elliott county school district - kentucky
TRANSCRIPT
ELLIOTT COUNTY SCHOOL DISTRICT
AUDITED FINANCIAL STATEMENTS AND SUPPLEMENTAL SCHEDULES
For the year ended June 30, 2020
Prepared by:
WHITE & ASSOCIATES, PSC
CERTIFIED PUBLIC ACCOUNTANTS 1407 Lexington Road
Richmond, Kentucky 40475 Phone (859) 624-3926 Fax (859) 625-0227

TABLE OF CONTENTS
*************** Page INDEPENDENT AUDITOR’S REPORT.…..………………………………………….. 1-2 MANAGEMENT DISCUSSION AND ANALYSIS…………………………………… 3-10 BASIC FINANCIAL STATEMENTS: Government-Wide Financial Statements: Statement of Net Position…………………………………………………….. 11 Statement of Activities………………………………………………………... 12 Fund Financial Statements: Balance Sheet - Governmental Funds……………...…..…….…………........... 13 Reconciliation of the Balance Sheet - Governmental Funds to the Statement of Net Position……….…………………………….. 14 Statement of Revenues, Expenditures and Changes in Fund Balances – Governmental Funds……………………………………… 15 Reconciliation of the Statement of Revenues, Expenditures and Changes in Fund Balances of Governmental Funds to the Statement of Activities………………………….…………………………... 16 Statement of Revenues, Expenditures and Changes in Fund Balance – Budget and Actual - General Fund ………..………………. 17 Statement of Revenues, Expenditures and Changes in Fund Balance – Budget and Actual – Special Revenue Fund…..…………... 18 Statement of Net Position – Proprietary Fund…………….……………. 19 Statement of Revenues, Expenses and Changes in Fund Net Position – Proprietary Fund.………………………………………..……………….. 20 Statement of Cash Flows – Proprietary Fund……………..………………… 21 Statement of Fiduciary Net Position – Fiduciary Funds…..…………….…… 22 Statement of Changes in Net Position – Fiduciary Fund………………..…… 23 Notes to the Financial Statements………………………………..…………... 24-62 REQUIRED SUPPLEMENTARY INFORMATION
Schedule of the District’s Proportionate Share of the Net Pension Liability CERS and TRS…..………………………………………………………………….. 63
Schedule of Contributions CERS and TRS…………………………………….. 64 Notes to Required Supplementary Information – PENSIONS……………………. 65-66
Schedule of the District’s Proportionate Share of the Net OPEB Liability – Medical and Life Insurance Plans – Teachers’ Retirement System…….……….. 67 Schedule of Contributions - Medical and Life Insurance Plans – Teachers’ Retirement System …………………………………………………………….. 68

Schedule of the District’s Proportionate Share of the Net OPEB Liability - Health Insurance Plan – County Employee Retirement System……….…………….. 69 Schedule of Contributions - Health Insurance Plan – County Employee Retirement System ………………………………………………………….... 70
Notes to Required Supplementary Information - OPEB……………………….…. 71-73 SUPPLEMENTARY INFORMATION Combining Statements – Non-Major Funds and Other: Combining Balance Sheet – Nonmajor Governmental Funds ……..………….. 74 Combining Statement of Revenues, Expenditures, and Changes in Fund Balances – Non-major Governmental Funds……………………… 75 Combining Balance Sheet – School Activity and Private Purpose Trust……………………………………………………………….. 76 Combining Statement of Revenues, Expenses, and Changes in Fund Balance -
School Activity and Private Purpose Trust………………………………… 77 Statement of Revenues, Expenses, and Changes in Fund Balance - Elliott County High School…………………………….…………………… 78
Schedule of Expenditures of Federal Awards………………….……………….. 79 Notes to the Schedule of Expenditures of Federal Awards…………………….. 80 INDEPENDENT AUDITOR’S REPORT ON INTERNAL CONTROL OVER
FINANCIAL REPORTING AND ON COMPLIANCE AND OTHER MATTERS BASED ON AN AUDIT OF FINANCIAL STATEMENTS PERFORMED IN ACCORDANCE WITH GOVERNMENT AUDITING STANDARDS…………………………………………………………..……………. 81-82
INDEPENDENT AUDITOR’S REPORT ON COMPLIANCE FOR EACH MAJOR FEDERAL PROGRAM AND REPORT ON INTERNAL CONTROL OVER COMPLIANCE REQUIRED BY THE UNIFORM GUIDANCE………………… 83-84 SCHEDULE OF FINDINGS AND QUESTIONED COSTS……………...…………... 85 SUMMARY SCHEDULE OF PRIOR AUDIT FINDINGS………………………….... 86 MANAGEMENT LETTER POINTS………………………………………………….... 87-89

Office: (859) 624-3926 Fax: (859) 625-0227
INDEPENDENT AUDITOR’S REPORT
To the Board of Education of the Elliott County School District Sandy Hook, KY And the State Committee for School District Audits
Report on the Financial Statements
We have audited the accompanying financial statements of the governmental activities, the business-type activities, each major fund, and the aggregate remaining fund information of the Elliott County School District as of and for the year ended June 30, 2020, and the related notes to the financial statements, which collectively comprise the Elliott County School District’s basic financial statements as listed in the table of contents.
Management’s Responsibility for the Financial Statements
Management is responsible for the preparation and fair presentation of these financial statements in accordance with accounting principles generally accepted in the United States of America; this includes the design, implementation, and maintenance of internal control relevant to the preparation and fair presentation of financial statements that are free from material misstatement, whether due to fraud or error.
Auditor’s Responsibility
Our responsibility is to express opinions on these financial statements based on our audit. We conducted our audit in accordance with auditing standards generally accepted in the United States of America and the standards applicable to financial audits contained in Government Auditing Standards, issued by the Comptroller General of the United States and the audit requirements prescribed by the Kentucky State Committee for School District Audits in the Auditor Responsibilities and State Compliance Requirements sections contained in the Kentucky Public School Districts’ Audit Contract and Requirements. Those standards require that we plan and perform the audit to obtain reasonable assurance about whether the financial statements are free from material misstatement.
An audit involves performing procedures to obtain audit evidence about the amounts and disclosures in the financial statements. The procedures selected depend on the auditor’s judgment, including the assessment of the risks of material misstatement of the financial statements, whether due to fraud or error. In making those risk assessments, the auditor considers internal control relevant to the entity’s preparation and fair presentation of the financial statements in order to design audit procedures that are appropriate in the circumstances, but not for the purpose of expressing an opinion on the effectiveness of the entity’s internal control. Accordingly, we express no such opinion. An audit also includes evaluating the appropriateness of accounting policies used and the reasonableness of significant accounting estimates made by management, as well as evaluating the overall presentation of the financial statements.
We believe that the audit evidence we have obtained is sufficient and appropriate to provide a basis for our audit opinions.
Opinions
In our opinion, the financial statements referred to above present fairly, in all material respects, the respective financial position of the governmental activities, the business-type activities, each major fund, and the aggregate remaining fund information of the Elliott County School District, as of June 30, 2020, and the respective changes in financial position, and, where applicable, cash flows thereof and the respective budgetary comparison for the General Fund and the Special Revenue Fund, for the year then ended in accordance with accounting principles generally accepted in the United States of America.
White & Associates, PSC Certified Public Accountants & Consultants
1407 Lexington Road Richmond, KY 40475 (859) 624-3926

2
Other Matters
Required Supplementary Information
Accounting principles generally accepted in the United States of America require that the Management’s Discussion and Analysis, Schedules of the District’s Proportionate Share of the Net Pension and OPEB Liability and Schedule of Contributions for CERS and TRS and Medical and Life and Health Insurance Plans comparison information as listed in the table of contents be presented to supplement the basic financial statements. Such information, although not a part of the basic financial statements, is required by the Governmental Accounting Standards Board, who considers it to be an essential part of financial reporting for placing the basic financial statements in an appropriate operational, economic, or historical context. We have applied certain limited procedures to the required supplementary information in accordance with auditing standards generally accepted in the United States of America, which consisted of inquiries of management about the methods of preparing the information and comparing the information for consistency with management’s responses to our inquiries, the basic financial statements, and other knowledge we obtained during our audit of the basic financial statements. We do not express an opinion or provide any assurance on the information because the limited procedures do not provide us with sufficient evidence to express an opinion or provide any assurance.
Other Information
Our audit was conducted for the purpose of forming opinions on the financial statements that collectively comprise the Elliott County School District basic financial statements. The combining and individual nonmajor fund financial statements and the schedule of expenditures of federal awards, as required by Title 2 U.S. Code of Federal Regulations Part 200, Uniform Administrative Requirements, Cost Principles, and Audit Requirements for Federal Awards, are presented for purposes of additional analysis and are not a required part of the basic financial statements.
The combining and individual nonmajor fund financial statements and the schedule of expenditures of federal awards are the responsibility of management and were derived from and relate directly to the underlying accounting and other records used to prepare the basic financial statements. Such information has been subjected to the auditing procedures applied in the audit of the basic financial statements and certain additional procedures, including comparing and reconciling such information directly to the underlying accounting and other records used to prepare the basic financial statements or to the basic financial statements themselves, and other additional procedures in accordance with auditing standards generally accepted in the United States of America. In our opinion, the combining and individual nonmajor fund financial statements and the schedule of expenditures of federal awards are fairly stated in all material respects in relation to the basic financial statements as a whole.
Other Reporting Required by Government Auditing Standards
In accordance with Government Auditing Standards, we have also issued our report dated November 13, 2020, on our consideration of the Elliott County School District’s internal control over financial reporting and on our tests of its compliance with certain provisions of laws, regulations, contracts, and grant agreements and other matters. The purpose of that report is solely to describe the scope of our testing of internal control over financial reporting and compliance and the results of that testing, and not to provide an opinion on the effectiveness of the Elliott County School District’s internal control over financial reporting or on compliance. That report is an integral part of an audit performed in accordance with Government Auditing Standards in considering the Elliott County School District’s internal control over financial reporting and compliance.
White & Associates, PSC Richmond, Kentucky
November 13, 2020
3
ELLIOTT COUNTY PUBLIC SCHOOL DISTRICT SANDY HOOK, KENTUCKY
MANAGEMENT’S DISCUSSION AND ANALYSIS (MD&A) Year ended June 30, 2020
As management of the Elliott County School District, we offer readers of the District’s financial statements this narrative overview and analysis of the financial activities of the District for the fiscal year ended June 30, 2020. We encourage readers to consider the information presented here in conjunction with additional information found within the body of the audit. FINANCIAL HIGHLIGHTS The beginning General Fund balance for the District was $628,759 and ending with $519,910. The district utilized KISTA financing to purchase 2 new busses and was able to purchase a 3rd bus through general fund and Capital Outlay funds.
The district was able to give and $1/hr. raise to all custodians and teacher aides. The General Fund had $9.28 million in revenue, which primarily consisted of the SEEK program, property, utility and motor vehicle taxes. There were $9.59 million expenditures in General Fund. The Board utilized the option provided in House Bill 269 to use Capital Outlay fund for a construction project and a portion of a new bus. The available funds totaled $56,010.
o $16,190 Isonville chimney demolition o $39,820 School Bus
Bonds are issued as the district renovates facilities consistent with a long-range facilities plan that is established with community input and in keeping with Kentucky Department of Education (KDE) stringent compliance regulations. There were no new building bonds issued in FY20.
OVERVIEW OF FINANCIAL STATEMENTS This discussion and analysis is intended to serve as an introduction to the District’s basic financial statements. The District’s basic financial statements comprise three components: 1) government-wide financial statements, 2) fund financial statements, and 3) notes to the financial statements. This report also contains other supplementary information in addition to the basic financial statements themselves. Government-wide financial statements: The government-wide financial statements are designed to provide readers with a broad overview of the District’s finances, in a manner similar to a private-sector business.

4
The statement of net position presents information on all of the District’s assets and liabilities, with the difference between the two reported as net position. Over time, increases or decreases in net position may serve as a useful indicator of whether the financial position of the district is improving or deteriorating. The statement of activities presents information showing how the District’s net position changed during the most recent fiscal year. All changes in net position are reported as soon as the underlying event giving rise to the change occurs, regardless of the timing of related cash flows. Thus, revenues and expenses are reported in this statement for some items that will only result in cash flows in future fiscal periods. The government-wide financial statements outline functions of the District that are principally supported by property taxes and intergovernmental revenues (governmental activities). The governmental activities of the District include instruction, support services, operation and maintenance of plant, student transportation and operation of non-instructional services. Taxes and intergovernmental revenues also support fixed assets and related debt. The government-wide financial statements can be found in the table of contents of this report. Fund financial statements: A fund is a grouping of related accounts that is used to maintain control over resources that have been segregated for specific activities or objectives. This is a state mandated uniform system and chart of accounts for all Kentucky public school districts utilizing the MUNIS administrative software. The District uses fund accounting to ensure and demonstrate compliance with finance-related legal requirements. All of the funds of the District can be divided into three categories: governmental, proprietary funds and fiduciary funds. Fiduciary funds are trust funds established by benefactors to aid in student education, welfare and teacher support. The only proprietary funds are our vending and food service operations. All other activities of the district are included in the governmental funds. The basic governmental fund financial statements can be found in the table of contents of this report. Notes to the financial statements: The notes provide additional information that is essential to a full understanding of the data provided in the government-wide and fund financial statements. GOVERNMENT-WIDE FINANCIAL ANALYSIS The largest portion of the District’s net position reflects its investment in capital assets (e.g., land and improvements, buildings and improvements, vehicles, furniture and equipment and construction in progress); less any related debt used to acquire those assets that are still outstanding. The District uses these capital assets to provide services to its students; consequently, these assets are not available for future spending. Although the District’s investment in its capital assets is reported net of related debt, it should be noted that the resources needed to repay this debt must be provided from other sources, since the capital assets themselves cannot be used to liquidate these liabilities. The District’s financial position is the product of several financial transactions including the net results of activities, the acquisition and payment of debt, the acquisition and disposal of capital assets, and the depreciation of capital assets.

5
Table 1
Net Position
$ (in Millions)
Governmental Activities Business-type Activities Totals
2019 2020 2019 2020 2019 2020
Current assets 0.74 0.64 0.33 0.33 1.07 0.97
Non-current assets 20.89 20.44 0.01 0.01 20.90 20.45
Total assets 21.63 21.08 0.34 0.34 21.97 21.42
Deferred outflows 1.22 1.29 0.04 0.04 1.26 1.33
Current liabilities 1.10 1.52 1.10 1.52
Non-current liabilities 15.58 14.27 0.17 0.17 15.75 14.44
Total liabilities 16.68 15.79 0.17 0.17 16.85 15.96
Deferred inflows 0.95 1.21 0.02 0.02 0.97 1.23
Net position:
Invested in capital assets, net of debt 10.66 10.91 0.01 0.01 10.67 10.92 Restricted 0.03 0.19 0.18 0.22 0.18
Unrestricted (deficit) (5.48) (5.54) (5.48) (5.54)
Total net position 5.21 5.37 0.20 0.19 5.41 5.56
SEE SCHEDULE OF CHANGES IN NET POSITION ON NEXT PAGE

6
Table 2 Changes in Net Position (in millions)
Total
Total Percentage
Governmental Activities Business-Type Activities School District Change
2019 2020 2019 2020 2019 2020 2019-2020 Revenues: Charges for services $ 0.05 $ 0.05 $ 0.05 $ 0.04 $ 0.10 $ 0.09 -10%
Operating grants and contributions 1.50 1.55 0.84 0.70 2.34 2.25 -4%
Capital grants and contributions 0.90 0.81 0.90 0.81 -10%
General revenues 9.58 9.43 (0.04) (0.05) 9.54 9.38 -2%
Total revenue 12.03 11.84 0.85 0.69 12.88 12.53 -3%
Expenses: Instruction $ 7.13 $ 6.80 $ 7.13 $ 6.80 -5%
Student 0.11 0.12 0.11 0.12 9%
Instructional staff 0.23 0.23 0.23 0.23 0%
District administration 0.48 0.65 0.48 0.65 35%
School administration 0.57 0.57 0.57 0.57 0%
Business 0.43 0.37 0.43 0.37 -14%
Plant operation & maintenance 0.98 1.10 0.98 1.10 12%
Student transportation 0.76 0.62 0.76 0.62 -18%
Community services operations 0.21 0.20 0.21 0.20 -5%
Food Service Operations 0.01 0.81 0.71 0.81 0.72 -11%
Building Improvements - 0.02 - 0.02 100%
Depreciation/Amortization 0.73 0.74 0.73 0.74 1%
Interest on long-term debt 0.28 0.26 0.28 0.26 -7%
Total Expenses $ 11.91 $ 11.69 $ 0.81 $ 0.71 $ 12.72 $ 12.40 -3%
Change in net position $ 0.12 $ 0.15 $ 0.04 $ (0.02) $ 0.16 $ 0.13 19%
DEBT Debt decreased from 2019 by $710,524.
Table 4
Outstanding Debt at Year-End
Government Activities
2019 2020
General Obligation Bonds 9,468,505 8,760,381 Capital Lease Obligations 758,030 777,572 KSBIT Obligations 141,669 119,727
Total Obligations 10,368,204 9,657,680
CAPITAL ASSETS

7
At the end of fiscal 2020, the District had $20.45 million invested in capital assets, including land, improvements, and construction in progress.
Capital Assets at Year-End (Net of depreciation)
Governmental ActivitiesBusiness Type
Activities Totals 2019 2020 2019 2020 2019 2020
Land 452,007 452,007 - - 452,007 452,007
Land and Improvements 38,959 27,837 - -
38,959 27,837
Buildings & Improvements 19,742,586 19,264,748 - - 19,742,586 19,264,748
Vehicles 573,172 630,898 - - 573,172 630,898
General Equipment 81,153 68,700 14,086 12,190 95,239 80,890 Totals 20,887,877 20,444,190 14,086 12,190 20,901,963 20,456,380
Comments on Budget Comparisons
8
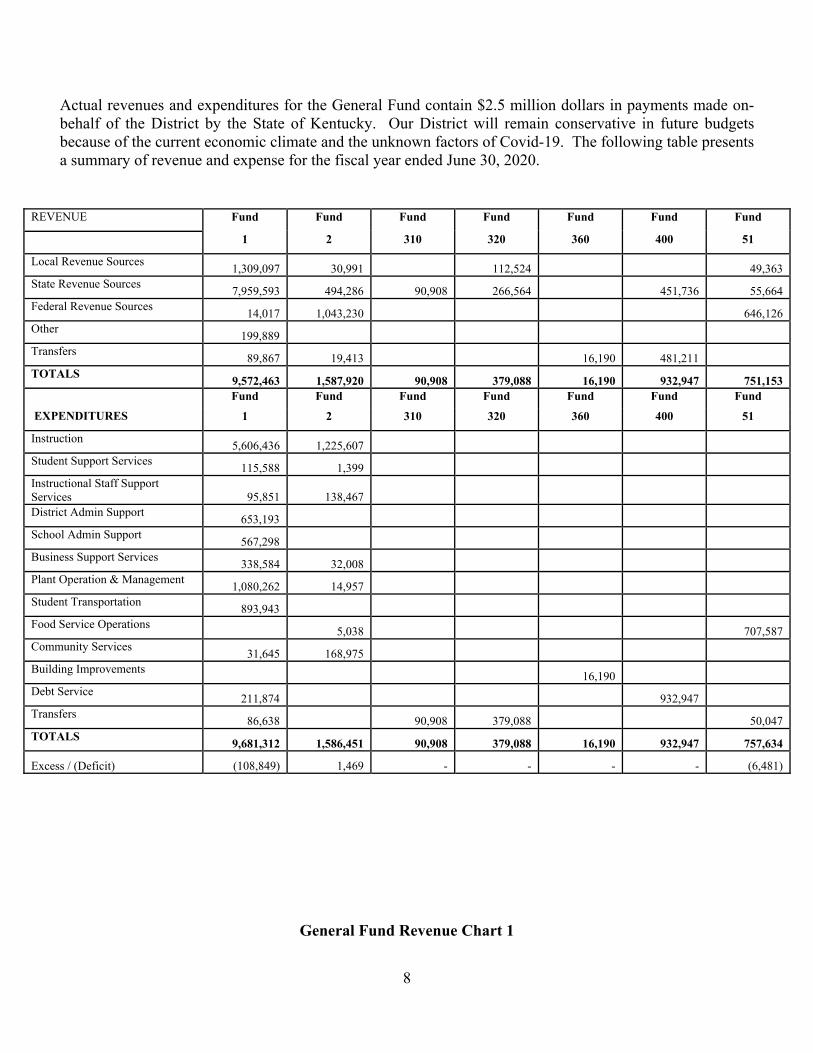
Actual revenues and expenditures for the General Fund contain $2.5 million dollars in payments made on-behalf of the District by the State of Kentucky. Our District will remain conservative in future budgets because of the current economic climate and the unknown factors of Covid-19. The following table presents a summary of revenue and expense for the fiscal year ended June 30, 2020.
REVENUE Fund Fund Fund Fund Fund Fund Fund
1 2 310 320 360 400 51
Local Revenue Sources 1,309,097 30,991 112,524 49,363
State Revenue Sources 7,959,593 494,286 90,908 266,564 451,736 55,664
Federal Revenue Sources 14,017 1,043,230 646,126
Other 199,889
Transfers 89,867 19,413 16,190 481,211
TOTALS 9,572,463 1,587,920 90,908 379,088 16,190 932,947 751,153
Fund Fund Fund Fund Fund Fund Fund
EXPENDITURES 1 2 310 320 360 400 51
Instruction 5,606,436 1,225,607
Student Support Services 115,588 1,399
Instructional Staff Support Services 95,851 138,467 District Admin Support
653,193 School Admin Support
567,298 Business Support Services
338,584 32,008 Plant Operation & Management
1,080,262 14,957 Student Transportation
893,943 Food Service Operations
5,038 707,587 Community Services
31,645 168,975 Building Improvements
16,190 Debt Service
211,874 932,947 Transfers
86,638 90,908 379,088 50,047 TOTALS
9,681,312 1,586,451 90,908 379,088 16,190 932,947 757,634
Excess / (Deficit) (108,849) 1,469 - - - - (6,481)
General Fund Revenue Chart 1

9
The majority of revenue was derived from state funding (83%), with local taxes making up 14% of total revenue.
General Fund Expenditures Chart 2
The majority of revenue is spent on instructional expenditures; this consumes 58% of the budget. The instruction function included the SBDM expenditures for staff and supplies. Support services make up 18%, which includes services for students, instructional staff, district administration, school administration and business. Plant operations and management makes up 11%. Student transportation makes up 9%. Debt Service is 2%. Food Service operations and community services make up less than one percent.
Special Revenue Fund Revenue/Expenditures
EXPENDITURESINSTRUCTION
SUPPORT SERVICES
PLANT OPERATIONS &MAINT
STUDENTTRANSPORTATION
DEBT SERVICE
REVENUE
STATE
LOCAL
OTHER
10
The majority of revenue was derived from Federal Sources (66 %) with the state revenue making up 31% and local source providing 3%. The function with the greatest expenditures is instruction at 77%. Other Governmental Funds Revenue/Expenditures The main other governmental funds are capital outlay fund, and building fund (FSPK). State funding makes up the capital outlay and the building fund consists of state and local revenues. During the FY20 school year these funds were used to make bond payments on existing debt, with the exception of $56,010 capital funds which were used for a chimney demolition project and to assist with a new bus purchase as approved per HB 267.
School Food Service Fund Revenue/Expenditures
The revenue is received from local, state, and federal monies. The largest being federal which makes up 86% of the budget. BUDGETARY IMPLICATIONS In Kentucky the public school fiscal year is July 1-June 30; other programs, i.e. some federal operate on a different fiscal calendar, but are reflected in the district overall budget. By law the budget must have a minimum 2% contingency. The beginning General fund balance for the fiscal year was $628,759. The ending fund balance was $519,910. Elliott County Public Schools continued to receive the Read To Achieve grant. It has continued to provide support teachers in the implementation of instructional strategies to address the needs of students reading at low levels at Isonville Elementary and Lakeside Elementary. The Math Achievement grant provided funds for support teachers and the implementation of services that address the needs of students who are struggling with math. Its impact involved Isonville Elementary and Sandy Hook Elementary. Elliott County Public School’s facility planning committee has met over the course of the fiscal year to discuss the budgetary implications and educational implications of a redistricting plan. The committee decided that the district will go forward with a consolidation plan that will eliminate the use of one school building in the upcoming year.
Questions regarding this report should be directed to the Superintendent Debbie Stephens or Kristen Salyers, Finance Officer at 606-738-8002 or by mail at Elliott County Board of Education, PO Box 767, Sandy Hook, KY 41171.

Elliott County School DistrictStatement of Net Position
June 30, 2020
Business-Governmental type
Activities Activities Total
ASSETSCash and cash equivalents $ 471,533 $ 325,175 $ 796,708 Receivables
Taxes-current 40,430 40,430 Taxes-delinquent 12,032 12,032 Accounts 30,018 30,018 Intergovernmental-state 5,621 5,621 Intergovernmental-federal 77,302 77,302
Inventories 8,958 8,958 Capital assets:
Land and construction in progress 452,007 452,007 Other capital assets, net of depreciation 19,992,183 12,190 20,004,373
Total capital assets 20,444,190 12,190 20,456,380 Total assets 21,081,126 346,323 21,427,449
DEFERRED OUTFLOWS OF RESOURCESDeferred outflows related to pensions 698,929 31,107 730,036 Deferred outflows related to OPEB 501,537 11,236 512,773 Deferred savings from refunding bonds 85,808 85,808
Total deferred outflows of resources 1,286,274 42,343 1,328,617
TOTAL ASSETS AND DEFERRED OUTFLOWS OF RESOURCES 22,367,400 388,666 22,756,066
LIABILITIESAccounts payable and accrued expenses 18,207 18,207 Accrued interest payable 74,068 74,068 Unearned revenue 69,068 69,068 Long-term liabilities:
Due within 1 year:Bond obligations 1,225,000 1,225,000 Capital lease obligations 111,746 111,746 KSBIT payable 22,516 22,516
Total due within 1 year 1,359,262 - 1,359,262 Due in more than 1 year:
Bond obligations 7,535,381 7,535,381 Capital lease obligations 665,826 665,826 Sick leave 77,245 77,245 KSBIT payable 97,211 97,211 Net pension liability 3,059,438 136,166 3,195,604 Net OPEB liability 2,836,489 32,556 2,869,045
Total due in more than 1 year 14,271,590 168,722 14,440,312 Total liabilities 15,792,195 168,722 15,960,917
DEFERRED INFLOWS OF RESOURCESDeferred inflows related to pensions 241,557 10,751 252,308 Deferred inflows related to OPEB 968,459 13,996 982,455
Total deferred inflows of resources 1,210,016 24,747 1,234,763
Net Investment in capital assets 10,906,237 12,190 10,918,427 Restricted for:
Capital projects 208 208 Food services 183,007 183,007
Unrestricted (deficit) (5,541,256) (5,541,256) Total net position 5,365,189 195,197 5,560,386
TOTAL LIABILITIES, DEFERRED INFLOWS OF RESOURCES AND NET POSITION $ 22,367,400 $ 388,666 $ 22,756,066
Primary Government
See the accompanying notes to the financial statements.
11
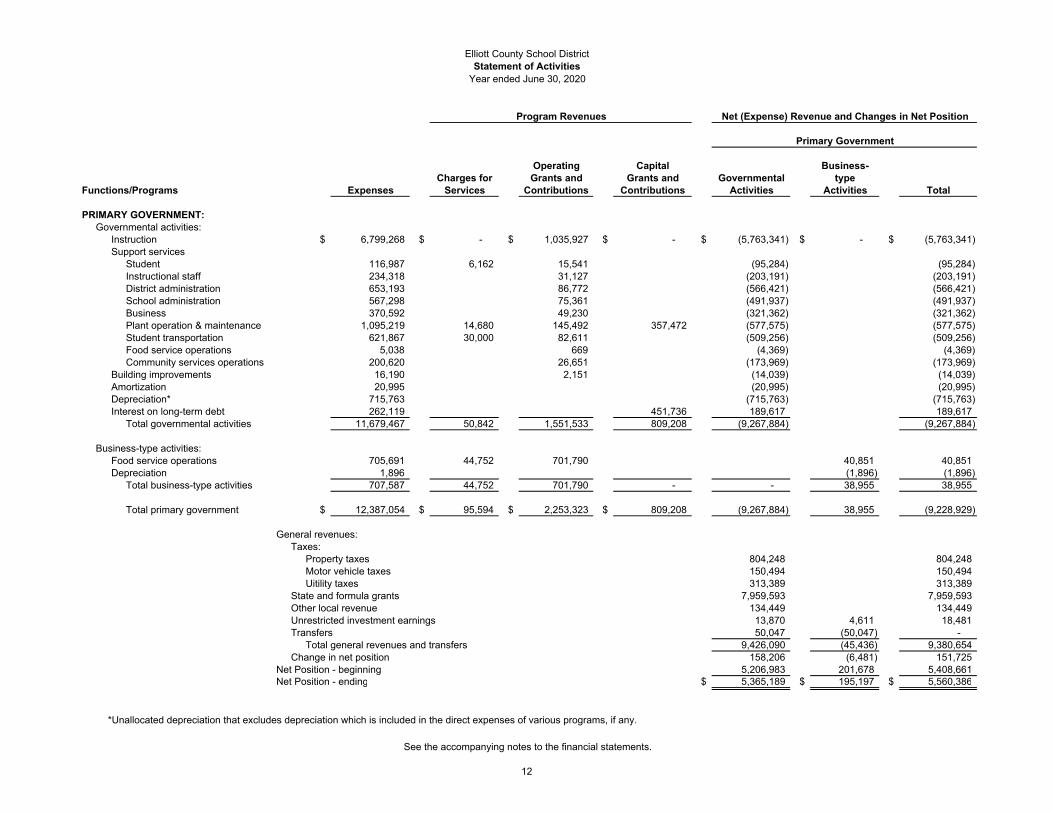
Elliott County School DistrictStatement of Activities
Year ended June 30, 2020
Operating Capital Business-Charges for Grants and Grants and Governmental type
Functions/Programs Expenses Services Contributions Contributions Activities Activities Total
PRIMARY GOVERNMENT:Governmental activities:
Instruction $ 6,799,268 $ - $ 1,035,927 $ - $ (5,763,341) $ - $ (5,763,341) Support services
Student 116,987 6,162 15,541 (95,284) (95,284) Instructional staff 234,318 31,127 (203,191) (203,191) District administration 653,193 86,772 (566,421) (566,421) School administration 567,298 75,361 (491,937) (491,937) Business 370,592 49,230 (321,362) (321,362) Plant operation & maintenance 1,095,219 14,680 145,492 357,472 (577,575) (577,575) Student transportation 621,867 30,000 82,611 (509,256) (509,256) Food service operations 5,038 669 (4,369) (4,369) Community services operations 200,620 26,651 (173,969) (173,969)
Building improvements 16,190 2,151 (14,039) (14,039) Amortization 20,995 (20,995) (20,995) Depreciation* 715,763 (715,763) (715,763) Interest on long-term debt 262,119 451,736 189,617 189,617
Total governmental activities 11,679,467 50,842 1,551,533 809,208 (9,267,884) (9,267,884)
Business-type activities:Food service operations 705,691 44,752 701,790 40,851 40,851 Depreciation 1,896 (1,896) (1,896)
Total business-type activities 707,587 44,752 701,790 - - 38,955 38,955
Total primary government $ 12,387,054 $ 95,594 $ 2,253,323 $ 809,208 (9,267,884) 38,955 (9,228,929)
General revenues:Taxes:
Property taxes 804,248 804,248 Motor vehicle taxes 150,494 150,494 Uitility taxes 313,389 313,389
State and formula grants 7,959,593 7,959,593 Other local revenue 134,449 134,449 Unrestricted investment earnings 13,870 4,611 18,481 Transfers 50,047 (50,047) -
Total general revenues and transfers 9,426,090 (45,436) 9,380,654 Change in net position 158,206 (6,481) 151,725
Net Position - beginning 5,206,983 201,678 5,408,661 Net Position - ending $ 5,365,189 $ 195,197 $ 5,560,386
*Unallocated depreciation that excludes depreciation which is included in the direct expenses of various programs, if any.
Program Revenues Net (Expense) Revenue and Changes in Net Position
Primary Government
See the accompanying notes to the financial statements.
12

Elliott County School DistrictBalance Sheet
Governmental FundsJune 30, 2020
Other Special Debt Governmental
General Revenue Service Funds Total
ASSETSCash and cash equivalents $ 434,146 $ 37,179 $ - $ 208 $ 471,533 Receivables
Taxes-current 40,430 40,430 Taxes-delinquent 12,032 12,032 Accounts 30,018 30,018 Intergovernmental-state 5,621 5,621 Intergovernmental-federal 771 76,531 77,302
Total assets 523,018 113,710 - 208 636,936
LIABILITIES Accounts payable and accrued expenses 3,108 15,099 18,207 Unearned revenue 69,068 69,068
Total liabilities 3,108 84,167 - - 87,275
FUND BALANCERestricted 29,543 208 29,751 Unassigned 519,910 519,910
Total fund balance 519,910 29,543 - 208 549,661
TOTAL LIABILITIES AND FUND BALANCE $ 523,018 $ 113,710 $ - $ 208 $ 636,936
Governmental Funds
See the accompanying notes to the financial statements.
13

Elliott County School DistrictReconciliation of the Balance Sheet - Governmental Funds to the Statement of Net Position
June 30, 2020
Fund balances-total governmental funds $ 549,661
Amounts reported for governmental activities in the statement of net position aredifferent because:
Capital assets are not reported in this fund financial statement because they are not current financial resources, but they are reported in the statement of netposition. 20,444,190
Costs associated with bond issues and refundings are expensed in the fund financialstatements because they are a use of current financial resources but are capitalizedon the statement of net position using the economic resources focus 85,808
Certain liabilities (such as bonds payable, the long-term portion of accrued sick leave,accrued interest payable, other accounts payable, and net pension obligations)are not due and payble in the current period and, therefore, are not reported in the fundsAccrued interest payable (74,068) Bond obligations (8,760,381) Capital lease obligations (777,572) KSBIT payable (119,727) Sick leave liability (77,245) Net pension liability (3,059,438) Net OPEB liability (2,836,489)
Deferred outflows and inflows or resources related to pensions are applicable to futureperiods and, therefore, are not reported in the fundsDeferred outflows related to pensions 698,929 Deferred outflows related to OPEB 501,537 Deferred inflows related to pensions (241,557) Deferred inflows related to OPEB (968,459)
Net position of governmental activities $ 5,365,189
See the accompanying notes to the financial statements.
14

Elliott County School DistrictStatement of Revenues, Expenditures, and Changes in Fund Balances
Governmental FundsYear ended June 30, 2020
Other Special Debt Governmental
General Revenue Service Funds Total
REVENUESFrom local sources
TaxesProperty $ 691,724 $ - $ - $ 112,524 $ 804,248 Motor vehicle 150,494 150,494 Utilities 313,389 313,389
Earnings on investments 13,796 74 13,870 Student activities 6,162 6,162 Transportation 30,000 30,000 Other local revenue 109,694 24,755 134,449
Intergovernmental - state 7,959,593 494,286 451,736 357,472 9,263,087 Intergovernmental - federal 14,017 1,043,230 1,057,247
Total revenues 9,282,707 1,568,507 451,736 469,996 11,772,946
EXPENDITURESInstruction 5,606,436 1,225,607 6,832,043 Support services
Student 115,588 1,399 116,987 Instructional staff 95,851 138,467 234,318 District administration 653,193 653,193 School administration 567,298 567,298 Business 338,584 32,008 370,592
Plant operation & maintenance 1,080,262 14,957 1,095,219 Food service operation 5,038 5,038 Student transportation 893,943 893,943 Community services operations 31,645 168,975 200,620 Building improvements 16,190 16,190 Debt service 211,874 932,947 1,144,821
Total expenditures 9,594,674 1,586,451 932,947 16,190 12,130,262
EXCESS (DEFICIENCY) OF REVENUES OVER EXPENDITURES (311,967) (17,944) (481,211) 453,806 (357,316)
OTHER FINANCING SOURCES (USES)Sale of equipment 14,680 14,680 Capital lease proceeds 185,209 185,209 Transfers in 89,867 19,413 481,211 590,491 Transfers (out) (86,638) (453,806) (540,444)
Total other financing sources and (uses) 203,118 19,413 481,211 (453,806) 249,936
NET CHANGE IN FUND BALANCES (108,849) 1,469 - - (107,380)
FUND BALANCE-BEGINNING 628,759 28,074 - 208 657,041
FUND BALANCE-ENDING $ 519,910 $ 29,543 $ - $ 208 $ 549,661
Governmental Funds
See the accompanying notes to the financial statements.
15
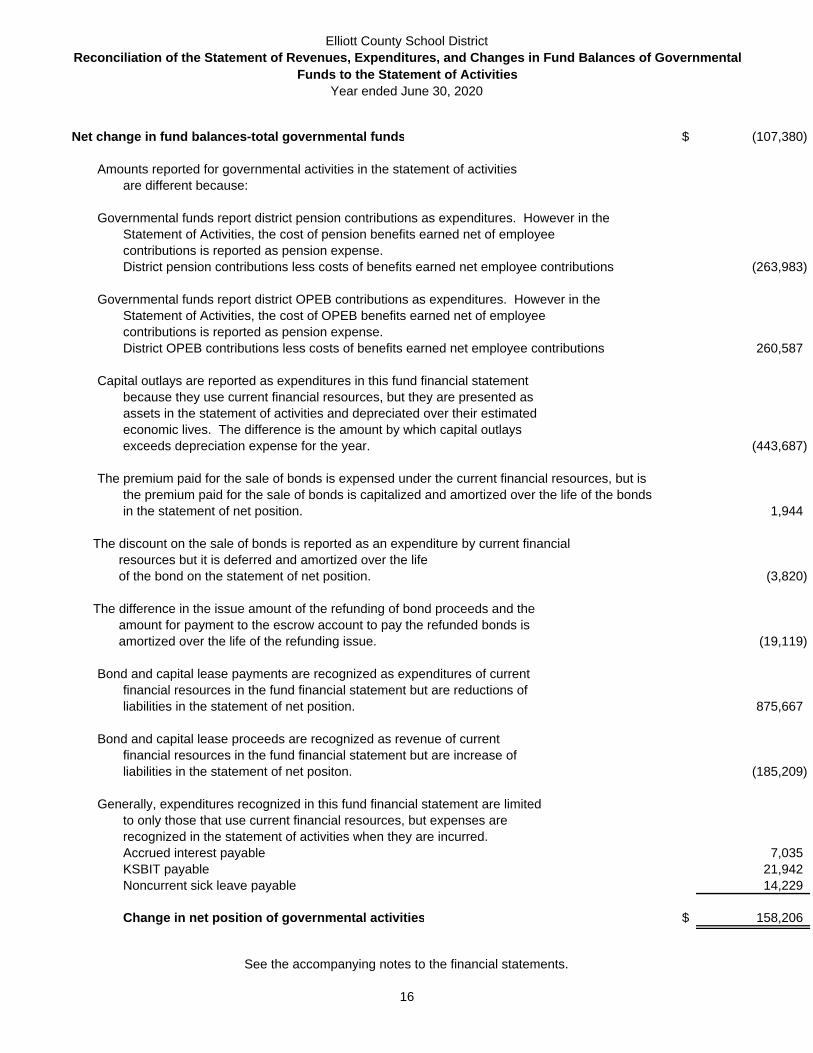
Elliott County School DistrictReconciliation of the Statement of Revenues, Expenditures, and Changes in Fund Balances of Governmental
Funds to the Statement of ActivitiesYear ended June 30, 2020
Net change in fund balances-total governmental funds $ (107,380)
Amounts reported for governmental activities in the statement of activitiesare different because:
Governmental funds report district pension contributions as expenditures. However in the Statement of Activities, the cost of pension benefits earned net of employeecontributions is reported as pension expense.District pension contributions less costs of benefits earned net employee contributions (263,983)
Governmental funds report district OPEB contributions as expenditures. However in the Statement of Activities, the cost of OPEB benefits earned net of employeecontributions is reported as pension expense.District OPEB contributions less costs of benefits earned net employee contributions 260,587
Capital outlays are reported as expenditures in this fund financial statementbecause they use current financial resources, but they are presented as assets in the statement of activities and depreciated over their estimatedeconomic lives. The difference is the amount by which capital outlaysexceeds depreciation expense for the year. (443,687)
The premium paid for the sale of bonds is expensed under the current financial resources, but isthe premium paid for the sale of bonds is capitalized and amortized over the life of the bondsin the statement of net position. 1,944
The discount on the sale of bonds is reported as an expenditure by current financialresources but it is deferred and amortized over the lifeof the bond on the statement of net position. (3,820)
The difference in the issue amount of the refunding of bond proceeds and theamount for payment to the escrow account to pay the refunded bonds is amortized over the life of the refunding issue. (19,119)
Bond and capital lease payments are recognized as expenditures of currentfinancial resources in the fund financial statement but are reductions of liabilities in the statement of net position. 875,667
Bond and capital lease proceeds are recognized as revenue of currentfinancial resources in the fund financial statement but are increase ofliabilities in the statement of net positon. (185,209)
Generally, expenditures recognized in this fund financial statement are limitedto only those that use current financial resources, but expenses arerecognized in the statement of activities when they are incurred.Accrued interest payable 7,035 KSBIT payable 21,942 Noncurrent sick leave payable 14,229
Change in net position of governmental activities $ 158,206
See the accompanying notes to the financial statements.
16
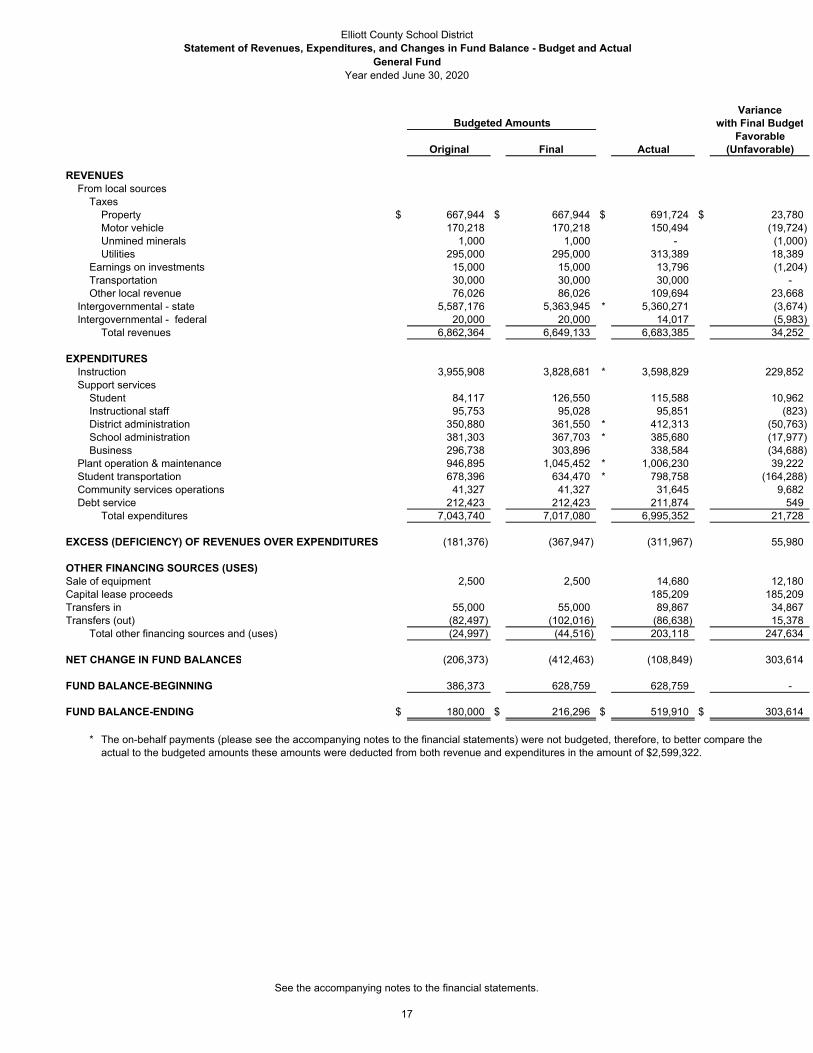
Elliott County School DistrictStatement of Revenues, Expenditures, and Changes in Fund Balance - Budget and Actual
General FundYear ended June 30, 2020
Variancewith Final Budget
FavorableOriginal Final Actual (Unfavorable)
REVENUESFrom local sources
TaxesProperty $ 667,944 $ 667,944 $ 691,724 $ 23,780 Motor vehicle 170,218 170,218 150,494 (19,724) Unmined minerals 1,000 1,000 - (1,000) Utilities 295,000 295,000 313,389 18,389
Earnings on investments 15,000 15,000 13,796 (1,204) Transportation 30,000 30,000 30,000 - Other local revenue 76,026 86,026 109,694 23,668
Intergovernmental - state 5,587,176 5,363,945 * 5,360,271 (3,674) Intergovernmental - federal 20,000 20,000 14,017 (5,983)
Total revenues 6,862,364 6,649,133 6,683,385 34,252
EXPENDITURESInstruction 3,955,908 3,828,681 * 3,598,829 229,852 Support services
Student 84,117 126,550 115,588 10,962 Instructional staff 95,753 95,028 95,851 (823) District administration 350,880 361,550 * 412,313 (50,763) School administration 381,303 367,703 * 385,680 (17,977) Business 296,738 303,896 338,584 (34,688)
Plant operation & maintenance 946,895 1,045,452 * 1,006,230 39,222 Student transportation 678,396 634,470 * 798,758 (164,288) Community services operations 41,327 41,327 31,645 9,682 Debt service 212,423 212,423 211,874 549
Total expenditures 7,043,740 7,017,080 6,995,352 21,728
EXCESS (DEFICIENCY) OF REVENUES OVER EXPENDITURES (181,376) (367,947) (311,967) 55,980
OTHER FINANCING SOURCES (USES)Sale of equipment 2,500 2,500 14,680 12,180 Capital lease proceeds 185,209 185,209 Transfers in 55,000 55,000 89,867 34,867 Transfers (out) (82,497) (102,016) (86,638) 15,378
Total other financing sources and (uses) (24,997) (44,516) 203,118 247,634
NET CHANGE IN FUND BALANCES (206,373) (412,463) (108,849) 303,614
FUND BALANCE-BEGINNING 386,373 628,759 628,759 -
FUND BALANCE-ENDING $ 180,000 $ 216,296 $ 519,910 $ 303,614
* The on-behalf payments (please see the accompanying notes to the financial statements) were not budgeted, therefore, to better compare theactual to the budgeted amounts these amounts were deducted from both revenue and expenditures in the amount of $2,599,322.
Budgeted Amounts
See the accompanying notes to the financial statements.
17
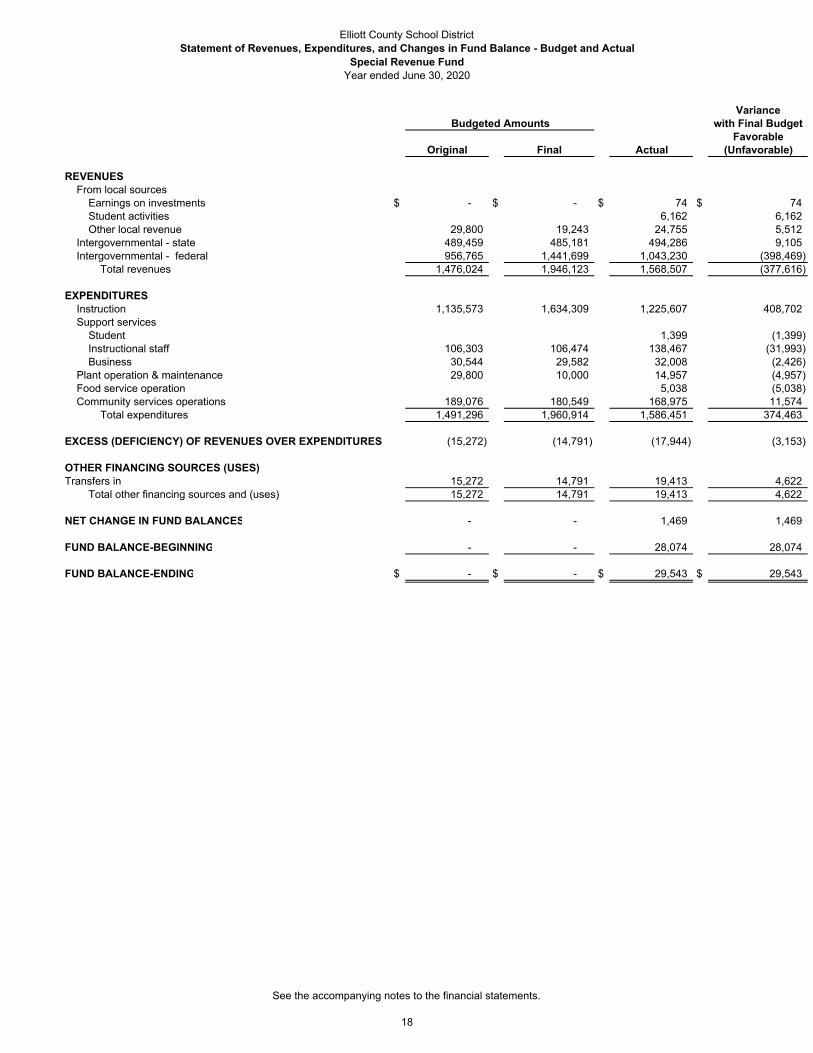
Elliott County School DistrictStatement of Revenues, Expenditures, and Changes in Fund Balance - Budget and Actual
Special Revenue FundYear ended June 30, 2020
Variancewith Final Budget
FavorableOriginal Final Actual (Unfavorable)
REVENUESFrom local sources
Earnings on investments $ - $ - $ 74 $ 74 Student activities 6,162 6,162 Other local revenue 29,800 19,243 24,755 5,512
Intergovernmental - state 489,459 485,181 494,286 9,105 Intergovernmental - federal 956,765 1,441,699 1,043,230 (398,469)
Total revenues 1,476,024 1,946,123 1,568,507 (377,616)
EXPENDITURESInstruction 1,135,573 1,634,309 1,225,607 408,702 Support services
Student 1,399 (1,399) Instructional staff 106,303 106,474 138,467 (31,993) Business 30,544 29,582 32,008 (2,426)
Plant operation & maintenance 29,800 10,000 14,957 (4,957) Food service operation 5,038 (5,038) Community services operations 189,076 180,549 168,975 11,574
Total expenditures 1,491,296 1,960,914 1,586,451 374,463
EXCESS (DEFICIENCY) OF REVENUES OVER EXPENDITURES (15,272) (14,791) (17,944) (3,153)
OTHER FINANCING SOURCES (USES)Transfers in 15,272 14,791 19,413 4,622
Total other financing sources and (uses) 15,272 14,791 19,413 4,622
NET CHANGE IN FUND BALANCES - - 1,469 1,469
FUND BALANCE-BEGINNING - - 28,074 28,074
FUND BALANCE-ENDING $ - $ - $ 29,543 $ 29,543
Budgeted Amounts
See the accompanying notes to the financial statements.
18

Elliott County School DistrictStatement of Net Position
Proprietary FundJune 30, 2020
SchoolFood
ServicesASSETS
Cash and cash equivalents $ 325,175 ReceivablesInventories 8,958 Capital assets:
Other capital assets, net of depreciation 12,190 Total assets 346,323
DEFERRED OUTFLOWS OF RESOURCESDeferred outflows related to pensions 31,107 Deferred outflows related to OPEB 11,236
Total deferred outflows of resources 42,343
TOTAL ASSETS AND DEFERRED OUTFLOWS OF RESOURCES 388,666
LIABILITIESNet pension liability 136,166 Net OPEB liability 32,556
Total liabilities 168,722
DEFERRED INFLOWS OF RESOURCESDeferred inflows related to pensions 10,751 Deferred inflows related to OPEB 13,996
Total deferred inflows of resources 24,747
TOTAL LIABILITIES AND DEFERRED INFLOWS OF RESOURCES 193,469
NET POSITIONNet investment in capital assets 12,190 Restricted 183,007
Total net position 195,197
TOTAL LIABILITIES, DEFERRED INFLOWS OF RESOURCES AND NET POSITION $ 388,666
See the accompanying notes to the financial statements.
19

Elliott County School DistrictStatement of Revenues, Expenses, and Changes in Fund Net Position
Proprietary FundYear ended June 30, 2020
SchoolFood
ServicesOPERATING REVENUES
Lunchroom sales $ 44,752 Total operating revenues 44,752
OPERATING EXPENSESDepreciation 1,896 Food service operations
Salaries and benefits 291,911 Operational 413,780 Total operating expenses 707,587
Operating income (loss) (662,835)
NONOPERATING REVENUES (EXPENSES)Federal grants 646,126 State grants 55,664 Transfers (50,047) Earnings from investments 4,611
Total nonoperating revenues (expenses) 656,354
CHANGE IN NET POSITION (6,481)
NET POSITION-BEGINNING 201,678
NET POSITION-ENDING $ 195,197
See the accompanying notes to the financial statements.
20

Elliott County School DistrictStatement of Cash Flows
Proprietary FundYear ended June 30, 2020
SchoolFood
Services
CASH FLOWS FROM OPERATING ACTIVITIESReceipts from customers $ 44,752 Payments to suppliers (405,064) Payments to employees (291,911)
Net cash provided (used) by operating activities (652,223)
CASH FLOWS FROM NONCAPITAL FINANCING ACTIVITIESOperating grants and contributions 701,790 Transfers to other funds (50,047)
Net cash provided (used) by noncapital financing activities 651,743
CASH FLOWS FROM INVESTING ACTIVITIESInterest 4,611
Net cash provided (used) by investing activities 4,611
NET INCREASE (DECREASE) IN CASH AND CASH EQUIVALENTS 4,131
CASH AND CASH EQUIVALENTS BALANCE-BEGINNING 321,044
CASH AND CASH EQUIVALENTS BALANCE-ENDING 325,175
Reconciliation of operating income (loss) to net cash provided (used)by operating activities:
Operating income (loss) (662,835) Adjustments to reconcile operating income (loss) to net cash provided (used) by operating activities:
Depreciation 1,896 Changes in assets and liabilities:
Receivables 5,730 Inventory (1,300) Deferrals assets 738 Deferrals liabilities 475 Pension liability 7,915 OPEB liability (4,842) Accounts payable and accrued expenses -
Net cash provided (used) by operating activities $ (652,223)
NONCASH NONCAPITAL FINANCING ACTIVITIESDuring the year, the district received $45,005 of food commodities from the U.S. Department of Agriculture.
During the year, the district recognized revenues and expenses for on-behalf payments relating to fringebenefits in the amount of $55,664 provided by state government.
See the accompanying notes to the financial statements.
21

Elliott County School DistrictStatement of Fiduciary Net Position
Fiduciary FundsJune 30, 2020
SCHOOL PRIVATE FIDUCIARYACTIVITY FUND PURPOSE TRUST FUNDS
ASSETSCash and cash equivalents $ 108,687 $ 107,251 $ 215,938
Total assets 108,687 107,251 215,938
LIABILITIESAccounts payable 248 248 Due to student groups 108,439 108,439
Total liabilities 108,687 - 108,687
NET POSITION HELD IN TRUSTPermanent fund 107,251 107,251
Total net position held in trust - 107,251 107,251
TOTAL LIABILITIES AND NET POSITION HELD IN TRUST $ 108,687 $ 107,251 $ 215,938
See the accompanying notes to the financial statements.
22

Elliott County School DistrictStatement of Changes in Net Position
Fiduciary FundYear ended June 30, 2020
Private PurposeTrust
AdditionsEarnings on investments $ 1,442
DeductionsBenefits paid -
Change in net position 1,442
Net position held in trust, beginning 105,809
Net position held in trust, ending $ 107,251
See accompanying notes to the financial statements.
23
ELLIOTT COUNTY SCHOOL DISTRICT NOTES TO THE FINANCIAL STATEMENTS
For the year ended June 30, 2020
24
NOTE A – SUMMARY OF SIGNIFICANT ACCOUNTING POLICIES Reporting Entity The Elliott County Board of Education (“Board”), a five-member group, is the level of government, which has oversight responsibilities over all activities related to public elementary and secondary school education within the jurisdiction of the Elliott County Board of Education (“District”). The District receives funding from Local, State and Federal government sources and must comply with the commitment requirements of these funding source entities. However, the District is not included in any other governmental “reporting entity” as defined in Section 2100-Codification of Governmental Accounting and Financial Reporting Standards. Board members are elected by the public and have decision making authority, the power to designate management, the responsibility to develop policies which may influence operations and primary accountability for fiscal matters. The District, for financial purposes, includes all of the funds relevant to the operation of the Elliott County Board of Education. The financial statements presented herein do not include funds of groups and organizations, which although associated with the school system, have not originated within the District itself such as Band Boosters, Parent-Teacher Associations, etc. The financial statements of the District include those of separately administered organizations that are controlled by or dependent on the Board. Control or dependence is determined on the basis of budget adoption, funding and appointment of the respective governing board. Based on the foregoing criteria, the financial statements of the following organization are included in the accompanying financial statements: Blended Component Unit Elliott County Board of Education Finance Corporation The Board authorized establishment of the Elliott County Board of Education Finance Corporation a non-stock, non-profit corporation pursuant to Section 162.385 of the School Bond Act and Chapter 273 and Section 58.180 of the Kentucky Revised Statutes (the “Corporation”) to act as an agency of the District for financing the costs of school building facilities. The Board of Directors of the Corporation shall be the same persons who are at any time the members of the Board of Education of the Elliott County Board of Education. Basis of Presentation Government-wide Financial Statements – The Statement of Net Position and the Statement of Activities display information about the District as a whole. These statements include the financial activities of the primary government, except for fiduciary funds. The statements distinguish between those activities of the District that are governmental and those that are considered business-type activities. The government-wide statements are prepared using the economic resources measurement focus. This is the same approach used in the preparation of the proprietary fund financial statements but differs from the manner in which governmental fund financial statements are prepared. Governmental fund financial statements therefore include a reconciliation with brief explanations to better identify the relationship between the government-wide statements and the statements for governmental funds.

NOTES TO THE FINANCIAL STATEMENTS (CONTINUED)
25
The government-wide statement of activities presents a comparison between direct expenses and program revenues for each segment of the business-type activities of the District and for each function or program of the District’s governmental activities. Direct expenses are those that are specifically associated with a service, program or department and are therefore clearly identifiable to a particular function. Program revenues include charges paid by the recipient of the goods or services offered by the program and grants and contributions that are restricted to meeting the operational or capital requirements of a particular program. Revenues that are not classified as program revenues are presented as general revenues of the District, with certain limited exceptions. The comparison of direct expenses with program revenues identifies the extent to which each business segment or governmental function is self-financing or draws from the general revenues of the District. Fund Financial Statements – Fund financial statements report detailed information about the District. The focus of governmental and enterprise fund financial statements is on major funds rather than reporting funds by type. Each major fund is presented in a separate column. Nonmajor funds are aggregated and presented in a single column. Fiduciary funds are reported by fund type. The accounting and reporting treatment applied to a fund is determined by its measurement focus. All governmental fund types are accounted for using a flow of current financial resources measurement focus. The financial statements for governmental funds are a balance sheet, which generally includes only current assets and current liabilities and a statement of revenues, expenditures and changes in fund balances, which reports on the changes in net total assets. Proprietary funds and fiduciary funds are reported using the economic resources measurement focus. The statement of cash flows provides information about how the District finances and meets the cash flow needs of its proprietary activities. The District has the following funds: I. Governmental Fund Types (A) General Fund The General Fund is the main operating fund of the District. It accounts for financial resources used for general types of operations. This is a budgeted fund, and any fund balances are considered as resources available for use. This is always a major fund of the District. (B) Special Revenue (Grant) Fund The Special Revenue (Grant) Fund accounts for proceeds of specific revenue sources (other than expendable trust funds or major capital projects) that are legally restricted to disbursements for specified purposes. It includes federal financial programs where unused balances are returned to the grantor at the close of specified project periods as well as the state grant programs. Project accounting is employed to maintain integrity for the various sources of funds. The separate projects of federally-funded grant programs are identified in the Schedule of Expenditures of Federal Awards included in this report. This is a major fund of the District.

NOTES TO THE FINANCIAL STATEMENTS (CONTINUED)
26
(C) Special Revenue (District Activity) Fund The Special Revenue (District Activity) Fund accounts for funds collected at individual schools for operation costs of the schools or school district that allows for more flexibility in the expenditures of those funds. (D) Special Revenue (Activity) Fund Special Revenue (Activity) Fund accounts for activities of student groups and other types of activities requiring clearing accounts. (E) Capital Project Funds Capital Project Funds are used to account for financial resources to be used for the acquisition or construction of major capital facilities and equipment (other than those financed by Proprietary Fund). SEEK Capital Outlay Fund The Support Education Excellence in Kentucky (SEEK) Capital Outlay Fund receives those funds designated by the state as Capital Outlay Funds and is restricted for use in financing projects as identified in the District’s facility plan. Building (FSPK) Fund The Facility Support Program of Kentucky (FSPK) accounts for funds generated by the building tax levy that is required to participate in the School Facilities Construction Commission’s construction funding and state matching funds, where applicable. Funds may be used for projects identified in the District’s facility plan. Construction Fund The Construction Fund accounts for proceeds from sale of bonds and other revenues to be used for authorized construction and/or remodeling. (F) Debt Service Fund The Debt Service Fund is used to account for the accumulation of resources for, and the payment of, general long-term debt principal and interest and related cost; and for the payment of interest on general obligation notes payable, as required by Kentucky Law. This is a major fund of the District. II. Proprietary Funds (Enterprise Funds) Food Service Fund The School Food Service Fund is used to account for school food service activities, including the National School Lunch Program, which is conducted in cooperation with the U.S. Department of

NOTES TO THE FINANCIAL STATEMENTS (CONTINUED)
27
Agriculture (USDA). Amounts have been recorded for in-kind contribution of commodities from the USDA. The Food Service Fund is a major fund of the District. The District applies all GASB pronouncements to proprietary funds. III. Fiduciary Fund Types Agency Funds The Agency Fund accounts for activities of student groups and other types of activities requiring clearing accounts. These funds are accounted for in accordance with “Accounting Procedures for Kentucky School Activity Funds,” except for those accounted through the central office. Private Purpose Trust Private Purpose Trusts are maintained within MUNIS and account for revenues generated by trusts set up to benefit a specific location in Elliott County. An endowment was established February 1, 2010 by a grant of $100,000 from the W. Paul and Lucille Caudill Little Foundation, Inc. to provide $5,000 in operating costs per year to the Adkins-Caudill Performing Arts Center. It was to be held in a separately managed fiduciary account permanently designated for the Adkins-Caudill Performing Arts Center. This is a major fund of the District.
The original principal received remains in the net position on the statement of net position and is restricted for the trust principal. The net appreciation on investments available for expenditures is included in the restricted spendable net position on the statement of net position. The District’s policy is to spend only investment income for the purposes of the Trust. The District has interpreted the Uniform Prudent Management of Institutional Funds Act (UPMIFA) as requiring the preservation of the fair value of the original gift as of the gift date of the donor-restricted endowment funds absent explicit donor stipulations to the contrary. As a result of this interpretation, the District classifies as restricted permanent nonspendable (a) the original value of the gift donated to the permanent endowment, (b) the original value of any subsequent gifts to the permanent endowment, and (c) accumulations to the permanent endowment made in accordance with the direction of the applicable donor gift instrument at the time the accumulations is added to the fund. The remaining portion of the donor-restricted endowment fund that is not classified in permanent nonspendable net position is classified as restricted permanent spendable net position until those amounts are appropriated for expenditure by the District in a manner consistent with the standard of prudence prescribed by UPMIFA. In accordance with UPMIFA, the District considers the following factors in making a determination to appropriate or accumulate donor-restricted endowment funds:
The duration and preservation of the fund The purposes of the organization and the donor-restricted endowment fund General economic conditions The possible effect of inflation and deflation The expected total return from income and the appreciation of investments Other resources of the District
NOTES TO THE FINANCIAL STATEMENTS (CONTINUED)
28
The investment policies of the District Basis of Accounting Basis of accounting determines when transactions are recorded in the financial records and reported on the financial statements. Government-wide financial statements are prepared using the accrual basis of accounting. Governmental funds use the modified accrual basis of accounting. Proprietary and fiduciary funds also use the accrual basis of accounting. Revenues – Exchange and Non-exchange Transactions – Revenues resulting from exchange transactions, in which each party receives essentially equal value, is recorded on the accrual basis when the exchange takes place. On a modified accrual basis, revenues are recorded in the fiscal year in which the resources are measurable and available. Available means that the resources will be collected within the current fiscal year or are expected to be collected soon enough thereafter to be used to pay liabilities of the current fiscal year. For the District, available means expected to be received within sixty days of the fiscal year-end. Non-exchange transactions, in which the District receives value without directly giving equal value in return, include property taxes, grants, entitlements and donations. On an accrual basis, revenue from property taxes is recognized in the fiscal year for which the taxes are levied. Revenue from grants, entitlements and donations is recognized in the fiscal year in which all eligibility requirements have been satisfied. Eligibility requirements include timing requirements, which specify the year when the resource are required to be used or the fiscal year when use is first permitted, matching requirements, in which the District must provide local resources to be used for a specified purpose, and expenditure requirements, in which the resources are provided to the District on a reimbursement basis, On a modified accrual basis, revenues from nonexchange transactions must also be available before it can be recognized. Unearned Revenue – Unearned revenue arises when assets are recognized before revenue recognition criteria have been satisfied. Grants and entitlements received before the eligibility requirements are met are recorded as unearned revenue. Expenses/Expenditures – On the accrual basis of accounting, expenses are recognized at the time they are incurred. The fair value of donated commodities used during the year is reported in the statement the revenues, expenses, and changes in net position as an expense with a like amount reported as donated commodities revenue. Unused donated commodities are reported as unearned revenue. The measurement focus of governmental fund accounting is on decreases in net financial resources (expenditures) rather than expenses. Expenditures are generally recognized in the accounting period in which the related fund liability is incurred, if measurable. Allocations of cost, such as depreciation, are not recognized in governmental funds. Cash and Cash Equivalents The District considers demand deposits, money market funds, and other investments with an original maturity of 90 days or less, to be cash equivalents.

NOTES TO THE FINANCIAL STATEMENTS (CONTINUED)
29
Inventories Inventory consists of food purchased by the District and commodities granted by the United States Department of Agriculture (USDA). The commodities are recognized as revenues and expenditures by the Food Service Fund when consumed. Any material commodities on hand at year end are recorded as inventory. All purchased inventory items are valued at the lower of cost or market (first-in, first-out) using the consumption method and commodities assigned values are based on information provided by the USDA. Prepaid Assets Payments made that will benefit periods beyond June 30, 2020 are recorded as prepaid items using the consumption method. A current asset for the prepaid amount is recorded at the time of the purchase and expenditure/expense is reported in the year in which services are consumed.
Capital Assets General capital assets are those assets not specifically related to activities reported in the proprietary funds. These assets generally result from expenditures in the government funds. These assets are reported in the government activities column of the government-wide financial Statement of Net Position but are not reported in the fund financial statements. Capital assets utilized by the proprietary funds are reported both in the business-type activities column of the government-wide Statement of Net Position and in the respective funds. All capital assets are capitalized at cost (or estimated historical cost) and updated for additions and retirements during the year. Donated fixed assets are recorded at their fair market values as of the date received. The District maintains a capitalization threshold of one thousand dollars with the exception of computers, digital cameras and real property for which there is no threshold. The District does not possess any infrastructure. Improvements are capitalized; the cost of, normal maintenance and repairs that do not add to the value of the asset or materially extend an assets life are not. Land and construction in progress are not depreciated. The other property, plant and equipment of the district are depreciated using the straight-line method over the following estimated useful lives: Description Estimated Lives Buildings and improvements 25-50 years Land improvements 20 years Technology equipment 5 years Vehicles 5-10 years Audio-visual equipment 15 years Food service equipment 10-12 years Furniture and fixtures 7 years Other 10 years Accrued Liabilities and Long-Term Obligations All payables, accrued liabilities and long-term obligations are reported in the government-wide financial statements, and all payables, accrued liabilities and long-term obligations payable from proprietary funds are reported on the proprietary fund financial statements.
NOTES TO THE FINANCIAL STATEMENTS (CONTINUED)
30
In general, payables and accrued liabilities that will be paid from governmental funds are reported on the governmental fund financial statements regardless of whether they will be liquidated with current resources. However, claims and judgment, the noncurrent portion of capital leases, accumulated sick leave, contractually required pension and OPEB contributions and special termination benefits that will be paid from governmental funds are reported as a liability in the fund financial statements only to the extent that they will be paid with current, expendable, available financial resources. In general, payments made within sixty days after year-end are considered to have been made with current available financial resources. Bonds and other long-term obligations that will be paid from governmental funds are not recognized as a liability in the fund financial statements until due. Accumulated Unpaid Sick Leave Benefits Upon retirement from the school system, an employee will receive from the District an amount equal to 30% of the value of the accumulated sick leave. Sick leave benefits are accrued as a liability using the termination payment method. An accrual for earned sick leave is made to the extent that it is probable that the benefits will result in termination payments. The liability is based on the School District’s past experience of making termination payments. Fund Balances Fund balance is divided into five categories as defined by GASB 54 as follows:
Nonspendable: Permanently nonspendable by decree of the donor, such as an endowment, or
funds that are not in a spendable form, such as prepaid expenses or inventory on hand.
Restricted Legally restricted under legislation, bond authority, or grantor contract. Committed Commitments of future funds for specific purposes passed by the Board. Assigned Funds that are intended by management to be used for a specific purpose,
including encumbrances. Unassigned Funds available for any purpose; unassigned amounts are reported only in the
General Fund unless a fund has a deficit.
The Board has adopted a GASB 54 spending policy which states that the spending order of funds is to first use restricted, committed, and assigned resources first, then unassigned resources as they are needed.
Net Position The Statement of Net Position presents the reporting entity’s non-fiduciary assets and liabilities, the difference between the two being reported as Net Position. Net Position is reported in three categories: 1) net investment in capital assets – consisting of capital assets, net of accumulated depreciation and reduced by outstanding balances for debt related to the acquisition, construction, or improvement of the assets; 2) restricted net position – resulting from constraints placed on net position by creditors, grantors, contributors, and other external parties, including those constraints imposed by law through constitutional provisions or enabling legislation adopted by the School District; 3) unrestricted net position – those assets that do not meet the definition of restricted net position or net investment in capital assets. It is the District’s policy to first apply restricted net position and then unrestricted net
NOTES TO THE FINANCIAL STATEMENTS (CONTINUED)
31
position when an expense is incurred for which both restricted and unrestricted net position are available. Property Taxes Property Tax Revenues – Property taxes are levied each September on the assessed value listed as of the prior January 1, for all real and personal property in the county. The billings are considered due upon receipt by the taxpayer; however, the actual date is based on a period ending 30 days after the tax bill mailing. Property taxes collected are recorded as revenues in the fiscal year for which they were levied. All taxes collected are initially deposited in the General Fund and then transferred to the appropriate fund. The property tax rates assessed for the year ended June 30, 2020, to finance the General Fund operations were $.418 per $100 valuation of real property, $.426 per $100 valuation for business personal property and $.565 per $100 valuation for motor vehicles. The District levies a utility gross receipts license tax in the amount of 3% of the gross receipts derived from the furnishings, within the county, of telephonic and telegraphic communications services, cablevision services, electric power, water, and natural, artificial and mixed gas. Operating and Non-Operating Revenues and Expenses Operating revenues are those revenues that are generated directly from the primary activity of the proprietary funds. For the School District, those revenues are primarily charges for meals provided by the various schools. Non-operating revenues are not generated directly from the primary activity of the proprietary funds. For the School District those revenues come in the form of grants (federal and state), donated commodities, and earnings from investments. In-Kind Local contributions, which include contributed services provided by individuals, private organizations, and local governments, are used to match federal and state administered funding on various grants. The amounts of such services and donated commodities are recorded in the accompanying financial statements at their estimated fair market values. Contributions of Capital Contributions of capital in proprietary fund financial statements arise from outside contributions of capital assets, or from grants or outside contributions of resources restricted to capital acquisition and construction. Inter-fund Receivables/Payables On fund financial statements, receivables and payables resulting from short-term interfund loans are classified as “interfund receivables/payables”. These amounts are eliminated in the governmental and business-type activities columns of the statements of net position, except for the net residual amounts due between governmental and business-type activities, which are presented as internal balances.

NOTES TO THE FINANCIAL STATEMENTS (CONTINUED)
32
Interfund Transfers Exchange transactions between funds are reported as revenues in the seller funds and as expenditures/expenses in the purchaser funds. Flows of cash or goods from one fund to another without a requirement for repayment are reported as interfund transfers. Interfund transfers are reported as other financing sources/uses in governmental funds and after nonoperating revenues/expenses in proprietary funds. Repayments from funds responsible for particular expenditures/expenses to the funds that initially paid for them are not presented on the financial statements. Deferred Outflows/Inflows of Resources In addition to assets, the statement of net position includes a section for deferred outflows of resources. This separate financial statement element, deferred outflows of resources, represents a consumption of net position that applies to a future period(s) and so will not be recognized as an outflow of resources (expense/expenditure) until the appropriate period. The District reports three types of deferred outflows – contributions to the CERS’s pension and OPEB plans after the measurement period and the unrecognized portion of a deferred loss on the refinancing of long-term debt. In addition to liabilities, the statement of net position will sometimes report a separate section for deferred inflows of resources. This separate financial statement element, deferred inflows of resources, represents an acquisition of net position that applies to a future period(s) and so will not be recognized as an inflow of resources (revenue) until appropriate period. The District reports two types of deferred inflows related to the net difference projected and actual earnings on pension and OPEB plan investments.
Pensions For purposes of measuring the net pension liability, deferred outflows of resources and deferred inflows of resources related to pensions, and pension expense, information about the fiduciary net position of the County Employees Retirement System Non-Hazardous (“CERS”) and Teachers Retirement System of the State of Kentucky (“TRS”) and additions to/deductions from fiduciary net position have been determined on the same basis as they are reported by the pensions. For this purpose, benefit payments (including refunds of employee contributions) are recognized when due and payable in accordance with the benefit terms. Investments are reported at fair value. Postemployment Benefits Other Than OPEBs (OPEB) For purposes of measuring the liability, deferred outflows of resources and deferred inflows of resources related to OPEB, and OPEB expense, information about the fiduciary net position of the Teachers’ Retirement System of the State of Kentucky (TRS), and the County Retirement System of Kentucky (CERS), and additions to/deductions from TRS’s/CERS’s fiduciary net position have been determined on the same basis as they are reported by TRS/CERS. For this purpose, benefit payments (including refunds of employee contributions) are recognized when due and payable in accordance with the benefit terms. Investments are reported at fair value, except for money market investments and participating interest-earning investment contracts that have a maturity at the time of purchase of one year or less, which are reported at cost.
NOTES TO THE FINANCIAL STATEMENTS (CONTINUED)
33
Bond and Related Premiums, Discounts, and Issuance Costs In the government-wide financial statements and in the proprietary fund financial statements, bond premiums and discounts are deferred and amortized over the life of the bonds using the straight line method. Bonds payable are reported net of the applicable bond premium or discount. Bond issuance costs are expensed when bonds are issued. In governmental fund financial statements, bond premiums and discounts, as well as debt issuance costs are recognized in the current period. The face amount of the debt is reported as other financing sources. Premiums received on debt issuance are reported as other financing sources while discounts on debt issuances are reported as other financing uses. Issuance costs, whether or not withheld from the actual debt proceeds received, are reported as debt service expenditures. Estimates The process of preparing financial statements in conformity accounting principles generally accepted in the United States of America requires District’s management to make estimates and assumptions that affect reported amounts of assets, liabilities, revenues, expenditures, designated fund balances, and disclosure of contingent assets and liabilities at the date of the financial statements. Actual results could differ from those estimates. Budgetary Process The District prepares its budgets on the modified accrual basis of accounting, which is the same basis as used to prepare the Statement of Revenues, Expenditures and Changes in Fund Balances – Governmental Funds. Once the budget is approved, it can be amended. Amendments are presented to the Board at their regular meetings. Per Board policy, all amendments require Board approval. Such amendments are made before the fact, are reflected in the official minutes of the Board, and are not made after fiscal year-end as dictated by law. Each budget is prepared and controlled by the budget coordinator at the revenue and expenditure function/object level. All budget appropriations lapse at year-end. The Kentucky Department of Education does not require the Capital Project Funds and Debt Service Funds to prepare budgets. New Pronouncements GASB issued Statement No. 88, Certain Disclosures Related to Debt, Including Direct Borrowings and Direct Placements, effective for the District’s fiscal year ending June 30, 2020. GASB issued Statement No. 95, Postponement of the Effective dates of Certain Authoritative Guidance, effective for the District’s fiscal year ending June 30, 2020. The adoption of GASB statement Numbers 88 and 95 did not have an impact on the District’s financial position or results of operations. The District will adopt the following new accounting pronouncements in future years:
NOTES TO THE FINANCIAL STATEMENTS (CONTINUED)
34
GASB issued Statement No. 84, Fiduciary Activities, effective for the District’s fiscal year ending June 30, 2021. GASB issued Statement No. 87, Leases, effective for the District’s fiscal year ending June 30, 2022. GASB issued Statement No. 89, Accounting for Interest Costs Incurred before the End of a Construction Period, effective for the District’s fiscal year ending June 30, 2022. GASB Statement No. 90, Majority Equity Interests – an amendment of GASB Statements No. 14 and No. 61, effective for the District’s fiscal year ending June 30, 2021. GASB issued Statement No. 91, Conduit Debt Obligations, effective for the District’s fiscal year ending June 30, 2023. GASB issued Statement No. 92, Omnibus 2020, effective for the District’s fiscal year ending June 30, 2022. GASB issued Statement No. 93, Replacement of Interbank Offered Rates, effective for the District’s fiscal year ending June 30, 2022. GASB issued Statement No. 94, Public-Private and Public-Public Partnerships and Availability Payment Arrangements, effective for the District’s fiscal year ending June 30, 2023. The impact of these pronouncements on the District’s financial statement has not been determined NOTE B – CASH AND CASH EQUIVALENTS The Kentucky Revised Statutes authorize the District to invest money subject to its control in obligations of the United States; bonds or certificates of indebtedness of Kentucky and its agencies and instrumentalities; savings and loan associations insured by an agency of the United States up to the amount insured; and national or state banks chartered in Kentucky and insured by an agency of the United States providing such banks pledge as security obligations, as permitted by KRS 41.240(4), having a current quoted market value at least equal to uninsured deposits. Custodial credit risk is the risk that in the event of a bank failure, a government’s deposits may not be returned to it. The District’s deposit policy for custodial credit risk requires compliance with the provisions of state law. At year end the District’s bank balances were collateralized by securities held by the pledging bank’s trust department in the District’s name and FDIC insurance. At year end, the carrying amount of the District’s cash and cash equivalents was $1,012,646. The bank balance for the same time was $1,298,250. Due to the nature of the accounts and certain limitations imposed on the use of funds, each bank account within the following funds is considered to be restricted: SEEK Capital Outlay Fund, Facility Support Program (FSPK/Building) Fund, Special Revenue (Grant Fund), Debt Service Fund, School Construction Fund, School Food Service Fund, and School Activity Fund.
NOTES TO THE FINANCIAL STATEMENTS (CONTINUED)
35
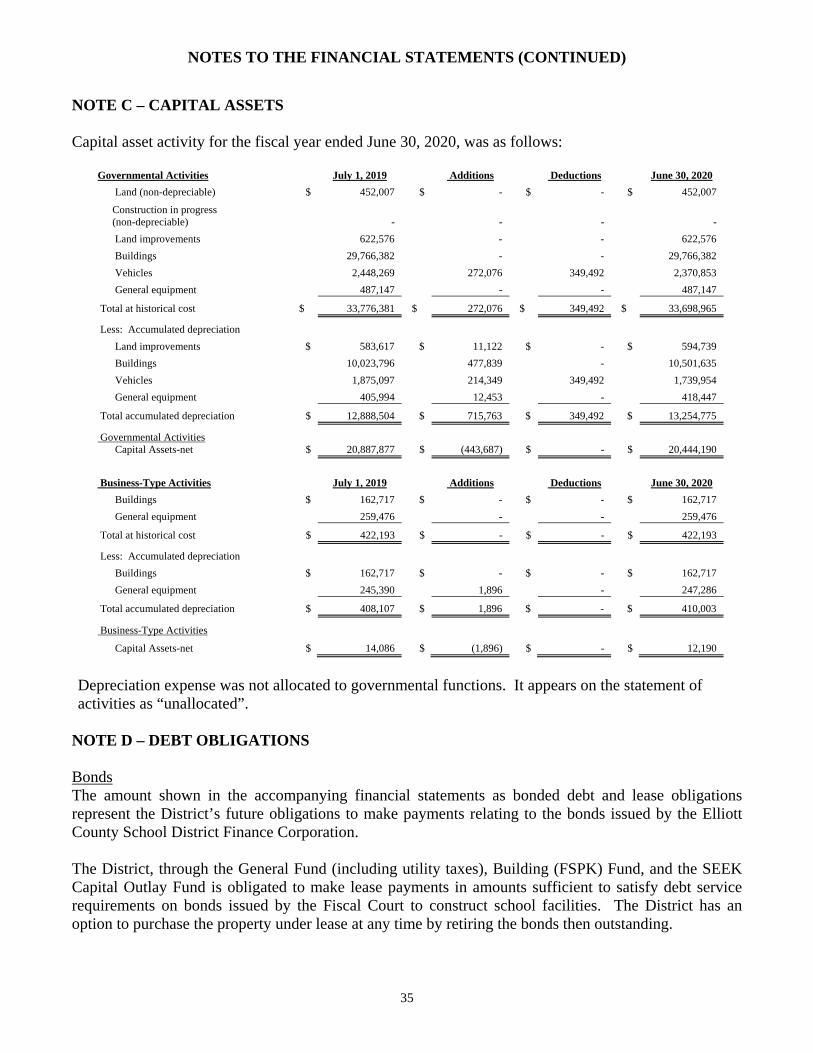
NOTE C – CAPITAL ASSETS Capital asset activity for the fiscal year ended June 30, 2020, was as follows:
Governmental Activities July 1, 2019 Additions Deductions June 30, 2020
Land (non-depreciable) $ 452,007 $ - $ - $ 452,007
Construction in progress (non-depreciable) - - - -
Land improvements 622,576 - - 622,576
Buildings 29,766,382 - - 29,766,382
Vehicles 2,448,269 272,076 349,492 2,370,853
General equipment 487,147 - - 487,147
Total at historical cost $ 33,776,381 $ 272,076 $ 349,492 $ 33,698,965
Less: Accumulated depreciation
Land improvements $ 583,617 $ 11,122 $ - $ 594,739
Buildings 10,023,796 477,839 - 10,501,635
Vehicles 1,875,097 214,349 349,492 1,739,954
General equipment 405,994 12,453 - 418,447
Total accumulated depreciation $ 12,888,504 $ 715,763 $ 349,492 $ 13,254,775
Governmental Activities Capital Assets-net $ 20,887,877 $ (443,687) $ - $ 20,444,190
Business-Type Activities July 1, 2019 Additions Deductions June 30, 2020
Buildings $ 162,717 $ - $ - $ 162,717
General equipment 259,476 - - 259,476
Total at historical cost $ 422,193 $ - $ - $ 422,193
Less: Accumulated depreciation
Buildings $ 162,717 $ - $ - $ 162,717
General equipment 245,390 1,896 - 247,286
Total accumulated depreciation $ 408,107 $ 1,896 $ - $ 410,003
Business-Type Activities
Capital Assets-net $ 14,086 $ (1,896) $ - $ 12,190
Depreciation expense was not allocated to governmental functions. It appears on the statement of activities as “unallocated”.
NOTE D – DEBT OBLIGATIONS Bonds The amount shown in the accompanying financial statements as bonded debt and lease obligations represent the District’s future obligations to make payments relating to the bonds issued by the Elliott County School District Finance Corporation. The District, through the General Fund (including utility taxes), Building (FSPK) Fund, and the SEEK Capital Outlay Fund is obligated to make lease payments in amounts sufficient to satisfy debt service requirements on bonds issued by the Fiscal Court to construct school facilities. The District has an option to purchase the property under lease at any time by retiring the bonds then outstanding.

NOTES TO THE FINANCIAL STATEMENTS (CONTINUED)
36
The original amount of outstanding issues, the issue dates, interest rates, maturity dates, and outstanding balances, at June 30, 2020 are summarized below:
Original Maturity Interest 2019 Bonds 2020 Bonds
Bond Issues Amount Date Rates Outstanding Additions Retirements Outstanding
2012 $ 4,500,000 8/1/2032 2.0-3.25% $ 3,960,000 $ - 210,000 $ 3,750,000
2012R 2,020,000 9/1/2023 .5 - 2.125% 990,000 - 225,000 765,000
2015 395,000 2/1/2035 3.1% 335,000 - 15,000 320,000
2005 290,000 8/1/2026 4.125% 130,000 - 15,000 115,000
2006 500,000 1/25/2021 QZAB 500,000 - - 500,000 2016R 2,185,000 11/1/2027 1-2% 1,910,000 - 205,000 1,705,000
2014 1,205,000 5/1/1934 2.55-3.75 1,110,000 - 30,000 1,080,000
2013 595,000 8/1/2033 2.25-3.75 555,000 - 10,000 545,000
9,490,000 - 710,000 8,780,000
Add: Premium 13,420 - 1,944 11,476
Less: Discount (34,915) - (3,820) (31,095)
$ 9,468,505 $ - $ 708,124 $ 8,760,381
The District has entered into “participation agreements” with the Kentucky School Facility Construction Commission. The Kentucky Legislature, for the purpose of assisting local school districts in meeting school construction needs, created the Commission. The table following sets forth the amount to be paid by the District and the Commission for each year until maturity of all bond issues. The bonds may be called prior to maturity at dates and redemption premiums specified in each issue. Assuming no issues are called prior to maturity, the minimum obligations of the District, including amounts to be paid by the Commission, at June 30, 2020 for debt service, (principal and interest) are as follows:
Fiscal Year Ended Principal Interest Principal Interest June 30th Local KSFCC Local KSFCC Total Total
2021 $ 353,016 $ 871,984 $ 128,457 $ 81,592 $ 1,225,000 $ 210,049
2022 365,326 384,674 120,986 75,718 750,000 196,704
2023 377,494 392,506 113,042 68,241 770,000 181,283
2024 295,801 384,199 105,616 59,598 680,000 165,215
2025 277,539 362,461 98,684 51,152 640,000 149,836
2026-2030 1,596,703 1,308,297 365,015 141,793 2,905,000 506,808
2031-2035 1,338,557 471,443 94,052 27,574 1,810,000 121,626
$ 4,604,436 $ 4,175,564 $ 1,025,852 $ 505,668 $ 8,780,000 $ 1,531,520
NOTES TO THE FINANCIAL STATEMENTS (CONTINUED)
37
Accumulated Sick Leave Upon retirement from the school system, an employee will receive from the District an amount equal to 30% of the value of accumulated sick leave. The activity during fiscal year 2020 for accumulated sick leave is as follows:
2019 2020
Outstanding Outstanding Balance Additions Retirements Balance
Sick Leave $ 91,474 $ - $ 14,229 $ 77,245
KSBIT The District elected to finance the worker’s compensation insurance deficit (KSBIT) with the now defunct Kentucky School Board Insurance Trust through the Kentucky Inter-local School Transportation Association (KISTA). The activity during fiscal year 2020 for the worker’s compensation and property and liability deficit are as follows:
Original Maturity Interest 2019 KSBIT 2020 KSBIT KISBIT Issues Amount Date Rates Outstanding Additions Retirements Outstanding
KSBIT $ 222,133 8/15/2024 2.0 - 3.25% $ 141,669 $ - $ 21,942 $ 119,727
The minimum payments are as follows:
Fiscal
Year Ended Local Total
June 30th Principal Interest Payments
2021 $ 22,516 $ 3,349 $ 25,865
2022 23,201 2,663 25,864
2023 23,908 1,956 25,864
2024 24,652 1,212 25,864
2025 25,450 414 25,864
Totals $ 119,727 $ 9,594 $ 129,321
Net Pension & OPEB Liability The net pension liability is $3,059,438 for governmental activities and $136,166 for business-type activities for a total of $3,195,604 as of June 30, 2020. (See Note G for additional information) The net OPEB liability is $2,836,489 for governmental activities and $32,556 for business-type activities for a total of $2,869,045 as of June 30, 2020. (See Note I for additional information)

NOTES TO THE FINANCIAL STATEMENTS (CONTINUED)
38
A summary of activity in bond obligations and other debts is as follows:
Description
2019 Outstanding
Balance
Additions
Retirements
2020 Outstanding
Balance Amount Due in One Year
Bonds, Net of Premium and Discount $ 9,468,505 $ - $ 708,124 $ 8,760,381 $ 1,225,000
Capital Lease 758,030 185,209 165,667 777,572 111,746
Sick Leave 91,474 - 14,229 77,245 -
KSBIT 141,669 - 21,942 119,727 22,516
Net Pension Liability 2,868,899 326,705 - 3,195,604 -
Net OPEB Liability 3,359,571 - 490,526 2,869,045 -
Totals $ 16,688,148 $ 511,914 $ 1,400,488 $ 15,799,574 $ 1,359,262
NOTE E – CAPITAL LEASE PAYABLE The following is an analysis of the leased property under capital lease by class:
KISTA Issue Original Amount
Maturity Date
Interest Rates
2019 Lease Outstanding Additions Retirements
2020 Lease Outstanding
Second Series 2015 284,961 3/1/2025 2.0-2.5% $ 167,192 $ - $ 27,801 $ 139,391
2014 61,793 3/1/2024 2.0 - 2.625% 29,970 - 6,212 23,758
Third Series 2009 796,487 3/1/2020 2.0- 3.6% 76,336 - 76,336 -
Series 2017 374,948 3/1/2027 2.55% 294,567 - 35,124 259,443
Series 2019 189,965 3/1/2029 3.000% 189,965 - 20,194 169,771
Series 2020 185,209 3/1/2030 2.0-2.5% - 185,209 - 185,209
$ 758,030 $ 185,209 $ 165,667 $ 777,572
The following is a schedule by years of the future minimum lease payments under capital lease together with the present value of the net minimum lease payments as of June 30, 2020:
Fiscal Year Ended Local Total June 30th Principal Interest Payments
2021 $ 111,746 $ 19,094 $ 130,840
2022 110,622 16,557 127,179
2023 109,519 13,871 123,390
2024 107,266 11,146.92 118,412.92
2025 104,369 8,433 112,802.42
2026-2030 234,050 13,220 247,270 $ 777,572 $ 82,323 $ 859,895

NOTES TO THE FINANCIAL STATEMENTS (CONTINUED)
39
Total minimum lease payments $ 859,895 Less: Amount representing interest (82,323) Present Value of Net Minimum Lease Payments $ 777,572 NOTE F – COMMITMENTS UNDER NON-CAPITALIZED LEASES Commitments under operating lease agreements for office equipment provided for the minimum future rental payments as of June 30, 2020 are as follows:
Fiscal Year Ended June
30, Payment
2021 $ 3,360 2022 3,360 2023 3,360 2024 2,520
Total $ 12,600
Expenditures for equipment under operating leases for the year ended June 30, 2020 totaled $7,656. NOTE G – RETIREMENT PLANS The District’s employees are provided with two pension plans, based on each position’s college degree requirement. The Kentucky Teachers Retirement System covers positions requiring teaching certification or otherwise requiring a college degree. The County Employees Retirement System covers employees whose position does not require a college degree or teaching certification. Teachers Retirement System Kentucky (TRS) Plan description—Teaching-certified employees of the Kentucky School District are provided pensions through the Teachers’ Retirement System of the State of Kentucky—a cost-sharing multiple-employer defined benefit pension plan with a special funding situation established to provide retirement annuity plan coverage for local school districts and other public educational agencies in the state. TRS was created by the 1938 General Assembly and is governed by Chapter 161 Section 220 through Chapter 161 Section 990 of the Kentucky Revised Statutes (KRS). TRS is a blended component unit of the Commonwealth of Kentucky and therefore is included in the Commonwealth’s financial statements. TRS issues a publicly available financial report that can be obtained at http://www.trs.ky.gov/financial-reports-information . Benefits provided—For members who have established an account in a retirement system administered by the Commonwealth prior to July 1, 2008, members become vested when they complete five (5) years of credited service. To qualify for monthly retirement benefits, payable for life, members must either:
NOTES TO THE FINANCIAL STATEMENTS (CONTINUED)
40
1.) Attain age fifty-five (55) and complete five (5) years of Kentucky service, or
2.) Complete 27 years of Kentucky service.
Participants that retire before age 60 with less than 27 years of service receive reduced retirement benefits. Non-university members with an account established prior to July 1, 2002 receive monthly payments equal to two (2) percent (service prior to July 1, 1983) and two and one-half (2.5) percent (service after July 1, 1983) of their final average salaries for each year of credited service. New members (including second retirement accounts) after July 1, 2002 will receive monthly benefits equal to 2% of their final average salary for each year of service if, upon retirement, their total service is less than ten years. New members after July 1, 2002 who retire with ten or more years of total service will receive monthly benefits equal to 2.5% of their final average salary for each year of service, including the first ten years. In addition, employees who retire July 1, 2004 and later with more than 30 years of service will have their multiplier increased for all years over 30 from 2.5% to 3.0% to be used in their benefit calculation. Effective July 1, 2008, the system has been amended to change the benefit structure for members hired on or after that date. Final average salary is defined as the member’s five (5) highest annual salaries for those with less than 27 years of service. Employees at least age 55 with 27 or more years of service may use their three (3) highest annual salaries to compute the final average salary. TRS also provides disability benefits for vested employees at the rate of sixty (60) percent of the final average salary. A life insurance benefit, payable upon the death of a member, is $2,000 for active contributing members and $5,000 for retired or disabled members. Cost of living increases are one and one-half (1.5) percent annually. Additional ad hoc increases and any other benefit amendments must be authorized by the General Assembly. Contributions—Contribution rates are established by Kentucky Revised Statutes (KRS). Non-university employees are required to contribute 12.855% of their salaries to the System. The Commonwealth of Kentucky, as a non-employer contributing entity, pays matching contributions in the amount of 13.105% of salaries for local school district employees hired before July 1, 2008 and 14.105% for those hired after July 1, 2008. For local school district employees whose salaries are federally funded, the employer contributes 16.105% of salaries. If an employee leaves covered employment before accumulating five (5) years of credited service, accumulated employee pension contributions plus interest are refunded to the employee upon the member’s request. Medical Insurance Plan Plan description—In addition to the pension benefits described above, Kentucky Revised Statute 161.675 requires TRS to provide post-employment healthcare benefits to eligible members and dependents. The TRS Medical Insurance benefit is a cost-sharing multiple employer defined benefit
NOTES TO THE FINANCIAL STATEMENTS (CONTINUED)
41
plan. Changes made to the medical plan may be made by the TRS Board of Trustees, the Kentucky Department of Employee Insurance and the General Assembly. To be eligible for medical benefits, the member must have retired either for service or disability. The TRS Medical Insurance Fund offers coverage to members under the age of 65 through the Kentucky Employees Health Plan administered by the Kentucky Department of Employee Insurance. Once retired members and eligible spouses attain age 65 and are Medicare eligible, coverage is obtained through the TRS Medicare Eligible Health Plan. Funding policy—In order to fund the post-retirement healthcare benefit, seven and one half percent (7.50%) of the gross annual payroll of members is contributed. Three point seventy-five percent (3.75%) is paid by member contributions and three quarters percent (.75%) from state appropriation and three percent (3.00%) from the employer. Also, the premiums collected from retirees as described in the plan description and investment interest help meet the medical expenses of the plan. Pension Liabilities, Pension Expense, and Deferred Outflows of Resources and Deferred Inflows of Resources Related to TRS At June 30, 2020 the District did not report a liability for the District’s proportionate share of the net pension liability because the Commonwealth of Kentucky provides the pension support directly to TRS on behalf of the District. The amount recognized by the District as its proportionate share of the net pension liability, the related State support, and the total portion of the net pension liability that was associated with the District were as follows:
District's proportionate share of TRS net pension liability $ -
Commonwealth's proportionate share of the TRS net pension liability associated with the District 18,260,871
$ 18,260,871
The net pension liability was measured as of June 30, 2019, and the total pension liability used to calculate the net pension liability was determined by an actuarial valuation as of that date. The District’s proportion of the net pension liability was based on the actual liability of the employees and former employees relative to the total liability of the System as determined by the actuary. At June, 30, 2020, the District’s proportion was 0.1338%. Actuarial Methods and Assumptions—The total pension liability in the June 30, 2019 actuarial valuation was determined using the following actuarial assumptions, applied to all periods included in the measurement: Valuation Date June 30, 2018 Actuarial Cost Method Entry Age Normal

NOTES TO THE FINANCIAL STATEMENTS (CONTINUED)
42
Amortization Method Level percentage of payroll, closed Remaining Amortization Period 28.1 years Asset Valuation Method 5-year smoothed market value Single Equivalent Interest Rate 7.5% Municipal Bond Index Rate 3.5% Projected Salary Increase 3.5-7.3%, including inflation Investment Rate of Return 7.5%, net of pension plan investment expense, including
inflation. The following represents assumptions and changes of assumptions from the prior valuation to the valuation performed as of June 30, 2019: - Municipal Bond Index Rate decreased to 3.5%
Mortality rates were based on the RP-2000 Combined Mortality Table for Males or Females, as appropriate, with adjustments for mortality improvements based on a projection of Scale BB to 2025 (with a set forward of 1 year for females and 2 years for males). The most recent experience study based on the results from July 1, 2010 – June 30, 2015 adopted by the Board on September 19, 2016.
The long-term expected rate of return on pension plan investments was determined using a log-normal distribution analysis in which best-estimate ranges of expected future real rates of return (expected returns, net of pension plan investment expense and inflation) are developed for each major asset class. These ranges are combined to produce the long-term expected rate of return by weighting the expected future real rates of return by the target asset allocation percentage and by adding expected inflation. The target allocation and best estimates of arithmetic real rates of return for each major asset class, as provided by TRS’s investment consultant, are summarized in the following table:
Asset Class
Target Allocation Long Term Expected
Real Rate of Return
U.S. Equity 40.0% 4.2% International Equity 22.0% 5.2% Fixed Income 15.0% 1.2% Additional Categories 7.0% 3.2% Real Estate 7.0% 3.8% Private Equity 7.0% 6.3% Cash 2.0% 0.9% Total 100.0%
Discount Rate: The discount rate used to measure the total pension liability was 7.50%. The projection of cash flows used to determine the discount rate assumed that plan member contributions will be made at the current contribution rates and the employer contributions will be made at the Actuarially Determined Contribution rates for all fiscal years in the future. Based on those assumptions, the pension plan’s fiduciary net position was projected to be available to make all projected future benefit payments of current plan members. Therefore, the long-term expected rate of return on pension plan

NOTES TO THE FINANCIAL STATEMENTS (CONTINUED)
43
investments was applied to all periods of projected benefit payments to determine the total pension liability. The following table presents the net pension liability of the Commonwealth associated with the District, calculated using the discount rate of 7.50%, as well as what the Commonwealth’s net pension liability would be if it were calculated using a discount rate that is 1-percentage-point lower (6.50%) or 1-percentage-point higher (8.50%) than the current rate:
1% Decrease Current
Discount Rate 1% Increase
6.50% 7.50% 8.50%Commonwealth's proportionate share of net pension liability $ 23,316,273 $ 18,260,871 $ 14,006,263
Pension plan fiduciary net position: Detailed information about the pension plan’s fiduciary net position is available in the separately issued TRS financial report which is publically available at http://www.TRS.ky.gov/. County Employees Retirement System Plan description—Substantially all full-time classified employees of the District participate in the County Employees Retirement System (“CERS”). CERS is a cost-sharing, multiple-employer defined benefit pension plan administered by the Kentucky General Assembly, The plan covers substantially all regular full-time members employed in non-hazardous duty positions of each county and school board, and any additional eligible local agencies electing to participate in the plan. The plan provides for retirement, disability and death benefits to plan members. CERS issues a publicly available financial report included in the Kentucky Retirement Systems Annual Report that includes financial statements and the required supplementary information for CERS. That report may be obtained by writing to Kentucky Retirement Systems, Perimeter Park West, 1260 Louisville Road, Frankfort, Kentucky, 40601, or by calling (502) 564-4646 or at https://kyret.ky.gov. Benefits provided: Benefits under the plan will vary based on final compensation, years of service and other factors as fully described in the plan documents. Contributions: Funding for CERS is provided by members, who contribute 5.00% (6.00% for employees hired after September 1, 2008) of their salary through payroll deductions, and by employers of members. For the year ending June 30, 2020, employers were required to contribute 24.06% of the member’s salary. During the year ending June 30, 2020, the District contributed $279,844 to the CERS pension plan. The contribution requirements of CERS are established and may be amended by the CERS Board of Trustees. CERS-Medical Insurance Plan

NOTES TO THE FINANCIAL STATEMENTS (CONTINUED)
44
In addition to the CERS pension benefits described above, recipients of CERS retirement benefits may elect to participate in a voluntary hospital/medical group insurance plan for themselves and their dependents. The cost of participation for their dependents is borne by the retiree. The retirement system will pay a portion of the cost of participation for the retiree based on years of service as follows: Less than 4 years – 0%, 4-9 years – 25%, 10-14 years – 50%, 15-19 years – 75% and 20 or more years – 100%. Pension Liabilities, Pension Expense, and Deferred Outflows of Resources and Deferred Inflows of Resources Related to CERS At June 30, 2020, the District reported a liability for its proportionate share of the net pension liability. The net pension liability was measured as of June 30, 2019. The total pension liability used to calculate the net pension liability was based on an actuarial valuation as of June 30, 2019. An expected total pension liability as of June 30, 2019 was determined using standard roll-forward techniques. The District’s proportion of the net pension liability was based on contributions to CERS during the fiscal year ended June 30, 2019. At June 30, 2020, the District’s proportion was 0.045437%.
District's proportionate share of CERS net pension liability $ 3,195,604
Commonwealth's proportionate share of the CERS net pension liability associated with the District -
$ 3,195,604
For the year ended June 30, 2020, the District recognized pension expense of $270,381. At June 30, 2020, the District reported deferred outflows of resources and deferred inflows of resources related to pensions from the following sources:
Deferred Outflows of Resources
Deferred Inflows of Resources
Differences between expected and actual experience $ 81,593 $ 13,502 Changes of assumptions 323,431 - Net difference between projected and actual earnings on pension plan investments 61,343 112,858
Changes in proportion and differences between District contributions and proportionate share of contributions - 125,948
District contributions subsequent to the measurement date 263,669 -
$ 730,036 $ 252,308

NOTES TO THE FINANCIAL STATEMENTS (CONTINUED)
45
The $263,669 reported as deferred outflows of resources related to pensions resulting from District contributions subsequent to the measurement date will be recognized as a reduction of the net pension liability in the year ended June 30, 2020. Deferred outflows and inflows related to differences between projected and actual earnings on plan investments are netted and amortized over a closed five year period. Other amounts reported as deferred outflows of resources and deferred inflows of resources related to pensions are amortized over the average service life of all members. These will be recognized in pension expense as follows:
Year Ended June 30,
2021 $ 146,787 2022 41,145 2023 22,474 2024 3,653
$ 214,059
Actuarial Methods and Assumptions—The total pension liability for CERS was determined by applying procedures to the actuarial valuation as of June 30, 2019. The financial reporting actuarial valuation as of June 30, 2019, used the following actuarial methods and assumptions: Valuation Date June 30, 2017 Actuarial Cost Method Entry Age Normal Amortization Method Level percentage of payroll, closed Remaining Amortization Period 26 years
Asset Valuation Method 20% of the difference between the market value of assets and the expected actuarial value of assets is recognized
Inflation 2.30% Salary Increase 3.30% to 11.55%, varies by service
Investment Rate of Return 6.25% Phase-In Provision Board certified rate is phased into the actuarially
determined rate in accordance with HB 362 enacted in 2018.
The following represents assumptions and changes of assumptions from the prior valuation to the valuation performed as of June 30, 2017: - The assumed investment rate of return decreased to 6.25%. - The assumed rate of inflation decreased to 2.30%. - The Salary Increase changed to 3.30% to 11.55%. - Phase-In provision added.

NOTES TO THE FINANCIAL STATEMENTS (CONTINUED)
46
The mortality table used for active members is RP-2000 Combined Mortality Table projected with Scale BB to 2013 (multiplied by 50% for males and 30% for females). For healthy retired members and beneficiaries, the mortality table used is the RP-2000 Combined Mortality Table projected with Scale BB to 2013 (set back 1 year for females). For disabled members, the RP-2000 Combined Mortality Table projected with Scale BB to 2013 (set back 4 years for males) is used for the period after disability retirement. There is some margin in the current mortality tables for possible future improvement in mortality rates and that margin will be reviewed again when the next experience investigation is conducted. The long-term expected return on plan assets is reviewed as part of the regular experience studies prepared every five years for CERS. The most recent analysis, performed for the period covering fiscal years 2008 through 2013 is outlined in a report dated April 30, 2014. Several factors are considered in evaluating the long-term rate of return assumption including long-term historical data, estimates inherent in current market data, and a log-normal distribution analysis in which best-estimate ranges of expected future real rates of return (expected return, net of investment expense and inflation) were developed by the investment consultant for each major asset class. These ranges were combined to produce the long-term expected rate of return by weighting the expected future real rates of return by the target asset allocation percentage and then adding expected inflation. The target asset allocation and best estimates of arithmetic real rates of return for each major asset class, as provided by CERS’s investment consultant, are summarized in the following table:
Asset Class Target Allocation Long Term Expected Real Rate of Return
US Equity 18.75% 4.30% Non-US Equity 18.75% 4.80% Private Equity 10.00% 6.65% Special Credit/High Yield 15.00% 2.60% Core Bonds 13.50% 1.35% Cash 1.00% 0.20% Real Estate 5.00% 4.85% Opportunistic 3.00% 2.97% Real Return 15.00% 4.10%
100.00%
Discount rate: The discount rate used to measure the total pension liability was 6.25%. The projection of cash flows used to determine the discount rate assumed that contributions from plan members and employers will be made at statutory contribution rates. Projected inflows from investment earnings were calculated using the long-term assumed investment return of 6.25%. The long-term assumed investment rate of return was applied to all periods of projected benefit payments to determine the total pension liability. Sensitivity of the District’s proportionate share of net pension liability to changes in the discount rate: The following presents the District’s proportionate share of the net pension liability calculated using the discount rate of 6.25%, as well as what the District’s proportionate share of the net pension

NOTES TO THE FINANCIAL STATEMENTS (CONTINUED)
47
liability would be if it were calculated using a discount rate that is 1-percentage-point lower (5.25%) or 1-percentage-point higher (7.25%) than the current rate:
1% Decrease Current
Discount Rate 1% Increase
5.25% 6.25% 7.25%District's proportionate share of net pension liability $ 3,996,795 $ 3,195,604 $ 2,527,820
Pension plan fiduciary net position: Detailed information about the pension plan’s fiduciary net position is available in the separately issued CERS financial report which is publically available at https://kyret.ky.gov. Payables to the pension plan: At June 30, 2020, there are no payables to CERS. Other Retirement Plans The District also offers employees the option to participate in defined contribution plans under Sections 403(B) and 401(k) of the Internal Revenue Code. All regular full-time and part-time employees are eligible to participate and may contribute up to the maximum allowable by law. These plans are administered by an independent third-party administrator. The District offers its employees a deferred compensation plan created in accordance with Internal Revenue Code Section 457. The plan, available to all employees, permits them to defer a portion of their salary until future years. This deferred compensation is not available to employees until their termination, retirement, death or unforeseeable emergency. GASB Statement No. 32, Accounting and Financial Reporting for Internal Revenue Code Section 457 Deferred Compensation Plans, allows entities with little or no administrative involvement and who do not perform the investing function for these plans to omit plan assets and related liabilities from their financial statements. The District, therefore, does not report these assets and liabilities on its financial statements. NOTE H – ACCOUNTING STANDARDS STATEMENT NO. 75 Government Accounting Standards Board (GASB) Statement No. 75 replaces the requirements of Statements No. 45, Accounting and Financial Reporting by Employers for Postemployment Benefits Other Than OPEB’s, as amended, and No. 57, OPEB Measurements by Agent Employers and Agent Multiple-Employer Plans, for OPEB. Reporting under GASB 75 is effective for fiscal years commencing after June 15, 2017. NOTE I – POSTEMPLOYMENT BENEFITS OTHER THAN OPEB The District’s employees participate in retirement systems of either TRS or CERS as described earlier. The following describes the postemployment benefits other than OPEB for both systems.

NOTES TO THE FINANCIAL STATEMENTS (CONTINUED)
48
TRS – General Information about the OPEB Plans Plan description – Teaching-certified employees of the District are provided OPEBs through TRS – a cost-sharing multiple-employer defined benefit OPEB plan with special funding situation established to provide retirement annuity plan coverage for local school districts and other public educational agencies in the state. TRS was created by the 1938 General Assembly and is governed by Chapter 161 Section 220 through Chapter 161 Section 990 of the Kentucky Revised Statutes (KRS). TRS is a blended component unit of the Commonwealth of Kentucky and therefore is included in the Commonwealth’s financial statements. TRS issues a publicly available financial report that can be obtained at http://www.trs.ky.gov/financial-reports-information The state reports a liability, deferred outflows of resources and deferred inflows of resources, and expense as a result of its statutory requirement to contribute to the TRS Medical Insurance and Life Insurance Plans. Retiree Medical Plan funded by the Medical Insurance Fund Plan description—In addition to the OPEB benefits described above, Kentucky Revised Statute 161.675 requires TRS to provide post-employment healthcare benefits to eligible members and dependents. The TRS Medical Insurance benefit is a cost-sharing multiple employer defined benefit plan with a special funding situation. Changes made to the medical plan may be made by the TRS Board of Trustees, the Kentucky Department of Employee Insurance and the General Assembly. Benefits provided - To be eligible for medical benefits, the member must have retired either for service or disability. The TRS Medical Insurance Fund offers coverage to members under the age of 65 through the Kentucky Employees Health Plan administered by the Kentucky Department of Employee Insurance. TRS retired members are given a supplement to be used for payment of their health insurance premium. The amount of the member’s supplement is based on a contribution supplement table approved by the TRS Board of Trustees. The retired member pays premiums in excess of the monthly supplement. Once retired members and eligible spouses attain age 65 and are Medicare eligible, coverage is obtained through the TRS Medicare Eligible Health Plan. Contributions - In order to fund the post-retirement healthcare benefit, seven and one half percent (7.50%) of the gross annual payroll of members is contributed. Three point seventy-five percent (3.75%) is paid by member contributions and three quarters percent (.75%) from state appropriation and three percent (3.00%) from the employer. The state contributes the net cost of health insurance premiums for members who retired on or after July 1, 2010 who are in the non-Medicare eligible group. Also, the premiums collected from retirees as described in the plan description and investment interest help meet the medical expenses of the plan. OPEB Liabilities, OPEB Expense, and Deferred Outflows of Resources and Deferred Inflows of Resources Related to OPEBs
NOTES TO THE FINANCIAL STATEMENTS (CONTINUED)
49
At June 30, 2020, the District reported a liability of $2,105,000 for its proportionate share of the collective net OPEB liability that reflected a reduction for state OPEB support provided to the District. The collective net OPEB liability was measured as of June 30, 2019, and the total OPEB liability used to calculate the net OPEB liability was based on a projection of the District’s long-term share of contributions to the OPEB plan relative to the projected contributions of all participating employers, actuarially determined. At June 30, 2020, the District’s proportion was .071911 percent. The amount recognized by the District as its proportionate share of the OPEB liability, the related State support, and the total portion of the net OPEB liability that was associated with the District were as follows:
District's proportionate share of TRS net OPEB liability $ 2,105,000
Commonwealth's proportionate share of the TRS net OPEB liability associated with the District 1,700,000
$ 3,805,000
At June 30, 2020, the District reported deferred outflows of resources and deferred inflows of resources related to OPEBs from the following sources:
Deferred Outflows of Resources
Deferred Inflows of Resources
Differences between expected and actual experience $ - $ 509,000 Changes of assumptions 56,000 - Net difference between projected and actual earnings on pension plan investments 9,000 - Changes in proportion and differences between District contributions and proportionate share of contributions - 145,000 District contributions subsequent to the measurement date 184,072 -
$ 249,072 $ 654,000
The $184,072 reported as deferred outflows of resources related to pensions resulting from District contributions subsequent to the measurement date will be recognized as a reduction of the collective net OPEB liability for the year ended June 30, 2020. Other amounts reported as deferred outflows of resources and deferred inflows of resources related to OPEB will be recognized in the District’s OPEB expense as follows:

NOTES TO THE FINANCIAL STATEMENTS (CONTINUED)
50
Year Ended June 30,
2021 $ (115,000) 2022 (115,000) 2023 (110,000) 2024 (111,000) 2025 (86,000)
Thereafter (52,000)
$ (589,000)
Changes of Benefit Terms - None Changes of Assumptions- The amortization period decreased to 22 years and the Municipal Bond Index Rate decreased to 3.5%. Actuarial Methods and Assumptions—The total OPEB liability was determined using an actuarial valuation of the June 30, 2019 using the following actuarial assumptions, applied to all periods included in the measurement: Valuation Date June 30, 2018 Actuarial Cost Method Entry Age Normal Amortization Method 22 years, closed Asset Valuation Method 5-year smoothed value Single Equivalent Interest Rate 8.0%, net of OPEB plan investment expense, includes
price inflation Municipal Bond Index Rate 3.5% Investment Rate of Return 8.0%, net of OPEB plan investment expense, includes
price inflation Inflation 3.0% Real Wage Growth 0.5% Wage Inflation 3.5% Salary Increase 3.5 to 7.2%, including wage inflation Discount Rate 8.0% Mortality rates were based on the RP-2000 Combined Mortality Table for Males or Females, as appropriate, with adjustments for mortality improvements based on a projection of Scale BB to 2025 (with a set forward of 1 year for females and 2 years for males). The RP-2000 Disabled Mortality Table set forward two years for males and seven years for females is used for the period after disability retirement.
The remaining actuarial assumptions (e.g. initial per capita costs, health care cost trends, rate of plan participation, rates of plan election, etc.) used in the June 30, 2018 valuation were based on a review of recent plan experience done concurrently with the June 30, 2018 valuation.

NOTES TO THE FINANCIAL STATEMENTS (CONTINUED)
51
The long-term expected rate of return on pension plan investments was determined using a log-normal distribution analysis in which best-estimate ranges of expected future real rates of return (expected returns, net of pension plan investment expense and inflation) are developed for each major asset class. These ranges are combined to produce the long-term expected rate of return by weighting the expected future real rates of return by the target asset allocation percentage and by adding expected inflation. The target allocation and best estimates of arithmetic real rates of return for each major asset class, as provided by TRS’s investment consultant, are summarized in the following table:
Asset Class Target Allocation
Percentage
30 Year Expected Geometric Real Rate of
Return
Global Equity 58.00% 5.10%
Fixed Income 9.00% 1.20%
Real Estate 6.50% 3.80%
Private Equity 8.50% 6.30%
Additional Categories 17.00% 3.20%
Cash 1.00% 0.90%
Total 100.00%
Discount Rate: The discount rate used to measure the total OPEB liability was 8.00%. The projection of cash flows used to determine the discount rate was performed in accordance with GASB 74. The projections basis was an actuarial valuation performed as of June 30, 2018. In addition to actuarial methods and assumptions were used in the projection of cash flows:
Total payroll for the initial projection year consists of the payroll of the active membership present on the Valuation Date. In subsequent projection years, total payroll was assumed to increase annually at a rate of 3.50%.
The KEHP group retiree health care costs for members retired on or after July 1, 2010, were assumed to be paid by either the state or the retirees themselves.
As administrative expenses, other than the administrative fee of $7.44 per member per month paid to KEHP by TRS, were assumed to be paid in all years by the employer as they come due, they were not considered.
Cash flows occur mid-year. Future contributions to the MIF were based upon the contribution rates defined in statue and the projected payroll of active employees. Per KRS 161.540(1)(c).3 and 161.550(5), when the MIF achieves a sufficient prefunded status, as determined by the retirement system’s actuary, the following MIF statutory contributions are to be decreased, suspended, or eliminated:
Employee Contributions Employer Contributions

NOTES TO THE FINANCIAL STATEMENTS (CONTINUED)
52
State Contributions for KEHP premium subsidies payable to retirees who retire after June 30, 2010
To reflect these adjustments, open group projections were used and assumed an equal, pro rata reduction to the current statutory amount in the years if/when the MIF is projected to achieve a Funded Ratio of 100% or more. Here, the current statutory amounts are adjusted to achieve total contributions equal to the actuarially determined contribution (ADC), as determined by the prior year’s valuation and in accordance with the MIF’s funding policy. As the specific methodology to be used for the adjustments has yet to be determined, there may be differences between the projected results and future experience. This may also include any changes to retiree contributions for KEHP coverage pursuant to KRS 161.675(4)(b). In developing the adjustments to the statutory contributions in future years the following was assumed:
Liabilities and cash flows are net of expected retiree contributions and any implicit subsidies attributable to coverage while participating in KEHP.
A 0% active member growth rate was assumed for the purposes of developing estimates for new entrants (membership dates beyond June 30, 2018).
Based on these assumptions, the MIF’s fiduciary net position was not projected to be depleted. The following table presents the net OPEB liability of the Commonwealth associated with the District, calculated using the discount rate of 8.00%, as well as what the Commonwealth’s net OPEB liability would be if it were calculated using a discount rate that is 1-percentage-point lower (7.00%) or 1-percentage-point higher (9.00%) than the current rate:
1% Decrease Current
Discount Rate 1% Increase
7.00% 8.00% 9.00%District & State’s proportionate share of net OPEB liability $ 2,493,000 $ 2,105,000 $ 1,779,000
Sensitivity of the District’s proportionate share of the collective net OPEB liability to changes in the healthcare cost trend rates – The following presents the District’s proportionate share of the collective net OPEB liability, as well as what the District’s proportionate share of the collective net OPEB liability would be if it were calculated using healthcare cost trend rates that were 1-percentage-point lower or 1-percentage-point higher than the current healthcare cost trend rates:
1% Decrease Current
Trend Rate 1% Increase
District & State’s proportionate share of net OPEB liability $ 1,713,000 $ 2,105,000 $ 2,586,000
OPEB plan fiduciary net position – Detailed information about the OPEB plan’s fiduciary net position is available in the separately issued TRS financial report.

NOTES TO THE FINANCIAL STATEMENTS (CONTINUED)
53
Other Post Employment Benefits Liabilities related to the Life Insurance Plan funded by - Life Insurance Plan (LIF) Plan description – Life Insurance Plan - TRS administers the life insurance plan as provided by Kentucky Revised Statute 161.655 to eligible active and retired members. The TRS Life Insurance benefit is a cost-sharing multiple employer defined benefit plan with a special funding situation. Changes made to the life insurance plan may be made by the TRS Board of Trustees and the General Assembly. Benefits provided - Effective July 1, 2000, the Kentucky Teachers’ Retirement System shall:
Provide a life insurance benefit in a minimum amount of five thousand dollars ($5,000) for its members who are retired for service or disability. This life insurance benefit shall be payable upon the death of a member retired for service or disability to the member’s estate or to a party designated by the member on a form prescribed by the retirement system; and
Provide a life insurance benefit in a minimum amount of two thousand dollars ($2,000) for its active contributing members. This life insurance benefit shall be payable upon the death of an active contributing member to the member’s estate or to a party designated by the member on a form prescribed by the retirement system.
Contributions – In order to fund the post-retirement life insurance benefit, three hundredths of one percent (.03%) of the gross annual payroll of members is contributed by the state. Note: Members employed on a substitute or part-time basis and working at least 69% of a full contract year in a single fiscal year will be eligible for a life insurance benefit for the balance of the fiscal year or the immediately succeeding fiscal year under certain conditions. For non-vested members employed on a substitute or part-time basis, the life insurance benefit is provided if death occurs as the result of a physical injury on the job. For vested members employed on a substitute or part-time basis, death does not have to be the result of a physical injury on the job for life insurance benefits to be provided. OPEB Liabilities, OPEB Expense, and Deferred Outflows of Resources and Deferred Inflows of Resources Related to OPEBs At June 30, 2020, the District did not report a liability for its proportionate share of the collective net OPEB liability for life insurance benefits because the State of Kentucky provides the OPEB support directly to TRS on behalf of the District. The amount recognized by the District as its proportionate share of the OPEB liability, the related State support, and the total portion of the net OPEB liability that was associated with the District were as follows:
NOTES TO THE FINANCIAL STATEMENTS (CONTINUED)
54
District's proportionate share of TRS net OPEB liability $ -
Commonwealth's proportionate share of the TRS net OPEB liability associated with the District 39,000
$ 39,000
For the year ended June 30, 2020, the District recognized OPEB revenue of $254,265 for support provided by the State. Actuarial Methods and Assumptions—The total OPEB liability in the June 30, 2019 actuarial valuation was determined using the following actuarial assumptions, applied to all periods included in the measurement: Valuation Date June 30, 2018 Actuarial Cost Method Entry Age Normal Amortization Method 30 years, closed Asset Valuation Method 5-year smoothed value Single Equivalent Interest Rate 7.5% Municipal Bond Index Rate 3.5% Investment Rate of Return 7.5%, includes price inflation Inflation 3.0% Real Wage Growth 0.5 % Wage Inflation 3.5% Salary Increase 3.5 to 7.45%, including wage inflation Discount Rate 7.5% The following represents assumptions and changes of assumptions from the prior valuation to the valuation performed as of June 30, 2019: - Projected salary increases changed to 3.5-7.45%.
- Inflation rate decreased to 3.0%.
- Wage inflation decreased to 3.5%.
- Municipal bond index rate decreased to 3.5%.
Mortality rates were based on the RP-2000 Combined Mortality Table for Males or Females, as appropriate, with adjustments for mortality improvements based on a projection of Scale BB to 2025 (with a set forward of 1 year for females and 2 years for males). The RP-2000 Disabled Mortality Table set forward two years for males and seven years for females is used for the period after disability retirement. The long-term expected rate of return on pension plan investments was determined using a log-normal distribution analysis in which best-estimate ranges of expected future real rates of return (expected returns, net of pension plan investment expense and inflation) are developed for each major asset class.

NOTES TO THE FINANCIAL STATEMENTS (CONTINUED)
55
These ranges are combined to produce the long-term expected rate of return by weighting the expected future real rates of return by the target asset allocation percentage and by adding expected inflation. The target allocation and best estimates of arithmetic real rates of return for each major asset class, as provided by TRS’s investment consultant, are summarized in the following table:
Asset ClassTarget
Allocation
30 Year Expected Geometric Real Rate of Return
U.S. Equity 40.0% 4.2%
International Equity 23.0% 5.2%
Fixed Income 18.0% 1.2%
Real Estate 6.0% 3.8%
Private Equity 5.0% 6.3%
Other Additional Categories 6.0% 3.3%
Cash 2.0% 0.9%
100.0%
Discount Rate: The discount rate used to measure the total OPEB liability was 7.5%. The projection of cash flows used to determine the discount rate was performed in accordance with GASB 74. The projections basis was an actuarial valuation performed as of June 30, 2018. In addition to actuarial methods and assumptions were used in the projection of cash flows:
Total payroll for the initial projection year consists of the payroll of the active membership present on the Valuation Date. In subsequent projection years, total payroll was assumed to increase annually at a rate of 3.5%.
The employer will contribute the actuarially determined contribution (ADC) in accordance with the Life Insurance Trust’s funding policy determined by a valuation performed on a date two years prior to the beginning of the fiscal year in which the ADC applies.
As administrative expenses were assumed to be paid in all years by the employer as they come due, they were not considered.
Active employees do not explicitly contribute to the plan. Cash flows occur mid-year.
Based on these assumptions, the LIF’s fiduciary net position was not projected to be depleted. OPEB plan fiduciary net position – Detailed information about the OPEB plan’s fiduciary net position is available in the separately issued TRS financial report. CERS – General Information about the OPEB Plans
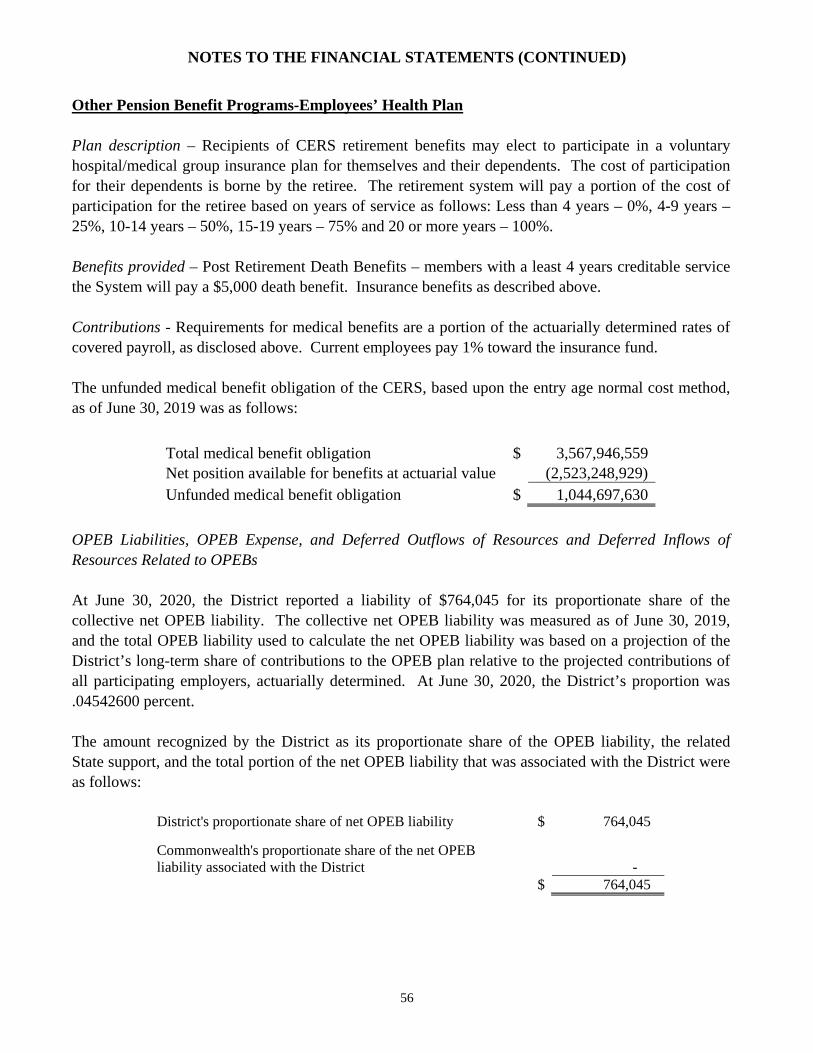
NOTES TO THE FINANCIAL STATEMENTS (CONTINUED)
56
Other Pension Benefit Programs-Employees’ Health Plan Plan description – Recipients of CERS retirement benefits may elect to participate in a voluntary hospital/medical group insurance plan for themselves and their dependents. The cost of participation for their dependents is borne by the retiree. The retirement system will pay a portion of the cost of participation for the retiree based on years of service as follows: Less than 4 years – 0%, 4-9 years – 25%, 10-14 years – 50%, 15-19 years – 75% and 20 or more years – 100%. Benefits provided – Post Retirement Death Benefits – members with a least 4 years creditable service the System will pay a $5,000 death benefit. Insurance benefits as described above. Contributions - Requirements for medical benefits are a portion of the actuarially determined rates of covered payroll, as disclosed above. Current employees pay 1% toward the insurance fund. The unfunded medical benefit obligation of the CERS, based upon the entry age normal cost method, as of June 30, 2019 was as follows:
Total medical benefit obligation $ 3,567,946,559 Net position available for benefits at actuarial value (2,523,248,929) Unfunded medical benefit obligation $ 1,044,697,630
OPEB Liabilities, OPEB Expense, and Deferred Outflows of Resources and Deferred Inflows of Resources Related to OPEBs At June 30, 2020, the District reported a liability of $764,045 for its proportionate share of the collective net OPEB liability. The collective net OPEB liability was measured as of June 30, 2019, and the total OPEB liability used to calculate the net OPEB liability was based on a projection of the District’s long-term share of contributions to the OPEB plan relative to the projected contributions of all participating employers, actuarially determined. At June 30, 2020, the District’s proportion was .04542600 percent.
The amount recognized by the District as its proportionate share of the OPEB liability, the related State support, and the total portion of the net OPEB liability that was associated with the District were as follows:
District's proportionate share of net OPEB liability $ 764,045
Commonwealth's proportionate share of the net OPEB liability associated with the District -
$ 764,045

NOTES TO THE FINANCIAL STATEMENTS (CONTINUED)
57
For the year ended June 30, 2020, the District recognized OPEB revenue of 8,434. At June 30, 2020, the District reported deferred outflows of resources and deferred inflows of resources related to OPEBs from the following sources:
Deferred Outflows of Resources
Deferred Inflows of Resources
Differences between expected and actual experience $ - $ 230,530 Changes of assumptions 226,088 1,512 Net difference between projected and actual earnings on pension plan investments 5,033 38,968 Changes in proportion and differences between District contributions and proportionate share of contributions - 57,445 District contributions subsequent to the measurement date 32,580 -
$ 263,701 $ 328,455
The $32,580 (includes $16,405 Implicit Subsidy) reported as deferred outflows of resources related to pensions resulting from District contributions subsequent to the measurement date will be recognized as a reduction of the collective net OPEB liability for the year ended June 30, 2020. Other amounts reported as deferred outflows of resources and deferred inflows of resources related to OPEB will be recognized in the District’s OPEB expense as follows:
Year Ended June 30,
2021 $ (17,966) 2022 (17,966) 2023 (7,177) 2024 (27,817) 2025 (22,342)
Thereafter (4,066)
$ (97,334)
Implicit Employer Subsidy- The fully-insured premiums KRS pays for the Kentucky Employees’ Health Plan are blended rates based on the combined experience of active and retired members. Because the average cost of providing health care benefits to retirees under age 65 is higher than the average cost of providing health care benefits to active employees, there is an implicit employer subsidy for the non-Medicare eligible retirees. GASB 74 requires that the liability associated with this implicit subsidy be included in the calculation of the Total OPEB Liability.

NOTES TO THE FINANCIAL STATEMENTS (CONTINUED)
58
Changes of Benefit Terms-None Actuarial Methods and Assumptions—The total OPEB liability for CERS was determined by applying procedures to the actuarial valuation as of June 30, 2019. The financial reporting actuarial valuation used the following actuarial methods and assumptions: Actuarial Cost Method Entry Age Normal Amortization Method Level percent of pay Amortization Period 26 years, closed
Asset Valuation Method 20% of difference between the market value of assets and the expected actuarial value of assets.
Price Inflation 2.30% Salary Increase 3.30 - 11.55%, varies by service Investment Return 6.25%
Payroll Growth 2.00% Mortality RP-2000 Combined Mortality Table, projected to
2013 With Scale BB (set back 1 year females) Healthcare Trend Rates (Pre-65) Initial trend starting at 7.25% and gradually
decreasing to an ultimate trend rate of 4.05% over period of 13 years.
Healthcare Trend Rates (Post-65) Initial trend starting at 5.10% and gradually decreasing to an ultimate trend rate of 4.05% over period of 11 years.
Healthcare Trend Rates (Phase-In) Board certified rate is phased into the actuarially determined rate in accordance with HB362 enacted in 2018.
The following represents assumptions and changes of assumptions from the prior valuation to the valuation performed as of June 30, 2019: - Amortization period decreased to 26.
- Payroll growth rate decreased to 2.00%
- Investment return rate decreased to 6.25%.
- Inflation rate decreased to 2.30%.
- Salary increase changed to 3.30 – 11.55%.
- Health care trend rates Pre-65 changed to having an initial trend rate of 7.25% decreasing to 4.05% over 13 years.
- Health care trend rates Post-65 changed to having an initial trend rate of 5.10% decreasing to 4.05% over 11 years.
- Health care trend rates phase in provision was added.

NOTES TO THE FINANCIAL STATEMENTS (CONTINUED)
59
Discount rate: The discount rate used to measure the total OPEB liability was 5.68%. The rate is based on the expected rate of return on OPEB plan investments of 6.25% and a municipal bond rate of 3.13%, as reported in Fidelity Index’s “20-Year Municipal GO AA Index” as of June 28, 2019. Based on the stated assumptions and the projection of cash flows as of each fiscal year ended, the plan’s insurance fiduciary net position and future contributions were projected to be sufficient to finance the future benefit payments of the current plan members. Therefore, the long-term expected rate of return on Insurance plan investments was applied to all periods of the projected benefit payments paid from the retirement plan. However, the cost associated with the implicit subsidy will not be paid out of the plan’s trust. Therefore, the municipal bond rate was applied to future expected benefit payments associated with the implicit subsidy. The projection of cash flows used to determine the single discount rate assumes that the funds receive the required employer contributions each future year, as determined by the current funding policy established in Statute as last amended by House Bill 362 (passed in 2018) that applies to CERS. The following table presents the net OPEB liability of the District, calculated using the discount rate of 5.68%, as well as what the District’s net OPEB liability would be if it were calculated using a discount rate that is 1-percentage-point lower (4.68%) or 1-percentage-point higher (6.68%) than the current rate:
1% Decrease Current
Discount Rate 1% Increase 4.68% 5.68% 6.68%
District's proportionate share of net OPEB liability $ 1,023,506 $ 764,045 $ 550,266
Sensitivity of the District’s proportionate share of net OPEB liability to changes in the discount rate: The following presents the District’s proportionate share of the net pension liability calculated using the discount rate of 5.68%, as well as what the District’s proportionate share of the net pension liability would be if it were calculated using a discount rate that is 1-percentage-point lower (4.68%) or 1-percentage-point higher (6.68%) than the current rate:
1% Decrease Current
Trend Rate 1% Increase District's proportionate share of net OPEB liability $ 568,224 $ 764,045 $ 1,001,501
OPEB plan fiduciary net position – Detailed information about the OPEB plan’s fiduciary net position is available in the separately issued CERS financial report. NOTE J – PRIVATE PURPOSE TRUST
The District received an endowment from the W. Paul and Lucille Caudill Little Foundation, Inc. in the amount of $100,000 to provide $5,000 in operating costs per year to the Adkins-Caudill Performing Arts Center. The $100,000 is the corpus and earnings of $7,251.

NOTES TO THE FINANCIAL STATEMENTS (CONTINUED)
60
NOTE K – COMMITMENTS
The District has no commitments outstanding as of June 30, 2020. NOTE L – CONTINGENCIES The District receives funding from Federal, State and Local governmental agencies and private contributions. These funds are to be used for designated purposes only. For government agency grants, if the grantor’s review indicates that the funds have not been used for the intended purpose, the grantors may request a refund of monies advanced or refuse to reimburse the District for its disbursements. The amount of such future refunds and un-reimbursed disbursements, if any, is not expected to be significant. Continuation of the District’s grant programs is predicated upon the grantors’ satisfaction the funds provided are being spent as intended and the grantors’ intent to continue their program. NOTE M - LITIGATION The District has no pending or threatened litigation involving amounts exceeding $10,000 individually or in the aggregate as of June 30, 2020. NOTE N – INSURANCE AND RELATED ACTIVITIES The District is exposed to various forms of loss of assets associated with the risks of fire, personal liability, theft, vehicular accidents, errors and omissions, fiduciary responsibility, illegal acts, etc. Each of these risk areas is covered through the purchase of commercial insurance. The District has purchased certain policies which are retrospectively rated which include Workers’ Compensation insurance. NOTE O – RISK MANAGEMENT The District is exposed to various risks of loss related to illegal acts, torts, theft/damage/destruction of assets, errors and omissions, injuries to employees, and natural disasters. To obtain insurance for workers’ compensation, errors and omission, and general liability coverage, the District purchased commercial insurance policies. The District purchases unemployment insurance through the Kentucky School Districts Insurance Trust Unemployment Compensation Fund; however, risk has not been transferred to such fund. In addition, the District continues to carry commercial insurance for all other risks of loss. Settled claims resulting from these risks have not exceeded commercial coverage in any of the past three fiscal years. NOTE P – DEFICIT FUND AND OPERATING BALANCES The following funds had a deficit change in fund balance/net position and/or deficit fund balance/net position:
Change in Net Position
Fund Net Change in Fund Balance
Business-type Activities/Proprietary Fund $ (6,481)
General Fund $ (108,849)

NOTES TO THE FINANCIAL STATEMENTS (CONTINUED)
61
NOTE Q – COBRA Under COBRA, employers are mandated to notify terminated employees of available continuing insurance coverage. Failure to comply with this requirement may put the school district at risk for a substantial loss (contingency). NOTE R – TRANSFER OF FUNDS The following transfers were made during the year:
Type From To Purpose Amount Debt Service General Fund Debt Service Debt Payments $ 67,225
Debt Service Capital Outlay Debt Service Debt Payments 34,898
Operations Capital Outlay Construction Operating Costs 16,190
Debt Service Building Fund Debt Service Debt Payments 379,088
Operations Capital Outlay General Fund Operating Costs 39,820
Operations Food Service General Fund Indirect Costs 50,047
Special Rev General Fund Special Revenue KETS Matching $ 19,413
NOTE S – ON-BEHALF PAYMENTS For fiscal year 2020, the Commonwealth of Kentucky contributed estimated payments on behalf of the District as follows:
Plan/Description Amount Kentucky Teachers Retirement System (GASB 68 and 75) $ 1,477,019
Health Insurance 1,170,504
Life Insurance 1,804
Administrative Fee 14,928
HRA/Dental/Vision 48,125
Federal Reimbursement (122,091)
Technology 64,697
SFCC Debt Service Payments 451,736
Total $ 3,106,722
These amounts are included in the financial statements as state revenue and an expense allocated to the different functions in the same proportion as full-time employees.

NOTES TO THE FINANCIAL STATEMENTS (CONTINUED)
62
NOTE T – RESTRICTED FUND BALANCES The following funds had restricted fund balances.
Restricted Fund Balance/ Fund Net Position Purpose
Special Revenue Fund $ 29,543 District Activities
Private Purpose Trust 107,251 Scholarships
Proprietary 183,007 School Food Services
FSPK Fund $ 208 FSPK
NOTE U – SUBSEQUENT EVENTS The District has evaluated subsequent events through November 13, 2020, the date of the audit report.
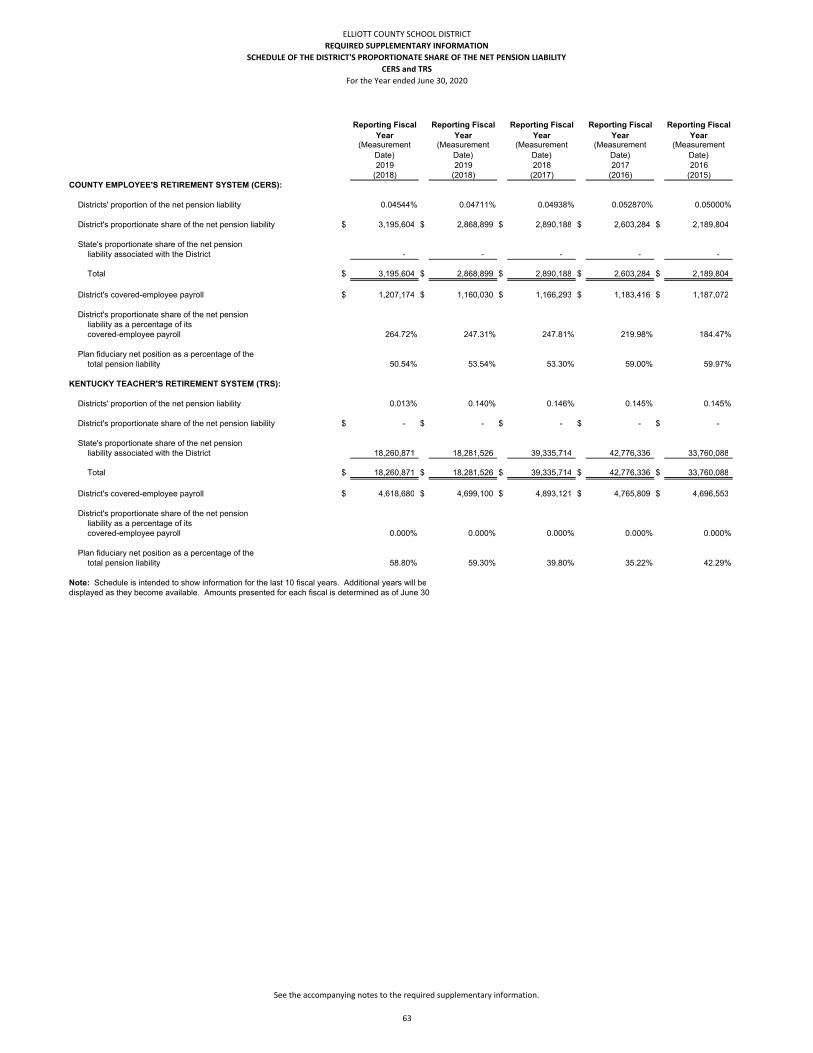
ELLIOTT COUNTY SCHOOL DISTRICT
REQUIRED SUPPLEMENTARY INFORMATION
SCHEDULE OF THE DISTRICT'S PROPORTIONATE SHARE OF THE NET PENSION LIABILITY
CERS and TRS
For the Year ended June 30, 2020
Reporting Fiscal Year
Reporting Fiscal Year
Reporting Fiscal Year
Reporting Fiscal Year
Reporting Fiscal Year
(Measurement Date)
(Measurement Date)
(Measurement Date)
(Measurement Date)
(Measurement Date)
2019 2019 2018 2017 2016(2018) (2018) (2017) (2016) (2015)
COUNTY EMPLOYEE'S RETIREMENT SYSTEM (CERS):
0.04544% 0.04711% 0.04938% 0.052870% 0.05000%
$ 3,195,604 $ 2,868,899 $ 2,890,188 $ 2,603,284 $ 2,189,804
- - - - -
Total $ 3,195,604 $ 2,868,899 $ 2,890,188 $ 2,603,284 $ 2,189,804
$ 1,207,174 $ 1,160,030 $ 1,166,293 $ 1,183,416 $ 1,187,072
264.72% 247.31% 247.81% 219.98% 184.47%
50.54% 53.54% 53.30% 59.00% 59.97%
KENTUCKY TEACHER'S RETIREMENT SYSTEM (TRS):
0.013% 0.140% 0.146% 0.145% 0.145%
$ - $ - $ - $ - $ -
18,260,871 18,281,526 39,335,714 42,776,336 33,760,088
Total $ 18,260,871 $ 18,281,526 $ 39,335,714 $ 42,776,336 $ 33,760,088
$ 4,618,680 $ 4,699,100 $ 4,893,121 $ 4,765,809 $ 4,696,553
0.000% 0.000% 0.000% 0.000% 0.000%
58.80% 59.30% 39.80% 35.22% 42.29%
Note: Schedule is intended to show information for the last 10 fiscal years. Additional years will bedisplayed as they become available. Amounts presented for each fiscal is determined as of June 30
Plan fiduciary net position as a percentage of thetotal pension liability
State's proportionate share of the net pensionliability associated with the District
District's covered-employee payroll
District's proportionate share of the net pensionliability as a percentage of itscovered-employee payroll
District's proportionate share of the net pension liability
Districts' proportion of the net pension liability
District's proportionate share of the net pension liability
State's proportionate share of the net pensionliability associated with the District
District's covered-employee payroll
District's proportionate share of the net pensionliability as a percentage of itscovered-employee payroll
Plan fiduciary net position as a percentage of thetotal pension liability
Districts' proportion of the net pension liability
See the accompanying notes to the required supplementary information.
63

ELLIOTT COUNTY SCHOOL DISTRICT
REQUIRED SUPPLEMENTARY INFORMATION ‐ SCHEDULE OF CONTRIBUTIONS
CERS and TRS
For the Year ended June 30, 2020
2020 2019 2018 2017 2016COUNTY EMPLOYEE'S RETIREMENT SYSTEM (CERS):
Contractually required contribution $ 263,669 $ 254,210 $ 217,667 $ 229,969 $ 201,659
Contributions in relation to the contractuallyrequired contributions 263,669 254,210 217,667 229,969 201,659
Contribution deficiency (excess) - - - - -
District's covered-employee payroll $ 1,176,458 $ 1,207,174 $ 1,160,030 $ 1,166,293 $ 1,183,416
District's contributions as a percentage of it's covered-employee payroll 22.41% 21.06% 18.76% 19.72% 17.04%
KENTUCKY TEACHER'S RETIREMENT SYSTEM (TRS):
Contractually required contribution $ - $ - $ - $ - $ -
Contributions in relation to the contractuallyrequired contributions - - - - -
Contribution deficiency (excess) - - - - -
District's covered-employee payroll $ 4,662,184 $ 4,618,680 $ 4,699,100 $ 4,893,121 $ 4,765,809
District's contributions as a percentage of it's covered-employee payroll 0.00% 0.00% 0.00% 0.00% 0.00%
Note: Schedule is intended to show information for the last 10 fiscal years. Additional years will be displayed as they become available. Amounts presented for each fiscal is determined as of June 30.
See the accompanying notes to the required supplementary information.
64

ELLIOTT COUNTY SCHOOL DISTRICT NOTES TO REQUIRED SUPPLEMENTARY INFORMATION-PENSIONS
For the year ended June 30, 2020
65
(1) CHANGES OF BENEFITS
There were no changes of benefit terms for TRS or CERS.
(2) CHANGES OF ASSUMPTIONS
TRS
The following represents assumptions and changes of assumptions from the prior valuation to the valuation performed as of June 30, 2019:
o Municipal Bond Index Rate decreased to 3.5%.
CERS
The following represents assumptions and changes of assumptions from the prior valuation to the valuation performed as of June 30, 2019:
o The assumed investment rate of return decreased to 6.25%. o The assumed rate of inflation decreased to 2.30%. o The Salary Increase changed to 3.30% to 11.55%. o Phase-In provision added.
(3) METHOD AND ASSUMPTIONS USED IN CALCULATIONS OF ACTUARIALLY DETERMINED CONTRIBUTIONS
TRS
The actuarially determined contribution rates in the schedule of employer contributions are calculated as of June 30, three years prior to the end of the fiscal year in which contributions are reported. The following actuarial methods and assumptions were used to determine contribution rates reported in the most recent year of that schedule:
Valuation Date June 30, 2018 Actuarial Cost Method Entry Age Normal Amortization Method Level percentage of payroll, closed Remaining Amortization Period 28.1 years Asset Valuation Method 5-year smoothed market value Single Equivalent Interest Rate 7.5% Municipal Bond Index Rate 3.5% Projected Salary Increase 3.5-7.3%, including inflation Investment Rate of Return 7.5%, net of pension plan investment expense, including inflation.
CERS
The Board of Trustees uses this actuarial valuation to certify the employer contribution rates for CERS for the fiscal year beginning July 1, 2019 and ending June 30, 2020. The amortization period of the unfunded liability has been reset as of July 1, 2013 to a closed 30-year period. The following actuarial methods and assumptions were used to determine contribution rates reported in the most recent year of that schedule:
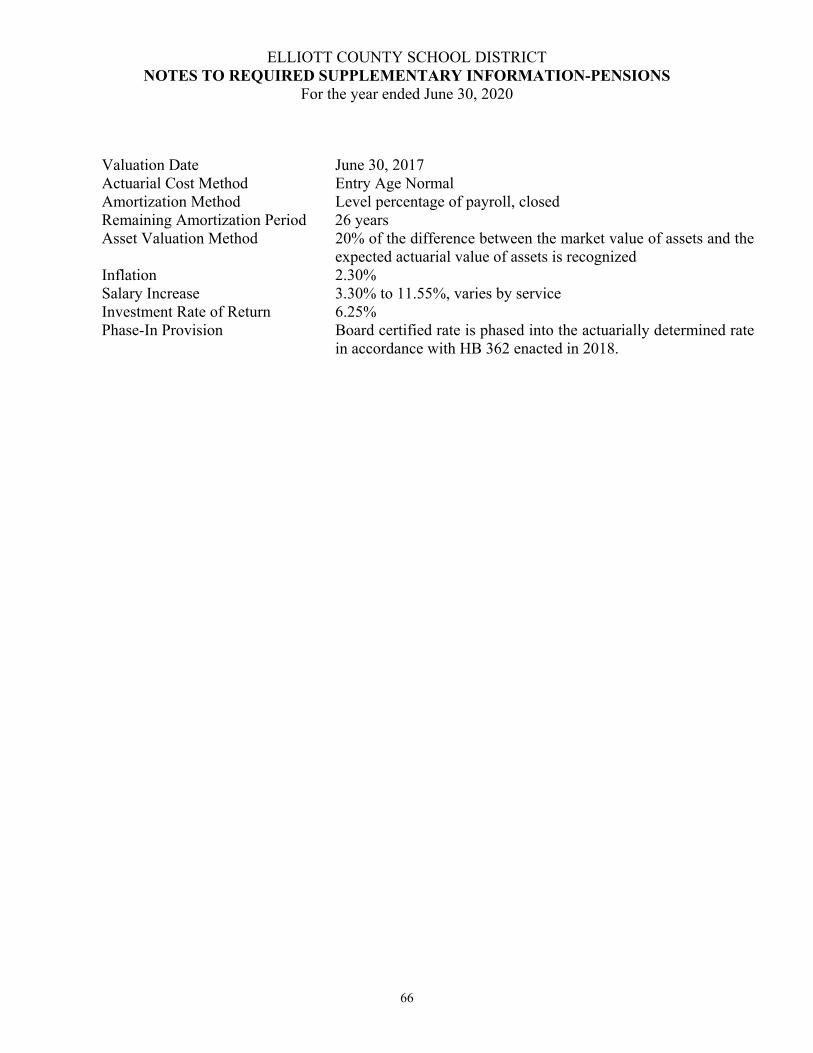
ELLIOTT COUNTY SCHOOL DISTRICT NOTES TO REQUIRED SUPPLEMENTARY INFORMATION-PENSIONS
For the year ended June 30, 2020
66
Valuation Date June 30, 2017 Actuarial Cost Method Entry Age Normal Amortization Method Level percentage of payroll, closed Remaining Amortization Period 26 years Asset Valuation Method 20% of the difference between the market value of assets and the
expected actuarial value of assets is recognized Inflation 2.30% Salary Increase 3.30% to 11.55%, varies by service Investment Rate of Return 6.25% Phase-In Provision Board certified rate is phased into the actuarially determined rate
in accordance with HB 362 enacted in 2018.

ELLIOTT COUNTY SCHOOL DISTRICT
REQUIRED SUPPLEMENTARY INFORMATION
SCHEDULE OF THE DISTRICT'S PROPORTIONATE SHARE OF THE NET OPEB LIABILITY
MEDICAL AND LIFE INSURANCE PLANS ‐ TEACHERS' RETIREMENT SYSTEM
Year ended June 30, 2020
Reporting Fiscal Year
Reporting Fiscal Year
Reporting Fiscal Year
(Measurement Date)
(Measurement Date)
(Measurement Date)
2020 2019 2018(2019) (2018) (2017)
MEDICAL INSURANCE PLANDistrict's proportion of the collective net OPEB liability (asset) 0.07191% 0.07273% 0.07764%
District's proportionate share of the collective net OPEB liability (asset) $ 2,105,000 $ 2,523,000 $ 2,768,000
State's proportionate share of the collective net OPEBliability (asset) associated with the District 1,700,000 2,175,000 2,261,000
Total $ 3,805,000 $ 4,698,000 $ 5,029,000
District's covered-employee payroll $ 4,618,680 $ 4,699,100 $ 4,893,121
District's proportionate share of the collective net OPEBliability (asset) as a percentage of itscovered-employee payroll 45.58% 53.69% 56.57%
Plan fiduciary net position as a percentage of thetotal OPEB liability 32.60% 25.50% 21.20%
LIFE INSURANCE PLANDistrict's proportion of the collective net OPEB liability (asset) 0.00000% 0.00000% 0.00000%
District's proportionate share of the collective net OPEB liability (asset) $ - $ - $ -
State's proportionate share of the collective net OPEBliability (asset) associated with the District 39,000 37,000 30,000
Total $ 39,000 $ 37,000 $ 30,000
District's covered-employee payroll $ 4,618,680 $ 4,699,100 $ 4,893,121
District's proportionate share of the collective net OPEBliability (asset) as a percentage of itscovered-employee payroll 0.00% 0.00% 0.00%
Plan fiduciary net position as a percentage of thetotal OPEB liability 73.40% 75.00% 80.00%
Note: Schedule is intended to show information for the last 10 fiscal years. Additional years will be displayed as they become available. Amounts presented for each fiscal is determined as of June 30.
See the accompanying notes to the required supplementary information.
67

ELLIOTT COUNTY SCHOOL DISTRICT
REQUIRED SUPPLEMENTARY INFORMATION ‐ SCHEDULE OF CONTRIBUTIONS
MEDICAL AND LIFE INSURANCE PLANS
TEACHERS' RETIREMENT SYSTEM
Year ended June 30, 2020
2020 2019 2018MEDICAL INSURANCE PLAN
Contractually required contribution $ 184,072 $ 124,807 $ 129,547
Contributions in relation to the contractuallyrequired contribution 184,072 124,807 129,547
Contribution deficiency (excess) - - -
District's covered-employee payroll $ 4,662,184 $ 4,618,680 $ 4,699,100
District's contributions as a percentage of it'scovered-employee payroll 3.95% 2.70% 2.76%
LIFE INSURANCE PLANContractually required contribution $ - $ - $ -
Contributions in relation to the contractuallyrequired contribution - - -
Contribution deficiency (excess) - - -
District's covered-employee payroll $ 4,662,184 $ 4,618,680 $ 4,699,100
District's proportionate share of the net pension liability as a percentage of it's covered-employee payroll 0.00% 0.00% 0.00%
Note: Schedule is intended to show information for the last 10 fiscal years. Additional years will be displayed as they become available. Amounts presented for each fiscal is determined as of June 30.
See the accompanying notes to the required supplementary information.
68

ELLIOTT COUNTY SCHOOL DISTRICT
REQUIRED SUPPLEMENTARY INFORMATION
SCHEDULE OF THE DISTRICT'S PROPORTIONATE SHARE OF THE NET OPEB LIABILITY ‐HEALTH INSURANCE PLAN
COUNTY EMPLOYEE RETIREMENT SYSTEM
Year ended June 30, 2020
Reporting Fiscal Year
Reporting Fiscal Year
Reporting Fiscal Year
(Measurement Date)
(Measurement Date)
(Measurement Date)
2020 2019 2018(2019) (2018) (2017)
HEALTH INSURANCE PLAN District's proportion of the collective net OPEB liability (asset) 0.04543% 0.04712% 0.04938%
District's proportionate share of the collective net OPEB liability (asset) $ 764,045 $ 836,571 $ 992,647
State's proportionate share of the collective net OPEBliability (asset) associated with the District - - -
Total $ 764,045 $ 836,571 $ 992,647
District's covered-employee payroll $ 1,207,174 $ 1,160,030 $ 1,166,293
District's proportionate share of the collective net OPEBliability (asset) as a percentage of itscovered-employee payroll 63.29% 72.12% 85.11%
Plan fiduciary net position as a percentage of thetotal OPEB liability 60.44% 57.62% 13.00%
Note: Schedule is intended to show information for the last 10 fiscal years. Additional years will be displayed as they become available. Amounts presented for each fiscal is determined as of June 30.
See the accompanying notes to the required supplementary information.
69

ELLIOTT COUNTY SCHOOL DISTRICT
REQUIRED SUPPLEMENTARY INFORMATION ‐ SCHEDULE OF CONTRIBUTIONS ‐ HEALTH INSURANCE PLAN COUNTY
EMPLOYEE RETIREMENT SYSTEM
Year ended June 30, 2020
2020 2019 2018HEALTH INSURANCE PLAN
Contractually required contribution $ 32,580 $ 26,201 $ 22,867
Contributions in relation to the contractually32,580 26,201 22,867
Contribution deficiency (excess) - - -
District's covered-employee payroll $ 1,176,458 $ 1,207,174 $ 1,160,030
District's contributions as a percentage of it'scovered-employee payroll 2.77% 2.17% 1.97%
Note: Schedule is intended to show information for the last 10 fiscal years. Additional years will be displayed as they become available. Amounts presented for each fiscal is determined as of June 30.
See the accompanying notes to the required supplementary information.
70

ELLIOTT COUNTY SCHOOL DISTRICT NOTES TO REQUIRED SUPPLEMENTARY INFORMATION-OPEB
For the year ended June 30, 2020
71
TRS
(1) CHANGES OF BENEFIT TERMS
There were no changes of benefit terms for the medical insurance fund or the life insurance fund.
(2) CHANGES OF ASSUMPTIONS
Medical Insurance Fund
o The amortization period decreased to 22 years o Municipal Bond Index Rate decreased to 3.5%.
Life Insurance Fund o Projected salary increases changed to 3.5-7.45%. o Inflation rate decreased to 3.0%. o Wage inflation decreased to 3.5%. o Municipal bond index rate decreased to 3.5%.
(3) METHOD AND ASSUMPTIONS USED IN CALCULATIONS OF ACTUARIALLY DETERMINED CONTRIBUTIONS
Medical Insurance Fund
The actuarially determined contribution rates, as a percentage of payroll used to determine the actuarially determined contribution amounts in the Schedule of Employer Contributions are calculated as of the indicated valuation date. The following actuarial methods and assumptions (from the indicated actuarial valuations) were used to determine contribution rates reported in that schedule for the year ending June 30, 2020:
Valuation Date June 30, 2018 Actuarial Cost Method Entry Age Normal Amortization Method 22 years, closed Asset Valuation Method 5-year smoothed value Single Equivalent Interest Rate 8.0%, net of OPEB plan investment expense, includes price
inflation Municipal Bond Index Rate 3.5% Investment Rate of Return 8.0%, net of OPEB plan investment expense, includes price
inflation Inflation 3.0% Real Wage Growth 0.5% Wage Inflation 3.5% Salary Increase 3.5 to 7.2%, including wage inflation Discount Rate 8.0%

ELLIOTT COUNTY SCHOOL DISTRICT NOTES TO REQUIRED SUPPLEMENTARY INFORMATION-OPEB
For the year ended June 30, 2020
72
Life Insurance Fund The actuarially determined contribution rates, as a percentage of payroll used to determine the actuarially determined contribution amounts in the Schedule of Employer Contributions are calculated as of the indicated valuation date. The following actuarial methods and assumptions (from the indicated actuarial valuations) were used to determine contribution rates reported in that schedule for the year ending June 30, 2020: Valuation Date June 30, 2018 Actuarial Cost Method Entry Age Normal Amortization Method 30 years, closed Asset Valuation Method 5-year smoothed value Single Equivalent Interest Rate 7.5% Municipal Bond Index Rate 3.5% Investment Rate of Return 7.5%, includes price inflation Inflation 3.0% Real Wage Growth 0.5 % Wage Inflation 3.5% Salary Increase 3.5 to 7.45%, including wage inflation Discount Rate 7.5%
CERS Other Pension Benefit Programs-Employees’ Health Plan (1) CHANGES OF BENEFIT TERMS
There were no changes of benefit terms.
(2) CHANGES OF ASSUMPTIONS
o Amortization period decreased to 26. o Payroll growth rate decreased to 2.00% o Investment return rate decreased to 6.25%. o Inflation rate decreased to 2.30%. o Salary increase changed to 3.30 – 11.55%. o Health care trend rates Pre-65 changed to having an initial trend rate of 7.25% decreasing to 4.05%
over 13 years. o Health care trend rates Post-65 changed to having an initial trend rate of 5.10% decreasing to
4.05% over 11 years. o Health care trend rates phase in provision was added.
(3) METHOD AND ASSUMPTIONS USED IN CALCULATIONS OF ACTUARIALLY DETERMINED CONTRIBUTIONS
Recipients of CERS retirement benefits may elect to participate in a voluntary hospital/medical group insurance plan for themselves and their dependents. The cost of participation for their dependents is borne by the retiree. The retirement system will pay a portion of the cost of participation for the retiree based on years of service as follows: Less than 4 years – 0%, 4-9 years – 25%, 10-14 years – 50%, 15-19 years – 75% and 20 or more years – 100%.

ELLIOTT COUNTY SCHOOL DISTRICT NOTES TO REQUIRED SUPPLEMENTARY INFORMATION-OPEB
For the year ended June 30, 2020
73
Contributions requirements for medical benefits are a portion of the actuarially determined rates of covered payroll, as disclosed above.
Actuarial Cost Method Entry Age Normal Amortization Method Level percent of pay Amortization Period 26 years, closed Asset Valuation Method 20% of difference between the market value of assets and the
expected actuarial value of assets. Price Inflation 2.30% Salary Increase 3.30 - 11.55%, varies by service Investment Return 6.25% Payroll Growth 2.00% Mortality RP-2000 Combined Mortality Table, projected to 2013 With Scale BB (set back 1 year females) Healthcare Trend Rates (Pre-65) Initial trend starting at 7.25% and gradually decreasing To an
ultimate trend rate of 4.05% over period of 13 years. Healthcare Trend Rates (Post 65) Initial trend starting at 5.10% and gradually decreasing To an
ultimate trend rate of 4.05% over period of 11 years. Healthcare Trend Rates (Phase-In) Board certified rate is phased into the actuarially determined rate
in accordance with HB362 enacted in 2018.
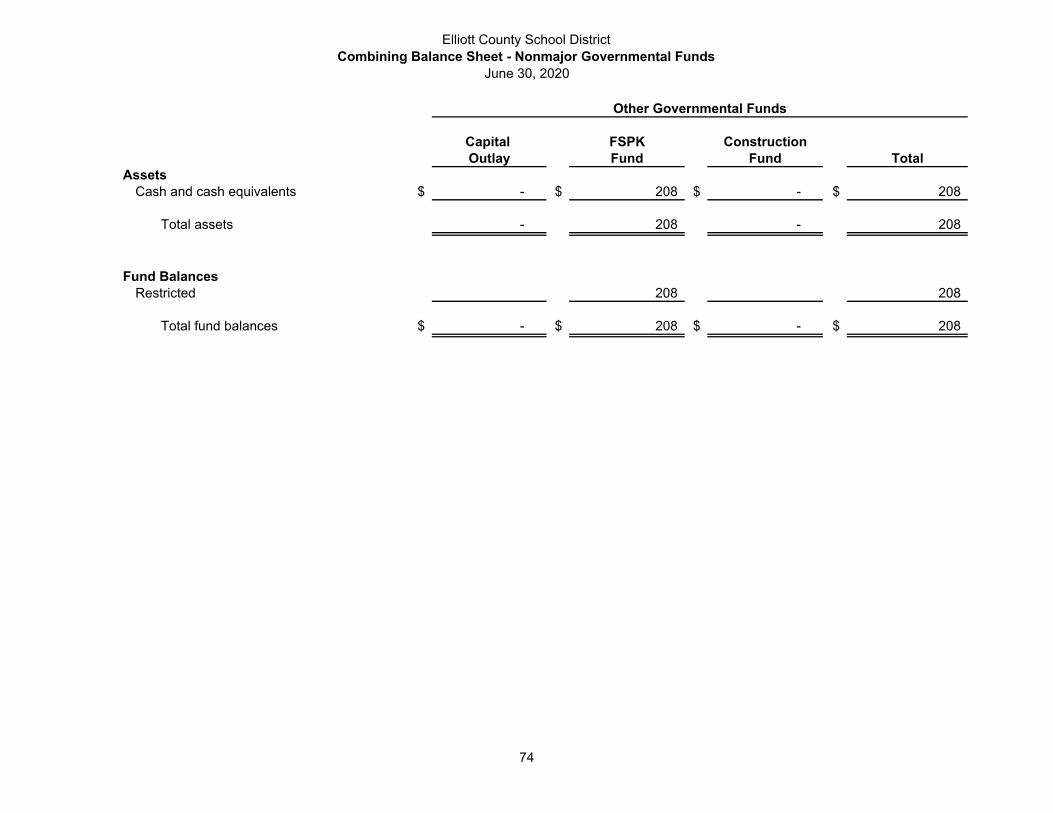
Elliott County School DistrictCombining Balance Sheet - Nonmajor Governmental Funds
June 30, 2020
Capital FSPK ConstructionOutlay Fund Fund Total
AssetsCash and cash equivalents $ - $ 208 $ - $ 208
Total assets - 208 - 208
Fund BalancesRestricted 208 208
Total fund balances $ - $ 208 $ - $ 208
Other Governmental Funds
74

Elliott County School DistrictCombining Statement of Revenues, Expenditures and Changes in Fund Balances - Nonmajor Governmental Funds
Year ended June 30, 2020
Capital FSPK ConstructionOutlay Fund Fund Total
RevenuesTaxes
Property $ - $ 112,524 $ - $ 112,524 Intergovernmental - state 90,908 266,564 357,472
Total revenues 90,908 379,088 - 469,996
ExpendituresBuilding improvements 16,190 16,190
Total expenditures - - 16,190 16,190
Excess (Deficit) of RevenuesOver Expenditures 90,908 379,088 (16,190) 453,806
Other Financing Sources (Uses)Operating transfers in (out) (90,908) (379,088) 16,190 (453,806)
Total other financing sources (uses) (90,908) (379,088) 16,190 (453,806)
Excess (Deficit) of Revenues and OtherFinancing Sources Over Expendituresand Other Financing Uses - - - -
Fund Balance Beginning - 208 208
Fund Balance Ending $ - $ 208 $ - $ 208
Other Governmental Funds
75

Elliott County School DistrictCombining Balance Sheet - School Activity and Private Purpose Trust
June 30, 2020
ELLIOTT CO. ISONVILLE LAKESIDE SANDY HOOK PRIVATEHIGH SCHOOL ELEMENTARY ELEMENTARY ELEMENTARY PURPOSE TRUST TOTAL
ASSETSCash and cash equivalents $ 68,985 $ - $ 10,116 $ 29,586 $ 107,251 $ 215,938
Total assets 68,985 - 10,116 29,586 107,251 215,938
LIABILITIESAccounts payable 248 248
Total liabilities 248 - - - - 248
FUND BALANCETrust activity 107,251 107,251 School activities 68,737 - 10,116 29,586 108,439
68,737 - 10,116 29,586 107,251 215,690
TOTAL LIABILITIES AND FUND BALANCE $ 68,985 $ - $ 10,116 $ 29,586 $ 107,251 $ 215,938
SCHOOL ACTIVITY FUNDS
76

Elliott County School DistrictCombining Statement of Revenues, Expenses and Changes in Fund Balance-School Activity and Private Purpose Trust
Year ended June 30, 2020
ELLIOTT CO. ISONVILLE LAKESIDE SANDY HOOK PRIVATEHIGH SCHOOL ELEMENTARY ELEMENTARY ELEMENTARY PURPOSE TRUST TOTAL
RevenuesStudent/trust revenues $ 242,748 $ 1,957 $ 6,840 $ 30,751 $ 1,442 $ 283,738
ExpendituresStudent/trust activities 234,266 3,443 4,812 21,909 264,430
Excess (Deficit) of RevenuesOver Expenses 8,482 (1,486) 2,028 8,842 1,442 19,308
Fund Balance-Beginning 60,255 1,486 8,088 20,744 105,809 196,382
Fund Balance-Ending $ 68,737 $ - $ 10,116 $ 29,586 $ 107,251 $ 215,690
SCHOOL ACTIVITY FUNDS
77

Elliott County School DistrictStatement of Revenues, Expenses, and Changes in Fund Balance - Elliott County High School
Year ended June 30, 2020
FUND BALANCE FUND BALANCEBEGINNING REVENUES EXPENSES TRANSFERS ENDING
GENERAL FUND $ 3,266 $ 25,606 $ 25,241 $ - $ 3,631 SENIOR CLASS FUNDS 302 10,377 10,836 165 8 HS SCIENCE 5 - - - 5 ARCHERY 3,222 10,185 7,571 - 5,836 ELEMENTARY BASKETBALL 3,276 4,019 5,551 - 1,744 PROM 2020 164 225 - (389) - FBLA/LEADERSHIP CLASS 1,453 24,132 25,498 - 87 ENVIRONMENTAL CLUB 344 - - - 344 ANNUAL 1,344 160 1,102 - 402 SOCCER 520 - - - 520 FCA 1,170 3,845 2,769 (575) 1,671 AP GEOGRAPHY 663 - - - 663 PEP CLUB 176 - - - 176 ELEMENTARY CHEERLEADING 627 - - - 627 DUNGEONS AND DRAGONS CLUB 221 - - - 221 LIONS/CUBS CLUB - 235 - - 235 DISTRICT ACTIFITY FUNDS - - 3,600 3,600 - STARTUP/CHANGE FUND - 1,600 1,600 - - JUNIOR CLASS - 37 - (37) - GENERAL II 150 - - - 150 FACULTY VENDING 1,368 1,751 2,352 - 767 DRAMA CLUB 8 278 189 - 97 BETA 1,303 2,846 1,241 - 2,908 BAND 4,515 9,073 6,688 - 6,900 JR BETA 35 9,981 8,926 - 1,090 FRESHMAN ACCOUNT 471 - - - 471 SOPHOMORE FUND 10 118 - (128) - FCCLA 3,186 1,424 1,185 - 3,425 FFA 3,332 6,058 8,057 575 1,908 INDUSTRIAL ARTS 184 - - - 184 WELDING - 230 199 - 31 ATHLETIC 10,046 26,333 31,053 (788) 4,538 7TH & 8TH ATHLETIC 287 18,035 17,048 - 1,274 HS ATHLETIC GIRLS 613 27,782 24,340 (250) 3,805 CROSS COUNTRY 1,053 2,029 2,811 - 271 TRACK 16 - - - 16 HS CHEERLEADING 3,777 20,371 14,574 (1,190) 8,384 7/8 CHEERLEADING 745 3,488 5,421 1,190 2 VOLLEYBALL 7 4,715 4,086 - 636 BASEBALL 1,285 10,340 8,064 - 3,561 SOFTBALL 219 - 215 - 4 GOLF 08-09 7 1,903 2,447 538 1 ROTC 2,795 2,676 2,765 500 3,206 LIBRARY 112 - - - 112 YEARBOOK ADS 2,626 - - - 2,626 ACADEMIC TEAM 507 - 313 - 194 JUNIOR CLASS (PROM) 1,380 7,547 5,415 389 3,901 8TH GRADE 331 - - (331) - 7TH/8TH GRADE ACCOUNT 3,134 5,349 3,109 (3,269) 2,105
TOTALS $ 60,255 $ 242,748 $ 234,266 $ - $ 68,737
78

ELLIOTT COUNTY SCHOOL DISTRICTSCHEDULE OF EXPENDITURES OF FEDERAL AWARDS
For the year ended June 30, 2020
Federal Grantor/ Federal Pass-Through Passed ProgramPass-Through Grantor/ CFDA Grantor's Through to or Award
Program Title Number Number Subrecipents Amount Expenditures
US Department of AgriculturePassed Through State Department of Education
School Breakfast Program 10.553Fiscal Year 19 7760005 19 $ - $ N/A $ 40,821 Fiscal Year 20 7760005 20 - N/A 131,545 National School Lunch Program 10.555Fiscal Year 19 7750002 19 - N/A 83,266 Fiscal Year 20 7750002 20 - N/A 269,285 Summer Food Service Program for Children 10.559Fiscal Year 19 7690024 19 - N/A 542 Fiscal Year 20 7690024 20 - N/A 6,522 Fiscal Year 19 7740023 19 - N/A 5,187 Fiscal Year 20 7740023 20 - N/A 63,557 Child Nutrition Cluster Subtotal 600,725
State Administrative Grant for Nutrition 10.560Fiscal Year 19 7700001 19 - N/A 3,064
Fresh Fruits & Vegetables 10.582Fiscal Year 19 7720012 19 - N/A 2,469 Fiscal Year 20 7720012 20 - N/A 14,951
17,420 Passed Through State Department of Agriculture
Food Donation-Commodities 10.565Fiscal Year 20 510.4950 - N/A 45,005
Total US Department of Agriculture 666,214
US Department of EducationPassed Through State Department of Education
* Title I Grants to Local Educational Agencies 84.010AFiscal Year 19 3100002 19 - 435,553 16,077 Fiscal Year 20 3100002 20 - 477,224 477,224
493,301
Special Education Grants to States 84.027AFiscal Year 20 3810002 20 - 299,236 299,236 Special Education-Preschool Grants 84.173AFiscal Year 20 3800002 20 - 19,669 19,669
Special Education Cluster Subtotal 318,905
Title IV Part A 84.424AFiscal Year 19 3420002 19 - 35,132 723 Fiscal Year 20 3420002 20 - 36,181 36,181
36,904 Perkins 84.048Fiscal Year 19 3710002 19 - - Fiscal Year 20 3710002 20 - 17,431 16,855
16,855 Teacher Quality 84.367AFiscal Year 19 3230002 18 - 57,600 11,165 Fiscal Year 20 3230002 19 - 62,282 62,282
73,447 Rural Education 84.358Fiscal Year 20 3140002 19 - 19,777 19,777
CARES Act Educational Stabilization Fund 84.425DFiscal Year 20 4000002 20 - 388,828 18,725
Total US Department of Education 977,914
US Department of DefensePassed directly from the US Department of the Army
ROTC 12.000Fiscal Year 20 504E - N/A 43,685
Total US Department of Defense 43,685
Total Expenditure of Federal Awards $ 1,687,813 * Major programs
See the accompanying notes to the schedule of expenditures of federal awards.79

ELLIOTT COUNTY SCHOOL DISTRICT NOTES TO THE SCHEDULE OF EXPENDITURES OF FEDERAL AWARDS
For the year ended June 30, 2020
80
NOTE A – BASIS OF PRESENTATION The accompanying schedule of expenditures of federal awards includes the federal grant activity of the Elliott County School District under the programs of the federal government for the year ended June 30, 2020. The information in this schedule is presented in accordance with the requirements of Title 2 U.S. Code of Federal Regulations Part 200, Uniform Administrative Requirements, Cost Principles, and Audit Requirements for Federal Awards, (Uniform Guidance). Because the schedule presents only a selected portion of the operations of the Elliott County School District, it is not intended to and does not present the financial position, changes in net position or cash flows of the District. NOTE B – SIGNIFICANT ACCOUNTING POLICIES Expenditures reported on the schedule are reported on the accrual basis of accounting. Such expenditures are recognized following the cost principles contained in the Uniform Guidance wherein certain types of expenditures are not allowable or are limited as to reimbursement. Negative amounts shown on the schedule represents adjustments or credits made in the normal course of business to amounts reported as expenditures in prior years. Pass-through entity identifying numbers are presented where available. NOTE C – FOOD DISTRIBUTION Nonmonetary assistance is reported in the schedule at the fair value of the commodities received and disbursed. For the year ended June 30, 2020, the District received food commodities totaling $45,005. NOTE D – INDIRECT COST RATE The Elliott County School District has not elected to use the 10-percent de minimis indirect cost rate allowed under the Uniform Guidance.

81
INDEPENDENT AUDITOR’S REPORT ON INTERNAL CONTROL OVER FINANCIAL REPORTING AND ON COMPLIANCE AND OTHER MATTERS BASED ON AN AUDIT OF FINANCIAL STATEMENTS PERFORMED IN
ACCORDANCE WITH GOVERNMENT AUDITING STANDARDS
To the Board of Education of the Elliott County School District Sandy Hook, KY And the State Committee for School District Audits
We have audited, in accordance with the auditing standards generally accepted in the United States of America and the standards applicable to financial audits contained in Government Auditing Standards issued by the Comptroller General of the United States and the audit requirements prescribed by the Kentucky State Committee for School District Audits, in the Auditor Responsibilities and State Compliance Requirements sections contained in the Kentucky Public School Districts’ Audit Contract and Requirements, the financial statements of the governmental activities, the business-type activities, each major fund, and the aggregate remaining fund information of the Elliott County School District, as of and for the year ended June 30, 2020, and the related notes to the financial statements, which collectively comprise the Elliott County School District’s basic financial statements, and have issued our report thereon dated November 13, 2020.
Internal Control over Financial Reporting
In planning and performing our audit of the financial statements, we considered the Elliott County School District’s internal control over financial reporting (internal control) as a basis for designing audit procedures that are appropriate in the circumstances for the purpose of expressing our opinions on the financial statements, but not for the purpose of expressing an opinion on the effectiveness of the Elliott County School District’s internal control. Accordingly, we do not express an opinion on the effectiveness of the Elliott County School District’s internal control.
A deficiency in internal control exists when the design or operation of a control does not allow management or employees, in the normal course of performing their assigned functions, to prevent, or detect and correct, misstatements on a timely basis. A material weakness is a deficiency, or a combination of deficiencies, in internal control, such that there is a reasonable possibility that a material misstatement of the entity’s financial statements will not be prevented, or detected and corrected on a timely basis. A significant deficiency is a deficiency, or a combination of deficiencies, in internal control that is less severe than a material weakness, yet important enough to merit attention by those charged with governance.
Our consideration of internal control was for the limited purpose described in the first paragraph of this section and was not designed to identify all deficiencies in internal control that might be material weaknesses or significant deficiencies. Given these limitations, during our audit we did not identify any deficiencies in internal control that we consider to be material weaknesses. However, material weaknesses may exist that have not been identified.
Compliance and Other Matters
As part of obtaining reasonable assurance about whether the Elliott County School District’s financial statements are free from material misstatement, we performed tests of its compliance with certain provisions of laws, regulations, contracts, and grant agreements, noncompliance with which could have a direct and material effect on the financial statements. However, providing an opinion on compliance with those provisions was not an objective of our audit, and accordingly, we do not express such an opinion. The results of our tests disclosed no instances of noncompliance or other matters that are required to be reported under Government Auditing Standards.
We noted certain matters that we reported to management of the Elliott County School District in a separate letter dated November 13, 2020.
White & Associates, PSC Certified Public Accountants & Consultants
1407 Lexington Road Richmond, KY 40475 (859) 624-3926

82
Purpose of this Report
The purpose of this report is solely to describe the scope of our testing of internal control and compliance and the results of that testing, and not to provide an opinion on the effectiveness of the entity’s internal control or on compliance. This report is an integral part of an audit performed in accordance with Government Auditing Standards in considering the entity’s internal control and compliance. Accordingly, this communication is not suitable for any other purpose.
White & Associates, PSC Richmond, KY
November 13, 2020

83
INDEPENDENT AUDITOR’S REPORT ON COMPLIANCE FOR EACH MAJOR FEDERAL PROGRAM AND REPORT ON INTERNAL CONTROL OVER COMPLIANCE REQUIRED BY THE UNIFORM GUIDANCE
To the Board of Education of the Elliott County School District Sandy Hook, KY And the State Committee of School District Audits
Report on Compliance for Each Major Federal Program
We have audited the Elliott County School District’s compliance with the types of compliance requirements described in the OMB Compliance Supplement that could have a direct and material effect on each of the Elliott County School District’s major federal programs for the year ended June 30, 2020. Elliott County School District’s major federal programs are identified in the summary of auditor’s results section of the accompanying schedule of findings and questioned costs.
Management’s Responsibility
Management is responsible for compliance with federal statutes, regulations, and the terms and conditions of its federal awards applicable to its federal programs.
Auditor’s Responsibility
Our responsibility is to express an opinion on compliance for each of the Elliott County School District’s major federal programs based on our audit of the types of compliance requirements referred to above. We conducted our audit of compliance in accordance with auditing standards generally accepted in the United States of America; the standards applicable to financial audits contained in Government Auditing Standards, issued by the Comptroller General of the United States; and the audit requirements of Title 2 U.S. Code of Federal Regulations Part 200, Uniform Administrative Requirements, Cost Principles, and Audit Requirements for Federal Awards (Uniform Guidance) and the audit requirements prescribed by the Kentucky State Committee for School District Audits, in the Auditor Responsibilities and State Compliance Requirements sections contained in the Kentucky Public School Districts’ Audit Contract and Requirements. Those standards and the Uniform Guidance require that we plan and perform the audit to obtain reasonable assurance about whether noncompliance with the types of compliance requirements referred to above that could have a direct and material effect on a major federal program occurred. An audit includes examining, on a test basis, evidence about the Elliott County School District’s compliance with those requirements and performing such other procedures as we considered necessary in the circumstances.
We believe that our audit provides a reasonable basis for our opinion on compliance for each major federal program. However, our audit does not provide a legal determination of the Elliott County School District’s compliance.
Opinion on Each Major Federal Program
In our opinion, the Elliott County School District, complied, in all material respects, with the types of compliance requirements referred to above that could have a direct and material effect on each of its major federal programs for the year ended June 30, 2020.
Report on Internal Control over Compliance
Management of the Elliott County School District is responsible for establishing and maintaining effective internal control over compliance with the types of compliance requirements referred to above. In planning and performing our audit of compliance, we considered the Elliott County School District’s internal control over compliance with the types of requirements that could have a direct and material effect on each major federal program to determine the auditing procedures that are appropriate in the circumstances for the purpose of expressing an opinion on compliance for each major federal program and to test and report on internal control over compliance in accordance with the Uniform Guidance, but not for the purpose of expressing an opinion on the effectiveness of internal control over compliance. Accordingly, we do not express an opinion on the effectiveness of the Elliott County School District’s internal control over compliance.
White & Associates, PSC Certified Public Accountants & Consultants
1407 Lexington Road Richmond, KY 40475 (859) 624-3926
84
A deficiency in internal control over compliance exists when the design or operation of a control over compliance does not allow management or employees, in the normal course of performing their assigned functions, to prevent, or detect and correct, noncompliance with a type of compliance requirement of a federal program on a timely basis. A material weakness in internal control over compliance is a deficiency, or a combination of deficiencies, in internal control over compliance, such that there is a reasonable possibility that material noncompliance with a type of compliance requirement of a federal program will not be prevented, or detected and corrected, on a timely basis. A significant deficiency in internal control over compliance is a deficiency, or a combination of deficiencies, in internal control over compliance with a type of compliance requirement of a federal program that is less severe than a material weakness in internal control over compliance, yet important enough to merit attention by those charged with governance.
Our consideration of internal control over compliance was for the limited purpose described in the first paragraph of this section and was not designed to identify all deficiencies in internal control over compliance that might be material weaknesses or significant deficiencies. We did not identify any deficiencies in internal control over compliance that we consider to be material weaknesses. However, material weaknesses may exist that have not been identified.
The purpose of this report on internal control over compliance is solely to describe the scope of our testing of internal control over compliance and the results of that testing based on the requirements of the Uniform Guidance. Accordingly, this report is not suitable for any other purpose.
White & Associates, PSC Richmond, KY
November 13, 2020
ELLIOTT COUNTY SCHOOL DISTRICT SCHEDULE OF FINDINGS AND QUESTIONED COSTS
For the year ended June 30, 2020
85
SUMMARY OF AUDITOR’S RESULTS What type of report was issued for the financial statements? Unmodified Were there significant deficiencies in internal control disclosed? None Reported If so, was any significant deficiencies material (GAGAS)? N/A Was any material noncompliance reported (GAGAS)? No Were there material weaknesses in internal control disclosed for major programs? No Were there any significant deficiencies in internal control disclosed that were not considered to be material weaknesses? None Reported What type of report was issued on compliance for major programs? Unmodified Did the audit disclose findings as it relates to major programs that is required to be reported as described in the Uniform Guidance? No Major Programs Title I [CFDA 84.010A] Dollar threshold of Type A and B programs $750,000 Low risk auditee? Yes FINDINGS - FINANCIAL STATEMENT AUDIT No findings at the financial statement level. FINDINGS AND QUESTIONED COSTS – MAJOR FEDERAL AWARD PROGRAMS AUDIT No findings at the major federal award programs level.

ELLIOTT COUNTY SCHOOL DISTRICT SUMMARY SCHEDULE OF PRIOR AUDIT FINDINGS
For the year ended June 30, 2020
86
There were no prior year audit findings.

j{|àx 9 TááÉv|tàxá? cfV CERTIFIED PUBLIC ACCOUNTANTS
87
MANAGEMENT LETTER POINTS To Management Elliott County School District Sandy Hook, Kentucky In planning and performing our audit of the financial statements of the Elliott County School District for the year ended June 30, 2020, we considered the District’s internal controls in order to determine our auditing procedures for the purpose of expressing an opinion on the financial statements and not to provide assurance on the internal control. Accordingly, we do not express an opinion on the effectiveness of the District’s internal control. However, during our audit, we became aware of several matters that are opportunities for strengthening internal controls and operating efficiency. We previously reported on the District’s internal control in our report dated November 13, 2020. This letter does not affect our report dated November 13, 2020, on the financial statements of the Elliott County School District. The conditions observed are as follows: ISONVILLE ELEMENTARY 1-20 Statement of Condition: Instances of receipts not being deposited timely. Recommendation for Correction: All monies should be deposited on a daily basis. In the event that less than $100 is on hand to deposit, smaller amounts may be held in a secure location until $100 is collected. At a minimum, deposits shall be made on a weekly basis even if the deposit amount is less than $100. The total of the deposit slip shall match the total receipts written since the last deposit. Each deposit shall be verified by a second person daily. Management Response to the Recommendation: This location is no longer open; however, the administration is providing Redbook training for all bookkeepers at all locations to ensure everyone is aware and trained on properly managing, depositing and recording school funds. Bookkeepers will make deposits according to policy. 2-20 Statement of Condition: Instances of all receipt numbers not being listed on deposit slip. Recommendation for Correction: The school treasurer shall prepare deposit slips containing the issuers name and the amount of each check or retain a copy of all checks to be deposited. The deposit slip shall note the receipt numbers in the deposit. Management Response to the Recommendation: This location is no longer open; however, the administration is providing Redbook training for all bookkeepers at all locations to

88
ensure everyone is aware and trained on properly managing, depositing and recording school funds. Bookkeepers will list all receipt numbers on the deposit slip. 3-20 Statement of Condition: Monthly Financial Reports were not being submitted to the superintendent or finance officer at the close of each month (July, Dec, and Jan). Recommendation for Correction: Monthly financial reports shall be prepared and submitted to the superintendent or finance officer no later than the 15th of the following month. The original shall be signed and reviewed for accuracy and reasonableness by the principal and submitted to the superintendent or finance officer and a copy retained in the files. A list of accounts payables and receivables shall accompany the report. Management Response to the Recommendation: Email reminders will be sent to bookkeepers to ensure that monthly reports are submitted on time. LAKESIDE ELEMENTARY No conditions SANDY HOOK ELEMENTARY 4-20 Statement of Condition: Instances of all receipt numbers not being listed on deposit slip. Recommendation for Correction: The school treasurer shall prepare deposit slips containing the issuers name and the amount of each check or retain a copy of all checks to be deposited. The deposit slip shall note the receipt numbers in the deposit. Management Response to the Recommendation: The school treasurer will prepare deposit slips with the check numbers listed as well as the issuers name. The school treasurer will make copies of each check to be deposited and will note the receipt numbers in the deposit. ELLIOTT COUNTY HIGH SCHOOL 5-20 Statement of Condition: Fund Raiser Worksheet (F-SA-2B) not being utilized for all fundraising events that require one. Recommendation for Correction: For each fundraising event, the sponsor responsible for the administration of the fundraiser will fill out the Fund Raiser Worksheet (F-SA-2B). After completion of the fundraiser, the sponsor will submit the completed Fund Raiser Worksheet to the Principal for review. After review, the principal will give the Fund Raiser Worksheet to the school treasurer to file with other financial documents. Management Response to the Recommendation: Sponsors will be required and reminded to submit the Fund Raiser Worksheet (F-SA-2B) to principal and treasurer after each fundraiser is completed.

89
6-20 Statement of Condition: Instances of receipts not being deposited timely. Recommendation for Correction: All monies should be deposited on a daily basis. In the event that less than $100 is on hand to deposit, smaller amounts may be held in a secure location until $100 is collected. At a minimum, deposits shall be made on a weekly basis even if the deposit amount is less than $100. The total of the deposit slip shall match the total receipts written since the last deposit. Each deposit shall be verified by a second person daily. Management Response to the Recommendation: Sponsors/teachers will be reminded to turn money in daily and treasurer will deposit money daily. Each deposit will be verified by a second person daily. We will review the status of these conditions during our next audit engagement. We have already discussed these conditions with district personnel that have responsibility for implementation of corrective action. All prior year conditions have been implemented and corrected. Ms. Debbie Stephens, Superintendent is the person responsible for initiation of the corrective action plan for the above conditions which will be implemented immediately. The corrective action plan is the management response for each condition. We would like to thank the Finance Officer, Kristen Salyers, and her department for their support and assistance during our audit. This report is intended solely for the information and use of the, management, and others within the district and is not intended to be and should not be used by anyone other than these specified parties. White & Associates, PSC White & Associates, PSC Richmond, Kentucky November 13, 2020