elk and bison management investigations
TRANSCRIPT

ALASKA DEPARTMENT OF FISH &GAME 1960 - 61 Pittm on- Roberts on Pr o ject Repo rt
'ISION OF GAME VOLUME 11 , NO. 4
ELK AND BISON MANAGEMENT INVESTIGATIONS Work Plans D and L-2
Juneau, Alaska

..
Aerial surveys reveal a population of approximately 1,200 elk on Afognak and Raspberry Islands. These animals stem from a transplant of eight yearling Roosevelt elk obtained from the State of Washington in 1929 and which were released on Afognak Island. (Ph.oto by Ron Batchelor)
I I
Elk tagging conducted by Alaska Department of Fish and Game Biologists will yield data relat ing to calf survival, and heJA.8 movement and distribution. ~ (Photo by Errol w. Claire)
Bison utilize valuable grazing land and thus come into conflict with civilization. By stabilizing their numbers through hunting, depredation losses can be minimized. (Photo by Joseph Gurske, Fo:d Greely)
Bison from the National Bison Range in Montana were transplanted to the Big Delta area in 1928. From this initial band of 23, the population has increased to an estimated 400 animals. (Photo by U.8. Fish and Wildlife Service)
I e· I
I
I

•• I 1960-1961 Volume II, Number 4
ANNUAL REPORT OF PROGRESS, 1960-1961
FEDERAL AID IN WILDLIFE RESTORATION PROJECT W-6-R-2
GAME INVESTIGATIONS OF ALASKA
STATE OF ALASKA
William A. Egan, Governor
Alaska Department of Fish and Game
Clarance L. Anderson, Commissioner
Division of Game
James W. Brooks, Director David R. Klein, P-R Coordinator
I I Personnel participating in project:
Ronald F. Batchelor Robert A. Rausch Joseph A. Nava, Jr.
I (Requests to reproduce material contained within this report should be directed to the Alaska Department of Fish and Game, Juneau, Alaska.)
I
•• I

Contents of Volume II••I Reports of Investigations
No. 1 Sitka Black-Tailed Deer Work Plan A
No. 2 Moose Work Plan B
No. 3 Caribou Work Plan c
No. 4 Elk Work Plan D
Bison Work Plan L-2
M No. 5 Sheep and Goat
Work Plan E
I No. 6 Bears
Work Plan F
No. 7 Fur Mammals Work Plan G
I Snowshoe Hare Work Plan H
I Wildlife Reconnaissance Work Plan L-1
I No. 8 Game Birds
Work Plan I
I No. 9 Marine Mammals
Work Plan J
No. 10 Wolves Work Plan K
No. 11 Parasites and Diseases Work Plan M
I
•• I

•• I
I I I I I I I .. ~
I I I I I I I
••
Job No.
D-la
D-lb
D-lc
D-ld
D-le
L-2
TABLE OF CONTENTS
Title Page No.
Herd Distribution and Abundance, Roosevelt Elk Studies . 1
Range Studies, Elk Management Investigation, Afognak Island 7
Productivity Analysis, Elk Management Investigation, Afognak Island 9
Mortality Studies, Elk Management Investi gation, Afognak Island 11
Characteristics of the Hunter Harvest, Elk Management Investigations . 13
Bison Management Investigations . 23
I

••
I Report No. D-laVolume 2e·1
ANNUAL REPORT OF PROGRESS INVESTIGATIONS PROJECT
I COMPLETION OF 1960-1961 SEGMENT
State: Alaska
Project No: W-6-R-2 Name: Alaska Wildlife Investigations
Roosevelt Elk StudiesWork Plan: D
Title: Herd Distribution andJob No: 1-a . Abundance
PERIOD COVERED: February l, 1961 to March 31, 1961
ABSTRACT:
During February and March aerial surveys of Afognak and1-e Raspberry Islands were conducted as a means of evaluating winter distribution of elk herds inhabiting the two Islands.
I As a result of the survey 4 distinct wintering areas were observed and 720 elk were counted. Tracks and signs of unobserved animals suggest that many more elk than were observed
I winter in the four key winter ranges.
OBJECTIVES:
To determine the distinctness, size and seasonal distri bution of recognizable herds of elk inhabiting Afognak and Raspberry Islands. To determine present herd status as a basis for harvest regulations.
TECHNIQUES:
I
Aerial surveys were conducted periodically through the winter for the purpose of ascertaining elk numbers and winter distribution. On-the-ground observations to obtain sex and age composition data were attempted but were found unsuccessful.
I

I
FINDINGS: ••IWinter Distribution and Status: Duri:r:g the months of February and March an aerial survey of Afosnak and Raspberry Islands was conducted to ascertain elk numbers and patterns of winter distribution. At the time of the survey elk herds I of the two islands were found to occupy four distinct winter ranges, Table 1 and Figure 1. Of these 4 ranges, the Afognak Lake area of southwestern Afognak Island was considered the I major wintering area, supporting 338 or nearly 50 per cent of all elk recorded during the survey. In addition to the animals counted, numerous tracks and sign of unobserved elk I noted in the heavily timbered southeastern portion of the Afognak Lake area suggested that many more elk than were sighted wintered in this region. I
Frequent aerial surveys of southwestern Afognak made during the period the elk drift onto their winter range in I dicated that animals summering along the crest north of Raspberry Strait and in the Malina Lakes area winter in the vicinity of Afognak Lake. I
An aerial count of the Tonki Cape region of northeastern Afognak revealed 171 elk wintering in the area. Like lower •I Afognak Lake, much of Tonki Cape is timbered making a total count impossible. As was observed in all wintering areas of Afognak, numerous tracks and signs indicated that many more I elk than were counted inhabited the Tonki Cape area. A conservative estimate places the Tonki herd at approximately 225 head. I
Throughout northcentra1 Afognak scattered bands of from 15 to 53 head were observed during the survey. As this por I tion of the island supports a dense Sitka spruce climax forest, figures obtained during the survey only suggest the status of elk in this region. Additional surveys will be I required in order to evaluate populations wintering in this area of Afognak Island. Information gathered to date suggests that elk summering on the Paramanof f Peninsula of western I Afognak move from that area into the heavily tirriliered north central region of Afognak during the winter. I
A survey of Raspberry Island during February revealed that a herd of 115 animals wintered in the Onion Bay area of I e
I - 2
I

••
••
I
Table 1. Roosevelt elk distribution on Afognak and Raspberry Islands, February, 1961.
I I WINTER RANGE
No. Elk Counted
Total Elk Counted
I Raspberry Island (Onion Bay area) 115 16
I Afognak Lake 338 47
I Northcentral Afognak
Tonki Cape
Island 96
171
13
24
I TOTAL 720
I 1e
I I I I I I
- 3
I
I

- - - - - - - - - - - - - - - - - - -
FIGURE I AFOGNAK ISLAND GRCAJP
~ N
I
Onion Bay
Tonki
Key Wintering Areas ~
15 Miles
Cape
I
.i::>
- e e

••
I
the southwestern end of the island. This herd was frequently
I•• observed in this vicinity throughout the winter.
I That the spruce climax plays an integral part in the
ecology of the Roosevelt elk of the Afognak Island Group was demonstrated throughout the winter survey. Of the four above
I mentioned winter ranges, all are characterized by dense stands of Sitka spruce with adjacent Alnus-Sa:mbucus and
I Calamagrostis-Salix associations. The later two associations supply the bulk of the available winter forage while the spruce association affords protection from severe winter
I weather. During periods of inclement winter weather elk were to be found almost entrrely within the dense spruce forest, only tc venture into the shrublands to feed for short periods of time.
I Observations of key winter ranges made throughout the winter revealed that the distribution of elk is closely tied in with the spruce climax. It is very doubtful that an elk
I population of any magnitude will ever become established outside the forested areas of the Kodiak Archipelago. This same conclusion has been drawn regarding the distribution
1e of the Sitka blacv-tailed deer of the Kodiak area.
At the conclusion of winter aerial surveys a total count of 720 elk was obtained from 4 distinct winter ranges of the
I I Afognak - Raspberry Island Group. This figure, it is es
timated, represents approximately 6C per cent of the total elk population of the Kodiak Archipelago.
I Sex and Age Composition: Though it was hoped herd
classificRtion information could be obtained during the winter survey, it was found that conditions at this time of the year made it impossible to gather such data. Data concerning
I composition of Afognak and Raspberry elk herds will be presented in a later report.
I RECOMMENDATIONS:
I The collection of distribution and herd composition data
on an annual basis is essential for the proper management of the Roosevelt elk.
I
- 5
I

I
SUBMITTED BY:
Ronald F. Batchelor Game Biologist June 30, 1961
APPROVED BY: ••I David R. Klein I P-R Coordinator
I I
James W. Brooks, Director Division of Game I
I I
e1 I I I I I I
••I
- 6 ...
I

I Volume 2 Report No. D-lb
ANNUAL REPORT OF PROGRESS INVESTIGATIONS PROJECT
COMPLETION OF 1960-1961 SEGMENTI•• I
State: Alaska
I Project No: W-6-R-2 Name: Alaska Wildlife Investigations
I Work Plan: D Elk Manaqement Investi gation, Afognak Island
I Job No: 1-b Title: Range Studies
I PERIOD COVERED: July 1, 1960 to June 30, 1961
ABSTRACT:
I 1e
This project was relatively inaqtive during the past year.
OBJECTIVES:
I To delineate seasonal elk ranges, and determine their vegetative composition. To determine forage and browse
I production in relation to availability, utilization, and preference.
I TECHNIQUES:
I Elk surveys conducted in connection with Job No.D-la
served to delimit seasonal elk ranges. Plant composition, utilization and condition and trend are determined by standard range analysis methods.
I FINDINGS:
I Data regarding winter distribution and use of key winter ranges by elk were reported in Job N~. D-la. Range analysis, utilization and condition and trend data have not been gathered during this period. Initial investi-I
•• - 7
I

I
gations regarding range use and range types were conducted during the period but are incomplete and will be reported ••Iat a later date.
RECOMMENDATIONS~
IThe evaluation of range condition and trend, utilization, and forage production is an integral segment in the management of the Roosevelt elk of the Afognak Island IGroup and should be continued.
ISUBMITTED BY: APPROVED BY:
I I
Ronald F. Batchelor David R. Klein Game Biologist P-R Coordinator June 30, 1961 I
91 James W. Brooks, Division of Game
- 8 - .
Director
I I I I I I
••I
I

Report No. D-lcVolume 2
I•• ANNUAL REPORT OF PROGRESS INVESTIGATIONS PROJECT
COMPLETION OF 1960-1961 SEGMENT
State: Alaska
Project No: W-6-R-2 Name: Alaska Wildlife Investigations
Work Plan: D Elk Management Investi gations, Afognak Island
Job No: 1-c Title: Productivity Analysis
19
PERIOD COVERED: July 1, 1960 to December 31, 1960
ABSTRACT:
This phase of the project was i~active during the
I period.
OBJECTIVES:
To obtain data concerning elk breeding, fertility and parturition; to determine factors affecting these elements of productivity~ and to apply this information to proper herd management.
TECHNIQUES:
I
Field observations of the timing, duration of the rut, and of the behavior of the elk during this period will be recorded. Fertility data will be gathered from observations made in the field, reproductive tracts, and measurement of survival of the calf crop to the period of legal hunting.
I FINDINGS:
Only preliminary investigations have been conducted
I
•• - 9
I

I
regarding this phase and available data will be presented ••Iin a later report.
RECOMMENDATIONS:
IThe collection of data regarding current production should be gathered on an annual basis.
I SUBMITTED BY: APPROVED BY:
I
Ronald F. Batchelor David R. Klein Game Biologist P-R Coordinator June 30, 1961
James W. Brooks, Director Division of Game
- 10
I
•• I

•• I
Volume 2 Report No. D-ld
I ANNUAL REPORT OF PROGRESS INVESTIGATIONS PROJECT
COMPLETION OF 1960-1961 SEGMENT
I State: Alaska
I Project No: W-6-R-2 Name: Alaska Wildlife Investigations
I Work Plan: D Elk Management Investi gations, Afognak Island
I Job No: 1-d Title: Mortality Studies
I PERIOD COVERED: September 1, 1960 to June 20, 1961
I ABSTRACT:
During the course of the investigation and in conjunction with other phases of the elk study no cases of mortality other than hunter harvest were recorde·a.
I OBJECTIVES:
I To obtain data relating to annual mortality sustained
by Raspberry and Afognak Islands' elk herd~to identify and evaluate the degree to which individual mortality factors are acting; and to apply this information to proper herd
I management.
TECHNIQUES:
I I Field observations concurrent with other phases of the
elk study were conducted to establish the degree and periods in which mortality is acting on both the total herd and individual elements.
I FINDINGS:
I
•• - 11
I

I -
During the course of the investigation, no cases of elk mortality were recorded from Raspberry and Afognak ••IIslands. The terrain and vegetation of the elk range are such that carcasses of naturally dying animals cannot be readily located even though intensive searches are made.
IRECOMMENDATIONS~
If the collection of mortality data cannot be accomplished through carcass counts, evaluation of natural I mortality will have to be made from composition counts made throughout the year. I SUBMITTED BY: APPROVED BY: I
I Ronald F. Batchelor David R. Klein IGame Biologist P-R Coordinator June 27, 1961
ltll I
James W. Brooks, Director Division of Game I
I I I I
••I
- 12
I

---··
•• I
Volume 2 Report No. D-le
I ANNUAL REPORT OF PROGRESS
I INVESTIGATIONS PROJECT
COMPLETION OF 1960-1961 SEGMENT
I State: Alaska
I Project No: W-6-R-2 Name: ,Alaska Wildlife
Investigations
I Work Plan: D Elk Management
_Investiqa tions
I Job No: 1-e Title: Characteristics of
the Hunter Harvest
I PERIOD COVERED: August 20, 1960 to October 31, 1960
ABSTRACT:
I 19 The Roosevelt elk kill for 1960 was 127 animals har
vested during a 57 day season. Of this figure, 68 animals were bulls, 43 were cows, 2 were calves, and 14 were unidentified as to sex. At the conclusion of the season seven more elk were harvested over the 19:59 figure. A collection
I of 51 elk jaws revealed that 47 per ce1,t of the female
I sample was represented by animals in the 4.5+ year class while 48 per cent of the male sample was composed of animals in the 1.5 year class. Available data indicate an existing differential age ratio between the male and female segments
I of the pop1..:ilation. Hunter success for the 1960 season was 37 per cent. The desired harvest of 150 animals was not attained, even with a liberal 20 day either-sex season.
I OBJECTIVES:
I To secure information relative to the total kill of elk
by hunters, area and chronological distribution of the kill, and hunter success.
To determine and evaluate the sex and age compositionI
•• - 13
I

I of the kill and the physical characteristics of elk harvested. ••
ITECHNIQUES:
Harvest information for the 1960 elk seas~n was obtained in part through contact with hunters in the field. In addi I tion, hunter~harvest forms were distributed to the military, local meat processors, and air lines in the Kodiak area. Throughout the season aerial surveys and hunting camp checks I were conducted to determine the extent of the harvest. Hunters checked in the field were encouraged to report their kills and turn in elk jaws to the Department's office in I Kodiak.
IThe 1960 hunting season opened on September 1 and extended through the 30th with the taking of either-sex animals permitted during the last five days (26-30). In addition, Ia 15 day extension during which either-sex animals could be taken was provided. In the Tonki Cape area the season extended from August 20 through October 15 with no sex re Istrictions. The bag limit was one elk.
Prior to the opening of the season, jaw collection post 91ers were distributed locally for hunters to observe. In addition, several ads were run in the local Kodiak paper reminding hunters to turn in elk and deer jaws. I
Lower jaws were collected and analysed to ascertain the age structure of the harvest and when practical, weights and Imeasurements of elk carcasses were recorded.
FINDINGS: I Sex breakdown of the kill: The sex breakdown of the
total legal elk harvest for 1960 was 54 per cent bulls as Icompared to 87 per cent in 1959. The cow kill increased from 13 per cent of the total harvest (limited cow season) in 1959 to 34 per cent of the 1960 kill. This large in Icrease of cows in the kill can be attributed to the liberal 20 day either-sex period during this year's season.
IAge distribution of the kill: The age distribution of a segment of the 1960 harvest is shown in Table 1. This
••I
- 14
I

I Table 1. Age distribution of Roosevelt elk kill - 1960.
I•• No. of Jaws
Age Represented Per Cent
I 0.5 years 2 4
I 1. 5 years 20 39
2.5 years 10 20
I 3.5 years 6 12
I 4.5 years 1 2
Over 4.5 years 12 23
I 51
" I
Table 2. Comparison of age distribution of female elk kills, 1959*- 1960.
I 1959 1960 No. of Jaws No. of Jaws
Age Per Cent Represented Per Cent Represe!'ted
I 0.5 years 5 1
I l.) years 0 0 26 5
2.5 years 27 3 11 2
I 3. 'j years 18 2 11 2
I r:: ,.4.5+ years ::> ::> 6 47 9
11 19
I * Tonki Cape area only.
I
•• - 15
I

I distribution is based on a sample of 51 elk jaws collected during the season for aging purposes. Of the 51 jaws collected, 19 were from females, 27 from males, and 5 from ••Iunidentified animals.
Female age distribution: A sample of lg female elk Jaws was collected during 1960. Age ratios of female elk I represented in the kill are shown in Table 2.
Female age ratios were found to be unlike the male ra I tios in that 47 per cent of the female sample was represented by the 4.5+ year class while this same year class for the male segment was only 8 per cent of the total. In 1959, the first I year female animals were legally harvested on a limited basis, the 4.S+ year class represented 55 per cent of the total for this sex and 34 per cent for males. I
Although the jaw samples collected during 1959 and 1960 are small and the reliability of the samples may be questioned, I all available data point to an existing differential age ratio between male and female segments of the population. A contributory factor has been the harvest of males for a period I of nine years and females for only two years and one of these years on a limited basis only. 91
Further data will be needed before any elaboration on this point can be made. I
Male age distribution: The age distribution of a sample of the male elk killed during the 1960 season is presented in Table 3. Of particular interest is the high percentage of I 1.5 year class animals in the sample. The proportion of young males in the kill has shown a marked increase from the 1958 level while the percentage of old animals (4.5+ year class) I has exhibited a marked decrease over the same period. This is evidenced by data presented in Table 4. Prior to 1958 few l.S year class males occurredin the harvest as the season I was opened for forked-horned animals or better. The large percentage of 1.5 year class animals recorded in the kill since 1957 may reflect the following factors: (1) the pre I sence of a large number of young animals in the population as a whole, (2) a high amount of selectivity of young animals on the part of local elk hunters, or (3) a combination of I points 1 and 2. The high percentage of old females in the
••I
- 16
I

- - - -.e - - - - - - - - - - - --e -Table 3. Distribution of 1960 elk harvest.
BULLS cows CALVES UNIDENTIFIED TOTAL KILL Number Per Cent Number Per Cent Number Per Cent Number Per Cent 1960
68 54 43 34 2 2 14 11 127
Table 4. Comparison of age distribution of male elk kills, 1956 - 1960.
1956 1957 1958 1959 1960 No. of Jaws No. of Jaws No. of Jaws No. of Jaws No. of Jaws
Age ReEresented % ReEresented % ReEresented % ReEresented % ReEresented-~
0.5 years 4 1
1--' LS years 3 1 27 10 43 19 30 14 48 13 '1
2.5 years 28 8 11 4 23 10 19 9 30 8
3.5 years 14 4 19 7 16 7 17 8 11 3
4.5+ years 55 16 43 16 18 8 34 16 8 2
TOTALS 29 37 44 47 27

I 1959 and 1960 kills suggests that hunters preferring young animals have difficulty selecting young cows from old cows. ••IDistribution of kill.by area: The distribution of the kill by area is shown in ·rable '5. The Lower Raspberry Straits and Afognak areas received the heaviest kill during the 1960 season. This was desirable as these two areas I were lightly harvested in 1959. The Tonki Cape area which supports an estimated elk population of between 150 and 200 head accounted for only 14 per cent of the 1960 harvest. IThis area continues to be under-harvested even with a liberal either-sex season of 57 days. In 1959 the cow elk season on Tonki was a special incentive to hunters and of the 33 I animals killed, 16 were cows. This :year only 18 elk were harvested in this area, 12 of which were bulls, and 6 were cows.
Chronological distribution of the kill: The distribution of the kill by five day periods is shown in Figure 1. In previous years the heaviest hunting pressure occurred during the early portion of the season and then slacked off. During 1960 the greater portion of the total harvest (37 per cent of the total kill) occurred during the last 5 days of the general season. At this time animals of either sex were legal. During the 15-day exte:r'\tion to the either-sex season, 11 u.r1 imals or 10 per cent of the total were added to the kil].
Hunter harvest - 19$0: Approximately 345 hunters harvested 127 elk for a success ratio of 37 per cent. A number of hunters from Anchorage and other Alaskan points participated in the hunt.
It is evident in Table 6 that the number of hunters participating in the pursuit of elk has stabilized during the last three years. tf this number does not increase within the near future it will be difficult to achieve adequate huntin•J pressure to properly harvest and control the elk populations of Raspberry and Afognak Islands.
Weather conditions this year hunter. Had there been some snow elk off the mountain tops, perhaps have been accomplished.
- 18
were excellent for the in the high areas to drive
a greater harvest might
I I I
I I I I I I I
•• I

••
44
I
Table 5. Distribution of elk kill by area, 1958 - 1950.
I•• I I I I I I
I I I I I I I
I
Area Killed
Raspberry Island
Afognak Island Malina Area Lower Raspberry Straits Tonki Cape
Area Killed
Raspberry Island
Afognak Island Malina Area Upper Raspberry Straits Lower Raspberry Straits Tonki Cape
Area Killed
Raspberry Island
Afognak Island Malina Area Lower Raspberry Straits Afognak Lake Area Tonki Cape
1958
Number Represented
44
14 31 1Q
Total 99
Number Represented
17
38 22 10
__ll. Total 120
1960
Number Represented
23
24 34 28
_Jg Total 127
- 19
Per Cent
14 31 10
Per Cent
14
32 18
8 28
Per Cent
18
19 27 22 14

Per Cent of Kill
I-' I-' N N w w ~ \)1 0 Vi 0 Ul 0 Ul 0
1-xj I-'·
u:::i c
Aug. 20-25 15.3 Ii ([)
I-'
Aug. 26-31 o.o .
9 Ii
Sept. 1-5 9.0 0 ::::1 0 I-' 0
Sept. 6-10 7.2 ..a I-'· ()
Ill N I-' 0 Sept. 11-15 1.8 a.
I-'· (/J
rt Sept. 16-20 8.2 Ii
I-'· tr' c rt
Sept. 21-25 11. 7 I-'· 0 !:l 0
Sept. 26-30 36.9 Hi
([) I-'
Oct. 1-5 A'
A' I-'· I-'
Oct. 6-10 I-'
I-'
"°Oct. 11-15 2.7 O'o 0.
- -- - ---··- - - - - - - - -

••
••
I
Table 6. Roosevelt elk kills, 1950 - 1960.
I Per Cent
Year Kill Number of Hunters Hunter Success
I 1950* 27 50 54
I 1951 0 0 0
1952* 15 35 43
I 1953* 19 40 48
I 1954 0 0 0
1955 26 105 25
I 1956 40 135 30
I 1957 70 250 28
19 1958 111 345 32
1959 120 330 36
I 1960 127 345 37
Hunting by permit only.I *
I I I I I
- 21
I

I It had been hoped that the additional 15 day extension
to the season would accomplish the desired harvest of 150 ••Ianimals. This extension coupled with the regular season provided for the taking of animals of either sex over a 20 day period.
IPhysical condition of elk: Data concerning the physical condition, weights, and measurements of elk are incomplete, and will be presented in a later report. I RECOMMENDATIONS:
IEvery effort should be made to increase the hunter harvest of elk in order to maintain the present high degree of productivity and to insure a proper balance between Ipopulations and their available ranges. As has been true with other species of Alaska wildlife, sufficient numbers of hunters are not available to adequately harvest existing Ipopulations of elk on Afognak and Raspberry Islands. The continued liberalization of either-sex harvesting and the manipulation of seasons appear in the light of present Imanagement problems, to be the best techniques available to properly harvest existing herds.
91 PREPARED BY: APPROVED BY: I
I Ronald F. Batchelor David R. Klein Game Biologist P-R Coordinator INovember 23, 1960
I James W. Brooks, Director I Division of Game
I
- 22 ••I
I

••
I
.. Report No.L-2
I ANNUAL REPORT OF PROGRESS INVESTIGATIONS PROJECT
I COMPLETION OF 1960-1961 SEGMENT
I State: Alas1'..a
I Project No: W-6-R-2 Name: Alaska Wildlife
Investigations
Work Plan: L Wildlife Data
I Collections
Job No: 2 Title: Bison Management
I Investigations
I PERIOD COVERED: November l, 1960 to March 30, 1961
ABSTRACT:
II An aerial census of the Gig Delta bison herd conducted
on November 16, 17 and 20, 1960 revealed 318 animals. The
I herd is estimated at 350 animals. Calves comprised 12 per cent of the herd. Approximately 55 per cent of the Delta herd frequent U1e Clearwilter homestead area in the fall.
I Depredations by the Delta herd caused a~ estimated loss of $12,730 in 1S60. The loss for the past 10 years is esti
I mated at $33,480.
Twenty-nine bison were counted during the aerial census of the Nabesna herd. This ~herd is estimated to contain at
I least 50 animals. The Nabesna herd has moved from the original pl~cement site near Nabesna to the Copper River between
I Copper Center and Chitinu_. There has been no property damage ca·u sed by the Nabesna herd.
I OP.,JECTIVES:
I To determine current size and population structure of
the Biy Della and Nabesna herds. To determine herd distribution and movements during tho year. To determine extent of property damage to homesteads, rural communities and govern
- 23
I
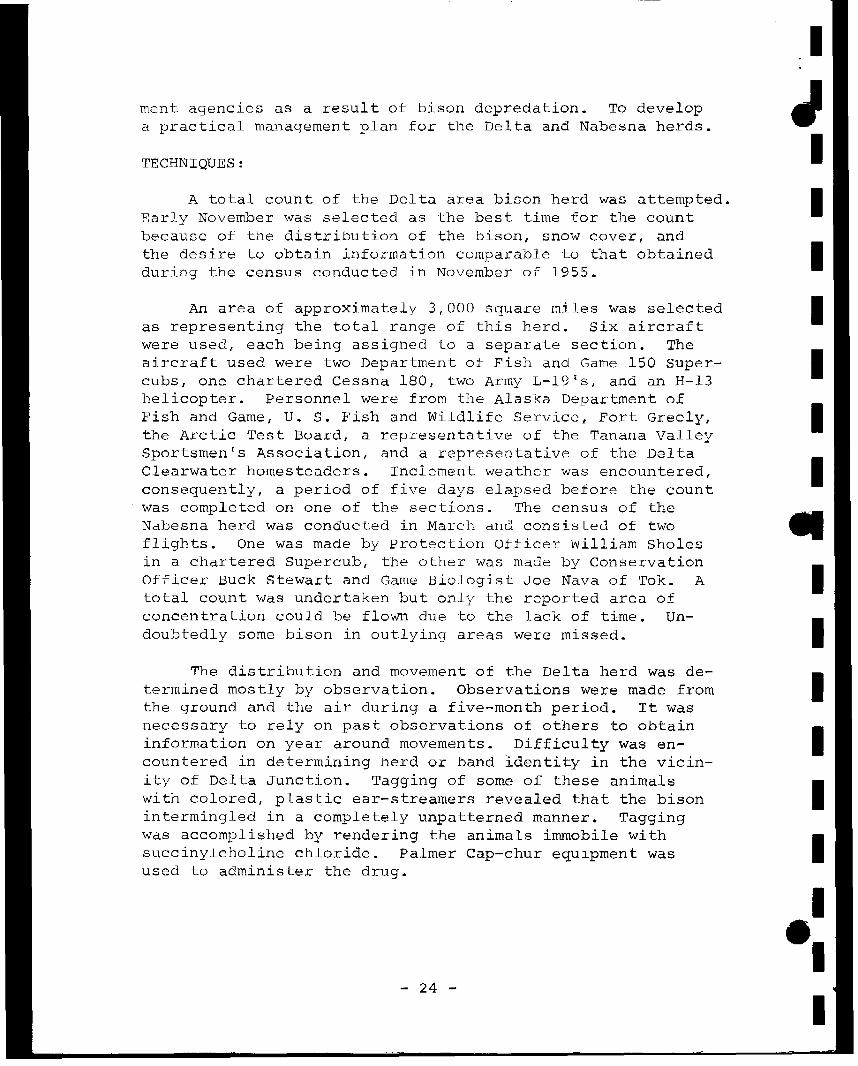
I ment agencies as a result of bison depredation. To develop Ja practical management plan for the Delta and Nabesna herds.
ITECHNIQUES:
A total count of the Delta area bison herd was attempted. IEarly November was selected as the best time for the count because of the distribution of the bison, snow cover, and the desire to obtain information comparable to that obtained Iduring the census conducted in November of 1955.
An area of approximately 3,000 square miles was selected Ias representing the total range of this herd. Six aircraft were used, each being assigned to a separate section. The aircraft used were two Department of Fish and Game 150 Super Icubs, one chartered Cessna 180, two Army L-19 1 s, and an H-13 helicopter. Personnel were from the Alaska Department of Fish and Game, u. S. Fish and Wildlife Service, Fort Greely, Ithe Arctic Test Board, a representative of the Tanana Valley Sportsmen's Association, and a representative of the Delta Clearwater homesteaders. Inclement weather was encountered, Iconsequently, a period of five days elapsed before the count was completed on one of the sections. The census of the Nabesna herd was conducted in March and consisted of two flights. One was made by Protection Officer William Sholes •in a chartered Supercub, the other was made by Conservation Officer Buck Stewart and Game Biologist Joe Nava of Tok. A Itotal count was undertaken but only the reported area of concentration could be flown due to the lack of time. Undoubtedly some bison in outlying areas were missed. I
The distribution and movement of the Delta herd was determined mostly by observation. Observations were made from Ithe ground and the air during a five-month period. It was necessary to rely on past observations of others to obtain information on year around movements. Difficulty was en Icountered in determining herd or band identity in the vicinity of Delta Junction. Tagging of some of these animals with colored, plastic ear-streamers revealed that the bison I intermingled in a completely unpatterned manner. Tagging was accomplished by rendering the animals immobile with succinylcholine chloride. Palmer Cap-chur equipment was I used to administer the drug.
I eI
- 24
I

.. I I I I I I I II I I I I I I I eI I
The movement of the Nabesna herd was determined by interview since observation time in the area was limited.
The amount of property damage due to bison depredations was determined mostly by interview. One observation trip was made to the Clearwater homestead area by the Project Supervisor and Conseravtion Officer Buck Stewart in September of 1960. Agencies and individuals contacted concerning bison depredations are as follows: the U. S. Army post at Fort Greely, the Federal Aviation Agency at Delta Junction, Delta Junction residents, and Delta Clearwater homesteaders. In addition, a notice was run in the local newspaper requesting information regarding other possible bison depredations.
FINDINGS:
Census
Delta Herd
Data from the aerial census conducted on November 16 through 20_, 1961, when combined with information on bison inhabiting adjoining areas not an estimated population of 352 blanket of snow created ideal This snow greatly enhanced the
surveyed at that time revealed bison (Table 1). The fresh
conditions for the count. success of the count, enabling
observers to distinguish between fresh and old tracks and accentuated tlw contrast between the dark bison and the white bacizground. Fresh bison tracks were seen and recorded in area six (Figure 1). The animals were in dense white spruce and were not sighted. I believe, when considering the sighting conditions and intensive coverage, that not more than five to ten per cent of the herd inhabiting the area surveyed could have be2n missed. Possibly a few lone animals or small bands resting in or traveling through spruce forest were missed.
Nabesna Herd
Twenty-nine bison were located in a partial survey of the Nabesna Herd. As this herd, which apparently winters on the northeast bank of the Copper River between the Dadina River and Chetaslina River, has scattered over many hundreds
- 25

- - - - - - - - - - - -
TABLE l. DELTA BISON CENSUS, 1960
HOURS TOTAL CALVES AREA DATE PILOT AND OBSERVER FLOWN BISON SEEN SEEN
l 11-16-60 Grundman & Stewart 2.0 0 2 11-16-60 Norton & Nava 3.0 0 3 11-16-60 Lanni & Hortman 1.3 0 4* 11-16-60 Sherbert & Pinkham 4.5 42 ? 5 11-16-60 Jones & Mathis ? 4 ? 6**# 11-16-60 Bentley & Rausch 3.9 54 3 7 11-17-60 Lanni & Pinkham ? 6 ? 9 11-17-60 Lanni & Pinkham ? 0 5 11-17-60 Jones & Nava 3.0 52 8 6 11-19-60 Bentley & Nava . 5 19 2
N 6 11-20-60 Bentley & Nava 1.1 78 15 VI 8*** 11-20-60 Bentley & Nava 1.1 0
TOTALS 20.4+ 255 28 or 12%
Actual observations from the air 255 Tracks estimated by Bentley & Rausch 15 Bison observed south of census area 4 4 Bison observed in area 4 by Bentley & Nava 44 Bison observed by sawmill workers 34
Total estimated population 352
* Four bison seen south of the census area on this date. ** Tracks seen indicated about 15 additional bison. *** Forty-four bison seen in area 4 on this date. These were counted as additional
animals. # Thirty-four bison were seen by sawmill workers in a wooded section of this area
where none had been seen from the ai~.
e .. - - -'-

- - - -e 'I ..
FIGURE l. NOVEMBER 1960 BISON CENSUS - DELTA HERD
Area 8 (O) N
Goodpaster Flats
Area 3 Area 2 9 ( 0}
(O) (O)
f...i QJ;:,
N ·.-.i -...] Ct; Naly
Lake
\-\
Area l Q) '?
( O) ..-\. Area 7 Area 5
(i. (6)
(56)
c;J Lake George
~ ( ) = Bison observed
Scale inch = 10 miles

I of square miles it was not practical to attempt complete coverage of the entire potential range. Additional information J regarding- bison numbers was obtained from local pilots. One pilot reported seeing 36 at one time. This cannot be con I sidered a complete count but it would appear that this herd consists of approximately 50 bison. Aerial census in the Copper River area is particularly difficult because of the I mature spruce forest.
I Movements
Delta Herd I The Delta herd exhibits definite seasonal movement pat
terns. The more purposeful movements include their annual I trek to the calving grounds along the Delta River, their late summer-fall movement to the breeding grounds around the old corral, and their winter dispersal between the Bir;f Del ta I and Gerstle Rivers (Figure 2). More detailed observations will perhaps reveal additional distributional characteristics of this herd. Of particular interest to the present study I are the late summer-fall and winter movements for it is these movements that bring the bison into conflict with civilization.
Apparently the late summer movement signals the approaching breeding season, which is reported to take place in the I vicinity of the old corral. TLis movement involves the entire herd with the exception of possible non-breeding (senile?) males, and the population segment inhabiting the Gerstle River I Healy Lake area. Concurrent with the rut and following it the bison forage in the adjoining grain and hay fields -c.leaning up both before and after harvest. This feeding I activity continues into early winter. The November count and subsequent information revealed that 200 (55 per cent) of the herd was in area 6 in 1961 (Figure 1). similar informa I tion for 1955 reveals only about 33 per cent of the total herd in this area. The significance, if any, of this change in distribution is not known but may rcf lect attraction to I the additional food stuffs created by the homesteading activities. I
••I
- 28
I

- - - - - - - - - • - - - - - - -,,- ..e FIGURE 2. AN~UAL MOVE!'v1EC-JT OF DELTA HERD OF BISON
•
\ \
\ N \. ".[) I \
\
I I
I J
I I
I I
Scale - l inch approx. 10 miles
H (])
>·.-! 0::
ro -1-1 .-I ([) Q
(]J ...-1
N
6
1111
I I
I I
\
\.
'
Big
........... -
Spring and Summer Concentration (Calving
Area)1 Concentration
' ' ' \.
' -
Area
\
- ......... _'"-_ -
.....
\ \
I>J=~~
Cl
Lake
/ /'
/ ;
/-(Depredation Area)
----••• Fall Movement Total Winter Range

I Ear-tagging and marking were used irt an attempt to de
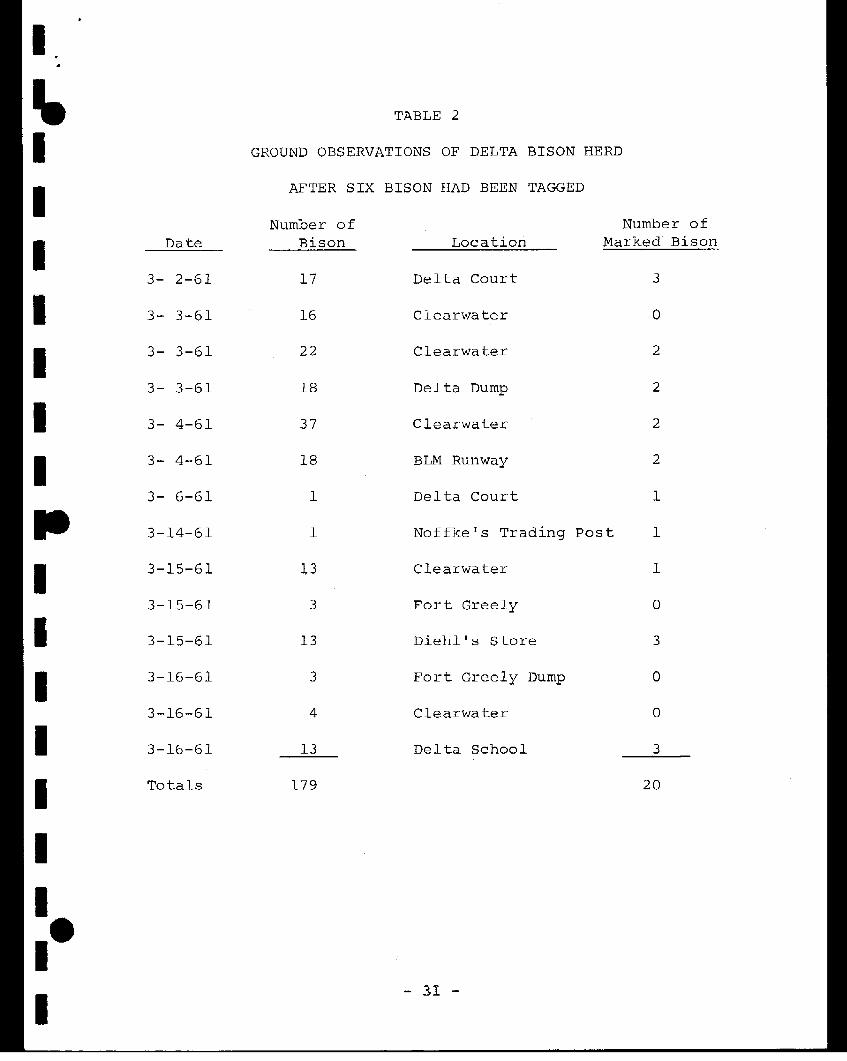
termine the numbers of bison inhabiting the Delta Junction J area during the winter. When approximately 2 per cent of the total estimated herd was marked, observations in March I included 11 per cent marked animals. This possibly indicates that only 16 per cent of the herd frequented this area during March (Table 2). Most of these animals were cows and I calves (Table 3). The remainder of the herd was spread out over the rest of the range, mostly to the east and south of Delta Junction. By late winter some of the animals had I wandered south and east as far as Craig Lake near the Johnston River. I Nabesna Herd
Seasonal movement patterns, if any, of the Nabesna I bison herd were not determined in this study. Past movements of this herd have been extensive. The herd has moved from the area in which it was released and now in I habits the Copper River valley between Copper Center and Chitina (Figure 3). This segment of the Nabesna herd grazes mainly on the northeast side of the river between the Dadina I River and Lower Tonsina. Local residents report the calving grounds to be on the Copper River bar just northeast of Lower Tonsina (Figure 3) • The bison of this herd seemingly dispersed quite widely and they have been reported from the following areas: Tazlina Lake, Tazlina Lodge, Hanagita River and Lake, Dadina-Chetaslina-East Fork and Cheshnina I Rivers.
IDepredations
Delta Herd I Total estimated losses through depredations of the Delta
bison herd was $12,730 in 1960. years is estimated at $33,480. in damage to automobiles due to total loss to homesteaders was constitutes the largest loss in cluded hay, oats, peas, barley,
The loss for the past 10 This does not include $6,120 I collision with bison. The
estimated at $10,480, this the area. and brome
figure was arrived at by the homesteaders to some bias. The homesteaders crops were
- 30
ITheir losses ingrass. The monetary and may be subject not fenced. Some I
••I
I
I
.. TABLE 2
I GROUND OBSERVATIONS OF DELTA BISON HERD
AFTER SIX BISON HAD BEEN TAGGED
I Number of Number of
Date Bison Location Marked Bison
I 3- 2-61 17 Delta Court 3
I 3- 3-61 16 Clearwater 0
I 3- 3-61 22 Clearwater 2
3- 3-61 18 Delta Dump 2
I 3- 4-61 37 Clearwater 2
I 3- 4-61 18 BLM Runway 2
3- 6-61 l Delta Court l
II 3-14-61 1 Noffke's Trading Post l
I 3-15-61 13 Clearwater l
I
3-15-61 3 Fort Greely 0
I 3-15-61 13 Diehl ' s Store 3
3-16-61 3 Fort Greely Dump 0
3-16-61 4 Clearwater 0
I 3-16-61 13 Delta School 3
I Totals 179 20
I I
•• - 31
I

I TABLE 3
" SEX AND AGE OF OBSERVED BISON OF THE DELTA HERD
INumber of Number of NumberDate Bison Seen Calves Adult Bulls
12- 6-60 17 I
2 l12 -8-60 9 0 I1 12-16-60 14 3 012-17-60 2 0 012-19-60 6 ? I0 12-22-60 1 0 112-30-60 15 4 01- 3-61 20 0 Il 1- 4-61 27 1 01- 5-61 30 21- 8-61 11 1
0 01-19-61 21 ? I?1-20-61 26 3 31-21-61 8 0 01-23-61 16 6 024-61 10 ? ?1-28-61 l 0 l3- 2-61 17 4 03- 3 1 56 21 03- 4-61 55 21 03- 6-61 11 0 13-14-61 l 0 l3-15-61 29 11 03-16-61 20 5
Totals 408 86 or 2 10 or 2%; 504 I
I I I
- 32 ••I
I
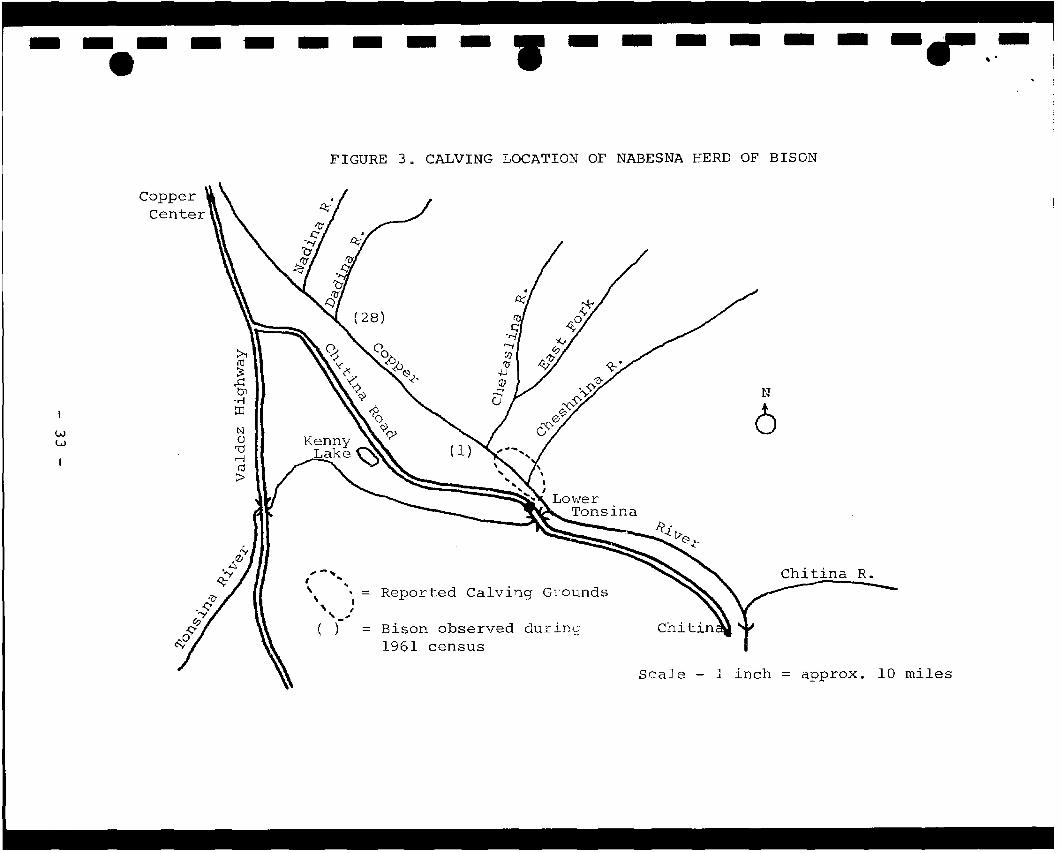
- - - - ·e - - • .. FIGURE 3. CALVING LOCATION OF NABESNA HERD OF BISON
>i ro ~
...c: bl N
·r-1
6::r: Nw
w QI '"d rl ro >
,- ..' .. ', = Reported Calving G~ounds ' (
1 ,' ,r = Bison observed during
1961 census
Scale - l inch = approx. 10 miles

I of the homesteaders plan to fence soon but most of them lack the time or money. The Federal Aviation Agency has erected Ja hurricane-type fence which successfully turns bison but improperly constructed cattle-guards were installed instead Iof gates and the bison still have free access to the area. Other monetary losses include $1,000 damage to lawns, shrubs and fences on Fort Greely; $1,000 damage to la~ms, gardens Iand incinerators at the Federal Aviation Agency; $200 damage to lawns and garbage cans at the Delta Trailer Court; $50 damage to a trapper in the form of garden and trapline damage. I Nabesna Herd
INo damage due to depredation by this herd could be found.
IManagement
Delta Herd I In 1928, 23 bison obtained from the National Bison Range,
Moise, Montana, were released in the Big Delta area. Initially, I from 1928 to the mid-1940 1 s, they increased at an average annual rate of 20 per cent (Figure 4). By the mid-1940's the population is reported to have numbered in excess of 500 anin,.al .> (records during the war years are absent) . The next •estimate, by U. S. Fish and Wildlife Service, was made in 1943 -- 325 animals were reported. This was a decrease of I 35 per cent from the previous estimate. The first systematic aerial survey was conducted in November 1955, when the population was estimated to be 265+ 10 (Table 4) • And, as pre I vicusly reported 318 - 352 were accounted for in Noven~er of 19C '). In a period of 32 years this herd apparently has exper iei1'.-::ed a peak population, a decline and a subsequent popu I lation increase, al though at the much reduced annual .- ate of 6 per cent.
I Management of the herd through hunting or other recrea
tional uses has been a minor factor in its history. Complete protection was afforded the herd from 1928 until 1950, prob I ably well after it had exceeded the carrying capacity of the range. In 1950, 1951, and 1952 permit hunts were held for the purpose of removing (senile?) bulls. Twenty-five adult I
I e - 34 - I
I

- - - - -- - - - - - - -e - .. - -,,- , ..FIGURE 4. CURVE OF DELTA BISON POPULATION
500
t::: 0 00
·rt a:i
w 4-1Ul 0
\..I (I)
~ ::I z
I 50~
~ 400
""' """ ~ y ~2 ~300
I ............... v
/ ~ ¥
-200
/
v 100 /
/ .~.
1928 30 32 34 36 38 40 42 44 46 48 50 52 54 56 58 60 62
* 1950 - 45 removed by hunting and transplant 1951 - 31 removed by hunting and transplant 1952 - 25 removed by hunting
** Segment prior to 1941 is based on the 1941 estimate of 500 + animals and must be considered only approximate.

TABLE 4
BISON CENSUSES (BIG DELTA HERD)
Year Total Per
J_~;·2s 23
;" 9<±0 IS 500*
1948 325**
1955 265+ 10
1960 352
* Estimated at 539 by John Hajdukovich,
** Fish and Wildlife Service estimate.
- 36
I
J I
cent Calves I I I
11.4
12.0 I I I
of Big Delta. 91 I I I I I I
••I
I
••
I •
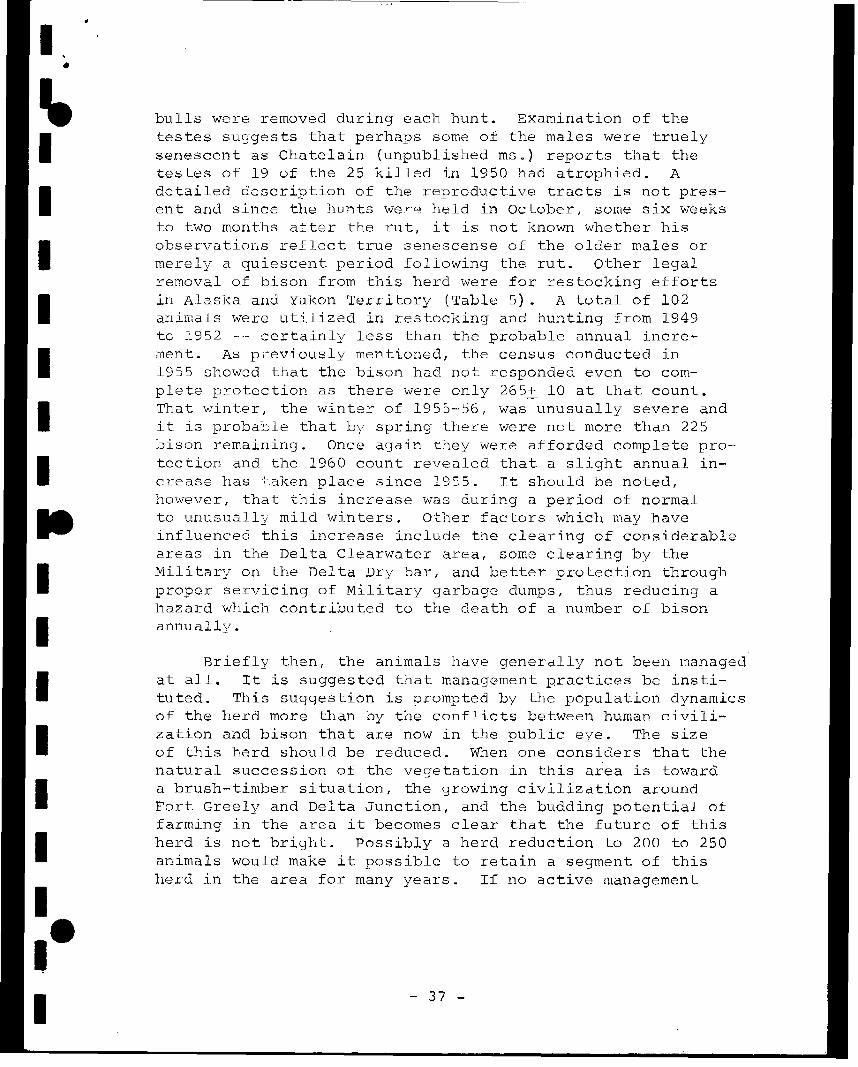
I .. bulls were removed during each hunt. Examination of the
testes suggests that perhaps some of the males were truely senescent as Chatelain (unpublished ms.) reports that the
I testes of 19 of the 25 killed in 1950 had atrophied. A detailed description of the reproductive tracts is not present and since the hunts wer~ held in October, some six weeks to two months a:'.::ter the rut, it is not known whether his
I observations reflect true senescense of the older males or merely a quiescent period following the rut. Other legal
I removal of bison from this herd were for restocking efforts in Alaska and Yukon 'Territory (Table 5). A total of 102 animals were utilized in restocking and hunting from 1949 to 1952 -- certainly less than the probable annual incre
I ment. As p.ceviously mentioned, the census conducted in 1955 showed that the bison had not responded even to com
I plete protection as there were only 265+ 10 at that count. That winter, the winter of 1955-56, was unusually severe and
I it is probable that by spring there were not more than 225 bison remaining. Once again they were afforded complete protection and the 1960 count revealed that a slight annual in
I
crease has taken place since 1955. It should be noted, however, that this increase was during a period of normal to unusually mild winters. Other factors which may have influenced this increase include the clearing of considerable areas in the Del ta Clearwater area, some clearing· by the Military on the Del ta Dry bar, and better protection through proper servicing of Military garbage dumps, thus reducing a
I hazard which contributed to the death of a number of bison annually.
I Briefly then, the animals have generally not been rnanag-ed
at all. It is suggested that management practices be insti
I tuted. This suggestion is prompted by the population dynamics of the herd more than by the conflicts between human civili zation and bison that are now in the public eye. The size
I of this herd should be reduced. When one considers that the natural succession of the vegetation in this area is toward a brush-timber situation, the growing civilization around Fort Greely and Delta Junction, and the budding potential of farming in the area it becomes clear that the future of this
I herd is not bright. Possibly a herd reduction to 200 to 250 animals would make it possible to retain a segment of this herd in the area for many years. If no active management
I
I - 37

I TABLE 5 J
BISON REMOVED FROM BIG DELTA HERD
I Year Males Females Total Reasons I 1949 1 l Predator control bait
I1950 5 12 17 Moved to Nabesna area
1950 l l Killed jncidental to trapping I 1950 25 2 27 Taken during the hunt
I1951 2 3 5 Moved to Yukon Territory
1951 24 l 25 Taken during the hunt I 1951 l l Killed incidental to trapping
I 1952 25 Taken during the hunt-1.L
Totals 83 19 102
I I I I I I
••I
- 38
I

1. -~ I
through recrea~ional uses is instituted, bison will continue to be a controversial resource of unrealized potential value.
Nabesna Herd
I In 1950, ~ males and 12 fema~es were transplanted from
I the Delta herd to the Nabesna area. These animals moved south to the Copper River and established themselves there. The herd has been protected completely. The available records do not show analysis of the range before or after the bison
I settled themselves in the Copper River Valley. In the future
I it is recommended that some basic analysis of the range potential in this area be undertaken. It is also recommended that a limited harvest be implemented in the 1962-63 fiscal year.
I RECOMMENDATIONS:
• I
Productivity studies of the Delta and Nabesna herds should be continued. A permit hunt for 100 - 150 bison should be held in the Delta Junction area in the fall of 1961. An annual harvest from the Nabesna herd of from five to ten animals should be implemented in 1962. A preliminary survey of the potential range of both the Big Delta and Nabesna herds should be undertaken. The Department of Fish and Game
I should request results of bison studies conducted by graduate student John Hogben (1953-1956).
I SUBMITTED BY:
I I Robert A. Rausch
Game Biologist
I I
APPROVED BY:
David R. Klein P-R Coordinator
Joseph A Nava, Jr. James W. Brooks, Director Game Biologist Division of GameI
•• I - 39