eliciting individual preferences for immigrants in the
TRANSCRIPT

1
Eliciting Individual Preferences for Immigrants in the Dominican Republic
Raul Jimenez M. *
(Draft May 2017)
Abstract
Immigration flows between low-income countries have increased sharply in recent
years, posing several challenges to national and foreign policy, as well as being a
subject of potential social turbulence. Along this process, and despite a growing
literature documenting the net welfare benefits of immigration, adverse policies and
public opinion appear to be as common in developing countries as in developed
countries. In such a context, understanding natives’ attitudes toward immigrants may
contribute to inform measures to smooth free human mobility. This paper presents the
results from two types of choice experiments in the Dominican Republic. The
experiments were designed to elicit individual preferences for immigrants’ attributes,
and to evaluate differences between choice settings that are “forced choice” and others
that allow for “neither option.” Overall, the findings indicate that education,
occupation, norm adherence, cultural resemblance, and country of origin have
substantial effects on the probability of immigrants obtaining support for admission
into the country. An interesting result is that foreigners from developed countries tend
to receive greater support for admission. At the same time, there is significant
heterogeneity in the estimations that is not explained by observable characteristics of
the respondent, suggesting that most heterogeneity is idiosyncratic. Regarding the two
different decision frameworks, the estimations indicate that allowing for the neither
option, arguably a more realistic setting, returns lower probability of admission.
Keywords: Immigration, Attitudes, Choice Experiments
JEL: F22, J61
* Department of Economics, University of Rome Tor Vergata, and Inter-American Development Bank, [email protected]. The findings, interpretations, and conclusions herein are strictly those of the author and should not be attributed in any manner to his affiliated institutions. All remaining errors are the author’s responsibility.

2
1. Introduction
Migration represents a topic of increasing interest in developing countries. Over the
past two decades, the stock of migrants has increased by more than 50 percent, from
154 million in 1990 to 232 million in 2013. During this process, flows between
developing countries have grown continuously to represent around 36 percent of the
total migrant stock (UN 2016). In the near future, this share is likely to grow further,
exposing many poor countries to a population influx for which they are unprepared,
risking political and social turbulence (Hanson and McIntosh 2016; Manning and Roy
2010). Examples of this turbulence have already been registered in countries such
Côte d’Ivoire and the Dominican Republic, where immigrants face adverse policies
for staying. Similarly, Distelhorst and Hou (2014) document the presence of
significant bias in the provision of public goods by origin of the beneficiary. Together
with recent political events in Europe and the United States, this situation shows not
only that immigration is a relevant and sensible topic in today’s national and foreign
policy, but also appears to reflect an unfavorable view toward free international
human mobility.
This general negative view has been documented in the literature, which suggests
that the explanation is that immigration tends to be perceived as an economic and
cultural threat (Facchini et al. 2008; Newman 2014; Blinder 2015; Bertoli et al. 2016).
Broadly, the factors that drive native opinions about immigrants may be divided into
economic and noneconomic. The former includes labor market and fiscal concerns;
noneconomic factors are norm adherence, national identity (i.e., religious beliefs,
language), and ethnicity. Hypotheses based on labor market factors assume that
citizens would tend to reject immigrants if they represented direct competition for
jobs. Similarly, it is postulated that fiscal considerations may explain why natives tend
to reject foreigners if they represent a greater tax burden through a greater use of
public services and social programs. For the noneconomic drivers, it is assumed that
greater norm adherence, greater identification with national culture, and similar
ethnicity tend to influence a favorable opinion on immigration. The empirical
literature finds support for these hypotheses, and emphasizes the role of cultural
factors in explaining opinions on immigration, as well as substantial heterogeneities
in those opinions across citizens with different characteristics (i.e., education, gender,

3
income) (e.g., Mayda 2006; Dustman and Preston 2007; Malchow-Møller 2008;
Facchini and Mayda 2012; Card et al. 2012; Ortega and Polavieja 2012).
However, a relevant observation is that these studies are mostly based on general
opinion surveys on immigration—not on individual immigrants. Therefore, such
studies only capture and examine the effects of impersonal attitudes. At the same time,
the studies are mainly based on administrative data. Thus, although the studies have
the advantage of evaluating cross-country samples, they generally restrict the
researchers to a few dimensions of analysis. Iyengar et. al. (2013) stress that the
distinction between studies focusing on attitudes toward individual immigrants and
group-level analyses on immigration is relevant, as the two approaches may
potentially lead to different conclusions with different implications for public policy.
Indeed, those findings, as well as the recent political winds, are in contrast with
the empirical evidence indicating that migration has had sizeable welfare net benefits
(Alesina et al. 2016; Akay et al, 2014; Chassamboulli and Palivos 2013; Peri 2012;).
This may suggest that noneconomic factors may play a dominant role in public
opinion. To reach a better understanding of what is in play, it is necessary to examine
individual natives’ attitudes toward individual immigrants. Hence, to investigate the
apparent disconnection between public opinion and the net contribution of
immigrants, a growing literature focuses on studying natives’ individual attitudes,
with the aim to identify the sources of opinions toward immigrants (Hainmueller and
Hiscox 2010; Aalberg et al. 2012; Iyengar et al. 2013; Hartman et al. 2014;
Hainmueller and Hopkins 2015; Wright et al. 2016). These studies are largely based
on survey and choice experiments, which allow manipulation of immigrants’
individual attributes to characterize citizens’ preferences for individual foreigners.
The findings of this stream of literature suggest important differences between
individual and public opinion. On the one hand, there is evidence that more educated
foreigners with skilled occupations tend to receive support. This finding aligns with
the evidence on the positive effects of immigration on overall welfare, but somewhat
contradicts the labor market competition hypothesis. On the other hand, violating
norms and having little cultural resemblance tend to reduce support for foreigners.
These findings are roughly homogeneous across different groups of natives,

4
suggesting that noneconomic factors and the composition of the immigrant stock in a
country drive public opinion and immigration policies.
In contrast with the growing immigrant flows between developing countries, to
date most of the literature studying drivers of attitudes toward immigrants has been
carried out in developed countries.1 Therefore, there is no evidence that previous
findings extend to different institutional, cultural, and ethnic contexts such as those in
developing countries. For example, social assistance, provision of public goods, and
fiscal contributions are markedly different in these countries. Further, in developing
countries, immigration control tends to be lax, and assimilation policy is scarce or
nonexistent, requiring a specific analysis (OECD 2011).
This paper attempts to contribute to fill this gap by studying attitude formation
toward individual immigrants in a developing country. To that end, I designed choice
experiments (CEs) to evaluate the effect of 10 attributes of immigrants on the
probability of obtaining citizen support for admission. The estimation methodology
allows for heterogeneous preferences among respondents, as well as the examination
of drivers of such variance. Further, to examine the effects of different decision
settings, I designed two types of CE: forced choice, and with the neither option.
The study took place in the Dominican Republic, where around 5.4 percent of the
total population is foreign born. Although this share is less than half the proportion of
immigrants in the United States (13 percent), the immigrant situation in the
Dominican Republic is receiving significant attention from the authorities, the public,
and the international community, constituting a source of considerable contemporary
angst. Recently, the Dominican government launched several measures on
immigration, including the implementation of the first Immigration Law (in 2011),
the first national survey of immigrants (in 2012), and the plan to regularize immigrants
(in 2014-15). In particular, the immigrant regularization measure received
international attention, as it involved deporting around 14,000 people, affecting
mainly the poorest immigrant group in the country, Haitians.2
1 For example, Hainmueller and Hiscox (2010), Hartman et al. (2014), and Hainmueller and Hopkins (2015) study the United States. Aalberg et al. (2012) study Norway. Iyengar et al. (2013) study Norway, the Republic of Korea, Japan, the United States, Canada, the United Kingdom, and Australia. 2 http://fpif.org/really-happening-dominican-republic-deporting-haitian-residents.

5
I designed an original survey and administered it to approximately 2,500 citizens
to collect stated preferences data on immigrant profiles. The choice experiment
applied repeated choice situations per respondent, returning a panel data structure.
The survey also collected detailed information on a range of demographic, social, and
economic characteristics of the respondents, as well as time spent per CE, which
allowed for control of potential confounding factors.
Overall, and aligned with the literature, the findings of this study indicate that
foreigners with higher education, skilled jobs, norm adherence, and national
resemblance are preferred for admission. The gender of the immigrant is not relevant.
An interesting finding is that foreigners from developed countries, with different
ethnicity, tend to receive a premium in the probability of acceptance. Such premium
is not observed for immigrants from other Latin American countries; moreover, a
penalty is observed for immigrants from Haiti. The estimated preference weights
among natives are shown to be heterogeneous, but they do not seem to be
systematically driven by the education, income level, or gender of the respondent,
suggesting that such variability is mostly based on natives’ tastes or idiosyncratic
preferences. Although these results are similar between experiments, with and without
the neither option, it is observed that the latter returns a lower probability of
acceptance, a finding that appears to reflect native preferences. Another difference
between the experiments is that labor experience is only statistically significant when
the neither option is available, suggesting that more information on the candidate is
relevant in a more stringent decision setting.
To my knowledge, this is the first stated preferences experiment extending to
developing countries the study of attitudes toward individual immigrants. In contrast
to previous studies, this work also contributes to the literature by applying
experiments that include a broader set of immigrant attributes, as well as comparing
findings between choice settings with the neither option and forced choice. The
theoretical framework and estimation methodology allow for heterogeneity in
preferences, and for testing whether such heterogeneity is driven by observable
characteristics of the respondent. Other studies evaluating attitudes toward individual
immigrants mostly apply linear estimation methods, testing homogeneity in attitudes
by applying regressions in subsamples of respondents with different characteristics.

6
This approach restricts testing multiple native characteristics at the same time, and
does not allow for evaluation of heterogeneity in attitudes by attributes among the
native population.
The next section presents a background on the case study. Section 3 outlines the
empirical approach to estimate the preference weights for immigrant attributes.
Section 4 describes the sampling frame and data collection. Section 5 presents the
main results, and a set of robustness regressions. Section 6 provides the conclusion
and discussion.
2. Background on the Case Study
The Dominican Republic is a Caribbean country with per capita gross domestic
product of around US$5,879 (2013).3 The main ethnic groups are mixed-Afro
descendant, at 73 percent of the total population, followed by white, 16 percent, and
black, 11 percent. The main religious group is Roman Catholic, 95 percent.4
Immigrants in the country represent around 5.4 percent of the total population a
share that has been stable over the past few decades. Table 1 shows some descriptive
statistics on the foreign-born population in the country. It is notable that 87 percent of
the country’s immigrants are from Haiti, the poorest country in the Latin America and
the Caribbean region, with income per capita about one-seventh that of the Dominican
Republic. The rest of the countries with a relevant immigrant presence in the
Dominican Republic are the United States (2.6 percent), Spain (1.3 percent), Italy (0.8
percent), China (0.7 percent), and Venezuela (0.7 percent), among others. In general,
the immigrant population is relatively young with a low level of formal education.
Around 50 percent of immigrants in the country are younger than 35 years, and 67
percent have only basic education (primary education). Approximately 50 percent of
foreigners have some degree of problem speaking Spanish.
The population share of immigrants in the Dominican Republic is modest, for
example, representing less than half that of the United States (14.5 percent) or Canada
3 In nominal current terms, according to the World Development Indicators database. 4 Information on ethnic groups and religion is from the CIA World Factbook.
7
(21.8 percent)5. However, due to geographic proximity, the country represents one of
the main worldwide destinations for immigrants from Haiti. As of 2015, it is estimated
that around 33 percent of total Haitians living abroad are in the Dominican Republic.6
At the same time, the immigrant situation in the Dominican Republic constitutes a
source of considerable contemporary angst, receiving great attention from the policy
authorities and the international community. In recent years, the government has taken
several measures specifically aimed to address the legal situation of foreigners in the
country. In late 2011, the government enacted the first Immigration Law. During
2012, the national statistical agency launched the first national survey of immigrants.
In 2014, the government launched a program for regularizing foreigners (Plan
Nacional de Regularizacion de Extranjeros), which raised several critics in the media,
as the program could lead to the deportation of a significant number of foreigners,
mainly Haitians.7
The media’s concerns about Haitians in the Dominican Republic may also be
explained by the long history between the two countries. Two events capture some
distinctive historical milestones. First, in the mid-1800s, the Dominican Republic won
a war of independence from Haiti, which was followed by a series of Haitian attempts
to regain control of the Dominican territory. Second, in 1937, under the rule of dictator
Rafael Trujillo, the Dominican Army was ordered to massacre Haitian immigrants, in
what it is known as the Parsley Massacre.8
3. Methodology
To study people’s attitudes toward immigrants’ attributes, I applied CEs. This
approach presents the survey respondents with hypothetical choice situations
5 UN (2016). 6 The United States represents the main destination country, concentrating 48 percent of Haitians (UN 2016). 7 See for example, media coverage in: http://www.bbc.com/mundo/noticias/2015/07/150730_americalatina_republica_dominicana_haitianos_lav; http://www.takepart.com/feature/2016/03/11/haiti-deported-dominican-republic. 8 https://www.washingtonpost.com/news/worldviews/wp/2015/06/16/the-bloody-origins-of-the-dominican-republics-ethnic-cleansing-of-haitians/?utm_term=.b2e250324afa; https://www.ncas.rutgers.edu/center-study-genocide-conflict-resolution-and-human-rights/dominican-republic-and-parsley-massacre-1937; and https://muse.jhu.edu/article/12744.
8
containing several immigrant profiles, from which the respondents have to choose a
type of immigrant supported for admission into the country. This section presents the
conceptual framework for modeling the respondent decisions, estimation method, and
experimental design.
3.1 Conceptual Framework
The decisions on which immigrant profile to admit can be framed within the standard
random utility maximization model. In this setup, citizens’ preferences for different
types of immigrants can be expressed as
𝑈𝑖,𝑗 = 𝑉(𝑋𝑗, 𝛼𝑖) + 𝜀𝑖,𝑗 (1)
In equation 1, the utility, 𝑈, that citizen 𝑖 obtains from candidate 𝑗 depends on an
observable set of candidate attributes, 𝑋, such as education, country of origin, and so
forth, given the respondent’s preferences, 𝛼, and a stochastic component, 𝜀𝑖,𝑗. Since
utility is not observed, this framework implies that respondents' decisions reveal the
preferred profiles under the following rule:
𝑌𝑖,𝑗 = {1, 𝑈𝑖,𝑗 > 𝑈𝑖,𝑔 𝑓𝑜𝑟 𝑎𝑙𝑙 𝑗 ≠ 𝑔
0, 𝑜𝑡ℎ𝑒𝑟𝑤𝑖𝑠𝑒
𝑖 = 1, … , 𝑛 ; 𝑗 = 1, . . , 𝐽
(2)
where 𝑌 takes the value 1 if candidate 𝑗 is selected, and therefore preferred to 𝑔, and
zero otherwise. In general, this setup allows for the inclusion of a “neither” option. In
this case, to admit a given immigrant profile, the respondent’s derived utility must be
not only greater than other profiles in the same choice set, but also greater than a given
utility threshold. In decision settings such as this, in which foreigners are evaluated
for allowing them into the country, the neither option is realistic and may allow for
elucidating general attitudes toward immigration. For example, in general, if residents
do not desire to have immigrants enter the country, then a high rate of selection of the
status quo option would elicit this information.
By assuming additivity and linearity in the specification of 𝑉(∙), and allowing the
parameters to depend on the respondents’ characteristics, we have

9
𝑈𝑖,𝑠,𝑗 = 𝑋′𝑠,𝑗𝛼𝑖 + 𝜀𝑖,𝑠,𝑗
𝛼𝑖,𝑘 = 𝛼0 + 𝑊𝑖𝛽𝑘 + 𝜎𝑘𝑢𝑖𝑘 , 𝑘 = 1, … , 𝐾
(3)
I introduce the sub-index 𝑠 to indicate a given choice situation. That is, similar to a
panel data structure, applying multiple choice sets per respondent provides more
observations and greater variability to estimate parameters per respondent. In equation
3, the utility of each profile depends on a set of observable immigrant attributes (𝑋)
and a stochastic component (𝜀).
The parameters, 𝛼𝑖,𝑘, represent native 𝑖’s preference weight for the 𝑘 immigrant
attributes. In this framework, this parameter is composed of a constant, 𝛼0; a linear
function of observable respondent characteristics, 𝑊𝑖𝛽𝑘; and a random component,
𝜎𝑘𝑢𝑖𝑘. Notice, 𝛼0 and 𝛽𝑘 are common for all respondents such that, for example, a
change in the education level is assumed to have the same effect on the preference
weight for all respondents. The population mean of each parameter is composed of
𝛼0 + 𝑊𝑖𝛽𝑘, such that all variability in this mean parameter comes from observable
characteristics. The idiosyncratic component of individual preferences is captured
here by a random variable, 𝜇𝑖,𝑘, and 𝜎𝑘 is the standard deviation of the parameter 𝛽𝑛𝑘
around the population mean.
3.2 Estimation
Under this framework, the probability of selecting a foreigner candidate into the
country is given by
𝑃(𝑌𝑖𝑠𝑗 = 1|𝛼) = 𝑃[𝑈𝑖𝑠𝑗 > 𝑈𝑖𝑠𝑔]
= 𝑃[𝜀𝑖𝑠𝑗 − 𝜀𝑖𝑠𝑔 < (𝑋′𝑠𝑗 − 𝑋′𝑠𝑔)𝛼]
(4)
Assuming that 𝜀 is independent and identically distributed extreme value, 𝜀𝑖𝑠𝑗∗ =
𝜀𝑖,𝑠,𝑗 − 𝜀𝑖,𝑠,𝑔 follows a logistic distribution, and the probability can be expressed as:
𝑃(𝑌𝑖𝑠𝑗 = 1|𝒖𝑖) =exp(𝑋′𝑠,𝑗𝛼)
∑ exp(𝑋′𝑠,𝑗𝛼)𝑗
(5)
Equation 5 represents the probability evaluated at parameters 𝛼. These parameters
are defined by equation 3 (𝛼𝑖 = 𝛼0 + 𝑊𝑖𝛽 + 𝜎𝑢𝑖), which requires specifying the

10
distribution of the random component of the parameter. This gives a mixed logit
probability, which is a weighted average of the logit formula evaluated at different
values of the parameters, where each parameter could have a different distribution
(Train 2009). In applications of discrete choice models, assumptions on the mixing
distributions depend on theoretical and practical considerations. For example, a price
increase for a given good or service, or greater levels of pollution are expected to have
negative signs. However, in the present context, given the dissimilar findings in the
literature, and the focus of this study on capturing heterogeneous preferences among
natives, imposing assumptions on the expected signs appears to be less appropriate.
Therefore, I assume that the random components for all random parameters follow a
standard normal, 𝑢~𝑁[0,1], such that the mixed logit probability is written as
𝑃(𝑌𝑖𝑠𝑗 = 1|𝒖𝑖) = ∫exp(𝑋′
𝑠,𝑗𝛼𝑖)
∑ exp(𝑋′𝑠,𝑗𝛼𝑖)𝑗
.
𝑢
𝑓(𝒖) 𝑑𝒖 (6)
where 𝑓(𝒖) is the density function of the parameters. Given a set of information,
equation 6 is estimated by maximum simulated likelihood.
3.3 Experimental Design
The data were generated by two types of CEs: a forced choice (CE-A), and a CE with
a neither option (CE-B). The surveyed citizens were invited to participate, and to
evaluate a set of choice situations. Each choice set contains three choice situations.
Each choice situation was presented sequentially, such that the respondent could go
back in the exercise. Each choice situation contains three immigrant profiles, from
which the respondent was requested to select only one profile as preferred for
admission into the country, or the neither option in CE-B. In both types of CEs, the
candidate profiles were unlabeled. Each profile contained 10 foreigner attributes. This
final configuration with respect to the number of attributes, profiles per choice set,
and number of choice sets per respondent was tested in two pilots, and selected to
avoid confusion and tiredness of the respondents.9
9 Alternative configurations that were tested were choice sets with six and 10 attributes and four profiles per respondent.

11
A distinctive characteristic of this stated preferences experiment is the joint
application of CEs with and without the neither option in the sample population. The
inclusion, or not, of the neither option is quite varied in experimental practice.
Previous studies on attitudes toward immigrants have separately applied forced choice
experiments and experiments with a neither option, but not both together. On the one
hand, a forced choice decision setting requires the respondent to evaluate the trade-
offs between the candidates, being a useful framework to study the priorities of the
decision maker.10 Under this sole objective, the presence of a neither option may lead
to so-called status quo bias, as it may provide the respondent with an outside option,
not having to spend effort in evaluating the alternatives. On the other hand, in many
applications, the neither option provides a more realistic decision setting to the
respondent. That is, at least take-up is mandatory, and most real-life scenarios will
allow the individual to opt out a given alternative or offer. In such cases, the neither
option may signal that the provided alternatives do not match the respondents’
preferences. The proposed designs include both settings, allowing for comparison of
their performance and results.
Another appealing characteristic of this CE is that it uses more attributes than
previous studies used. These attributes are the country of origin, education level,
gender, age, religion, reasons for application, profession, job experience, language,
and migration status. I selected these attributes based on the literature, and on a small
focus group with Dominican citizens (10 participants).11 Table 2 lists the attributes
10 For example, in an experiment with a neither option, the respondent may reject all candidates from an "unfriendly" country, independent of the education of the candidate. In contrast, in a forced choice experiment, she/he needs to evaluate the trade-offs between respondent characteristics to make a choice. In the case of the United States, for example, foreigners from Iraq are likely to be rejected, although under a forced choice experiment Iraqis may be more likely to be accepted. What prevails is important to be analyzed. If, regardless of education level, Iraqis are rejected, this result may be interpreted as citizens having strong attitudes toward Iraqis. However, if, regardless of such dislike, Iraqis are accepted because they have better education, it may be interpreted as signaling that the decision maker sets society’s gain before his personal attitudes. Similarly, if a set of highly educated candidates is perceived as a threat in the labor market, then it is probable that they will be rejected in an experiment with a neither option. However, in a forced choice experiment, the decision maker must evaluate the trade-offs. The resulting decision will be interesting, as it implicitly contains information on what is set as a priority by the respondents, their “private” labor market fears, or their social considerations, as better-educated immigrants are more likely to contribute to society in the long run. 11 At the beginning of the focus group, the participants were provided a form and requested to fill in the main characteristics they would evaluate if they were responsible for admitting immigrants into the country.
12
and their corresponding labels. The attributes and levels used in the experiment
closely reflect the characteristics of the immigrant population presented in Table 1.
The identified attributes and their levels return a full factorial of 1,411,200
foreigner profiles. To select a combination of profiles that provides sufficient
variability to identify efficiently the effects of each attribute on the admission
decision, I performed an efficient design based on a multinomial logit. In addition to
the linear specification in equation 3, I considered interactions between country and
education, and education and gender. The specification requires at least 95 profiles to
have enough degrees of freedom for estimation. For an expected sample size of 2,500,
I generated a design with 600 profiles grouped into three profiles per choice set and
three choice sets per respondent. This configuration is the same for each experiment,
with and without the neither option.12 That is, each experiment has a total of 200
choice sets (three choice situations per choice set, and three profiles per choice
situation). The optimization was restricted to avoid profiles with improbable
combinations of attribute labels, such as being a medical doctor without formal
education.
Through the formation of choice situations with different immigrant profiles, the
CE approach provides exogenous variability for eliciting individual stated
preferences. However, the decision setup may produce order bias. This bias occurs
when respondents’ choices are affected by the order of the profiles, or the attributes
within each profile. In this application, the unlabeled alternatives precluded that
responses would be affected by the order of profiles. To avoid bias due to the order of
the attributes, I randomly sorted the attributes within each choice situation. That is, all
three profiles in each choice situation have the same order, but the order is randomly
arranged across different choice situations.
4. Sampling Frame and Data
12 Importantly, in the experimental design and sampling, I prioritized increasing sample variability to obtain greater population representativeness. Depending on the priorities, other research may include a text before the experiment to evaluate its impact. I did not include a general question on attitudes toward immigration, to avoid any type of potential predisposition of the respondent.

13
The choice experiments were applied as part of a broader face-to-face survey
implemented in urban areas of the Dominican Republic between November 2015 and
early March 2016. The sampling was performed in three stages. First, a target sample
of 2,500 interviews was split between seven cities that concentrate around 67 percent
of the total urban households in the country.13 Second, within each city, I randomly
selected the districts, which are geographical units composed of between 150 and
1,000 households. Third, within each district, I randomly selected “areas” composed
of 40-100 households. Depending on the size of the area, between four and 15
households were randomly selected for the interview. The number of respondents
within each area was defined ex ante to reduce the capture of redundant information.
Within each area, respondents were randomly selected according to a preestablished
selection rule. The rate of respondents accepting the interview was 77 percent. Of
those accepting the interview, 4 percent stopped the interview at some point.14 All
interview rejections were replaced to reach the target sample size.
Given the sample distribution, CE-A and CE-B were randomly pre-assigned to
have an equal number of respondents in both experiments. That is, each choice set
was applied six times, and 100 choice sets were applied one additional time. Further,
after the choice experiments were applied, the respondent was requested to rate each
foreigner profile on a scale from 1 (definitely should not be admitted) to 5 (definitely
should be admitted).15 In addition, the survey captured information on socioeconomic
characteristics of the respondent, such as employment status, household income, and
gender, among others.
After dropping respondents who were not citizens of the Dominican Republic,
respondents younger than age 18 years, and respondents who did not answer the
choice set section, the total sample contains 2,479 respondents, 1,230 respondents for
13 According to the Population Census of 2012. 14 Following a random selection process, a total of 3,427 doors were knocked, from which 610 households rejected the interview and 217 did not answer. 15 I chose not to include a question on general opinion on immigration, to avoid potential pre-conditioning of respondents to the choice experiments. The period of the interview coincided with several related events involving immigrants from Haiti.

14
CE-A and 1,249 respondents for CE-B.16 Table 3 presents the descriptive statistics,
showing no significant differences between the respondents in both types of
experiments. Around 70 percent of the respondents were females whose average age
was 48 years, and had eight years of schooling. This sample is mainly constituted of
respondents whose father was born in the Dominican Republic. These respondents
belong to households with monthly per capita income of US$185 and an average of
3.7 family members. The unconditional rate of admitted profiles is 66 percent in both
experiments. That is, the 2,479 respondents evaluated a total 0f 22,311 profiles (nine
profiles per respondent), supporting the admission of around 14,725 candidates.
As a word of caution, this sample presents some differences with respect to urban
areas in the Dominican Republic. Although the per capita income is statistically
similar, the sample seems to have a greater participation of women (respondents),
lower rate of employment, and greater household size.
5. Results
This section presents the empirical results for the different models and specifications.
Tables 4 and 5 summarize the estimations of the experiments without and with the
neither option, respectively. In each table, the first column presents the results of a
multinomial model in which all coefficients are assumed to be constant across
respondents. The second column presents the estimations of the random parameter
logit (RPL) without heterogeneity in the mean. The third column presents the
preferred RPL model with the parameter mean depending on the education level of
the respondent. Other specifications were tested for random parameters and
independent variables explaining the mean coefficient heterogeneity. For
heterogeneity in the mean, I tested specifications with income, gender, age, and
employment status, obtaining similar not statistically significant results.17
16 In the case of the experiment without the neither option, there were 19 respondents who did not answer a choice set. In most cases, this occurred in the final choices, which may be mainly interpreted as fatigue. 17 Results available upon request.

15
Estimated preference weights. Across all models, the estimated parameters are
similar in terms of coefficient sign and statistical significance for both experiments.
Overall, the estimations indicate that younger immigrants with a good command of
Spanish, and with a high-skilled profession tend to be preferred for admission. In
particular, high-skill professions, including entrepreneurs, have greater preference
weights on the probability of being accepted into the country. A possible interpretation
is that respondents evaluate those immigrants as potentially having greater immediate
positive impact on the local economy. Another common result in all models is that the
gender of the foreigner seems not to be a relevant characteristic for admission. For
country of origin, candidates from the United States, Spain, and Italy are the most
preferred for admission. The respondents appear to be indifferent to the nationality of
candidates from other Latin American countries, Japan, and China. In contrast, the
estimated parameter for candidates from Haiti is negative and statistically significant
across models. As commented in the background section, these results may be
explained by the long history between the two countries, as well as the growing level
of Haitian immigration in recent years. In the next subsection, I explore these results
in greater detail.
Work experience is not significant in CE-A, but always significant in CE-B, where
candidates with greater experience are preferred. These findings may indicate that
experience becomes a relevant factor for admission once the decision maker has the
possibility of denying access to all candidates (choosing the neither option).
For the legal status of the immigrant, columns 1 and 2 return estimates congruent
with the literature. Being currently illegal plays against receiving support for
admission. However, this result does not hold in the preferred model in column 3.
Altogether, the results support the hypotheses that foreigner alignment to norms
and cultural identity are preferred, and immigrants are generally not perceived as a
threat in the labor market. However, some signs of prejudice may be inferred from the
observed higher preferences for immigrants from developed countries.
Heterogeneity in preferences. The heterogeneity of the estimations is measured
by the standard deviation of the random parameters. The results indicate a great degree
of heterogeneity in individual preferences for immigrants’ education level, country of

16
origin, religion, profession, and current resident status. Further, as greater
heterogeneity is allowed in the estimations, moving from the more restrictive
multinomial model (column 1) to the RPL model (column 3), a better fit of the data is
observed in the sequence of native choices, measured by the log likelihood at the
bottom of the tables.
Sources of heterogeneity in preferences for immigrants’ attributes. Panel C in
Tables 4 and 5 suggests that respondent characteristics do not play a significant role
in explaining their preferences toward immigrant attributes. Only in CE-A, forced
choice, the education of the respondents seems to be inversely correlated with their
preferences for some countries of origin—China, Spain, Italy, and the United States—
and weakly correlated with preferences for candidates from Japan. It is tempting to
interpret these findings as suggesting that Dominicans with a higher level of education
may be less likely to support immigrants from developed countries, who may have
higher levels of education as well, therefore representing competition in the labor
markets. However, the direct “expected” correlation between education of the
respondents and the candidates is not significant. This result holds for CE-B, with the
neither option.
Aside from the education of the respondent, no other variable is relevant in
explaining heterogeneity in preferences for immigrants’ attributes. These results are
similar for various specifications, as well as with the inclusion of other covariates.18
Together with the results in panel B, the findings may indicate that preferences for
immigrants’ characteristics are indeed heterogeneous between citizens. But such
heterogeneity seems to respond to a random distribution of preferences, instead of to
specific drivers, such as the education, gender, or income of the citizens.
To further evaluate whether the preferences of natives are explained by their
observable characteristics, I take advantage of the RPL model, which allows
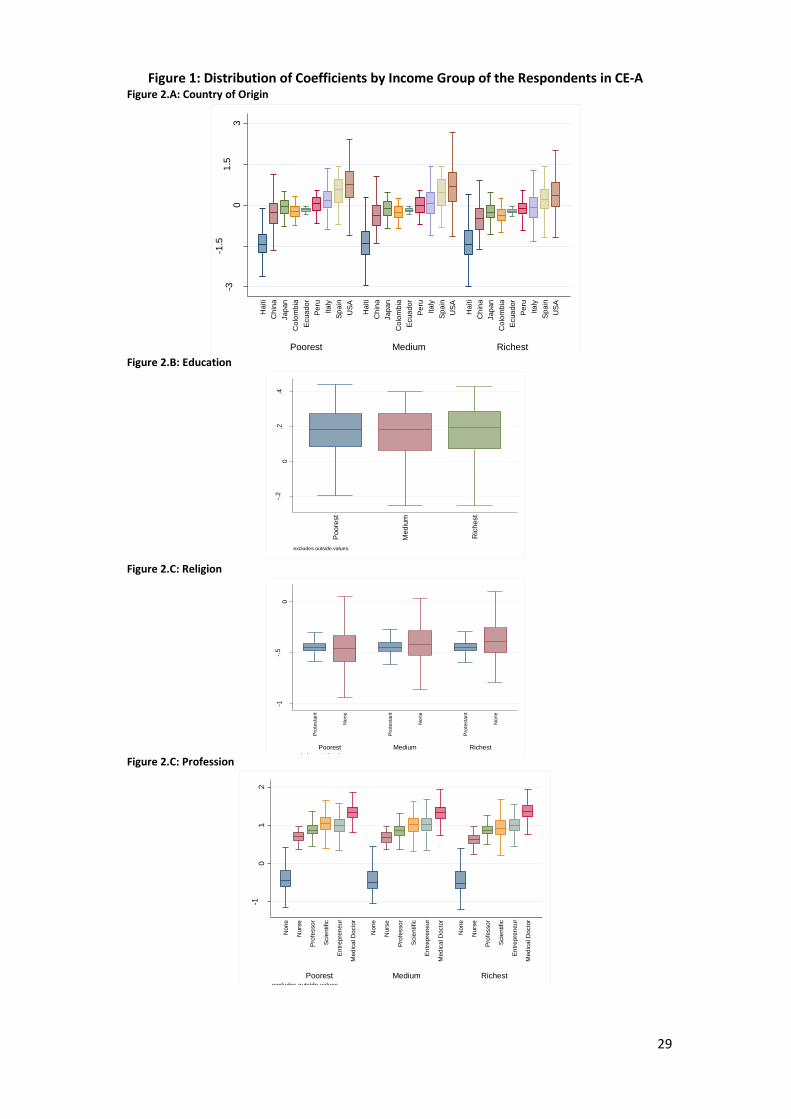
generating the full distribution of the random parameters across individuals. In Figure
1 (CE-A) and Figure 2 (CE-B), I plot the distribution (box plots) of the estimated
parameters for the country of origin, education, religion, and profession of the
18 Additional regressions included gender of the respondent and employment status. The results are available upon request.

17
immigrant, by income groups of the respondents. This inspection verifies that
preferences by immigrants’ characteristics are not driven by respondents’ observable
characteristics, in this case, income. Moreover, except for religion, the distributions
of the preference weights are similar for both types of experiments.
Predicted probability of admission. Figure 3 presents the distribution of
probabilities by type of experiment and estimation model. The predictions of the CE
with the neither option return lower probabilities of admission. In this type of CE, the
average probability of admission is around 25 percent, while in the forced choice
experiments it is 33 percent. The difference in acceptance rates seems to be
systematic, although the neither option was only selected in 5 percent of the choice
situations.
To evaluate whether this difference reflects individual preferences instead 0f
influences of the choice setting in which the respondents made their evaluations, I
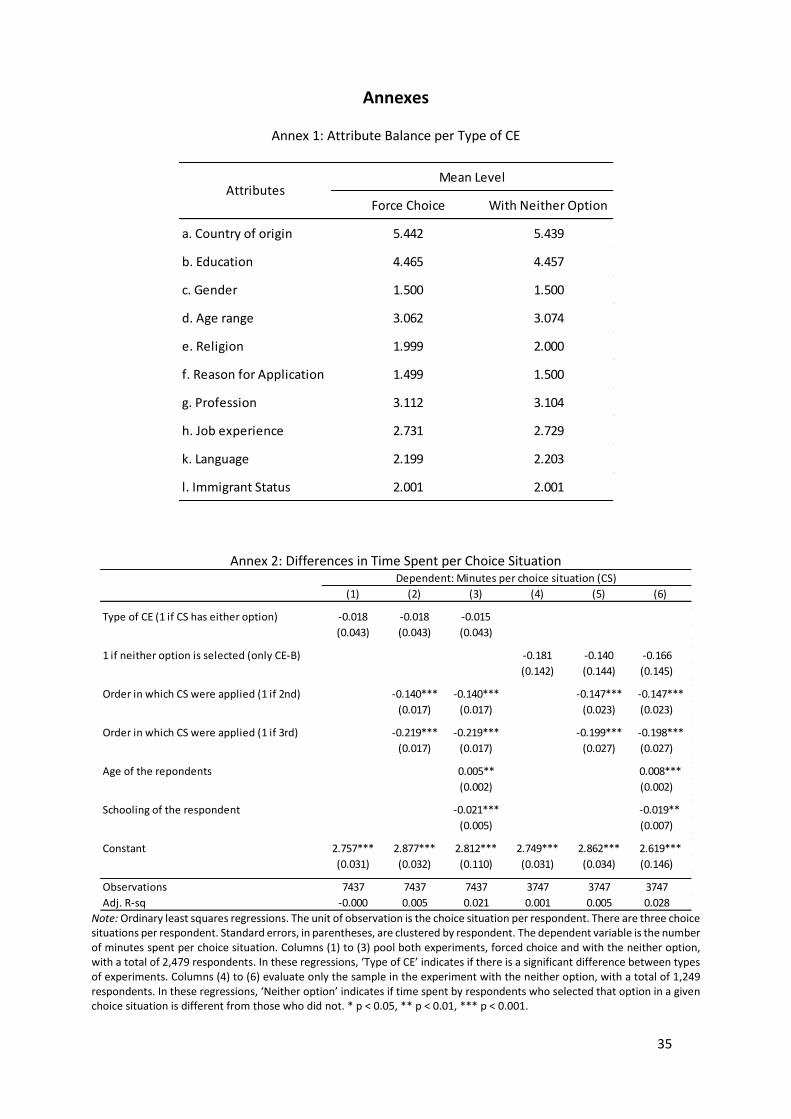
explore three potential sources of bias: attribute balance, balance in characteristics of
respondents, and status quo bias. For immigrants’ attributes balance, Annex 1 shows
balance in the profiles between both experiments. Similarly, the balance between
observable and non-observable characteristics of the respondents, between both types
of CE, are ensured by the random distribution of the choice sets. Further, Table 3
verifies balance in the observable characteristics.
Evaluating the presence of status quo bias is challenging. The usual approach of
adding an alternative specific constant may be misleading in this case, because, by
choosing the neither option, natives may be signaling their opinion about immigration.
Therefore, I explore patterns in respondents’ responses and time spent answering each
choice set between both types of experiments. If respondents took the neither option
as a shortcut, it would be expected that the time spent in evaluating the profiles would
be significantly less for choice situations corresponding to CE-B than for CE-A.
Annex 2 presents the results of ordinary least squares (OLS) regressions. Columns 1
to 3 evaluate whether there are significant differences in time dedicated per choice
situation between the types of experiments. The following control variables are added
gradually: dummies indicating the order in which each choice situation was applied
per respondent, the age of the respondents, and years of schooling. Columns 4 to 6
18
evaluate the difference between respondents who selected the neither option and other
respondents only in the experiment with the neither option. The estimated coefficients
have negative signs, but they are not statistically significant, suggesting that
respondents allocate the same effort in evaluating profiles in forced choice
experiments as when the neither option is allowed. An interesting result is that the
time spent per choice situation decreases nonlinearly as the respondents advance in
the choice set. These reductions may be associated with a greater familiarity of the
respondents with the requested exercise.
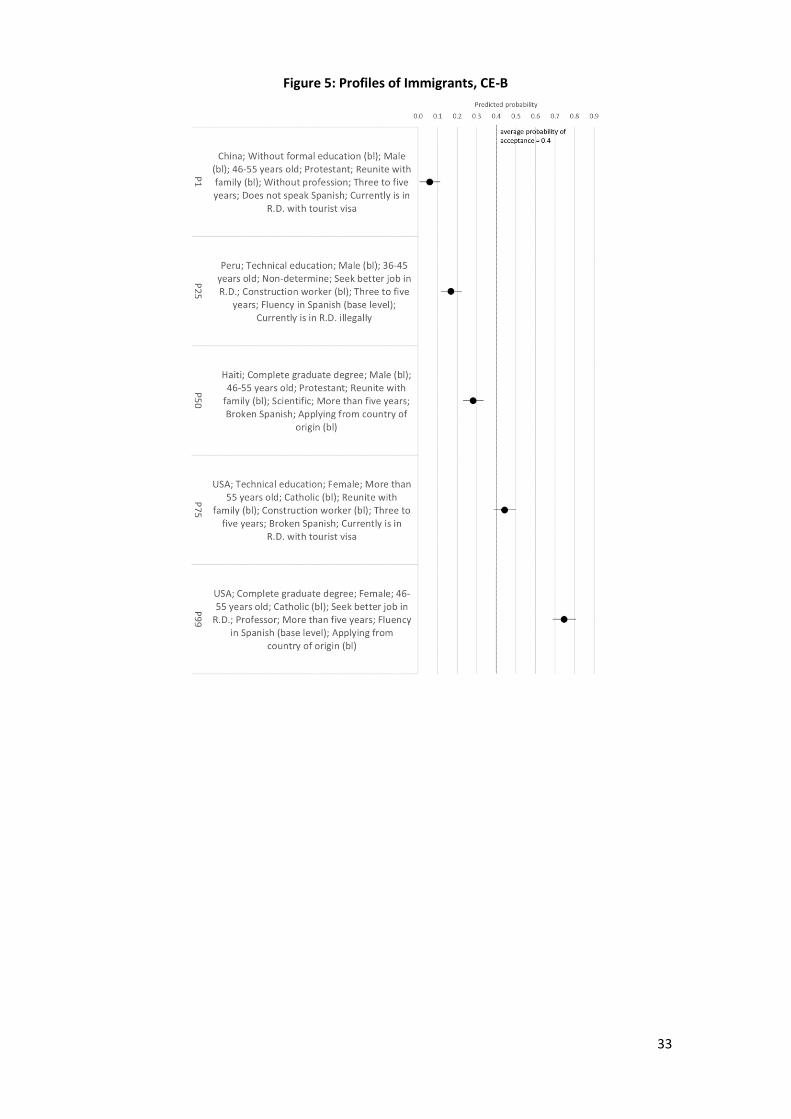
Preferred immigrant profiles. Following the approach of Hainmueller and
Hopkins (2015), I illustrate the results for the preferred foreigner profiles by
calculating the profiles at several percentiles of the probability of admission. Figures
4 and 5 present the characteristics of the chosen candidates at the 1st, 25th, 50th, 75th,
and 99th percentiles of the predicted probability of acceptance into the country. The
figure shows similar patterns in both types of experiments, and indicates that citizens’
support is greatly driven by the composition of attributes in the immigrant profile. In
CE-A and CE-B, the 1st percentile is occupied by immigrants from Haiti and China,
with low education levels, no profession, and poor command of Spanish. The
probability of being admitted for these profiles is less than 10 percent. Higher
percentiles, the 75th and 99th, correspond to foreigners from developed countries,
Italy and the United States, with a higher level of education. Profiles in these
percentiles would be admitted with probabilities of 50 and 75 percent, respectively,
both above the average probability of acceptance (42 percent).
These findings are consistent with the literature in the sense that more educated
immigrants with skilled professions receive greater support, while candidates from
some countries, with cultural dissimilarities, or difficulties in speaking the local
language, may be penalized. In this regard, interesting results by Hartman et al. (2014)
and Hainmueller and Hopkins (2015) suggest that prejudice could play a role in
preferences for specific countries of origin and/or ethnicity considerations. However,
the authors also find evidence, in the United States, that those negative effects on
support for admission are generally outweighed by the potential contribution of the
immigrant to the economy. Examination of this trade-off is relevant in the context
under study. To a great extent, education may signal the candidate’s potential, as

19
education is correlated with skilled occupations. Therefore, and given the previous
findings, Figure 6 plots the predicted probability of admission by education level,
grouped by developed countries (Italy, Spain, and the United States), developing
countries plus Japan (China, Colombia, Ecuador, Peru, and Venezuela), and Haiti. As
the attribute levels were randomly sorted between profiles, this figure reflects
conditional means.19 The figure shows a premium for candidates from developed
countries and a market penalty for Haitians. A plausible explanation is the presence
of cognitive bias in the respondents. That is, the they may correlate country of origin
with other characteristics, such as income. On the other hand, this result may suggest
the existence of racial bias. This last type of bias has been registered in the context of
the provision of public goods by politicians in the United States and South Africa
(McClendon 2016).20
Robustness check. I explore the robustness of the results by using an alternative
estimation approach and a different dependent variable. First, I use an OLS model to
estimate the preference weights and probabilities of acceptance. For example,
Hainmueller and Hopkins (2015) base their analysis on OLS models relying on a
random sampling of profiles and large sample size. As a second check, I replicate the
estimations of Tables 3 and 4, but with a new dependent variable. The new dependent
variable for the choice of acceptance is based on the score provided by the respondent.
I dichotomize the score provided by the respondent to a given candidate in each choice
experiment, with a cutoff score of 3. In principle, under this unrestricted context,
providing a score (or ranking) of the profiles represents a previous step in the cognitive
process of deciding on the most preferred candidate for admission. The use of a
decision variable generated in a different way allows testing the robustness of the
results to a somewhat different selection method.
The results are available in Annexes 3, 4, and 5, showing no significant change in
the estimates. Moreover, the OLS seem to perform well, with estimates that are
aligned with the discrete choice models and returning predicted probabilities mostly
19 Restrictions were not imposed between country of origin and level of education, or between education and language, religion, age, legal status, job experience, or gender. 20 There is also evidence of racial bias in the literature of labor economics, see for example Bertrand and Mullainathan (2004).

20
within the [0,1] range.21 The results with the dichotomized ordered dependent variable
are also quite similar to the main results.
6. Conclusions and Discussion
This paper investigates citizens’ preferences for immigrants’ attributes in the
Dominican Republic, based on two types of choice experiments, forced choice and
with neither option. The empirical approach allows for individual heterogeneity and
examining how those preferences change with native individuals’ characteristics.
Overall, the findings indicate that education, occupation, and country of origin affect
the probability of immigrants obtaining citizen support for admission into the country.
That is, foreigners with higher schooling and skilled jobs, and from developed
countries tend to receive greater support for admission. Norm adherence and cultural
resemblance also positively influence the chances of being accepted. The gender of
the immigrant is not relevant. Significant heterogeneity is observed in the estimated
preference weights of the immigrants’ attributes. However, the heterogeneity is not
explained by the observable characteristics of the respondent, suggesting that most of
the heterogeneity is of random nature.
The estimated parameters and their distributions tend to be similar between the
two types of experiments that were implemented. However, there are two relevant
distinctions. First, the distribution of the predicted probability of acceptance is skewed
to the left. That is, cetirus paribus, there are lower chances of acceptance in the
experiment with the neither option, a result that seems to reflect citizens’ preferences
instead of the choice setting. Second, the labor experience of the immigrant is
significant only in this type of experiment, suggesting that having more information
on the foreigner’s background is relevant once the decision setting becomes more
stringent.
For country of origin, an interesting finding is that the estimated preference
weights tend to be higher and statistically significant for developed countries.
21 About 2 percent of the observations have predicted negative values for probabilities. No predicted probability is greater than 1.

21
Regardless of the levels of the other attributes, immigrants from developed countries
seem to be preferred for admission. The respondents appear to be indifferent about
the nationality of immigrants from developing countries. The noticeable exception is
for candidates from Haiti, who face a strong negative penalty in their chances of
getting support for admission.
The results are aligned with previous literature evaluating natives’ attitudes
toward individual immigrants. Immigrants with attributes signaling greater potential
to contribute to the economy, greater norm adherence, and cultural resemblance tend
to be preferred.
It is important to highlight a potential limitation of the stated preferences design
used here. The current composition of the immigrant population in a given country
may affect the stated preferences of the respondents. That is, despite the exogenous
variation provided by the CE design, respondents may have priors based on their
experience or overall perception (which may be based on media coverage) of
immigration. This may trigger an aversion to certain attribute levels while reducing
attention to other candidates’ attributes that otherwise may lead to a favorable opinion.
This could be the case for Haitians in this case study, who are, by and large, the main
immigrant group with relatively low formal education levels.
This study was based on a face-to-face survey, which makes it difficult to test
ethnocentric preferences. For greater understanding of attitudes toward immigrants
from developed countries, in developing countries, future research may use computer-
based surveys, which can introduce visual variability for race to test such preferences.
Another topic that may be a subject for further research, and particularly relevant in
the current context, is testing the effects of vignettes of citizen responses (e.g.,
information on the contributions of immigrants, or wording that appeals to altruism).
The results of the study reported here seem to indicate that support for immigrants is
mainly based on their attributes. However, the experiments were not designed to test
the effects of alternative decision frames. Such studies may inform public policies
aimed to increase tolerance toward the expected increasing migration flows.
References

22
Aalberg, T., S. Iyengar, and S. Messing. 2012. “Who Is a ‘Deserving’ Immigrant? An
Experimental Study of Norwegian Attitudes.” Scandinavian Political Studies 35 (2): 97–
116.
Akay, A., A. Constant, and C. Giulietti. 2014. “The Impact of Immigration on the Well-Being
of Natives.” Journal of Economic Behavior & Organization 103: 72–92.
Alesina, A., J. Harnoss, and H. Rapoport. 2016. “Birthplace Diversity and Economic
Prosperity.” Journal of Economic Growth 21 (2): 101–38.
Bertoli, S., V. Dequiedt, and Y. Zenou. 2016. “Can Selective Immigration Policies Reduce
Migrants' Quality?” Journal of Development Economics 119: 100–09.
Bertrand, M., and S. Mullainathan. 2004. “Are Emily and Greg More Employable Than
Lakisha and Jamal? A Field Experiment on Labor Market Discrimination.” American
Economic Review 94 (4): 991–1013.
Blinder, S. 2015. “Imagined Immigration: The Impact of Different Meanings of ‘Immigrants’
in Public Opinion and Policy Debates in Britain.” Political Studies 63 (1): 80–100.
Card, D., C. Dustmann, and I. Preston. 2012. “Immigration, Wages, and Compositional
Amenities.” Journal of the European Economic Association 10 (1): 78–119.
Chassamboulli, A., and T. Palivos. 2013. “The Impact of Immigration on the Employment and
Wages of Native Workers.” Journal of Macroeconomics 38: 19–34.
Distelhorst, G., and Y. Hou. 2014. “Ingroup Bias in Official Behavior: A National Field
Experiment in China.” Quarterly Journal of Political Science 9 (2): 203–30.
Dustmann, Christian, and Ian P. Preston. 2007. “Racial and Economic Factors in Attitudes to
Immigration.” Journal of Economic Analysis & Policy 7 (1): article 62.
Facchini, G., A. M. Mayda, L. Guiso, and C. Schultz. 2008. “From Individual Attitudes towards
Migrants to Migration Policy Outcomes: Theory and Evidence.” Economic Policy 23 (56):
651–713.
Facchini, G., and A. M. Mayda. 2012. “Individual Attitudes towards Skilled Migration: An
Empirical Analysis across Countries.” World Economy 35 (2): 183–96.
Hainmueller, J., and M. J. Hiscox. 2010. “Attitudes toward Highly Skilled and Low-Skilled
Immigration: Evidence from a Survey Experiment.” American Political Science Review
104 (01): 61–84.
Hainmueller, J., and D. J. Hopkins. 2014. “Public Attitudes toward Immigration.” Annual
Review of Political Science 17: 225–49.
Hainmueller, J., and D. J. Hopkins. 2015. “The Hidden American Immigration Consensus: A
Conjoint Analysis of Attitudes toward Immigrants.” American Journal of Political Science
59 (3): 529–48.
Hanson, G. and McIntosh, C., 2016. Is the Mediterranean the New Rio Grande? US and EU
Immigration Pressures in the Long Run. The Journal of Economic Perspectives, 30(4),
pp.57-81.

23
Hartman, T. K., B. J. Newman, and C. S. Bell. 2014. “Decoding Prejudice toward Hispanics:
Group Cues and Public Reactions to Threatening Immigrant Behavior.” Political
Behavior 36 (1): 143–63.
Iyengar, S., S. Jackman, S. Messing, N. Valentino, T. Aalberg, R. Duch, K. S. Hahn, S. Soroka,
A. Harell, and T. Kobayashi. 2013. “Do Attitudes about Immigration Predict Willingness
to Admit Individual Immigrants? A Cross-National Test of the Person-Positivity Bias.”
Public Opinion Quarterly 77 (3): 641–65.
Malchow-Møller, N., J. R. Munch, S. Schroll, and J. R. Skaksen. 2008. “Attitudes towards
Immigration: Perceived Consequences and Economic Self-Interest.” Economics Letters
100 (2): 254–57.
Manning, A., and S. Roy. 2010. “Culture Clash or Culture Club? National Identity in Britain.”
Economic Journal 120 (542): F172–F100.
Mayda, A. M. 2006. “Who Is Against Immigration? A Cross-Country Investigation of
Individual Attitudes toward Immigrants.” Review of Economics and Statistics 88 (3):
510–30.
McClendon, G. H. 2016. “Race and Responsiveness: An Experiment with South African
Politicians.” Journal of Experimental Political Science 3 (01): 60–74.
Newman, B. J. 2015. “Unfamiliar Others: Contact with Unassimilated Immigrants and Public
Support for Restrictive Immigration Policy.” International Journal of Public Opinion
Research 27 (2): 197–219.
OECD (Organisation for Economic Co-operation and Development). 2011. "Immigrant
Integration in the South." In Tackling the Policy Challenges of Migration: Regulation,
Integration, Development. Paris: OECD.
O'Rourke, K. H., and R. Sinnott. 2006. “The Determinants of Individual Attitudes towards
Immigration.” European Journal of Political Economy 22 (4): 838–61.
Ortega, F. and Polavieja, J.G., 2012. Labor-market exposure as a determinant of attitudes
toward immigration. Labour Economics, 19(3), pp.298-311.
Peri, G. 2012. “The Effect of Immigration on Productivity: Evidence from US States.” Review
of Economics and Statistics 94 (1): 348–58.
Train, K.E., 2009. Discrete choice methods with simulation. Cambridge university press.
UN (United Nations). 2016. International Migration Report 2015. New York: Department of
Economic and Social Affairs, Population Division, United Nations.
Wright, M., M. Levy, and J. Citrin. 2016. “Public Attitudes toward Immigration Policy across
the Legal/Illegal Divide: The Role of Categorical and Attribute-Based Decision-Making.”
Political Behavior 38 (1): 229–53.

24
Table 1: Characteristics of the Immigrant Population in Dominican Republic
Source: National Survey of Immigrants 2012.
A. Country of origin Total (%) Male(%) Female(%)
All countries 100 64 4 35 6
Haiti 87 65.4 34.6
United States of America 2.6 52.7 47.3
Spain 1.3 62.5 37.5
Puerto Rico 0.8 55.8 44.2
Italy 0.8 74.5 25.5
China 0.7 64.9 35.1
France 0.7 70.3 29.7
Venezuela 0.7 47.7 52.3
Cuba 0.6 58.4 41.6
Colombia 0.5 51.0 49.0
Other countries 4.0 55.5 44.6
Observations 524,632
B. Education level % D. Age range %
Without formal education 17.4 15-29 years old 55.4
Basic Education 50.1 30-39 years old 26.8
Secondary Education 21.4 40-49 years old 10.7
Higher Education 8.7 50-59 years old 5.1
Postgraduate 0.8 More than 59 years old 2.0
Observations 659,142 Observations 453,754
C. Religion % E. Command of spanish %
Catholic 42.3 Try to speak but is unable 18.5
Evagelist 31.9 Broken Spanish 28.2
Adventist 4.2 Fluency in Spanish 53
Other 18.3 Observations 667,850
None 3
No information 0.4
Observations 608,340

25
Table 2. Attributes for Immigrant Profiles in the Choice Experiments
Attributes Labels
a. Country of origin China Spain Haiti Japan Ecuador (base level) Venezuela Colombia Peru Italy United States of America
b. Education Without formal education (base level) Primary education Secondary education Technic education Incomplete college Complete college Complete graduate degree
c. Gender Male (base level) Female
d. Age range 18-25 years old (base level) 26-35 years old 36-45 years old 46-55 years old More than 55 years old
e. Religion Catholic (base level) Protestant Non-determine
f. Reason for Application Reunite with family members already in R.D. (base level) Seek better job in R.D.
g. Profession Without profession Construction worker (base level) Nurse Professor Scientific Medical doctor Entrepreneur
h. Job experience No experience (base level) One to two years Three to five years More than five years
k. Language Fluency in Spanish (base level) Broken Spanish Try to speak English but is unable Does not speak Spanish
l. Immigrant Status Applying to residence from the country of origin (base level) Currently is in R.D. with tourist visa Currently is in R.D. illegally

26
Table 3: Descriptive Statistics of the Sample
Note: *Urban Dominican Republic calculated with data from National Survey of Labor Force 2015, second semester. To choose a set of comparable respondents, a person was randomly selected among the household head and the spouse/wife. Values are expanded using population factor
Variables
Mean SE Mean SE Mean SE Mean SE
Per capita household income, US$) 185 2.28 182 2.00 184 1.52 180 4.01
Gender (female=1) 0.71 0.00 0.69 0.00 0.70 0.00 0.59 0.01
Age 48.6 0.1 48.5 0.1 48.6 0.1 47.4 0.2
Schooling 8.33 0.04 8.42 0.04 8.38 0.03 . .
Employment status 0.59 0.00 0.60 0.00 0.59 0.00 0.63 0.01
Household size 3.67 0.01 3.71 0.01 3.69 0.01 3.38 0.02
1 if profile is admitted 0.67 0.00 0.66 0.00 0.66 0.00 . .
1 if father from another country 1.00 0.00 0.99 0.00 1.00 0.00 . .
# Respondents 1230 1249 2494 4862
Without Neither
Option
With Neither
OptionTotal Survey Urban Dom. Rep.*

27
Table 4: Main Results – CE without neither option
Note: (1), (2), (3) indicate multinomial, random parameter logit (RPL), and RPL with heterogeneity in mean. ***, **, * denote significance at 1, 5, 10 percent level. Total observations = 11,070. Total respondents = 1,230. Based on 500 replications using Halton draws.
( 1 ) ( 2 ) ( 3 )
Choice Coef. SE Coef. SE Coef. SEFixed parameter/component
Education level .07736*** 0.021 .16054*** 0.032 .14689** 0.064Gender 0.05524 0.044 0.06794 0.060 0.06795 0.062Age range -.03511** 0.016 -.05054** 0.022 -.05275** 0.023Labor experience 0.03145 0.022 0.03748 0.030 0.03737 0.031Language -.08548*** 0.022 -.12739*** 0.031 -.13545*** 0.032China -.23494* 0.125 -.34007* 0.177 0.29241 0.341Spain .29921** 0.152 .42974** 0.202 1.40372*** 0.415Haiti -.66229*** 0.127 -1.17512*** 0.206 -1.02957*** 0.380Japan -0.11491 0.126 -0.11318 0.166 0.40456 0.330Ecuador -0.16015 0.152 -0.14685 0.197 -0.07271 0.407Colombia -0.16687 0.154 -0.22446 0.204 0.14539 0.433Peru -0.01769 0.152 -0.00134 0.199 0.53163 0.409Italia 0.05867 0.124 0.0791 0.167 .82030** 0.325USA .40281*** 0.127 .59087*** 0.177 1.52109*** 0.359Protestant -.29965*** 0.054 -.42282*** 0.078 -.44658*** 0.156Non-determine -.27182*** 0.054 -.39313*** 0.080 -.60978*** 0.163Seek better job in R.D. -.08669** 0.044 -.12386** 0.062 -.21562* 0.128Without profession -.22345*** 0.066 -.39510*** 0.107 -0.29287 0.199Nurse .49995*** 0.083 .64659*** 0.115 .93184*** 0.239Professor .68320*** 0.111 .81368*** 0.159 .87127*** 0.329Scientific .77435*** 0.109 .94869*** 0.158 1.28912*** 0.324Medical doctor 1.01267*** 0.110 1.25149*** 0.165 1.30351*** 0.341Entrepreneur .76886*** 0.109 .93627*** 0.161 .92287*** 0.326Currently is in R.D. with tourist visa -0.03962 0.052 -0.04952 0.072 -0.15662 0.148Currently is in R.D. i l legally -.19266*** 0.053 -.29206*** 0.079 -0.21678 0.161
SD of the random parameterEducation level .29456*** 0.037 .30784*** 0.040China .96218*** 0.232 1.02105*** 0.240Spain 0.08143 0.698 0.04497 0.563Haiti 1.70920*** 0.255 1.78522*** 0.257Japan 0.09076 0.541 0.30829 0.401Ecuador 0.13182 0.630 0.12924 0.628Colombia 0.26356 0.824 0.43866 1.072Peru 0.05542 0.586 0.03264 0.534Italia .83386*** 0.270 .81535*** 0.292USA 1.09466*** 0.227 1.18899*** 0.233Protestant 0.34762 0.292 0.37358 0.283Non-determine .57839*** 0.211 .56041** 0.223Seek better job in R.D. 0.14789 0.490 0.16002 0.421Without profession .90743*** 0.222 .92682*** 0.229Nurse 0.17663 0.420 0.16515 0.450Professor 0.69251 0.476 .92261** 0.376Scientific 0.4567 0.679 .81611** 0.382Medical doctor .73223* 0.441 .97507** 0.410Entrepreneur .90635** 0.359 1.04263*** 0.342Currently is in R.D. with tourist visa 0.23545 0.229 0.25782 0.228Currently is in R.D. i l legally .81103*** 0.169 .86128*** 0.172
Heterogeneity in meanEducation level 0.00202 0.006China -.08057** 0.036Spain -.11743*** 0.044Haiti -0.02843 0.038Japan -.06553* 0.035Ecuador -0.01432 0.043Colombia -0.05119 0.044Peru -0.06622 0.043Italy -.09178*** 0.035USA -.10976*** 0.037Protestant 0.00063 0.016Non-determine 0.02399 0.017Seek better job in R.D. 0.01073 0.013Without profession -0.01365 0.020Nurse -0.03075 0.025Professor 0.0016 0.034Scientific -0.03767 0.033Medical doctor 0.00682 0.034Entrepreneur 0.00556 0.033Currently is in R.D. with tourist visa 0.01243 0.016Currently is in R.D. i l legally -0.01003 0.017
McFadden Pseudo R-squared 0.122 0.145 0.149
Log likelihood -3533.0 -3466.5 -3449.7

28
Table 5: Main Results – CE with neither option
Note: (1), (2), (3) indicate multinomial, random parameter logit (RPL), and RPL with heterogeneity in mean. ***, **, * denote significance at 1, 5, 10 percent level. Total observations = 14,988. Total respondents = 1,249. Based on 500 replications using Halton draws sequences.
( 1 ) ( 2 ) ( 3 )
Coef. SE Coef. SE Coef. SEFixed parameter/component
Education level .04482** 0.021 .15096*** 0.038 .15317** 0.067Gender 0.04451 0.044 0.05741 0.070 0.06398 0.067Age range -.06512*** 0.017 -.09524*** 0.027 -.08976*** 0.026Labor experience .05578** 0.022 .07823** 0.036 .07944** 0.034Language -.12374*** 0.022 -.23068*** 0.038 -.21532*** 0.036China -.24058** 0.121 -.35180* 0.199 -0.46291 0.320Spain .42582*** 0.143 .63183*** 0.223 0.44152 0.412Haiti -.76994*** 0.120 -1.70193*** 0.262 -1.75554*** 0.379Japan -0.05733 0.119 -0.08143 0.192 -0.32759 0.318Ecuador -.34418** 0.153 -.56741* 0.301 -0.47175 0.444Colombia -.36382** 0.154 -.59507** 0.270 -.90203* 0.469Peru -0.0319 0.147 -0.20666 0.254 0.08318 0.443Italia 0.08397 0.121 0.10088 0.197 0.16301 0.317USA .48291*** 0.120 .85008*** 0.203 .80931** 0.323Protestant -.19552*** 0.053 -.34408*** 0.090 -0.14277 0.173Non-determine -.28846*** 0.053 -.48402*** 0.094 -.34565** 0.174Seek better job in R.D. -0.06442 0.044 -0.10239 0.074 -0.22652 0.144Without profession -.21850*** 0.067 -.59741*** 0.132 -.40999* 0.233Nurse .44303*** 0.085 .64858*** 0.138 .82551*** 0.267Professor .83971*** 0.113 1.19924*** 0.188 1.05506*** 0.352Scientific .85080*** 0.111 1.09116*** 0.182 1.24462*** 0.347Medical doctor 1.20240*** 0.112 1.80248*** 0.213 1.95757*** 0.365Entrepreneur .84428*** 0.110 1.16140*** 0.196 1.19040*** 0.365Currently is in R.D. with tourist visa 0.00185 0.054 -0.07162 0.092 -0.29067 0.178Currently is in R.D. i l legally -.10426* 0.054 -.20181** 0.095 -0.17061 0.183
SD of the random parameterEducation level .40097*** 0.035 .37337*** 0.032China .91301*** 0.315 .80937** 0.320Spain 0.22827 1.075 0.53639 0.638Haiti 2.21072*** 0.318 2.03698*** 0.300Japan .82441*** 0.313 .85172*** 0.275Ecuador 1.04395 0.840 0.86956 0.708Colombia 0.77182 0.702 0.87513 0.626Peru 1.23864 0.826 1.06096 0.815Italia 1.10530*** 0.257 1.16950*** 0.228USA 1.51887*** 0.249 1.41218*** 0.234Protestant .69213*** 0.252 .66016*** 0.245Non-determine .76252*** 0.203 .68511*** 0.212Seek better job in R.D. .58574** 0.249 .55818** 0.222Without profession 1.57604*** 0.224 1.51398*** 0.210Nurse .73847** 0.311 0.39122 0.456Professor 0.20063 0.544 0.27585 0.464Scientific 0.35844 0.602 0.37892 0.702Medical doctor .91485* 0.484 0.09713 1.532Entrepreneur 1.26923*** 0.406 1.14662*** 0.408Currently is in R.D. with tourist visa .81666*** 0.243 .49444* 0.264Currently is in R.D. i l legally 1.09694*** 0.185 .86959*** 0.191
Heterogeneity in meanEducation level -0.00081 0.007China 0.01555 0.030Spain 0.02377 0.042Haiti 0.01938 0.035Japan 0.02777 0.030Ecuador -0.00419 0.044Colombia 0.03279 0.045Peru -0.03048 0.044Italy -0.01045 0.031USA -0.00184 0.031Protestant -0.02013 0.018Non-determine -0.01281 0.018Seek better job in R.D. 0.01537 0.015Without profession -0.01853 0.023Nurse -0.0223 0.027Professor 0.01325 0.036Scientific -0.01883 0.036Medical doctor -0.03119 0.037Entrepreneur -0.0063 0.037Currently is in R.D. with tourist visa 0.02947 0.018Currently is in R.D. i l legally -0.00303 0.019
McFadden Pseudo R-squared 0.112 0.238 0.239
Log likelihood -4106.1 -3958.9 -3950.5
29
Figure 1: Distribution of Coefficients by Income Group of the Respondents in CE-A Figure 2.A: Country of Origin
Figure 2.B: Education
Figure 2.C: Religion
Figure 2.C: Profession
-3-1
.5
01
.53
Cou
ntr
y o
f ori
gin
Poorest Medium Richest
Ha
iti
Ch
ina
Jap
an
Co
lom
bia
Ecua
do
r
Pe
ru
Ita
ly
Sp
ain
US
A
Ha
iti
Ch
ina
Jap
an
Co
lom
bia
Ecua
do
r
Pe
ru
Ita
ly
Sp
ain
US
A
Ha
iti
Ch
ina
Jap
an
Co
lom
bia
Ecua
do
r
Pe
ru
Ita
ly
Sp
ain
US
A
excludes outside values
-.2
0.2
.4
Ed
uca
tion
Poo
rest
Med
ium
Ric
hest
excludes outside values
-1-.
50
Relig
ion
Poorest Medium Richest
Pro
testa
nt
No
ne
Pro
testa
nt
No
ne
Pro
testa
nt
No
ne
excludes outside values
-10
12
Pro
fessio
n
Poorest Medium Richest
No
ne
Nu
rse
Pro
fesso
r
Scie
ntific
En
trep
ren
eu
r
Med
ical D
octo
r
No
ne
Nu
rse
Pro
fesso
r
Scie
ntific
En
trep
ren
eu
r
Med
ical D
octo
r
No
ne
Nu
rse
Pro
fesso
r
Scie
ntific
En
trep
ren
eu
r
Med
ical D
octo
r
excludes outside values

30
Figure 2: Distribution of Coefficients by Income Group of the Respondents in CE-B
-3-1
.5
01
.53
Cou
ntr
y o
f ori
gin
Poorest Medium Richest
Ha
iti
Ch
ina
Jap
an
Co
lom
bia
Ecua
do
r
Pe
ru
Ita
ly
Sp
ain
US
A
Ha
iti
Ch
ina
Jap
an
Co
lom
bia
Ecua
do
r
Pe
ru
Ita
ly
Sp
ain
US
A
Ha
iti
Ch
ina
Jap
an
Co
lom
bia
Ecua
do
r
Pe
ru
Ita
ly
Sp
ain
US
A
excludes outside values
-.4
-.2
0.2
.4.6
Ed
uca
tion
Po
ore
st
Me
diu
m
Ric
hest
excludes outside values
-1-.
50
.5
Relig
ion
Poorest Medium Richest
Pro
testa
nt
Non
e
Pro
testa
nt
Non
e
Pro
testa
nt
Non
e
excludes outside values
-2-1
01
2
Pro
fessio
n C
oef.
Poorest Medium Richest
Non
e
Nurs
e
Pro
fessor
Scie
ntific
En
tre
pre
ne
ur
Me
dic
al D
octo
r
Non
e
Nurs
e
Pro
fessor
Scie
ntific
En
tre
pre
ne
ur
Me
dic
al D
octo
r
Non
e
Nurs
e
Pro
fessor
Scie
ntific
En
tre
pre
ne
ur
Me
dic
al D
octo
r
excludes outside values

31
Figure 3: Distribution of Predicted Probabilities of Admission
Note: Kernel density estimates of individual probability of admission to the country. CE-A = experiment without the neither option; CE-B = experiment with the neither option; (1) = multinomial model; (2) = random parameter logit (RPL) model; (3) RPL model with mean heterogeneity. For RPL models, the random parameters are education, country of origin, profession, legal status, and religion.
01
23
4
kd
en
sity
0 .2 .4 .6 .8Predicted probabilities
CE-A(1)
CE-A(2)
CE-A(3)
CE-B(1)
CE-B(2)
CE-B(3)

32
Figure 4: Profiles of Immigrants, CE-A
33
Figure 5: Profiles of Immigrants, CE-B

34
Figure 6: Predicted Probabilities by Educational Level of the Immigrant and Country of Origin
CE-A
CE-B
35
Annexes
Annex 1: Attribute Balance per Type of CE
Annex 2: Differences in Time Spent per Choice Situation
Note: Ordinary least squares regressions. The unit of observation is the choice situation per respondent. There are three choice situations per respondent. Standard errors, in parentheses, are clustered by respondent. The dependent variable is the number of minutes spent per choice situation. Columns (1) to (3) pool both experiments, forced choice and with the neither option, with a total of 2,479 respondents. In these regressions, ‘Type of CE’ indicates if there is a significant difference between types of experiments. Columns (4) to (6) evaluate only the sample in the experiment with the neither option, with a total of 1,249 respondents. In these regressions, ‘Neither option’ indicates if time spent by respondents who selected that option in a given choice situation is different from those who did not. * p < 0.05, ** p < 0.01, *** p < 0.001.
Mean Level
Force Choice With Neither Option
a. Country of origin 5.442 5.439
b. Education 4.465 4.457
c. Gender 1.500 1.500
d. Age range 3.062 3.074
e. Religion 1.999 2.000
f. Reason for Application 1.499 1.500
g. Profession 3.112 3.104
h. Job experience 2.731 2.729
k. Language 2.199 2.203
l. Immigrant Status 2.001 2.001
Attributes
Dependent: Minutes per choice situation (CS)
(1) (2) (3) (4) (5) (6)
Type of CE (1 if CS has either option) -0.018 -0.018 -0.015
(0.043) (0.043) (0.043)
1 if neither option is selected (only CE-B) -0.181 -0.140 -0.166
(0.142) (0.144) (0.145)
Order in which CS were applied (1 if 2nd) -0.140*** -0.140*** -0.147*** -0.147***
(0.017) (0.017) (0.023) (0.023)
Order in which CS were applied (1 if 3rd) -0.219*** -0.219*** -0.199*** -0.198***
(0.017) (0.017) (0.027) (0.027)
Age of the repondents 0.005** 0.008***
(0.002) (0.002)
Schooling of the respondent -0.021*** -0.019**
(0.005) (0.007)
Constant 2.757*** 2.877*** 2.812*** 2.749*** 2.862*** 2.619***
(0.031) (0.032) (0.110) (0.031) (0.034) (0.146)
Observations 7437 7437 7437 3747 3747 3747
Adj. R-sq -0.000 0.005 0.021 0.001 0.005 0.028

36
Annex 3: Main Results with Alternative Dependent Variable (CE-A)
Note: In these regressions, the dependent variable is generated from the score provided by the respondent. (1), (2), (3) indicate multinomial, random parameter logit (RPL), and RPL with heterogeneity in mean. ***, **, * denote significance at 1, 5, 10 percent level. Total observations = 14,988. Total respondents = 1,249. Based on 500 replications using Halton draws sequences.
( 1 ) ( 2 ) ( 3 )
Choice Coef. SE Coef. SE Coef. SEFixed parameter/component
Education level .07250*** 0.020 .15025*** 0.032 .16505*** 0.063Gender 0.01304 0.044 0.00383 0.061 0.00227 0.062Age range -.03721** 0.016 -.05427** 0.022 -.05585** 0.023Labor experience 0.03013 0.022 0.03579 0.030 0.03528 0.031Language -.08288*** 0.022 -.12571*** 0.031 -.13050*** 0.032China -0.19129 0.125 -.31658* 0.179 0.11295 0.336Spain .38878*** 0.151 .55698*** 0.204 1.30481*** 0.408Haiti -.65758*** 0.127 -1.22596*** 0.213 -1.35475*** 0.383Japan -0.09954 0.125 -0.11528 0.168 0.23901 0.323Ecuador -0.07126 0.151 -0.04537 0.199 -0.18381 0.400Colombia -0.17633 0.153 -0.26139 0.209 -0.12347 0.421Peru 0.00466 0.152 0.01541 0.201 0.30152 0.401Italia 0.07536 0.124 0.08722 0.169 .67100** 0.320USA .37658*** 0.126 .56353*** 0.178 1.08795*** 0.344Protestant -.25522*** 0.054 -.36671*** 0.079 -.32953** 0.157Non-determine -.23795*** 0.054 -.34881*** 0.079 -.43973*** 0.157Seek better job in R.D. -.09325** 0.044 -.13789** 0.063 -.22422* 0.126Without profession -.21238*** 0.066 -.37295*** 0.106 -0.27979 0.195Nurse .47883*** 0.083 .63432*** 0.116 .85206*** 0.235Professor .64359*** 0.110 .76749*** 0.159 .56250* 0.323Scientific .75932*** 0.109 .93036*** 0.158 1.22480*** 0.315Medical doctor 1.00117*** 0.110 1.27157*** 0.170 1.10795*** 0.338Entrepreneur .77096*** 0.108 .96571*** 0.168 .74761** 0.332Currently is in R.D. with tourist visa -0.05779 0.052 -0.06087 0.073 -0.23733 0.148Currently is in R.D. illegally -.21032*** 0.053 -.33064*** 0.081 -.27418* 0.160
SD of the random parameterEducation level .28652*** 0.038 .29186*** 0.039China 1.02777*** 0.232 1.08216*** 0.236Spain 0.02453 0.650 0.05785 0.558Haiti 1.70963*** 0.260 1.75612*** 0.259Japan 0.0369 0.434 0.05026 0.450Ecuador 0.10467 0.660 0.06062 0.632Colombia 0.39105 0.727 0.40793 0.869Peru 0.04721 0.468 0.02784 0.435Italia .85144*** 0.268 .87774*** 0.275USA .99982*** 0.233 1.04887*** 0.236Protestant .52729** 0.241 .57405** 0.232Non-determine .49175** 0.226 .44927* 0.256Seek better job in R.D. 0.11669 0.406 0.00671 0.409Without profession .86336*** 0.233 .86385*** 0.237Nurse 0.01235 0.538 0.14387 0.524Professor 0.65308 0.565 .87986** 0.379Scientific 0.57384 0.448 0.6247 0.432Medical doctor .95165** 0.399 1.01604** 0.398Entrepreneur 1.25757*** 0.323 1.30646*** 0.322Currently is in R.D. with tourist visa 0.36522 0.224 0.29199 0.239Currently is in R.D. illegally .86194*** 0.168 .86554*** 0.170
Heterogeneity in mean(Education of the respondent)Education level -0.00143 0.006China -0.05572 0.035Spain -.09078** 0.043Haiti 0.00708 0.038Japan -0.04587 0.034Ecuador 0.01254 0.042Colombia -0.0216 0.044Peru -0.03765 0.042Italy -.07258** 0.034USA -.06413* 0.036Protestant -0.00619 0.016Non-determine 0.00918 0.016Seek better job in R.D. 0.01064 0.013Without profession -0.01235 0.020Nurse -0.02632 0.024Professor 0.02912 0.033Scientific -0.03302 0.032Medical doctor 0.02092 0.034Entrepreneur 0.0274 0.034Currently is in R.D. with tourist visa 0.02164 0.016Currently is in R.D. illegally -0.00585 0.017
McFadden Pseudo R-squared 0.112 0.137 0.141
Log likelihood -3558.3 -3499.4 -3481.7

37
Annex 4: Main Results with Alternative Dependent Variable (CE-B)
Note: In these regressions, the dependent variable is generated from the score provided by the respondent. (1), (2), (3) indicate multinomial, random parameter logit (RPL), and RPL with heterogeneity in mean. ***, **, * denote significance at 1, 5, 10 percent level. Total observations = 14,988. Total respondents = 1,249. Based on 500 replications using Halton draws sequences.
( 1 ) ( 2 ) ( 3 )
Coef. SE Coef. SE Coef. SEFixed parameter/component
Education level .04330** 0.021 .13678*** 0.035 .16265** 0.065Gender 0.00595 0.044 3.37688*** 0.316 0.01291 0.066Age range -.06926*** 0.017 0.00582 0.066 -.09719*** 0.025Labor experience .05345** 0.022 -.09938*** 0.026 .07535** 0.034Language -.12209*** 0.022 .07599** 0.034 -.20232*** 0.035China -.26018** 0.120 -.20544*** 0.036 -0.44188 0.322Spain .33323** 0.143 -.41511** 0.193 0.49302 0.407Haiti -.78840*** 0.120 .51765** 0.214 -1.53607*** 0.354Japan -0.12602 0.119 -1.49209*** 0.235 -0.31354 0.316Ecuador -.33517** 0.152 -0.18477 0.184 -0.46615 0.438Colombia -.34283** 0.152 -.41895* 0.254 -.95478** 0.472Peru -0.08442 0.147 -.51349* 0.274 -0.01628 0.462Italia 0.0237 0.120 -0.31332 0.250 0.13797 0.310USA .42608*** 0.120 0.04817 0.185 .84666*** 0.317Protestant -.16957*** 0.052 .72320*** 0.189 -0.16207 0.171Non-determine -.25477*** 0.053 -.29320*** 0.085 -.29879* 0.168Seek better job in R.D. -0.07187 0.044 -.40976*** 0.087 -0.19986 0.139Without profession -.23601*** 0.066 -0.10993 0.070 -0.36013 0.224Nurse .43660*** 0.084 -.55305*** 0.123 .74255*** 0.260Professor .80551*** 0.112 .60957*** 0.129 1.07393*** 0.345Scientific .83880*** 0.110 1.08994*** 0.178 1.07491*** 0.340Medical doctor 1.16783*** 0.111 1.05558*** 0.173 1.85045*** 0.360Entrepreneur .80108*** 0.110 1.67792*** 0.204 1.06002*** 0.357Currently is in R.D. with tourist visa 0.01817 0.053 1.03648*** 0.183 -0.25517 0.175Currently is in R.D. illegally -.09931* 0.053 -0.02662 0.086 -0.11243 0.177
SD of the random parameterEducation level .37298*** 0.032 .36566*** 0.031China 1.11276*** 0.265 1.11345*** 0.251Spain 0.26864 0.911 0.65274 0.542Haiti 1.88445*** 0.301 1.74423*** 0.281Japan .89367*** 0.273 .97124*** 0.253Ecuador 0.65146 1.013 0.84509 0.782Colombia 0.77819 0.939 0.96414 0.686Peru 1.55337** 0.631 1.49050** 0.665Italia .92170*** 0.257 .97886*** 0.253USA 1.26121*** 0.243 1.25233*** 0.234Protestant .71162*** 0.215 .73329*** 0.201Non-determine .69285*** 0.203 .56874** 0.230Seek better job in R.D. .60398*** 0.204 0.37687 0.273Without profession 1.40981*** 0.214 1.45903*** 0.204Nurse 0.36698 0.363 0.08831 0.425Professor 0.04645 0.452 0.00151 0.435Scientific 0.05871 0.573 0.4268 0.488Medical doctor 0.62223 0.559 0.17389 0.632Entrepreneur 1.09951** 0.428 1.10594*** 0.375Currently is in R.D. with tourist visa .62291*** 0.240 .54823** 0.227Currently is in R.D. illegally .93175*** 0.180 .77768*** 0.184
Heterogeneity in mean(Education of the respondent)Education level -0.00263 0.0066China 0.003 0.03081Spain 0.00177 0.04163Haiti 0.00897 0.03311Japan 0.01138 0.03034Ecuador -0.00029 0.04293Colombia 0.0432 0.04414Peru -0.03558 0.04637Italy -0.01484 0.03024USA -0.01821 0.03103Protestant -0.01272 0.01771Non-determine -0.01166 0.0173Seek better job in R.D. 0.0105 0.01443Without profession -0.02469 0.02293Nurse -0.01381 0.02626Professor 0.00354 0.03502Scientific -0.00054 0.03526Medical doctor -0.02323 0.03573Entrepreneur -0.00127 0.03635Currently is in R.D. with tourist visa 0.0293 0.01789Currently is in R.D. illegally -0.01057 0.01817
McFadden Pseudo R-squared 0.110 0.245 0.247
Log likelihood -4043.9 -3919.6 -3909.7

38
Annex 5: Main Results (OLS)
Note: Clustered standard errors.
Forced Choice With Neither Option
Coef. SE Coef. SE
Pais de origen
a. Country of origin
China
Spain 0.090 0.025 0.127 0.025
Haiti -0.080 0.015 -0.075 0.015
Japan 0.027 0.015 0.043 0.015
Ecuador (bl) -0.016 0.026 -0.041 0.025
Venezuela 0.051 0.026 0.062 0.028
Colombia 0.011 0.025 -0.068 0.024
Peru 0.030 0.026 0.050 0.026
Italia 0.055 0.016 0.064 0.016
USA 0.122 0.016 0.137 0.015
b. Education
Without formal education (bl)
Primary education 0.030 0.017 0.024 0.017
Secondary education 0.001 0.017 0.022 0.016
Technical education 0.070 0.018 0.041 0.017
Incomplete college 0.051 0.017 0.018 0.017
Complete college 0.112 0.030 0.060 0.029
Complete graduate degree 0.117 0.034 0.048 0.033
c. Gender
Male (bl)
Female -0.003 0.009 0.009 0.008
d. Age range
18-25 years old (bl)
26-35 years old 0.014 0.014 -0.001 0.014
36-45 years old -0.011 0.016 -0.018 0.016
46-55 years old -0.004 0.017 -0.050 0.016
More than 55 years old -0.030 0.017 -0.058 0.017
e. Religion
Catholic (bl)
Protestant -0.064 0.011 -0.042 0.011
Non-determine -0.053 0.011 -0.056 0.011
f. Reason for Application
Reunite with family (bl)
Seek better job in R.D. -0.013 0.008 -0.007 0.008
g. Profession
Without profession
Construction worker (bl) 0.044 0.011 0.037 0.011
Nurse 0.121 0.018 0.129 0.018
Professor 0.186 0.033 0.203 0.032
Scientific 0.199 0.034 0.195 0.033
Medical doctor 0.255 0.033 0.300 0.033
Entrepreneur 0.221 0.033 0.213 0.034
h. Job experience
No experience (bl)
One to two years 0.030 0.015 0.046 0.015
Three to five years 0.043 0.015 0.045 0.016
More than five years 0.040 0.017 0.039 0.017
k. Language
Fluency in Spanish (base level)
Broken Spanish -0.047 0.013 -0.060 0.014
Try to speak English but is unable -0.064 0.013 -0.062 0.014
Does not speak Spanish -0.041 0.013 -0.087 0.014
l. Immigrant Status
Applying from country of origin (bl)
Currently is in R.D. with tourist visa -0.012 0.011 0.000 0.011
Currently is in R.D. illegally -0.043 0.011 -0.018 0.011
Constant 0.206 0.029 0.200 0.028
Observations 11220 11316