eli lilly’s approach to early phase - engineering.purdue.edu · eli lilly and company...
TRANSCRIPT
Eli Lilly’s Approach to Early Phase
Chemical Reactivity Hazard Assesments
Purdue Process Safety & Assurance Center
Spring Meeting
10-MAY-2018
Stanley P. Kolis, Ph.D.
Research Advisor – Small Molecule Design and Development
Eli Lilly and Company
Indianapolis, IN 46285
Our Fundamentals
♦ Our Mission: We make
medicines that help people
live longer, healthier, more
active lives.
♦ Our Vision: We will make a
significant contribution to
humanity by improving global
health in the 21st century.
♦ Our Values: Integrity,
excellence, respect for people
2© 2018 Eli Lilly and Company
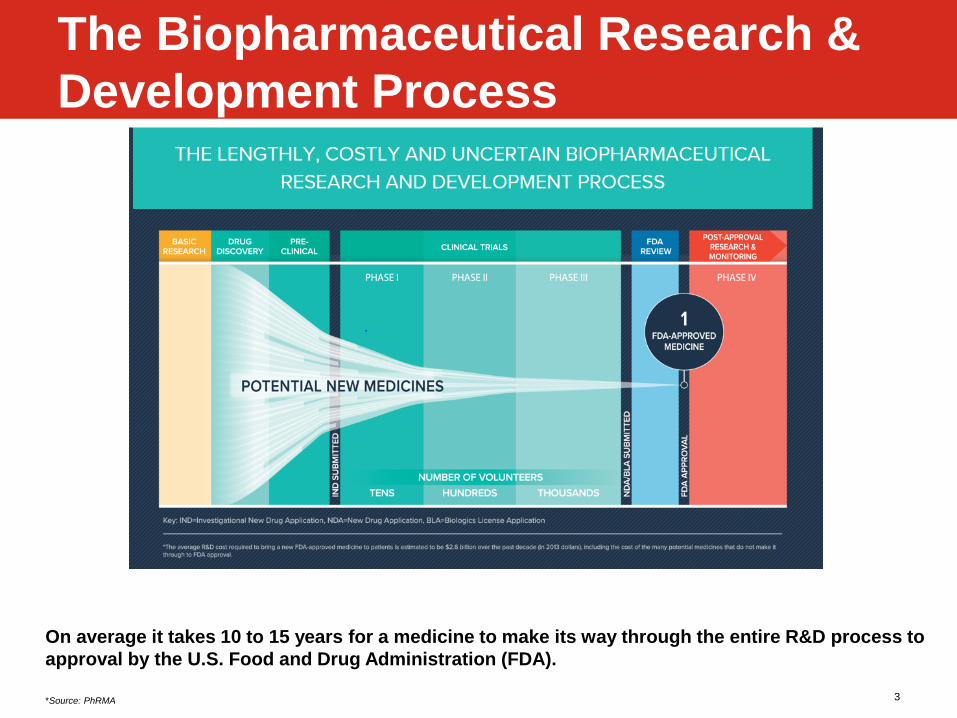
The Biopharmaceutical Research &
Development Process
3
On average it takes 10 to 15 years for a medicine to make its way through the entire R&D process to
approval by the U.S. Food and Drug Administration (FDA).
*Source: PhRMA© 2018 Eli Lilly and Company
5/16/2018 4
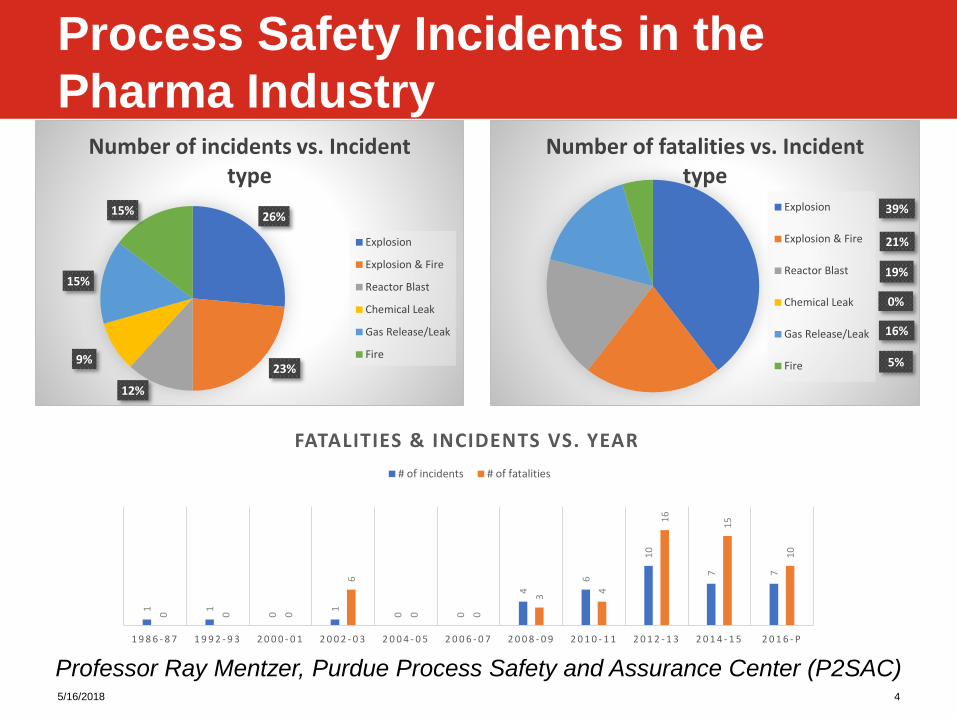
Process Safety Incidents in the
Pharma Industry1 1
0
1
0 0
4
6
10
7 7
0 0 0
6
0 0
3
4
16
15
10
1 9 8 6 - 8 7 1 9 9 2 - 9 3 2 0 0 0 - 0 1 2 0 0 2 - 0 3 2 0 0 4 - 0 5 2 0 0 6 - 0 7 2 0 0 8 - 0 9 2 0 1 0 - 1 1 2 0 1 2 - 1 3 2 0 1 4 - 1 5 2 0 1 6 - P
FATALITIES & INCIDENTS VS. YEAR
# of incidents # of fatalities
26%
23%
12%
9%
15%
15%
Number of incidents vs. Incident type
Explosion
Explosion & Fire
Reactor Blast
Chemical Leak
Gas Release/Leak
Fire
39%
21%
19%
0%
16%
5%
Number of fatalities vs. Incident type
Explosion
Explosion & Fire
Reactor Blast
Chemical Leak
Gas Release/Leak
Fire
Professor Ray Mentzer, Purdue Process Safety and Assurance Center (P2SAC)
5/16/2018 5
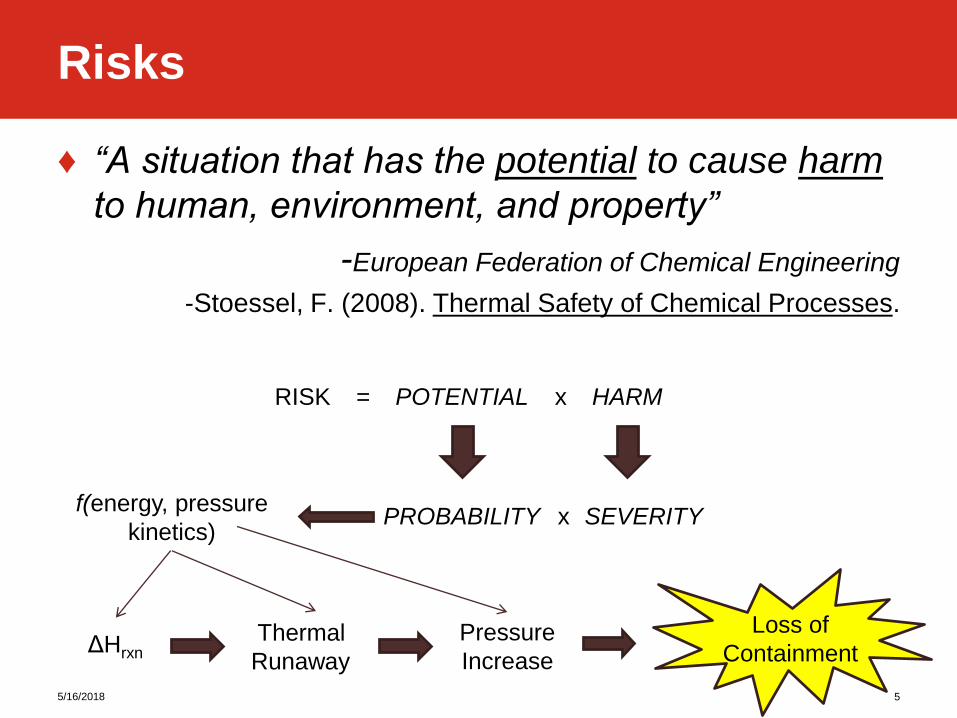
Risks
♦ “A situation that has the potential to cause harm
to human, environment, and property”
-European Federation of Chemical Engineering
-Stoessel, F. (2008). Thermal Safety of Chemical Processes.
RISK = POTENTIAL x HARM
PROBABILITY x SEVERITYf(energy, pressure
kinetics)
ΔHrxnThermal
Runaway
Pressure
Increase
Loss of
Containment
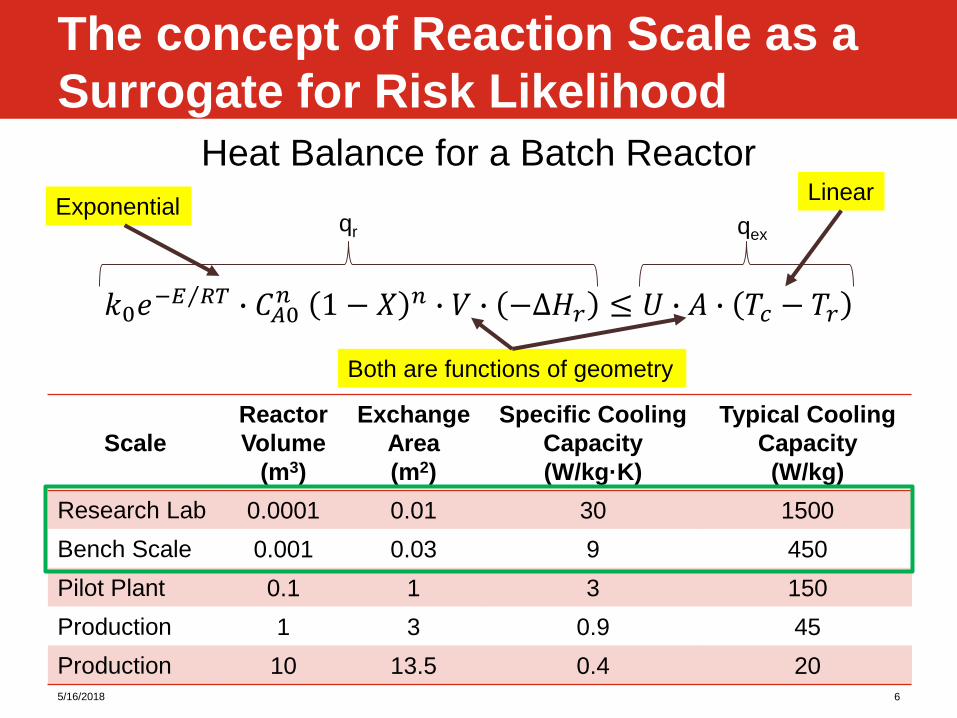
Heat Balance for a Batch Reactor
𝑘0𝑒− Τ𝐸 𝑅𝑇 ∙ 𝐶𝐴0
𝑛 1 − 𝑋 𝑛 ∙ 𝑉 ∙ −∆𝐻𝑟 ≤ 𝑈 ∙ 𝐴 ∙ 𝑇𝑐 − 𝑇𝑟
5/16/2018 6
The concept of Reaction Scale as a
Surrogate for Risk Likelihood
Both are functions of geometry
qr qex
Scale
Reactor
Volume
(m3)
Exchange
Area
(m2)
Specific Cooling
Capacity
(W/kg·K)
Typical Cooling
Capacity
(W/kg)
Research Lab 0.0001 0.01 30 1500
Bench Scale 0.001 0.03 9 450
Pilot Plant 0.1 1 3 150
Production 1 3 0.9 45
Production 10 13.5 0.4 20
ExponentialLinear
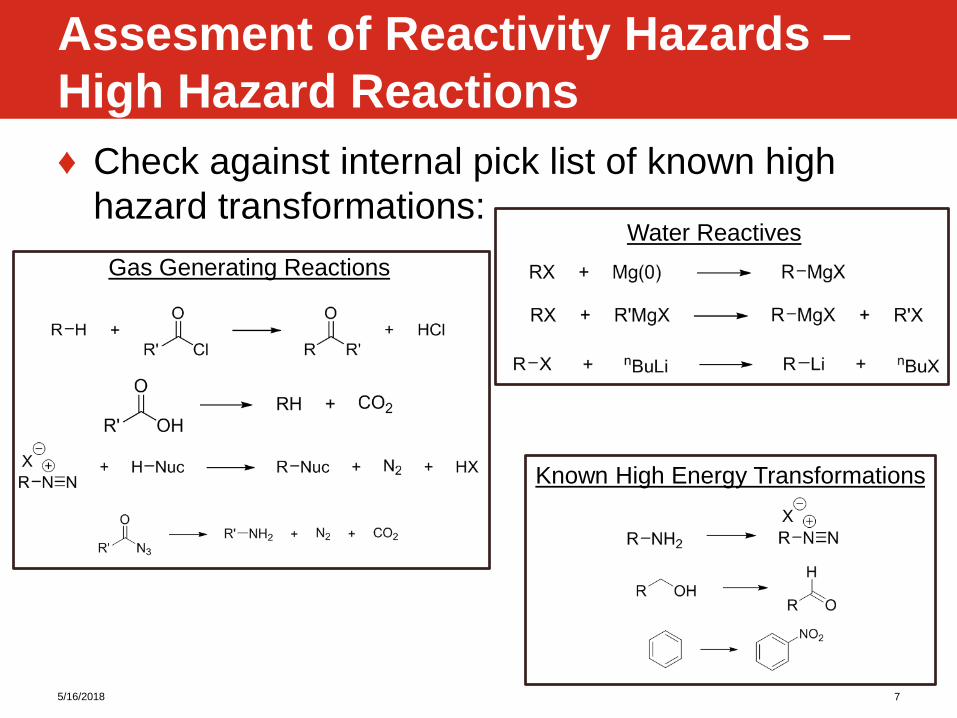
♦ Check against internal pick list of known high
hazard transformations:
5/16/2018 7
Assesment of Reactivity Hazards –
High Hazard Reactions
Water Reactives
Gas Generating Reactions
Known High Energy Transformations
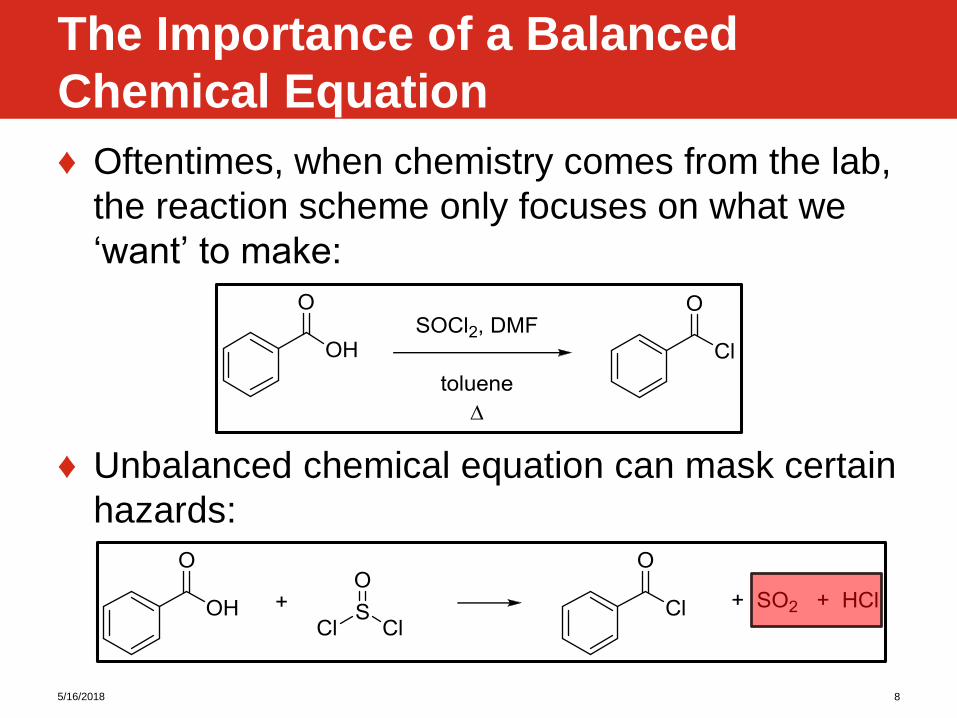
♦ Oftentimes, when chemistry comes from the lab,
the reaction scheme only focuses on what we
‘want’ to make:
♦ Unbalanced chemical equation can mask certain
hazards:
5/16/2018 8
The Importance of a Balanced
Chemical Equation
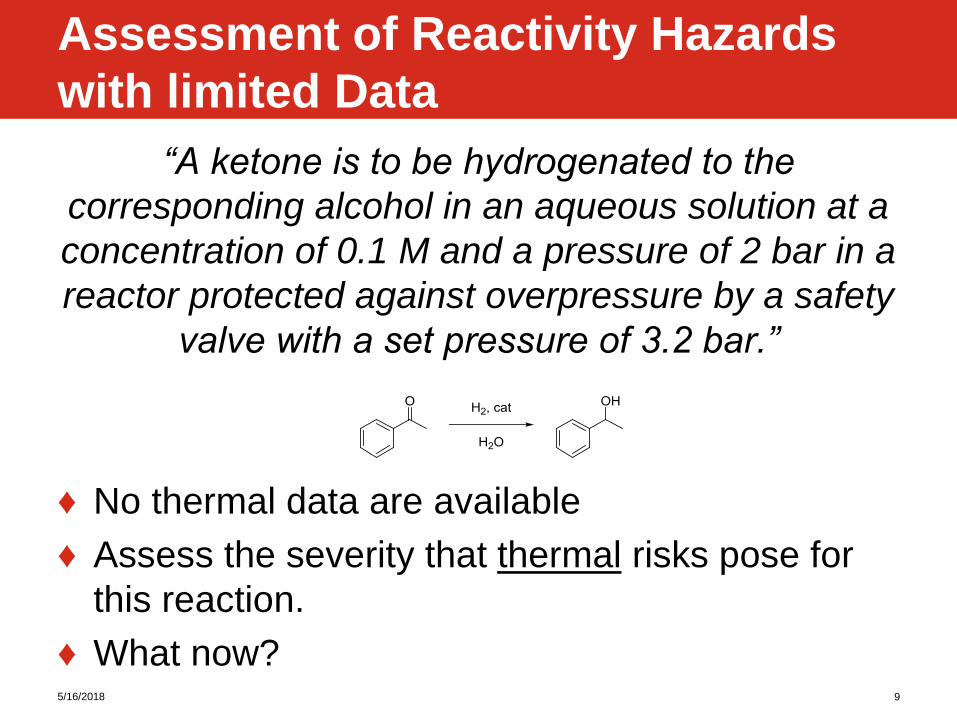
“A ketone is to be hydrogenated to the
corresponding alcohol in an aqueous solution at a
concentration of 0.1 M and a pressure of 2 bar in a
reactor protected against overpressure by a safety
valve with a set pressure of 3.2 bar.”
♦ No thermal data are available
♦ Assess the severity that thermal risks pose for
this reaction.
♦ What now?5/16/2018 9
Assessment of Reactivity Hazards
with limited Data
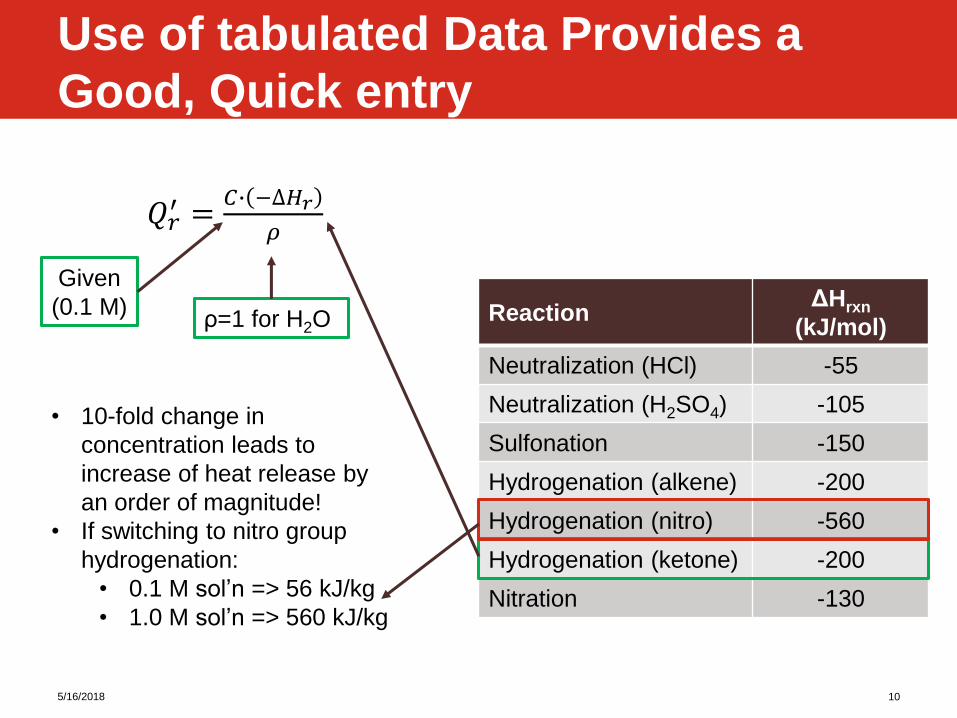
𝑄𝑟′ =
𝐶∙ −∆𝐻𝑟
𝜌=
0.1 ൗ𝑚𝑜𝑙𝐿∙ − −200 ൗ𝑘𝐽
𝑚𝑜𝑙
1.00 ൗ𝑘𝑔𝐿
= 20 ൗ𝑘𝐽𝑘𝑔
Given
(0.1 M)
5/16/2018 10
Use of tabulated Data Provides a
Good, Quick entry
ReactionΔHrxn
(kJ/mol)
Neutralization (HCl) -55
Neutralization (H2SO4) -105
Sulfonation -150
Hydrogenation (alkene) -200
Hydrogenation (nitro) -560
Hydrogenation (ketone) -200
Nitration -130
ρ=1 for H2O
• 10-fold change in
concentration leads to
increase of heat release by
an order of magnitude!
• If switching to nitro group
hydrogenation:
• 0.1 M sol’n => 56 kJ/kg
• 1.0 M sol’n => 560 kJ/kg
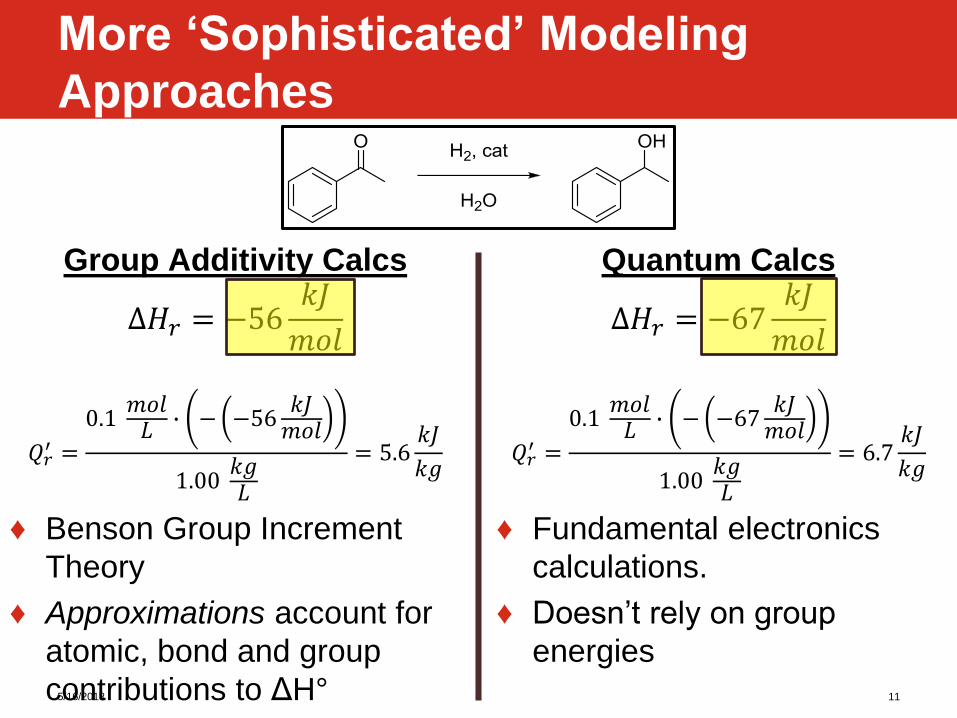
More ‘Sophisticated’ Modeling
Approaches
5/16/2018 11
Group Additivity Calcs
∆𝐻𝑟 = −56𝑘𝐽
𝑚𝑜𝑙
𝑄𝑟′ =
0.1𝑚𝑜𝑙𝐿 ∙ − −56
𝑘𝐽𝑚𝑜𝑙
1.00𝑘𝑔𝐿
= 5.6𝑘𝐽
𝑘𝑔
♦ Benson Group Increment
Theory
♦ Approximations account for
atomic, bond and group
contributions to ΔH°
Quantum Calcs
∆𝐻𝑟 = −67𝑘𝐽
𝑚𝑜𝑙
𝑄𝑟′ =
0.1𝑚𝑜𝑙𝐿 ∙ − −67
𝑘𝐽𝑚𝑜𝑙
1.00𝑘𝑔𝐿
= 6.7𝑘𝐽
𝑘𝑔
♦ Fundamental electronics
calculations.
♦ Doesn’t rely on group
energies
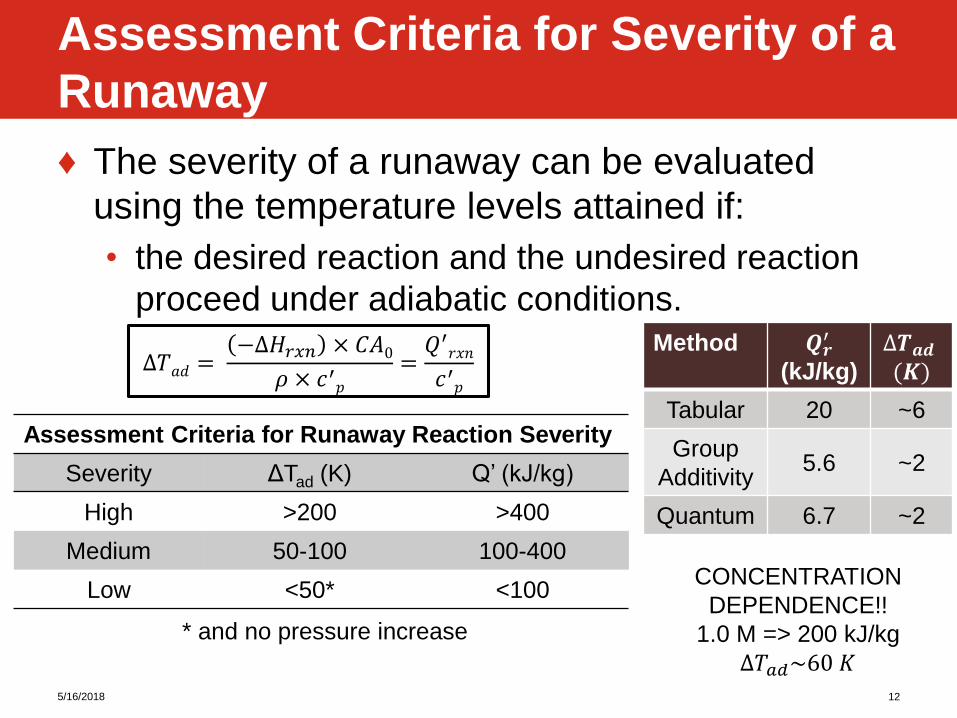
♦ The severity of a runaway can be evaluated
using the temperature levels attained if:
• the desired reaction and the undesired reaction
proceed under adiabatic conditions.
5/16/2018 12
Assessment Criteria for Severity of a
Runaway
∆𝑇𝑎𝑑 =−∆𝐻𝑟𝑥𝑛 × 𝐶𝐴0
𝜌 × 𝑐′𝑝=𝑄′
𝑟𝑥𝑛
𝑐′𝑝
Assessment Criteria for Runaway Reaction Severity
Severity ΔTad (K) Q’ (kJ/kg)
High >200 >400
Medium 50-100 100-400
Low <50* <100
* and no pressure increase
Method 𝑸𝒓′
(kJ/kg)
∆𝑻𝒂𝒅(𝑲)
Tabular 20 ~6
Group
Additivity5.6 ~2
Quantum 6.7 ~2
CONCENTRATION
DEPENDENCE!!
1.0 M => 200 kJ/kg
∆𝑇𝑎𝑑~60 𝐾
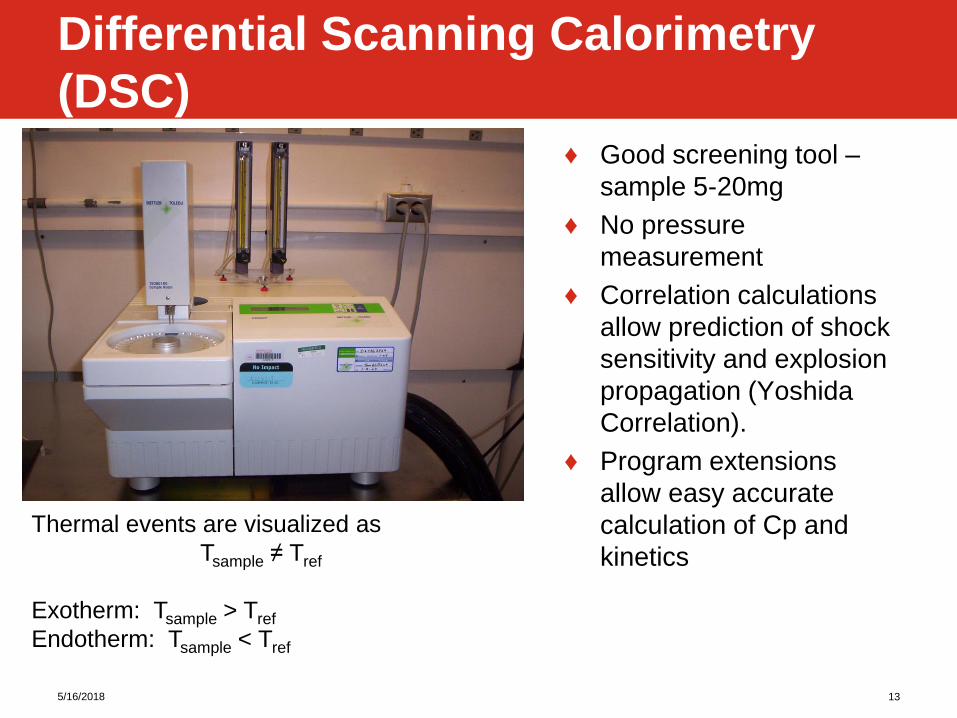
♦ Good screening tool –
sample 5-20mg
♦ No pressure
measurement
♦ Correlation calculations
allow prediction of shock
sensitivity and explosion
propagation (Yoshida
Correlation).
♦ Program extensions
allow easy accurate
calculation of Cp and
kinetics
5/16/2018 13
Differential Scanning Calorimetry
(DSC)
Thermal events are visualized as
Tsample ≠ Tref
Exotherm: Tsample > Tref
Endotherm: Tsample < Tref
5/16/2018 14
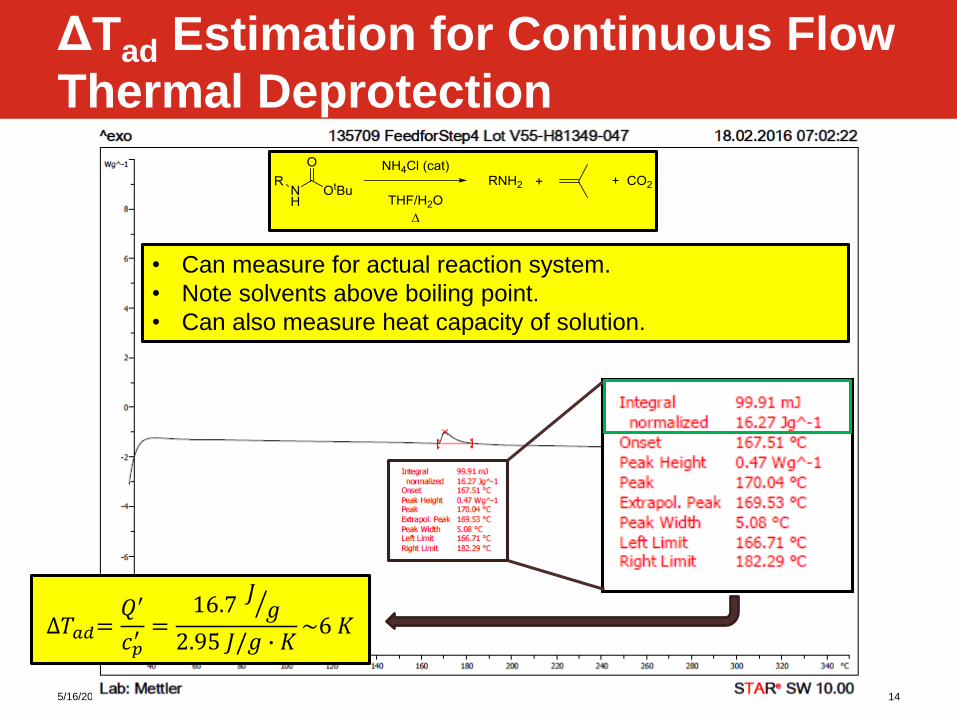
ΔTad Estimation for Continuous Flow
Thermal Deprotection
• Can measure for actual reaction system.
• Note solvents above boiling point.
• Can also measure heat capacity of solution.
∆𝑇𝑎𝑑=𝑄′
𝑐𝑝′ =
16.7 ൗ𝐽 𝑔
2.95 𝐽/𝑔 ∙ 𝐾~6 𝐾
5/16/2018 15
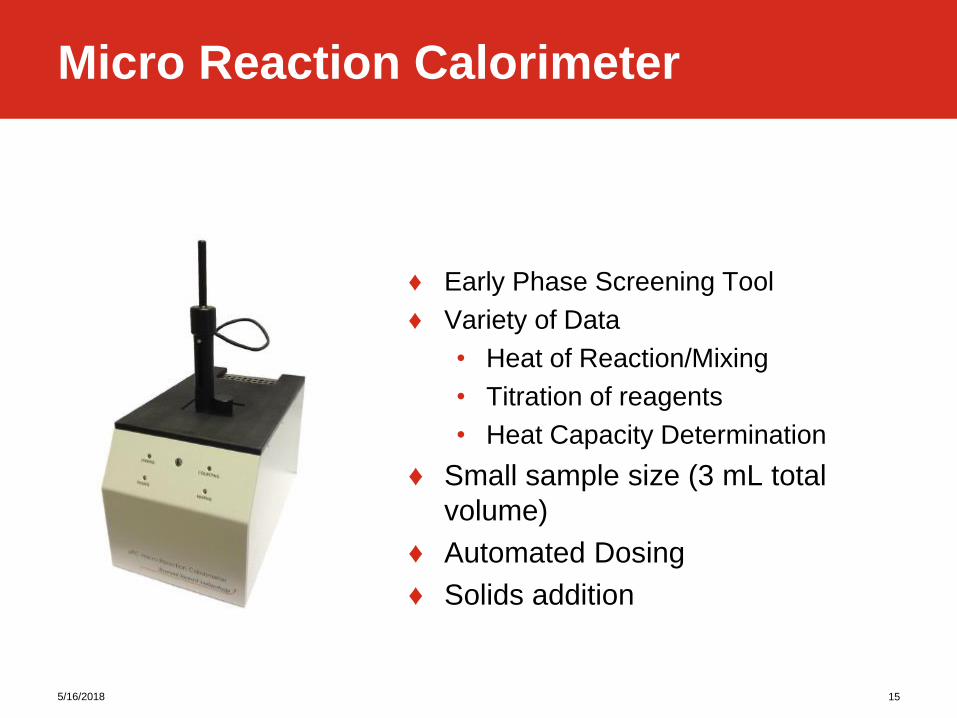
Micro Reaction Calorimeter
♦ Early Phase Screening Tool
♦ Variety of Data
• Heat of Reaction/Mixing
• Titration of reagents
• Heat Capacity Determination
♦ Small sample size (3 mL total
volume)
♦ Automated Dosing
♦ Solids addition
5/16/2018 16
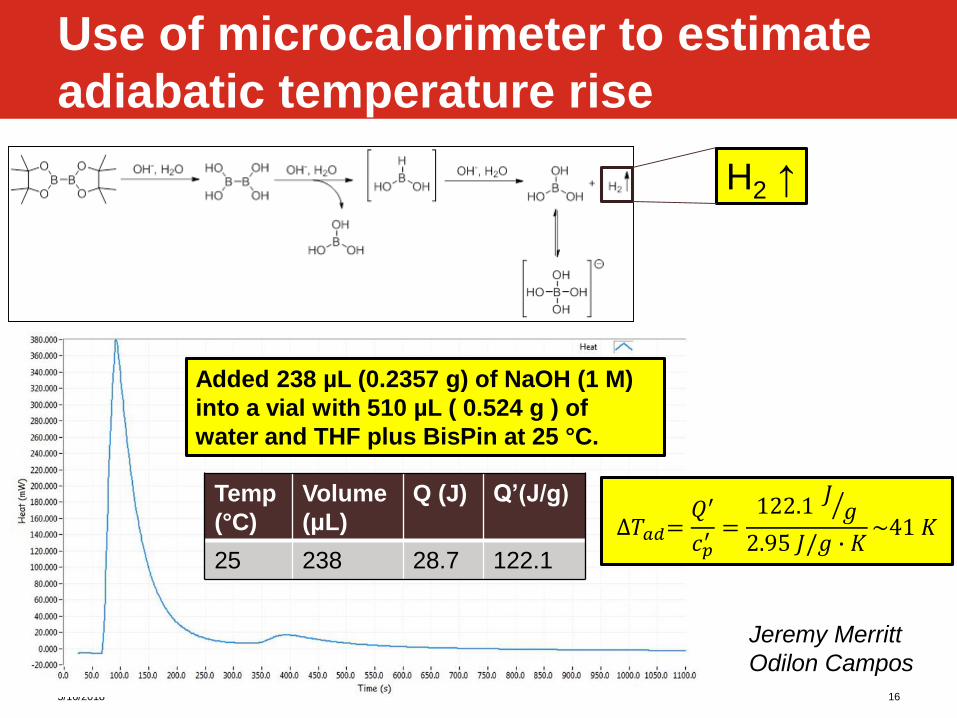
Use of microcalorimeter to estimate
adiabatic temperature rise
Added 238 µL (0.2357 g) of NaOH (1 M)
into a vial with 510 µL ( 0.524 g ) of
water and THF plus BisPin at 25 °C.
Temp
(°C)
Volume
(μL)
Q (J) Q’(J/g)
25 238 28.7 122.1
H2 ↑
∆𝑇𝑎𝑑=𝑄′
𝑐𝑝′ =
122.1 ൗ𝐽 𝑔
2.95 𝐽/𝑔 ∙ 𝐾~41 𝐾
Jeremy Merritt
Odilon Campos
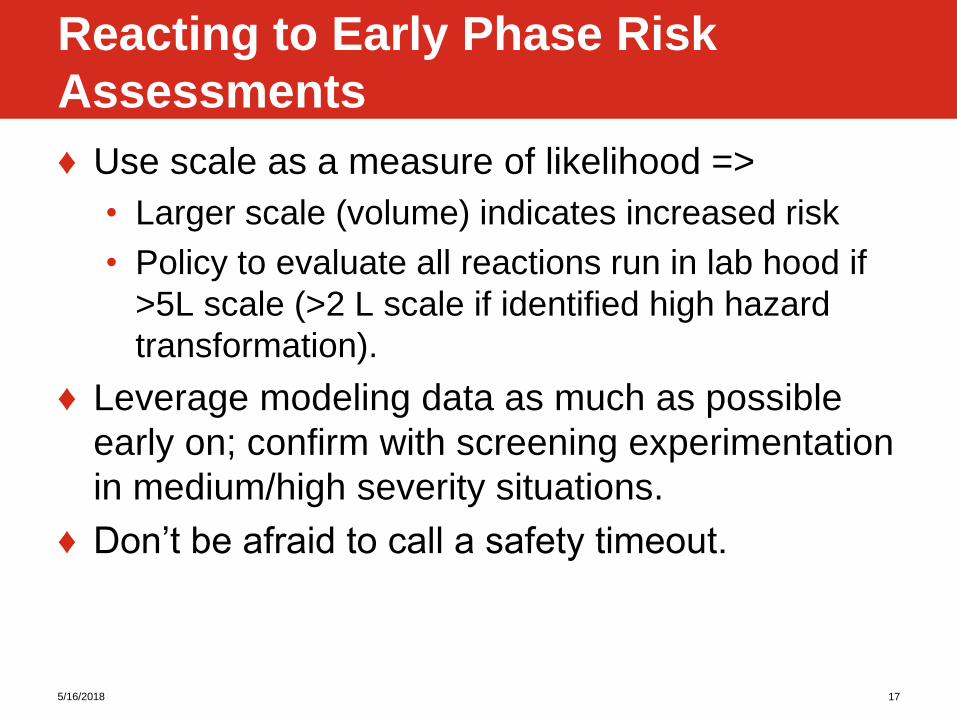
♦ Use scale as a measure of likelihood =>
• Larger scale (volume) indicates increased risk
• Policy to evaluate all reactions run in lab hood if
>5L scale (>2 L scale if identified high hazard
transformation).
♦ Leverage modeling data as much as possible
early on; confirm with screening experimentation
in medium/high severity situations.
♦ Don’t be afraid to call a safety timeout.
5/16/2018 17
Reacting to Early Phase Risk
Assessments
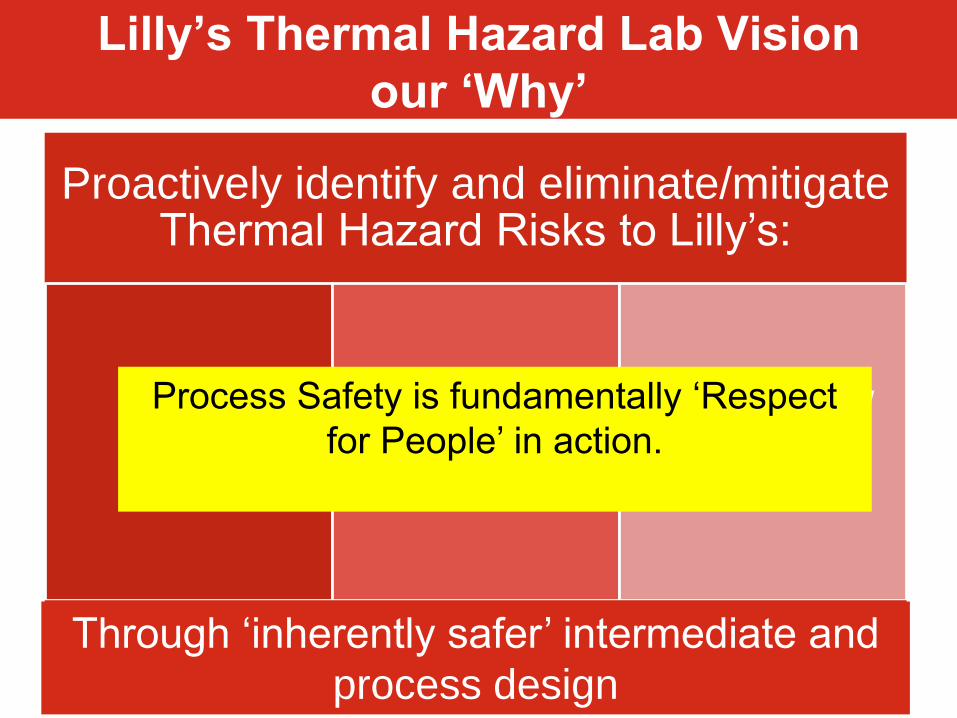
Proactively identify and eliminate/mitigate Thermal Hazard Risks to Lilly’s:
PeopleProperty/
Environment
Processes/
Products
5/16/2018 18Company Confidential © 2015 Eli Lilly and Company
Lilly’s Thermal Hazard Lab Vision
our ‘Why’
Through ‘inherently safer’ intermediate and
process design
Process Safety is fundamentally ‘Respect
for People’ in action.