elevation of brain magnesium prevents and reverses cognitive deficits and synaptic loss in...
TRANSCRIPT

Elevation of Brain Magnesium Prevents and ReversesCognitive Deficits and Synaptic Loss in Alzheimer’s
Disease Mouse Model
Wei Li, Jia Yu, Yong Liu, Xiaojie Huang, Nashat Abumaria, Ying Zhu, Xian Huang, Wenxiang Xiong, Chi Ren, Xian-Guo Liu, Dehua Chui, and Guosong
LiuThe Journal of Neuroscience, 2013 33(19):8423–
8441Presenter: Balogun W. G.
Coordinator: Dr. Akinola O. B.

INTRODUCTION
• Brain magnesium levels (Andra´si et al., 2005) and serum Mg concentrations (Barbagallo et al., 2011) appear to be significantly lower in AD patients compared with age-matched normal subjects.
• Previous studies indicated that the magnesium ion (Mg2+) is a critical factor in controlling synapse density/plasticity (Slutsky et al., 2004)
• In this present work, they show that elevation of brain magnesium prevents/reverses synapse loss and memory deficits in a transgenic mouse model of AD and reveal the possible underlying mechanism.

Aim 1
• They investigate whether elevating brain magnesium can prevent learning and memory deficits in Tg mice.

Method 1: they assessed spatial learning and memory abilities using the water maze task.
Probe test conducted 24 h after the training. (ANOVA differences among quadrants: WT: p 0.05; Tg+MgT: p 0.0001)
Escape latencies in seconds (s) during training (5 trials/d) in water maze task at 7 months of age (i.e., after 1 month of treatment). (ANOVA effect of treatment, p 0.05).

Method 1 cont’d
Water maze tank test on mice at 15 months of age (ANOVA effect of treatment, p 0.05).
Probe test 24 h later (ANOVA differences among quadrants: WT: p 0.0001; Tg+MgT: p 0.0001)

Method 2: they assess STM and LTM using a modified version of the standard NORT
STM (10 min retention interval, left) and LTM (24 h, right) NORTs performed on the same group of mice at 22 months of age Recognition index calculated as percentage of time spent exploring each object (Obj1–3). Black bars indicate novel object (Nov). ANOVA differences in recognition index of different objects in WT (STM: p 0.0001; LTM: p 0.0001) and Tg+MgT (STM: p 0.0001; LTM: p 0.001). Dashed lines represent chance levels of performance (25%).

Method 3: they quantified the magnesium contents (total magnesium in tissue) in brain and in other organs in the behaviorally tested mice
F:Total magnesium (ionized and non ionized) contents in different organs/tissues (Mg tissue) normalized to tissue weight (mg/g) in the groups of mice
G and H: Magnesium ion concentration in the plasma [Mg 2]plasma, and RBC

Table 1. Body weight, food/fluid intake, and locomotor activity in the open field of WT (n7), Tg (n6), and Tg + MgT (n6) mice and the velocity in the water mazetask of WT, Tg, and Tg + MgT mice at age of 7 months and 15 months
Group Body weight (g)
Food intake (g/d)
Fluid intake (ml/d)
Velocity (cm/s)
Distance traveled (cm)
Velocity in the water maze (cm/s) at 7months
Velocity in the water maze (cm/s) at 15months
WT 42.84 ± 3.92
4.08 ± 0.61
7.16 ± 0.26
5.72 ± 0.75
3403.9 ± 443.13
11.2 ± 1.1
12.9 ± 2.6
Tg 40.87 ± 10.80
3.41 ± 1.48
6.83 ± 0.71
4.34 ± 0.48
2573.5±286.99
9.9 ± 1.1 11.1 ± 1.9
Tg + MgT
39.73 ± 3.57
3.69 ± 0.74
6.25 ± 1.00
5.03 ± 0.32
2954.0 ± 159.68
10.8 ± 1.5
11.8 ± 2.4

Aim 2 • Elevation of brain magnesium prevents synapse
loss in Tg mice

Method 1: they examine effects of MgT treatment on synapse density
Immunostaining of synaptophysin-positive terminals (Syn Puncta) in DG-OML. Right, Quantitative analysis of Syn Puncta
Electron microscopic images showing structural synapses (blue arrows) in hippocampal outer molecular layer of DG (DG-OML). Right, Estimated synaptic density

Method 2: the effects of MgT treatment on different types of neurotransmitter terminals Immunostaining of glutamatergic (VGluT1, C), GABAergic (GAD65,D), and acetylcholinergic puncta terminals (vAChT, E)

Method 3: they plot the relationship between synapse density and STM (quantified by the recognition index during the NORT task) in Tg mice
Correlation between the density of Syn Puncta and STM in Tg mice (23 months old). TgMgT(23 months old treated for 17 months) data are displayed, but were not included in the regression analysis (Pearson’s test). Error bars show SEM. *p 0.05; **p 0.01; ***p 0.001


Aim 3• Impairment of NMDAR signaling in Tg mice
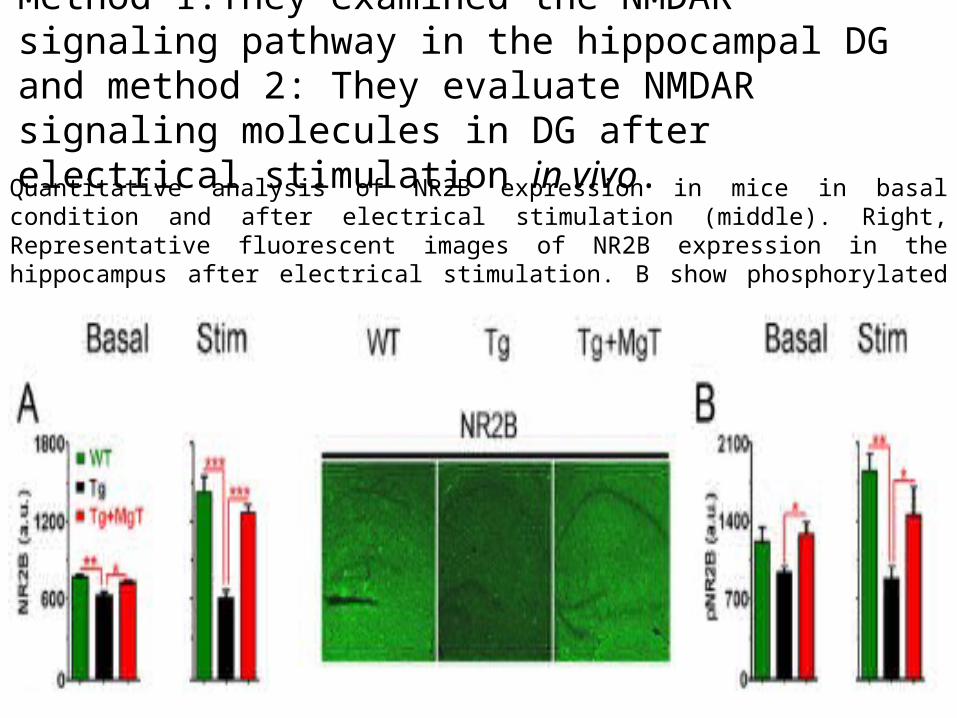
Method 1:They examined the NMDAR signaling pathway in the hippocampal DG and method 2: They evaluate NMDAR signaling molecules in DG after electrical stimulation in vivo.
Quantitative analysis of NR2B expression in mice in basal condition and after electrical stimulation (middle). Right, Representative fluorescent images of NR2B expression in the hippocampus after electrical stimulation. B show phosphorylated NR2B expression

Method 1 and 2 cont’dPhosphorylated CaMKII (pCaMKII)/CaMKII ratio and its Quantitative expression in DG of mice obtained by immunostaining after in vivo hippocampal electrical stimulation 2 h before perfusion
Calmodulin expression in basal and electrical stimulation

Method 1 and 2 cont’dPhosphorylated CREB (pCREB)/CREB ratio (in cell body region only: yellow box)
Phosphorylated ERK1/2 (pERK1/2)/ERK1/2 ratio.

Method 1 and 2 cont’dBDNF expression and its Quantitative expression in DG of mice obtained by immunostaining after in vivo hippocampal electrical stimulation 2 h before perfusion
Phosphorylated TrkB (pTrkB)/TrkB ratio in basal and electrical stimulation

Method 3: They compared the expression/phosphorylation of NMDAR signaling key proteins using quantitative Western blotting. Table show Representative Western blots showing the expression levels of NR2B, pCaMKII, CaMKII, pCREB, and CREB in the hippocampus of mice killed either after home-cage conditions (basal) or after 24 h of environmental-enrichment-based behavioral stimulation (Stim). GAPDH expression served as loading control

Method 3 cont’d Left, Quantitative analysis of NR2B expression in the hippocampus of the mice obtained by Western blot (arbitrary units, a.u.). Mice were killed under basal conditions without behavioral stimulation. Right, Quantitative analysis of NR2B expression the hippocampus of mice obtained by Western blot after behavioral stimulation. K, L, Same as J but quantifying pCaMKII/CaMKII ratio (K) and pCREB/CREB ratio from hippocampal homogenates (L).

Aim 4
• Impairment of protein synthesis and energy pathways in Tg mice

Method 1: they investigated the expression / phosphorylation levels of signaling molecules involved in controlling activity dependent protein synthesis in hippocampal DG
Left, Quantitative analysis of IRS-1 expression in DG of mice obtained by immunostaining (arbitrary units, a.u.). Mice were perfused under basal conditions without behavioral or electrical stimulation. Middle, Expression of IRS-1 in the DG mice obtained by immunostaining after in vivo hippocampal electrical stimulation 2 h before perfusion. Right, Representative fluorescent images of IRS-1 expression in the hippocampus after electrical stimulation. B, Same as A but phosphorylated Akt (pAkt)/Akt ratio
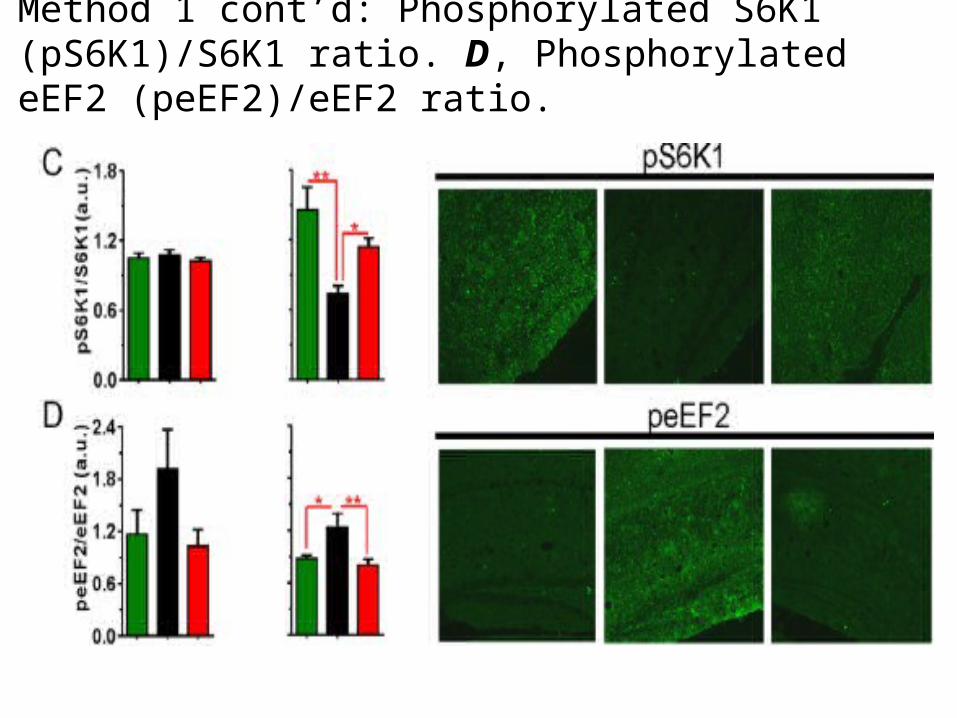
Method 1 cont’d: Phosphorylated S6K1 (pS6K1)/S6K1 ratio. D, Phosphorylated eEF2 (peEF2)/eEF2 ratio.
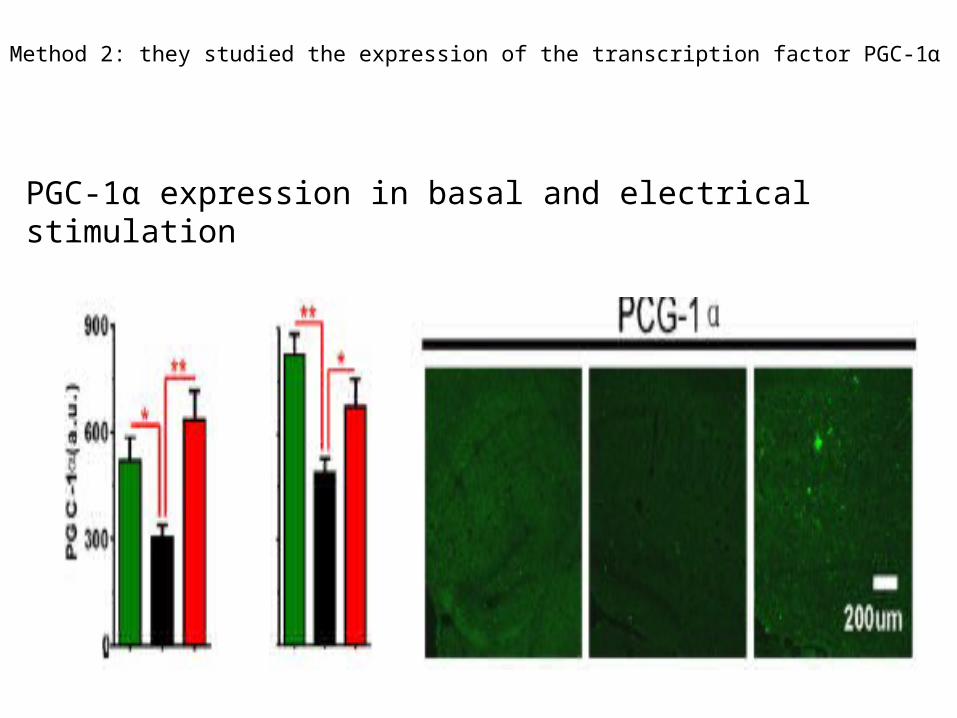
Method 2: they studied the expression of the transcription factor PGC-1α
PGC-1α expression in basal and electrical stimulation

Aim 5
• Over activation of Ca2+-activated signaling molecules in Tg mice
Method• They determined the expression of calpain,
calcineurin and Cdk5

Left, Quantitative analysis of calpain I expression in DG of mice obtained by immunostaining (arbitrary units, a.u.). Mice were perfused under basal conditions Middle, Quantitative analysis of calpain I expression in DG of mice obtained by immunostaining after in vivo hippocampal electrical stimulation (Stim) 2 h before perfusion. Right, Representative fluorescent images of calpain I expression in the hippocampus after electrical stimulation. B, Calcineurin expression. C, Cdk5 expression.

Diagram show Cluster display summarizing the expression and/or phosphorylation level of all investigated signaling molecules under basal conditions (left) and after in vivo hippocampal electrical stimulation (right). Columns represent data from individual mice. Color intensity corresponds to the expression/phosphorylation level.

Aim 6• Prevention of exogenous Aβ42-induced down
regulation of NMDAR synaptic transmission by elevation of (Mg)˳

Method 1: they studied the molecular mechanisms underlying impairment of NMDARs by Aβ
INMDA/AMPA in 0.8-[Mg2+]o, 0.8-[Mg2+]o + Aβ42, and 0.8-[Mg2+]o + Aβ42 + FK506 slices.

Method 2: they investigate whether calcineurin is also involved in the molecular mechanism underlying the up regulation of NMDARs by elevation of [Mg2+]
A show: INMDA/AMPA in 0.8-[Mg 2]o, 1.2-[Mg 2]o (green, n6), 0.8-[Mg 2]o+FK506, and 1.2-[Mg 2]o+FK506 slices. D, INMDA/AMPA in 0.8-[Mg 2]o, 1.2-[Mg 2]oA42, 0.8-[Mg 2]o+FK506, and 1.2-[Mg 2]o +FK506, 0.8-[Mg 2]oAβ42+FK506, and 1.2-[Mg 2]o Aβ42+FK506 B show: Schematic illustration of how high A impairs NMDAR and how elevation of [Mg 2]o might prevent this impairment

Method 3: they studied the effects of Aβ on INMDA after blocking NR2B-containing NMDARs
INMDA/AMPA after the addition of ifenprodil; 0.8-[Mg 2]o, 0.8-[Mg 2]o Aβ42, 1.2-[Mg 2]o, and 1.2-[Mg 2]o Aβ42. The Recordings were conducted in vitro using acute hippocampal slices from 4-week-old WT mice.

Aim 7• Effects of elevating brain magnesium on amyloid
plaques and BACE1 expression

Method 1: they explored whether elevation of brain magnesium can affect APP metabolismA: Top left, Immunostaining of hippocampal amyloid plaque of Tg and Tg + MgT. Right: Hippocampal amyloid plaque areas were significantly lower in Tg + MgT mice. Bottom: Same as above but in the frontal cortex. B, Concentrations of Aβ42 (top) and Aβ40 (bottom) monomers in CSF of Tg and Tg + MgT mice measured by ELISA

Method 2: they investigate the expression of BACE1 in the three groups of miceLeft, Representative fluorescent images of BACE1 expression in the hippocampus after electrical stimulation. Middle, Quantitative analysis of BACE1 expression in DG of WT, Tg, and Tg+MgT mice obtained by immunostaining (arbitrary units, a.u.). Mice were perfused under basal conditions without behavioral or electrical stimulation. Right, Quantitative analysis of BACE1 expression in DG of WT, Tg, and TgMgT mice (n6/group) obtained by immunostaining after in vivo hippocampal electrical stimulation (Stim) 2 h before perfusion.

Method 2 cont’dLeft, Representative Western blots of BACE1 expression in the hippocampus of mice killed under home-cage conditions (basal) or after 24 h of environmental-enrichment-based stimulation (Stim). Middle, Quantitative analysis of BACE1 expression in the hippocampus mice obtained by Western blot. Right, Quantitative analysis of BACE1 expression in the hippocampus of mice obtained by Western blots after behavioral stimulation.

Method 2 cont’dLeft, Representative fluorescent images of human (h) sAPPβ expression in the hippocampus after electrical stimulation. Middle, Quantitative analysis of hsAPPβ expression in DG of mice obtained by immunostaining (arbitrary units, a.u.). Mice were perfused under basal conditions without behavioral or electrical stimulation. Right, Quantitative analysis of hsAPPβ expression in DG of Tg and TgMgT mice obtained by immunostaining after in vivo hippocampal electrical stimulation (Stim) 2 h before perfusion
Left, Representative Western blots of hsAPPβ expression in the hippocampus of mice killed under home-cage conditions (basal) or after 24 h of environmental-enrichment-based stimulation (Stim). Middle, Quantitative analysis of hsAPPβ expression in the hippocampus of Tg and TgMgT mice obtained by Western blot (arbitrary units, a.u.). Mice were killed under basal conditions without behavioral or electrical stimulation. Right, Quantitative analysis of hsAPPβ expression in the hippocampus of Tg and TgMgT mice obtained by Western blots after behavioral stimulation.G, Same as F but for-CTF.

Method 3: they investigated whether BDNF/TrkB signaling could influence BACE1 expression
Correlation between BDNF expression or phosphorylated TrkB levels and BACE1 expression in the hippocampus of Tg mice (Pearson’s test). Data from WT mice are displayed, but were not included in the analysis

Method 4: they investigate if MgT might also regulate BACE1 expression in WT miceA, Left, Representative Western blots of NR2B expression in the hippocampus of WT mice killed under home-cage conditions (basal) or after 24 h of environmental-enrichment-based stimulation (Stim). Middle, Quantitative analysis of NR2B expression in the hippocampus of WT and WT+MgT mice obtained by Western blot (arbitrary units, a.u.). Mice were killed under basal conditions without behavioral or electrical stimulation. Right, Quantitative analysis of NR2B expression in the hippocampus of WT and WT+MgT mice obtained by Western blots after behavioral stimulation. B, Left, Representative Western blots of BACE1 expression in the hippocampus of WT mice killed under home-cage conditions (basal) or after 24 h of environmental-enrichment-based stimulation (Stim). Middle, Quantitative analysis of BACE1 expression in the hippocampus of WT and WT+MgT mice obtained by Western blot (arbitrary units, a.u.). Mice were killed under basal conditions without behavioral or electrical stimulation. Right, Quantitative analysis of BACE1 expression in the hippocampus of WT and WT+MgT mice obtained by Western blots after behavioral stimulation.

Aim 8• Reversal of learning and memory deficits and
synapse loss in aged Tg mice by MgT treatment
Method 1
• They investigate if MgT treatment will be effective at
reversing memory deficits even when it is given at the
end stage of ad-like pathological progression in Tg mice

A, Experimental design to determine whether MgT treatment can reverse behavioral deficits in aged Tg mice. B, Recognition index of the novel object (Nov) and other familiar objects (Obj 1–3) during STM (left) and LTM (right) tests in the NORT task. WT and untreated Tg. C, Same as B and on the same mice but NORT tests were reconducted after MgT treatment was given to Tg mice for 1 month. ANOVA revealed significant differences in WT and MgT-treated aged Tg mice. Dashed lines represent chance levels of performance (25%).

D, Nest construction social behavior in WT and untreated Tg mice. E, Same as D and on the same WT and Tg mice, but after MgT treatment was given to Tg for 1 month.

Method 2: they quantified NR2B and BDNF expression in aged WT mice and aged Tg mice with 1 month of MgT treatment (perfused at the age of 24 months)Quantitative analysis of NR2B expression in DG of WT and aged Tg+MgT mice obtained by immunostaining (arbitrary units, a.u.) G, Same as F but for BDNF expression.
Density of synaptophysin positive terminals (Syn Puncta). Data from untreated aged Tg mice were inserted (black bars) to show the effects of the 1 month treatment. ANOVAs were followed by Bonferroni’s post hoc test.
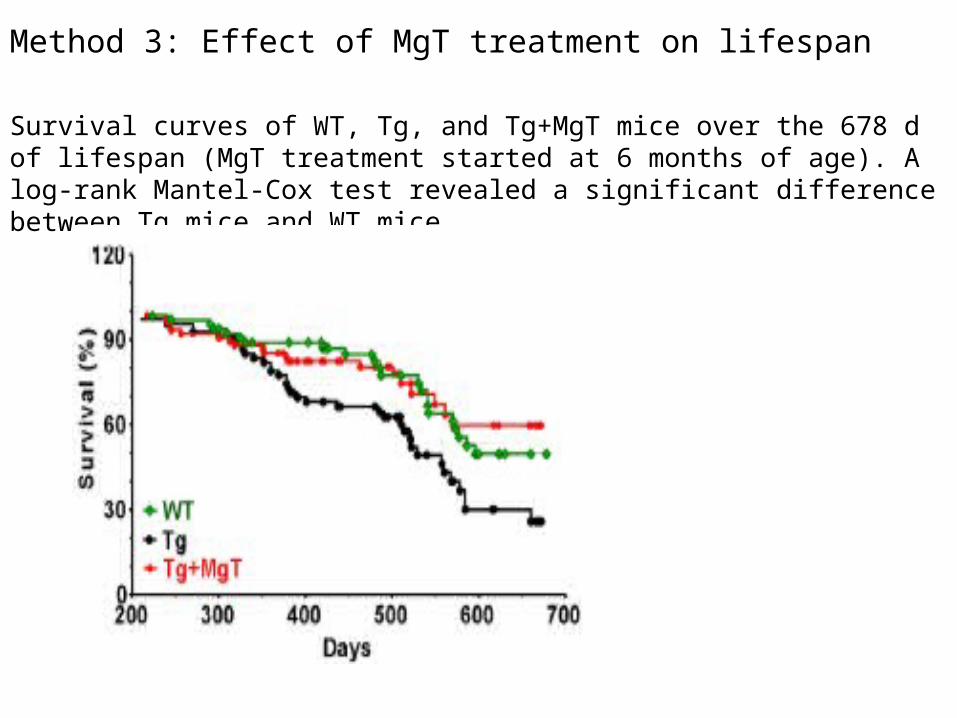
Method 3: Effect of MgT treatment on lifespan
Survival curves of WT, Tg, and Tg+MgT mice over the 678 d of lifespan (MgT treatment started at 6 months of age). A log-rank Mantel-Cox test revealed a significant difference between Tg mice and WT mice

Discussion
• Down regulation of NMDAR signaling was the major AD-like pathological progression in the Tg mice.
• They have shown that elevating brain magnesium was effective at preventing/reversing learning and memory deterioration in Tg mice, a model of AD-like pathologies by regulating NMDA and BACE expression and also restoring synaptic density
• MgT treatment causes elevation of brain magnesium resulting in increase calcium channel blockage, resulting in reductions in brain seizures.
• Restoration/elevation of brain magnesium in AD patients might be beneficial for ameliorating the cognitive deficits of AD.

Research gap• The exact molecular mechanisms underlying
regulation of BACE1 expression/activity by Mg2+ is not known, brothers and sisters you can take this up.

Reference • Andra´si E, Pa´li N, Molna´r Z, Ko¨sel S (2005) Brain
aluminum, magnesium and phosphorus contents of control and Alzheimer-diseased patients. J Alzheimer's Dis. 7:273–284
• Barbagallo M, Belvedere M, Di Bella G, Dominguez LJ (2011) Altered ionized magnesium levels in mild-to-moderate Alzheimer’s disease. Magnes Res 24:S115–121.
• Slutsky I, Sadeghpour S, Li B, Liu G (2004) Enhancement of synaptic plasticity through chronically reduced Ca2+
flux during uncorrelated activity. Neuron 44:835– 849.

Thank you for your
time