elevated temperature material properties of stainless ... et... · properties of stainless steel...
TRANSCRIPT
Full citation: Gardner L, Bu Y., Francis P., Baddoo N.R., Cashell K.A., McCann F. Elevated temperature material properties of stainless steel reinforcing bar. Construction and Building Materials, Volume 114, 1 July 2016, Pages 977–997, http://www.sciencedirect.com/science/article/pii/S0950061816305487
Elevated temperature material properties of stainless steel reinforcing bar
L. Gardnera, Y. Bua, P. Francisb, N. R. Baddoob, K.A. Cashellc and F. McCannd,
a Imperial College London b The Steel Construction Institute
c Brunel University London d London South Bank University
Abstract
Corrosion of carbon steel reinforcing bar can lead to deterioration of concrete structures, especially in
regions where road salt is heavily used or in areas close to sea water. Although stainless steel reinforcing bar
costs more than carbon steel, its selective use for high risk elements is cost-effective when the whole life
costs of the structure are taken into account. Considerations for specifying stainless steel reinforcing bars and
a review of applications are presented herein. Attention is then given to the elevated temperature properties
of stainless steel reinforcing bars, which are needed for structural fire design, but have been unexplored to
date. A programme of isothermal and anisothermal tensile tests on four types of stainless steel reinforcing
bar is described: 1.4307 (304L), 1.4311 (304LN), 1.4162 (LDX 2101) and 1.4362 (2304). Bars of diameter
12 mm and 16 mm were studied, plain round and ribbed. Reduction factors were calculated for the key
strength, stiffness and ductility properties and compared to equivalent factors for stainless steel plate and
strip, as well as those for carbon steel reinforcement. The test results demonstrate that the reduction factors
for 0.2% proof strength, strength at 2% strain and ultimate strength derived for stainless steel plate and strip
can also be applied to stainless steel reinforcing bar. Revised reduction factors for ultimate strain and fracture
strain at elevated temperatures have been proposed. The ability of two-stage Ramberg-Osgood expressions to
capture accurately the stress-strain response of stainless steel reinforcement at both room temperature and
elevated temperatures is also demonstrated.
Keywords
Anisothermal, Constitutive law, Elevated temperature, Fire design, Reinforced concrete, Rebar, Reinforcing
bar, Isothermal, Material modelling, Stainless steel, Stress strain, Structures.
1. Introduction
The traditional approach to improving the durability of reinforced concrete structures is to modify the
concrete specification, in terms of composition and/or cover requirements. Whilst this approach can improve
the performance, it is not an inherently durable solution to the problem of chloride-induced corrosion and

there is a risk that significant maintenance may be required within the design life of the structure.
Maintenance is disruptive and costly, especially when it results in transportation disruptions and/or the loss
of production due to facility shut-down. The use of stainless steel reinforcing bar can be a cost-effective
option for structures in potentially corrosive environments which are expensive to maintain and repair
because stainless steel is highly resistant to corrosion from chloride ions and does not rely on the high
alkalinity of concrete for protection. As well as reduced maintenance costs, the use of stainless steel
reinforcement will give the structure a longer design life (> 100 years) compared with carbon steel and
enable a reduction in concrete cover and weight of deck and substructure.
Stainless steels derive their inherent corrosion resistance from the presence of certain alloying elements,
primarily chromium and nickel, which result in differences in microstructure compared to carbon steel. The
physical and mechanical properties of stainless steels at room temperature, and at elevated temperatures, also
differ from carbon steel. Stainless steels generally retain more of their room temperature strength than carbon
steel above temperatures of about 550C, and more of their stiffness than carbon steel across the whole
temperature range [1, 2]. Although there have been a number of investigations into the performance of
stainless steel flat material at elevated temperatures, data on the performance of stainless steel reinforcing bar
at elevated temperatures are scarce and no information is given in EN 1992-1-2, the Eurocode dealing with
the performance of concrete structures at elevated temperatures [3]. This is an important gap in technical
knowledge, especially since the protection of key infrastructure elements is becoming increasingly
important. As described by Garlock et al. [4], the majority of fires that occur on bridges are hydrocarbon
fires, often as a result of spillage from crashed oil tankers. These hydrocarbon fires are characterised by high
heating rates, which means failure can occur only a short time after ignition. A notable bridge fire occurred
in Birmingham, Alabama in 2002 when a petroleum truck collided with a bridge support at the junction of
Interstates 65, 20, and 59. The tanker’s cargo ignited, causing a severe fire which damaged the bridge to such
an extent that it had to be completely replaced; the consequent traffic disruption was enormously costly [5].
Giuliani et al. [6] studied the vulnerability of bridges to fire and concluded that in the majority of bridge
fires, the bridge structure was significantly damaged and high repair costs were sustained. Even where
limited structural damage had occurred, high costs due to the temporary closure of the bridge and traffic
disruption had to be sustained.
This paper describes the outcomes of a test programme aimed at investigating the elevated temperature
material characteristics for stainless steel reinforcement. Two test methods (anisothermal and isothermal)
were used to assess the mechanical behaviour at elevated temperatures of plain and ribbed bars of diameter
12 mm and 16 mm in four grades of stainless steel.
2. Applications of stainless steel reinforcing bar
Stainless reinforcing bar was first developed in the 1930’s [7] and the earliest known structure with stainless
steel reinforcement was the 2100 m long Progreso Pier in the Gulf of Mexico, which was built in 1940 and is
still fit-for-purpose (background, Figure 1). Stainless steel was selected due to the warm and humid marine
environment and the use of local limestone aggregate in the concrete with a relatively high porosity. In 1969,

a neighbouring pier was built with carbon steel reinforcement which has now suffered very severe corrosion
(foreground, Figure 1).
No further applications were found until 1970, when the issue of chloride ingress began to be recognised as a
significant problem for reinforced concrete structures in corrosive environments. Since then, stainless steel
reinforcing bar has been used around the world in a range of large and small structures including bridges,
tunnels, buildings, harbour installations, temples and monuments, both for new structures as well as for
repairing corrosion-damaged structures [8]. The non-magnetic property of austenitic stainless steel has also
led to the use of stainless steel reinforcing bar in buildings such as hospitals, banks, airports and
meteorological stations which house equipment sensitive to magnetic fields.
A more recent example of stainless steel reinforcement being used in a large infrastructure project is in
Edmonton, Canada. The very low winter temperatures and high annual snowfall in this area leads to the
application of large amounts of salt, both sodium and the more corrosive calcium chloride, to keep the roads
as free from ice as possible. Following a successful trial in 2011, around 6000 tonnes of grade 1.4362 duplex
stainless steel reinforcing bar were specified for the construction of a new interchange (bridge substructure,
retaining walls, overpass etc) on the ring road around the city [8].
Stainless steels are inevitably more expensive than carbon steel due to the alloying elements they contain. In
order to realise a whole life cost benefit, it is generally necessary to concentrate stainless steel reinforcing bar
in areas of the structure most at risk. Gedge [9] presents a classification system for structural elements that
are likely to benefit from specification of stainless reinforcing bar. For the majority of highway bridges, use
of stainless steel reinforcing bar for parapet edge beams, bearing shelves on jointed bridges, abutments and
intermediate supports adjacent to the carriageway is considered the most cost-effective solution. The United
Kingdom’s Highway Agency has specifically recognised selective use of stainless steel as a viable option for
reduced whole cost of a structure in its Design Manual for Roads and Bridges [10]. Predictive models for
specifying the level of corrosion resistance required for reinforcing bar in a range of service environments
have also been developed [11].
Research by the Virginia Transportation Research Council found that the whole life cost of a bridge that
utilises corrosion resistant metallic reinforcing bars (CRR) is substantially less than standard designs with
either conventional or epoxy-coated reinforcing bar. As a result, all projects in the State of Virginia with a
design life of 75 years or longer are required to use CRR steels and not epoxy coated or galvanised bars [12].
Reinforcing bar is also available in high strength, high chromium microcomposite steels with improved
resistance to corrosion, known as MMFX steels [13]. They contain about 9% chromium, so cannot be
classified as stainless steel and do not demonstrate the level of corrosion resistance of the standard stainless
steels used in the reinforcing bar which are studied in this paper. Another solution for extending the life of
reinforced concrete structures exposed to corrosive environments are glass fibre reinforced polymers
reinforcing bar. However glass fibre performs poorly at elevated temperatures, and melts at around 800°C.
Numerical modelling has shown that the fire resistance of a beam with carbon steel reinforcing bar is at least
double that of an equivalent beam with glass fibre reinforcement [14].

3. Specification of stainless steel reinforcing bar
The sizes of stainless steel reinforcing bars generally range in diameter from 8 mm to 25 mm, and are
produced in coils and straight bars cut up to 12 m in length. The two most widely used specifications for
stainless steel reinforcement are the British Standard BS 6744 [15] and the American Standard ASTM A955
[16]. These standards both adopt the bar profiles and strength classes given in the British and American
carbon steel reinforcing bar standards respectively (EN 10080 [17] and ASTM A615/A615M [18]). The
stainless steel material designations in BS 6744 are in accordance with EN 10088-1 [19] and the designations
in ASTM A955 are in accordance with ASTM A276 [20].
The test programme described in this paper involved reinforcing bar made from four different grades of
stainless steel, which are currently widely used for reinforcing bar, as well as for structural members such as
hollow sections, channels, angles, I sections, etc [21-22]. The distinctive characteristics of these steels are
given below.
Grade 1.4307 (304L)
This is a low-carbon, standard chromium-nickel austenitic stainless steel. These standard austenitic steels are
the most widely used group of stainless steels in construction. Due to its fully austenitic structure, it is
suitable for applications with low magnetic permeability requirements.
Grade 1.4311 (304LN)
This is a low-carbon, higher nickel and nitrogen alloyed austenitic stainless steel with improved strength and
low-temperature toughness, compared with grade 1.4307. It is also suitable for low magnetic permeability
requirements.
Grade 1.4162 (LDX 2101®)
This is a low-nickel, general-purpose duplex stainless steel, known as a ‘lean’ duplex [23, 24]. Duplex
stainless steels have approximately twice the strength of austenitic stainless steels. The corrosion resistance
of grade 1.4162 is generally as good as the standard chromium-nickel austenitic steels and the reduced nickel
content means it also costs about the same also.
Grade 1.4362 (2304)
This is a duplex stainless steel with superior corrosion resistance compared with grade 1.4162, mainly due to
the higher content of nickel.
Equivalent designations for these steels are given in Table 1. Note that BS 6744 only lists one standard
chromium-nickel austenitic stainless steel, grade 1.4301, with a note permitting the nitrogen content to be
increased to a maximum of 0.22%. However, the composition of both grade 1.4307 and grade 1.4311 fall
within the compositional limits of grade 1.4301. Guidance on the choice of stainless steel for a given
application is provided in Annex B of BS 6744 [15]; the specific information relating to the grades in the test
programme reported herein is reproduced in Table 2.
BS 6744 covers three strength grades: 200, 500 and 650, which correspond to minimum 0.2% proof strengths
of 200 MPa, 500 MPa and 650 MPa, respectively. Bars in accordance with the strength grade 500 are most

commonly used. ASTM A955 covers two strength classes, grade 60 (yield strength of 420 MPa) and grade
75 (yield strength of 520 MPa).
The strength of austenitic stainless steel bars in the annealed (softened) condition is 175 MPa for grade
1.4307 and 270 MPa for grade 1.4311. The strength of these steels can be increased so that they meet the
requirements of either the 200 or 500 strength class in BS 6744 through the addition of cold-work. The
strength of duplex stainless steel bars in the annealed condition is 450 MPa for grade 1.4162 and 400 MPa
for grade 1.4362. As with the austenitics, the strength of these bars can be increased to either class 500 or
class 650 through the addition of cold-work. In the US, in accordance with the terminology used in ASTM
A955 [16], austenitic reinforcement is available in grade 60 whereas duplex reinforcing bars are available in
grades 60 and 75.
4. Thermal properties of stainless steel
The thermal properties of stainless steels differ from those of carbon steels because of the effect of the
differences in microstructure and alloying content. The thermal conductivity of stainless steel and carbon
steel [3] are presented in Figure 2; it is noteworthy that the thermal conductivity is the same for austenitic
and duplex stainless steels. The low thermal conductivity of stainless steel compared to carbon steel (and
copper and aluminium also) has led to the use of stainless steel in thermal breaks and other applications
requiring thermal insulation.
The specific heat capacity of stainless steel is compared to carbon steel [3] in Figure 3. The specific heat of
the two materials is similar (around 550 to 600 J/kg K), with the exception that carbon steel undergoes a
phase change at around 750C where the microstructure changes from pearlite (a two-phase mixture of
ferrite and cementite) to austenite.
Figure 4 compares the thermal expansion of austenitic and duplex stainless steels with the values for carbon
steel and concrete taken from EN 1992-1-2 [3]. These stainless steels exhibit greater thermal expansion than
carbon steel for all temperatures and do not have the characteristic phase-change plateau at around 750C.
The thermal expansion behaviour of concrete is dependent on the aggregate type used. As shown in Figure 4,
this property increases steadily with temperature until around 700 or 800C (for siliceous or calcareous
aggregates, respectively) after which it plateaus and remains constant; this is due to chemical changes in the
constituent materials at these temperatures [25].
5. Fire resistant design of structural stainless steel
Unlike carbon steel, stainless steel does not exhibit a clearly defined yield stress at room temperature.
Instead, the stress-strain curve is non-linear, with increasing strength accompanied by reducing stiffness
(Figure 5). For materials which exhibit these stress-strain characteristics, it is conventional to use the 0.2%
proof strength f0.2p as the design strength. Beyond this point, no further strain hardening is considered in
traditional design, though it is considered, and systematically harnessed, in the deformation based continuous
strength method [26-28]. The non-linear stress-strain characteristics lead to some differences in the structural
performance of stainless steel members compared to carbon steel members, which are generally reflected in
the design rules set out in EN 1993-1-4 [29].
The fire resistance of structural stainless steel members can be determined using EN 1993-1-2 [30]. The
simplified design rules for carbon steel structures can be safely applied to stainless steel in combination with
the specific strength and stiffness reduction factors for the grade of stainless steel. The reduction factors are
the ratio of strength (or stiffness or strain) at the elevated design temperature to the strength (or stiffness or
strain) at room temperature. As mentioned previously, the reduction factors for stainless steel differ quite
significantly from those for carbon steel because of the different microstructure and alloying elements. These
specific factors for stainless steel are given in Annex C of EN 1993-1-2, where a stress-strain relationship for
stainless steel at elevated temperatures is also defined. Since this standard was published, a significant
amount of further research has been carried out into the performance of stainless steel in fire [31-38] and
more data are available on the performance of a larger number of stainless steels suitable for structural
applications. In the next edition of EN 1993-1-2, it is therefore proposed to include eight generic sets of
reduction factors which describe the elevated temperature behaviour for a group of stainless steels, instead of
a set of reduction factors for each specific grade of stainless steel [39].
When the response of a structural element in fire is considered, larger strains can be tolerated than at room
temperature. This reflects the fact that an element is likely to be either repaired or replaced once exposed to
fire, meaning large deformations during the fire do not need to be mitigated against. For these reasons, the
steel strength at 2% total strain is generally used for fire design in EN 1993. For stainless steel, this can result
in a significant increase in strength, as a result of strain hardening. Annex C of EN 1993-1-2 gives an
expression (Eq. (1)) for calculating the strength at 2% total strain fy, at a temperature from the 0.2% proof
stress f0.2p, and ultimate stress fu, at this temperature:
)( ,2.0,%,2,2.0, pupy ffkff (1)
where k2%, is a factor for calculating fy,.
For concrete structures, fire design is covered by EN 1992-1-2 [3]. Reduction factors for the properties of
concrete and reinforcing steel are given to account for the degradation of strength and stiffness of the
materials with temperature. The degraded material properties are used with temperature-dependent effective
depth and width parameters to calculate the resistance at a given temperature, using the same mechanical
models as for room temperature design.
EN 1992-1-2 describes the stress-strain relationship of reinforcing steel through the following parameters:
the slope of the linear elastic range Eθ, the proportional limit fp,θ and corresponding strain εp,θ, the maximum
stress level fy,, defined at the strength at 2% strain, and corresponding strain εy,θ = 0.02, and the strain at the
ultimate tensile stress εu,θ. Note that EN 1992-1-2 employs a subscript s in the above symbols to denote steel
reinforcement and that the strain at the ultimate tensile stress is denoted εst,θ; εu,θ is employed herein for
consistency with the notation used for stainless steel in EN 1993-1-2. The stress-strain relationship for
reinforcing steel is the same as that given in EN 1993-1-2 for flat structural steel material. Furthermore, the
Class N reduction factors for hot rolled carbon steel reinforcing bar are the same as those in EN 1993-1-2 for

flat structural steel material. The Class N maximum stress level reduction factors for hot rolled material are
greater than or equal to those for cold-worked material for temperatures up to 800C, while the stiffness
reduction factors are greater than or equal to those for cold-worked material at all temperatures.
The purpose of the test programme described in this paper is to investigate whether the same reduction
factors for stainless steel flat material can be applied to stainless steel reinforcing bar. The performance of
different bar diameters and product forms (plain and ribbed) is also compared.
6. Elevated temperature test programme
An experimental study to determine the elevated temperature material stress-strain properties of stainless
steel reinforcing bars was performed in the Structures Laboratory at Imperial College London. A total of 164
elevated temperature material tests were conducted, covering both plain and ribbed reinforcement, austenitic
and duplex material and two bar diameters. The tested material was cold-worked to strength class 500. Two
testing methods were employed – steady-state (isothermal) and transient-state (anisothermal). In the steady-
state tests, the coupons were heated to a target temperature that was then held constant while the coupon was
subjected to an increasing axial tensile load until fracture. In the transient-state tests, the coupons were
loaded with a target tensile stress that was then held constant while the coupon was heated until fracture.
Steady-state tests enable full stress-strain curves, which are suitable for use in analytical and numerical
models, to be obtained directly, while transient-state tests more closely mimic realistic fire conditions, i.e.
static load followed by increasing temperature. Values were obtained for the following temperature-
dependent material properties, where is temperature:
Modulus of elasticity E
0.2% proof strength f0.2p,
Strength at 2% strain fy,
Ultimate strength fu,
Strain at ultimate tensile stress, u,and
Strain at fracture, f,
These properties are illustrated in Figure 6. From the test results, temperature-dependent reduction factors
were calculated for each of the material properties, which are compared later with existing code provisions.
6.1 Test apparatus
Figure 7 shows the test apparatus, which comprised an Instron 750 hydraulic testing machine, an electric
furnace capable of heating to temperatures up to 1100°C, a heat control unit with temperature probes which
were inserted into the top of furnace, thermocouples attached to the test specimens, rock-wool insulation at
either end of the furnace and an extensometer. The extensometer, shown in Figure 8, comprised two clamps
fixed to the specimen with pointed bolts, two invar rods, a contact plate and a linear variable differential
transducer (LVDT). The machine load, machine displacement, LVDT displacement and thermocouple

readings were recorded using the DATASCAN data acquisition equipment and logged using the DSLOG
computer package at one second intervals.
6.2 Test specimens
Table 3 summarises the test programme. Each coupon had an overall length of 1000 mm with a gauge length
L of 60 mm or 80 mm for the 12 mm and 16 mm bars, respectively. In order to ensure that the coupons failed
within the gauge length (thus providing full stress-strain curves up to fracture), the test pieces in this region
were narrowed either by a reduction of 1 mm in diameter for the plain round specimens or 0.5 mm on each
side for the deformed bars. The extensometer was aligned with the centre of the furnace to ensure that the
length of coupon being measured coincided with the region of the furnace at the target test temperature.
Standard gauge lengths [40] of oAL 65.5 , where Ao is the original cross-sectional area of the coupons in
the narrowed region, were also marked onto the specimens for the calculation of the fracture strain after
testing.
6.3 Testing methods
Two complementary elevated temperature material testing methods were employed in the programme, as
described in the following sub-sections. All tests were conducted in accordance with ISO 6892 Parts 1 [40]
and 2 [41], following the prescribed heating rates and loading rates.
6.3.1 Steady-state (isothermal) tests
In the steady-state tests, the specimens were heated up to the target temperature at a rate of 10°C/min. A time
period of 10 to 15 minutes was allowed after the heating phase for the temperature to settle. The target
temperatures ranged from room temperature to 1000°C in increments of 100°C. During the heating phase,
the testing machine was set to load control so that the upper jaw of the machine could displace to
accommodate the thermal expansion of the specimen, thus ensuring no load was induced. The tensile
coupons were then tested until fracture under displacement control at a displacement rate of 0.05 mm/s, in
keeping with the strain rates set out in [41]. Typical isothermal stress-strain curves (for the 12 mm diameter
grade 1.4307 specimens) are shown in Figure 9 while the reduction factors derived from the results of the
steady-state tests are presented in Section 7. The room temperature test results are given in Table 4.
6.3.2 Transient-state (anisothermal) tests
In the transient-state tests, the specimens were first loaded in tension to a particular level and then subjected
to increasing temperature until failure. The applied stress levels ranged from 10% to 90% of the ultimate
strength at room temperature. While maintaining the loads at these levels, with the testing machine set to
load control, the furnace temperature was increased by 10°C/min until failure. The heating rate of 10˚C/min
is similar to the rate of temperature increase of protected steelwork during a fire [39]. The actual rate of
temperature increase experienced by a reinforcing bar embedded in concrete in typical fire conditions
depends on the type of aggregate, cover and thermal gradient through the cross-section and is difficult to
measure experimentally, though the high thermal inertia of reinforced concrete structural elements will result
in relatively slow rates of temperature increase through the cross-section. Lamond and Pielert [42] report that
the maximum temperature to be reached by reinforcing bar in normal weight concrete with 25 mm cover
would be around 400-450°C, whereas 50 mm of cover would limit the temperature to around 200°C. Since
the strength of the steel decreases with increasing temperature, the higher the applied stress level, the lower
the failure temperature. The results of the transient-state tests are presented in Section 7.
The displacement readings from the extensometer comprised components relating to the mechanical tensile
strain of the coupons, the thermal strain of the coupons and also some thermal strains associated with the
extensometer apparatus itself. For the steady-state tests, once the target temperature was achieved, the
extensometer reading was zeroed and thus only the mechanical strain was measured. For the transient-state
tests, however, both mechanical and thermal strains arise with increasing temperature. To isolate the thermal
strains, extensometer readings were taken during the heating phase of an unloaded coupon up to 1000°C. The
resulting thermal strains were then deducted from the total temperature-strain plots to give only the strains
induced from the effect of the applied load.
By examining the full set of transient-state temperature-strain curves, of which there is one at each applied
stress level, stress-strain curves can be derived by extracting strains corresponding to a specific temperature
from each curve, and plotting these against the respective applied stresses, as demonstrated in Figure 10,
resulting in a set of isothermal stress-strain curves. For higher temperatures, for example at 2 in Figure 10,
fewer data points are available since for transient-state tests performed at the higher applied stress levels (f3
in the example) the failure temperature is lower than the temperature in question.
7. Test results and recommendations
7.1 Reduction factors
The results of the tests (i.e. the derived reduction factors) are presented in Figures 11 to 22 for the austenitic
stainless steel (grades 1.4307 and 1.4311) reinforcing bars and Figures 23 to 34 for the duplex stainless steel
(grades 1.4162 and 1.4362) reinforcement. The derived reduction factors, which may be used in simplified
fire design methods, are compared with the reduction factors given in EN 1992-1-2 for cold-worked carbon
steel reinforcement and the reduction factors set out by Gardner et al. [39] for different groups of austenitic
and duplex stainless steels. Note that EN 1992-1-2 does not provide reduction factors for 0.2% proof strength
for carbon steel reinforcement, so comparisons are made against the proportional limit reduction factors for
this property. The three groups of austenitic stainless steels defined by Gardner et al. [39] are: austenitic I
(1.4301, 1.4318 and 1.4818), austenitic II (1:4401/4 and 1.4541) for more highly alloyed or stabilised grades
and austenitic III (1.4571), this stabilised grade being treated separately due to its superior elevated
temperature performance. The two austenitic stainless steel grades tested herein are most closely aligned to
the austenitic I group, and comparisons are therefore made with the reduction factors proposed for this
group. The two groups of duplex stainless steel [39] are duplex I (1.4362) and, with higher nitrogen content,
duplex II (1.4462 and 1.4162). The results for the two duplex grades tested herein are compared with the
reduction factors for their corresponding group. The reduction factors proposed by Gardner et al. [39] will be
recommended for inclusion in the next revision of EN 1993-1-2. The following comparisons and
observations are made:
No consistent differences were noted between the results of isothermal and anisothermal tests or
between the reduction factors of the 12 mm and 16 mm diameter bars. Similarly, the results for the
plain and ribbed bars follow a comparable pattern. Therefore, in the assessment of reduction factors,
all data are given equal weighting.
The reduction factors derived from the test results for the 0.2% proof strength (k0.2p = f0.2p,/f0.2p) are
plotted in Figures 11 and 12 for the austenitic grades and Figure 23 and 24 for the duplex grades
with the reduction factors of Gardner et al. [39] derived for flat stainless steel material, and also the
proportional limit reduction factors for carbon steel cold-worked reinforcement given in EN 1992-1-
2 [3]. All the results from the isothermal tests lie on or above the recommended stainless steel
reduction factor curves. However, many of the anisothermal test results fall below the recommended
curves, particularly at 800°C and above. This may be partly attributed to the difficulty in obtaining
reliable values for 0.2% proof strengths from anisothermal tests at these very high temperatures, but
also reflects the findings of previous research on cold-formed stainless steel sections [43], which
showed that strength enhancements derived from cold-work are lost at 800°C and above. It was
therefore recommended in [39] that, for 800°C and above, the elevated temperature 0.2% proof
strength should be based on the recommended reduction factors, but multiplied by the room
temperature 0.2% proof strength of the annealed material (i.e. removing the benefit of cold-work).
Presented in an alternative fashion, the room temperature properties are fixed, but the recommended
0.2% proof strength reduction factors are multiplied by the ratio of the annealed to the cold-worked
0.2% proof strength for 800°C and above. The same recommendation is made herein for
reinforcement, though it should be noted that reinforcing steel, embedded in concrete, is unlikely to
experience such high temperatures.
The reduction factors derived from the test results for the ultimate strength (ku = fu,/fu) – see Figures
13 and 14 for the austenitic grades and Figures 25 and 26 for the duplex grades – are plotted with the
recommended stainless steel reduction factors from [39] and those for carbon steel cold-worked
reinforcement in EN 1992-1-2, noting in the latter case that reduction factors for ultimate strength
are the same as those for the strength at 2% strain (referred to as yield strength and denoted fsy, in
EN 1992-1-2). The test results are generally well represented by the recommended stainless steel
reduction factors [39], including at the very high temperatures. Compared to the 0.2% proof strength,
the influence of cold-work is far less pronounced on the ultimate strength; it is therefore
recommended that no adjustment is needed to the reduction factors to account for this.
The test results for the k2%, factor are plotted in Figures 15 and 16 for the austenitic grades and
Figures 27 and 28 for the duplex grades with the values given in [39]. Note that the k2%, factors
define the strength at 2% strain as a proportion of the difference between the 0.2% proof strength
and the ultimate strength. Therefore, when the values of the 0.2% proof strength and the ultimate

strength are close, experimental data for the k2%, factor can become rather scattered, as is the case
herein, and sensitive to the degree of cold-work to which the material has been subjected. However,
in such circumstances, since the strength at 2% strain in already closely bound (by the 0.2% proof
strength and ultimate strength), the influence of the k2%, factor is very small. It is recommended that
the proposed values for the k2%, factor based on flat material [39] may also be applied to stainless
steel reinforcement.
The reduction factors derived from the isothermal test results for the modulus of elasticity (kE = E/E)
are plotted in Figures 17 and 18 for the austenitic grades and Figures 29 and 30 for the duplex grades
with the values for stainless steel given in EN 1993-1-2 and the values for carbon steel cold-worked
bar given in EN 1992-1-2. The test results are generally well represented by the Eurocode reduction
factors for stainless steel up to about 600°C, though at higher temperatures, the experimental
reduction factors are generally below those given in the code. This, as well as the high degree of
scatter, has also been observed in previous studies [39, 43]. It is important to note that, as previously
stated, the temperature of steel reinforcement in a fire is unlikely to ever be greater than 400-450°C
due to the presence of surrounding concrete [42]. Nevertheless, further research is needed in this
area, and it is recommended herein that consideration is given to having different reduction factors
for modulus of elasticity for the different families of stainless steel, rather than the single set of
reduction factors currently given in EN 1993-1-2.
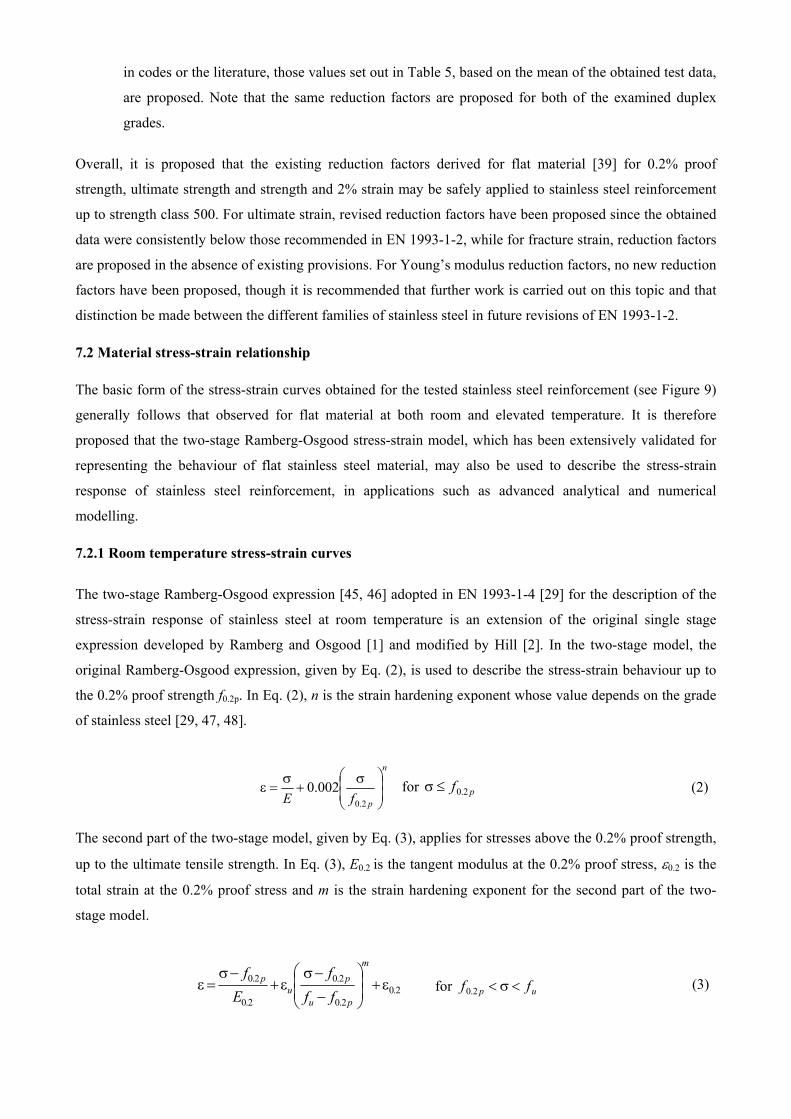
The reduction factors derived from the test results for the ultimate strain (kεu = εu,/εu), where εu is the
ultimate strain at room temperature, are plotted in Figures 19 and 20 for the austenitic grades and
Figures 31 and 32 for the duplex grades with the values for stainless steel given in EN 1993-1-2 and
the recommendations made by Chen and Young [44]. Note that there are no existing
recommendations for grade 1.4362 stainless steel (Figure 32). The EN 1993-1-2 reduction factors
and the Chen and Young recommendations generally follow the same trend as the test data, which is
reducing ductility with temperature until about 800°C, followed by plateauing or rising values. The
test ultimate strains are however consistently below those predicted by EN 1993-1-2, and hence
revised reduction factors, presented in Table 5 and shown in Figures 19, 20, 31 and 32 are
recommended. The proposals are based on the mean of the obtained data, and also considering the
results of Chen and Young [44] as an additional data set, since their recommendations were based on
single data sets for grades 1.4301 and 1.4162 stainless steel. For the grade 1.4362 material, reduction
factors have been proposed in the absence of existing values. The proposed reduction factors are
assumed to be representative of their respective groups (austenitic I, duplex I and duplex II).
The reduction factors derived from the test results for the fracture strain (kεf = εf,/εf) where εf is the
fracture strain at room temperature, are plotted in Figures 21 and 22 for the austenitic grades and
Figures 33 and 34 for the duplex grades. The consistent trend of the test results is for the fracture
strain to initially reduce below the room temperature value for temperatures up to about 800°C,
beyond which higher fracture strains are observed. In the absence of reduction factors recommended
in codes or the literature, those values set out in Table 5, based on the mean of the obtained test data,
are proposed. Note that the same reduction factors are proposed for both of the examined duplex
grades.
Overall, it is proposed that the existing reduction factors derived for flat material [39] for 0.2% proof
strength, ultimate strength and strength and 2% strain may be safely applied to stainless steel reinforcement
up to strength class 500. For ultimate strain, revised reduction factors have been proposed since the obtained
data were consistently below those recommended in EN 1993-1-2, while for fracture strain, reduction factors
are proposed in the absence of existing provisions. For Young’s modulus reduction factors, no new reduction
factors have been proposed, though it is recommended that further work is carried out on this topic and that
distinction be made between the different families of stainless steel in future revisions of EN 1993-1-2.
7.2 Material stress-strain relationship
The basic form of the stress-strain curves obtained for the tested stainless steel reinforcement (see Figure 9)
generally follows that observed for flat material at both room and elevated temperature. It is therefore
proposed that the two-stage Ramberg-Osgood stress-strain model, which has been extensively validated for
representing the behaviour of flat stainless steel material, may also be used to describe the stress-strain
response of stainless steel reinforcement, in applications such as advanced analytical and numerical
modelling.
7.2.1 Room temperature stress-strain curves
The two-stage Ramberg-Osgood expression [45, 46] adopted in EN 1993-1-4 [29] for the description of the
stress-strain response of stainless steel at room temperature is an extension of the original single stage
expression developed by Ramberg and Osgood [1] and modified by Hill [2]. In the two-stage model, the
original Ramberg-Osgood expression, given by Eq. (2), is used to describe the stress-strain behaviour up to
the 0.2% proof strength f0.2p. In Eq. (2), n is the strain hardening exponent whose value depends on the grade
of stainless steel [29, 47, 48].
n
pfE
2.0
002.0 for pf 2.0 (2)
The second part of the two-stage model, given by Eq. (3), applies for stresses above the 0.2% proof strength,
up to the ultimate tensile strength. In Eq. (3), E0.2 is the tangent modulus at the 0.2% proof stress, 0.2 is the
total strain at the 0.2% proof stress and m is the strain hardening exponent for the second part of the two-
stage model.
2.02.0
2.0
2.0
2.0
m
pu
pu
p
ff
f
E
f for up ff 2.0 (3)

As an alternative to Eq. (3), the second part of the two-stage model may be defined on the basis of a
Ramberg-Osgood curve passing through the 1% proof stress f1.0p, as given by Eq. (4), where 1.0 is the total
strain at the 1% proof stress and n0.2,1.0 is the strain hardening exponent for the second part of the two-stage
model described by Eq. (4).
2.02.00.1
2.0
2.0
2.00.12.00.1
2.0
2.00.1,2.0
n
pp
ppp
ff
f
E
ff
E
f for up ff 2.0 (4)
Although very accurate representations of the stress-strain response of stainless steel up to the ultimate stress
can be achieved using either Eq. (3) or Eq. (4), Eq. (4) would generally be slightly more accurate at higher
strains since the curve passes, approximately [48], through the ultimate stress/strain point, while Eq. (4)
would generally be slightly more accurate at lower strains since the curve passes through the 1% proof stress.
Eq. (3) is therefore considered to be more suitable for modelling scenarios where very high strain would be
expected (e.g. connections) while Eq. (4) may be more suitable for modelling stainless steel structural
members. Additionally, a three-stage model, which utilises Eq. (4) up to 2% strain, followed by a linear
relationship has been proposed [50].
Typical comparisons between the measured room temperature stress-strain curves on stainless steel
reinforcement (for 1.4162D12 material) from the present study and the two (Eqs (2) and (3) and Eqs (2) and
(4)) two-stage Ramberg-Osgood models described above are shown in Figure 35. Both models may be seen
to provide an excellent representation of the experimental curves and are thus deemed suitable for the
description of the stress-strain response of stainless steel reinforcement. For the data shown in Figure 35, the
maximum absolute error between the measured test stress-strain curve and the Ramberg-Osgood models is
about 20 N/mm2 for both Eqs (2) and (3) and Eqs (2) and (4), though this corresponds to a point on the early
part of the stress-strain curve where stress is varying rapidly with strain. The mean absolute error over the
full range of data is 3.3 N/mm2 for Eqs (2) and (3) and 4.8 N/mm2 for Eqs (2) and (4). Average values for the
strain hardening parameters n, m and n0.2,1.0 obtained from the tests performed in the present study are
reported in Table 6.
7.2.2 Elevated temperature stress-strain curves
For the representation of stainless steel stress-strain curves at elevated temperatures, the two-stage Ramberg-
Osgood concept has also been shown to be applicable [39, 44]. For stresses up to the elevated temperature
0.2% proof strength f0.2p,, the original Ramberg-Osgood, but based on elevated temperature properties,
where n is the strain hardening exponent at temperature [39, 44].
n
pfE ,2.0
002.0 for ,2.0 pf (5)
For the second part of the two-stage model, Gardner et al. [39] proposed Eq. (6), which passes through the
elevated temperature strength at 2% strain fy,. This point was chosen since the strength at 2% strain is

generally employed in structural fire design, and reduction factors for its determination are readily available.
In Eq. (6), E0.2, is the tangent modulus at the elevated temperature 0.2% proof stress, 0.2, and 1.0, are the
total strains at the elevated temperature 0.2% and 1.0% proof strengths, respectively, and n,2 [39] is the
elevated temperature strain hardening exponent for the second part of the two-stage model described by Eq.
(6).
,2.0,2.0,
,2.0
,2.0
,2.0,,2.0
,2.0
,2.02,
02.0
n
py
ppyp
ff
f
E
ff
E
f for ,,2.0 up ff (6)
Analogous to Eq. (3), the second part of the two-stage Ramberg-Osgood model can also be formulated to
pass through the ultimate stress at elevated temperature fu,, as given by Eq. (7) [44], where m [44] is the
elevated temperature strain hardening exponent for the second part of the two-stage model described by Eq.
(6).
,2.0,2.0,
,2.0,
,2.0
,2.0
m
pu
pu
p
ff
f
E
f for ,,2.0 up ff (7)
As at room temperature, both two-stage Ramberg-Osgood models have been shown to be capable of
providing an accurate representation of elevated temperatures stainless steel stress-strain curves [39,44], with
Eq. (6) being slightly more precise at lower strains and Eq. (7) being slightly more precise at higher strains.
Comparisons of both models with measured elevated stress-strain curves (for 1.4162D12 material) from the
present study are shown in Figure 36. For the data shown in Figure 36, the average (for the seven elevated
temperatures) maximum absolute error between the measured test stress-strain curve and the Ramberg-
Osgood models is about 20 N/mm2 for both Eqs (2) and (3) and Eqs (2) and (4), though again, as for the
room temperature comparisons, this corresponds to points on the early part of the stress-strain curves where
stress is varying rapidly with strain. The average (for the seven elevated temperatures) mean absolute error
over the full ranges of data is 3.7 N/mm2 for Eqs (2) and (3) and 4.4 N/mm2 for Eqs (2) and (4). Average
values for the elevated temperature strain hardening parameters n, m and n,2 obtained from the tests
performed in the present study are reported in Table 6.
8. Conclusions
The use of stainless steel reinforcement in place of carbon steel reinforcement is becoming an increasingly
common means of improving the durability of reinforced concrete structures. In this paper, previous
applications are outlined and factors affecting the specification of stainless steel reinforcement are described.
Consideration was then given to the elevated temperature material properties of stainless steel reinforcing
bars, which is important for structural fire design. A total of 164 elevated temperature material tests
(isothermal and anisothermal) were conducted, covering both plain and ribbed reinforcement, austenitic and
duplex material and two bar diameters. No consistent differences were observed between the results of
isothermal and anisothermal tests or between the reduction factors of the 12 mm and 16 mm diameter bars or

the plain and ribbed bars. The obtained test results showed that the reduction factors for 0.2% proof strength,
strength at 2% strain and ultimate strength derived for stainless steel plate and strip can also be applied to
stainless steel reinforcing bar. Revised reduction factors for ultimate strain and fracture strain at elevated
temperatures have been proposed. The ability of two-stage Ramberg-Osgood expressions to capture
accurately the stress-strain response of stainless steel reinforcement at both room temperature and elevated
temperatures is also demonstrated.
Acknowledgements
The authors gratefully acknowledge the support of Outokumpu who supplied the test specimens, and the
assistance of Mr Ge Yin and Mr Gordon Herbert in the laboratory testing programme.
References
[1] Euro Inox/SCI. Design manual for structural stainless steel. Third ed. Building series, vol. 3. Euro Inox
and the Steel Construction Institute; 2006.
[2] Gardner L, Ng KT. Temperature development in structural stainless steel sections exposed to fire. Fire
Safety Journal, 2006;41(3):185-203.
[3] EN 1992-1-2. Eurocode 2: Design of concrete structures. Part 1.2 General rules. Structural fire design.
CEN; 2004.
[4] Garlock M, Paya-Zaforteza I, Kodur V, Gu L. Fire hazard in bridges: Review, assessment and repair
strategies. Engineering Structures 2012;35:89-98
[5] Barkley T, G. Strasburg G. Bridge Rebuilt on the Fast Track, U.S. Department of Transportation
Federal Highway Administration. Available from:
https://www.fhwa.dot.gov/publications/publicroads/02sep/05.cfm. Updated July 4, 2011, Accessed Oct
20, 2015.
[6] Giuliani L, Crosti C, Gentili F. Vulnerability of bridges to fire. In: Proceedings of the 6th International
Conference on Bridge Maintenance, Safety and Management: 2012 July 8-12; Stresa, Lake Maggiore,
Italy. CRC Press.
[7] The Concrete Society. Guidance on the use of stainless steel reinforcement, Concrete Society Technical
Report No. 51. 1998.
[8] Nickel Institute. Stainless rebar: past present and future. Nickel Magazine 2014 March;29(1):4.
Available at:
http://nickelinstitute.org/en/NickelMagazine/MagazineHome/AllArchives/2014/Volume29-
1/InUseStainlessRebar.aspx. Accessed 10th November 2015.

[9] Gedge G. The use of stainless steel reinforcement in bridges. The British Stainless Steel Association,
2003.
[10] The Highways Agency. Design manual for roads and bridges, Volume 1 Highway structures: Approval
procedures and general design Section 3: General design, Part 8 - BA 57/01 - Design for durability.
2001.
[11] Marsh BK. Stainless steel reinforcement – The use of predictive models in specifying selective use of
stainless steel reinforcement. Ove Arup & Partners Ltd; 2009.
[12] Virginia Department of Transportation. Corrosion resistant reinforcing steels (CRR). Virginia: Structure
and Bridge Division; 2012 August. Report No. IIM-S&B-81.5.
[13] Azom. Synopsis of research on the performance of MMFX reinforcing steel in concrete structures. 2013
August. Available from: http://www.azom.com/article.aspx?ArticleID=9852. Accessed Oct 20, 2015.
[14] Abbasi A, Hogg PJ. Prediction of the failure time of glass fiber reinforced plastic reinforced concrete
beams under fire conditions. Journal of Composites for Construction 2005;9(5):450-457.
[15] BS 6744. Stainless steel bars for the reinforcement of and use in concrete. Requirements and test
methods. British Standards Institution; 2001.
[16] ASTM A955 / A955M-15. Standard specification for deformed and plain stainless-steel bars for
concrete reinforcement. ASTM International, West Conshohocken, PA, USA; 2015.
[17] EN 10080. Steel for the reinforcement of concrete, Weldable reinforcing steel, General. British
Standards Institution; 2005.
[18] ASTM A615 / A615M-15a. Standard specification for deformed and plain carbon-steel bars for
concrete reinforcement. ASTM International, West Conshohocken, PA, USA; 2015.
[19] EN 10088-1. Stainless steels Part 1: List of stainless steels. British Standards Institution; 2014.
[20] ASTM A276 / A276M-15. Standard specification for stainless steel bars and shapes. ASTM
International, West Conshohocken, PA, USA; 2015.
[21] Gedge G. Structural uses of stainless steel — buildings and civil engineering. Journal of Constructional
Steel Research 2008;64(9): 1194-1198.
[22] Gardner L. Aesthetics, economics and design of stainless steel structures. Advanced Steel Construction.
2008; 4(2): 113-122.
[23] Theofanous M and Gardner L. (2010). Experimental and numerical studies of lean duplex stainless steel
beams. Journal of Constructional Steel Research. 2010; 66(6):816-825.

[24] Huang Y and Young B. Tests of pin-ended cold-formed lean duplex stainless steel columns. Journal of
Constructional Steel Research. 2013; 82: 203-215.
[25] Wang YC, Burgess IW, Wald F, Gillie M. Performance-based fire engineering of structures. CRC
Press; 2012.
[26] Theofanous M, Prospert T, Knobloch M and Gardner L. The continuous strength method for steel
cross-section design at elevated temperatures. Thin-Walled Structures. 2016; 98: 94-102.
[27] Afshan S. and Gardner L. The continuous strength method for structural stainless steel design. Thin-
Walled Structures. 2013; 68: 42-49.
[28] Buchanan C, Gardner L and Liew A. The continuous strength method for the design of circular hollow
sections. Journal of Constructional Steel Research. 2016; 118: 207-216.
[29] EN 1993-1-4. Eurocode 3: Design of steel structures. Part 1-4: General rules. Supplementary rules for
stainless steel. CEN; 2006.
[30] EN 1993-1-2. Eurocode 3. Design of steel structures. Part 1-2: General rules. Structural fire design.
CEN; 2005.
[31] Ng KT and Gardner L. Buckling of stainless steel columns and beams in fire. Engineering Structures.
2007; 29(5): 717-730.
[32] Gardner L. Stainless steel structures in fire. Proceedings of the Institution of Civil Engineers -
Structures and Buildings. 2007; 160(3): 129-138.
[33] Fan S, Ding X, Sun W, Zhang L, Liu M. Experimental investigation on fire resistance of stainless steel
columns with square hollow section. Thin-Walled Structures, 2016; 98A: 196-211.
[34] Tondini N, Rossi B and Franssen JM. Experimental investigation on ferritic stainless steel columns in
fire, Fire Safety Journal, 2013; 62C: 238-248.
[35] Han LH, Chen F, Liao FY, Tao Z and Uy B. Fire performance of concrete filled stainless steel tubular
columns, Engineering Structures, 2013; 56: 165-181.
[36] Lopes N, Vila Real P, Simões da Silva L, Franssen JM. Numerical analysis of stainless steel beam-
columns in case of fire, Fire Safety Journal, 2012; 50: 35-50.
[37] Cai Y and Young B. Bearing factors of cold-formed stainless steel double shear bolted connections at
elevated temperatures, Thin-Walled Structures, 2016; 98A: 212-229.
[38] Huang Y and Young B. Stress–strain relationship of cold-formed lean duplex stainless steel at elevated
temperatures, Journal of Constructional Steel Research, 2014; 92: 103-113.

[39] Gardner L, Insausti A, Ng KT, Ashraf M. Elevated temperature material properties of stainless steel
alloys. Journal of Constructional Steel Research 2010; 66:634-647.
[40] ISO 6892-1. Metallic materials. Tensile testing Part 1: Method of test at room temperature;
International Standards Organisation; 2009.
[41] ISO 6892-2. Metallic materials. Tensile testing Part 2: Method of test at elevated temperature;
International Standards Organisation; 2011.
[42] Lamond JF, Pielert JH. Significance of tests and properties of concrete and concrete-making materials,
STP169D. ASTM International; 2006.
[43] Ala-Outinen T. Fire resistance of austenitic stainless steel Polarit 725 (EN 1.4301) and Polarit 761 (EN
1.4571). VTT research notes 1760. Espoo (Finland). 1996.
[44] Chen J, Young B. Stress-strain curves for stainless steel at elevated temperatures. Engineering
Structures 2006:28 (2):229-239.
[45] Mirambell E and Real E. On the calculation of deflections in structural stainless steel beams: an
experimental and numerical investigation. Journal of Constructional Steel Research, 2000; 54(4): 109-
133.
[46] Rasmussen KJR. Full-range stress–strain curves for stainless steel alloys. Journal of Constructional
Steel Research, 2003; 59(1): 47-61.
[47] Afshan S, Rossi B, Gardner L. Strength enhancements in cold-formed structural sections – Part I:
Material testing. Journal of Constructional Steel Research, 2013; 83: 177–188.
[48] Arrayago I, Real E and Gardner L. Description of stress-strain curves for stainless steel alloys.
Materials and Design, 2015; 87: 540-552.
[49] Gardner L and Ashraf M. Structural design for non-linear metallic materials. Engineering Structures,
2006; 28(6): 926-934.
[50] Quach WM, Teng JG and Chung KF. Three-Stage Full-Range Stress-Strain Model for Stainless Steels.
Journal of Structural Engineering ASCE, 2008; 134(9): 1518-1527.

Table 1 Equivalent designation of the stainless steels in the test programme
EN 10088 designation Popular designation UNS designation Strength grade
1.4307 304L S30403 500
1.4311 304LN S30453 500
1.4162 LDX 2101® S32101 500
1.4362 2304 S32304 500
Table 2 Guidance on use of stainless steel reinforcement for different service conditions from BS 6744 [15]
Stainless steel grade
Service condition
For structures or components with either a long design life, or which are inaccessible for future maintenance
For structures or components exposed to chloride contamination with no relaxation in durability design (e.g. concrete cover, quality or water proofing treatment requirements)
Reinforcement bridging joints, or penetrating the concrete surface and also subject to chloride contamination (e.g. dowel bars or holding down bolts)
Structures subject to chloride contamination where reductions in normal durability requirements are proposed (e.g. reduced cover, concrete quality or omission of water proofing treatment)
1.4301 1 1 4 3
1.4162 1 1 4 3
1.4362 2 2 1 1
Key
1 – Appropriate choice for corrosion resistance and cost.
2 – Over-specification of corrosion resistance for the application.
3 – May be suitable in some instances: specialist advice should be obtained.
4 – Unsuitable for the application.

Table 3 Summary of test specimens
Specimen ID Stainless steel
grade Bar type
Diameter (mm)
No. of steady-state tests
No. of transient-state
tests
4307R12 1.4307 Plain round 12 10 9
4162R12 1.4162 Plain round 12 10 9
4307R16 1.4307 Plain round 16 10 9
4362R16 1.4362 Plain round 16 10 9
4311D12 1.4311 Ribbed 12 10 5
4162D12 1.4162 Ribbed 12 10 8
4162D16 1.4162 Ribbed 16 10 7
4311D16 1.4311 Ribbed 16 10 9
4362D16 1.4362 Ribbed 16 10 9
Table 4 Summary of the mechanical properties of the test bars at room temperature
Specimen Product form f0.2p (MPa) fu (MPa) E (MPa) u (%) f (%)
4307R12
Plain round bars
562 796 210200 30.7 39.9
4162R12 805 964 208700 2.9 18.8
4307R16 537 751 211100 31.4 42.4
4362R16 760 860 197500 3.0 22.0
4311D12
Ribbed bars
480 764 202600 38.6 48.3
4162D12 682 874 199100 20.4 32.4
4162D16 646 844 195200 22.5 32.9
4311D16 528 717 199900 32.9 47.9
4362D16 608 834 171400 11.5 35.1

Table 5 Proposed reduction factors for ultimate strain and fracture strain for stainless steel
Reduction factor
Group Temperature (°C)
20 100 200 300 400 500 600 700 800 900 1000
Ultimate strain reduction factor ku
Austenitic I 1.00 0.56 0.42 0.42 0.42 0.42 0.33 0.24 0.15 0.15 0.20
Duplex I 1.00 1.00 1.00 1.00 1.00 1.00 1.00 0.80 0.60 0.40 0.40
Duplex II 1.00 0.87 0.74 0.74 0.74 0.74 0.74 0.44 0.14 0.14 0.14
Fracture strain reduction factor kf
Austenitic I 1.00 0.78 0.50 0.50 0.50 0.50 0.50 0.50 0.50 1.00 1.50
Duplex I and II
1.00 0.90 0.78 0.78 0.78 0.78 0.78 0.78 0.78 2.40 4.00
Table 6 Average values for the strain hardening parameters obtained from the tests performed in the present study
n m n0.2,1.0 n m n,2
Austenitic 4.7 4.8 4.8 7.9 7.1 5.6
Duplex 5.3 5.0 4.4 6.3 7.9 6.5

Figure 1 Progreso Pier, Mexico – the pier in the background was constructed in 1940 and used stainless steel reinforcing bar whereas the pier in the foreground was constructed in 1969 and used carbon steel
reinforcing bar (Courtesy of the Nickel Institute)
Figure 2 Comparison of thermal conductivity of stainless steel and carbon steel

Figure 3 Comparison of specific heat capacity of stainless steel and carbon steel
Figure 4 Comparison of thermal expansion of stainless and carbon steel

Figure 5 Typical stress-strain curves for stainless steel and carbon steel
Figure 6 Definition of measured elevated temperature material properties
Stress
fy,θ
f0.2p,θ
Eθ E
θ
0.2% 2.0% Strain
Stress
fu,θ
Eθ
Strain ɛu,θ ɛf,θ
(a) Initial portion of stress-strain curve (b) Full stress-strain curve

Figure 7 Apparatus for elevated temperature tests
Figure 8 Extensometer components used to record strain

Figure 9 Isothermal stress-strain curves for grade 1.4307 austenitic stainless steel bars with a diameter of 12 mm
Figure 10 Derivation of isothermal stress-strain curves from transient-state test temperature-strain data.

Figure 11 Reduction factors for 0.2% proof strength for austenitic grade 1.4307 stainless steel, compared with recommendations of Gardner et al. [39] for stainless steel (austenitic group I) and EN 1992-1-2 for
carbon steel
Figure 12 Reduction factors for 0.2% proof strength for austenitic grade 1.4311 stainless steel, compared with recommendations of Gardner et al. [39] for stainless steel (austenitic group I) and EN 1992-1-2 for
carbon steel

Figure 13 Reduction factors for ultimate tensile strength for austenitic grade 1.4307 stainless steel, compared with recommendations of Gardner et al. [39] for stainless steel (austenitic group I) and EN 1992-
1-2 for carbon steel
Figure 14 Reduction factors for ultimate tensile strength for austenitic grade 1.4311 stainless steel, compared with recommendations of Gardner et al. [39] for stainless steel (austenitic group I) and EN 1992-
1-2 for carbon steel

Figure 15 k2%, factors for determining the strength at 2% strain for austenitic grade 1.4307 stainless steel, compared with recommendations of Gardner et al. [39] for stainless steel (austenitic group I)
Figure 16 k2%, factors for determining the strength at 2% strain for austenitic grade 1.4311 stainless steel, compared with recommendations of Gardner et al. [39] for stainless steel (austenitic group I)

Figure 17 Reduction factors for modulus of elasticity for austenitic grade 1.4307 stainless steel, compared with values given in EN 1993-1-2 Annex C for stainless steel and EN 1992-1-2 for carbon steel
Figure 18 Reduction factors for modulus of elasticity for austenitic grade 1.4311 stainless steel, compared with values given in EN 1993-1-2 Annex C for stainless steel and EN 1992-1-2 for carbon steel

Figure 19 Reduction factors for ultimate strain for austenitic grade 1.4307 stainless steel, compared with values given in EN 1993-1-2 Annex C and recommended by Chen and Young [44] for grade 1.4301
stainless steel, together with proposed values for austenitic group I
Figure 20 Reduction factors for ultimate strain for austenitic grade 1.4311 stainless steel, compared with values given in EN 1993-1-2 Annex C and recommended by Chen and Young [44] for grade 1.4301
stainless steel, together with proposed values for austenitic group I

Figure 21 Reduction factors for fracture strain for austenitic grade 1.4307 stainless steel, together with proposed values for austenitic group I
Figure 22 Reduction factors for fracture strain for austenitic grade 1.4311 stainless steel, together with proposed values for austenitic group I

Figure 23 Reduction factors for 0.2% proof strength for duplex grade 1.4162 stainless steel, compared with recommendations of Gardner et al. [39] for stainless steel (duplex group II) and EN 1992-1-2 for carbon
steel
Figure 24 Reduction factors for 0.2% proof strength for duplex grade 1.4362 stainless steel, compared with recommendations of Gardner et al. [39] for stainless steel (duplex group I) and EN 1992-1-2 for carbon steel

Figure 25 Reduction factors for ultimate tensile strength for duplex grade 1.4162 stainless steel, compared with recommendations of Gardner et al. [39] for stainless steel (duplex group II) and EN 1992-1-2 for
carbon steel
Figure 26 Reduction factors for ultimate tensile strength for duplex grade 1.4362 stainless steel, compared with recommendations of Gardner et al. [39] for stainless steel (duplex group I) and EN 1992-1-2 for carbon
steel

Figure 27 k2%, factors for determining the strength at 2% strain for duplex grade 1.4162 stainless steel, compared with recommendations of Gardner et al. [39] for stainless steel (duplex group II)
Figure 28 k2%, factors for determining the strength at 2% strain for duplex grade 1.4362 stainless steel, compared with recommendations of Gardner et al. [39] for stainless steel (duplex group I)

Figure 29 Reduction factors for modulus of elasticity for austenitic grade 1.4162 stainless steel, compared with values given in EN 1993-1-2 Annex C for stainless steel and EN 1992-1-2 for carbon steel
Figure 30 Reduction factors for modulus of elasticity for austenitic grade 1.4362 stainless steel, compared with values given in EN 1993-1-2 Annex C for stainless steel and EN 1992-1-2 for carbon steel
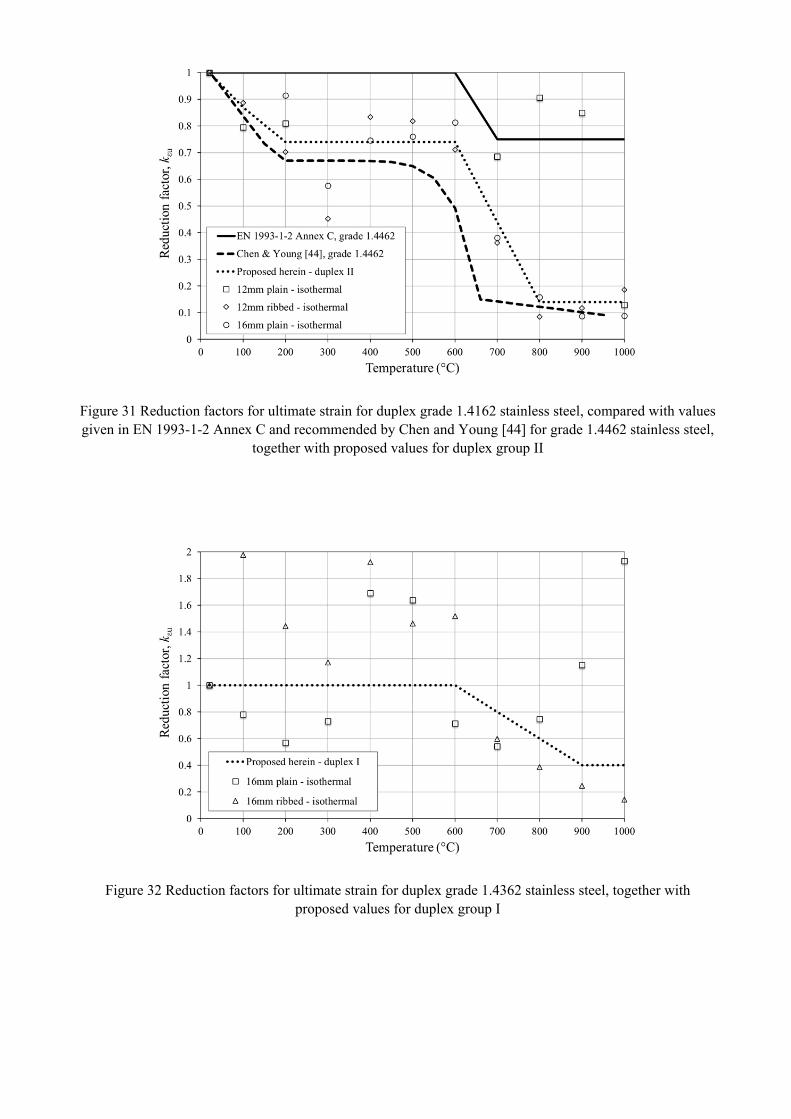
Figure 31 Reduction factors for ultimate strain for duplex grade 1.4162 stainless steel, compared with values given in EN 1993-1-2 Annex C and recommended by Chen and Young [44] for grade 1.4462 stainless steel,
together with proposed values for duplex group II
Figure 32 Reduction factors for ultimate strain for duplex grade 1.4362 stainless steel, together with proposed values for duplex group I

Figure 33 Reduction factors for fracture strain for duplex grade 1.4162 stainless steel, together with proposed values for duplex groups I and II
Figure 34 Reduction factors for fracture strain for duplex grade 1.4362 stainless steel, together with proposed values for duplex groups I and II

Figure 35 Comparison between a typical measured room temperature stress-strain curve and the two-stage Ramberg-Osgood models given by Eqs (2) and (3) [45,46,48] and Eqs (2) and (4) [49]
Figure 36 Comparison between typical measured elevated temperature stress-strain curves and the two-stage Ramberg-Osgood models given by Eqs (5) and (6) [39] and Eqs (5) and (7) [44]