elena del rey and ioana schiopu november 2015 eeee · elena del rey and ioana schiopu november 2015...
TRANSCRIPT
European Expert Network onEconomics of Education (EENEE)eeeeeEeEuropeaneuropean EeExpert expert EeEconomics of economics of EeEducationeducationeuropeeeuropeeeeeeeeeuropeeeeuropeeuropeeuropeeeeuropeeeuropeeeeuropeeuropeeuropeeeeuropeeStudent Debt in Selected Countries
EENEE Analytical Report No 25Prepared for the European Commission
Elena Del Rey and Ioana Schiopu November 2015
25
Student Debt in Selected Countries
Elena del Rey
University of Girona
and
Ioana Schiopu
ESADE Ramon Llull
University
November 2015
Europe Direct is a service to help you find answers
to your questions about the European Union
Freephone number ()
00 800 6 7 8 9 10 11 () The information given is free as are most calls (though some operators phone
boxes or hotels may charge you)
More information on the European Union is available on the Internet (httpeuropaeu)
Luxembourg Publications Office of the European Union 2014 ISBN 978-92-79-49409-3
doi 102766971679 copy European Union 2015
All rights reserved This document has been prepared for the European Commission However it reflects the views only of the authors and the Commis-sion cannot be held responsible for any use which may be made of
the information contained therein
November 2015 2
Table of Contents Table of Contents 2
Executive summary (English) 3 Executive summary (German) 4 Executive summary (French) 6 Introduction 8 Student debt in selected countries 9
Australia 10 England 12 Nordic Countries 14 Finland 14 Norway 16 The Netherlands 17 Hungary 18 USA 19 Canada 22
Countries without extensive student loan programs 23 France 23 Germany 24
Concluding comments 25 References 26
November 2015 3
Executive summary (English) Increasing costs of higher education and the expansion of access together with greater cost-sharing by students and their families have led to higher indebtedness of former students in many countries This report reviews the extent of this burden as well as the available evidence on the impact of graduate indebtedness in selected countries
Two main types of student loan systems exist Mortgage type loans require repayments in the form of predetermined fixed monthly instalments In contrast income contingent loans tie repayments to earnings Thus one problem of the former type of loan is that it can impose high burdens on graduates with lowest incomes To reduce the burden on low income groups some countries like Finland or the Netherlands where most loans are of the mortgage type allow some graduates to benefit from reductions in the amounts due In Finland loan reductions can also be obtained if the degree is completed on time In Norway low-income students with good academic progress can convert a portion of the loan into a non-repayable grant Under the system in place until 2015 in the Netherlands the amount owed could be turned into a grant if the student graduated in less than ten years Thus funding schemes incorporate incentives for good academic progress in some countries
Unlike mortgage type loans income-contingent loans tie repayments to earnings during a given period These types of loans have become widespread and are increasingly adopted around the world (eg the Netherlands as of September 2015) Because debtors only pay a given proportion of their incomes and obligations usually expire after 15 to 30 years of graduation income-contingent arrangements transfer part of the repayment burden to the funding institution and often ultimately to the taxpayer In Australia and England there are some concerns about the sustainability of the system over the medium run By contrast in other countries like the US and Hungary the student loan programs are profitable
Irrespective of type student loans may also affect incentives in unanticipated ways Studies carried out in Australia and the United States two of the countries with the largest uptake and longest tradition of student loans have shown that student debt is correlated with delaying marriage andor children lower likelihood of homeownership and lower wealth accumulation In Australia which pioneered income-contingent loans there is also evidence of income concentration below the minimum repayment thresholds This evidence indicates that the repayment schedule may give incentives to work in low paid or part-time jobs and suggests such perverse effects should be taken into account in the design of the income-contingent loan schemes
While present in many developed economies student loans are by no means universal For example France and Germany two of the largest economies in the EU with spending per student similar to that of Australia Finland or the UK do not have broadly based student loan programs How does this affect access to higher education in these countries Although there is evidence that parental contributions to student income are significant in France and Germany the percentage of 25 to 34 year olds having a tertiary education diploma and the degree of upward educational mobility largely differ between these two countries Thus one cannot draw general conclusions regarding the link between the absence of loans and equality of opportunity Many factors interact to generate such outcomes including among others the quality of pre-college education redistributive policies or the productive structure of each country A more systematic analysis would be required in order to identify the links between student support policies and educational opportunity
November 2015 4
Executive summary (German) Ein Anstieg der Kosten im houmlheren Bildungswesen und die Ausweitung des Zugangs zu houmlherer Bildung welche mit einer houmlherer Kostenbeteiligung der Studierenden und auch ihrer Familien zusammenfallen haben in vielen Laumlndern zu einer houmlheren Verschuldung von ehemaligen Studierenden gefuumlhrt Dieser Bericht betrachtet das Ausmaszlig dieser Verschuldung und ihre Auswirkungen in ausgewaumlhlten Laumlndern
Es existieren zwei unterschiedliche Arten von Studienkreditsystemen Hypothekenartige Kredite erfordern die Zuruumlckzahlung des Kredits in Form einer vorher festgesetzten monatlichen Rate Im Gegensatz dazu sind bei einkommensabhaumlngigen Krediten die Zuruumlckzahlungen an spaumltere Gehaumllter gebunden Deshalb ist ein Problem der hypothekenartigen Kredite dass sie Graduierten mit niedrigen Einkommen eine hohe Last auferlegen Um diese Belastung zu reduzieren gestehen Laumlnder wie Finnland und die Niederlande in denen die meisten Kredite hypothekenartig sind manchen Graduierten einen reduzierten Ruumlckzahlungsbetrag zu In Finnland koumlnnen diese Verminderungen auch eingestanden werden wenn der Studienabschluss in Regelstudienzeit erlangt wurde In Norwegen koumlnnen Studierende mit einem niedrigen Einkommen und einer guten akademischen Entwicklung einen Teil ihres Kredites in ein nicht-zuruumlckzuzahlendes Stipendium umwandeln In dem System das bis 2015 in den Niederlanden angewandt wurde konnte der Betrag in ein Stipendium umgewandelt werden wenn Studierende in weniger als 10 Jahren ihren Studienabschluss erlangten Somit gibt es in manchen Laumlndern Finanzierungsmechanismen die Anreize fuumlr eine gute akademische Entwicklung beinhalten
Im Gegensatz zu hypothekenartigen Krediten sind die Zuruumlckzahlungen von einkommensabhaumlngigen Krediten vom Einkommen in einer bestimmten Periode abhaumlngig Diese Art von Krediten hat sich immer weiter ausgebreitet (so zB seit September 2015 in den Niederlanden) Da die Schuldner nur einen Teil ihres Einkommens zuruumlckzahlen und die Verpflichtungen normalerweise 15 bis 30 Jahre nach Studienabschluss auslaufen uumlbertragen einkommensabhaumlngige Loumlsungen einen Teil der Zuruumlckzahlungsgemeinkosten auf die kreditgebende Institution und somit letztendlich oft an den Steuerzahler In Australien und England gibt es Bedenken zu der Nachhaltigkeit dieses Systems in der mittleren Frist Im Gegensatz dazu sind Studienkreditprogramme in anderen Laumlndern wie in den USA und Ungarn rentabel
Unabhaumlngig von der Art des Kredits koumlnnen Studienkredite auch nicht antizipierte Anreize setzen Studien die in Australien und den USA und somit in zwei der Laumlnder mit der groumlszligten Inanspruchnahmen und der laumlngsten Tradition von Studierendenkrediten durchgefuumlhrt wurden haben gezeigt dass die Inanspruchnahme eines Studienkredits mit einer spaumlteren Eheschlieszligung undoder Kindern einer niedrigeren Wahrscheinlichkeit von Hausbesitz und einer niedrigeren Akkumulation von Wohlstand korreliert In Australien als Pionier einkommensabhaumlngiger Kredite gibt es auch Evidenz uumlber die Konzentration von Einkommen genau unter der minimalen Zuruumlckzahlungsgrenze Die Evidenz deutet darauf hin dass das Design der Zuruumlckzahlungen Anreize geben kann in niedrig bezahlten oder Teilzeitjobs zu arbeiten und regt dazu an solche verdrehten Effekte bei der Ausgestaltung von einkommensabhaumlngigen Kreditplaumlnen zu beruumlcksichtigen
Waumlhrend es in vielen entwickelten Laumlndern Studienkredite gibt ist ihre Verbreitung keinesfalls universell In Frankreich und Deutschland zum Beispiel zwei der groumlszligten Volkswirtschaften der EU wo Ausgaben fuumlr Studieren aumlhnlich hoch sind wie in Australien Finnland oder dem Vereinigten Koumlnigreich sind Studienkreditprogramme nicht weit verbreitet Welchen Einfluss hat das auf den Zugang zu houmlherer Bildung in diesen Laumlndern Obwohl es Evidenz dazu gibt dass der elterliche Beitrag zum Einkommen von Studierenden in Frankreich und Deutschland signifikant ist
November 2015 5
unterscheidet sich der Anteil der 25- bis 34-Jaumlhrigen die einen Universitaumltsabschluss haben und der Grad der Bildungsmobilitaumlt stark zwischen den beiden Laumlndern Deshalb kann man keine allgemeinen Schlussfolgerungen zum Zusammenhang zwischen fehlenden Studienkrediten und Chancengleichheit ziehen Es gibt viele Faktoren die zusammenspielen um solche Ergebnisse zu erzeugen wie etwa die Qualitaumlt der Bildung vor der tertiaumlren Bildung umverteilende Politikmaszlignahmen oder die Produktivitaumlt jedes Landes Um die Zusammenhaumlnge zwischen Studienfoumlrderpolitik und Chancengerechtigkeit zu identifizieren waumlre eine systematischere Analyse notwendig
November 2015 6
Executive summary (French) On assiste dans plusieurs pays agrave de grands changements dans la pratique de lrsquoenseignement supeacuterieur Si les eacutetudes supeacuterieures sont plus chegraveres et ouvertes agrave un public plus large il existe eacutegalement un partage des coucircts de lrsquoeacuteducation plus important entre les eacutetudiants et leur famille Ces diffeacuterents pheacutenomegravenes entrainent une hausse de lrsquoendettement eacutetudiant et ce mecircme apregraves que ces derniers aient quitteacute lrsquoenseignement supeacuterieur Cette eacutetude analyse donc lrsquoimportance de lrsquoendettement des jeunes diplocircmeacutes ainsi que son impact dans plusieurs pays
Il existe deux grands types de precircts destineacutes aux eacutetudiants Les precircts laquo classiques raquo type precircts immobiliers exigent un paiement sous forme de preacutelegravevements mensuels dont le montant est preacutedeacutetermineacute et fixe Au contraire drsquoautres precircts sont indexeacutes sur le revenu les mensualiteacutes deacutependent du salaire perccedilu par la personne diplocircmeacutee Un des problegravemes du des precircts classiques est en effet qursquoil peut imposer une charge importante sur les diplocircmeacutes connaissant des premiers salaires peu eacuteleveacutes Afin de reacuteduire cette pression sur les bas salaires certains pays tels que la Finlande ou encore les Pays-Bas ougrave la majoriteacute des precircts ne permettent pas la modulation des mensualiteacutes octroient agrave certains eacutetudiants des reacuteductions des montants agrave rembourser En Finlande cette reacuteduction des dettes peut ecirctre obtenue si le diplocircme est obtenu sans retard En Norvegravege les eacutetudiants agrave faible revenus ont la possibiliteacute srsquoils obtiennent de bons reacutesultats de couvrir une partie de ces dettes par lrsquoobtention drsquoune bourse Le systegraveme mis en place jusqursquoen 2015 aux Pays-Bas preacutevoyait eacutegalement la possibiliteacute drsquoun remboursement drsquoune partie de la dette par lrsquoobtention drsquoune bourse si lrsquoeacutetudiant obtient son diplocircme dans un temps imparti Ainsi plusieurs pays organisent des incitations financiegraveres agrave obtenir de bons reacutesultats acadeacutemiques
Contrairement agrave ce premier type de precircts les precircts indexeacutes sur le revenu font varier le montant de remboursement en fonction du salaire perccedilu pendant une peacuteriode donneacutee Ce type de precirct srsquoest rapidement reacutepandu et ce dans le monde entier (par exemple aux Pays-Bas agrave partir de 2015) Les personnes endetteacutees ne remboursent qursquoune part deacutetermineacutee de leurs revenus pendant une peacuteriode qui srsquoeacutetend jusqursquoagrave 15 agrave 30 ans apregraves la diplomation Ainsi ce type de precirct transfegravere une partie de la charge agrave lrsquoorganisme de financement et donc souvent en dernier ressort au contribuable En Australie et en Angleterre des inquieacutetudes grandissantes se font drsquoailleurs entendre sur la soutenabiliteacute drsquoun tel systegraveme agrave moyen terme Au contraire dans drsquoautres pays comme aux Etats-Unis ou en Hongrie le systegraveme de precircts eacutetudiants apparaicirct rentable
Quel que soit le type de precirct lrsquoendettement des eacutetudiants de lrsquoenseignement supeacuterieur peut eacutegalement avoir des effets non anticipeacutes Des eacutetudes meneacutees en Australie et aux Etats-Unis - deux des pays ougrave lrsquoutilisation des precircts eacutetudiants est parmi les plus larges et les plus anciennes - ont montreacute que lrsquoimportance de cette dette est correacuteleacutee avec un deacutecalage de lrsquoacircge du mariage ou du premier enfant un accegraves agrave la proprieacuteteacute plus difficile et une moindre accumulation de capital Par ailleurs en Australie pays pionnier en termes de mise en place de precircts indexeacutes sur le revenu il existe des pheacutenomegravenes de concentration des revenus en dessous du seuil minimum de remboursement Ceci semble indiquer que le precirct indexeacute sur le salaire peut encourager les personnes endetteacutees agrave travailler pour un faible salaire ou agrave temps partiel Ces effets pervers doivent donc ecirctre pris en compte dans lrsquoeacutelaboration de tels meacutecanismes de precirct
Mecircme si les precircts pour eacutetudiants sont freacutequents dans les eacuteconomies deacuteveloppeacutees ils ne sont en aucun cas un pheacutenomegravene universel Par exemple la France et lrsquoAllemagne deux des plus grandes eacuteconomies de lrsquoUnion Europeacuteenne qui connaissent une deacutepense par eacutetudiant similaire agrave celle de lrsquoAustralie de la Finlande ou du Royaume-Uni nrsquoont pas de programmes de precircts eacutetudiants si larges Quelles en sont les conseacutequences sur lrsquoenseignement supeacuterieur dans ces pays Bien que les aides des
November 2015 7
parents aux eacutetudiants soient importantes en France et en Allemagne le pourcentage de jeunes de 25 agrave 34 ans diplocircmeacutes de lrsquoenseignement supeacuterieur et le degreacute de mobiliteacute eacuteducative diffegraverent grandement entre ces deux pays Il est ainsi difficile de tirer des conclusions geacuteneacuterales sur le lien entre lrsquoabsence de precircts eacutetudiants et lrsquoeacutegaliteacute des chances De nombreux facteurs doivent ecirctre pris en consideacuteration tels que la qualiteacute de lrsquoenseignement primaire et secondaire les politiques redistributives ou encore la structure de chaque eacuteconomie Une analyse plus systeacutematique serait par conseacutequent neacutecessaire afin drsquoidentifier le lien entre les politiques drsquoaide aux eacutetudiants et les reacuteelles opportuniteacutes eacuteducatives qursquoelles leur offrent
November 2015 8
Introduction As a consequence of increased cost-sharing in higher education around the world higher education students are taking on an increasingly large amount of debt not only to pay fees but also to cover living expenses while studying In theory higher debt should not be a problem as long as the increase in the studentrsquos return of investment is commensurate But higher education is a risky and increasingly costly investment Although the average lifetime college premium has been rising over time in both developed and developing economies there is a lot of heterogeneity in returns across students Moreover labour market uncertainty has increased considerably in recent decades (see for example Lochner and Shin 2014) while increased access to higher education has led to relatively poorer and less able students joining the pool of borrowers Coupled with higher education costs this could generate higher student debt and higher default rates The combination of increasing debt and less predictable access to well-paid employment have generated concerns in a number of countries about the short and long-term impact of student debt
Different types of student loans exist Mortgage type loans have predetermined fixed monthly payments and the repayment obligation is not extinguished until the debt is paid in full Depending on the type of contract involved and the penalties associated with delinquent loans the risk of investment in higher education is borne by the borrower andor the lender Private loans are most often of this type Income contingent loans in contrast explicitly account for the fact that some graduates will not be able to repay the amount owed in full The burden of these unpaid amounts usually falls on the taxpayer and so the risk of investment in higher education is shared within the population at large In other cases relatively successful graduates effectively pay a surcharge that covers non-payments of some members of their cohort Then the investment risk is shared within the cohort Different arrangements thus imply different types of problems as discussed in this report Finally although student debt contracts are spreading around the world some countries buck this trend relying instead on direct subsidies to students families or institutions to support the investments in higher education
The aim of this report is to document the main issues arising from student debt across different countries We focus on the following questions
How much funding in terms of student loans is available for higher education students in different countries
What is the size of graduate debt in different countries What are the established conditions of repayment To what extent are graduate debt levels problematic for graduates or society
Whenever possible we provide information about the cost of student loan programs for the public budget and summarize existing research on studentsrsquo reaction to financial incentives of different funding schemes
We look at selected countries that are well known for having broadly based loan programs for students Australia England Finland and Norway (as representative of the Nordic countries) the Netherlands Hungary the USA and Canada In all these countries except Hungary total (public and private) expenditure per student by institution in higher education is higher than average in the OECD (Table 1) Together with the UK France and Germany are the largest economies in the EU Although the spending per student is similar to that of Australia Finland or the UK there are no broadly based student loan programs in these countries A number of questions naturally arise Is more or less public funding available for students when no loans are offered Do parents bear a higher share of the higher education cost Is access to higher education limited to the comparatively wealthier students Although a precise
November 2015 9
answer would require a more thorough analysis beyond the scope of this report we provide an overview of the situation in France and Germany in order to put the issue of student debt in perspective
The rest of the report is organized as follows Section 2 reports the evidence on graduate debt in the aforementioned selected countries Section 3 refers to the countries without extensive student loan programs trying to explore the causes and consequences of their different approach to student funding Section 4 concludes
Table 1 Tertiary education spending attainment and loan uptake in selected countries Country Governme
nt expenditure on higher education as of GDP(i)
Public support for households and private entities of GDP (ii)
Expenditure per student by institution(iii)
Percentage of students who have a loan(iv)
Average amount of loan(v)
of 25-34 year olds with tertiary education(
vi)
Australia 118 039 10711 771 3507 47 Canada 188 038 11585 - 4421 57 Finland 208 030 10905 277 1200 40 France 126 010 10454 - - 43 Germany 135 031 10904 - - 29 Hungary 109 014 7153 17 3876 30 Netherlands
161 050 11701 334 2646 43
Norway 196 099 14288 70 9381 45 UK 127 099 10412 839 10070
(England)
48
USA 136 039 15345 71 15510 44 (i) UISISU httpdatauisunescoorg Year 2011 data extracted on 06 Jul 2015 Includes research expenditure (ii) OECD 2014 Includes scholarships grants and loans Table B54 2011Table B54 (iii) OECD 2014 Annual expenditure per student by educational institutions for all services (2011) In equivalent USD converted using PPPs for GDP by level of education based on full-time equivalents Table B11a (iv) OECD 2014 Academic year 201011 Table B53 (v) OECD 2014 Average annual gross amount of loan available to each student (in USD) National students in USD converted using PPPs Table B53 (vi) OECD 2014 Percentage of adults who have attained tertiary education by type of program and age group (2012) Table A13a Empty spaces mean that no data is available
Student debt in selected countries In this section we provide an overview of student debt in different countries in connection with developments in the overall student funding and the higher education landscape We include information when available about the size and distribution of that debt and try to assess whether it constitutes a problem and for whom We also devote some attention to the issue of incentives generated purposely or not by different loan schemes We focus on Australia England Finland and Norway as representatives of the Nordic countries the Netherlands Hungary the USA and Canada
November 2015 10
Australia Australia was the first country to introduce in 1989 an income-contingent loan program for the payment of university fees the Higher Education Contribution Scheme (HECS henceforth) The program has been known since 2005 as the Higher Education Loan Program (HELP) Administered by the government the loans bear no real interest but are indexed to the Consumer Price Index By 2010-11 771 percent of students had a loan (OECD 2014)
The Australian Taxation Office (ATO) calculates the individual HELP repayment income (HRI) and publishes regularly the income thresholds and corresponding repayment rates (see Table 2 for 2012-13) Below AUSD 51309 (EUR 39261) no payment is due This provides incentives to work on low paid jobs or to work part-time According to Chapman and Leigh (2009) there is evidence of a small but significant degree of concentration of earnings (bunching) below the minimum repayment threshold but the economic effect in terms of budgetary cost and loss of pre-tax earnings is small
Table 2 HECS HELP income thresholds and repayment rates 2012-13
HECS-HELP 2012 ndash 2013 Repayment income Repayment rate (proportion of earnings)
Below $ 51309 (39261euro) Nil $51309 (39261euro)- $57153 (43733euro) 40 $57154 (43734euro) - $62997 (48205euro) 45 $62998 (48206euro) - $66308 (50738euro) 50 $66309 (50739euro) - $71277 (54541euro) 55 $71278 (54542euro) - $77194 (59068euro) 60 $77195 (59069euro) - $81256 (62177euro) 65 $81257 (62178euro) - $89421 (68424euro) 70 $89422 (68425euro) - $95287 (72913euro) 75 $95288 (72914euro) and above 80
Source Australian Taxation Office Tax Calculator (httpatotaxcalculatorcomauhelp-debt)1 The maximum yearly payment is 8 percent of HRI Based on 2011 Census data Go8 (a coalition of leading Australian universities) reports that more than one fifth of graduates in full time employment earned incomes less than the HELP repayment threshold2 This group consists mainly of graduates in the early stages of their careers since most graduates do not begin to make repayments until their third year of full time work The same source reveals that on average graduates working full time will earn around AUSD 84000 a year The ATO estimates that it takes an average of 81 years to fully repay HELP debts However about 17 percent of new lending is now classified as doubtful due to low earnings emigration or death and it is not expected to ever be fully repaid (Norton 2014) Although the program is specifically designed to allow this to happen doubtful debt is quite unevenly distributed
Indeed expected repayment levels differ greatly across types of bachelor degrees while 95 percent of graduates in medicine repay their loan in full 50 percent of graduates in Visual Arts and Crafts never make any payment This is all the more surprising when we take into account that in Australia the size of fees for each 1 Currency conversion based on average annual quotations EUR-AUSD in 2012 and 2013 from CREA 2 Go8 is the Group of Eight leading universities in Australia (httpsgo8eduau)
November 2015 11
course is determined based precisely upon expected earnings following graduation and not the cost of providing the course The large rates of non-repayment in some areas of study may hence reflect a large degree of wage dispersion in those areas
The differences in expected repayment rates by men and women are also important While 100 per cent of male doctors and dentists are expected to repay in full 10 per cent of female doctors and 20 percent of female dentists are not able to repay the debt in full In fact 10 percent of female lawyers and engineers are not expected to repay at all (Norton 2014 Figure 4) Of course maternity and child rearing are at the basis of these differences It could be argued that these differences in repayment are not a negative feature of the program since the income contingent nature of repayment encourages women to study and access high pay part-time jobs In their study about the access implications of income-contingent charges for higher education Chapman and Ryan (2005) conclude that the introduction of the income-contingent loan program did not discourage university participation in general or among individuals from low income groups and that participation grew more strongly for women than it did for men
Coming back to the reasons for non-repayment we need not forget that not everyone who starts a degree finishes it and that graduates may leave the country These also explain the existence of doubtful debt Since the ATO has no international jurisdiction this second issue implies that an unintended consequence of the schemersquos design is that loans are impossible to be collected from debtors who leave Australia Chapman and Higgins (2013) provide estimates of the cost of unpaid debts from graduates going overseas and make some proposals of how this issue should be addressed For example the government could arrange bilateral agreements with other countries so that they would use their internal revenue services to collect the debts under the same income contingent parameters in operation in the country of origin Barr (2001) acknowledges that this may be difficult and proposes instead to convert income contingent loan debt into mortgage-type debt for borrowers who go overseas to simplify collection (this is the approach adopted in England Sweden and New Zealand) Of course it is required that borrowers leaving the country leave contact details to allow the authorities to keep in touch with debtors Ideally in the long run Barr (2001) argues an international agency with the capacity to collect loans in all countries on an income contingent basis should be established
Norton (2014) also points out the fact that debt is written off in case of death He argues that few people die early and that HELP doubtful debt is principally driven by people expected to die at the age of 60 and above This is a consequence of the fact that more individuals are pursuing higher education later in life since constant scientific and technological innovation have led to increasing life-long learning
In the end the cost of unpaid student loans falls back on the Australian taxpayer In addition the fact that no real interest rate is applied on the loans implies that the government is losing a potential real return on the funds devoted to loans Because they involve long time periods and the estimation of opportunity costs it is very difficult to calculate the size of these costs
Regarding the effects of loans on student behaviour Andrews (1999) argued that the introduction of HECS had a minor influence on the limited participation in higher education of individuals from low socio-economic groups Birch and Miller (2006) (cited in Vossensteyn et al 2013) studied the effects of HECS on performance comparing the grades of first-year students that paid their HECS liabilities with those that deferred them They find a positive correlation between debt deferral and performance for students with lower university entrance scores suggesting that the presence of debt might increase student motivation However the correlation is negative for students with higher entrance scores This result might reflect the lower
November 2015 12
socio-economic background of those students who defer payments an effect that is not offset by increased motivation within this particular student group Interestingly these results do not extend to students beyond the first year indicating that senior students with debt have similar academic performance to their peers without debt Using standard econometric methods to control for selection Houssard Sastro and Hardy (2010) show that graduates with HECS debt are less likely to own a home and hold a high socio-economic status than their counterparts without debt
Finally Australian students also benefit from means-tested scholarships and grants (the amounts depend on the recipientrsquos income) First there are a number of subsidised student places (Commonwealth supported places) Also low income individuals of age 16 to 24 who are studying full time in apprenticeship or training looking for a job or sick are entitled to a Youth Allowance Depending on circumstances the fortnightly payments range from $23360 to $725403 In addition students receiving a Youth Allowance are entitled to a student start-up scholarship of $1025 twice a year at the beginning of each semester to buy textbooks and specialized material In 2009-10 around 12 of students received Youth Allowance4
England Income contingent loans collected through the tax system were introduced in England in the early 90s Reforms to the basic mechanism followed in 1997 and 2005 when tuition fees were raised A significant reform was again introduced in 2012-13 when universities were allowed to charge up to GBP 9000 a year for tuition
That year the average fee charged was GBP 8385 Eligible full-time undergraduate (first cycle) students are however not expected to pay these tuition costs up front 56 Instead they get a loan Under both the old and the new system repayments are income-contingent and made at the rate of 9 percent of income above a certain threshold of earnings This threshold has been raised in the last reform and will be GBP 21000 (EUR 29286) in 2016 prices adjusted each year for inflation in line with the retail price index (RPI) (Eurydice 2013-14) The reform introduced in 2012-13 also raised the interest rate of the loan Before graduates were charged an interest rate equivalent to inflation as measured by the RPI The loan now bears a real interest rate of 3 percent per year (that is 3 percent plus inflation measured by the RPI) while students are studying (ie from the point at which loans are issued until the April after graduation) After this point the interest rate will depend on the graduatersquos income in each financial year (Crawford and Jin 2014)
Graduates with income below GBP 21000 will face a 0 percent real interest in 20167 The real interest rate will then increase linearly with income reaching a maximum of 3 percent for graduates with income of GBP 41000 or more Interestingly the interest 3 See httpwwwhumanservicesgovaucustomerservicescentrelinkyouth-allowance retrieved July 2015 4 In addition around 3 of students receive AUSTUDY targeted to students older than 25 (httpwwwabsgovauAUSSTATSabsnsfLookup41020Main+Features20July+2013) Higgins (2011) argues that student income support is largely insufficient and that and income contingent loan for living expenses should be introduced in Australia 5 In Euros the maximum tuition fee amounts to 10843euro the average tuition being 10102euro (using the average exchange rate for May 2015) 6 These fees apply to students from all parts of the UK and from the EU but for students from Wales can be offset by a fee grant from the Welsh Government 7 Note that the earliest date for repayment for all post-2012 (Plan 2) borrowers will be April 2016
November 2015 13
rate does not affect the size of the repayment made by the graduate each year which is fixed at 9 percent of gross income over the repayment threshold Instead the interest rate applied affects the overall size of the loan and hence the length of the period over which it is to be repaid The interest rate affects also the size of the debt potentially written off at the end of the repayment period Indeed any outstanding debt will be written off 30 years after the individual becomes liable to make repayments (April after graduation)
There are also loans for living costs for all students and they are subject to the same terms of repayment that apply for tuition fee loans Students living in the family home can borrow a maximum of GBP 4375 for living costs For students living away from the family home the maximum is larger of GBP 5500 outside London and GBP 7675 in London Students who receive a need based grant can borrow lower amounts
Crawford and Jin (2014) estimate that graduates will leave university with GBP 44035 of debt on average in 2014 prices In nominal terms they will repay on average GBP 66897 The Student Loans Company reports lower average debt levels for the 2014 repayment cohort of GBP 20100 However this figure refers to graduates who enrolled under the previous student loan plan when university fees where capped at GBP 3000 Crawford and Jinrsquos estimates on the other hand can be interpreted to provide an upper bound for estimated debt levels since they focus on students studying full-time and assume that everyone takes out a loan and that there is no dropout from university
Because repayment is income contingent the estimated dispersion of repayments is large the 10 percent lowest lifetime earners are expected to pay on average GBP 6460 while the 10 percent highest lifetime earners are expected to pay GBP 103691 As in Australia gender differences in expected repayments are large
According always to Crawford and Jinrsquos estimates the majority of graduates will not repay their loan in full As many as 73 percent of graduates will have some debt written off at the end of the repayment period with the new system On average the amount written off will be GBP 30000 The cost to the government will therefore be large Crawford Crawford and Jin (2014) estimate that for each pound lent out to cover tuition and maintenance the long run cost to the government is 433p This subsidy varies considerably across the distribution of graduate earnings while the lowest earning 10 percent receives a subsidy of 93 percent the highest earning 10 percent receive a subsidy of only 1 percent It is worth emphasizing that even the highest earners receive a subsidy however small This is due to the fact that the interest rate at which the government borrows to lend to students is higher than the interest rate that it gets from loan repayment Thus even though student loans bear a real interest rate interest rates are subsidized Still with respect to the situation prior to the 2012 reforms the introduction of the real interest rate generated important savings for government mainly from those individuals in the middle and upper earning deciles who were to pay more under the new conditions (Johnston and Barr 2013) As stated by the same authors those savings were offset by the increase in the income threshold at which repayments start In turn the cost of the student loans naturally increased with the introduction of the real interest rate by approximately GBP 4400 per graduate according to their estimates
In England there are no financial benefits for families of university students but the financial position of the family affects the amount of financial support available to students in the form of grants and bursaries (Eurydice 2013-14) From 2016-17 however maintenance grants will be abolished and replaced by increased maintenance loans (Hubble and Bolton 2015)
November 2015 14
Nordic Countries The principle of free education (guaranteed by law in Finland Denmark Norway and Sweden) is implemented by means of generous student aid and loans guaranteed by the government in addition to zero university fees for home and European Economic Area students (Ahola et al 2014) These countries usually share the view that students should be financially independent from parents For this reason aid is not means-tested according to parental income and parents do not benefit from tax benefits or family allowances In contrast the presence of a spouse or children is frequently accounted for Universities charge no fees and financial aid is generous but requires academic achievement The combination of zero tuition and considerable financial aid is made possible by large public spending8 These countries actually spend the largest proportions of GDP in public subsidies to tertiary education (see Table 1) And yet families (be it parents or partners) still provide more than 20 percent of the monthly income of students who do not live with their parents Although as shown on Table 3 this is a low contribution relative to other countries it shows that students are not totally independent from their families
Finland Like in the other Nordic countries no tuition fees are charged in Finnish universities Student financial aid is generous and consists of a study grant a housing supplement and a government-guaranteed student loan The study grant is an allowance paid by the government on a monthly basis Students are usually required to make adequate progress in their studies in order to be eligible for payment Amounts range from EUR 55 to 298 per month and are lower for students living with parents The housing supplement is an allowance paid by the government and it is considered to be non-taxable income It covers 80 percent of the rent for students living independently The maximum amount is EUR 20160 per month Students with yearly income larger than EUR 11850 per year are not eligible for financial aid There are no family allowances or tax benefits for parents
About 40 percent of students in higher education take up loans in addition to the aforementioned grants (Eurydice 2013-14) A typical amount to borrow is EUR 300 per month during 9 months or EUR 2700 a year These study loans are government guaranteed Once a student has been granted the government guarantee for a student loan she needs to apply for the loan at a bank of her choice No other collateral is needed as security for these loans A government guarantee is valid for a maximum period of 30 years from the moment the first instalment was drawn Unlike in countries with public income contingent loan programs students negotiate some of the loan terms such as the interest rate and repayment schedule (typically of a mortgage type) directly with their respective banks Graduates generally start paying off their loans within about two years of the end of their studies It usually takes about twice the time of duration of studies to pay back student loans (Ministry of Education and Culture) Default rates have traditionally been small although they did increase from 02-03 percent in the 80s to 11-14 percent by the end of the 90s Nowadays default on student loans does not seem to be perceived as a problem in Finland
8 These conditions apply to all students enrolled in higher education including foreigners who comply with the requirements In particular they usually need to speak Norwegian
November 2015 15
Table 3 Composition of monthly income of students not living with parents in selected European countries
Composition of monthly income for students not living with parents FI FR DE NL NO
Familypartner contribution for all students in 22 54 48 30 21 Contribution of public support for all students in 15 20 18 18 27 Job contribution for all students in 54 22 28 32 45 Other income in 9 4 6 20 7 Source eurostudenteu retrieved July 2015 ldquoOther incomerdquo includes income from either private or public sources that are not assigned to one of the other categories mentioned above eg grants and loans from private companies housing benefits or child benefits The social insurance institution of Finland (Kela) provides interest payment assistance in case of need If the higher education degree is completed within the target time graduates can also benefit from student loan compensations andor tax deductions These reductions in the payments due can amount to as much as one third of the student loan amount
In particular higher education students admitted from August 2005 and until August 2014 who graduate in the normative time are entitled to a tax deduction for study loans of 30 per cent of the qualifying debt exceeding EUR 2500 Students who have started their first higher education studies after 1 August 2014 can benefit from a student loan compensation of 40 percent of the qualifying debt exceeding EUR 2500 Kela will usually pay these compensations directly to the bank as an extra repayment on the student loan Both tax deductions and student loan compensations are generally granted without application but there are some exceptions to this
Table 4 reports the number of graduates in debt and the average amount they owe since the academic year 2010-11 (source Statistical database Kelasto retrieved June 2015) Taking inflation into account these amounts are fairly stable9 Numbers of people with outstanding debt seem by contrast to have been sensitive to the economic downturns from 2007-08 to 2011-12 approximately In 2013-14 a total of 309917 people had outstanding student debt and the average amount of debt held was EUR 5421 Interest allowances were granted that year to 1879 people with a global cost to the social insurance institution of EUR 230109 ie EUR 12246 per beneficiary (source Kela statistics)
9 The annual inflation rate from 2006 to 2014 in Finland was 220 264 343 -055 285 29 236 161 and 047 per cent respectively (httpwwwinflationeuinflation-ratesfinlandhistoric-inflationcpi-inflation-finlandaspx)
November 2015 16
Table 4 Debt characteristics in Finland
Year Persons with outstanding student debt Average amount of debt 2013-14 309917 5421 2012-13 298416 5281 2011-12 289076 5150 2010-11 281055 5011 2009-10 278005 4887 2008-09 276142 4799 2007-08 280233 4657 2006-07 292096 4484 2005-06 301892 4329 Source Statistical database Kelasto retrieved August 2015
Norway Norway has a long tradition of student loans and uptake of loans by students is among the largest in the world In 2010-11 70 percent of students had a loan and the average debt at graduation was according to the OECD USD 25188 (EUR 18530)10 As in the other Nordic countries universities do not charge tuition fees and everyone including foreign students can get student loans For the academic year 2015-16 the maximum amount one student could borrow was NOK 100920 or EUR 1200011
The most remarkable feature of Norwegian student loans is that up to 40 percent of these loans can be converted into non-repayable grants provided that some conditions related to academic progress as well as income and wealth of the student are met In particular the borrower must not live with her parents must pass all exams and earn less than NOK 162769 (EUR 19354) in 2015 andor less than NOK 168059 (EUR 19983) in 2016 Assets must not exceed NOK 370304 in 2015 and NOK 382339 in 2016 In Euros these amounts are respectively 44031 and 45462 using the average exchange rate in May 201512 However if the annual income andor assets of graduates exceed a certain level the grant is converted back into a loan (Opheim 2010) The support also remains a loan if students live at home with their parents even if they pass their exams
The normal repayment time is 20 years and all graduates can apply for delayed repayment for up to 3 years (during that time of deferment however interest still accumulates) In cases of low income unemployment illness childbirth or care of small children repayments may be postponed for a period and the interest can be waived In some cases all or parts of the loan will be cancelled (Eurydice 2015)13 Overall the system is designed to protect low wage earners It is however quite
10 Currency conversion using average annual quotations Euro-USD in 2010 and 2011 httpwwwcreaeseconomiansfa424eb3ddf92f02ec1256aa1002d763ef130e3e28017efc5c12574440044371fOpenDocument 11 Currency conversion using average monthly quotations Euro-NOK in May 2015 httpwwwdatosdelanzarotecomitemDetallesaspidFamilia=10ampidItem=4496 The description of the grant and loan amounts and conditions can be found in the webapge of the Norwegian State Educational Loan Fund -Lanekassen-2015 12 These amounts vary when the student is married andor has children 13 This applies for instance if the person lives and works in certain parts of Northern Norway as part of the package of fiscal incentives to favour residence in this area
November 2015 17
difficult to estimate the global cost of these measures to the government (consequently the taxpayer)
The Netherlands Holland has two main types of educational institutions research universities currently enrolling some 240000 students and universities of applied science (UAS) enrolling about 446000 students14 Dutch students pay fees to attend both types of institution and these fees have been gradually increasing in the last 20 years If they need to students can apply for a tuition fee loan that is a monthly loan equivalent to the amount of the tuition fees The loan bears the same interest rate that the Dutch government pays to the National Bank plus a small administrative surcharge During the last decade this implied and average of 35 per cent For 2010-11 the OECD (2014) reports an interest rate of 15 per cent and in 2012-13 it was only 06 percent (Vossensteyn 2014) There is a grace period of two years after graduation during which students do not have to make repayments After that a mortgage-style repayment schedule with fixed monthly instalments is applied over a period of 15 years The minimum monthly amount is EUR 45 Graduates can apply for a temporary reduction of payments in case of need and all debt remaining after 15 years is cancelled Vossensteyn (2014) records that in 2012 about 3 percent of total debt was not repaid but the most recent figures provided by Dutch Ministry of Education Culture and Science reveal a repayment rate of 90 percent only After the reform of the system of student aid that is due next September it is expected that the repayment rate go down to 864 percent The reason is that the new system will increase the amount of debt and make repayments more income contingent with a maximum of 4 percent of gross income to be spent by graduates on repayment
Before September 2015 all students were also eligible to a basic grant a public transportation pass and a supplementary means-tested grant that like the loan needed to be applied for As of September 2015 the basic grant will be abolished and substituted by a loan In contrast the means-tested supplementary grant will be increased
Grants in the Netherlands are performance-related they are initially paid out in the form of a loan but become non-repayable if the student graduates within ten years15 Students who fail to graduate have to repay all the finance they have received with the exception of the first five months of the supplementary grant (Eurydice 2015)
Vossensteyn (2014) investigates the impact for students of financial incentives embedded in higher education funding He concludes that the introduction of performance related grants combined with a more performance oriented general funding of higher education institutions has been effective in reducing the average time of degree completion In particular after 1996 students reduced their time to complete studies from from 64 to 58 years Like in Australia Vossensteyn does not find a negative effect of increased cost sharing on participation On the contrary participation has continuously increased An interesting fact is that although there is some evidence that students are debt averse the truth is that higher numbers of students are taking loans and accumulating higher debt Nowadays about 50 percent of graduates have debt and the average debt is about EUR 15000 This is likely to
14 According to httpswwwstudyinhollandnleducation-systemdutch-institutions retrieved August 2015 15 Typically bachelor programs last for 3 years in research universities and 4 years in universities of applied sciences which can be accessed a year younger
November 2015 18
increase in some additional EUR 6000 on average after the reform of the system of student aid due next September16
Parents are not eligible for financial assistance Vossensteyn (2014) explains that this was not the case before the mid 80s However during the 70s student unions argued in favour of more financial independence for students and this led to the approval of the Student Finance Act in 1986 that set the basis for the present scheme
Hungary All student-funding schemes presented so far transfer to the taxpayer the cost of non-repayment In 2001 Hungary introduced a student loan system that was uniquely different in this sense (Barr 2014) In particular in addition to income contingent repayment the Hungarian scheme relied on private funding and self-sustaining operation without any direct state subsidy (Berlinger 2009) Still today the program is managed by a not-for-profit state owned institution the Hungarian Student Loan Company (Diaacutekhitel) Although the government guarantees all loans to the private investor the cost of non-repayment falls on the participating cohort of graduates through the application of a cohort risk premium to the interest on the loan (Barr 2014) Thus the cost of non-repayment by some graduates falls on the more successful graduates in the same cohort who pay an interest surcharge17 In addition to the repayment and pre-payment of the borrowers Diaacutekhitel obtains resources from the return on investing assets stand-by liquidity facilities mid and long term loans from commercial banks loans from special purpose financing institutions (European Investment Bank EIB Hungarian Development Bank) and the issue of domestic bonds (Havelda 2010) The company has been successfully operating until now
Best performing students in Hungary are offered full scholarships to cover university fees Those students who miss the grade requirement by little are awarded a scholarship that amounts to 50 percent of the tuition fee The rest of the students are required to pay full tuition For first cycle (bachelors) degrees lasting 3 or 4 years tuition fees are approximately EUR 1000 per academic year on average18
Until 2012 loans were not available for the payment of tuition fees but only for other general maintenance expenses (this program is referred to as Student Loan 1) The OECD reports that 276 percent of graduates held some debt in the academic year 2010-11 The average debt at graduation for these individuals is 9263 USD (EUR 6630)19 The Hungarian Student Loan Company reports that repayment was larger than expected and allowed in 2013 to reduce the interest rate from 775 to 75 percent In particular during the fiscal year 2013 payments were 164 percent of all repayments expected for the calendar year (Diaacutekhitel 2013) From the beginning of the program clients have repaid 175 times more than the prescribed obligation
Since 2012-13 when the number of state funded places was cut the program Student Loan 2 was introduced for the payment of tuition fees of students with partial or no scholarship (Eurydice 2015) Unlike Student Loan 1 the interest of Student loan 2 is subsidized by the state and graduates only pay an interest of 2 percent (Diaacutekhitel
16 We thank Marc van der Steeg and Hans Vossensteyn for providing us with updated information on the figures in this section 17 This of course might generate adverse selection effects as students with better prospects will be less interested in taking up the loan However this adverse selection can be limited by the lack of other sources of finance for students 18 In addition registration fees range from EUR 40 EUR to up to EUR 800 depending on the course (httpwwwstudyineuropeeustudy-in-hungary) 19 The average quotation for 2010 and 2011 is 1 Euro =1397 USD
November 2015 19
2013) In 2012-13 the maintenance loan (Student Loan 1) amounted to a maximum of 250 thousand HUF per semester (795 Euro) for a maximum of 10 semesters20
Loan repayment starts only four months after the termination of studies and usually lasts for 10-15 years At the latest graduates are expected to terminate their legal relationship with the company after they turn 35 Advanced payments are not penalized The Student Loan Centre is required to terminate the loan contract with debtors whose overdue debt exceeds the instalments payable for 6 months (or 12 months with certain older contracts) The handling of these debts is then transferred to the tax authority In 2013 the ratio of cases transferred to the National Tax and Customs Administration constituted 29 percent
It has to be noted that repayment of Student loan 2 has not started yet Students in this program will be graduating this summer at best They will end up holding larger debt levels than their predecessors but they will only pay a 2 percent interest rate The rest of the interest due including the cohort risk premium will be subsidized
USA In the US student loans are an important source of college education funding apart from grants work-study and tax benefits Student loan programs have been in place for decades (the first federal student loan program was introduced in 1958) In 2013-14 the fraction of federal and non-federal loans in total student aid was 427 percent (College Board 2014)21
During the last decades both the fraction of college graduates with education-related debt and the average student debt per graduating borrowers have grown significantly The percentage of Bachelor degree recipients with debt increased from 55 percent in 1989-90 to 71 percent in 2011-12 Over the same period the average cumulative student loan debt per borrower rose from 7300 to 21200 (Hershbein and Hollenbeck 2014a 2014b) There are significant changes in the distribution of cumulative loan amounts For instance the fraction of college graduates who borrowed more than USD 30000 was 4 percent in 1989-1990 In 2011-12 it went up to 30 percent
Two notable key factors underpin these trends One is the substantial rise in the cost of college education Taking into account the changes in student aid the net tuition fees room and board (TFRB) cost has increased by 67 at public four-year colleges and 24 per cent at private non-profit four-year colleges between 1990-91 to 2014-15 Over the same period the net TFRB at public two-year institutions declined by 7 percent (due to a stronger increase in grant and tax benefits than the published TFRB) Second the enrolment in higher education has expanded Expansion brought in the system relatively poorer students who are likely to get lower parental support and have to rely more on debt in order to fund their studies22
Most of the student lending in the US is done through federal student loan programs although there is also a market for private student loans The size of the private market is estimated to be USD 910 billion or 72 percent of the USD 127 trillion in outstanding balances for the entire student loan market (Arvidson et al 2013) While the share of private loans in total new loans disbursed peaked at 23 percent in 2007- 20 1 Euro=3145 HUF as of July 1st 2015 According to the OECD Better life Index Hungarians earn USD 20948 per year on average (1887973 Euro) 21 The amounts borrowed by parents under the ParentPLUS program are included They represent around 10 percent of total federal loans 22 The share of high school graduates from low income families who enrolled in college grew from 347 percent in 1975 peaked at 561 per cent in 2008 and declined to 488 in 2013 (National Center for Education Statistics Digest of Education Statistics 2013 Table 30230)
November 2015 20
08 after the Great Recession it declined to 7 percent in 2012-13 (source authorsrsquo calculations based on College Board 2014 Table 1)
The largest federal student loan program is the Stafford Loan which can be subsidized or unsubsidized23 In the case of subsidized loans the government pays the interest while the student is in school The Stafford Loan accounts for 75 percent of total student-loan volume followed by PLUS loans to parents (87 percent) and PLUS loans to graduate students (68 percent)
Under the Stafford program the undergraduate cumulative borrowing limit is USD 31000 for dependent students24 and USD 57500 for the independent ones Graduate students can borrow up to USD 20500 per year The cumulative loan limit is USD 138500 (including both undergraduate and graduate loans)25 The interest rate on Stafford loans is variable but capped to 825 per cent for undergraduate and 95 per cent for graduate students All federal student loans can be consolidated into a single Direct Consolidation Loan The interest rate is fixed for the life of the loan and is calculated as a weighted average of the interest rates on the consolidated loans
The borrowers with Stafford loans have four basic repayment options standard graduated extended and income-contingent The repayment plans involve a fixed monthly payment (Standard Repayment Plan and Extended Repayment Plan) or can vary over the lifetime of the loan (the Graduated Repayment Plan and the income dependent schemes) Under the Graduated Repayment Plan payments increase gradually over the life of the loan usually every two years and are not income adjusted The repayment periods vary between 10 and 30 years For instance in the case of consolidated loans the repayment period is maximum 10 years if the amount of student debt is less than USD 7500 20 years if debt is lower than USD 40000 and 30 years if the amount of outstanding loans is higher than USD 60000 (Lochner and Monge Naranjo 2014b) The payments of the consolidated loans can be fixed or increase over the life of the loan
Discharging student debt through bankruptcy is very difficult In case of economic hardship the borrower can be granted a deferment or forbearance which makes possible a temporary suspension of payments or a reduction in the monthly payments Borrowers experiencing difficulties in repaying their debt can switch to an income-contingent plan where the monthly payments are calculated based on current income For example under the Pay As You Earn Repayment Plan (PAYE) introduced in 2012 the maximum monthly payment cannot exceed 10 percent of discretionary income This is calculated as the difference between the adjusted gross income and 150 percent of the poverty guideline which varies with the relevant family size and state of residence26 The outstanding balances at the end of the repayment period are forgiven The eligibility for PAYE has been expanded in June 2014
In case of default up to15 percent of the borrowers disposable earnings can be seized without a court order Federal tax refunds or Social Security payments can be also be
23 Until 1994-95 federal student loans were disbursed through private lenders but were guaranteed by the federal government However this program was eliminated and since 2009-10 all new federal loans have been Direct Loans Stafford Loans are now called Direct Subsidized and Direct Unsubsidized Loans 24 The dependency status is determined by a number of federal criteria that include studentrsquos age marital status parentsrsquo situation etc 25 The loan limits for medical school students are higher 26 See httpsstudentaidedgovsarepay-loansunderstandplans for more details about various repayment options
November 2015 21
seized and used to pay the outstanding debt27 Lochner and Monge Naranjo (2014b) report that default rates on federal student loans declined during the 90s and stabilized during the 2000s However they rose after the Great Recession from 46 percent in 2005 to 10 percent in 2011 The default rates are larger at private for-profit colleges and 2-year public institutions (13-15 percent) compared to private non-profit and 4-year public institutions (less than 8 per cent) Although for-profit colleges enrolled 10 per cent of full time students in 2009 they accounted for 44 percent of defaults (College Board 2014)
The research on student loan repayment behaviour suggests that differences in defaultnon-payment rates across institution types are attributable to the composition of their student bodies (see Gross et al 2009 for a review of the literature) For-profit or less-than-four-year colleges typically attract students from lower income families andor minority group and tend to borrow larger amounts They are less prepared academically and thus more likely to have lower returns from college education These characteristics are usually associated with a higher likelihood of experiencing difficulties in debt repayment More recent studies such as Lochner and Monge-Naranjo (2014a) and Gervais Kochar and Lochner (2014) reach similar conclusions
Despite the rise in default rates the overall estimated revenues associated with the federal loan programs were higher than the costs in recent years28 Between 2013-15 the average weighted subsidy rates ndash the cost as a percentage of initial amount disbursed ndash of all federal loans were negative indicating that overall cash inflows are larger than outflows For example the average subsidy rate in FY2013 was -882 percent meaning that the Federal government was earning almost 9 percent on each dollar loaned (Department of Education Fiscal Year 2013 Budget Request) Direct Subsidized Stafford Loans and Direct Consolidation Loans had positive subsidy rates in the FY2014 and FY2015 but they were more than compensated by large negative subsidy rates of the other federal loan types For example between 2013 and 2015 the Direct Unsubsidized Stafford Loan and Direct PLUS Loan programs for graduates had average subsidy rates of -2084 percent and -3265 percent respectively Estimates for older cohorts of Federal Direct Loans yielded positive subsidy rates until 2008 and negative thereafter29 According to the Congressional Budget Office the projected subsidy rates are also negative for coming years30
While concerns about student debt have been recently voiced out in the media recent research argues that increased borrowing should not necessarily translate into higher debt burden as most students borrow moderate amounts compared with the expected payoff from higher education (Akers and Chingos 2014 Dynarski S 2014) Akers and Chingos (2014) discuss the decline in the interest rates on federal student loans and the increase in their amortization periods as well as the fact that average income of households with student debt is growing faster than debt
However an upward trend in the average college premium might hide substantial heterogeneity in college education returns across students As discussed above students from lower quality institutions might have substantially lower returns than 27 However wage garnishment cannot be applied under some circumstances such as self-employment or a (post garnishment) weekly-take home pay of less than 30 times the federal minimum wage (Lochner and Monge Naranjo 2014b) 28 Under the terms of the Federal Credit Reform Act (FCRA) of 1990 the present value of costs and revenues associated with a loan are calculated for the life of the loan using Treasury interest rates 29 httpswwwwhitehousegovombbudgetSupplemental Federal Credit Supplement Spreadsheets Direct Loans Subsidy Re-estimates 30 httpswwwcbogovsitesdefaultfiles43054_StudentLoanPellGrantProgramspdf Table 2
November 2015 22
the average graduate Recent research also concludes that increased risk exposure due to higher debt levels may be a concern In particular there is evidence of increased labor market uncertainty over the last decades (eg variability of earnings)31 Moreover as pointed out by Dynarski (2014) repayments of student loans are made when borrowers are most vulnerable to income shocks
Student debt might have broader repercussions that are worth considering Importantly higher student debt is associated with a lower likelihood of homeownership (Brown and Caldwell 2013 Brown et al 2014 Cooper and Wang 2014) lower accumulated wealth (Cooper and Wang 2014 Fry 2014) a lower probability of attending graduate school (Rothstein and Rouse 2007 Akers 2013) and delaying of marriage and children (Baum and OrsquoMalley 2003)32
Canada Like in the US loans are a frequently used option for funding higher education studies in Canada The Canadian Student Loan Program has similar features to the American one Student loans are available to all students in public and private colleges but the amount that can be borrowed depends on financial need and is capped From 2000 onwards all loans are directly financed by the government The government pays interest on the loans while the students are in school Students begin repayment after a six-month grace period following graduation The interest rate can be fixed or floating and the repayment period can last for up to 15 years Normally student loans cannot be discharged through bankruptcy In 2009 the government introduced the Repayment Assistance Plan (RAP) that like PAYE in the US is an income-based repayment scheme offered to borrowers in financial hardship Under this scheme payments cannot exceed 20 percent of gross family income No payments are made if borrower income is below a minimum threshold Outstanding debts are forgiven after 15 years Over time there has been an increase in the number of borrowers enrolled in the Repayment Assistance Plan (see CSLP Statistical Review 2012-2013 Table 52)
Student borrowing has been increasing from the mid90s Luong (2010) reports that the fraction of graduates with loans from any source rose from 49 per cent to 57 per cent over the period 1995-2005 The increase in borrowing seems to follow the trend in tuition fees During the 70s and 80s average tuition fees for full-time undergraduates were stable or declining However they started to rise in the 1990s when provincial governments reduced their support to universities (Vossensteyn et al 2013) The average tuition fees for full-time undergraduate university students rose from around CAD 2000 in 1989-90 to more than CAD 4000 in 2008-09 (see Luong 2010 Chart A the figures are in expressed in constant 2007 dollars)
Average student debt (from all sources) at graduation also rose from CAD 15200 in 1995 to CAD 18800 in 2005 The distribution of the amounts became more lopsided The fraction of graduates with outstanding debts higher than CAD 25000 or more rose from 17 percent in 1995 to 27 percent in 2005 The percentage of students owing more than CAD 50000 or more at graduation went up from 2 percent to 6 percent (Luong 2010)
Despite the increase in borrowing the default rate has declined substantially since 2003-04 from 29 percent to 13 percent in 2011-12 (CSLP Statistical Review 2005-06 2010-11 2012-3 Three Year Cohort Default Rates for Direct Loans) Borrowers at private institutions have the highest default rates 22 percent in 2011-12 compared
31 See Heathcote Storesletten and Violante (2010) Mofitt and Gottschalk (2012) and Lochner and Shin (2014) 32 Some of the contributions listed above attempt to establish causal relationships (eg Rothstein and Rouse 2007 Akers 2013)
November 2015 23
to 8 and 16 percent at universities and colleges respectively Results from Lochner Stinebrickner and Suleymanoglu (2013) indicate that a higher probability of default is linked to lower income and family support Educational attainment also plays a role as borrowers with a university education or higher are less likely to default According to the study repayment problems are also more common among students enrolled in private institutions
The government costs of student loan programs have exceeded the revenues between 2003-04 and 2012-13 and the net costs of the program have increased over the period Also projections show that despite expectations of lower future enrollment the net costs of the system are likely to increase However it is important to note that the net cost includes non-repayable assistance disbursed under the Canada Student Grants Program (CSGP) Implemented in 2009 to help students in financial need the program grew in importance over time The total amount disbursed grew from 668 million CAD in 2003-04 to 6802 in 2012-13 which represents 54 percent of the net cost in that year (CSLP Annual Reports) However a significant part of student aid is still indirect in the form of tax benefits which in AY2010-2011 were almost 25 times larger than grants under CSGP (Burley and Awad 2015) Tax credits have been criticized for not helping enough the students in need (see Fry L 2007)
Countries without extensive student loan programs We now devote some attention to a couple of countries France and Germany where student loans are not as widely used to finance higher education In contrast in these countries parents are expected to contribute towards the costs of the education of their children Table 3 shows that in effect family contributions typically represent a much higher percentage of student income than in countries like Finland Norway or the Netherlands In contrast with the case of Nordic countries parents can benefit from financial aid in the form of tax allowances both in France and Germany Does the fact that families contribute more imply that higher education is available to the relatively wealthier only Or are loans on the contrary substituted by sufficiently generous grants and family aid In what follows we will try to give some answers to these questions for each country in turn
France In France fees are determined by the Ministry of Higher Education and Research In 2013 they were of EUR 183 Euro annually for undergraduate studies EUR 254 for graduate and EUR 388 for doctoral studies Some universities add to these fees the costs of providing specific services In the end some public universities can charge as much as EUR 2000 per year33 In general students who receive a grant (almost 35 percent of the student population in 2012-13) are exempted from fee payment Since 2008 loans of up to EUR 15000 are also available to French students but less than 01 per cent of students take out such a loan (Eurydice 2013-14)
33 Grandes eacutecoles and Engineering Schools are different with fees around EUR 550 per year and reaching up to EUR 10 000 per year depending on family income There are also grandes eacutecoles which not only deliver education free of charge but may even pay some students expected to become civil servants This is for instance the case in the Ecole Polytechnique and the eacutecoles normales supeacuterieures
November 2015 24
Table 5 Intergenerational education mobility in selected European countries FI FR DE NL NO UK
Students parents without tertiary education (not ISCED 5-6) in 373 42 311 433 353 491
Students fathers without tertiary education (not ISCED 5-6) in 55 541 371 509 458 -
Students mothers without tertiary education (not ISCED 5-6) in 49 535 596 613 496 -
Ratio students fathers without tertiary education to counterparts in total population
08 07 05 - 06 -
Ratio students mothers without tertiary education to counterparts in total population
08 07 08 - 08 -
England and Wales Source Eurostudent National profiles httpwwweurostudenteuresultsprofiles retrieved July
2015 Students are classified into categories based on family income This classification determines who is eligible for need-based support and for how much The need based grant can be as large as EUR 5500 Students on a need-based grant can also get a complimentary merit based grant based on results in the baccalaureacuteat of as much as EUR 1800 Parents of students who are financially dependent on them (and less than 25 years old) are eligible for tax relief proportional on their income Two thirds of the students declare receiving financial aid from their parents (Eurostudent 2015) and the average contribution to student income by parents is larger than 50 percent for students not living with parents (Table 3) According to the OECD 31 percent of students in France benefit from grants or scholarships although only 24 percent receive aid higher than tuition fees and the percentage of global expenditure in higher education devoted to scholarships and grants is below the average of the OECD This information may be misleading as support provided by sources other than the Ministry of Education such as housing allowances and tax reductions are not included in these figures and they are likely to be quite large Housing allowances for instance represent about 90 percent of scholarships grants and about one-third of students benefit from them (OECD 2014) On the other hand annual expenditure levels per student by educational institutions in tertiary education are similar to those of Finland and the UK (see Table 1 above)
In the end upward education mobility is high with 34 percent of men and 46 per cent of women achieving a level of education higher than their parents (the average in the OECD is 28 and 36 per cent respectively) And 43 percent of 25 to 34 year olds have a tertiary education degree a percentage similar to that of the US or Sweden Thus we cannot conclude that access is harmed in France by the lack of general funding through students loans that on the other hand are available to students as we have already mentioned
Germany Although in principle the Laumlnder may impose fees on students social pressure against university fees is very large and at present none of them charge general study fees In fact many Laumlnder experimented with university fees for short periods (less tan 10 years) but they all decided to abolish them The last to do so were Bavaria in 2013-14 and Lower Saxony in 2014-15 While fees were in place state loans were available to cover fees and living costs
November 2015 25
At the moment grants and loans are only available for children of low-income families as parents are required by law to fund their childrenrsquos education including higher education In contrast non-low income families with children under 25 pursuing studies are entitled to tax allowances (Eurydice 2015) General public student support (BAfoumlG) is awarded half as a grant and half as an interest free loan and approximately 25 percent of students receive this kind of support Total amounts range from EUR 10 to EUR 670 per month for 12 months per year A maximum of EUR 10000 needs to be paid back According to Grave and Sinning (2014) this program is largely in deficit costing the government between 57 and 80 percent of the total issued debt They argue that it would be less expensive to give out all the aid in the form of a grant due to the large cost of interest subsidies Moreover there is evidence that student aid has not been successful in improving access of the less well off in Germany (Baumgartner and Steiner 2004)
In contrast the percentage of total public expenditure in higher education devoted to public support in the form of grants or scholarships to households in Germany is above the OECD average (Chart B53 OECD 2014) The annual expenditure per student by educational institutions in tertiary education is quite similar in Germany to that of Finland France or the UK (see Table 1 above) Still upward intergenerational education mobility is lower than average (20 percent for men 18 percent for women as compared to 28 percent for men and 36 for women on average in the OECD) and less than 28 percent of 25 to 34 year olds have a tertiary education degree Moreover Orr Ushel and Wespel (2014) report that the expansion of higher education was achieved in Germany through an increase of enrolments in Fachhochschulen Universities of Applied Sciences which are more vocational in nature and less costly to provide and where the share of students from less well-educated parents is greater than in universities Although we cannot attribute these facts to the lack of general funding of students through loans there is some evidence of limited access to higher education and social stratification within higher education in Germany
Concluding comments We have reviewed some of the important issues related to student debt in a number of developed countries Student loans can take the form of mortgage type loans or income contingent loans Mortgage type loans with predetermined fixed payments are used in Nordic countries where the government guarantees the loans and provides protection to low-income earners but loans are provided by private banks Increasingly however student aid is made available in the form of loans with income contingent repayments managed by public agencies Also for the most part student loans can be used to pay both fees and general living expenses Two exceptions are Australia that restricts public loans to cover fee-payment and Nordic countries that provide loans to fund living expenses only because there are no university fees in these countries
Some student loan programs are used to steer incentives This is notably the case in Norway and the Netherlands where student aid is given out in the form of a loan and can sometimes be transformed in a grant depending on academic achievement Student loan schemes can also affect incentives unintentionally Indeed studies carried out in Australia and the United States have shown that student debt is associated with delaying marriage or having children lower likelihood of homeownership and lower accumulation of wealth
Government finances can also be at stake when the loan scheme is managed by public agencies as it is typically the case with income contingent schemes Indeed in this case because debtors only pay a given proportion of their incomes and obligations usually expire after 15 to 30 years of graduation income-contingent arrangements
November 2015 26
transfer part of the repayment burden to the funding institution and often ultimately to the taxpayer In Australia and England there are some concerns about the sustainability of the system over the medium run By contrast in other countries like the US and Hungary the student loan programs are profitable It is worth noting that in spite of the concerns with graduate debt voiced out in the media recent research shows that in the US most students borrow moderate amounts compared with the expected payoff from higher education However the dispersion of realized earnings can be quite large so the burden of student debt can become significant for some borrowers
Finally we have considered France and Germany as examples of countries in which borrowing for college is not widespread In France student loans are actually available but demand is low with parental contributions amounting to more than 50 percent of student income on average In Germany a student loan scheme available only to students in need is reported to be too costly and indeed more costly than it would be to simply give out the equivalent aid in the form of a grant Although public subsidies are relatively large parents also contribute nearly 50 per cent of student income in Germany It is however difficult to draw general conclusions regarding the link between the absence of loans and equality of opportunity as intergenerational mobility is rather low in Germany but high in France Many factors interact to generate such outcomes including among others the quality of pre-college education redistributive policies or the productive structure of each country A more systematic analysis beyond the scope of this report would be required in order to elucidate the role of student support policies on educational opportunity
Acknowledgements
We gratefully acknowledge the contributions to this report by Havelda Balaacutezs Nicholas Barr Edina Berlinger Bruce Chapman Claire Crawford Rodica Fazakas William Gort Tim Higgins Jukka Laurimo Lene Mejer Vibeke Opheim Lluiacutes Puigdemont Mariacutea Racionero Simon Roy Javier Valbuena Marc van der Steeg and Hans Vossensteyn
References Ahola S T Hedmo J-P Thomsen and A Vabo (2014) Organisational features of higher education Denmark Finland Norway and Sweden Working Paper 142014 Nordic Institute for Studies in Innovation Research and Education (NIFU)
Akers B (2013) Excess Sensitivity of Labor Supply and Educational Attainment Evidence from Variation in Student Loan Debt Working Paper
Akers B and M M Chingos (2014) Is a student loan crisis on the horizon In B J Hershbein and K Hollenbeck (Eds) Student Loans and the Dynamics of Debt Kalamazoo MI WE
Upjohn Institute for Employment Research
Arvidson D D Feshbach R Parikh and J Weinstein (2013) The Measure One private student loan report Q1 2015 httpwwwmeasureonecomreports
Barr N (2001) The Welfare State as Piggy Bank Information risk uncertainty and the role of the state Oxford University Press
Barr N (2014) Income contingent loans and higher education financing Ch 5 in Income contingent loans Theory practice and prospects Edited by B Chapman T Higgins and JE Stiglitz International Economics Association Conference Vol no 153 Palgrave Macmillan 2014
November 2015 27
Baum Sandy and Marie OrsquoMalley (2003) College on Credit How Borrowers Perceive Their Education Debt Journal of Student Financial Aid 33(3) 1-19
Baumgartner H and V Steiner (2004) Enrolment into Higher Education and Changes in Repayment Obligations of Student Aid ndash Microeconometric Evidence for Germany ndash DIW Berlin German Institute for Economic Research Discussion Paper 444
Berlinger Edina (2009) An Efficient Student Loan System Case Study of Hungary Higher Education in Europe 34(2) 257-267
Birch E and Miller PW (2006) The Impact of HECS Debt on Australian Studentsʹ Tertiary Academic Performance Education Research and Perspectives Vol 33 No 1
Brown Meta and Sydnee Caldwell (2013) ldquoYoung Student Loan Borrowing Retreat from Housing and Auto Marketsrdquo Liberty Street Economics
Brown Meta Andrew Haughwout Donghoon Lee Joelle Scally and Wilbert van der Klaauw (2014) ldquoMeasuring Student Debt and Its Performancerdquo Staff Report no 668 Federal Reserve Bank of New York
Burley G and A Awad (2015) Student Financial Assistance in Canada Complicated Inefficient and Ineffective Canadian Federation of Students Ottawa wwwcfs-fceeca
Chapman B and A Leigh (2009) Do very high tax rates induce bunching Implications for the design of income contingent loan schemes The Economic Record 85 (270) 276-289
Chapman B and Higgins T (2013) The cost of unpaid HECS debts of students working abroad Australian Economic Review 46(3) p 286-299
Chapman B and C Ryan (2005) The access implications of income-contingent charges for higher education lessons from Australia Economics of Education Review 24 491ndash512
College Board (2014) Trends in Student Aid Trends in Higher Education Series the College Board
Cooper Daniel and J Christina Wang (2014) Student Loan Debt and Economic Outcomes Staff Report no 14-7 Federal Reserve Bank of Boston
Crawford C and W Jin (2014) Payback Time Student Debt and Loan Repayments What Will the 2012 Reforms Mean for Graduates Institute for Fiscal Studies Report R93
Crawford C Crawford R and W Jin (2014) Estimating the public cost of student loans Institute for Fiscal Studies Report R94
CSLP Annual Reports 2005-2006 2008-2009 2011-2012 2012-2013 Employment and Social Development Canada httpwwwesdcgccaenreportscslp_cespindexpage
CSLP Statistical Review 2012-13 httpwwwesdcgccaenreportscslp_cespcslp_stats_2013page7-1
Department of Education STUDENT LOANS OVERVIEW Fiscal Year 2013 Budget Request
Diaacutekhitel 2013 Annual Report
Dynarski S (2014) An Economistrsquos Perspective on Student Loans in the United States Economic Studies at Brookings ES Working Paper Series September 2014
EUROSTUDENT V 2012ndash2015 Bielefeld W Bertelsmann Verlag Available at httpdatabaseeurostudenteu83countries5B5D=9 retrieved July 2015
November 2015 28
Eurydice (2013-14) National Student Fee and Support Systems Facts and Figures Education and Training
Eurydice (2015) Countries Description of national education systems Retrieved May June July 2015 from httpswebgateeceuropaeufpfismwikiseurydiceindexphptitle=Countries
Fry Richard (2014)Young Adults Student Debt and Economic Well-Being Pew Research Center social and Demographic Trends
Fry L (2007) Modernizing Canadarsquos System of Students Financial Assistance Ottawa Canadian Alliance of Student Associations
Gervais M C S Kochar and L Lochner (2014) Profits for whom The unprofitability of lending to for-profit students Working Paper
Go8 (2014) Policy Note HELP Understanding Australiarsquos system of income contingent loans Group of 8 May 2014
Grave B S and M Sinning (2014) Why donrsquot we just give them the money Financing living expenses of students in Germany in Income Contingent Loans Theory practice and prospects Edited by B Chapman T Higgins and JE Stiglitz IEA Conference Volume No 153 Palgrave Macmillan 2014
Gross J O Cekic D Hossler and N Hillman (2009) What matters in student loan default A review of the research literature Journal of Student Financial Aid 39 (1) 19-29
Havelda B (2010) Key elements of the Hungarian Student Loan Scheme Budapest Student Loan Center Retrieved July 2015 from httpwwwirohruserdocsFileACCESS3 Hungary study visitDIAK_Havelda_presentationpdf
Hershbein B J and K Hollenbeck (2014a) The distribution of college graduate debt 1990 to 2008 A decomposition approach In B J Hershbein and K Hollenbeck (Eds) Student Loans and the Dynamics of Debt Kalamazoo MI WE Upjohn Institute for Employment Research
Hershbein B J and K Hollenbeck (2014b) The distribution of college graduate debt 1990 to 2008 A decomposition approach - updated web tables and figures WE Upjohn Institute Working Paper
Higgins T (2011) Income Support for Higher Education Through Income Contingent Loans Available at SSRN httpssrncomabstract=1810137 or httpdxdoiorg102139ssrn1810137
Houssard C A Sastro and S Hardy (2010) The impact of HECS debt on socioeconomic inequality and transition to adulthood outcomes ECON 4106 Policy Evaluation Session 2 2010 at httpwwwmelbourneinstitutecomdownloadshildaBibliographyWorking+Disussion+Research_Papers2010Houssard_etal_impact_of_HECS_debtpdf Retrieved July 2015
Hubble S and P Bolton (2015) Abolition of maintenance grants in England from 201617 House of Commons Library BRIEFING PAPER Number 07258 15 July 2015
Johnston A and N Barr (2013) Student loan reform interest subsidies and costly technicalities lessons from the UK experience Journal of Higher Education Policy and Management 352 167-178
November 2015 29
Kela (2015) The social insurance institution of Finland Statistics on financial aid for students Retrieved May 2015 from httpwwwkelafiwebenstatistics-by-topic_statistics-on-financial-aid-for-students-
Lochner L and A Monge-Naranjo (2014a) Default and repayment among baccalaureate degree earners In B J Hershbein and K Hollenbeck (Eds) Student Loans and the Dynamics of Debt
Kalamazoo MI WE Upjohn Institute for Employment Research
Lochner L and A Monge-Naranjo (2014b) Student Loans and Repayment Theory Evidence and Policy NBER Working Paper No 20849
Lochner L and Shin (2014) Understanding Earnings Dynamics Identifying and Estimating the Changing Roles of Unobserved Ability Permanent and Transitory Shocks NBER Working Paper No 20068 Issued in April 2014
Lochner L T Stinebrickner and U Suleymanoglu (2013) Analysis of the CSLP Student Loan Defaulter Survey and Client Satisfaction Surveys CIBC Working Paper Series Working Paper 2013-3
Luong M (2010) The Financial Impact of Student Loans Statistics Canada Perspectives on Labour and Income vol11 no1
Norton A (2014) Doubtful debt The rising cost of student loans Grattan Institute Report No 2014-7
Lanekassen Norwegian State Educational Loan Fund [httpswwwlanekassennonb-NOLanguagesFinancial-support-for-foreign-studentsGrants-and-loans] Last update 30062015 Retreived 01072015
OECD Better Life Index Retrieved July 2015 from httpwwwoecdbetterlifeindexorg
OECD (2014) Education at a Glance 2014 OECD Indicators OECD Publishing httpdxdoiorg101787eag-2014-en
Opheim V (2010) Buried in debt Student loans social inequalities and study delays in the post-Bologna system of Norway Unpublished manuscript
Orr D A Ushel and J Wespel (2014) Do changes in cost sharing have an impact on the behaviour of students and higher education institutions Evidence from nine case studies Volume I comparative report European Comission Education and Training DOI 10276674065
Rothstein Jesse and Cecilia Elena Rouse (2007) Constrained After College Student Loans and Early Career Occupational Choices NBER WP no 13117
Shao (2014) Debt Marriage and Children ndash The Impact of Student Loans on Marriage and Fertility
Student Loans Company (2013-14) Student Loans in England Financial Year 2013-14 httpwwwslccoukstatisticsaspx
Student Loans Company (2015) Retrieved July 2015 from httpwwwslccoukmedia788360average_balance_on_entry_into_repayment_by_country_within_the_ukpdf
Study in Europe Hungary Retrieved July 2015 from httpwwwstudyineuropeeustudy-in-hungary
Vossensteyn H (2014) Access to Dutch higher education issues of tuition fees and student financial support in H Ertl and C Dupuy (eds) Students Markets and Social Justice higher education fee and student support policies in Western Europe and beyond Oxford Symposium Books pp 111-132)
November 2015 30
Vossensteyn H L Cremonini E Epping G Laudel and L Leisyte (2013) International Experiences with Student Financing -Tuition fees and student financial support in perspective Final report Centre for Higher Education Policy Studies (CHEPS) University of Twente
EENEE Analytical Reports 25 24 23 22 21 20 19 18 17 16 15
Elena Del Rey Ioana Schiopu Maria Knoth Humlum Nina Smith Torberg Falch Constantin Mang Francis Kramarz Martina Viarengo Jo Blanden Sandra McNally Ludger Woessmann Daniel Muumlnich George Psacharopoulos Reinhilde Veugelers Elena Del Rey Giorgio Brunello Maria de Paola Samuel Muehlemann Stefan C Wolter Hessel Oosterbeek
Student Debt in Selected Countries The impact of school size and school consolidations on quality and equity in education Innovations in education for better skills and higher employabil-ity Using Education and Training to Prevent and Combat Youth Unemployment Reducing Inequality in Education and Skills Implications for Economic Growth The Economic Case for Education Mechanisms and methods for cost-benefit cost-effectiveness analysis of specific education programmes The contribution of universities to innovation (regional) growth and employment The costs of early school leaving in Europe Return on investment of apprenticeship systems for enterpris-es Evidence from cost-benefit analyses The Financing of Adult Learning
14 Susanne Link Developing key skills What can we learn from various national
approaches 13 Marc Piopiunik
Paul Ryan Improving the transition between educationtraining and the labour market What can we learn from various national ap-proaches
12 Daniel Muumlnich
Erik Plug George Psacharopoulos Martin Schlotter
Equity in and through Education and Training Indicators and Priorities
11 Adrien Bouguen Marc Gurgand
Randomized Controlled Experiments in Education
10 Torberg Falch
Hessel Oosterbeek Financing lifelong learning Funding mechanisms in education and training
9 Reinhilde Veugelers A Policy Agenda for Improving Access to Higher Education in the
EU 8 Giorgio Brunello
Martin Schlotter Non Cognitive Skills and Personality Traits Labour Market Rele-vance and their Development in EampT Systems
7 Eric A Hanushek
Ludger Woessmann The Cost of Low Educational Achievement in the European Un-ion
6 George Psacharopou-
los Martin Schlotter
Skills for Employability Economic Growth and Innovation Mon-itoring the Relevance of Education and Training Systems
5 Martin Schlotter Guido Schwerdt Ludger Woessmann
Methods for Causal Evaluation of Education Policies and Prac-tices An Econometric Toolbox
4 Martin Schlotter Origins and Consequences of Changes in Labour Market Skill
Needs
3 Martin Schlotter Guido Schwerdt Ludger Woessmann
The Future of European Education and Training Systems Key Challenges and their Implications
2 George
Psacharopoulos The Costs of School Failure ndash A Feasibility Study
1 Ludger Woessmann
Gabriela Schuetz Efficiency and Equity in European Education and Training Sys-tems
Numeacutero de catalogue NC-02-15-536-EN-N
doi 102766971679
ISBN 978-92-79-49409-3
- EENEE_AR25 Title Pagepdf
- Title_with_identifierspdf
- Student_Debt_Formatted_Ex_Sumpdf
- Back Matter with Identifierpdf
-
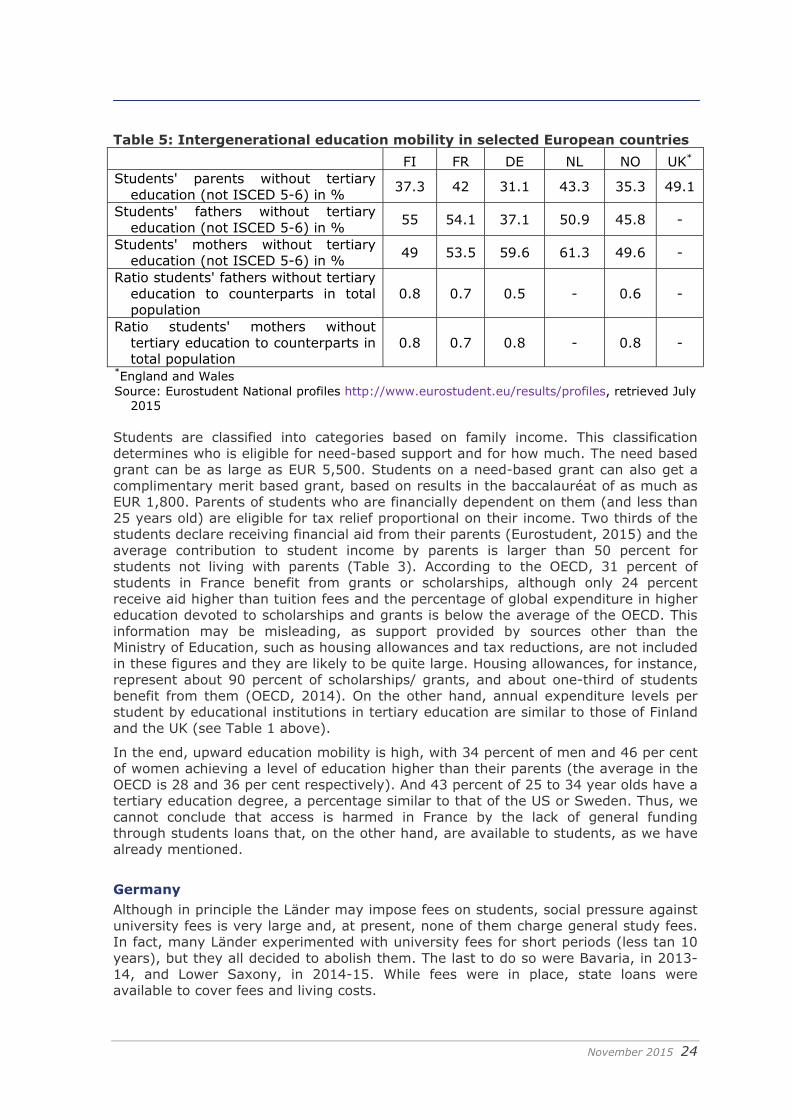

Numeacutero de catalogue NC-02-15-536-EN-N
doi 102766971679
ISBN 978-92-79-49409-3
- EENEE_AR25 Title Pagepdf
- Title_with_identifierspdf
- Student_Debt_Formatted_Ex_Sumpdf
- Back Matter with Identifierpdf
-