elementos para elaborar un perfil de género y salud · elementos para elaborar un perfil de...
TRANSCRIPT


3
Elementos para elaborar un Perfil de Género y Salud
Guidelines for Developing a Population-Based Gender and Health Profile
Harpa Isfeld Margaret Haworth-BrockmanPrairie Women’s Health Centre of Excellence
Design and illustration:www.lapizypapel.ec | [email protected]

4
The authors wish to thank the Gender, Eth-nicity and Health Office of the Pan-American Health Organization for the opportunity to work on this project. We thank in particular Lilia Jara for her guidance and thoughtful suggestions.
Our thanks go also to Barbara Clow, Ann Pederson, Paula Migliardi, Sandi Kirby, Deb Malazdrewicz and Erin Schellenberg who reviewed previous drafts.
This guide arises from earlier work done with Lissa Donner. Ms Donner worked with us for a number of years to refine the knowledge
and understanding of gender-based analysis and health statistics that led to this guide, and we thank her for her contributions.
Finally, our thanks to the participants and hosts of the Gender Based Analysis of Health Statistics Workshop held in June 2008 in Belize City. Their comments and questions were invaluable to the final content of this guide.
Prairie Women’s Health Centre of Excellence receives core funding through the Women’s Health Contribution Program of Canada.
Acknowledgements
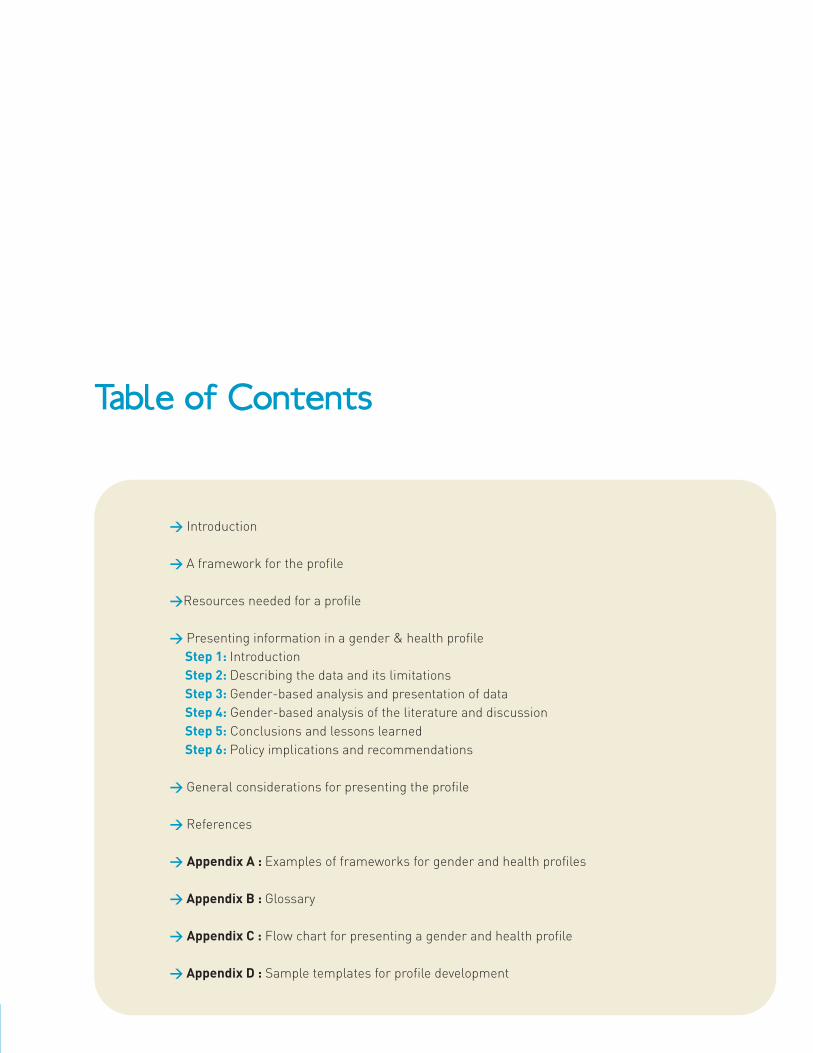
> Introduction
> A framework for the profile
>Resources needed for a profile
> Presenting information in a gender & health profile Step 1: Introduction Step 2: Describing the data and its limitations Step 3: Gender-based analysis and presentation of data Step 4: Gender-based analysis of the literature and discussion Step 5: Conclusions and lessons learned Step 6: Policy implications and recommendations
> General considerations for presenting the profile
> References
> Appendix A : Examples of frameworks for gender and health profiles
> Appendix B : Glossary
> Appendix C : Flow chart for presenting a gender and health profile
> Appendix D : Sample templates for profile development
Table of Contents

6
This guide describes how to develop and present a gender and health profile for health policy and planning.
A gender and health profile is a summary of data and related information that describes health, and its determinants, for a population. Gender-based analysis is used to understand how sex-disaggregated data relate to the daily lives of men, women, girls and boys. The popu-lation health story described in a profile is built upon a series of indicators, or measurements, of key health concerns or topics. Indicators should be widely understood, easily measured, can be addressed through policy at some level, and can be used to record the progress made to reduce inequities and improve health in the population. Because health indicators provide simple and convenient descriptions of aspects of health status or influences on health, they can be used to encourage practitioners, policy makers and the general public to take action to improve health.
Profiles can differ in their level of complexity. A profile can be developed for just one health topic or for many topics and indicators in a framework of topic areas. A profile that includes a number of topic areas and many indicators provides a richer understanding
of the range of influences on health, and can uncover subtle differences in local and national circumstances.
The content of a profile is based on both numerical (quantitative) and narrative (quali-tative) data. Numerical data give some idea of what is happening (trends over time, emer-gence of new diseases, for example) and to whom it is happening (which people are sick, where they live, how they are being treated, for example). Numerical data describe the health of the population broadly, and statisti-cal analysis and investigation make it possible to separate variables, such as sex and age, as well as to compare variables from comple-mentary data sets. However, numerical data are not the only information provided in a pro-file. Current academic research, government documents and community reports provide other valuable information in a profile about why trends and data points are observed, and how they may have come about.
Indicators are specific measures. They are recorded and compared between groups, places or over time, to establish where change and improvement may be needed, and to measure how well the change is succeeding.
Introduction
This guide describes the information needed and the steps to take to present health-related data in a profile using a gender-based analysis. It follows the methods described in the Guidelines for Gender-Based Analysis of Health Information for Decision Making.
The aim is to use the data, related literature and gender-based analysis to improve health, health deter-minants and health system performance.

7
Elementos para elaborar un Perfil de Género y Salud
The World Health Organization defines health broadly, as more than just the pre-sence or absence of disease:
“Health is a state of complete physical, mental and
social well-being and not merely the absence of di-
sease or infirmity.”
A gender and health profile, then, should include a broad range of indicators for health and health determinants. That is, a profile should include not only clinical indicators of physical and mental health, but also indicators about other dimensions in people’s lives.
A framework outlines how the profile’s in-dicators relate to each other and are used together to provide a complete story about health. A framework can be set up in many ways but the framework chosen should name the areas of interest in the profile (such as health status, health determinants and health system performance). The indi-cators provide measures that contribute to the understanding of health and gender wi-thin the topic areas. The goal is to compile, wherever possible, a rich picture of health-influencing factors.
For example, a simple measure of labour force participation gives only a brief idea of how and where men and women are employed. More complete information is given when rates of employment and unemployment are included, as well as some measure and description of self-employment. All these factors (indica-tors) influence health because of the stresses related to precarious, seasonal or unstable employment. The story becomes clearer with presentation of data on employment by educa-tion level, wage differences, income earnings and in which sector and occupations the work
A framework for the profile
For example:
Possible clinical health indicators: Possible non-clinical health indicators:
Rates of diagnosed disease Income
Hospital visits Education and literacy
Visits to doctors or other clinicians Access to services including health care
Treatment data Political decision-making ability
Drug prescriptions Migration trends
Mortality rates and causes Labour and working conditions
Body weight Exposure to pollutants and toxins

8
is done (private, public, service, etc.). It would also be important to consider the distribution of paid and unpaid work among women and men in the household, as women generally do more unpaid work than men, and men do more paid work than women. This situation affects women’s access to health and retire-ment plans through paid work. Each of these indicators provides more information about the daily lives and the influences on women’s and men’s health and helps to explain where inequities arise.
Community stakeholders, both women and men, can be consulted about their health concerns and the indicators they want inclu-ded in the framework. The indicators cho-sen for the profile should be ones that can be measured and can be used to take action to improve equity and equality. See Appendix A for some examples of profile frameworks.
The profile framework is like the frame of a house. It gives the ba-sic structure and defines the rooms. The indicators, like the con-tents and furniture of a house, provide the more complex details and information.

9
Elementos para elaborar un Perfil de Género y Salud
As explained in the introduction, a profile does not just report data by sex. A gender and health profile brings together data disaggregated by sex (as well as by age, socio-economic level, ethnicity, geography and other relevant varia-bles where possible), current literature, and a working knowledge of existing policies and local politics. It is also important to have staff who are knowledgeable about the health of women and men in the community as well as contacts with health care providers, health planners, front-line workers, and grassroots agencies who can help describe population trends in more detail or at a more local level if needed.
Health indicator data
You will require statistical data for the indicator, collected and reported by sex, and preferably by age, ethnicity and socio-economic status. Whenever possible, use the most recent and complete data for the region, nation or local area. In particular, it is valuable if the data are available for the level where policy is made.
In some cases not all the data needed may be available, or it may not be available by sex. For some indicators it may be possible to use proxy data – data that are similar to the topic in question, and that can give some idea of the current measures – to describe what should be measured and reported.
Resources needed for a profile
Proxy data example: Data about a particular ethnic group may not be availables, or perhaps cannot be se-parated from a larger data set. However, census data may provide information about geographical areas where there are high proportions of the ethnic group of interest. The area-level data can then be used as a proxy for the ethnic group.
For each indicator or set of indicators you will need the following:
Be sure to highlight where there are information gaps, or where data should be collected and reported by sex in the future.
Resources needed for each indicator and a profile:
> Data disaggregated by sex, and by other relevant variables, > Current research and academic literature, government and
community reports,> Staff who understand gender, and who have working knowledge
of policies in the topic area, > Community representatives and > Other experts who can help interpret data and literature within
the local context.

Current literature
The data in the profile are presented in the context of current academic and research li-terature, government and NGO reports, and community documents. The literature from all these sources is used to describe what other people have already learned about the indi-cator. This would include medical and clinical research and reports, papers about treatment methods, population health and social health trends, government policies and strategies, as well as information on local issues and initia-tives. Some of this literature will be specific to one sex or the other, but much of it
Use the literature gathered if it gives more or better understanding of biology and physiology (sex differences in symptoms, for instance), or the effects of gender roles on the indicator (whether men are more or less likely to seek health care, for instance).
As employment affects health through inco-me but also through work place stress, the example of labour and employment (page 2) would be richer with information from local, national and regional reports and papers about labour trends, economic opportunities and recent changes, migration and employ-ment patterns, and perhaps, local men’s and women’s employment over the lifespan and gender divisions in household labour. Re-
ports from grassroots agencies may provide important community knowledge about wor-king conditions, employment security issues, availability of social support and health and safety training for workers. Summaries of this information provide context for the indicator data in a profile.
Note that all documents used to develop a profile must be given full citations.
Staff knowledgeBoth the data and the literature must be analy-zed with a gender perspective. Staff involved in writing and developing a profile must be able to conduct and interpret simple statistical analyses, understand scientific methods, cri-tically consider limitations of the data and the literature gathered, interpret how the informa-tion collectively gives greater understanding of gender in this aspect of the health of women and men, and provide recommendations for policy, programming or further surveillance. Staff must also consider what else is known about social and cultural roles, status and expectations that may be influencing the numerical data presented.
Wherever possible, staff should be able to invest their own experience and knowledge of local situations in how they interpret what they see in the data and the literature, wi-thout making subjective conclusions.
CommunityMembers of the community, local women and men, also have important knowledge to share. Citizen engagement is ensured by working with community leaders (both women and men) throughout the develop-
10
It is appropriate to report on one sex only if the condition or disease is sex-specific. For example, maternal mortality and morbidity affect women only, whereas prostate cancer affects men only. Gender-based analysis is still needed to show how gender roles influence the health condition.

11
Elementos para elaborar un Perfil de Género y Salud
ment of the profile. Community women and men can advise on the indicators that are important to their health, and that reflect local circumstances and influences on the health of the community. Involving commu-nity members in the design, development, and production of the profile contributes to their sense of ownership of the profile, and enriches the information compiled.
Government contacts and other expertsA gender and health profile is likely to cover a wide range of subject areas. Since staff may not have enough knowledge about all topics, a profile will be enriched if staff can contact external experts from time-to-time for as-sistance in interpreting data, or guidance in
finding other related literature. It is possible, for example, that a local public health nurse can explain, based on her work, changes in disease incidence, or why more women have recently received new treatments. Government employees are also excellent resources with information about policies and programs that affect health or service delivery.
In addition, it is valuable to have regular contact with the staff and agency that collect, compile and store the statistical data. They can help ensure that interpretations of the data used in the profile are correct, and provide information about data limitations and how the data are collected and reported.

12
This section describes the steps for develo-ping and presenting the information for in-dicators in a gender and health profile. The steps describe the organization for presen-
ting the profile indicators and explain key aspects of the process involved. An example, diabetes in Belize, is presented in the pages following the instructions for each step.
12
Presenting information in a gender & health profile
For every indicator (or set of related indicators) in a profile, present the following:
Step 1: IntroductionStep 2: Description of the data, including limitationsStep 3: Gender-based analysis and presentation of data Step 4: Gender-based analysis of literature and discussion (including the implica-
tions of other results and gender influences on the health issue) Step 5: Conclusions and lessons learnedStep 6: Policy implications and recommendations

14
The introduction defines the topic under consideration and explains why it has been included in the Gender and Health profile. It also sets the context and explains how this topic is important to population health and what will be done with the results.
Define concepts : It is useful to start with a definition of the topic or health concern. Use clear and plain language to ensure that a broad range of readers will have a basic understanding of the topic. If the description includes complex medical terms, it is helpful to provide back-ground information or explanations for tech-nical or biomedical terms in a sidebar or text box, with references for further reading.
Establish purpose : Explain why this topic is a health concern for women or for men. Consider what is known about differences between women and men in this topic area and what more may be learned from an analysis of the indicator(s). Raising such questions at the outset may help you to clarify a purpose for the analysis. Certain results from the analysis (later steps) might
be highlighted here to demonstrate to readers the importance of including gender and sex differences in the analysis.
Set a context : Other information may help to set a context for the importance of your findings for women and men, families, communities, the wider society and its systems (e.g. health and social services systems, the economy). By including community and social issues, as well as me-dical concerns, you will lay the groundwork for a broad analysis of health.
You may want to include:
> estimates of the size of the population affected or at risk,
> a ranking of the importance of the indicator in relation to other indicators,
> observations of any recent trends, > a global or national context to the issue, > implications for the quality of life of indivi-
duals or conditions in the community,> the importance of the indicator for econo-
mic and social development, and/or> implications for health care costs for indivi-
duals and for the society.
The following example gives an introduction to the topic and indicators for Diabetes me-llitus in Belize.
Questions to consider for the Introduction:
> What is the topic? > What indicator(s) will be used to describe the topic? > Why include this topic in the profile? > Why is it a health concern for women or men? > What do you hope to learn from the present analysis?> How is the topic important to the health of communities or the
population as a whole? > How can the findings be used to change health policies or services?
Step 1 | Introduction
Guidelines for Developing a Population-Based Gender and Health Profile | Step1 Introduction
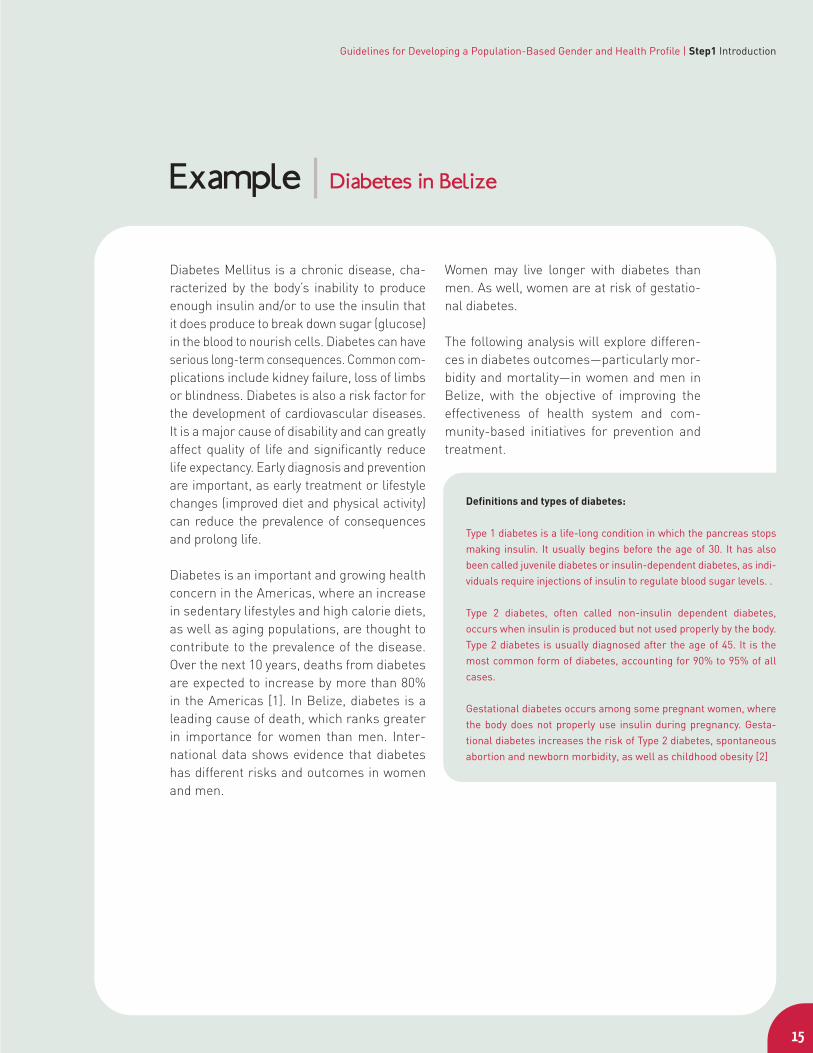
Diabetes Mellitus is a chronic disease, cha-racterized by the body’s inability to produce enough insulin and/or to use the insulin that it does produce to break down sugar (glucose) in the blood to nourish cells. Diabetes can have serious long-term consequences. Common com-plications include kidney failure, loss of limbs or blindness. Diabetes is also a risk factor for the development of cardiovascular diseases. It is a major cause of disability and can greatly affect quality of life and significantly reduce life expectancy. Early diagnosis and prevention are important, as early treatment or lifestyle changes (improved diet and physical activity) can reduce the prevalence of consequences and prolong life.
Diabetes is an important and growing health concern in the Americas, where an increase in sedentary lifestyles and high calorie diets, as well as aging populations, are thought to contribute to the prevalence of the disease. Over the next 10 years, deaths from diabetes are expected to increase by more than 80% in the Americas [1]. In Belize, diabetes is a leading cause of death, which ranks greater in importance for women than men. Inter-national data shows evidence that diabetes has different risks and outcomes in women and men.
Women may live longer with diabetes than men. As well, women are at risk of gestatio-nal diabetes.
The following analysis will explore differen-ces in diabetes outcomes—particularly mor-bidity and mortality—in women and men in Belize, with the objective of improving the effectiveness of health system and com-munity-based initiatives for prevention and treatment.
15
Example | Diabetes in Belize
Definitions and types of diabetes:
Type 1 diabetes is a life-long condition in which the pancreas stops making insulin. It usually begins before the age of 30. It has also been called juvenile diabetes or insulin-dependent diabetes, as indi-viduals require injections of insulin to regulate blood sugar levels. .
Type 2 diabetes, often called non-insulin dependent diabetes, occurs when insulin is produced but not used properly by the body. Type 2 diabetes is usually diagnosed after the age of 45. It is the most common form of diabetes, accounting for 90% to 95% of all cases.
Gestational diabetes occurs among some pregnant women, where the body does not properly use insulin during pregnancy. Gesta-tional diabetes increases the risk of Type 2 diabetes, spontaneous abortion and newborn morbidity, as well as childhood obesity [2]


17
Elementos para elaborar un Perfil de Género y Salud | Paso2 Descripción de los datos y sus limitaciones
The next step is to briefly describe the data used to measure an indicator of health.
Define the indicator(s) that will be used for the health topic and describe the data. In-clude information on the source of the data, the time period and population they repre-sent, the method of data collection used and, where available, the case definition or criteria that determined what information was included and what was excluded. Cite a reference to provide readers with more in-formation about the data source, including any notations from the data administrator. It may be important to note who is responsible for the calculation of any statistics that will be used in the data analysis (for example the staff of your own organization or the organi-zation which administers the data).
Information on the data’s origin and make up can suggest ways in which the data may be limited in responding to the purpose of the analysis (Step 1) and help to interpret how and to whom the findings will apply. Thus, it is useful to describe limitations of the data. Some important types of data limitations include:
Imprecision: Despite best efforts to achie-ve accuracy, data may not represent ideal or precise measures of the health indicator, as it has been defined. Health indicators are commonly expressed as prevalence or in-cidence rates (see Glossary). However, data often provide only an approximation of the true prevalence or incidence of illness for the population.
For example, hospital admissions data are of-ten relied upon for measuring the prevalence of illness in a population, yet these data only reflect cases of illness in individuals who have developed symptoms, sought care, received a diagnosis, and been admitted for treatment in hospital. Thus, many cases in the population go unmeasured. While hospital admissions data may provide a good estimate of the pre-valence of a serious and acute disease in the population, they may be an imprecise measure of the prevalence of a chronic, asymptomatic illness, which may require hospital care only during acute phases.
As a further example, disease incidence ra-tes are commonly calculated from data based upon laboratory test results for reportable in-fections. However, unless the entire popula-tion is routinely screened for infection, there is no means to calculate a true incidence rate, which requires that a population ‘at risk’ (ini-tially free of infection) can be identified. Thus, depending on screening practices or how rea-dily volunteers seek testing, the data may lack precision as a measure of incidence.
Incompleteness: Some segments of the population may be left out of the data. This may be due to chance (i.e. sampling error) or result from known or unknown biases in
Incidence rates measure the probability that healthy people will develop a disease during a certain period of time.
Prevalence rates measure the number of existing cases of disease in a population at one point in time.
Step 2 | Describing the data and its limitations
the way data are collected. For instance, te-lephone surveys exclude the homeless and households with no telephones; hospital data exclude those who do not seek care or lack access. If the health issue under study could be very different for those left out compared to the whole population, the findings may not apply to all. Explain to readers how much of the population the data relate to, who is left out, and whether the health concern for that group is known to be different from that of the population you wish to describe, or if the group is small enough that differences are not likely to affect the overall rate.
Inconsistency: Changes in definition, data co-llection, or variables reported can limit the ability to compare data over time. Standard and consistent methods over time and between jurisdictions simplify analysis and planning.
Each set of data will have benefits and limi-tations. Often we rely on the best available data, providing cautionary or qualifying sta-tements, where appropriate, to guide rea-ders in the interpretation of the results.
18
Sub-populations not included in health-related data may be of cri-tical interest to the profile.
For example, if hospitalization data from small rural hospitals are routinely excluded, but rates of illness are high in those regions, the results would underestimate a vital health concern for rural populations.

19
Elementos para elaborar un Perfil de Género y Salud | Paso2 Descripción de los datos y sus limitaciones
Example | Diabetes in Belize
This example is based on data generously provided by The Ministry of Health for Belize, which is committed to implementing stan-dards to develop and maintain consistent, reliable and accurate data. The example is not intended as a critique of this data, but as an illustration of what data limitations may relate to the purposes of a Gender and Health profile.
First, provide a description of the data:
This analysis is based on health admi-nistration data on hospitalization for diabetes, and on deaths related to dia-betes and population estimates derived from the vital records system, reported for 2001 through 2005. They are derived from an annual report on health data for Belize, produced by the Ministry of Health, which gives data on national aggregates, age, district and sex [3]. All computations were prepared by Prairie Women’s Health Centre of Excellence and the responsibility for the use and interpretation of these data is entirely that of the authors.
Provide a definition of the health indicator(s), perhaps in a sidebar or foot-note. Add any comments regarding data limitations.
Rates of diabetes that are based on data for only hospitalized cases are likely to un-derestimate the prevalence of diabetes in the population, as many diabetics show no outward symptoms of disease and Ame-rican research has estimated that 30% of diabetes may be undiagnosed [4]. As well, some segments of the population may have greater access to hospitals (women
versus men), which may be distinct from their risk of disease. Caution should be taken in using prevalence data to inter-pret trends in the risk of diabetes in the population, as the data cannot distinguish between new and repeated admissions to hospital for the same individual. These data do not distinguish between type 1, type 2 and gestational diabetes, which limits the specificity of this analysis.
Questions to consider for further data description:
> Among men and among women, what is the possible percentage of undiagnosed disease?
> Which sub-populations, who may have high rates of diabetes, are not included in these data?
> Are institutionalized populations or those who receive care in private hospitals co-vered by the diabetes data?
> Do the values include both Type I and Type II diabetes diagnoses? Do they also inclu-de cases of gestational diabetes? How might this affect your interpretation of findings regarding diabetes?
> As the hospitalization data provide counts of “cases” defined as a hospital admission, is any correction applied to remove repea-ted hospitalization within the year for the same individuals?
> Are diabetes related deaths identified ac-cording to a primary cause of death alone, or also as a contributing cause?
21
Elementos para elaborar un Perfil de Género y Salud | Paso3 Análisis de género y presentación de los datos
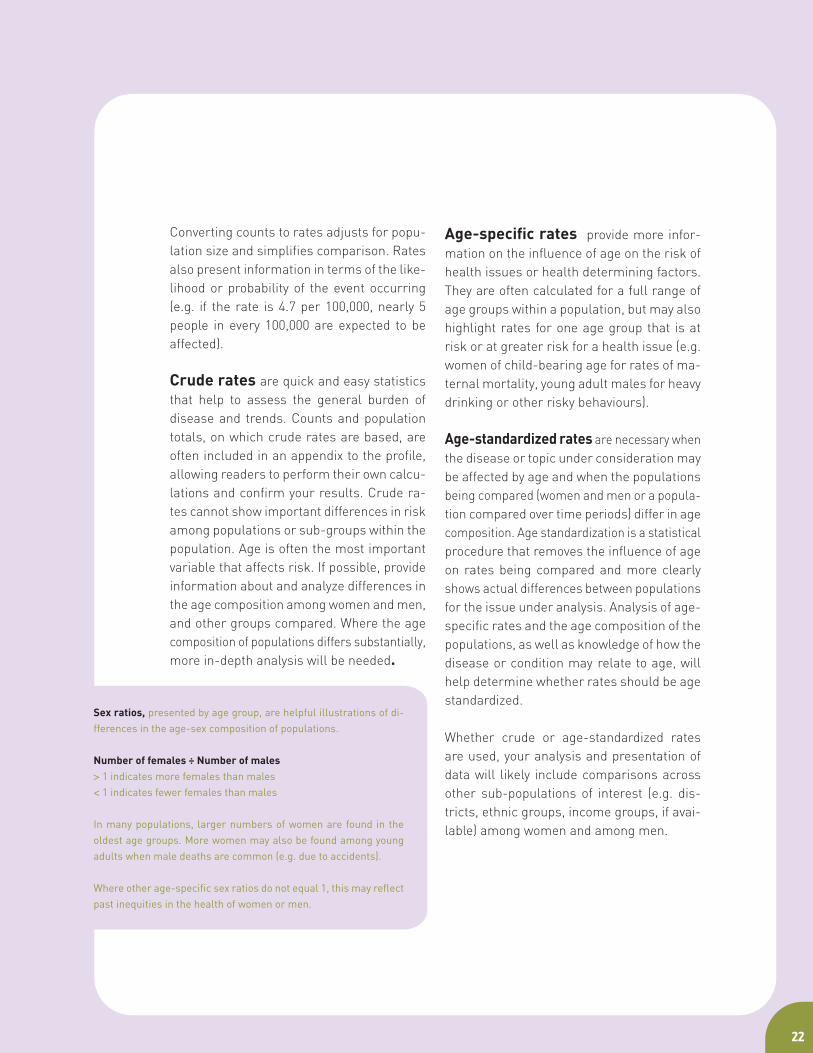
Several statistics are commonly used in a pre-sentation of numerical data, each serving a purpose in the analysis of a health issue. The presentation of the data should be a blend of charts and written explanations. Charts and graphs provide clear illustration of the informa-tion, but readers often require some explana-tion about what is being shown. Ideally, there
should be a mix of charts and other figures throughout the text and description.
It may be helpful to include each of these statistics (Table 1) in your presentation of an indicator. In a gender-based analysis it is important to present these statistics by sex whenever possible.
Counts: sometimes called frequencies, simply enumerate cases or events of interest for the population under analysis (e.g. num-ber of cases in women and in men). They are concrete and easy to relate to other variables in health care or community planning.
For example the number of hospital beds, medication or staff needed; 60% of cases may require 60% of available resources. However, it is not appropriate to compare counts of ca-ses between populations which differ in size.
Table 1: Statistics used in the presentation of data
Note (*): The age-standardization methods described represent the so called Direct Method of Standardization.
Step 3 | Gender-based analysis and presentation of data
Statistic Description Formula
Count (frequency) Number of cases or events, e.g. deaths, hospital admissions, diagnoses, house-holds with low income, individuals with high school diploma
= d
Crude rate Number of cases or events divided by the number of individuals in the total population
= d/n
Age-specific rates Number of cases for individuals in an age group divided by the population in that age group
ri = di/ni
where ‘r’ is the age-specific rate for one age group and ‘i’ represents any number of age groups
Age-standardized rate* The rate that would occur in the popula-tions being compared if they shared a stan-dard age composition (a standard popula-tion), to which their age-specific rates were applied. When male and female populations are compared, the standard population is often the total population (male + female).
= ∑ (ri * Ni) ∑ Niwhere ri is each age-specific rate in the population being compared; Ni is the population size for the corresponding age group in the standard popu-lation; ∑ signifies addition of values over all age groups
22
Converting counts to rates adjusts for popu-lation size and simplifies comparison. Rates also present information in terms of the like-lihood or probability of the event occurring (e.g. if the rate is 4.7 per 100,000, nearly 5 people in every 100,000 are expected to be affected).
Crude rates are quick and easy statistics that help to assess the general burden of disease and trends. Counts and population totals, on which crude rates are based, are often included in an appendix to the profile, allowing readers to perform their own calcu-lations and confirm your results. Crude ra-tes cannot show important differences in risk among populations or sub-groups within the population. Age is often the most important variable that affects risk. If possible, provide information about and analyze differences in the age composition among women and men, and other groups compared. Where the age composition of populations differs substantially, more in-depth analysis will be needed.
Age-specific rates provide more infor-mation on the influence of age on the risk of health issues or health determining factors. They are often calculated for a full range of age groups within a population, but may also highlight rates for one age group that is at risk or at greater risk for a health issue (e.g. women of child-bearing age for rates of ma-ternal mortality, young adult males for heavy drinking or other risky behaviours).
Age-standardized rates are necessary when the disease or topic under consideration may be affected by age and when the populations being compared (women and men or a popula-tion compared over time periods) differ in age composition. Age standardization is a statistical procedure that removes the influence of age on rates being compared and more clearly shows actual differences between populations for the issue under analysis. Analysis of age-specific rates and the age composition of the populations, as well as knowledge of how the disease or condition may relate to age, will help determine whether rates should be age standardized.
Whether crude or age-standardized rates are used, your analysis and presentation of data will likely include comparisons across other sub-populations of interest (e.g. dis-tricts, ethnic groups, income groups, if avai-lable) among women and among men.
22
Sex ratios, presented by age group, are helpful illustrations of di-fferences in the age-sex composition of populations.
Number of females ÷ Number of males > 1 indicates more females than males < 1 indicates fewer females than males
In many populations, larger numbers of women are found in the oldest age groups. More women may also be found among young adults when male deaths are common (e.g. due to accidents).
Where other age-specific sex ratios do not equal 1, this may reflect past inequities in the health of women or men.

23
Elementos para elaborar un Perfil de Género y Salud | Paso3 Análisis de género y presentación de los datos
Though there are many ways to present data, the following provides one example of a logical progression, from basic to more complex, of the suggested statistics and their analyses.
It may be helpful to begin with an analysis of the age-sex composition of the population. This information will be useful in deciding whether age-standardization should be per-formed or whether to qualify certain results. Although you could include the information in your presentation, it may not be necessary.
Population, age-sex compositionThe population of Belize in 2005 was approxi-mately 291,800, comprised of 147,400 men and 144,400 women. Thus, the overall sex ratio (females to males) was 0.98. Figure 1 provides sex ratios by age, which show slightly greater numbers of young women (20-34) than young men. This may reflect higher mortality for young men or short-falls in population counts, which can result from men’s greater mobility. There are also more middle-aged and older men than wo-men, though there are slightly more women among the oldest individuals.
Example | Gender-based analysis and presentation of data
Figure 1. Sex Ratios for Belize Population by Age, 2005
Note: Sex ratio equal to 1 signifies equal numbers of males and females; greater than 1signifies more females than males; less than 1 signifies fewer females than males.
2424
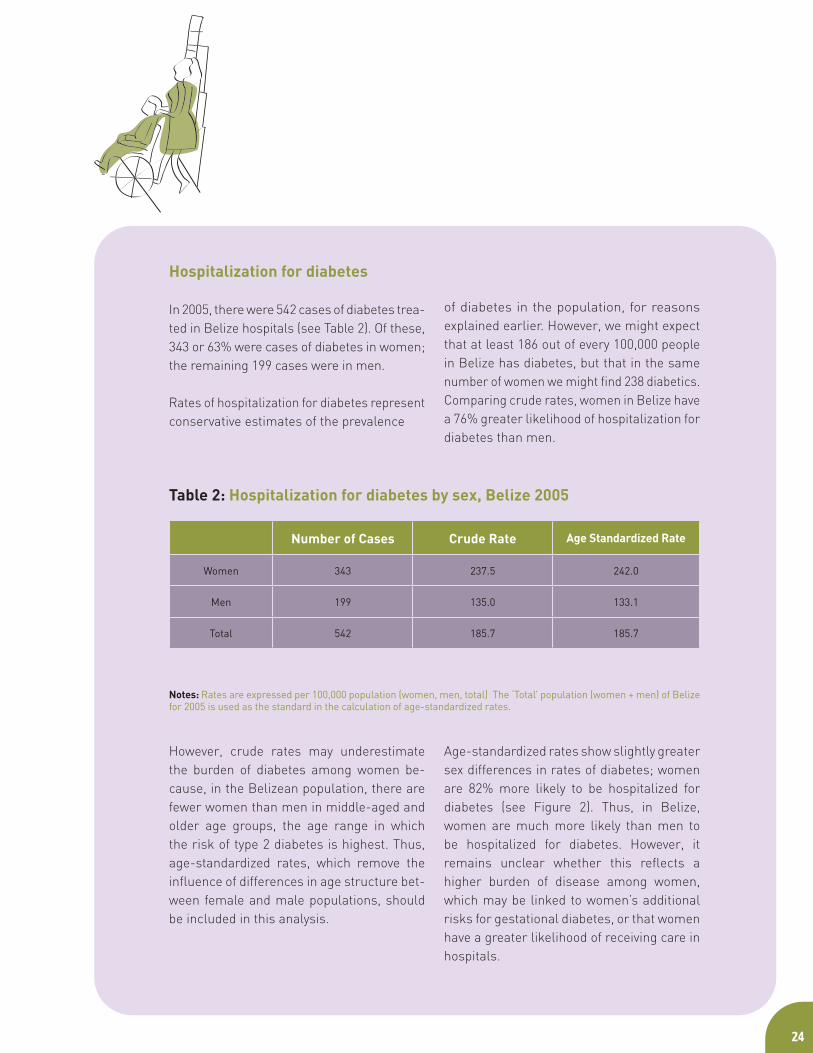
Hospitalization for diabetes
In 2005, there were 542 cases of diabetes trea-ted in Belize hospitals (see Table 2). Of these, 343 or 63% were cases of diabetes in women; the remaining 199 cases were in men.
Rates of hospitalization for diabetes represent conservative estimates of the prevalence
of diabetes in the population, for reasons explained earlier. However, we might expect that at least 186 out of every 100,000 people in Belize has diabetes, but that in the same number of women we might find 238 diabetics. Comparing crude rates, women in Belize have a 76% greater likelihood of hospitalization for diabetes than men.
However, crude rates may underestimate the burden of diabetes among women be-cause, in the Belizean population, there are fewer women than men in middle-aged and older age groups, the age range in which the risk of type 2 diabetes is highest. Thus, age-standardized rates, which remove the influence of differences in age structure bet-ween female and male populations, should be included in this analysis.
Age-standardized rates show slightly greater sex differences in rates of diabetes; women are 82% more likely to be hospitalized for diabetes (see Figure 2). Thus, in Belize, women are much more likely than men to be hospitalized for diabetes. However, it remains unclear whether this reflects a higher burden of disease among women, which may be linked to women’s additional risks for gestational diabetes, or that women have a greater likelihood of receiving care in hospitals.
Number of Cases Crude Rate Age Standardized Rate
Women 343 237.5 242.0
Men 199 135.0 133.1
Total 542 185.7 185.7
Table 2: Hospitalization for diabetes by sex, Belize 2005
Notes: Rates are expressed per 100,000 population (women, men, total) The ‘Total’ population (women + men) of Belize for 2005 is used as the standard in the calculation of age-standardized rates.
25
Elementos para elaborar un Perfil de Género y Salud | Paso3 Análisis de género y presentación de los datos
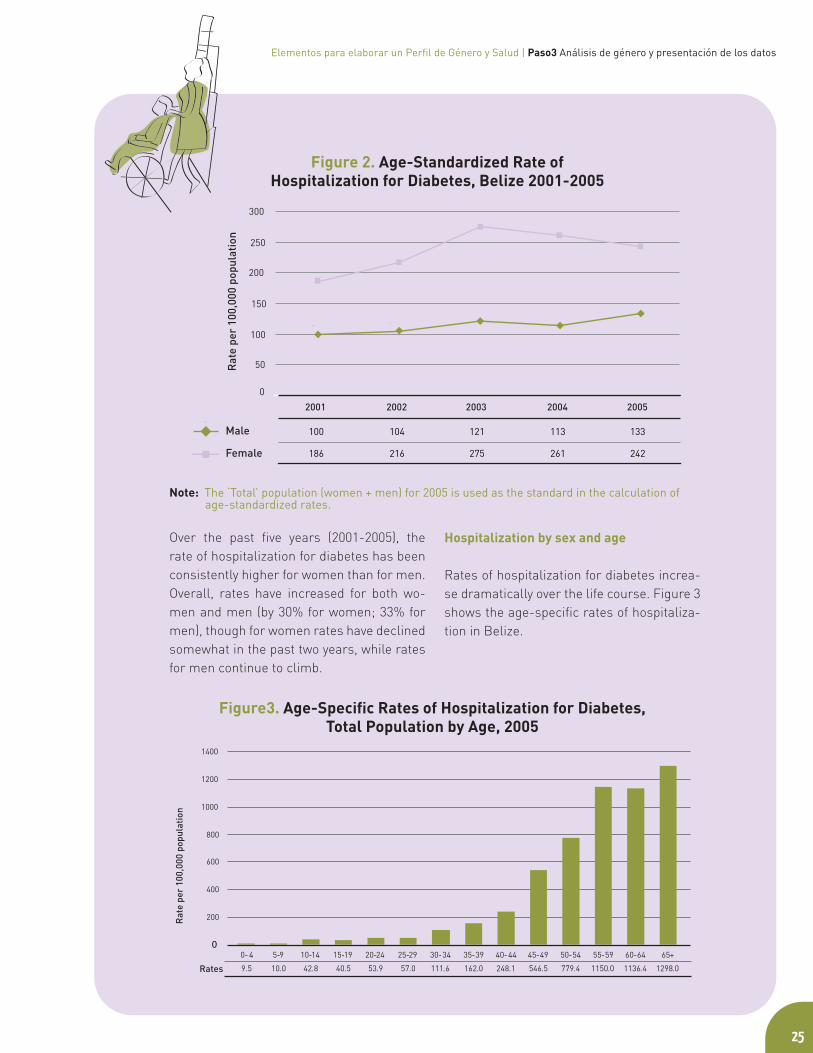
Over the past five years (2001-2005), the rate of hospitalization for diabetes has been consistently higher for women than for men. Overall, rates have increased for both wo-men and men (by 30% for women; 33% for men), though for women rates have declined somewhat in the past two years, while rates for men continue to climb.
Hospitalization by sex and age
Rates of hospitalization for diabetes increa-se dramatically over the life course. Figure 3 shows the age-specific rates of hospitaliza-tion in Belize.
Figure 2. Age-Standardized Rate of Hospitalization for Diabetes, Belize 2001-2005
Figure3. Age-Specific Rates of Hospitalization for Diabetes, Total Population by Age, 2005
Note: The ‘Total’ population (women + men) for 2005 is used as the standard in the calculation of age-standardized rates.
0
50
100
150
200
250
300
Male 100 104 121 113 133
Female 186 216 275 261 242
2001 2002 2003 2004 2005
Rat
e pe
r 10
0,00
0 po
pula
tion

2626
When we contrast this with sex-disaggregated data (see Figure 4), we find that rates of hos-pitalization for diabetes are higher for women than men in all age categories.
Women in the middle and upper age range have rates of hospitalization for diabetes that are, on average, twice that for men. Wo-men aged 45 to 49 and 60 to 64 appear to have particularly high risk relative to men of the same age (3.6 and 2.3 times higher, respectively). Women’s higher rates of hos-pitalization may also reflect their more fre-quent contact with the health system, par-ticularly for women who seek reproductive health care services. Also, higher rates of diabetes in the 45 to 49 age range for women compared to men may be a consequence of
their having had gestational diabetes during pregnancy, which increases the risk for de-veloping type 2 diabetes.
MortalityAlthough women are more likely to be hos-pitalized for diabetes, it is unclear to what extent this reflects higher risk of diabetes, poorer outcomes, or greater access to care in hospitals compared to men. Rates of dea-th related to diabetes may tell us more about whether women’s higher rates of hospitaliza-tion prevent them from dying from diabetes.
Figure4. Age-Sex Specific Rates of Hospitalization for Diabetes, 2005
27
Elementos para elaborar un Perfil de Género y Salud | Paso3 Análisis de género y presentación de los datos
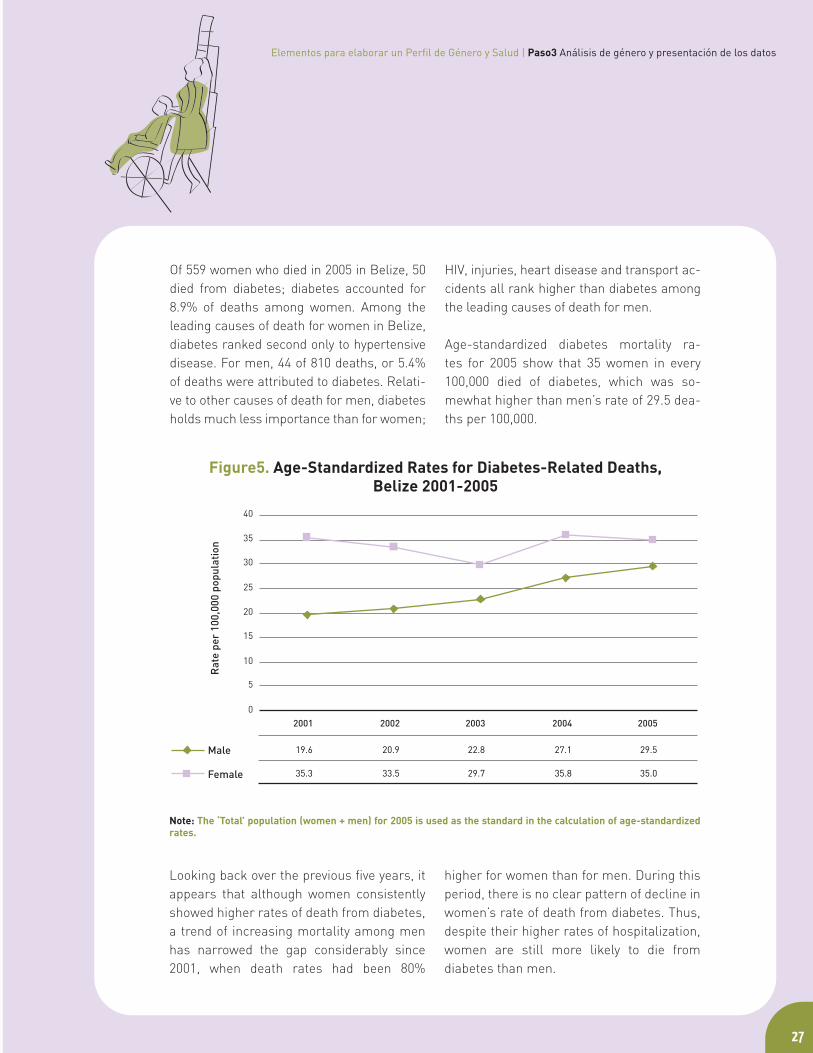
Of 559 women who died in 2005 in Belize, 50 died from diabetes; diabetes accounted for 8.9% of deaths among women. Among the leading causes of death for women in Belize, diabetes ranked second only to hypertensive disease. For men, 44 of 810 deaths, or 5.4% of deaths were attributed to diabetes. Relati-ve to other causes of death for men, diabetes holds much less importance than for women;
HIV, injuries, heart disease and transport ac-cidents all rank higher than diabetes among the leading causes of death for men.
Age-standardized diabetes mortality ra-tes for 2005 show that 35 women in every 100,000 died of diabetes, which was so-mewhat higher than men’s rate of 29.5 dea-ths per 100,000.
Looking back over the previous five years, it appears that although women consistently showed higher rates of death from diabetes, a trend of increasing mortality among men has narrowed the gap considerably since 2001, when death rates had been 80%
higher for women than for men. During this period, there is no clear pattern of decline in women’s rate of death from diabetes. Thus, despite their higher rates of hospitalization, women are still more likely to die from diabetes than men.
Figure5. Age-Standardized Rates for Diabetes-Related Deaths, Belize 2001-2005
Note: The ‘Total’ population (women + men) for 2005 is used as the standard in the calculation of age-standardized rates.
2828
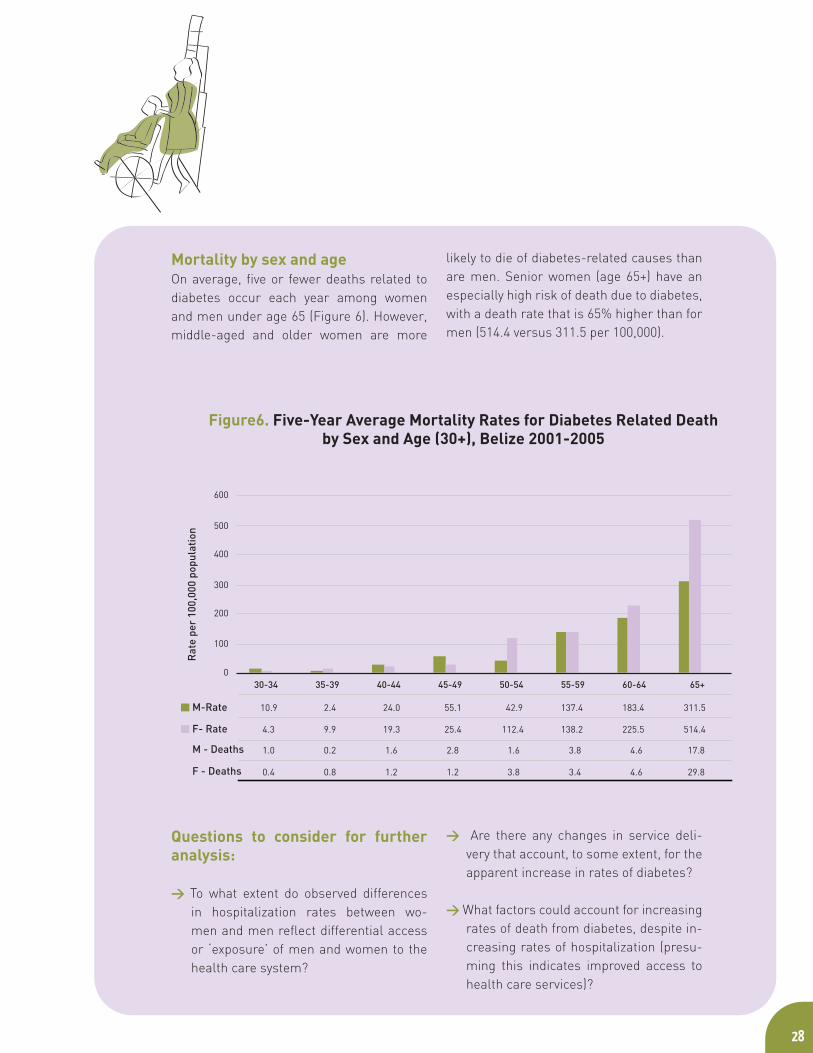
Mortality by sex and ageOn average, five or fewer deaths related to diabetes occur each year among women and men under age 65 (Figure 6). However, middle-aged and older women are more
likely to die of diabetes-related causes than are men. Senior women (age 65+) have an especially high risk of death due to diabetes, with a death rate that is 65% higher than for men (514.4 versus 311.5 per 100,000).
Questions to consider for further analysis:
> To what extent do observed differences in hospitalization rates between wo-men and men reflect differential access or ‘exposure’ of men and women to the health care system?
> Are there any changes in service deli-very that account, to some extent, for the apparent increase in rates of diabetes?
> What factors could account for increasing rates of death from diabetes, despite in-creasing rates of hospitalization (presu-ming this indicates improved access to health care services)?
Figure6. Five-Year Average Mortality Rates for Diabetes Related Death by Sex and Age (30+), Belize 2001-2005

29
Elementos para elaborar un Perfil de Género y Salud | Paso3 Análisis de género y presentación de los datos
> What factors may contribute to older women’s higher rates of death from dia-betes compared to men, and increasing rates of death among men?
Geographical diversity District-level comparisons by sex show that women are consistently more likely to be hos-pitalized for diabetes (Figure 7) and to die from diabetes-related causes (Figure 8) than men in all districts of Belize
Figure7. Five-Year Average Rates of Hospitalization by District,Belize 2001-2005
3030
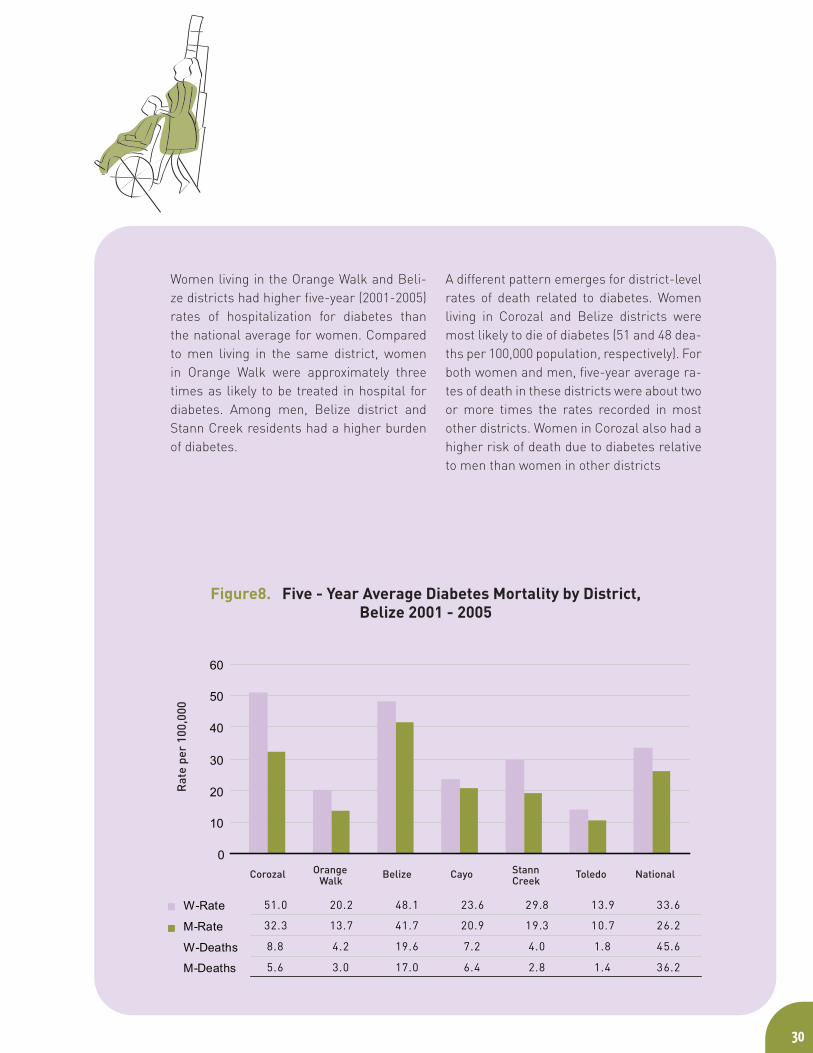
Women living in the Orange Walk and Beli-ze districts had higher five-year (2001-2005) rates of hospitalization for diabetes than the national average for women. Compared to men living in the same district, women in Orange Walk were approximately three times as likely to be treated in hospital for diabetes. Among men, Belize district and Stann Creek residents had a higher burden of diabetes.
A different pattern emerges for district-level rates of death related to diabetes. Women living in Corozal and Belize districts were most likely to die of diabetes (51 and 48 dea-ths per 100,000 population, respectively). For both women and men, five-year average ra-tes of death in these districts were about two or more times the rates recorded in most other districts. Women in Corozal also had a higher risk of death due to diabetes relative to men than women in other districts
Figure8. Five - Year Average Diabetes Mortality by District,Belize 2001 - 2005
31
Elementos para elaborar un Perfil de Género y Salud | Paso3 Análisis de género y presentación de los datos
> Can differences in diabetes treatment and mortality between districts be attributed to differences in lifestyle factors between districts, e.g. the availability of conve-nience foods with low nutrient value or patterns of work and recreation that en-courage physical activity?
> How do district and sex differences in le-vels of poverty and food security contri-bute to the observed differences in rates of diabetes hospitalization and death?
> Do districts differ for the size of any po-pulation with genetic vulnerability to dia-betes?
> To what extent are differences in rates of hospitalization for diabetes in the dis-tricts due to differences in the availability of treatment, or service type, e.g. is there more out-patient care than hospital ad-mission in some districts?
The district-level data raise many questions, which could be addressed in further analysis.
Questions to consider for further analysis:

33
Elementos para elaborar un Perfil de Género y Salud | Paso4 Análisis de la bibliografía y debate
The next step is to describe what else is known about the indicator using published literature, and other sources of information. The review of literature will gather information on:
> findings from other studies concerning the indicator, to allow inter-regional or international comparisons of rates for women and men, and
> knowledge concerning factors that con-tribute to women’s and men’s different experiences and outcomes for the in-dicator, including the biological, social (e.g. roles, power differences) and syste-mic (e.g. health service system) factors that interact with the indicator.
Also, the literature review may provide information that can inform other parts of the profile. For example, it may provide critiques of the data available (Step 2) or recommend strategies and policies (Step 6) that have been effective in other jurisdictions.
Succinctly describe the current research on the indicator and topic and discuss
its implications for the population under consideration. Note where there is a lack of literature based on sex-disaggregated data or on gender distinct influences on the health topic. Consider how community groups and local experts can inform your analysis of women’s and men’s experiences of the health issue. Every additional piece of information should be assessed to see if it is relevant to the discussion and contributes to real understanding of the issue. Be sure to fully cite all literature and reports used.
Inter-regional and international comparisonsCompare the results of your data analysis with those from other jurisdictions, making allowances for any difference in definitions, data collection methods, and data quality issues. Do other studies confirm your findings, or suggest other or new information?
Factors contributing to gender and sex differences in the indicator Factors influencing women’s and men’s experiences and outcomes for the indicator will be unique to each health issue. However, the following areas and questions may guide an exploration of the literature and the presentation of discussion content.
> Risk: Consider risk factors for the health issue, viewing risk in relation to both biological factors and social determinants of health. How do women and men in the population differ in their exposure to these risks? How do gender relations within the household, community, workplace and the
Does the literature support the results of your data analysis or suggest other or new information?
What does the literature say about factors contributing to women’s and men’s distinct experiences and outcomes for this health topic and indicator?
Does the literature adequately address the influence of gender?
Can local women’s or men’s experiences provide more information?
Step 4 | Gender-based analysis of the literature and discussion

economy affect risks for women and for men? How do differences in access to power and resources affect risk? How do gender roles, including women’s unpaid work and care giving roles, affect risk?
> Symptoms and illness experience: Illness experience varies according to bio-
logical, social, or psychological differences and has implications for women and men’s self-perceived health, ability to carry out their roles, and their likelihood to seek help or health care. Consider how women and men differ in their experience of the health issue. Do symptoms differ in type or severity; does illness progress differently? Also consider how women’s and men’s ex-periences of illness are perceived by health care practitioners. Are the experiences of women and men considered equally valid? Could gender biases in the recognition of women’s and men’s symptoms influence diagnosis?
> Intervention and treatment : Health care interventions vary not only in response to sex differences in health between women and men, but also in response to gendered interactions between clients and professio-nals. Consider whether health professionals respond differently to men and women’s illness. Are women and men equally likely to be targeted for prevention, receive treatment or rehabilitation supports? Are women or men over-prescribed medications or less likely to receive referral for surgery? Are interventions gender-sensitive and appro-priate, given the evidence of differences in the experiences of women and men?
> Service or resource utilization: Similarly, gender influences the behaviour
of health consumers. Women and men
differ in the likelihood that they seek health care or other services, when they seek services, and the types of interventions they will use. Consider whether men and women use health services to the same degree or at same stage of illness. In light of women and men’s different roles, their needs may differ for supports and services. How do women’s and men’s health needs differ by age and stage of life? Do differences in how men and women use health services affect their health status for this issue?
> Outcomes: While the data description will have demonstrated certain differences in women’s and men’s outcomes, often these results only describe outcomes of clinical disease and death. The literature may be used to broaden the understan-ding of other types of health outcomes and their differences in men and women. For example, information on quality of life, prevalence of complications, disability and functionality issues, add greater depth to the analysis. These aspects may be more sensitive to gender differences than the ‘end states’ of disease and death.
> Diversity:The diversity among women and among men should be addressed in the analysis. What does the literature say con-cerning variation in the indicator among women and among men? Are some popu-lations more vulnerable? What is the effect of ethnicity on women’s and men’s access to power, resources and health care? Are there differences for urban, suburban, ru-ral, or remote populations? How does the health indicator vary by income and class among women and men?
34

35
Elementos para elaborar un Perfil de Género y Salud | Paso4 Análisis de la bibliografía y debate
The analysis and discussion may begin with comparative data analyses. How do data from other nations help to highlight the importance of diabetes among women and men in the region and in Belize? Are rates for women in Belize comparable with those for other Latin American, Caribbean, or North American coun-tries? Are there similar differences between women and men in other regions?
Table 3 shows estimated sex-specific death rates for diabetes-related causes from 14 selected nations among 42 American countries for which rates were available. Published rates for Belize (35.5 per 100,000 for women, 21.3 per 100,000 for men) were
comparable to the results of the analysis found in this example (average rates of 33.6 and 24.1 per 100,000 for women and men, respectively). Comparison across 42 American nations showed that death rates for women in Belize were more likely to be greater than the rates for women in other nations than were men’s rates of death. Also, sex-differences in diabetes deaths tended to be relatively high in Belize. Only five countries reported higher sex ratios (Female/Male) for diabetes mortality than Belize, where women were 1.7 times as likely as men to die from diabetes-related causes [5].
Example | Diabetes in Belize
Females Males Ratio F:MCayman Islands 10.2 16.0 0.6
Canada 24.9 25.5 1.0
United States 25.1 24.2 1.0
Guatamala 75.6 69.3 1.1
Mexico 75.6 69.3 1.1
Costa Rica 20.4 15.7 1.3
Ecuador 28.0 20.8 1.3
Montserrat 152.5 113.5 1.3
Nicaragua 39.5 28.8 1.4
Panama 38.5 25.5 1.5
Belize 35.5 21.3 1.7
Cuba 24.9 12.4 2.0
El Salvador 35.1 17.0 2,1
Anguila 93.7 15.1 6.2
Source: Adapted from, Gender, Health and Development in the Americas, Basic Indicators 2007, PAHO.Notes: 1. Rates per 100,000 population. 2. Latest data available
Table 3. Estimated death rate1 from diabetes.Selected nations in the Americas. 2001-20052

36
The burden of diabetes is increasing internationally, which confirms short-term trends found in this data analysis. It is predicted that the number of people with diabetes worldwide will more than double over 25 years, to reach a total of 366 million by 2030. Most of this increase will occur as a result of a 150% rise in developing countries. The estimate takes population growth, aging and urbanization trends in developing nations into account [6]. The most dramatic increases in diabetes (type 2) are occurring in regions where there have been major changes in the type of diet consumed, reduced physical activity, and increases in overweight and obesity [7].
Type 2 diabetes accounts for more pre-mature death in developing countries than in many developed nations, where it has generally been considered a disease of the middle-aged and elderly [6]. Not only is type 2 diabetes more common in all age groups than in the past, it is being identified in increasingly younger age groups, including adolescents and children, especially in high-risk popu-lations [7]. Without data disaggregated by type of diabetes, it is not possible to confirm if this is true for Belize.
Hospitalization rates from Belize have shown a relatively large burden of disease among women in the 45 to 65 age range. This differs from the pattern in many nations where women and men generally have similar rates of diabetes until old age (over 65 years), when more women have diabetes [6].
Proceed with a discussion of the published literature, government and NGO reports, or other information, as it applies to your study population. Use the guiding categories and questions to broaden the discussion of gender and diversity, as these experiences apply to diabetes.
Risk
Women and men have different types and levels of risk for diabetes. Gestational diabetes is one distinct risk factor for women. Although insulin function usually returns to normal after pregnancy, gestational diabetes increases women’s risk for developing type 2 diabetes later in life. Also, their babies are often heavy at birth, tend to develop obesity in childhood, and have a higher risk of developing type 2 diabetes at an early age [7].
> How important is gestational diabetes as a risk factor for diabetes among women and children in the region?
Recent decades have seen a shift from manual labour to more sedentary jobs in the service sector, dietary changes and in-creased urbanization, which increases the use of motorized transportation, computer use and labour saving devices. Women tend to be less physically active than men. Care giving roles and a lack of leisure time are often a barrier to physically active re-creation, but, conversely, women may be active because they care for young children and they are also less likely to use a car for transportation. Men tend to be more physi-cally active in general, and are more likely to have jobs that keep them active [4].
37
Elementos para elaborar un Perfil de Género y Salud | Paso4 Análisis de la bibliografía y debate
> How do women’s and men’s activity levels differ in the region, and how might these differences affect the risk of diabetes?
> Has an urban shift in lifestyle affected women and men differently?
Overweight is a risk factor for diabetes, and is increasing worldwide. Surveys in Latin America and the Caribbean in 2002 found that 50-60% of adults and 7-12% of children over age five were overweight or obese [1]. Women and men differ in their risks for weight gain and patterns of weight gain over their lifetime. Women’s weight changes more over the life course; women are vulnerable to weight gain at puberty, childbirth and after menopause. Cultural ideals for thin or muscular body types influence women’s and men’s self image and self-esteem. Women tend to engage in chronic dieting more often, resulting in unhealthy weight fluctuations [4].
> How might sex-differences in body weight affect the observed differences in rates of diabetes among women and men in Beli-ze, and in the region?
Certain ethnic groups carry a genetic predisposition for diabetes. For example, higher rates of type 2 diabetes are reported in people of Asian and African origin, and in indigenous peoples of the Americas and Australasia [6].
> Are there sub-populations in Belize with a known genetic predisposition to diabetes?
Intervention/treatment Many women cannot get the care they need or seek because of their domestic responsibilities for children, restrictions in their ability to take time from paid work and the extra burdens of other unpaid work. The availability of specialists may affect the rate of diabetes complications seen.
> What is the availability of specialists like in different districts within the country?
> Do women and men differ in their ability to get care from specialists?
> Are there differences in the health care in-surance coverage available to women and men, which may be a barrier to care?
OutcomesAge-adjusted mortality rates are 1.5 to 2.5 times higher among diabetics than in the general population. However, the contributing cause of death has been found to differ by ethnicity. In Caucasian populations, mortality is often due to heart disease, whereas kidney disease is a major contributor to diabetic-related death of American Indian and Asian populations, and in some African nations, infections are an important cause of death [7].
> Considering the ethnic diversity in Belize, how can these findings inform screening for complications?
Some research has found that diabetic women
38
are significantly more likely to have coronary events than are diabetic men and non-diabetic women. Also, women with diabetes may be more vulnerable to depression than men, which may affect coping and the ability to self-manage care [4].
> What complications, if any, appear more
common among men and among women in Belize or in the region?
> Are their differences in how the disease progresses in women and men?
> Is diabetes-related disability equally likely to affect women and men?
Diversity
> What is known about poverty of women and men in the region and in Belize?
> What do local agencies say about poverty’s influence on the experience of diabetes?
These are the kinds of questions (above) thatshould influence how the results are interpre-ted and presented using, as suggested here, lo-cal information and knowledge to broaden the information given.
38

The conclusion is a synthesis of findings for each topic area and its indicators. Describe the combined findings of the quantitative data analysis and the literature analysis to clearly represent the evidence for health inequities and challenges for women, men or sub-groups among them.
Here it may be useful to turn back to an initial purpose, baseline data from previous years or assumptions made at the outset of your analysis. What new information do you now have concerning the topic? What lessons have been learned, what gaps identified? Measu-rement of health indicators is useful only to the extent that, based on the new knowledge, it is possible to intervene and effect change. Ongoing surveillance of those indicators can then be used to evaluate progress made by the intervention.
The strength of a profile lies in its ability to provide a comprehensive ‘story’ of women’s and men’s health, which requires a broad synthesis of many issues and topic areas. Thus, it is beneficial to relate each topic area and its respective indicators to other topic areas, where opportunities are evident in your analysis. If for instance, trends in respiratory diseases are related to changes in tobacco smoking in the population, make sure that the disease indicator is referred to in the tobacco indicator, and also that the tobacco indicator mentions the changes in respiratory
disease. If poor housing and sanitation are in the same districts where the profile shows disease outbreaks, help the reader to make those links by mentioning where else in the profile to find related information.
It may also be useful to draw conclusions based on larger groupings of topics. For example, your framework of topics may have included several chronic diseases or a group of topics on socioeconomic determinants of health. Conclusions based on related topics may illustrate larger trends or promote more coordinated and comprehensive planning. Thus, it may be important to note where the analyses have shown increases in several chronic diseases, which share common risk factors, or the co-occurrence of chronic di-seases in a sub-population, in which case a coordinated chronic disease prevention strategy may be called for.
40
Measurement of health indicators is useful only to the extent that, based on the new knowledge, it is possible to intervene and effect change.
The strength of a profile lies in its ability to provide a comprehensive ‘story’ of women’s and men’s health.
Conclusions based on related topics may illustrate larger trends or promote more coordinated and comprehensive planning.
Step 5 | Conclusions and lessons learned
Diabetes is a major health concern in Belize, and is associated with increasing demands on the health care system, as well as long-term health impacts and social, financial and personal costs to diabetics and their families. Although type 2 diabetes accounts for the majority of cases, and is commonly regarded as a disease of older people in many nations, in Belize substantial numbers of middle-aged individuals are affected in their productive years of life.
Similar to findings from other nations, data on diabetes in Belize demonstrate important differences in the burden of disease and outcomes between women and men. In fact, Belizean women have higher rates of diabetes relative to men than in most other American nations. Women are much more likely than men to be hospitalized for diabetes. Women account for nearly two-thirds of cases seen in hospitals in Belize and their rate of hospitalization exceeds that for men by over 80%. Among middle-aged (age 45-49) and older women (especially aged 60-64), rates of hospitalization for diabetes may be twice that of men or more. Gestational diabetes may be an important contributing factor in women’s greater prevalence of diabetes in these age ranges. Diabetes is associated with increasing demands for health care. Between 2001 and 2005, rates of hospitalization rose by approximately 30% for women and men.
Although women’s higher rates of hospitalization relative to men may reflect
their greater contact with the health system (i.e. in association with reproductive health concerns and women’s greater care giving role within the family), the mortality data show that women do require more diabetes–related health care. Women, particularly older women, are more likely to die from diabetes-related causes than are men. However, this gap appears to be closing as men’s rates of death have been increasing faster than for women in recent years, which may signal unmet needs for health care among diabetic men.
Comparisons by district show that women in Orange Walk and Belize districts are more likely to be hospitalized for diabetes than women living in other districts. Among men, Belize and Stann Creek districts show a higher than average burden of diabetes. However, for both women and men, diabetes-related deaths are most common in the Belize and Corozal districts. Higher deaths rates in these districts may be because clients with advanced diabetes move to those districts where there are more specialists and tertiary care available in the urban centres. However, diabetes may also be more severe in the more urbanized districts, which is supported in the literature.
Further analyses of diversity await the availability of data disaggregated by sex and socioeconomic status and ethnicity, which have been associated with variation in rates of diabetes in other populations.
41
Guidelines for Developing a Population-Based Gender and Health Profile | Step5 Conclusions and lessons learned
Example | Diabetes in Belize

42
SynthesisSeveral other topics that may appear el-sewhere in the profile, are naturally related to diabetes. You will want to highlight im-portant findings for women and men from those analyses as they relate to diabetes. For example, what relevant results might be highlighted from indicators on obesity, physical activity levels, nutrition, or smoking among women and men? Other linkages to indicators of socioeconomic conditions or literacy may also be relevant.
Do the results for cardiovascular disease, cancer or other chronic and degenerative conditions, covered in other parts of the profile, illustrate larger trends that also concern diabetes? You may wish to consider these results together in an integrated conclusion on all chronic diseases, or those which share common risk factors.
Many women in Latin America and the Caribbean still have lower levels of literacy than men. Literacy tends to be lower in rural than urban areas, and in poorer than richer areas [1].
These findings may have implications for diabetes education programs

44
The final step for each indicator is a discussion about the policy implications for the indicator. Explain how the gender-based analysis can be used to inform, develop, change or implement policy. This might include changes to health services or infrastructure.
Begin with a brief description of current policies as they relate to the indicator. Use the following questions as a guide:
> What are the current policies relating to this indicator?
> Do they prevent or allow men and women to seek care or to take advantage of resources equally?
> Are there policies outside of the health sector that should be changed to reduce health inequalities?
> What have community groups and individuals said about the related policy?
> Do the data and information show that the policy is working to help the population and improve health?
Use the information now assembled in the profile to make specific recommendations for policy that should or could be strengthened or changed. Identify the relevant decision-making authority to which the recommendations will be made.
Here are some areas where there may be recommendations:
Indicator data
> Are the data collected providing information that is needed to understand the health issue as it affects women and men? For instance, should financial or income data be collected for each person or for each household?
> Are the data reported to the same level of detail as they are collected?
> Should the data collected for the indicator be broader? For example, would hospital readmissions provide more information about morbidity rates for the disease or condition?
> Should the data be collected and reported for a different time span, or for different age categories? Are there sub-populations routinely missed in the data that should be included?
> Is there an adequate infrastructure for surveillance for the indicator?
Health promotion
> What does the gender-based analysis show about where health promotion efforts and initiatives should be directed? Is one sex, age or ethnic group particularly vulnerable?
Step 6 | Policy implications and recommendations
How can health promotion and public educa-tion be directed to reduce health inequities for that part of the population? For instance, perhaps public education posters are not in a local language or are too complicated to read and understand.
> How effective are screening programs? Are they reaching the most vulnerable members of the population? Should there be different screening programs for rural or urban wo-men and men? How can men be reached? Would it be helpful to screen women if they are coming for care for their children? How will women without children be reached? How can elderly women and men be rea-ched in rural and urban areas?
> How can local women and men be con-sulted? Are policies in other sectors sup-porting health promotion? What about food security policies, or local transpor-tation, school fees or taxation policies,
for example? How is income assured for the most poor? Is violence against wo-men and girls tolerated or ignored?
Infrastructure in health and other sectors
> Do the data and other information show that there are enough doctors, nurses, or other health care workers available? Do these health care workers need training to understand gender-specific or gender-sensitive treatments and care?
> Are there coordinated interventions across sectors?
> What are the barriers to reducing health inequities? What initiatives have been successful?
These are just some examples of possible areas for policy change that can improve health and reduce inequities.
45
Guidelines for Developing a Population-Based Gender and Health Profile | Step6 Policy implications and recommendations
46
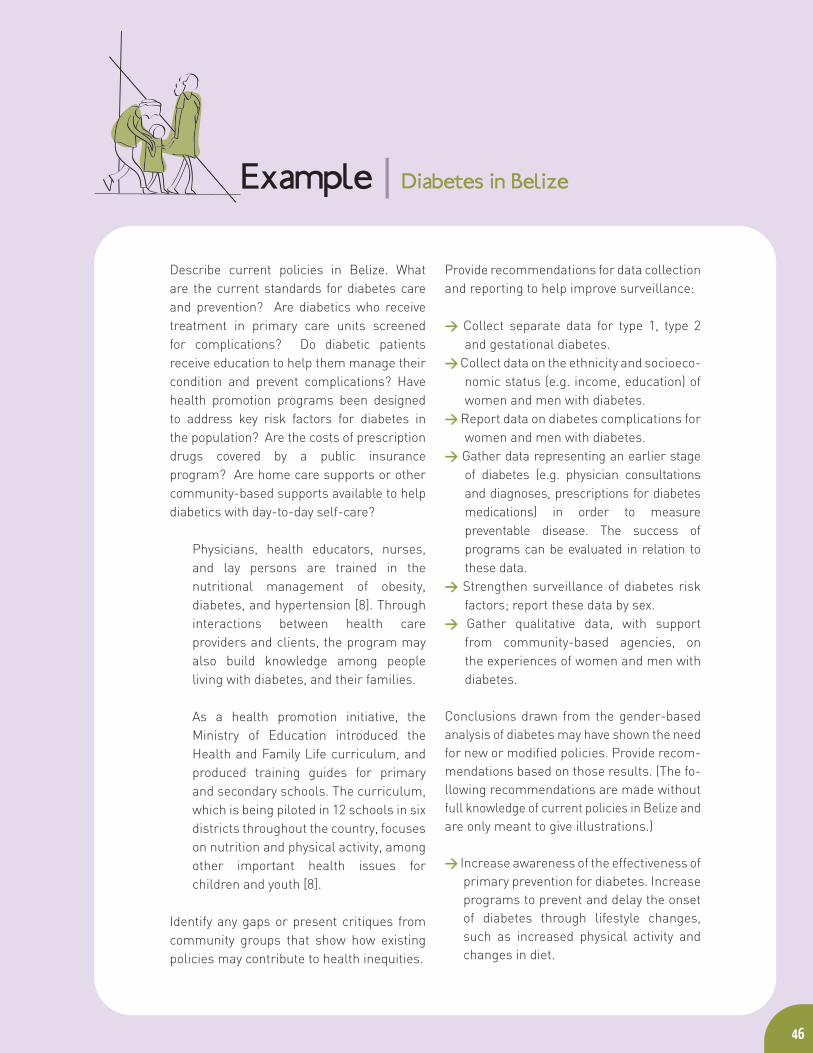
Describe current policies in Belize. What are the current standards for diabetes care and prevention? Are diabetics who receive treatment in primary care units screened for complications? Do diabetic patients receive education to help them manage their condition and prevent complications? Have health promotion programs been designed to address key risk factors for diabetes in the population? Are the costs of prescription drugs covered by a public insurance program? Are home care supports or other community-based supports available to help diabetics with day-to-day self-care?
Physicians, health educators, nurses, and lay persons are trained in the nutritional management of obesity, diabetes, and hypertension [8]. Through interactions between health care providers and clients, the program may also build knowledge among people living with diabetes, and their families.
As a health promotion initiative, the Ministry of Education introduced the Health and Family Life curriculum, and produced training guides for primary and secondary schools. The curriculum, which is being piloted in 12 schools in six districts throughout the country, focuses on nutrition and physical activity, among other important health issues for children and youth [8].
Identify any gaps or present critiques from community groups that show how existing policies may contribute to health inequities.
Provide recommendations for data collection and reporting to help improve surveillance:
> Collect separate data for type 1, type 2 and gestational diabetes.
> Collect data on the ethnicity and socioeco-nomic status (e.g. income, education) of women and men with diabetes.
> Report data on diabetes complications for women and men with diabetes.
> Gather data representing an earlier stage of diabetes (e.g. physician consultations and diagnoses, prescriptions for diabetes medications) in order to measure preventable disease. The success of programs can be evaluated in relation to these data.
> Strengthen surveillance of diabetes risk factors; report these data by sex.
> Gather qualitative data, with support from community-based agencies, on the experiences of women and men with diabetes.
Conclusions drawn from the gender-based analysis of diabetes may have shown the need for new or modified policies. Provide recom-mendations based on those results. (The fo-llowing recommendations are made without full knowledge of current policies in Belize and are only meant to give illustrations.)
> Increase awareness of the effectiveness of primary prevention for diabetes. Increase programs to prevent and delay the onset of diabetes through lifestyle changes, such as increased physical activity and changes in diet.
Example | Diabetes in Belize

> Plan a coordinated response involving several sectors and addressing non-health factors that contribute to risks of diabetes (e.g. transport and urban design).
> Increase awareness of diabetes among women, to better prevent or delay its onset, as well as practices for effective management and prevention of complications.
> Design health promotion programs and health services that are gender appropriate, culturally appropriate, community-based and respectful of age and socioeconomic conditions.
> Consult with community agencies regar-ding the needs and experiences of women and men with diabetes. Because most diabetes care relies on informed self-management, it is important to empower individuals and tailor diabetes education to their needs.
> Explore opportunities to screen for gestational diabetes and provide diabetes prevention information during pre-natal visits.
> Find innovative solutions to address men’s lower utilization of the health care system. For example, target men for diabetes education in the workplace.
> Address any inequities by district in access to specialists; improve capacity for out-patient care in rural districts.
To improve policy, it is also important to consider any network opportunities that exist among other countries, to share information and coordinate planning and implementation. Also consider what partnerships with non-governmental organizations or agencies in other sectors could be established to improve diabetes prevention and control. Search for best practice models in areas where you identify special needs within your population (e.g. gender-sensitive and plain language diabetes education).
The World Health Organization (WHO) and the International Diabetes Federation (IDF) cooperate in the delivery of the Diabetes Action Now program, aimed at reducing the impact of diabetes worldwide. The program focuses on low and middle-income communities, particularly in developing countries. Its purpose is to stimulate and support the adoption of effective measures for the surveillance, prevention and control of diabetes. [6]
47
“The scale of the problem requires population-wide measures to reduce levels of overweight and obesity, and physical inactivity. In-formed policy decisions on transport, urban design, and on food pricing and advertising can play an important part in reducing the population-wide risks of developing type 2 diabetes.” [6]
“Only through partnerships, involving governments, civil society and private sector, can the necessary changes be made that will reverse current trends towards overweight and obesity and the range of chronic diseases associated with them.” [6]
Guidelines for Developing a Population-Based Gender and Health Profile | Step6 Policy implications and recommendations

48
> Ensure you give enough information so that readers who do not have medical or statistical background can use the infor-mation, as the profile will be more useful for a broad range of stakeholders.
> Define social concepts and abstractions. For example what is meant by the term ‘youth’ or ‘elderly? Who is included in the-se categories? How is ‘low income’ defi-ned? These and other general terms re-quire clarity.
> Ensure that you provide enough information on what the numerator and denominator are in the calculation of any rate. Does the rate refer to an entire population, or a na-rrower range of those at risk or exposed to the condition, e.g. women of childbearing age, adults, youth in some age range?
> Present the profile and the indicators in clear non-academic language so that the profile can be used by a wide range of agencies, including community organizations.
> Charts should be clearly labeled. While multi-coloured charts are attractive, the charts must be legible and distinguisha-ble in black and white when they are re-produced by photocopy or from computer printers.
References1. Pan-American Health Organization. Health
in the Americas, 2007; Volume I–Regional. Washington, DC: Pan-American Health Or-ganization, 2007.
2. It’s Your Health: Type 2 Diabetes. [Inter-net]. Ottawa: Health Canada.; c2006 [cited 2008 May 19]. Available from : http://www.hc-sc.gc.ca/iyh-vsv/diseases-maladies/diabete_e.html
3. Ministry of Health, Belize. May 2006. Health Statistics of Belize, 2001-2005. The Epide-miology Unit, Ministry of Health.
4. Donner, L. H. Isfeld, M. Haworth-Brockman and C. Forsey. Manitoba Women’s Health profile. Winnipeg, MB: Prairie Women’s Health Centre of Excellence, 2008. (forthcoming).
5. Pan-American Health Organization. Gender, Health and Development in the Americas: Basic Health Indicators 2007. Washington, DC: PAHO, Gender, Ethnicity and Health Unit, 2007.
6. World Health Organization and International Diabetes Federation. 2004. Diabetes Action Now. [Internet] Geneva, Switzerland: WHO. [cited 2008 May 25]. Available from http://www.who.int/diabetes/actionnow/en/DANbooklet.pdf
7. World Health Organization and Food and Agriculture Organization of the United Nations. 2003. Diet, Nutrition and the Prevention of Chronic Diseases. WHO Technical Report Series 916. [Internet]. Geneva, Switzerland: WHO. [cited 2008 May 25]. Available from: http://whqlibdoc.who.int/trs/WHO_TRS_916.pdf
8. Pan-American Health Organization. Health in the Americas, 2007; Volume II-Countries, Belize. Washington, DC: Pan-American Health Organization, 2007.
General considerations for presenting a profile
49
Guidelines for Developing a Population-Based Gender and Health Profile
Here are three examples of Frameworks used in gender and health profiles::
Appendix A |
Manitoba women’s health profilewww.pwhce.ca/Profile
> Socio-economic Factors> Violence against Women> Reproductive and Sexual Health > Physical and Mental Health> Health Care Use> Mortality
Women of South-East Asia: a health profilewww.searo.who.int
Women’s Health Status > Mortality and Morbidity> Disease Burden> Reproductive Health> Nutrition> Health Problems in Work & Environment>Violence against women
Determinants and Responses > Factors determining health> National initiatives
Women’s Health and Development-related Indicators
> Regional Tables> Country descriptions.
Pan American Health Organization
Socio-economic determinants of health > Demography> Socio-economic factors (income, employment, education, environment, laws and regulations)
Health Status > Mortality> Morbidity> Risk factors> Sexual and reproductive health> Gender based violence
Access and utilization of health services > Coverage> Utilization in health promotion and prevention > Health expenditures
Health management > Formal and informal health care> Making decision
Profile frameworks examples

50
Age-specific rate: The number of cases or events of interest for individuals in an age group, divided by the population in that age group.
Age-standardized rate (Direct Method): The rate that would occur in the populations being compared if they shared a standard age composition (a standard population), to which their age-specific rates were applied. When male and female populations are compared, the standard population is often the total population (male + female).
Counts/frequencies: The number of cases or events for the variable of interest, e.g. deaths, hospital admissions, diagnoses, households with low income, individuals with high school diploma.
Crude rate: The number of cases or events for the variable of interest, divided by the number of individuals in the total population.
Incidence rates : measure the probability that healthy people will develop a disease during a certain period of time. Incidence is useful in studying causes of illness and assessing the success of prevention programs.
Number of new cases
------------------ Population (at risk)
Note: For purposes of calculating incidence, a population is considered to be “at risk” when it is comprised of individuals who are free of the disease at the outset of the period for which the rate is calculated. The size of the population at risk is often estimated by subtracting the number of confirmed cases of diseases in the population, i.e. prevalent cases, from the total population.
Population health : is the study of health and disease in human populations, where the community, rather than the individual, is the primary focus of concern.
Prevalence: rates measure the number of existing cases of disease in a population at one point in time. Preval ence rates are useful in assessing the burden of illness, particularly chronic disease, in the popula-tion.
Number of existing cases
-------------------- x 100,000 population Total population
Sex-disaggregated data : are data separated by sex (male and female), allowing the user to read and use the data for each sex separately, as well as in combination.
Appendix B | Glossary
x 100.000 population

51
Guidelines for Developing a Population-Based Gender and Health Profile | Appendix
Appendix C | Flow chart for presenting a gender and health profile

52
Profile framework:
> What topics in Gender and Health will be covered in the Profile? > How have you decided on these topics?> What indicators are useful and convenient measures to describe the topics? > What data are available for each of these indicators?
Appendix D | Sample templates for profile development
Topic Area: Indicators within topics: Data available:
Step 1: IntroductionQuestions to consider and explain in the Introduction for each topic:
What is the topic?
What indicator(s) will be used to describe the topic?
Why is this topic included in the profile?
Why is it a health concern for women or men?
What do you hope to learn from the present analysis?
How is the topic important to the health of communities or the population as a whole?How can the findings be used to change health policies or services?
Step 2: Describing the data and its limitations: Describe the data you are using.
Are the data separated by sex? How else can you separate the data: by age, rural or urban residence, or ethnicity?
How is the disease or condition of interest de-fined by the administrator of your data source, that is, what is the ‘case definition’ and what inclusion/exclusion criteria are applied?

53
Guidelines for Developing a Population-Based Gender and Health Profile | Appendix
Are the data precise? Do they describe the indicator as you would like? How will you take the lack of precision into account? How can you use the data to give an approximation to your indicator?
Are the data complete? Who or what are you missing? How will you account for the gaps in the data?
Are the data consistent? Can they be compared across the population and over time? How will you account for the inconsistencies in the data?
Other possible questions to consider and explain when describing the data:
Among men and among women, what is the estimated percentage of undiagnosed disease?
Which sub-populations are not included in these data? How else can you find out about disease and trends for those sub-populations?
Are institutionalized populations or those who receive care in private hospitals covered by the data?
Do you need to make any correction to remove possible repeat or duplicate data where the data record more than one case for the same person?
Step 3: Gender-based analysis and presentation of data:
How will you present the data? Counts/frequenciesCrude rates
Explain why you will or will not use the fo-llowing: > Age-specific rates> Age-adjusted rates
Other possible questions to consider for further analysis:
To what extent do observed differences in hospitalization rates between women and men reflect differential access or ‘exposure’ of men and women to the health care system?
Are there any changes in service delivery that account, to some extent, for any recent trends in rates?
Can observed differences in treatment and mortality be attributed to differences in life-style factors? What are those factors? How are they related to men’s and to women’s ro-les in families, communities and society?
How do district and sex differences in levels of poverty, access to treatment or other ser-vices contribute to the differences observed in the data?
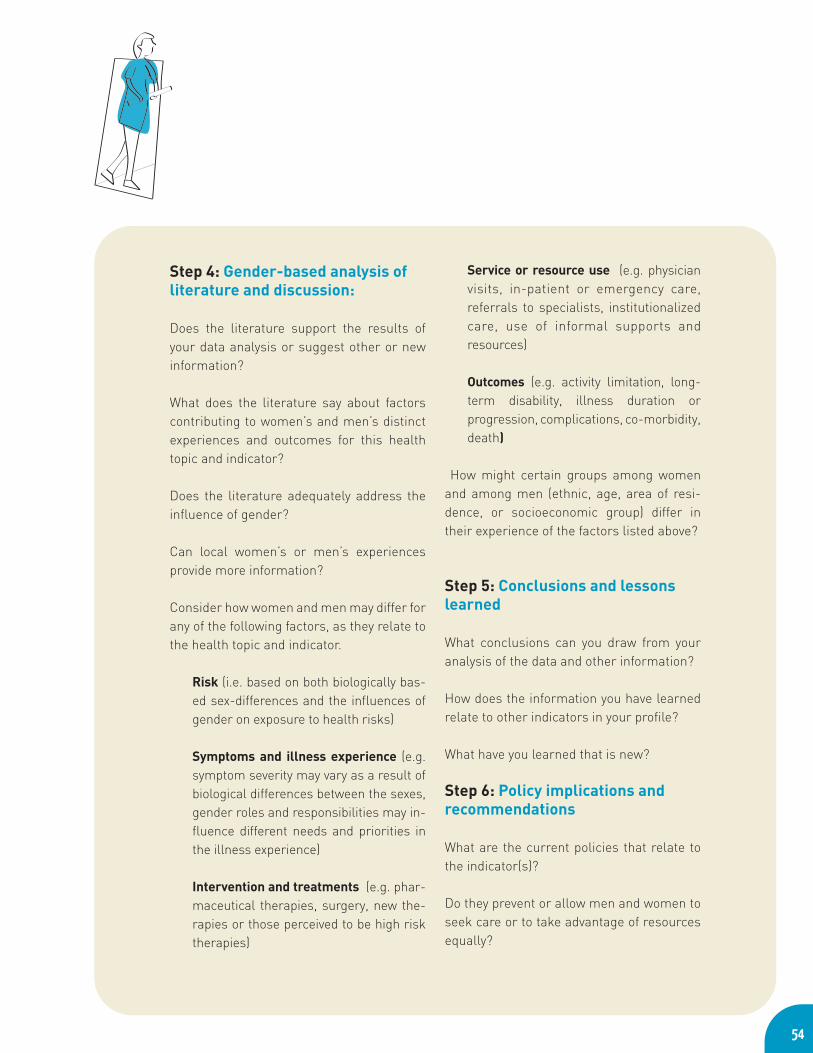
54
Step 4: Gender-based analysis of literature and discussion:
Does the literature support the results of your data analysis or suggest other or new information?
What does the literature say about factors contributing to women’s and men’s distinct experiences and outcomes for this health topic and indicator?
Does the literature adequately address the influence of gender?
Can local women’s or men’s experiences provide more information?
Consider how women and men may differ for any of the following factors, as they relate to the health topic and indicator.
Risk (i.e. based on both biologically bas-ed sex-differences and the influences of gender on exposure to health risks)
Symptoms and illness experience (e.g. symptom severity may vary as a result of biological differences between the sexes, gender roles and responsibilities may in-fluence different needs and priorities in the illness experience)
Intervention and treatments (e.g. phar-maceutical therapies, surgery, new the-rapies or those perceived to be high risk therapies)
Service or resource use (e.g. physician visits, in-patient or emergency care, referrals to specialists, institutionalized care, use of informal supports and resources)
Outcomes (e.g. activity limitation, long-term disability, illness duration or progression, complications, co-morbidity, death)
How might certain groups among women and among men (ethnic, age, area of resi-dence, or socioeconomic group) differ in their experience of the factors listed above?
Step 5: Conclusions and lessons learned
What conclusions can you draw from your analysis of the data and other information?
How does the information you have learned relate to other indicators in your profile?
What have you learned that is new?
Step 6: Policy implications and recommendations
What are the current policies that relate to the indicator(s)?
Do they prevent or allow men and women to seek care or to take advantage of resources equally?
55
Guidelines for Developing a Population-Based Gender and Health Profile | Appendix
Are there policies outside of the health sector that should be changed to reduce health inequalities?
What have community groups and individuals said about the related policy?
Do the data and information show that the policy is working to help the population and improve health?
Use the information now assembled in the Profile to make specific recommendations for policy that should or could be strengthen-ed or changed. Identify the relevant decision-making authority to which the recommenda-tions will be made.
Here are some areas where there may be recommendations:
Collection of indicator data
Health promotion and illness prevention
Policies in other sectors related to this indicator
Infrastructure and resources in Health and other sectors
