electrostatic correlations and fluctuations for ion binding to a finite length polyelectrolyte
TRANSCRIPT

Electrostatic correlations and fluctuations for ion bindingto a finite length polyelectrolyte
Zhi-Jie Tan and Shi-Jie Chena)
Department of Physics and Astronomy and Department of Biochemistry, University of Missouri,Columbia, Missouri 65211
~Received 7 September 2004; accepted 5 November 2004; published online 7 January 2005!
A statistical mechanical model is presented which explicitly accounts for the fluctuations, theelectrostatic, and the excluded volume correlations for ions bound to a polyelectrolyte such as DNA.The method can be employed to treat a wide range of ionic conditions including multivalent ions.The microscopic framework of the theory permits the use of realistic finite length and groovedstructural model for the polyelectrolyte and modeling of the finite size of the bound ions. Testagainst Monte Carlo simulations suggests that the theory can give accurate predictions for the iondistribution and the thermodynamic properties. For multivalent ions, the theory makes improvedpredictions as compared with the mean-field approach. Moreover, for long polyelectrolyte and dilutesalt concentration, the theory predicts ion binding properties that agree with the counterioncondensation theory. ©2005 American Institute of Physics.@DOI: 10.1063/1.1842059#
I. INTRODUCTION
Polyelectrolyte folding requires the proper ionic solutioncondition. It is essential to understand how the ionic condi-tion, such as ion concentration, ion size, and ion charges,determines the polyelectrolyte folding stability and cooperat-ivity. The ion-polyelectrolyte interaction is crucial to the dis-tribution of the ions in the close proximity of the polyelec-trolyte surface. The closely bound ions reside within a shortdistance of 1;2 hydrated ionic radii from the polyelectro-lyte surface, so the discrete properties of the bound ions canbe very important.
The local ion concentrations near the polyelectrolyte sur-face, especially around the charged groups, can be high.1,2
The condensed distribution of the bound ions causes strongcorrelations between the ions, as are characterized by a largecorrelation parameterG5q2/(eawskBT),3–7 where q is theionic charge,kB is the Boltzmann constant,T is the tempera-ture,e is the dielectric constant, andaws is the Wigner-Seitzradius. Multivalent ions carry high chargesq and generallyinvolve very strong correlations. In fact, the electrostatic cor-rectional force may be responsible for the attraction betweenlike-charged polyelectrolytes,3,8–10 and may also contributeto the folding driving force for nucleic acids.11–15
In addition, fluctuations in the ion binding will affect themechanical and thermodynamic properties of the polyelec-trolyte. For example, fluctuations in ion distribution can re-duce bending rigidity for randomly charged polymer.16,17
Moreover, the ion fluctuation is closely related to the stabil-ity of the system. Most previous models on ion fluctuationare based on simplified models.16–21In the present study, weaddress detailed polyelectrolyte structures and ion sizes inaddition to the ion-ion correlations due to both Coulombicand excluded volume interactions.
Classical approaches, including the counterion conden-sation ~CC! theory22 and the Poisson-Boltzmann equation~PB! theory,23–29 have enabled quantitative predictions forthe thermodynamic properties of proteins, DNAs, RNAs, andother polyelectrolytes. The CC theory assumes a two-stateion distribution and assumes an average uniform distributionof the bound ions, while neglecting the direct interactionsbetween the bound ions and the polyelectrolyte backbonecharges. PB is a mean-field theory which neglects the corre-lation effects. Both CC and PB ignore the fluctuations incounterion distributions and assume a mean distribution ofcounterions. Monte Carlo~MC! and molecular dynamicssimulations30,31 and the hypernetted chain theory32,33 can ac-count for the ion size, excluded volume, and inter-ion corre-lations, but require random sampling of the ionic configura-tions or through convoluted integral equation solutions.
In this paper, we present a statistical thermodynamicsmodel for a rigid polyelectrolyte of finite length immersed ina salt solution. The purpose here is to provide an analyticaltreatment for the ion-polyelectrolyte binding by consideringthe detailed geometry of the polyelectrolyte and the finitesize of the ions. In contrast to the previous CC- or PB-basedstudies, the present study considers electrostatic correlationsand fluctuations for the bound ions. Moreover, comparedwith the previous simplified salt-free models,3,20 we considerthe contributions from the added salt ions in the supportingsolution. The current form of the theory is developed forrigid polyelectrolyte. This is a first step towards a theory thatcan treat the interactions between multiple polyelectrolytechains and the folding of a flexible polyelectrolyte, whichinvolves an ensemble of chain conformations.
II. POLYELECTROLYTE STRUCTURE
In the present study, we use the double-helicalB-DNAas a paradigm for the polyelectrolyte. Previous studies haveshown that the detailed grooved structure, and the positions
a!Author to whom correspondence should be addressed. Electronic mail:[email protected]
THE JOURNAL OF CHEMICAL PHYSICS122, 044903 ~2005!
122, 044903-10021-9606/2005/122(4)/044903/16/$22.50 © 2005 American Institute of Physics
Downloaded 11 Nov 2005 to 128.206.125.7. Redistribution subject to AIP license or copyright, see http://jcp.aip.org/jcp/copyright.jsp

of the phosphate groups are important for the distribution ofthe bound ions.1,34 All-atom models can give the details forthe polyelectrolyte structure, but are intractably complex fora rigorous statistical mechanical theory developed in thepresent study. Therefore, we employ a coarse-grained semi-realistic polyelectrolyte model while retaining the key struc-tural features.
First, the model should provide the major and minorgrooves. The groove structures, which have been neglectedin many previous simplified models, are important becausethe interactions of the bound ions are dependent on the de-tailed geometry of the polyelectrolyte surface. Second, themodel should properly account for the sizes and the positionsof the negatively charged phosphate groups as well as otherneutral groups on the nucleotide backbone. Previous simula-tions based on realistic polyelectrolyte structures have shownthat the thermodynamic results are quite sensitive to thebackbone charge distribution.34,35 This is different from thesimplified cylindrical polyelectrolyte model, where the uni-form and discrete charge distributions give similar results.
We use a previously reported grooved DNA helix modelto describe the polyelectrolyte structure.34 The model, whichretains a high degree of realism for the polyelectrolyte struc-ture, is tractable for our statistical mechanical calculations.Previous detailed molecular simulations have validated thegrooved model through the computation of the detailed iondistribution.34 Figure 1 shows the grooved model. We repre-sent aB-form DNA structure ofL nucleotide units as twohelical strands, each withL/2 nucleotide units, around a cen-tral cylindrical rod of radiusr core53.9 Å. The central cylin-drical rod represents the space occupied by the base pairs andis assumed to be inaccessible to the salt ions. We use twohard spheres to represent the chemical groups in a nucleotideunit: a charged sphere with a point charge2e (e5protoniccharge! at the center to represent the phosphate group and aneutral sphere to represent the rest of the group in the nucle-otide. The phosphate sphere is placed at the center of thephosphate group of the nucleotide and the neutral sphere liesbetween the phosphate sphere and the cylindrical rod, asshown in Fig. 1. Both spheres are assumed to have radius ofr 052.1 Å. The radii of the spheres are chosen to best simu-late the more realistic soft potential~a smooth distance-dependent potential functions!.34 For a B-DNA, the phos-phate charge positions (r i
s ,u is ,zi
s) are given by the followingequation:36
H r is58.9 ~Å !
u is5u0
s1 i ~36°!zi
s5z0s1 i3.38 ~Å !
, ~1!
where s (51,2) denotes the two strands andi(51,2,. . . ,L/2) denotes the nucleotides on each strand. Theinitial position parametersu0
s andz0s are 0° and 0 Å for the
first strand, and 154.4° and 0.78 Å for the second strand.
III. TIGHTLY BOUND IONS AND BINDING MODES
We assume that ions are hydrated, i.e., the model doesnot treat the desolvated ions binding to~often deeply pen-etrated! specific sites of the polyelectrolyte. We use ionic
radii 3.5, 4.5, and 3.5 Å for the hydrated Na1, Mg21, andCl2 ions,37 respectively. The positively charged counterionstend to bind to the polyelectrolyte~polyanion in our model!in the solution. We classify the bound counterions into twotypes: ‘‘the tightly bound ions’’ and ‘‘the diffusively boundions.’’ The tightly bound ions are trapped in the strong elec-trostatic field on the polyelectrolyte surface. They lose, to aconsiderable extent, the radial degree of freedom, thoughthey may diffuse on the polyelectrolyte surface. On the otherhand, the diffusively bound ions are more mobile and arediffusively distributed in the solution around the polyelectro-lyte.
We can use the fluid model to describe the diffusivelybound ions. In the mean-field approximation, the local con-centrationca(x) at positionx for ions of speciesa obeys theBoltzmann distribution, as determined by the electrostaticpotentialc~x!,
ca~x!5ca0e2zaec(x)/kBT, ~2!
wherezae is the charge of the ion andca0 is the bulk con-
centration. The electric potentialc~x! is given by the solutionof the PB,
“•e0e“c524pH r f1(a
zaeca~x!J , ~3!
FIG. 1. ~a! The B-DNA grooved primitive model~Ref. 34!. In our theory,the region around DNA molecule is divided into two parts:~i! the tightlybound region, where counterions are trapped by the strong electrostatic fieldand are strongly correlated;~ii ! the diffusively bound region~outside thedotted lines!, where ions are diffusive and can be described by the Poisson-Boltzmann theory. The boundary between the two regions is determined byFig. 1~c!. ~b! The cross section of theB-DNA grooved model shows theposition of cylindrical core, intermediate neutral sphere, and phosphatesphere.~c! The tightly bound regions around aB-DNA of length L540 inNa1 ~left! and Mg21 ~right! solutions at bulk concentrationc050.1M . Thered spheres represent the phosphate groups and the green dots represent thepoints on the boundaries of the tightly bound regions.
044903-2 Z.-J. Tan and S.-J. Chen J. Chem. Phys. 122, 044903 (2005)
Downloaded 11 Nov 2005 to 128.206.125.7. Redistribution subject to AIP license or copyright, see http://jcp.aip.org/jcp/copyright.jsp

wherer f is the charge density of the fixed charges ande0 isthe permittivity of free space.
Sincec~x! decreases rapidly asx approaches the poly-electrolyte surface, which, according to Eq.~2!, causes anabrupt increase in the counterion concentrationca(x). Theremay exist a region ofx sufficiently close to the polyelectro-lyte surface where ions are sufficiently condensed so thations become strongly correlated. We call the strongly corre-lated ions as the tightly bound ions, and the correspondingregion as the tightly bound region. How to quantitatively andunambiguously define the tightly bound region? We use thefollowing criteria.
~a! Strong electrostatic correlation can be characterizedby a large correlation parameter:
G~x!5~zae!2
eaws~x!kBT>Gc . ~4!
Here we usee.78 (5bulk solvent) for inter-ion distanced>2r c>7Å (r c5 ion radius! for Na1 or Mg21. Previouscomputer simulations suggest thatGc.2.6 for the liquid togaseous phase transition for ion system.5–7 To measure the~excess! electrostatic correlation induced by the polyelectro-lyte, we use the Wigner-Seitz radiusaws(x) for counterionconcentration in excess of the bulk solvent concentration:3
4p
3@aws~x!#3@ca~x!2ca
0 #51. ~5!
~b! Ions of finite size in the high concentration region be-come crowded and can frequently bump into each other,causing the excluded volume correlation between the ions. Astrong excluded volume correlation induced by the polyelec-trolyte can be characterized by a small mean inter-ion dis-tanced,
d52aws<2~r c1Dr !, ~6!
wherer c is the ion radius,Dr is the mean displacement ofions from the equilibrium positions, and 2(r c1Dr ) is theclosest distance between two ions before they overlap. FromLindermann’s melting theory, we chooseDr /d.0.1 as themelting point for the correlated structure.38–40
From the counterion concentrationca(x) in Eq. ~2! andthe correspondingaws in Eq. ~5!, we can quantitatively mapout the tightly bound region, from either Eq.~4! or Eq.~6!—whichever is first satisfied as the ion positionx approachesthe polyelectrolyte surface. In fact, we find that for Na1
solutions, Eq.~6! gives the tightly bound region, while forMg21 solutions, which involve stronger electrostatic interac-tions, Eq. ~4! determines the tightly bound region. In Fig.1~c!, we show the tightly bound region for a double strandedoligomeric B-DNA in Na1 and Mg21 solutions, respec-tively. As shown in the figure, the tightly bound region isroughly a thin layer~or patches of thin layers! on the poly-electrolyte surface, and the tightly bound region covers awide area from the surface of the phosphate groups to themajor or minor grooves, depending on the size and thecharge of the counterions. We call the tightly bound regionfor each nucleotide (5monomer of the DNA polyelectrolyte!
as a tightly bound cell. A tightly bound ion in the tightlybound cell can either reside in the major or minor groove orbound to the respective phosphate group.
As described above, according to the inter-ion correla-tion strength, we can classify two types of ions: the tightlybound and the diffusive ions for counterions inside and out-side the tightly bound region, respectively. For the~stronglycorrelated! tightly bound ions, we need a theory that goesbeyond the PB to account for the strong correlation and fluc-tuation. In the following sections, we develop such a theory.The main points of the theory include the following.
~1! To consider thefluctuation of the tightly bound ions,we introduce binding modes. A binding modeM isdefined by the ion occupation numbersmi in thetightly bound cells (i 51,2,. . . ,N; N5thenumber of the tightly bound cells in the polyelectrolyte!:M5$m1 ,m2 , . . . ,mi , . . . ,mN%.
~2! The use of the discrete modes makes it possible to fullyaccount for them-particle (ion) electrostatic correlation(m5( i 51
N mi is the number of the tightly bound ions!.~3! For a given tightly bound mode, the tightly bound ions
have freedom to move around in their respective tightlybound cells. For each mode, we perform the statisticalaverage over the possible positions of the tightly boundions to determine the potential of mean force~free en-ergy! of the bound ions.The finite size of the ions, thepolyelectrolyte structure, and the electrostatic and stericcorrelationsare fully accounted for in the calculation.
~4! For each mode~charge distribution! of the tightly boundions, we use the mean-field PB theory to describe thedistribution of the ~weakly correlated! diffusive ions.From the ion distribution, we can determine the free en-ergies of the system, including the interaction betweenthe tightly bound ions and the diffusive ions. We can alsodetermine the dominant binding modes, the fluctuations,and the radial distribution of the bound ions, etc.
IV. STATISTICAL MECHANICS MODEL
Consider anL-mer polyelectrolyte immersed in a solu-tion of N1 cations andN2 anions. The total partition func-tion of the system is the sum of the partition functionsZM
(M5the binding mode! for all the possible binding modes:
Z5(M
ZM . ~7!
From the mode partition functionZM we obtain the probabil-ity pM for the binding mode and the mean distribution$m1 ,m2 , . . . ,mL% of the tightly bound ions:
pM5ZM
Z; mi5(
Mmi pM for i 51,2,. . . ,L. ~8!
At the center of the theory is the mode partition functionZM . We consider a modeM with Nb tightly bound ions~andNd5N11N22Nb diffusive ions!. We use Ri ( i51,2,. . . ,Nb) andr j ( j 51,2,. . . ,Nd) to denote the coordi-nates of thei th tightly bound ion and thej th diffusive ion,respectively. The total interaction energy for a given configu-
044903-3 Ion binding to a finite length polyelectrolyte J. Chem. Phys. 122, 044903 (2005)
Downloaded 11 Nov 2005 to 128.206.125.7. Redistribution subject to AIP license or copyright, see http://jcp.aip.org/jcp/copyright.jsp

ration ~R,r ! can be decomposed asUb(R) for the electro-static interactions between the tightly bound charges(5charges of the tightly bound ions and the phosphatecharges!, Us(R,r ) for the interactions between the diffusiveions, andU int(R,r ) for the interactions between the tightlybound charges and the diffusive ions.
For a given mode,Ri can distribute within the volume ofthe respective tightly bound cell andr j can distribute in thevolume V of the solution. Averaging over the possible iondistributions gives the free energiesDGb and DGd for thetightly bound and for the diffusive ions, respectively,
e2DGb /kBT5^e2Ub /kBT&5*) i 51
Nb dRie2Ub /kBT
*) i 51Nb dRi
, ~9!
e2DGd /kBT5^e2(U int1Us)/kBT&
5E )j 51
Nd dr j
Ve2(U int1Us)/kBT. ~10!
Strictly speaking, for a given modeM , the diffusive ion freeenergyDGd is dependent on the spatial coordinatesR of thetightly bound ions in the tightly bound cells. However, as-suming the dependence ofDGd on the tightly bound ions ismainly through the net tightly bound charge, which is fixedfor a given mode, we can ignore theR dependence ofDGd .In practice, we approximateDGd by DGd(R), whereR isthe mean value ofR.
The decoupling ofR andDGd results in the separationof theR and ther variables in the configurational integral forZM ,
ZM51
~N12Nb!!
1
N2! E )i 51
Nb
dRi
3E )j 51
Nd
dr je2(Ub1U int1Us)/kBT
5Z(id)c1
NbS E )i 51
Nb
dRi D e2DGb /kBTe2DGd /kBT, ~11!
wherec15N1 /V denotes the total cation concentration, andZ(id) is the partition function for an ideal solution without theinsertion of the polyelectrolyte:
Z(id)5ZM~Nb→0,Ub→0,U int→0,Us→0!.
The excluded volume and the electrostatic interactionsare inherently coupled. In our calculation, the excluded vol-ume effect is considered not only for the configurational in-tegral (*) i 51
Nb dRi) in Eq. ~11! ~see Sec. B below!, but alsofor the electrostatic integral in Eq.~9! for DGb ~see Sec. Abelow!. From the above expression forZM and the total par-tition function Z @see Eq.~7!#, we can compute the electro-static free energyDGel:
DGel52kBT ln~Z/Z(id)!52kBT ln (M
~ZM /Z(id)!.
~12!
Physically,DGel is the free energy change upon the insertionof the polyelectrolyte.
A. Free energy of the tightly bound ions
The interaction energyUb in Eq. ~9! for a given configu-rationR of the tightly bound ions can be decomposed as twoparts: the Coulomb interactionsui j between charges in thei th and thej th ( j Þ i ) tightly bound cells anduii between thetightly bound charges in the same (i th) cell,
Ub5(i 51
L
(j . i
ui j 1(i 51
L
uii ,
uii 52 (i 851
mi zi 8e2
e i i 8r ii 81 (
i 851
mi
(i 9. i 8
zi 8zi 9e2
e i 8 i 9r i 8 i 9, ~13!
ui j 5e2
e i j r i j2 (
i 851
mi zie2
e i 8 j r i 8 j2 (
j 851
mj zje2
e i j 8r i j 8
1 (i 851
mi
(j 851
mj zizje2
e i 8 j 8r i 8 j 8, ~14!
where, as shown in Fig. 2~a!, (i 8,i 9), and (j 8, j 9) denote thetightly bound ions in thei th and thej th tightly bound cells,respectively.ze is the electric charge of the correspondingion, r ande represent the distance and the effective dielectricconstant for the electrostatic interaction between the respec-tive charges, andmi andmj are the occupancies of the tightlybound ions in thei th and thej th cell, respectively.
We simplify the calculation forDGb by assuming
^e2Ub(R)/kBT&.)i
^e2uii (R)/kBT&)i j
^e2ui j (R)/kBT&, ~15!
FIG. 2. Illustration of~a! the electrostatic and~b!–~d! the excluded volumeinteractions between charges in the tightly bound region. Empty circles rep-resent phosphate groups and the shaded circles represent the tightly boundions.
044903-4 Z.-J. Tan and S.-J. Chen J. Chem. Phys. 122, 044903 (2005)
Downloaded 11 Nov 2005 to 128.206.125.7. Redistribution subject to AIP license or copyright, see http://jcp.aip.org/jcp/copyright.jsp

where the pairwise potential of mean force arises from theaveraging over the possible coordinates of the tightly boundions in the respective cells:
^e2ui j (R)/kBT&5*v i
dRi*v jdRje
2ui j /kBT
*v idRi*v j
dRj. ~16!
Herev i andv j denote the volumes of the respective tightlybound cells. In the evaluation of the electrostatic integrals inEq. ~16!, the excluded volume interactions between ionsiand j are rigorously accounted for. In fact, the excluded vol-ume effect plays a significant role because the steric conflictis quite severe between ions distributed in the neighboringtightly bound cells.
We define two potentials of mean force:F1(m) for theintracell interactionsuii , wherem is the occupancy of thetightly bound ions in the cell, andF2( i , j ,mi ,mj ) for theintercell interactionui j , wheremi and mj are the occupan-cies of the tightly bound ions in the cells:
F1~m!52kBT ln^e2uii (R)/kBT&;
F2~ i , j ,mi ,mj !52kBT ln^e2ui j (R)/kBT&. ~17!
F1 andF2 can be precalculated and tabulated for differentparameters. For a given modeM5(m1 ,m2 , . . . ,mL), thesum of the potentials of mean force gives the free energyDGb :
DGb.(i
F1~mi !1(i j
F2~ i , j ,mi ,mj !. ~18!
The potential of mean forceF2( i , j ,1,1) for a DNA oflengthL530 is plotted in Fig. 3. From the figure, it is clearthat the dominant interactions come from ions distributed inspatially neighboring phosphate cells:u i 2 j u51 for the near-est neighbors along the sequence,u i 2 j u510 for the spatialneighbors separated by an exact helical turn (510-nt in se-quence!, and u i 2 j u511 and 21 for phosphates~on separatestrands! in the closest spatial proximity in the minor andmajor grooves, respectively.
B. Excluded volume correlationsbetween the tightly bound ions
The volume integral*) i 51Nb dRi in Eq. ~11! provides a
measure for the free accessible space of theNb tightly bound
ions in the tightly bound region. Since an exact treatment forthe full excluded volume correlations between all theNb
tightly bound ions is intractable, we decompose theNb-ioncorrelation into pairwise correlations between ions in adja-cent tightly bound cells. This leads to a factorable excludedvolume for theNb ions,
E )i 51
Nb
dRi.)i 51
Nb E dRi , ~19!
where the excluded volume interferences between the ions inadjacent cells are accounted for by the single ion volumeintegralv i5*dRi :
v i5
vb~0! if there exists no tightly bound counterion in the neighboring tightly bound cells;vb~1! if there exists a bound ion in one of the neighboring tightly bound cells;vb~2! if there exist bound ions in both neighboring tightly bound cells.
Physically, the finite volume of the ions in the neighboringcells restrict the viable space of the ion, causingvb(2),vb(1),vb(0). We apply Eq.~19! to the one-, two-, andthree-ion systems in Figs. 2~b!–2~d!, and computevb(n)(n50,1,2) through the following equations for the threemodel systems:
vb~0!5E dR~0!, ~20!
vb2~1!5E E dR~1!dR8~1!, ~21!
FIG. 3. The pairwise potential of mean forceF2( i , j ,1,1) ~in kBT) betweentwo phosphate cells (i and j ) with a Mg21 ion in each cell@see Eqs.~16! and~17!#, for a DNA oligomer of lengthL530 in a 0.01M @Mg21# solution.The phosphates 1< i , j <15 reside in strand 1 and 16< i , j <30 in the otherstrand of DNA.
044903-5 Ion binding to a finite length polyelectrolyte J. Chem. Phys. 122, 044903 (2005)
Downloaded 11 Nov 2005 to 128.206.125.7. Redistribution subject to AIP license or copyright, see http://jcp.aip.org/jcp/copyright.jsp
vb2~1!vb~2!5E E E dR~1!dR~2!dR8~1!. ~22!
Here the ~multiple-ion! excluded volume interactions arefully considered when evaluating the above integrals.
Because the geometry of the tightly bound regions arequite irregular, the multidimensional integrations over thetightly bound region forF1 andF2 and for the free volumevb(n) are time consuming. However, since the tightly boundregion is mainly a thin layer on the surface of the polyelec-trolyte, we can approximate the tightly bound region as auniform thin layer of thicknessd. The thickness of the layerrepresents the maximum displacement of the tightly boundion away from the polyelectrolyte surface. Multivalent ionsusually have a thicker layer of the tightly bound regionbecause ions are confined by a stronger electrostaticforce. d can be obtained from the volumevb(0),
vb~0!.V~0!R~0!2d, ~23!
whereR(0) is the mean distance to the center of the respec-tive phosphate sphere@see Fig. 2~b!# and V~0! is the solidangle of the surface of the tightly bound cell measured fromthe center of the phosphate sphere. Since a tightly bound cellcovers most of~or all of! the nucleotide surface, we can takeV~0! as the solid angle that covers the full surface of anucleotide unit.
C. Free energy of the diffusively bound ions
The free energyDGd accounts for the electrostatic inter-actions between the diffusive ions and between the diffusiveions and the tightly bound ions. We use the mean-field theory~PB! to describe the diffusively bound ions and make thefollowing approximation forDGd :
^e2(U int1Us)/kBT&.^e2U int /kBT&^e2Us /kBT&,
where the averaging is for both the spatial configurationR ofthe tightly bound ions and the configurationr of the diffusiveions. The above approximation results in an additive sum forDGd ,
DGd.DGint1DGs ,
whereDGs is the free energy of the diffusive ion solution,andDGint is the free energy for the interaction between thediffusive and the tightly bound ions~and the fixed charges onthe polyelectrolyte backbone!:
DGint52kBT ln^e2U int(R,r )/kBT&;
DGs52kBT ln^e2Us(R,r )/kBT&.
We make use of the mean-field results forDGint andDGs ~Refs. 41 and 42! and have
DGd51
2 E (a
ca~x!zae@c~x!1c8~x!#d3x
1kBTE (a
Fca~x!lnca~x!
ca0 2ca~x!1ca
0 Gd3x,
~24!
where the first integral givesDGint and the enthalpic part ofDGs , and the second integral gives the entropic part ofDGs . c~x! and c8(x) are the electrostatic potentials withand without the diffusive salt ions, respectively.c8(x) isintroduced becausec(x)2c8(x) gives the electrostatic po-tential from the diffusive ions. a denotes the ion species,zae is the charge of the ion,ca
0 is the bulk ion concentration,andca(x) is the local ion concentration determined from theelectrostatic potentialc~x! @see Eq.~2!# andc~x! is obtainedfrom PB @Eq. ~3!#.
D. Electrostatic potential for the diffusive ionsin the solution
For azc :1 salt, the general PB in Eq.~3! for the diffu-sive ions has the following form:
“•e“f524pr fe/e0kBT
1k02@zc exp~f!2zc exp~2zcf!#. ~25!
Heref5ec/kBT is the reduced electrostatic potential in thediffusive solution and k05A4pNAe2c0/(e0kBT) is theDebye-Huckel screening parameter.c0 is the bulk salt con-centration andNA is the Avagadro’s number. The charge den-sity r f of the fixed charges includes the phosphate chargesand the tightly bound ions. Using the aforementioned ap-proximation for the decoupling of the diffusive ion distribu-tion and the tightly bound ion configurationR, we fix thetightly bound ions in a tightly bound cell to the center of therespective phosphate spheres. As a result, thei th tightlybound cell withmi tightly bound ions would contribute afixed charge of (mizae2e) at the center of the phosphatesphere, wherezae is the charge of a tightly bound ion.Though the coordinates of the tightly bound ions are ap-proximated as being fixed here, no such approximation ismade in the calculations for the tightly bound ions. In fact,the averaging over all the possible coordinates inside thetightly bound region yields the potentials of mean forceF1
andF2 and the free energyDGb for the tightly bound ions.Existing PB solvers23–29,43have been successful in pre-
dicting the electrostatic interactions for complex protein andnucleic acid structures. In the present study, based on thealgorithms used in the PB solvers,23,43–45we develop a three-dimensional~3D! finite-difference algorithm that is conve-nient to use for our present model. The algorithm of solvingthe nonlinear PB is divided into two parts: the assignment ofthe physical quantities and the outer boundary conditionsonto the grid points, and the actual iterative process of solv-ing PB.
We first assign the grid charges inside the tightly boundregion by partitioning a charge onto the eight nearest gridpoints, weighted by a trilinear function:43 (12dx)(12dy)3(12dz), wheredx , dy , dz are the distances of the chargefrom the grid point in thex,y,z directions, respectively. Wethen assign dielectric constantse at the midpoints betweengrid points. We assigne52 inside ande578 outside thepolyelectrolyte molecule.23–25 We also assign the Debye-Huckel parameterk for each grid point. Specifically, we as-sign k50 inside the tightly bound region because of theabsence of the diffusive ions, andk5k0 for grid points in
044903-6 Z.-J. Tan and S.-J. Chen J. Chem. Phys. 122, 044903 (2005)
Downloaded 11 Nov 2005 to 128.206.125.7. Redistribution subject to AIP license or copyright, see http://jcp.aip.org/jcp/copyright.jsp
the diffusive ion region.23 We use the screened Debye-Huckel potential as the boundary condition for the potentialon the outer boundary.43
To solve the nonlinear PB equation iteratively, we use asimple method proposed in Ref. 46. If there is a good trialsolution fa for the exact solutionf for PB, Df (5f2fa) would be a small quantity. We substitutef (5fa
1Df) into PB equation and perform Taylor expansion aboutthe small quantityDf. Keeping only the linear terms off2fa in PB, we have the following linearized PB:
“•e“f524pr fe/e0kBT
1k02@zc exp~fa!2zc exp~2zcfa!#
1k02@zc exp~fa!1zc
2 exp~2zcfa!#~f2fa!.
Starting from an initial trialfa , we can solve PB iterativelyover all the grid points by applying the above equation, untilan appropriate convergence condition is satisfied. In thisway, f at all grid points can be obtained. In our algorithm,the iteration is truncated atuf2fau<1024.
In addition, we employ the focusing operation23 in orderto obtain the detailed electrostatic field near the molecule.Specifically, we use the three-step focusing process.47 In thefirst run, PB is solved on a large-scale grid. The size of the~cubic! cell of the first run relies on the salt concentrationused. Generally, we keep it larger than six times of the De-bye length of salt solution in order to properly account forthe salt effects and to diminish the boundary effect. In thesecond run, a smaller area near the polyelectrolyte is selectedand PB is solved based on a smaller grid. The outer boundaryconditions of the second run are interpolated from the poten-tials of the first run using trilinear interpolation. For the sec-ond and the third run, the sizes of the cubic cells are kept at102 and 51 Å, respectively, and the corresponding resolu-tions are kept at 0.85 Å per grid and 0.425 Å per grid, re-spectively. The corresponding number of grid points is 1213
for both the second and the third run. High resolution is usedfor the region near the polyelectrolyte surface because themost important potential change occurs in that region. To testour numerical algorithm, different resolutions are used, andthe results are stable.
E. Effects of dielectric discontinuity
The dielectric discontinuity~low e in DNA and highe insolvent! is partially accounted for by the effective dielectricconstants for the charge-charge interactions@see Eqs.~13!and ~14!#. Previous studies use a distance-dependent dielec-tric function to account for the dielectric effects.48–54 Al-though the studies appeared to be successful, the treatmentsare physically oversimplified for the molecules with arbitraryshapes.1,55 Physically, the charge-induced reaction field ofthe low dielectric DNA molecule causes an increase in thephosphate-counterion attraction,1,55 a repulsive force on thecounterion due to its self-image, and an increased~de-creased! Coulomb forces between ions on the same~oppo-site! side of the DNA.1,55–58The former two effects are con-sidered to play roles in the ion distribution,1 and the thirdeffect may not be significant because counterions tend to
repel each other and inter-ion distance are generally large,1
especially for hydrated ions. In this section, we examine thedielectric effects for the specific grooved DNA model em-ployed in the present study. We useesol578 for the solventandeDNA52 for the DNA~including the cylindrical core, theneutral and the phosphate sphere; see Fig. 1!.
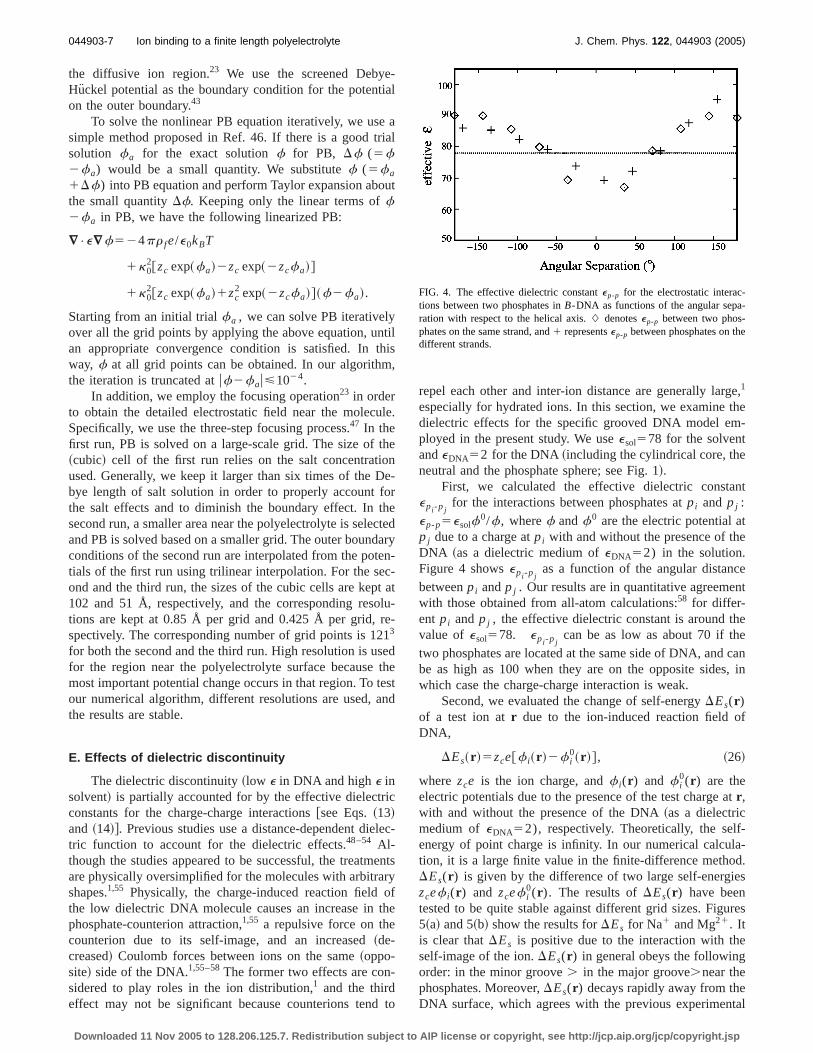
First, we calculated the effective dielectric constantepi -pj
for the interactions between phosphates atpi and pj :ep-p5esolf
0/f, wheref andf0 are the electric potential atpj due to a charge atpi with and without the presence of theDNA ~as a dielectric medium ofeDNA52) in the solution.Figure 4 showsepi -pj
as a function of the angular distancebetweenpi andpj . Our results are in quantitative agreementwith those obtained from all-atom calculations:58 for differ-ent pi andpj , the effective dielectric constant is around thevalue of esol578. epi -pj
can be as low as about 70 if thetwo phosphates are located at the same side of DNA, and canbe as high as 100 when they are on the opposite sides, inwhich case the charge-charge interaction is weak.
Second, we evaluated the change of self-energyDEs(r )of a test ion atr due to the ion-induced reaction field ofDNA,
DEs~r !5zce@f i~r !2f i0~r !#, ~26!
where zce is the ion charge, andf i(r ) and f i0(r ) are the
electric potentials due to the presence of the test charge atr ,with and without the presence of the DNA~as a dielectricmedium of eDNA52), respectively. Theoretically, the self-energy of point charge is infinity. In our numerical calcula-tion, it is a large finite value in the finite-difference method.DEs(r ) is given by the difference of two large self-energieszcef i(r ) and zcef i
0(r ). The results ofDEs(r ) have beentested to be quite stable against different grid sizes. Figures5~a! and 5~b! show the results forDEs for Na1 and Mg21. Itis clear thatDEs is positive due to the interaction with theself-image of the ion.DEs(r ) in general obeys the followingorder: in the minor groove. in the major groove.near thephosphates. Moreover,DEs(r ) decays rapidly away from theDNA surface, which agrees with the previous experimental
FIG. 4. The effective dielectric constantep-p for the electrostatic interac-tions between two phosphates inB-DNA as functions of the angular sepa-ration with respect to the helical axis.L denotesep-p between two phos-phates on the same strand, and1 representsep-p between phosphates on thedifferent strands.
044903-7 Ion binding to a finite length polyelectrolyte J. Chem. Phys. 122, 044903 (2005)
Downloaded 11 Nov 2005 to 128.206.125.7. Redistribution subject to AIP license or copyright, see http://jcp.aip.org/jcp/copyright.jsp

results on a clay DNA model.1,55 Quantitatively, ourDEs isslightly smaller than that measured in the experiment, whichmay be attributed to the different dielectric DNA modelsused.1,55 SinceDEs(r ) is proportional to the square of thevalency, Mg21 ions in general have largerDEs(r ) value. Onthe other hand, Mg21 ions have larger excluded volume thanNa1 ions because of the larger hydrated radius, and thusMg21 ions are distributed further away from the DNA.
Third, we computed the change of the interaction energyDEp(r ) between a~test! ion and the phosphates in thephosphate-induced reaction field of DNA,
DEp~r !5zce@fp~r !2fp0~r !#, ~27!
where fp(r ) and fp0(r ) are the potentials atr due to the
phosphate charges on DNA ofeDNA52 and eDNA5esol
578, respectively. Figures 5~c! and 5~d! show theDEp(r )for the Na1 and Mg21 ions. DEp(r ) is negative due to the~negative! image charges of the phosphates. The strength ofthe attractiveDEp(r ) obeys the following order: in the minorgroove.near the phosphates. in the major groove. This is
because an ion in the minor groove can be much closer to thephosphate charges than one in the major groove.
BecauseDEs(r ) is positive~repulsive! while DEp(r ) isnegative~attractive!, DEs(r ) and DEp(r ) can compensateand cancel each other. We plot the net effectDE(r )5DEs(r )1DEp(r ) in Figs. 5~e! and 5~f!. The figures showthat inside the major groove,DE(r ) is positive and contrib-utes a destabilizing free energy to the ion binding. Moreover,for both Na1 and Mg21 ions, DE(r ),0 near the phos-phates, which means that the reaction field is stabilizing forion binding near the phosphates. For Na1 ions, DE(r ) issmall @see Fig. 5~e!#. For Mg21 ions, DE(r ) is larger thanthat for the Na1 ion in the major groove. In the minor grooveand near the phosphates,DE(r ) is small too. For example, ata radial distance of 10.2 Å in the minor groove~minimumaccessible distance for a hydrated Mg21 in the minorgroove!, DE(r ) is 20.1kBT for Na1 and 0.3kBT for Mg21.For a larger radial distance,DE(r ) of Mg21 becomes nega-tive too. For example, at radial distance 14 Å,DE is about20.15kBT. The different behavior between Na1 and Mg21
FIG. 5. The two-dimensional contours in a plane per-pendicular to theB-DNA helix for the energy change~in kBT) due to dielectric discontinuity (e52 in DNAand e578 in solvent!: the change of self-energyDEs
for Na1 ~a! and Mg21 ~b! ions; the change of the inter-action from phosphatesDEp for Na1 ~c! and Mg21 ~d!ions; and the total change of energyDE (5DEs
1DEp) for Na1 ~e! and Mg21 ~f! ions. The centralblank spaces are the inaccessible volumes for the hy-drated ions~DNA helix plus a excluded volume layerwith one ion radius!.
044903-8 Z.-J. Tan and S.-J. Chen J. Chem. Phys. 122, 044903 (2005)
Downloaded 11 Nov 2005 to 128.206.125.7. Redistribution subject to AIP license or copyright, see http://jcp.aip.org/jcp/copyright.jsp

ions comes from their different valencies. Since,DEs(r )}zc
2 and DEp(r )}zc , DEs(r ) is dominant for multivalentions ~larger zc) near DNA surface~e.g., deep in grooves!,andDEp(r ) becomes important when ions are away from thedeep groove positions. For both Na1 and Mg21 ions,DE(r )is small as compared with the Coulombic energy. Therefore,the effect of dielectric discontinuity due to DNA on ions’distribution does not appear to be significant.59,60 Further-more, previous studies suggested that the dielectric constantof nucleic acids~and protein! might be much larger than2,61–64 and consequently the effects of dielectric discontinu-ity become even smaller. Therefore, in the present study, forsimplicity, we neglect the effects~the reaction field! arisingfrom the dielectric discontinuity.
As a caveat, we note that the reaction field is nonaddi-tive, thus the above decomposition for the contributions fromdifferent charges is a simplification for a complex problem. Amajor approximation in the above test charge calculation isto neglect the effect from the ion cloud surrounding the DNAand the interactions between the ion cloud and the DNA~andthe phosphates!. With such an approximation,DEs(r ) andDEp(r ) can be solved from the linear Poisson equation~rather than the nonlinear PB!, and they are additive. As aresult,DEs(r )1DEp(r ) can give the total energy from theDNA reaction field. However, rigorously speaking, the en-ergy of the reaction field is nonadditive, and the differentcomponents of the reaction field and the self-energy are in-herently coupled due to the ion-DNA and ion-ion interac-tions. Therefore, the results given above can only provide acrude estimation for the self-energy~and the reaction fieldenergy!. Nevertheless, theDEs(r ) andDEp(r ) may providesome insights in the effects of DNA dielectric discontinuity.
V. DYNAMICS OF THE TIGHTLY BOUND IONSAND THE ION-BINDING MODES
A. Monte Carlo simulation
Since MC simulation is independent of the analyticalstatistical mechanical theory, it can provide a test and vali-dation for the statistical mechanical theory. In addition, wecan employ MC simulations to obtain the kinetic informationfor the tightly bound ions. We use the grooved model for thepolyelectrolyte structure, and use hard spheres for ions withcharges placed at the centers of the spheres. We use a cellmodel by placing the polyelectrolyte at the center of a cubiccell and placing ions in the cell and in the neighboring imagecells.30,65–67We also impose charge neutrality for the system,so the net charge of the simulation cell is zero. The size ofthe cubic cell is always kept six times larger than the Debyelength of the solution to diminish the boundary effect. Thenumbers of different ions in the simulation depend on thecell size, salt concentration, and polyelectrolyte length. Theconcentration of polyelectrolyte is assumed to be very diluteso that interactions between different polyelectrolytes can beignored. In the simulation, we keep the polyelectrolyte fixedand allow the ions to move. The aqueous solvent is modeledas continuous medium with dielectric constant 78.
The electrostatic energy for a given ion distribution of
the system is evaluated as the sum of the Coulombicinteractions65,66
E5(i
(j 5 i 11
zizje2
e i j r i j1(
i(
l
zizle2
e i l r i l,
where i denotes ions in the cell,j (Þ i ) denotes ions in thecell and in the image cells,l denotes the phosphate groups,and zie,zje, and zle are the charges of the respective ionsand the phosphate groups. The first double summation ac-counts for the interactions between ions in the cell and allother ions~in the cell and the adjacent image cells!. Thesecond double summation accounts for the interactionsbetween ions in the cell and the phosphate charges on thepolyelectrolyte backbone. Following the simulationalalgorithm,66 we consider only the nearest adjacent imagecells.
For each Monte Carlo move of the ions, we compute theenergy changeDE of the system, and the probability exp(2DE/kBT) for the particular move to be accepted. The ionsare simulated to move with the acceptable probabilities. Suchprocess of stochastic move continues until the systemreaches thermal equilibrium from which the equilibrium dis-tribution of the ions can be obtained.
To validate our MC simulation method, we run MCsimulations for three different DNA lengthsL520, 40, and80 in both the 1:1~NaCl! and 2:1 (MgCl2) salt solutions ationic strength 0.022M , and compare the ion distribution withthat obtained from the simulations in Ref. 68 for infinitelylong DNA. In order to make direct comparisons, we use thesame set of parameters as those used in Ref. 68:e578, andion radius52.1 and 3 Å for counterions and coions, respec-tively. The comparison with Ref. 68 shows that the predicteddistribution for the fractional excess chargeQtot(R) for largeL is indeed very close to the known result for infinitely longchain. Here the fractional excess charge per nucleotideQtot(R) is defined as the net charge per nucleotide withinradial distanceR around the polyelectrolyte. In fact, the re-sult for L580 is already very close to the infinite-lengthresults, which confirms the previous finding that the counter-ion concentration near the middle of oligomer forL>40closely approaches that of the infinite-length poly-electrolyte.66
B. Dynamics of the tightly bound ions
All-atom molecular dynamics69,70 and Browniandynamics71 simulations show that~i! the majority of boundcounterions keep hydrated,72,73 ~ii ! most ions are not boundto specific sites,~iii ! the mobility of bound counterions isless than ions in bulk solvent,74 and~iv! the diffusion of thebound counterions in the grooves is local.71 For the presentgroove model of DNA, we use Monte Carlo simulation toinvestigate the ensemble averaged statistical properties aswell the single ion trajectory for a bound ion.
We first compute the mean residence time averaged overall the ions in the region immediately surrounding the poly-electrolyte: the mean timetp(d) for a tightly bound ion tostay within a distance ofr c1d (r c5 ion radius! from thesurface of the respective phosphate group and timet'(d) for
044903-9 Ion binding to a finite length polyelectrolyte J. Chem. Phys. 122, 044903 (2005)
Downloaded 11 Nov 2005 to 128.206.125.7. Redistribution subject to AIP license or copyright, see http://jcp.aip.org/jcp/copyright.jsp

a tightly bound ion to stay within a radial distance ofr c1dfrom the polyelectrolyte surface. Physically,tp is a result ofthe radial motion as well as the motion parallel to the poly-electrolyte surface. Clearlytp(d),t'(d) for any d. Figures6~a! and 6~b! show the Monte Carlo results fort' andtp fordifferent bulk salt concentrationc0 and differentd. Mg21
has longer residence time than Na1, because Mg21 is elec-trostatically more strongly attracted to the anionic polyelec-trolyte.
As the ion concentrationc0 is increased, more ions arebound. The increase in the number of the bound ions causesseveral notable changes in the dynamic properties of thebound ions, which are follows.
~i! A larger number of the tightly bound ions would pro-vide more effective charge neutralization of the polyelectro-lyte and hence a weaker radial electrostatic field around thepolyelectrolyte. As a result, the radial motion of the ion be-comes less restricted, causing shorter radial residence timet' .
~ii ! A larger number of the bound ions means increasedCoulombic and excluded volume repulsion between thebound ions. The increased inter-ion repulsion would suppressand restrict the parallel motion of the tightly bound ions,causing a reduction in the displacement parallel to the poly-electrolyte surface. Indeed, as shown in Figs. 6~c!–6~f!,higher ion concentrations correspond to smaller axial dis-placementDz.
~iii ! As the parallel motion ‘‘shrinks,’’ the difference be-tweent' andtp(,t') decreases. In the limiting case whenthere is no parallel motion,t' becomes equal totp . In fact,the Brownian dynamics simulation71 for infinite long poly-
electrolyte estimated thattp /t';1/8 for salt free solution~with monovalent ions added to neutralize the system!. OurMC simulation for a finite length polyelectrolyteL524 givesthat tp /t' decreases from 1/1.2 to about 1/2 as@Na1# de-creases from 0.1M to 0.001M . Here, we choosed53 Åwhen evaluatingt' and tp . As @Na1# decreases andL in-creases,tp /t' is expected to approach the value predictedfrom the Brownian dynamics simulation.
We also track the trajectories for single bound counteri-ons. We find that, for ions inside the bound region, the par-allel diffusion is localized to the nearest neighbor or the nextnearest neighbor tightly bound cells. The result agrees with aprevious study.71 Moreover, as shown in Figs. 6~c!–6~f!,higherc0 results in more mobile ions outside the bound re-gion, because of the stronger charge neutralization on thepolyelectrolyte and thus a weaker electric field nearby. Thiseffect is more pronounced for multivalent ions because of thestronger charge neutralization.
C. Equilibration kinetics of the binding modes
Different binding modes (5configurations of the tightlybound ions! result in different electric fields around the poly-electrolyte, causing different distribution of the diffusiveions. We would like to understand the kinetics for the cou-pling between the diffusive ions and the binding modes.
A change in the binding mode can arise either from theradial diffusion, causing the binding or dissociation of anion, or from the parallel diffusion~hopping! across the dif-ferent tightly bound cells, which conservesNb . The radialdiffusion changes the total number of the tightly bound ions
FIG. 6. ~a,b! The mean residence timetp ~bottom twolines! for a counterion to stay within a distance ofr c
1d (r c5counterion radius! from the surface of therespective phosphate group, and the mean residencetime t' ~upper two lines! for a counterion to stay withina radial distance ofr c1d from the polyelectrolyte sur-face. Solution conditions are~a! Na1 and ~b! Mg21,with salt concentrationsc050.001M ~solid lines! and0.1M ~dashed lines!. Botht' andtp are scaled as num-ber of Monte Carlo steps.~c–f! Three characteristicdistances of counterions~in unit of angstrom!: the dis-tanceDp of tightly bound counterions from the respec-tive phosphate sphere centers~black lines!; the distanceDz in the axis direction~gray lines!; and the radial dis-tance Dr of counterions from DNA axis~light graylines!. ~c! @Na1#50.001M ; ~d! @Na1#50.1M ;~e! @Mg21#50.001M ; ~f! @Mg21#50.1M . Thecounterions, which reside in the layer with thicknessd52 Å, are tracked in the simulations, and the trackingprocess is performed after the system reaches thermalequilibrium.
044903-10 Z.-J. Tan and S.-J. Chen J. Chem. Phys. 122, 044903 (2005)
Downloaded 11 Nov 2005 to 128.206.125.7. Redistribution subject to AIP license or copyright, see http://jcp.aip.org/jcp/copyright.jsp
Nb and the parallel diffusion conservesNb . Ion diffusionaround DNA has been investigated using all-atomsimulation74 and from continuous-medium simulation.71 Itwas found thatD'<D i<D0 for the diffusion coefficientsD' and D i for the bound counterions in the radial~'! andparallel ~i! directions andD0 for the ions in the bulksolvent.71,74 D' and D i increase and approachD0 with theincrease of radial distance from the DNA surface. Moreover,different types of counterions can have very different diffu-sion coefficients, for example, Li1 diffuses much slowerthan Na1 near the DNA surface,70 though they both aremonovalent ions. Furthermore, the diffusion near DNA isdependent on the geometry as well as the charge distributionon the polyelectrolyte. In general,D'!D0 due to the elec-trostatic attraction from the phosphate groups, andD i , de-pending on the ion and the polyelectrolyte structure, could becomparable toD0 or D' .
Preequilibrium case. If D i;D0 andD'!D0 , the modechange due to the parallel diffusion is much faster than thatdue to the radial diffusion. This would cause the modes withthe same total numberNb of the tightly bound ions to pre-equilibrate through the fast parallel diffusion before conver-sion into a mode of differentNb . As a result, the diffusiveions in the solution would ‘‘see’’ an approximately preequili-brated ensemble of modes with the sameNb and a pre-equilibrated distribution of the tightly bound ions$m1 ,m2 , . . . ,mL%:
mi5(mie
2DGb /kBT
(e2DGb /kBT ~ i 51,2,. . . ,L !, ~28!
where the sums are for all the modes withNb tightly boundions. In this case, we need to solve PB and the free energyDGd of the diffusive ions for eachNb , not for each mode.Note that for anL-mer polyelectrolyte, there are 2L11 pos-sible Nb values (Nb50,1,2,. . . ,2L). Because 2L11!thenumber of the binding modes, the preequilibration results ina great reduction in the computational time.
Non-preequilibrium case. If D i!D0 andD'!D0 , sincethe mode conversion is much slower than the relaxation ofthe diffusive ions in solution, preequilibration does not occur.As a result, the calculation ofDGd requires to solve the PBfor each tightly bound mode separately. Given the large num-ber of the modes, this is a formidable computational prob-lem. To circumvent the problem, we use the following twoapproaches.
~i! We first make the preequilibrium assumption, andcompute the mode probabilitypM @see Eq.~28!# for eachmodeM . We then regard the modes of largepM as the ‘‘im-portant’’ modes, and recomputeDGd ~andZM and pM) rig-orously without the preequilibration assumption for the im-portant modes. In our calculation, we choosepM.1023 asthe criteria for the important modes. The approach is vali-dated because different cutoff values~around 1023) result inconsistent thermodynamic results.
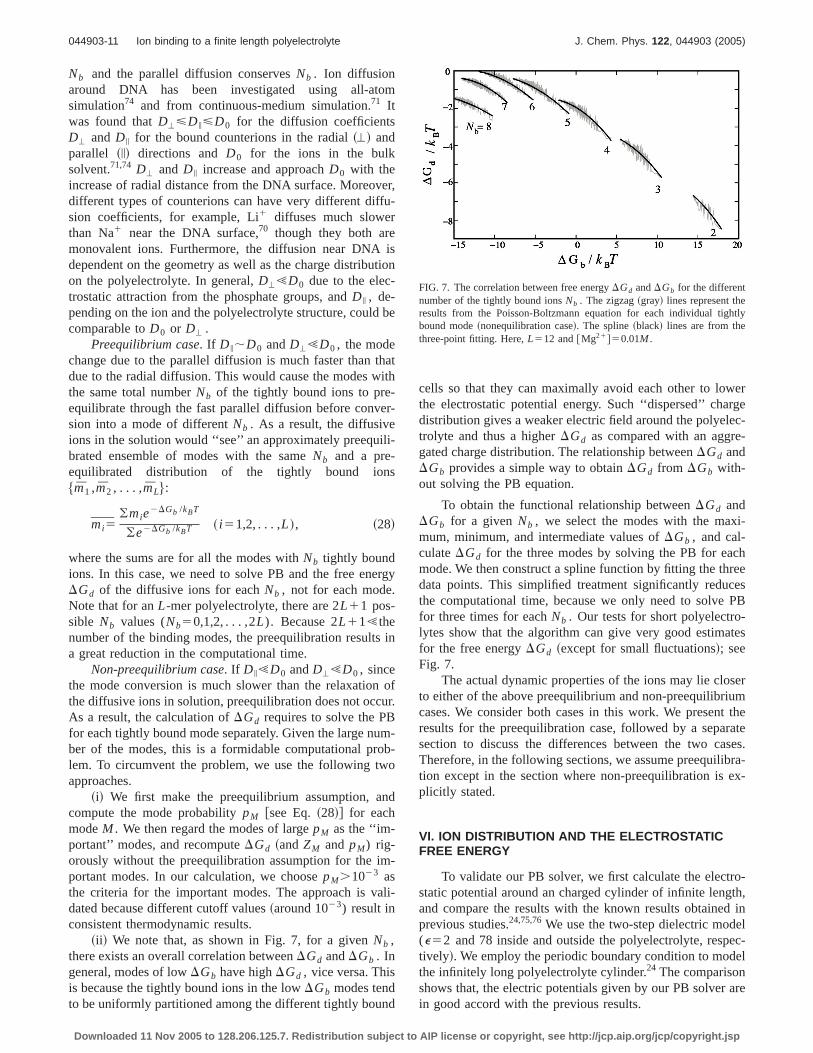
~ii ! We note that, as shown in Fig. 7, for a givenNb ,there exists an overall correlation betweenDGd andDGb . Ingeneral, modes of lowDGb have highDGd , vice versa. Thisis because the tightly bound ions in the lowDGb modes tendto be uniformly partitioned among the different tightly bound
cells so that they can maximally avoid each other to lowerthe electrostatic potential energy. Such ‘‘dispersed’’ chargedistribution gives a weaker electric field around the polyelec-trolyte and thus a higherDGd as compared with an aggre-gated charge distribution. The relationship betweenDGd andDGb provides a simple way to obtainDGd from DGb with-out solving the PB equation.
To obtain the functional relationship betweenDGd andDGb for a givenNb , we select the modes with the maxi-mum, minimum, and intermediate values ofDGb , and cal-culateDGd for the three modes by solving the PB for eachmode. We then construct a spline function by fitting the threedata points. This simplified treatment significantly reducesthe computational time, because we only need to solve PBfor three times for eachNb . Our tests for short polyelectro-lytes show that the algorithm can give very good estimatesfor the free energyDGd ~except for small fluctuations!; seeFig. 7.
The actual dynamic properties of the ions may lie closerto either of the above preequilibrium and non-preequilibriumcases. We consider both cases in this work. We present theresults for the preequilibration case, followed by a separatesection to discuss the differences between the two cases.Therefore, in the following sections, we assume preequilibra-tion except in the section where non-preequilibration is ex-plicitly stated.
VI. ION DISTRIBUTION AND THE ELECTROSTATICFREE ENERGY
To validate our PB solver, we first calculate the electro-static potential around an charged cylinder of infinite length,and compare the results with the known results obtained inprevious studies.24,75,76We use the two-step dielectric model(e52 and 78 inside and outside the polyelectrolyte, respec-tively!. We employ the periodic boundary condition to modelthe infinitely long polyelectrolyte cylinder.24 The comparisonshows that, the electric potentials given by our PB solver arein good accord with the previous results.
FIG. 7. The correlation between free energyDGd andDGb for the differentnumber of the tightly bound ionsNb . The zigzag~gray! lines represent theresults from the Poisson-Boltzmann equation for each individual tightlybound mode~nonequilibration case!. The spline~black! lines are from thethree-point fitting. Here,L512 and@Mg21#50.01M .
044903-11 Ion binding to a finite length polyelectrolyte J. Chem. Phys. 122, 044903 (2005)
Downloaded 11 Nov 2005 to 128.206.125.7. Redistribution subject to AIP license or copyright, see http://jcp.aip.org/jcp/copyright.jsp
A. Quantitative characterizationof the tightly bound layer
From Eqs. ~20! and ~23!, we can obtain the volumevb(0) of the tightly bound region and the mean thicknessdof tightly bound layer. Table I gives the values ofd for DNAwith different lengthL in the Na1 and Mg21 solutions ofdifferent concentration.d for @Mg21# solution is much largerthan that in@Na1# solution. This is because Mg21 ions havemuch stronger inter-ion correlations than the Na1 ions andthus have a larger tightly bound region. Moreover,d in-creases as the bulk ion concentration increases, becausehigher bulk salt concentration leads to a higher bound ionconcentration and thus stronger correlation for bound ions.We can also compute the free volumevb(1) andvb(2) fromEqs.~21! and ~22!.
B. Electrostatic free energy DGel
Figure 8 shows the electrostatic free energyDGel @seeEq. ~12!# as a function of the bulk salt concentrationc0 forthe Na1 and Mg21 solutions. As a comparison, we also showthe results from a pure Poisson-Boltzmann calculation~with-out considering the tightly bound ions! for low bulk saltconcentrations, for which PB can give an accurate descrip-tion for the system in a Na1 solution.77 In the pure Poisson-Boltzmann calculation, in order to account for the ion size,we have added an excluded volume~charge-free! layer onthe polyelectrolyte surface.78,79 The thickness of the charge-free layer is equal to the ion radiusr c . We find that both our
theory and PB predict thatDGel decreases asc0 increases.This is because higher salt concentration causes strongerelectrostatic screening and stronger charge neutralization forthe polyelectrolyte, and consequently lowers the electrostaticrepulsion between the polyelectrolyte charges.
As shown in Fig. 8,DGel predicted from our theory fora Na1 solution is very close to that predicted from PB. For aMg21 solution, however, our theory predicts a lower freeenergyDGel than PB. This is because the correlated distri-bution of the tightly bound ions can have lower energies thanthe mean-field configuration. Moreover,DGel for a Mg21
solution is much lower than that of a Na1 salt solution, be-cause of the much stronger attraction between Mg21 and thephosphate groups.
C. Ion radial distribution
The mean net chargeQb of the tightly bound ions pernucleotide unit and the total charge of the diffusively boundions Qd(R) per nucleotide unit can be calculated from thefollowing equations:
Qb5zceNb
L;
~29!
Qd~R!51
L E E Er 50
r 5RH(a
zaeca~x!J d3x,
where the sum overa is for all the ion species, andNb
5(MNbpM and ca(x)5(Mca(r )pM are the mean numberof the tightly bound counterions and the mean diffusive ionconcentration averaged over all the possible binding modes.
We compute the total bound chargeQtot(R) within a cy-lindrical region of radiusR. Since a binding mode onlyspecifies the number~not the spatial distribution! of thetightly bound ions in each tightly bound cell, the model can-not give the continuousR dependence ofQb . Thus we can-not obtain a continuousR dependence ofQtot(R). We definea stepwiseR dependence ofQtot(R),
Qtot~R!5Qd~R!1u~R2R* !Qb , ~30!
where the step function is defined asu(x)50 for x,0 andu(x)51 for x>0, and R* 58.9Å12.1Å1d1r c (r c
5counterion radius! is the outermost radial distance on thecontour of the tightly bound region~simplified as a thin layerof thicknessd!; see Fig. 1.
In Fig. 9, we test the theory predictions against the MCsimulation. For Na1 solutions, both our theory and the PBcan make accurate predictions forQtot(R). For Mg21 solu-tions, however, our theory makes better predictions than PB.Because PB ignores the low energy correlated configurationsof the tightly bound ions and thus under-estimates the boundion charge.80,81
D. Tightly bound counterions
In Fig. 10~a!, we plot the chargeQb of the tightly boundions as a function of the bulk salt concentrationc0 for boththe Na1 and Mg21 solutions. We find that our theory gener-ally gives quite accurate predictions~as tested against theMC simulation results! over a wide range ofc0. As c0
TABLE I. Mean thicknessd of the tightly bound region forB-DNA ofdifferent lengthL in solutions with different@Na1# or @Mg21#.
Width d ~Å!
L
@Na1# @Mg21#
1M 0.1M 0.01M 0.001M 0.1M 0.01M 0.001M 0.0001M
40 0.14 0.06 0.03 0.02 2.5 2.4 2.1 2.030 0.12 0.04 0.02 0.01 2.4 2.1 2.0 1.920 0.08 0.01 0.0 0.0 2.2 1.9 1.7 1.510 0.01 0.0 0.0 0.0 1.8 1.3 1.0 0.8
FIG. 8. Electrostatic free energy ofB-DNA oligomer with lengthL524 inNa1 ~upper two lines! and Mg21 ~bottom two lines! salt solutions at roomtemperature. Solid lines, from the present model; dotted lines, from Poisson-Boltzmann equation.
044903-12 Z.-J. Tan and S.-J. Chen J. Chem. Phys. 122, 044903 (2005)
Downloaded 11 Nov 2005 to 128.206.125.7. Redistribution subject to AIP license or copyright, see http://jcp.aip.org/jcp/copyright.jsp

increases, the entropic cost for ion binding decreases. Con-sequently, the binding of the tightly bound ions becomesmore favorable, resulting in more tightly bound ions andhence a largerQb . Moreover, because Mg21 ions are morestrongly attracted to the polyelectrolyte than Na1 ions, Qb
for Mg21 is much larger than that for Na1. In fact, for a Na1
solution, the electrostatic correlation is weak and only veryfew ions are tightly bound.
From Fig. 10~a!, we note thatQb exceeds unity at highMg21 concentrations. This means that negatively chargedDNA molecule is ‘‘overneutralized’’ by Mg21 ions. We notethat such overcharging34,82 or charge inversion83 phenomenacannot be predicted by the mean field theories. In fact, theovercharging may be related to the attraction between twolike-charged macroions.84
E. Total bound ions and comparisonswith the counterion condensation theory
The tightly bound counterions in our theory are differentfrom the ‘‘bound counterions’’ or ‘‘condensed counterions’’defined in the CC theory.22 The bound ions in PB or CCinclude both the tightly bound ions and the diffusively boundions defined in our theory. Therefore, the total charge of thecondensed ions in the CC theory corresponds to the totalcharge of all the ions within a properly defined bound radiusRb.R* :
Qtot~Rb!5Qd~Rb!1Qb .
Various methods have been used to defineRb .75,82,85–87
Here we define Rb through the following equation:87
d2Qtot(c)(R)/d(ln R)2uR5Rb
50, whereQtot(c)(R) is the total charge
of the counterions within a radial distanceR. Qtot(c)(R) can
be computed in the same way asQtot(R) from Eqs.~29! and~30!, except that the sum for ion speciesa in Eq. ~29! is forthe counterions only. The number of bound ions from thedefinition agrees with that of CC theory for infinite-lengthcylinder polyelectrolyte.87
For an infinite-length DNA, CC predicts that the con-densed counterions have total charge of 0.76e per nucleotidefor Na1 and 0.88e per nucleotide for Mg21.22 For anL-merDNA ~finite-length! in a 1:1 salt solution, a modified CCtheory88 gives that, the total condensed counterion charge isequal to (121/j) for L>lD /b and (12jcri /j) for L!lD /b. Herejcri5 ln(lD /b)/ ln(L), j5 l B /b is the Manningparameter,lD is the Debye length andb51.7 Å is the lon-gitudinal spacing of the charges on the polyelectrolyte back-bone.
FIG. 9. The spatial distribution of the total charge~per nucleotide! Qtot(R)within a cylindrical region of radiusR around the aB-DNA helix of lengthL524 in ~a! @Na1# and ~b! @Mg21# solutions at room temperature.c0
50.1M , 0.01M , and 0.001M from top to bottom. Dashed lines, MonteCarlo simulations; dotted lines, Poisson Boltzmann equation; solid lines, thepresent model.
FIG. 10. ~a! The salt concentration dependence of the chargeQb of thetightly bound counterions~per nucleotide! for a B-DNA oligomer of lengthL524 in @Mg21# ~upper line! and in@Na1# ~bottom line! solutions. Lines,from the present model; symbols, from the Monte Carlo simulation.~b! Thesalt concentration dependence of the total chargeQtot(Rb) of the bound ionsper nucleotide for aB-DNA oligomer of lengthL524 in @Mg21# ~upperlines! and @Na1# ~bottom lines! solutions. Solid lines, from the presentmodel; dotted lines, from the counterion condensation theory for an infinite-length DNA in @Mg21# ~upper line! and in @Na1# ~bottom line! ~Ref. 22!;dashed line, from the counterion condensation theory for an oligomer inmonovalent ionic solution~Ref. 88!; symbols, from the Monte Carlo simu-lation.
044903-13 Ion binding to a finite length polyelectrolyte J. Chem. Phys. 122, 044903 (2005)
Downloaded 11 Nov 2005 to 128.206.125.7. Redistribution subject to AIP license or copyright, see http://jcp.aip.org/jcp/copyright.jsp
We use MC simulation to obtain the radial distributionfunction Qtot
(c)(R), from which the bound radiusRb is calcu-lated. In Fig. 10~b!, we plotQtot(Rb) predicted from the MCsimulation, from the present theory, and from the CC theoryfor infinite- and finite-length polyelectrolytes. Figure 10~b!shows thatQtot(Rb) from our theory is in good agreementwith that from the MC simulation. For a finite-length poly-electrolyte, our theory and the CC theory predict qualita-tively the samec0 dependence for the bound ions. Moreover,as we expected, higher thec0 gives larger bound chargeQtot(Rb). For c0<0.01M , the CC theory overestimates thebound ion chargesQtot(Rb) because the CC results used hereare for line charge polyelectrolyte, and the line charge canenhance the counterion condensation.
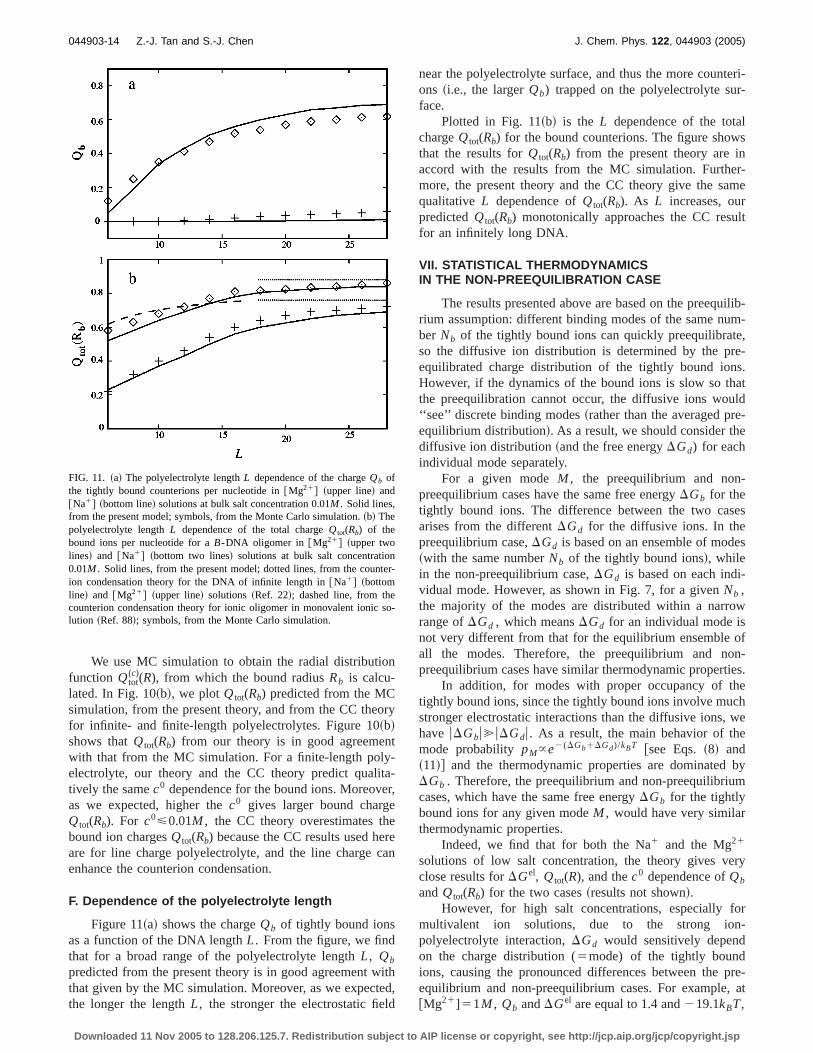
F. Dependence of the polyelectrolyte length
Figure 11~a! shows the chargeQb of tightly bound ionsas a function of the DNA lengthL. From the figure, we findthat for a broad range of the polyelectrolyte lengthL, Qb
predicted from the present theory is in good agreement withthat given by the MC simulation. Moreover, as we expected,the longer the lengthL, the stronger the electrostatic field
near the polyelectrolyte surface, and thus the more counteri-ons ~i.e., the largerQb) trapped on the polyelectrolyte sur-face.
Plotted in Fig. 11~b! is the L dependence of the totalchargeQtot(Rb) for the bound counterions. The figure showsthat the results forQtot(Rb) from the present theory are inaccord with the results from the MC simulation. Further-more, the present theory and the CC theory give the samequalitative L dependence ofQtot(Rb). As L increases, ourpredictedQtot(Rb) monotonically approaches the CC resultfor an infinitely long DNA.
VII. STATISTICAL THERMODYNAMICSIN THE NON-PREEQUILIBRATION CASE
The results presented above are based on the preequilib-rium assumption: different binding modes of the same num-ber Nb of the tightly bound ions can quickly preequilibrate,so the diffusive ion distribution is determined by the pre-equilibrated charge distribution of the tightly bound ions.However, if the dynamics of the bound ions is slow so thatthe preequilibration cannot occur, the diffusive ions would‘‘see’’ discrete binding modes~rather than the averaged pre-equilibrium distribution!. As a result, we should consider thediffusive ion distribution~and the free energyDGd) for eachindividual mode separately.
For a given modeM , the preequilibrium and non-preequilibrium cases have the same free energyDGb for thetightly bound ions. The difference between the two casesarises from the differentDGd for the diffusive ions. In thepreequilibrium case,DGd is based on an ensemble of modes~with the same numberNb of the tightly bound ions!, whilein the non-preequilibrium case,DGd is based on each indi-vidual mode. However, as shown in Fig. 7, for a givenNb ,the majority of the modes are distributed within a narrowrange ofDGd , which meansDGd for an individual mode isnot very different from that for the equilibrium ensemble ofall the modes. Therefore, the preequilibrium and non-preequilibrium cases have similar thermodynamic properties.
In addition, for modes with proper occupancy of thetightly bound ions, since the tightly bound ions involve muchstronger electrostatic interactions than the diffusive ions, wehave uDGbu@uDGdu. As a result, the main behavior of themode probabilitypM}e2(DGb1DGd)/kBT @see Eqs.~8! and~11!# and the thermodynamic properties are dominated byDGb . Therefore, the preequilibrium and non-preequilibriumcases, which have the same free energyDGb for the tightlybound ions for any given modeM , would have very similarthermodynamic properties.
Indeed, we find that for both the Na1 and the Mg21
solutions of low salt concentration, the theory gives veryclose results forDGel, Qtot(R), and thec0 dependence ofQb
andQtot(Rb) for the two cases~results not shown!.However, for high salt concentrations, especially for
multivalent ion solutions, due to the strong ion-polyelectrolyte interaction,DGd would sensitively dependon the charge distribution (5mode) of the tightly boundions, causing the pronounced differences between the pre-equilibrium and non-preequilibrium cases. For example, at@Mg21] 51M , Qb andDGel are equal to 1.4 and219.1kBT,
FIG. 11. ~a! The polyelectrolyte lengthL dependence of the chargeQb ofthe tightly bound counterions per nucleotide in@Mg21# ~upper line! and@Na1# ~bottom line! solutions at bulk salt concentration 0.01M . Solid lines,from the present model; symbols, from the Monte Carlo simulation.~b! Thepolyelectrolyte lengthL dependence of the total chargeQtot(Rb) of thebound ions per nucleotide for aB-DNA oligomer in @Mg21# ~upper twolines! and @Na1# ~bottom two lines! solutions at bulk salt concentration0.01M . Solid lines, from the present model; dotted lines, from the counter-ion condensation theory for the DNA of infinite length in@Na1# ~bottomline! and @Mg21# ~upper line! solutions ~Ref. 22!; dashed line, from thecounterion condensation theory for ionic oligomer in monovalent ionic so-lution ~Ref. 88!; symbols, from the Monte Carlo simulation.
044903-14 Z.-J. Tan and S.-J. Chen J. Chem. Phys. 122, 044903 (2005)
Downloaded 11 Nov 2005 to 128.206.125.7. Redistribution subject to AIP license or copyright, see http://jcp.aip.org/jcp/copyright.jsp
respectively, for the preequilibration case, and equal to 1.3and 221.8kBT, respectively, for the non-preequilibrationcase.
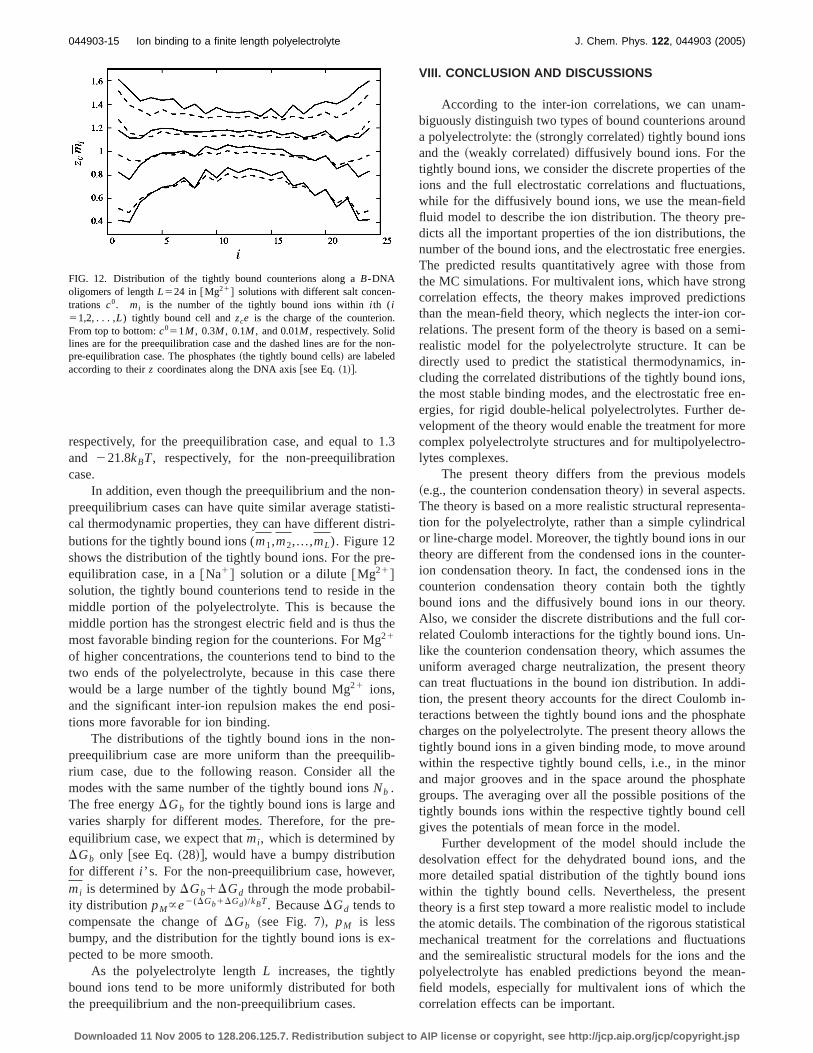
In addition, even though the preequilibrium and the non-preequilibrium cases can have quite similar average statisti-cal thermodynamic properties, they can have different distri-butions for the tightly bound ions (m1,m2,...,mL). Figure 12shows the distribution of the tightly bound ions. For the pre-equilibration case, in a@Na1# solution or a dilute@Mg21#solution, the tightly bound counterions tend to reside in themiddle portion of the polyelectrolyte. This is because themiddle portion has the strongest electric field and is thus themost favorable binding region for the counterions. For Mg21
of higher concentrations, the counterions tend to bind to thetwo ends of the polyelectrolyte, because in this case therewould be a large number of the tightly bound Mg21 ions,and the significant inter-ion repulsion makes the end posi-tions more favorable for ion binding.
The distributions of the tightly bound ions in the non-preequilibrium case are more uniform than the preequilib-rium case, due to the following reason. Consider all themodes with the same number of the tightly bound ionsNb .The free energyDGb for the tightly bound ions is large andvaries sharply for different modes. Therefore, for the pre-equilibrium case, we expect thatmi , which is determined byDGb only @see Eq.~28!#, would have a bumpy distributionfor different i ’s. For the non-preequilibrium case, however,mi is determined byDGb1DGd through the mode probabil-ity distributionpM}e2(DGb1DGd)/kBT. BecauseDGd tends tocompensate the change ofDGb ~see Fig. 7!, pM is lessbumpy, and the distribution for the tightly bound ions is ex-pected to be more smooth.
As the polyelectrolyte lengthL increases, the tightlybound ions tend to be more uniformly distributed for boththe preequilibrium and the non-preequilibrium cases.
VIII. CONCLUSION AND DISCUSSIONS
According to the inter-ion correlations, we can unam-biguously distinguish two types of bound counterions arounda polyelectrolyte: the~strongly correlated! tightly bound ionsand the~weakly correlated! diffusively bound ions. For thetightly bound ions, we consider the discrete properties of theions and the full electrostatic correlations and fluctuations,while for the diffusively bound ions, we use the mean-fieldfluid model to describe the ion distribution. The theory pre-dicts all the important properties of the ion distributions, thenumber of the bound ions, and the electrostatic free energies.The predicted results quantitatively agree with those fromthe MC simulations. For multivalent ions, which have strongcorrelation effects, the theory makes improved predictionsthan the mean-field theory, which neglects the inter-ion cor-relations. The present form of the theory is based on a semi-realistic model for the polyelectrolyte structure. It can bedirectly used to predict the statistical thermodynamics, in-cluding the correlated distributions of the tightly bound ions,the most stable binding modes, and the electrostatic free en-ergies, for rigid double-helical polyelectrolytes. Further de-velopment of the theory would enable the treatment for morecomplex polyelectrolyte structures and for multipolyelectro-lytes complexes.
The present theory differs from the previous models~e.g., the counterion condensation theory! in several aspects.The theory is based on a more realistic structural representa-tion for the polyelectrolyte, rather than a simple cylindricalor line-charge model. Moreover, the tightly bound ions in ourtheory are different from the condensed ions in the counter-ion condensation theory. In fact, the condensed ions in thecounterion condensation theory contain both the tightlybound ions and the diffusively bound ions in our theory.Also, we consider the discrete distributions and the full cor-related Coulomb interactions for the tightly bound ions. Un-like the counterion condensation theory, which assumes theuniform averaged charge neutralization, the present theorycan treat fluctuations in the bound ion distribution. In addi-tion, the present theory accounts for the direct Coulomb in-teractions between the tightly bound ions and the phosphatecharges on the polyelectrolyte. The present theory allows thetightly bound ions in a given binding mode, to move aroundwithin the respective tightly bound cells, i.e., in the minorand major grooves and in the space around the phosphategroups. The averaging over all the possible positions of thetightly bounds ions within the respective tightly bound cellgives the potentials of mean force in the model.
Further development of the model should include thedesolvation effect for the dehydrated bound ions, and themore detailed spatial distribution of the tightly bound ionswithin the tightly bound cells. Nevertheless, the presenttheory is a first step toward a more realistic model to includethe atomic details. The combination of the rigorous statisticalmechanical treatment for the correlations and fluctuationsand the semirealistic structural models for the ions and thepolyelectrolyte has enabled predictions beyond the mean-field models, especially for multivalent ions of which thecorrelation effects can be important.
FIG. 12. Distribution of the tightly bound counterions along aB-DNAoligomers of lengthL524 in @Mg21# solutions with different salt concen-trations c0. mi is the number of the tightly bound ions withini th (i51,2,. . . ,L) tightly bound cell andzce is the charge of the counterion.From top to bottom:c051M , 0.3M , 0.1M , and 0.01M , respectively. Solidlines are for the preequilibration case and the dashed lines are for the non-pre-equilibration case. The phosphates~the tightly bound cells! are labeledaccording to theirz coordinates along the DNA axis@see Eq.~1!#.
044903-15 Ion binding to a finite length polyelectrolyte J. Chem. Phys. 122, 044903 (2005)
Downloaded 11 Nov 2005 to 128.206.125.7. Redistribution subject to AIP license or copyright, see http://jcp.aip.org/jcp/copyright.jsp

ACKNOWLEDGMENTS
The authors are grateful to Dr. Dirk Stigter and Dr. Ger-ald Manning for stimulating communications. This researchwas supported by NIH/NIGMS through Grant No.GM063732 and by the Molecular Biology Program at theUniversity of Missouri-Columbia.
1J. Conrad, M. Troll, and B. H. Zimm, Biopolymers27, 1711~1988!.2M. Gueron and G. Weisbuch, Biopolymers19, 353 ~1980!.3I. Rouzina and V. A. Bloomfield, J. Phys. Chem.100, 9977~1996!.4I. Rouzina and V. A. Bloomfield, Biophys. J.74, 3152~1998!.5E. L. Pollock and J. P. Hansen, Phys. Rev. A8, 3110~1973!.6W. Slattery, G. Doolen, and H. Dewitt, Phys. Rev. A21, 2087~1980!.7S. Ichimaru, H. Iyetomi, and S. Tanaka, Phys. Rep.149, 91 ~1987!.8S. Q. He, P. G. Arscott, and V. A. Bloomfield, Biopolymers53, 329~2000!.
9V. A. Bloomfield, Biopolymers44, 269 ~1997!.10Y. Levin, J. J. Arenzon, and J. F. Stilck, Phys. Rev. Lett.83, 2680~1999!.11R. Das, L. W. Kwok, I. S. Millettet al., J. Mol. Biol. 332, 311 ~2003!.12X. Fang, T. Pan, and T. R. Sosnick, Biochemistry38, 16840~1999!.13S. L. Heilman-Miller, D. Thirumalai, and S. A. Woodson, J. Mol. Biol.
306, 1157~2001!.14S. L. Heilman-Miller, J. Pan, D. Thirumalai, and S. A. Woodson, J. Mol.
Biol. 309, 57 ~2001!.15M. S. Rook, D. K. Treiber, and J. R. Williamson, Proc. Natl. Acad. Sci.
U.S.A. 96, 12471~1999!.16B. Y. Ha and D. Thirumalai, J. Phys. II7, 887 ~1997!.17B. Y. Ha and D. Thirumalai, Macromolecules36, 9658~2003!.18B. Y. Ha and A. J. Liu, Phys. Rev. Lett.79, 1289~1997!.19M. O. De la Cruz, L. Benolli, M. Delsanti, J. P. Daliez, O. Spalla, and M.
Driford, J. Chem. Phys.103, 5781~1995!.20J. J. Arenzon, J. F. Stilck, and Y. Levin, Eur. Phys. J. B12, 79 ~1999!.21M. Muthukumar, J. Chem. Phys.120, 9343~2004!.22G. S. Manning, Q. Rev. Biophys.2, 179 ~1978!.23M. K. Gilson, K. A. Sharp, and B. Honig, J. Comput. Chem.9, 327
~1987!.24K. A. Sharp and B. Honig, J. Phys. Chem.94, 7684~1990!.25A. Nicholls and B. J. Honig, J. Comput. Chem.12, 435 ~1991!.26J. A. Grant, B. T. Pickup, and A. Nicholls, J. Comput. Chem.22, 608
~2001!.27T. J. You and S. C. Harvey, J. Comput. Chem.14, 484 ~1993!.28D. Sept, N. A. Baker, and J. A. McCammon, Protein Sci.12, 2257~2003!.29N. A. Baker, D. Sept, S. Joseph, M. J. Holst, and J. A. McCammon, Proc.
Natl. Acad. Sci. U.S.A.98, 10037~2000!.30P. Mills, C. F. Anderson, and M. T. Record, Jr., J. Phys. Chem.89, 3984
~1985!.31D. H. Ermak and J. A. McCammon, J. Chem. Phys.69, 1352~1978!.32R. Bacquet and P. J. Rossky, J. Phys. Chem.88, 2660~1984!.33V. Vlachy, Annu. Rev. Phys. Chem.50, 145 ~1999!.34J. C. G. Montoro and J. L. F. Abascal, J. Chem. Phys.103, 8273~1995!.35E. Allahyarov, H. Lowen, and G. Gompper, Phys. Rev. E68, 061903
~2003!.36S. Arnott and D. W. L. Hukins, Biochem. Biophys. Res. Commun.47,
1504 ~1972!.37M. Marcus,Ion Solvation~Wiley, Great Britain, 1985!.38F. A. Lindemann, Z. Phys.11, 609 ~1910!.39Y. Zhou, M. Karplus, K. D. Ball, and R. S. Berry, J. Chem. Phys.116,
2323 ~2002!.40T. M. Truskett, S. Torquato, S. Sastry, P. G. Debenedetti, and F. H. Still-
inger, Phys. Rev. E58, 3083~1998!.41J. Th. G. Overbeek, Colloids Surf.51, 61 ~1990!.42D. Stigter, Biophys. J.69, 380 ~1995!.43I. Klapper, R. Hagstrom, R. Fine, K. Sharp, and B. Honig, Proteins1, 47
~1986!.
44G. Lamm and G. R. Pack, J. Phys. Chem. B101, 959 ~1997!.45G. Lamm and G. R. Pack, Int. J. Quantum Chem.65, 1087~1997!.46Z. Xiang, Y. Shi, and Y. Xu, J. Comput. Chem.16, 200 ~1995!.47S. W. Chen and B. Honig, J. Phys. Chem. B101, 9113~1997!.48B. E. Hingerty, R. H. Ritchie, T. L. Ferrell, and J. E. Turner, Biopolymers
24, 427 ~1985!.49M. A. Young, B. Jayaram, and D. L. Beveridge, J. Phys. Chem. B102,
7666 ~1998!.50J. Ramstein and R. Lavery, Proc. Natl. Acad. Sci. U.S.A.85, 7231~1988!.51M. O. Fenley, G. S. Manning, and W. K. Olson, Biopolymers30, 1191
~1990!.52L. Wang, B. E. Hingerty, A. R. Srinivasan, W. K. Olson, and S. Broyde,
Biophys. J.83, 382 ~2002!.53S. Ehrenson, J. Comput. Chem.10, 77 ~1989!.54S. A. Hassan, F. Guarnieri, and E. L. Mehler, J. Phys. Chem. B104, 6478
~2000!.55M. T. Troll, D. Roitman, J. Conrad, and B. H. Zimm, Macromolecules19,
1186 ~1986!.56J. Skolnick and M. Fixman, Macromolecules11, 867 ~1978!.57D. Stigter, Biopolymers46, 503 ~1998!.58B. Jayaram, K. A. Sharp, and B. Honig, Biopolymers28, 975 ~1989!.59S. Gavryushov and P. Zielenkiewicz, J. Phys. Chem. B101, 792 ~1997!.60S. Gavryushov and P. Zielenkiewicz, Biophys. J.575, 2732~1998!.61J. J. Dwyer, A. G. Gittis, D. A. Karp, E. E. Lattman, D. S. Spencer, W. E.
Stites, and B. Garcı´a-Moreno, Biophys. J.79, 1610~2000!.62K. K. Lee, C. A. Fitch, and B. Garcı´a-Moren, Protein Sci.11, 1004~2002!.63D. S. Cerutti, C. F. Wong, and J. A. McCammon, Biopolymers70, 391
~2003!.64J. Antosiewicz, J. A. McCammon, and M. K. Gilson, J. Mol. Biol.238,
415 ~1994!.65M. Le Bret and B. H. Zimm, Biopolymers23, 271 ~1984!.66M. C. Olmsted, C. F. Anderson, and M. T. Record, Jr., Proc. Natl. Acad.
Sci. U.S.A.86, 7766~1989!.67B. Jayaram, S. Swaminathan, D. L. Beveridge, K. Sharp, and B. Honig,
Macromolecules23, 3156~1990!.68J. L. F. Abascal and J. C. G. Montoro, J. Chem. Phys.114, 4277~2001!.69M. Feig and B. M. Pettitt, Biophys. J.77, 1769~1999!.70A. P. Lyubartsev and A. Laaksonen, J. Biomol. Struct. Dyn.16, 579
~1998!.71L. E. Guldbrand, T. R. Forester, and R. M. Lynden-Bell, Mol. Phys.67,
473 ~1989!.72A. D. MacKerell, Jr., J. Phys. Chem. B101, 646 ~1997!.73N. V. Hud and M. Polak, Curr. Opin. Struct. Biol.11, 293 ~2001!.74V. A. Makarov, M. Feig, B. K. Andrews, and B. M. Pettitt, Biophys. J.75,
150 ~1998!.75L. Kotin and M. Nagasawa, J. Chem. Phys.36, 873 ~1962!.76I. A. Shkel, O. V. Tsodikov, and M. T. Record, Jr., J. Phys. Chem. B104,
5161 ~2000!.77M. Fixman, J. Chem. Phys.70, 4995~1979!.78V. K. Misra and D. E. Draper, J. Mol. Biol.299, 813 ~2000!.79V. K. Misra and D. E. Draper, Proc. Natl. Acad. Sci. U.S.A.98, 12456
~2001!.80L. B. Bhuiyan, C. W. Outhwaite, and D. Bratko, Chem. Phys. Lett.193,
203 ~1992!.81D. Bratko and V. Vlachy, Chem. Phys. Lett.90, 434 ~1982!.82M. Deserno, C. Holm, and S. May, Macromolecules33, 199 ~2000!.83A. Y. Grosberg, T. T. Nguyen, and B. I. Shklovskii, Rev. Mod. Phys.74,
329 ~2002!.84R. Messina, C. Holm, and K. Kremer, Phys. Rev. Lett.85, 872 ~2000!.85M. Le Bret and B. H. Zimm, Biopolymers23, 287 ~1984!.86G. R. Pack, L. Wong, and G. Lamm, Biopolymers49, 575 ~1999!.87H. Qian and J. A. Schellman, J. Phys. Chem. B104, 11528~2000!.88G. S. Manning and U. Mohanty, Physica A247, 196 ~1997!.
044903-16 Z.-J. Tan and S.-J. Chen J. Chem. Phys. 122, 044903 (2005)
Downloaded 11 Nov 2005 to 128.206.125.7. Redistribution subject to AIP license or copyright, see http://jcp.aip.org/jcp/copyright.jsp