electrophoretic profile of the general …eprints.cmfri.org.in/11022/1/abinash padhi.pdf ·...
TRANSCRIPT
ELECTROPHORETIC PROFILE OF THE GENERAL PROTEINS IN THE GREEN
(Perna viridis Linnaeus) AND THE BROWN {Perna indica Kuriakose & Nair) MUSSELS
DISSERTATION SUBMTTED IN PARTIAL FULFILMENT OF THE REQUIREMENTS
FOR THE DEGREE OF MASTER OF FISHERIES SCIENCE
IN MARI CULTURE OF THE CENTRAL INSTITUTE OF FISHERIES EDUCATION
(DEEMED UNIVERSITY)VERSOVA, MUMBAI - 4 0 0 061
r. rr* stwt*tnstitut#
TrT) By,_.n :„ p H fT' ’
in a s h ‘P J B u
r #*<*»*-'-»n«>iuifb waosM
* * *<iotvum** . .S i -------
MFp angq AICAR. •»
INDIAN COUNCIL O F AGRICULTURAL RESEA RC H CEN TR A L MARINE FISH ER IE S R E SE A R C H INSTITUTE
P .B . NO. 1 6 0 3 , KOCHI - 6 8 2 0 1 4 INDIA
JULY 1 9 9 8

< J & e M c a t e J t o
p .
m y
a r e n t s
D E C L A R A T I O N
I hereby declare that this dissertation entitled “ Electrophoretic Profile of
the general proteins in the G reen (Perna viridis L innaeus) and the Brown
(Perna indica K uriakose & N air) mussels” has not previously formed the basis
for the award o f any degree, diploma, associateship, fellowship or other similar
titles or recognition.
Kochi
July, 1998 ABINASH PADHI
CERTIFICATE
Certified that the dissertation entitled “Electrophoretic profile of the
general proteins in the Green (Perna viridis Linnaeus) and the brown {Perna indica Kuriakose & Nair) mussels” is a bonafide record o f the work carried out
by Mr. Abinash Padhi under my guidance and supervision and that no part thereof
has been presented for the award o f any other degree, diploma or any other similar
Major Advisor
Kochi, July, 1998.
Dr. M.K. George, M.Sc, PhDSenior Scientist, PNPDCentral Marine Fisheries Research InstituteDr. Salim Ali RoadKochi -6 8 2 014

ADVISORY COMMITTEE
1. Chairman and Major Advisor
Dr. M.K. George, M.Sc, PhD Senior Scientist, PNPD C.M.F.R.I.
2. .Co-chairman
Shri. T.S.Velayudhan, M.Sc Senior Scientist, MFD C.M.F.R.I.
3. Member
Dr. (Mrs) Manpal Sridhar, M.Sc, PhD J fa,ASenior Scientist, PNPD 3 / % j °\ &C.M.F.R.I.
^ H i *l
ftt m tft.faRfew srtr -qn "*?Tf % 1nD -5 0
TTi rrfrT <if^ur i tr t t ttt m | %i eft'fa ft fey
3TTT tf.g f& W % g t^ T 3TR ?7^5T^T y H l j ^ (THT.^t. TR) qT
^c tttt % 1 3 p p h £ ^ f t p r r ^rrfrRrt ^ 3 fk m r w r
m1m»I§3 ?PfFT y q $ 3 C TJ 3T?77T % I -HlPl4l % fafosr 3FF # ^
f rf%rr g t ^ r g ) ^ o 5 : w t 3 ^ ^ r f w % s rfe sp JT spt% ^
1 q ^ r r ? r r #5 3fr? *fajr ^rrfFr ^ r g t ^ r
w f \ «n; 1% 'Mtt 3 fk m * ^ n f r m '4t 1 3 r n
ffaT % ?TSli?rT jTrfrTsff 3W?5 if 3Tf7TT 3T ^ -HlfrT Tf ^
=Hfrt=t3 3 ^ IJRfqq f Ic
^ rrM r 3 ttt h h IIh w $t ^ i M
W ?o5TTT 3TT^Rrmjt 3 T ^ R ift 3 W R 3FRFT IPT^T ^T T % I* .0 ,n v*>
7 V

ABSTRACT
The electrophoretic profiles o f the general proteins and the selected enzymes (MDH and EST) were examined in the green mussel, P. viridis and the brown
mussel P. indica and their suspected hybrids from South India. The protein and
the enzyme profiles were distinctly different in the two species. The protein
profiles in different tissues o f the green and brown mussels were found tissue and
species specific. The two species are genetically different. The protein and the
enzyme profiles in the brown and suspected ‘brown type’ hybrids were similar and
that o f the green and the suspected ‘green type’ hybrids were also similar. The
suspected hybrids may be the colour morphs o f the respective species.
Morphometric studies on these two species and the suspected hybrids also
corroborated the above findings.
v
ACKNOWLEDGEMENTSI express my deep sense o f gratitude to Dr. M.K. George, Senior
Scientist, C.M.F.R.I, Kochi and Major Advisor, for his constant help and in giving
me the sumptuous guidance for structuring a proper plan o f work, which infallibly
assisted in completing my work in due time.
I am obliged to our adorable Director, Dr. M. Devaraj for providing me
necessary facilities for my study.
I remain deeply indebted to Dr. C. Suseelan, Senior Scientist and Officer
in-charge, PGPM, for his constant encouragement and co-operation during my
course work.
I acknowledge my deep sense o f gratitude to Shri T S. Velaudhyan and
Dr. (Mrs) Manpal Sridhar, Senior Scientists, members o f Advisory committee, for
their help and inspiration during my dissertation work.
I am rendering my sincere gratitude to Dr. P C Thomas, Senior Scientist, CMFR1,
Dr. A. Gopal krishnan, Senior Scientist NBFGR Kochi unit, Dr. K.K. Appukutan,
Senior Scientist, Mrs V. Kripa, Scientist, CMFRI, Dr. P S Kuriakose, Principal
Scientist, and OIC , Calicut Research Centre o f CMFRI and Dr. G.P.K. Acharya,
Senior Scientist, Vizhinjam Research centre o f CMFRI for their help and
encouragement.
Timely help rendered by Shri T V. Sathianandan and Shri. K.N. Kurup, Scientists
in statistical analysis are gratefully acknowledged.
My special thanks to Mr P.M. Aboobekar, Technical officer, PGPM for his kind
co-operation during my course work. 1 also extend my thanks to Mr. Andrew
Mathew, Mr. K.T. Thomas, Vizhinjam and Mr. V.G. Surendranathan, Calicut,
research centres o f CMFRI, Technical officers and supporting staff Mr. P.
Harshakumar for helping me during specimen collection. 1 am thankful to Mr. K.
Raghavan for his help in taking photographs.
I remain deeply indebted to Miss. Bindhu Paul and Miss. V. Sapna,
SRF’s, without whom it would have not possible to complete my work within the
stipulated time. Their constant help and encouragement made me to carryout this
work..
I convey my sincere gratitude to Mr M M Shirdhenkar and Mr. V.
Terrence Rebello, PhD scholars, for their constant help and valuable suggestion
throughout my study period. 1 also thank Mr. M.P Paulton, Technical Assistant
for his timely help and to my friend Mr. S. Prasanth for his hearty co-operation and
in giving me moral support during my work
I wish to thank my batchmates especially Tushara, Bindhu, Raihanathu,
Smitha, Krishna, Gajanan, Kantian, Rajesh and to my Junior Sandeep for their
ready and untiring help.

1 express my heartfelt thanks to my seniors, Binaya Bhai and Bhuyan Bhai
for sending me the chemicals and references. I am also thankful to Ms. Jeeja Sudhir, Ram’s Computech, Mamangalam for her help in desk top publishing o f my
dissertation.
I owe a lot to ICAR for awarding me Junior Research Fellowship during
my study period.
Last but not least, I also thank all the authors and publishers whose
books, Journals and articles were used for the preparation o f this dissertation.
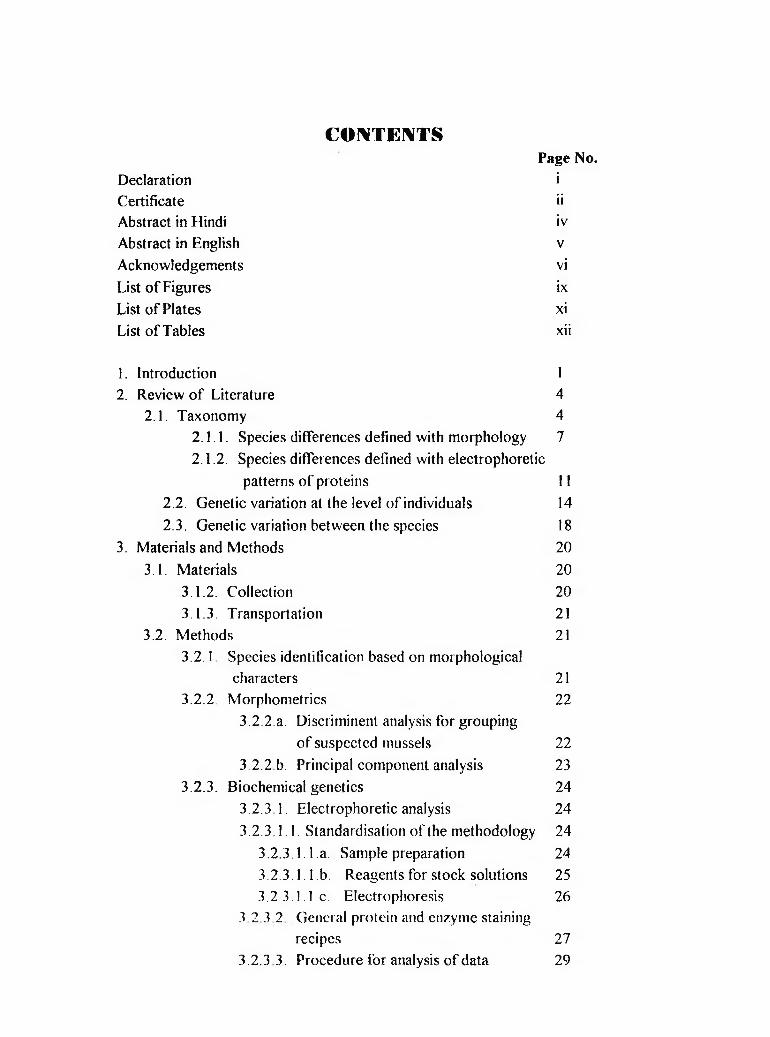
C O N T E N T SPage No.
Declaration iCertificate iiAbstract in Hindi ivAbstract in English vAcknowledgements viList o f Figures ixList o f Plates xiList o f Tables xii
1. Introduction 12. Review o f Literature 4
2.1. Taxonomy 42.1.1. Species differences defined with morphology 72.1.2. Species differences defined with electrophoretic
patterns o f proteins 112.2. Genetic variation at the level of individuals 142.3. Genetic variation between the species 18
3. Materials and Methods 203.1. Materials 20
3.1.2. Collection 203.1.3. Transportation 21
3.2. Methods 213.2.1 Species identification based on morphological
characters 2 13.2.2 Morphometries 22
3.2 2.a. Discriminent analysis for groupingo f suspected mussels 22
3 2.2 b. Principal component analysis 233.2.3. Biochemical genetics 24
3.2.3 1. Electrophoretic analysis 243 2 3 I I Standardisation o f the methodology 24
3.2.3 .1.1.a. Sample preparation 243.2.3.1.1.b. Reagents for stock solutions 253.2.3.1. I .e. Electrophoresis 26
3 2 3 2 General protein and enzyme stainingrecipes 27
3.2.3 3. Procedure for analysis o f data 29
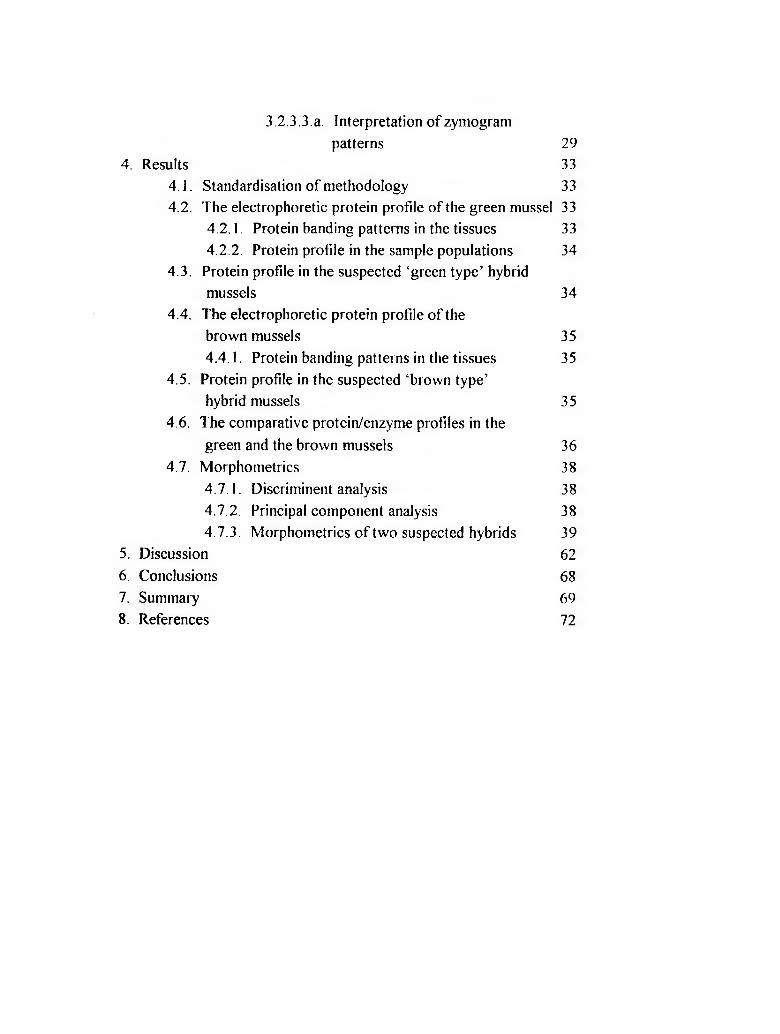
3.2.3.3.a. Interpretation o f zymogrampatterns 29
4. Results 334.1. Standardisation o f methodology 334.2. The electrophoretic protein profile o f the green mussel 33
4.2.1. Protein banding patterns in the tissues 334.2.2. Protein profile in the sample populations 34
4.3. Protein profile in the suspected ‘green type’ hybridmussels 34
4.4. The electrophoretic protein profile o f thebrown mussels 354.4.1. Protein banding patterns in the tissues 35
4.5. Protein profile in the suspected ‘brown type’hybrid mussels 35
4.6. The comparative protein/enzyme profiles in thegreen and the brown mussels 36
4.7. Morphometries 384.7.1. Discriminent analysis 384.7.2. Principal component analysis 384.7.3. Morphometries o f two suspected hybrids 39
5. Discussion 626. Conclusions 687. Summary 698. References 72
LIST OF FIGURES Figure No Page No
1. Distribution o f P. viridis and P.indica alongthe Indian coasts 3
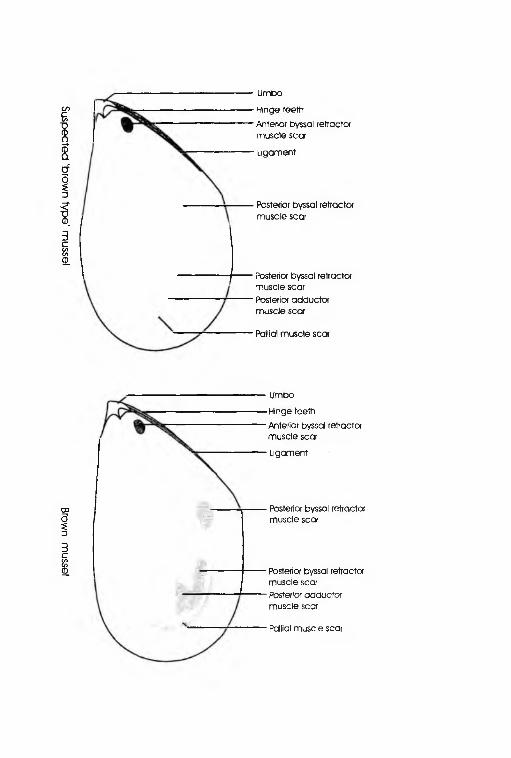
2. Collection sites for P. viridis and P. Indica 203. Various morphometric measurements observed 224. Internal view of right valve o f mussels showing
mussel impressions, ligament and hinge teeth 215. Principal component analysis to know the
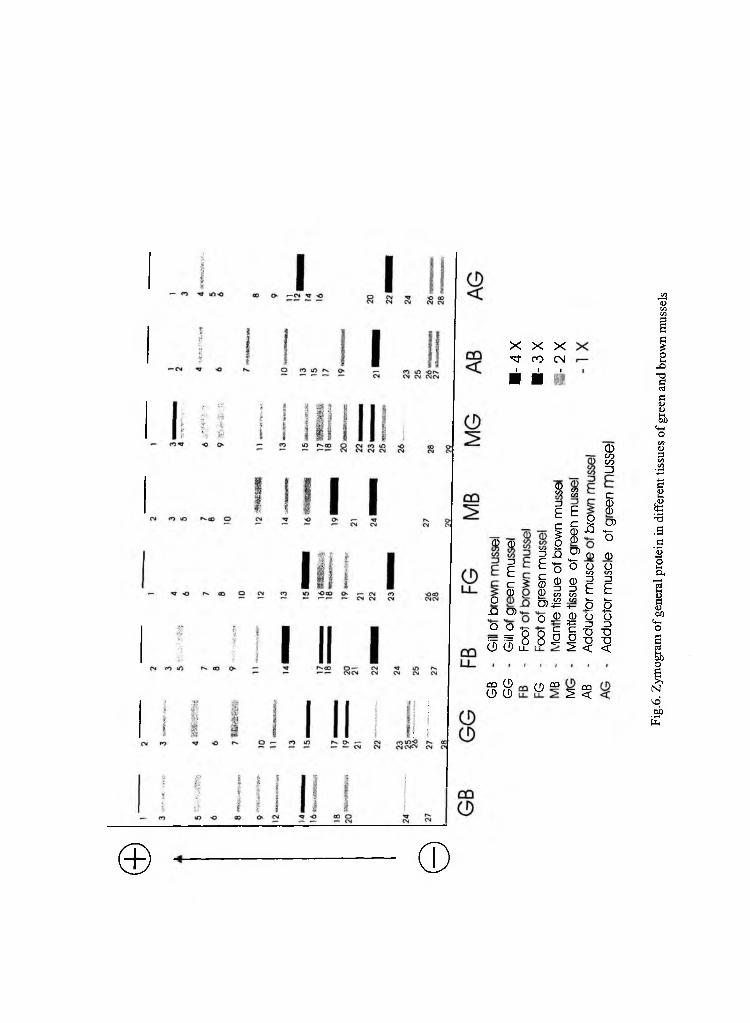
geographical differences among the green mussels. 386. Zymogram of general proteins in different tissues
o f green and brown mussels. 337. Zymogram o f general proteins in different tissues
o f green, brown and suspected ‘brown type’hybrid mussels. 33
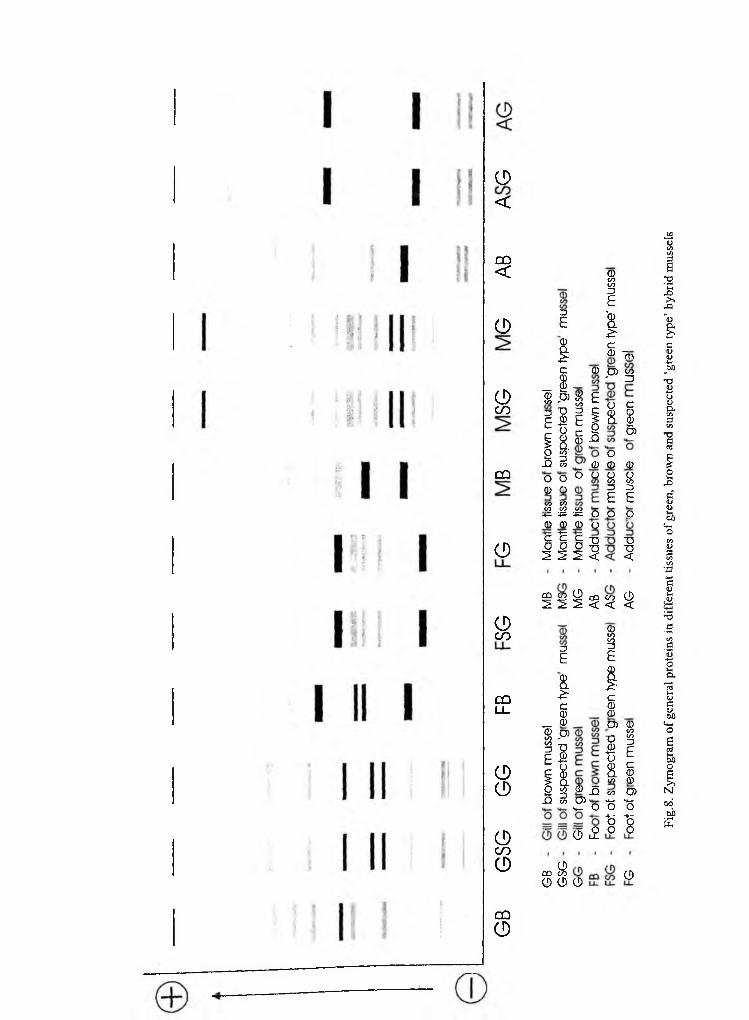
8. Zymogram o f general proteins in different tissues o fgreen, brown and suspected ‘green type’ hybrid mussels. 34
9. Zymogram of the esterase enzyme profile in the adductor muscle o f the green, brown and suspected ‘brown type’ hybrid mussels 35
10. Zymogram o f the MDH enzyme profiles in theadductor muscle of the green, brown and suspected brown type hybrid mussels 35
11. Zymogram of the esterase enzyme profiles in the mantletissue o f the green, brown and suspected ‘brown type’ hybrid mussels 35
12. Zymogram of the esterase enzyme profiles in the gilltissue o f the green, brown and suspected browntype hybrid mussels. 35
IX

Plate No.1. Green mussel (Perna viridis)2. Brown mussel (Perna indica)3. Suspected ‘ brown type’ hybrid4. Suspected ‘green type’ hybrid5. Species specific protein profiles in different tissues
o f green and brown mussels6. General protein profiles in different tissues o f green,
brown and ‘brown type’ hybrid mussels7. The general protein profiles in the green and ‘green
type’ hybrid mussels8. The esterase enzyme profiles o f the adductor
muscle in the green, brown and ‘brown type’ hybrid mussels
9. The esterase enzyme profiles o f the gill in the green,brown and ‘brown type’ hybrid mussels.
10. The MDH enzyme profiles in the green, brownand ‘brown type’ hybrid mussels.
11. The general protein profiles in the green musselsamples.
LIST OF PLATESPage No.
20
20
20
20
33
33
34
34
35
35
35
Table No.1. Diagnostic characters separating species of
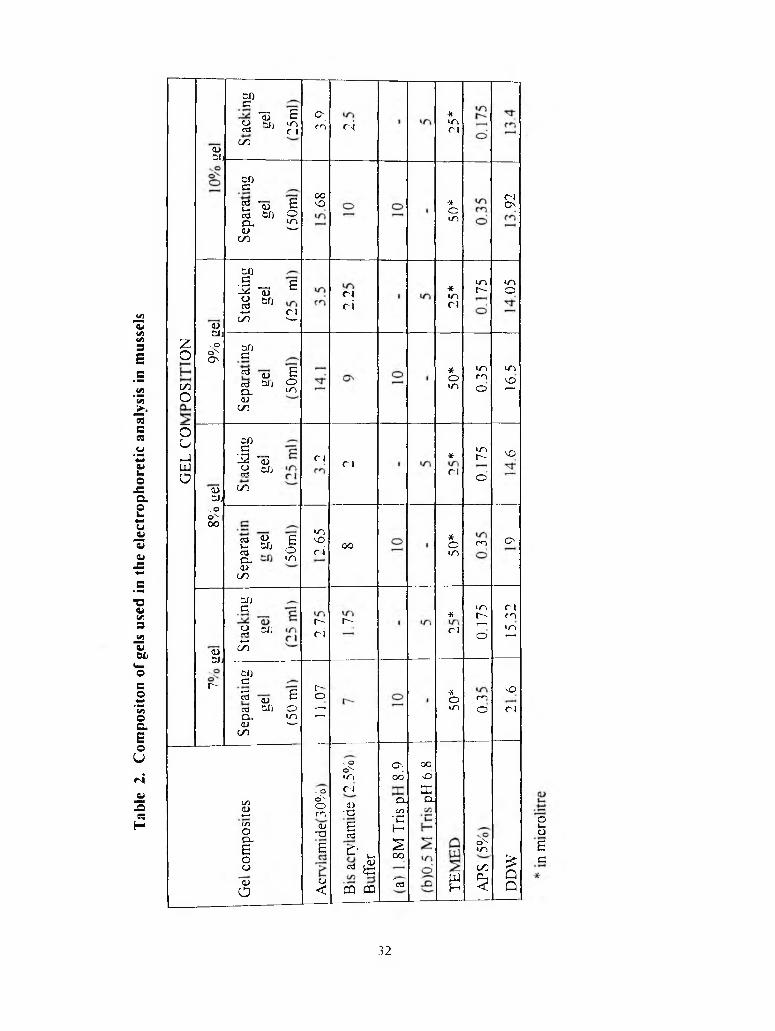
Verna2. Composition o f gels used in the electrophoretic
analysis in mussels3. Diagnostic characters o f two suspected hybrid mussels.4. Morphometric measurements o f the green, brown
and suspected hybrid mussels collected from different regions
5. Results o f principal component analysis6. Results o f discriminent analysis for grouping
of green and brown mussels.7. Results o f discriminent analysis for suspected
hybrid mussels.8. Staining intensity and thickness o f esterase
bands in different tissues o f green, brown and ‘brown type’ hybrid mussels
9. Staining intensity and thickness o f MDH bands inthe adductor muscle o f the green, brown and suspected ‘brown type’ hybrid mussels.
10. Staining intensity and thickness o f general proteinsbands in different tissues o f the green, brown and suspected ‘brown type’ hybrid mussels
11. Staining intensity and thickness o f general proteinbands in different tissues o f green, brown and suspected ‘green type’ hybrid mussels
12. Staining intensity and thickness o f genera! proteinbands in mantle tissues o f green mussels from different regions.
LIST OF TABLESPage No
31
3240
4146
48
54
56
57
58
60
61


Mussels o f the family Mytilidae are the commonest o f marine molluscs, and
constitute an important element in the ecology of coastal waters. Mussel meat is
nutritious and good to eat. The mussel resources are exploited from their natural
beds. Mussels are also cultured in many nations including India. As they are
sessile filter feeders and have been shown to be effective concentrators o f trace
toxic substances, mussels are now being widely used as biomonitoring organisms
for coastal water quality. They have been extensively used as model organisms in
many scientific studies and a vast body o f data is available from basic physiological,
biochemical, genetic and toxicological investigations.( Gosling, 1992a)
Four hundred species o f Myfilus and seventy one species of Verna are known
to occur under the family Mytilidae. Since, many o f these species have confusing
common morphological characteristics, accurate classification and identification of
mussel species is a practical problem to the taxonomists and the biologists (Siddall,
1980). For example, until recently, the mussels o f India, popularly known as the
green and brown mussels, were classified and described under the genus Mytihis where as these mussels were redescribed and put under the genus Verna. Thus
the green mussel was described as Verna viridis where as the brown mussel was
described and classified as a new species with the name, Verna indica (Kuriakose
& Nair, 1976). A detailed account on the fishery and biology of the Indian green
and brown mussels as well as their culture potential have been reported by CMFRI
( CMFRI Bulletin 29) and during the national seminar on the shell resources and
farming in 1987 (CMFR1 Bulletin 42, 1988) The green and brown mussels have
distribution along the east and west coasts o f India (Fig. 1).
For scientific exploitation, farming and conservation o f any fishery resouses,
an accurate identification o f the species and its populations is essential ( Allendorf
el a/., 1987). The recent identification o f the green and brown mussels o f India
was done on the basis o f morphological phenotypes which can be influenced by the
ecological and environmental parameters. However, gene controlled protein
profiles o f organisms are very valuable characteristics for accurate identification of
the species and its populations, since protein / enzyme characteristics are much
less influenced by the non -genetic parameters (Bye & Ponniah, 1983). Thus the
biochemical genetic description o f the species is more accurate and dependable.
Besides, the detectable genetic differences can become complementary to the
morphological differences already used for identification o f the species. In this
respect, the question arises that whether the morphologically described green
mussel P. viridis and the brown mussel P indica are also genetically different
species? Moreover , the mussel specimens with apparent mixed morphological
characteristics were observed along with the green and brown mussels. These were
suspected as varieties/hybrids o f the green and brown mussels. These are two
types. For practical purpose, one was labelled as ‘brown type’ hybrid as it had
brown mussel shell shape but with green shell colour. The other ‘green type’
hybrid had green mussel shell shape but with brown/green shell colour. Are these
specimens hybrids or varieties o f the green and brown mussels? The aim o f the
2

present study was to find out answers to the above questions. In the present study,
morphometries o f these two species not considered by earlier workers (Kuriakose
and Nair, 1976) were also used for obtaining additional informations on the
morphological differences of the species. The dissertation contains the results of
the present investigation on the protein profiles and morphometries o f the green
and brown mussels o f India as well as their suspected hybrids.
3

72° 76° 80° 84° 88°
o p viridis
V° p indica
J 1 r 4 -
/S o
ro o o j 1/1o )\
20°
1 6 ° -io \
\
(s''*r"^
\16°
o \ J 10 O)
12° □ o \°\V
12°
□ o'J a ^
i(o □
8° - ? u - 8°a . OO □
□
“ T .. ..1....~ T ----- “ t -..“ .... V ...J
72° o 0 oo o o CO ■C*. o 00 00 o
Fig. 1. Distribution o f P viridis and P indica along the Indian coast

e v i e i v o f < = > L ^ ife r a tn r e

2.1 TAXONOMY
Invertebrates generally have higher level of genetic diversity than vertebrates
as measured by protein electrophoresis (Nevo, 1978). The Mytilidae or true
mussels, demonstrate a great deal o f variation in morphological features which are
taxonomically important in the Bivalvia . Thus the taxonomic status o f species
within the Mytilidae is often confused. For want o f reliable morphological features
by which to distinguish species and genera, the inconsistent or ‘plastic’ character o f
gross adult shell morphology has, in the past, shaped the family’s hierarchy. The
existence o f physiological races and a wide range o f eco-morphs in the Mytilidae
has also complicated the interpretation o f experimental evidence and created a
taxonomic challenge for the researcher working with mytilids. (Siddall, 1980).
In 1932, the rosters o f Index Animalium reported on the use o f
approximately 400 different species names in the genus Mylilus and another 71
names in the genus Pern a (Siddall, 1980). Unfortunately, the name Perna had
been used to describe two genera o f mytilids, Perna (Retzius, 1788) and Modiolus (H and A. A Dams, 1858) and a genus of Pteriacea, Isognomon (Bruguiere, 1792).
When Retzius (1788) set forth the genus Perna, he listed the type specimen as
Perna tnagellanica which according to Lamy (1936-1937) is synonymous with
Linnaeus Mya perna and whose holotype was presumably collected from the straits
of Magellan. Both are properly referred to as Perna perna (Lamy 1936-37). P magellanica as described by Retzius must not be confused with Mylilus
4

magellanicus Chemnitz which, as Soot-Ryen (1955) details, probably belongs to the genus Aulacomyci.
Linnaeus (1758) first described M viridis while Gmelin (1791) is credited for
M canaliculus. The several works o f Born, Chemnitz, Dillwyn, Gmelin and
Lamarck expanded the list of species in the genus Perna but Hanley (1843, 1855)
temporarily reversed this trend by lumping together several species. In Hanley’s work (1843) the synonymy o f M viridis L. and M smaragdinus Chemnitz was
described as was the synonymy between M canaliculus Gmelin and M laius Chemnitz..
Von Ihering (1901, 1907) and Jukes-Browne (1905) discussed hinge and
ligament structures and muscle scars as bases for establishing the taxonomic
hierarchy o f the Mytilidae This work laid the foundation for Lamy’s (1936-1937)
analysis o f museum specimens involving both the genera Mylilus and Verna. I he
confused taxonomic interrelationships involving Mylilus and Perna, which
developed in the 19th century were simplified by Lamys comprehensive works
followed by those o f Soot- Ryen (1952, 1955). Dodge (1952) regarded
Chloromya as a sub genus Mylilus. In 1952. Soot-Ryen divided the genus Perna into two groups (1) those having pitted resilial ridge belonging to the genus
Chloromya and (2) having a compact resilial ridge forming a new genus
Choromylilus with the genotype C chorus Molina 1782. Soot-Ryen (1955)
showed Chloromya to be an invalid synonym for Perna and clarified much o f the

taxonomic nomenclature o f the mytiiids by retaining Perna (Retzius, 1788) for
those species o f mytiiids resembling Mylilus but which have a pitted resilial ridge
and discontinuous posterior retractor muscle scars and lack an anterior adductor
muscle. Dance (1974) placed C chorus Molina in the genus Perm but gave no
new evidence supporting this change. The close taxonomic relationship among the genera Mylilus, Perna, Choromyiilus and Auktcomya are briefly described by
Soot-Ryen (1952). Siddall (1980) described several larval and adult characteristics
of the three living species currently placed in the genus Perna (P perna, P viridis and P canaliculus)
Lamy (1936) recognized the following as distinct species of Mylilus: Mylilus edulis Linnaeus, 1758 from Northern temperate latitudes, Mylilus galloprovincialis Lamarck, 1819 from the Mediterranean sea, Mylilus irossnlus Gould, 1850 from the pacific coast o f North America, Mylilus chilensis Hupe,
1854 from Chile, Mylilus phitensis Orbigny, 1846 from Argentina, Mylilus planulalus Lamarck, 1819 from Australia and Myhlus desolalionis Lamy, 1936
from the Kerguelen Island Soot-Ryen (1955) recognised. Mylilus comsms Gould, 1861 (= M crassitesfa Lischke, 1868) from Japan and China, and Mylilus cahfornianus Conrad, 1837 from the pacific coast o f North America, as distinct
species, but considered most o f the species described by Lamy to be subspecies o f
M edulis. Also, the Newzealand mussel Mylilus aoleanus, first described by
Powell (1958), has since regarded as a subspecies o f M edulis by Fleming (1959).
More recently, Scarlato and Starobogatov (1979) have described what they
6
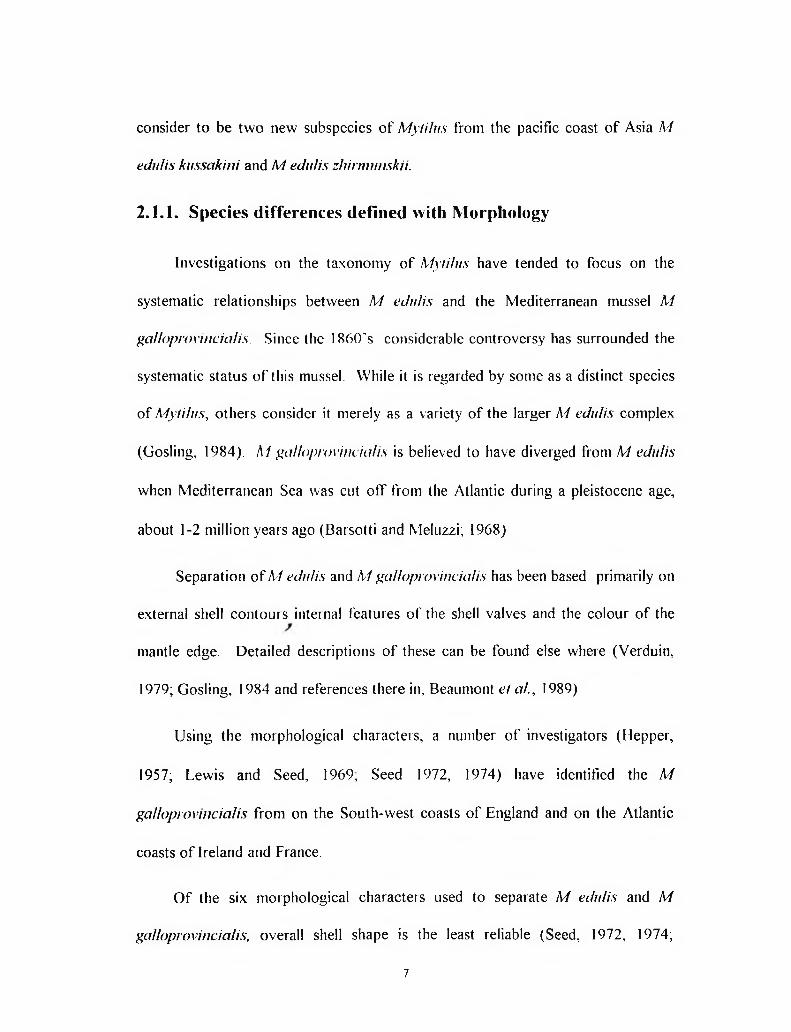
consider to be two new subspecies o f Mytilns from the pacific coast of Asia M edulis kusscikini and M edulis zhinmmskii.
2.1.1. Species differences defined with Morphology
Investigations on the taxonomy o f Mytilns have tended to focus on the
systematic relationships between M edulis and the Mediterranean mussel M galloprovincialis. Since the 1860's considerable controversy has surrounded the
systematic status o f this mussel. While it is regarded by some as a distinct species of Mytilns, others consider it merely as a variety o f the larger M edulis complex
(Gosling, 1984). M galloprovincialis is believed to have diverged from M edulis when Mediterranean Sea was cut off from the Atlantic during a pleistocene age,
about 1-2 million years ago (Barsotti and Meluzzi; 1968)
Separation o f M edulis and M galloprovincialis has been based primarily on
external shell contours internal features of the shell valves and the colour o f the mantle edge. Detailed descriptions o f these can be found else where (Verduin,
1979; Gosling, 1984 and references there in, Beaumont et a!., 1989)
Using the morphological characters, a number o f investigators (Hepper,
1957; Lewis and Seed, 1969, Seed 1972, 1974) have identified the M galloprovincialis from on the South-west coasts o f England and on the Atlantic
coasts o f Ireland and France.
O f the six morphological characters used to separate M edulis and M galloprovincialis, overall shell shape is the least reliable (Seed, 1972, 1974;
7

Gosling 1984; Beaumont el al., 1989 )being influenced by environmental factors,
the effect o f which appear to be the same for both forms o f mussel (Seed, 1 978).
O f the various internal shell characteristics the anterior adductor scar and hinge
plate size have been generally regarded as the two most reliable in separating the
two forms o f mussel.
Beaumont el al (1989) have found mantle edge colour to have good discriminatory power in separating mixed populations o f M edulis and M ga/loprorincialis in South-west England. However, in other areas eg the Atlantic
coasts o f France and Ireland and even in the Mediterranean sea, where only M
galloprovincialis occurs a large percentage (20-60%) o f individuals were
misidentified using this character alone (Seed, 1972, 1974).
There is no single morphological character that can reliably used to separateA.mixed or pure populations o f the two forms o f mussel (Gosling, 1984; Beaumont
el al., 1989; Koehn, 1991; Me Donald et al., 1991).
Ferson el al (1985) used an image analysis technique that automatically
determines the outlines o f shells to discriminate between distinct population o f M edulis and the recently rediscovered M irossulus Gould 1850 (Me Donald and
Koehn, 1988) in New found land , Canada.
Me Donald el al (1991) have used canonical variate analysis of shell traits to
discriminate between three different taxa o f Mytilus collected from sites in the
northern and southern hemisphere, prior electrophoretic analysis had indicated that

only one taxon was present at each o f the northern hemisphere sites. Eighteen
morphometric characters were employed, virtually all o f which have been used by previous authors (Seed, 1972; Verduin, 1979; Beaumont el a l ., 1989) The analysis
revealed three clusters in the northern hemisphere, corresponding to M edulis, M galloprovincialis and M trossiilus, with the best discrimination between M edulis and M galloprovincialis. In the southern hemisphere where to date M trossiilus has not been identified, M edulis samples were morphologically intermediate
between northern M edulis and M irossnlns. In contrast, both southern and
northern A/ gciUopro\ incialis were morphologically similar. For the field
taxonomist there is no single morphological character which can be used to
discriminate between allopatric populations of A/ edulis, M galloprovincialis and
M trossiilus (Gosling, 1992a)
Much o f the confusion described above stems from the fact that, until
relatively recently, Mylilus systematics has been based solely on morphological
shell characteristics that are influenced by non-genetic factors such as age and
density o f mussels, tidal level and habitat type (Seed, 1968, Gosling 1992a).
Examination o f preserved larval and adult specimens o f Perna perna, P viridis and
P canaliculus confirmed Seed’s (!968) contention that shell shape and thickness
are characters o f little taxonomic value in the Mytilidae. Variations in shell
coloration and patterns are also considerable in all these materials.
9
Literature dealing with the taxonomy of the green and brown edible mussels
of the Indian coasts shows that these are treated invariably under the genus Mytilus (Annandale, 1916; Hornell, 1917, 1921; Gravely, 1941; Paul 1942; Jones; 1951;
Satyamurty, 1956, Kundu, 1965; Menon, Sareen and Tandon, 1966). However,
recently the green and brown mussels hitherto described from the coasts o f India as
Mytilus have been brought under the genus Verna. The green mussel recorded and
described as M viridis by earlier workers has been renamed as P viridis while the
brown mussel exhibiting distinct morphological traits hence has been assigned the
status of a new species P indica (Kuriakose & Nair, 1976).
Clearly, systematic information that is relatively free of environmentally
induced changes is highly desirable ( Seed, 1968). Over the past 20 years, the
application o f the techniques o f protein electrophoresis have enabled in quantifying
genetic differences between species ( Ferguson, 1980). Electrophoretic technique
is an effecient method that separates protein molecules according to their net
charge and size. Since each gene controls each protein, analysis of proteins and
their variant form can greatly help in detecting genetic variations between and
within the species. Thus the total genetic profile of the species can be measured by
obtaining the electrophoretic patterns o f the general tissue proteins. Thus species
identity o f even the fish fillets (Shaklee & Keenan 1986), o f larvae (Smith &
Crossland, 1977) and identity o f hybr ids (Shearer & Mulley 1978, Pullan & Smith
1987) were revealed by gel electrophoresis of tissues proteins / enzymes.
10
2.12. Species differences defined with Electrophoretic patterns of proteins
Biochemical and molecular systematics have dramatically altered the
understanding o f the ecology, evolution and biogeography o f bay or blue mussels
of the genus Mytilus (Me Donald and Koehn, 1988; Koehn, 1991; Seed; 1992; Rawson and Hilbish, 1995)
Protein electrophoresis, together with techniques such as DNA-DNA
hybridization mitochondrial DNA analysis, immunology and amino acid sequencing /have proved invaluable in quantifying genetic differences between different animal
and plant taxa (Gosling, 1992). For differentiation of closely related species
electrophoresis has proved to be _ a jnost effective technique (Ferguson 1980;
Murphy et a/., 1990)
Where populations o f two forms, came into geographic contact they may
hybridize. The size o f hybrid zone varys depending on location eg in North West
Europe the width o f the hybrid zone between M edulis and M galloprovincialis is
large, while that between North sea M Mu/is and Baltic M trossu/ns is narrow,
hybridization occurring over a short distance (Vainola and Hvilsom, 1991).
Results from electrophoretic analysis has indicated that such zones are
spatially complex, containing a mixture o f pure hybrid and introgressed individuals.
The M edulis Igallopiovincialis hybrid zone in north-west Europe has been well
11

studied (Skibinski and Beardmore, 1979). Over 170 taxa belonging to different
animal or plant families are known to be hybrid zone (Barton & Hewitt, 1989).
The term hybrid zone is used in a narrower sense when the clines are maintained in
a small region by balance between dispersion and selection against hybrids (Barton and Hewitt, 1985)
The genetic structure o f populations o f the M edulis (L) - M galloprovincialis (Lmk) complex has been characterised by studying
polymorphism by means o f isozyme electrophoresis (Viard el al, 1994). In areas
o f contact, hybridization occurs to such an extent as to contravene the present
working definition o f species-the biological species concept o f Mayr (1970). This
defines species as groups o f actually or potentially interbreeding individuals,
reproductively isolated from other such group and therefore, places heavy reliance
on the presence o f genetically based barriers to gene exchange between species
pairs. Other workers hold a different view point (Me Donald & Koehn, 1988;
Koehn, 1991; Me Donald el al., 1991) these have tended to concentrate an widely
separated allopatric populations o f the three forms o f mussel, and are therefore
stock by the amount o f morphological and genetic differences between the
different taxa differences which are maintained despite hybridization and the
massive potential for larval dispersal. These workers feel that “this genetic
distinctness warrants taxonomic recognition at the species level (Me Donald el al., 1991)
12
M coruscus and M caiifoniiamis are readily distinguished from other taxa by the presence o f radiating ribs on the shell. However, a report by Vermeij (1989) suggests that M caiifoniiamis and M coruscus may in factjxj. be a single species.
Me Donald el al (1991) suggest that the South American mussels M chileiisis and
Mplaiensis and also M desolaHonis should tentatively be included in M edulis and
that the Newzealand mussel M aoleantis and M p/amdalus from Australia should be in M galfoprovincia/is.
Me Donald el al (1991) have suggested that the two subspecies M edidis zhurmunski and M edulis kussakini; on the basis o f their described geographic
distribution (Scarlato and Starobogatov, 1979) should be considered as M galloprovincia/is and M Irossiilns respectively
Before the use of electrophoresis, eight Mylilus taxa were commonly
recognised : M edidis Mgalloprovincialis, Mp/anti/aliis, Mplatensis M chileiisis, M desolalionsis, M coruscus and M caiifoniiamis. The last species is found on the
pacific coast o f North America, is easily distinguished by the radiating ribs on the
shell (Soot-Reyn, 1955) M coruscus has been reported from the pacific coast of
Asia (Scarlatto, 1981) but since no one has collected allozyme data from this
species, its taxonomic status remains obscure. The remaining taxa have been
considered races, varieties or sub species o f M edulis by some authors, while
others have considered them full species (Koehn, 1991). The biochemical genetic
study carried out by Me Donald el al (1988) concluded that the mussels M
13

galloprovincialis (Lmk) and M irossuhss are genetically two distinct species. The
mediterranean mussel M galloprovincialis (Lmk) has been identified on the west
coast o f southern Africa using morphological and biochemical genetic
comparisons with the samples o f pure M edulis from, Denmark and
Mgalloprovincialis from the Mediterranean coast o f Spain (Grant el a!., 1985)
Mytilns sps from Sanriku bay Japan were examined using morphological characters and electrophoretically detectable enzyme polymorphisms (Wilkins ef a/., 1983)
and the mussels were identified as A7galloprovincialis. Skibinski el al (1983) used
starch gel electrophoresis to study variation at loci in mussels sampled from British
coastal silo and two types of mussels such as A/ edulis and M galloprovincialis were identified. Microgeographic allozyme differentiation in the hybrid zone of
M galloprovincialis and A/ edulis on the continental European west coast has
been reported by Comesana el al (1997) Morphological and genetic differences
between Japanese and Chinese red ark shell were examined (Yokogawa, 1997).
2.2. GENETIC VARIATION AT THE LEVEL OF THE
INDIVIDUALS
Protein polymorphism have been used to investigate the genetic structure of
natural populations o f a diverse marine invertebrates (Burton, 1983). Substantial
differentiation has been observed in several species that appear to have high
dispersal capabilities while some o f this differentiation may be the result o f natural
selection. Other cases (where populations are found to have unique allele in high
14

frequency) seem to reflect restricted dispersal and gene flow among conspecific population (Burton, 1983)
7Electrophoretic studies have been made a total o f 8 populations and 400
individuals to determine the amount o f genetic diversity within and between
populations and taxa (Hedgecock et a!., 1984) Electrophoretic analysis o f loci
controlling a variety o f enzymes has been applied to samples of padstow mussel
and typical M edulis in order to resolve the disputed status of the “pad stow
mussel” (Ahmad et a/., 1976). Genetic variation exhibited by electrophoretic
analysis o f tissue proteins and enzymes o f the pacific oyster (C gigas) was analysed
(Buroker et a i, 1975). Buroker (1983) studied 19 different geographic population
o f the American oyster ( (T virginica) by protein electrophoresis. Gartner et aI (1980) reported the genetic difference among M edulis population from four
localities in Atlantic Canada using electrophoretic technique. Genetic
differentiation were analysed among 18 populations o f zebra mussels {Dreissena polymorpha) from the Great lakes and seven populations from Europe using
starch gel electrophoresis (Marsden et a /., 1995). Van-der-Bank, (1995) reported
a study on, the allozyme variation in a fresh water mussel population from
Southern Africa, Geographic variation in the allozyme frequencies of the brown
mussel (Penia perna) has been studied by Grant et ml (1992) in Southern Africa.
Starch gel electrophoresis was carried out to survey genetic variation in 25 species
of marine mollusc (Fujio et a/., 1983) The genetic cohesiveness among
populations o f the marine gastropod Concholepas concholepas from four regions
15
in Southern Chile were examined (Gallardo el til, 1996). Varvio el al (1988)
studied the genetic relationships among Mylilus populations throughout the North
Atlantic region. Eight populations o f M galloprovincialis from different coasts of
the Northern and central Aegean sea have been investigated at the morphological
and ailozymic level (Karakousis el al., 1993). Pompa el al (1990) conducted a
study on the genetic variation in four populations of the mussel Perna perna from the shores o f north east Venezuela. Frank el a! (1990) reported the enzyme
variation between littoral and sub littoral populations of the green-lipped mussel
Perna canaliculus. Gardner el al (1996) reported the biochemical genetic
variation among populations o f the greenshell mussel Perna canaliculus from
Newzealand.. Genetic variability has been surveyed in allopatric populations o f M edulis from over a hundred locations in the northern and southern hemispheres
(Levinton and Koehn, 1976; Ahmad el al., 1977; Gratner-kepkay el a t, 1980, 1983, Gosling and Wilkins, 1981; Skibinski it a!., 1983; Koehn el al 1984;
Bulnheim and Gosling, 1988; Varvio el al., 1988,. Johannesson el al., 1990; Me
Donald el a/., 1990, 1991) Geographic or clinal variation in the frequency of
allozyme variants have been observed in European populations o f Mylilus (Theisen, 1978; Skibinski and Beardmore, 1979; Gosling and Wilkins, 1981). In
North America (Koehn el a l, 1976) and in the Baltic (Theisen, 1978) geographic
variation has been initially viewed as occuring within a single species,M edulis and
has been interpreted interms o f natural selection acting at individual allozyme loci;
temperature and salinity have been identified as possible selective factors (Koehn
16
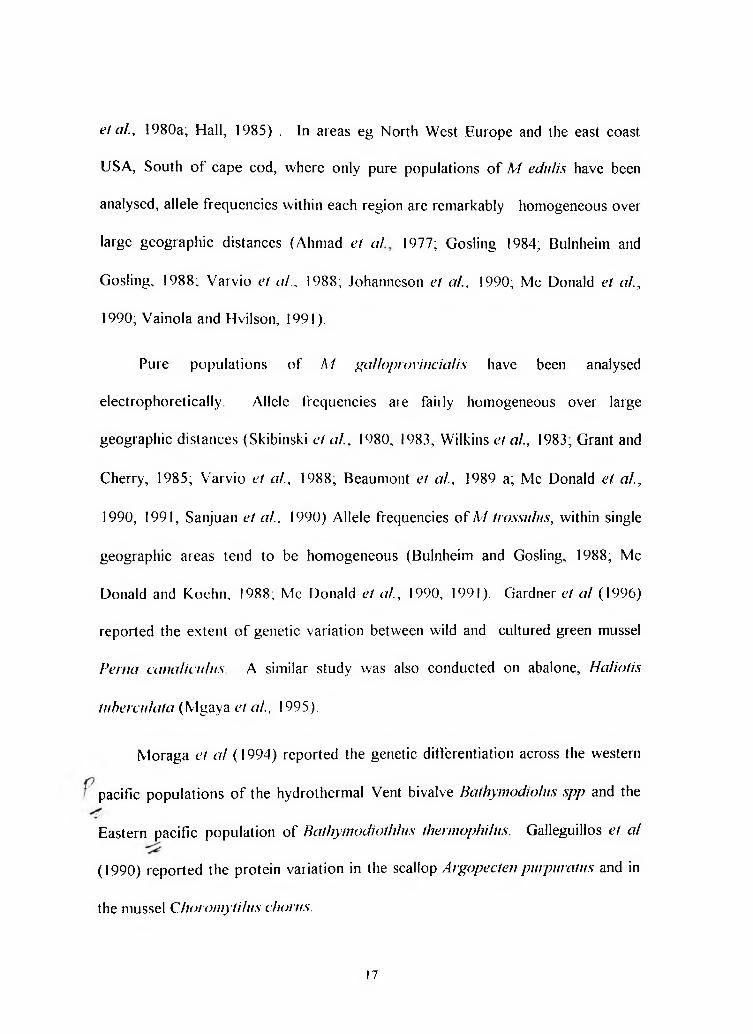
et a i, 1980a; Hall, 1985) . In areas eg North West Europe and the east coast USA, South o f cape cod, where only pure populations o f M edulis have been
analysed, allele frequencies within each region are remarkably homogeneous over
large geographic distances (Ahmad et a l 1977; Gosling 1984; Bulnheim and
Gosling, 1988; Varvio et a!., 1988; Johanneson et a i, 1990; Me Donald et a t, 1990; Vainola and Hvilson, 1991).
Pure populations of M galloprovincialis have been analysed
electrophoretically. Allele frequencies are fairly homogeneous over large
geographic distances (Skibinski ef a i, 1980. 1983, Wilkins et al., 1983, Grant and
Cherry, 1985; Varvio et a i, 1988, Beaumont et a i, 1989 a; Me Donald et a i, 1990, 1991, Sanjuan et a i, 1990) Allele frequencies o f M trossulus, within single
geographic areas tend to be homogeneous (Bulnheim and Gosling, 1988; Me
Donald and Koehn, 1988; Me Donald et a i, 1990, 1991). Gardner et al (1996)
reported the extent o f genetic variation between wild and cultured green mussel
Perna canaliculus A similar study was also conducted on abalone, Haliotis tuhere11lata (Mgaya et a i, 1995).
Moraga et al ( 1994) reported the genetic differentiation across the western
pacific populations o f the hydrothermal Vent bivalve Bathymodiolus spp and the
Eastern pacific population o f Bathymodiothlus thermophilus. Galleguilios et al(1990) reported the protein variation in the scallop Argopecteti purpuratus and in
the mussel Choromytilus chorus.
17

2.3. G EN ETIC VARIATION BETW EEN THE SPECIES
Buroker et al (1979) reported the level of genetic variation for 6 Crctssostrea and 3 scaccostrea species. Skibinski et a! (1980) studied genetic variation at 13- !6 loci in Modiolus modiolus, M edulis and M galloprovincialis. Gosling (1984)
reported that the two forms o f mussels M edulis and M galloprovincialis are
closely related, genetic identity and genetic distance value were similar to those
observed between sub species o f other invertebrates. Bulnheim et al (1988)
examined the population genetic structure of mussels from various regions o f
Baltic Sea with reference to A f edulis and M galloprovincialis. Coustauc et al (1991) carried out a genetic study on the French Atlantic coast from 1989-1990
t revealed interdigitation between typically M edulis and typically M
galloprovincialis populations and intermediate populations. Me Donald el aI(1991) reported that the northern and Ssouthern hemisphere samples consists of
three electrophoretically distinguishable species such as M edulis, Mgalloprovincialis and M trossu/tis.
The electrophoretic profiles o f proteins / enzymes were also used in
diffenentiating the Indian species o f prawns (Thomas, 1981., Philip Samuel, 1981)
crabs (Kannupandi & Paulpandian, 1975 ) fishes (Manohar & Velankar, 1973.,
Menezes, 1979., Mahobia,1987.,Chakraborty 1990). However, application o f
electrophoretic techniques in differentiating the Indian Bivalves like mussels was
not reported earlier.
18

The essence o f the above review is that all tissue proteins/ enzymes are
potential genetic markers and any one or more markers may be selected and
analysed by electrophoretic method to study the genetic variability between the
species, within the species, among the populations and also to verify whether the
suspected individual is a hybrid or a new species. The present investigation on the
electrophoretic profiles o f the general proteins and morphometries in the Indian mussels was aimed at detecting the genetic differences between the green mussel
P. viridis and the brown mussel P.indica. The results and the conclusions o f the
investigation are presented in this dissertation
19

i y P f a f e r / a ^ a n & f

3.1. MATERIALS
3.1.2. COLLECTION
Wild specimens o f the green mussels (plate 1) were collected from Calicut ( 1 r i S ’N 76° 45 ’E ), Cochin ( 9° 58’N 76° 16’E ), Quilon ( 9°57’N 76° 33’E
), Vizhinjam (8° 22’M, 76° 56E) and Madras (13° 06’N 80° 18’E ), (fig-2) wild
specimens o f brown mussels (plate 2) were collected from Cochin Vizhinjam and
Mandapam ( 9° 16’N 79° 12’E ) fig (2). The samples collected from Mandapam
were the stock from Vizhinjam. Two types o f suspected hybrids were collected
from the Vizhinjam (plate 3) and Cochin (plate 4). The suspected hybrids of
Vizhinjam were present along with the green and brown mussel population where
as the suspected hybrids o f Cochin were collected from the onshore areas o f the
Narakal without the interference o f brown and green mussel population The
green mussels were collected from thg. Fort Kochi and brown mussels were
collected from the Chellanam area o f the Cochin. A total o f 10 green, 10 brown. ~
and 10 suspected ‘green type’ hybrids were collected from Cochin. A total o f 21
green mussels, 20 brown mussels and 8 number o f suspected ‘brown type’ hybrid
mussels were collected from Vizhinjam. Likewise, 20 green mussels were also
collected from the back water areas o f Quilon and 20 number of green mussels
were collected from the Calicut. 21 number o f green mussels and 10 number o f
brown mussels were also collected from Madras and Mandapam respectively.
Thus a total o f 150 specimens were examined from the five regions.
20

72° 76° 80°. J ......
84° 88°
20°
J )20°
16° 16°
12°
8°
\
C a lic u t
I Madras
tSochlnQuilon ^ /landapam &
12°
72° 76° 80° 84° 88°
Fig.2. Collection sites o f P viridis and P indica

. L!8*4RY
*N *-SI2 9Ut (nrrw) CocWa-682 il4 , (rniia)
P ‘ If i r v i d i A ( /. in n a tu t)
Plate 1. Green Mussel. (Perna viridis)
p . i n d i e * . (Km.aua.*#** 1*. N/at/)Plate 2. Brown mussel {Perna indica)

Plate 3. Suspected ‘brown type’ hybrid mussel
Plate 4. Suspected ‘green type’ hybrid mussel
3.1.3. TRANSPORTATION :
The specimens from the different collection centres were transported in live condition to the lab. Within 7 hours specimens were brought to the lab except from
Madras and Mandapam All the samples were transported live in moist condition. From Madras the samples were brought in moist condition to the Calicut Research centre o f CMFRI and there the animals were transferred to seawater and aeration
was provided. On the same day. after 3-4 hours mussels were again kept in moist
condition and transported to Cochin In the lab, animals were properly cleaned in
seawater and were immediately stored at 20"C, till analysis.
Similarly, the samples (brown mussels) were collected from Mandapam and
brought to lab via Vizhinjam Research centre of CMFRI.
3.2. METHODS
3.2.1. SPECIES IDENTIFICATION BASED ON
MORPHOLOGICAL CHARACTERS
Both green (P viridis) and brown (P indica) mussels were differentiated
based on their morphological characters (Kuriakose et a/.. 1976). The diagnostic characters separating the species P viridis and P indica are given in Table 1. The
morphological characters o f the suspected intermediate individuals collected from
Vizhinjam and Cochin were examined with respect to the characters o f green and
brown mussel
21

(QDC?
CD
Oc536QO - fi
3ccn tn CD cn cn 3O3CQ3cc/>OCD
3"OcB<s></)o'3<Q' 5? Q3CD 3Q 3 Q.3"3'
CQ CD —t- CD CD
(DCDD3c
Umbo
Hinge teethAnterior byssal retractor m uscle scar
Ligament
Posterior byssal retractor muscle scar
Posterior byssal retractor muscle scar
Posterior adductor muscle scar
Pallial m uscle scar
Suspected 'brown
type1 mussel
Brown m
ussel
Umbo
Hinge teethAnterior byssal retractor m usc le scar
ligam en t
Posterior byssal retractor m uscle scar
Posterior byssal retractor m uscle scar Posterior adductor m usc le scar
Pallial m usc le s e a
Umbo
Hinge teettiAnterior byssal retractor m uscle scar
Ligament
Posterior byssal retractor m uscle scar
Posterior byssal retractor m uscle scar Posterior adductor m uscle scar
Pallial m uscle scar

3.2.2. MORPHOMETRI.CS :
Dorso Ventral length (DVL), shell width, shell thickness (Fig 3) o f each
individual were measured (Table 4) and the average value of each parameter was
calculated Morphometric comparison between the green mussels from different regions, between green and brown mussels, between green, brown and suspected green/brown type mussels was done
3.2.2. a. Discriminent analysis for grouping of suspected mussels.
Discriminent Analysis was done according to the method described by Rao
(1965) for grouping of the suspected individuals collected from Cochin and
Vizhinjam using SPSS software.
Morphometric meassurements o f a total of 93 mussels (63 green and 30 brwm). ('fable 6 ) were taken and the discriminent function was calculated. Using
the fitted discriminent function for discriminating green and brown mussels, the
discriminent scores o f each suspected individuals was calculated. Based on these
scores a rule for classification to one of the two groups were formulated based on
posterior probability as follwed.
(i) Get an estimate o f prior probability that an animal belong to group T as
P (Gi) from their availability in the population.
22
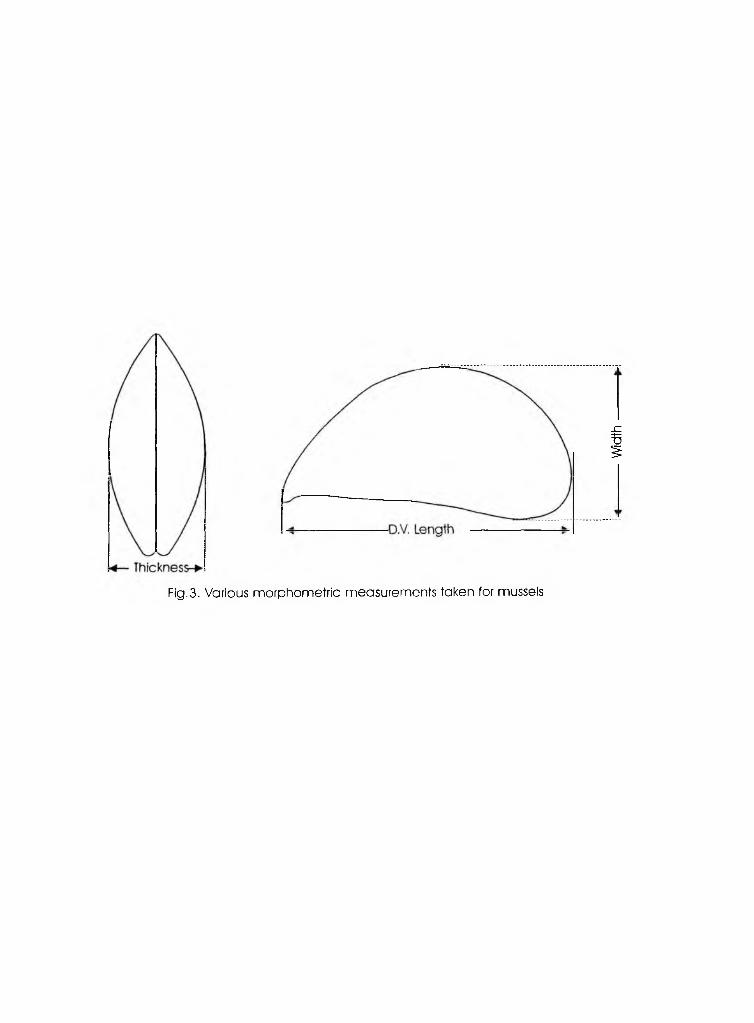
Fig.3. Various morphometric measurements taken for musselsWid
th
(ii) Using the means and standard deviations o f scores of the groups
assuming normality,, compute the conditional probability P (D/Gi)
(iii) Using Baye s formula workout the posterior probabilities as
P (Gi/D) = P(D/Gi) P (Gi)2
PE P(D/Gi) P(Gi) i I
(iv) Group the animal with discriminant score D to that group for which P
(Gi/D) is the largest.
I he percentage of green mussel in Vizhinjam = 5 %
The percentage of brown mussel in Vizhinjam = 95%
Hence I’ (Cii) 0.05
P(G.,) 0.95
The percentage of green mussel in Cochin =» 80%
The percentage of brown mussel in Cochin ~ 20%
Hence IMG,) 0.80
P (G.>) = 0.20
3.2.2. b. Principal component analysis
To see whether there is any geographical difference in green mussel
populations, principal component analysis was carried using the morphometric
23
measurement. 1 he I ! two PC’s explained percentage of variation. Morphometric measurements were first transformed by natural iogarthims and the transformed value were used for PC analysis on the sum of squares and sum of products matrix.
One way analysis of variation was done to see significant difference between centres.
3.2.3. BIOCHEMICAL GENETICS
3.2.3.1. ELECTROPHORETIC ANALYSIS
3.2.3. M. STANDARDISATION OF THE METHODOLOGY
3.2.3.1.2. a Sample Preparation.
Tissue samples from adductor muscle, mantle, foot, gill and digestive diverticula were taken from the thawed mussels in cold conditions. Each of these was weighed and packed in aluminium foil, labelled properly and was immediately kept below 0°C until use This procedure was repeated initially for five individuals at a stretch. Later, each of the tissue was minced under cold conditions and then separately homogenised in selected media at selected tissue medium ratios. The homogenising media tried were double distilled water (DDW) and 0.05M Tris/HCl, (pH 7) buffer. The ratios at which the media were utilised for homogenising the three selected tissues were 1:1 (w/v), 1:2 (w/v) and 2:1 (w/v). Mechanical homogeniser (Remi) and a manual glass homogeniser were employed. Homogenisation was invariably conducted under cold conditions. Homogenates
24
were taken in Eppendorf tubes. Centrifugation was done at speeds ranging from
5,000 to 10,000 rpm for periods ranging from 5 minutes to 30 minutes at 4.°C.
(These conditions were selected based on the experience o f previous workers on
other bivalves). Supernatant obtained was drawn and transferred to another set of
labelled Eppendorf tubes and stored at - 20°C till they were analysed
3.2.3.1.1.b. Reagents for stock solutions:
1 Gel buffer (Tris-HC I)
a. Separating gel buffer (Tris - HCI) 1 8M pH 8.9
Tris -10.9 gram for 50ml.
b Stacking gel buffer (Tris - HCI) 0.5M pH - 6.8 I ris - 3.02 gram for 50 ml
2 Tank buffer (Tris Glycine) 0.2M pH 8.3
Tris Glycine-36.03 grm for 2.4 litre.
All the buffer reagents were dissolved separately in double distilled water
and made upto the required volume. The pH was checked with digital pH meter.
The pH of gel buffer was adjusted adding 8M HCI as required The pH of tank
buffer was adjusted by adding 2M Tris (Stock).
3. 30%. Acrylamide Solution:
30 grams of acrylamide was dissolved in 100ml of DDW (w/v)
and filtered through whatman filter paper. The solution was
kept at 4°C in an amber coloured bottle.

4. 2.5% Bisacrylamide solution:
2.5. grams of bisacrylamide was dissolved in 100 ml DDW (w/v) and filtered through whatman filter paper. The solution
was stored at 4“C in an amber coloured bottle.
5 Loading buffer :
Loading buffer consisted of I ml of 0.5 % Bromophenol Blue,
2ml o f Glycerol and 7ml DDW. At first the required quantity
o f glycerol and buff er were mixed and then dye was added to it.
6 APS : 5% APS solution prepared on the same day o f electrophoretic run.
0 05 gm of APS was dissolved in cold DDW and stored at 4WC
until use
3.2.3.1.2.c. Electrophoresis:
Electrophoresis was done in horizontal electrophoretic unit. Polyacrylamide
gel medium was used Various proportions of acrylamide (30% stock) and
Bisacrylamide (2.5% stock) solutions were tried to maximise the resolution and
separation of bands. However, for any gel percentage the proportion o f
Bisacrylamide was 5% of the total acrylamide concentration (Gordon, 1980) For
one gel, 50 ml o f separating gel and 25ml of stacking gel was prepared. The
amount o f buffer, APS, TEMED in any percentage of gel was kept constant. 350
26
f.il APS and 50f.il I EMED were added For separating gel where as half o f each
respective quantity was used For stacking gel preparation.
The proportion tried for sample and loading buffer were 1:1 (v/v), 2:1 (v/v)
and 1:2 (v/v) A total volume (sample + dye) of 60 pi were loaded in each well.
Electrophoresis was stopped when the marker dye reached the anodai end,
which usually occured within 3 hours W hen electrophoretic run was over, the gel
was taken from the cassette and stained for general proteins.
The best tissue giv ing maximum activity, number o f bands and showing band
variation for a given set o f electrophoretic conditions, producing the best
separation and resolution oF bands was selected For protein analysis. The
composition oF the gels used are given in Table 2.
The electrophoretic profile oF two enzymes such as Esterase (EST) and
Malate dehydrogenase (MDH) were also studied. The method standardised For
protein separation was utilised For the enzyme systems. I he staining method of
Shaw and Prasad (1970) was adopted For detection oF enzymes. The
electrophoretic banding patterns obtained after the staining were recorded as well
as photographed For Further reFerence and analysis.
3.2.3.2. General protein and Enzyme staining Recipes:1, General protein :
MonomerCoommasie Blue (SRL) 1 25g
27

Methanol 230mlDDW 230mlGlacial Acetic acid 40ml
Filter the solution. Stain the gel in dark for 90 minutes and coasts. Transfer to destaining solution containing 150 ml of methanol, 70 ml of Acetic acid
and 780 ml o f water
2 . Hstetase
Substrate
1% « . (1-tiaphtbyl acetate
2-Naphthyl acetate
fi-Naphthyl acetate
Acetone
DDW
lg
lg
50ml
50ml
Slain
Fast blue RR 100 mgc
0.5 M tris - Hcf pH 7.1 100ml
1% a , P-naphthyl acetate 3 ml
DDW 87 ml
28

Incubate at room temperature until blue bands appear wash and fix.
3 MDH. For 100 nil
2M Tris HCI (pH 8 0 ) 80 ml
2M D-L Malic acid (pH 7.0) 12 ml
Nicotinamide Adenine Dinucleotide (NAD) 4ml
Nitro- blue Tetra solium (NBT) 3ml
When ready to stain add :
Phenazonium met ho sulfate (PMS) 1.2 ml
Incubate at 37 " C in dark until sufficient activity is present.
3.2.3J. PROCEDURE FOR ANALYSIS OF DATA:
3.2.3.3.a. Interpetation of Zymogram patterns :
The electrophoretic position of the major and minor protein/enzyme fractions
obtained in the green and blown mussels were closely examined to detect regions
that differentiated the two species. The same method was adopted to examine the
suspected hybrids. To study the genetic variations within the green mussel,protein
profiles between the green mussels were examined to detect polymorphic
phenotypes at assumed loci. The phenotype variants at an assumed locus were designed as slow moving S band (slow homozygote), fast moving F band ( fast
29

homozygote)and their combination as SF band (hetrozygote), depending on the
distance migrated by the particular band in that particular gel area. As a standard
practice, the observed protein phenotypes are presumed as genotypes produced by co-dominant alleles at a particular genetic locus
The number o f gene loci controlling the observed phenotypes in the two
species were -also estimated on the basis o f gene-protein relationship. Thus it was
pressumed that each protein fraction in a product of a particular gene in each
species. The fastest migrated band was designated as band number one and gene
locus one The subsequent bands loci down towards the point of application of
protein extract were given higher serial numbers. Differences in the migration o f
the bands were the basis o f counting the number of loci (Fig. 6).

1 able 1. Diagnostic characters separating the species of Perna.
Diagnostic Characters / ’ viridis P iiuiicaShape of anterior end Pointed, beak - like,
dovvnturnedPointed and Straight
Size of hinge plate Thick, broad, extends slightly to the ventral border
Thick, narrow, terminal
Number and Size o f hinge teeth
Two small on the left valve and one on the right valve
One large on the left valve and a corresponding depression on the right valve
Dorsal ligamental margin
Curved Straight
Mid-dorsal shell Arcuate A distinct dorsal angle or hump present
Ventral shell margin Highly concave Almost straightMantle margin colour Yellowish green BrownExcurrent aperture opening
Mouth oval and wide; passage into the mantle cavity small; restricted by rectum and rectum and posterior adductor not visible through the opening
Mouth and passage into the mantle cavity are of same width; rectum and posterior adductor prominently visible through the opening.
Ventral mantle margin Inner fold o f the posterior ventral mantle margin thin, extensible, smooth, tentacles or papillae absent.
Inner fold of the posterior mantle margin very thick not extensible provided with 18-22 thick branching tentacles.
Posterior byssal retractors
Two, short, thick bundles; anterior bundle arises from the posterior and diverges in the form o f a ‘V ’.
Two, short, thick bundles; anterior bundle arises from the posterior and diverges in the form of a ‘V \
Source (M I R! bulletin 29
Table
2. Co
mposi
ton o
f gels
used
in the
electr
opho
retic
analys
is in
musse
ls4>SfJ
oncr. 13 6o -yj m f IocdC/3
CDC COg "o E <oa3 Sft OCL ^a> wCO
O;co c i*tncj
*oLT)
olON
2OCOo
QJSJjsOoxO n
ci)- S _ g ^ 1 3 8 00 ^ nCO w
c*ci
*mcj
Ci/)cctf <Detf SJJCLQJCO
Eo>n* o iri
int"~ <no
VT> cnm VOo (—,
OOJLUo 4>SJj,oO''00
=1)cJ2 "a3 £ =*</iri r )
in* c-CJ o
Eo« Jiv- CfjS. ir>a>c/5
tnvOci CO-*om
<uD/ir-
OXic^ £/) * - »
C/3r-ci r-
C/)c .♦-*aj <D E r-oct3 SI) o ■—<a. in —•OJ s—'CO
*oin
m
mO
V Otn <D oxO-*—• r«~,m <L»O ”0Q-E booa> oO <
V oox*/">CJ-a>
"O£a3£■cd
V—£
CQ CQ
cr:cocM 00 * c H
sCO
"cd
ooOXQJ
wH
oxtnco5?
VO
O'
tn C J* r- rn,_j »ncl o *—1
VOCJ
£oa
Ov-.osc,
32

4.1. STANDARDISATION OF METHODOLOGY:
To select a suitable homogenising medium, double distilled water, 0.2 M sucrose solution and 0.05M Tris/HCl buffer (pH-7). were tested and the results
were compared. TrisHCI, buffer (pH-7) at 2:l(w/v) ratio followed by
centrifugation at 10,000 rpm for 15 minutes at 4"C gave satisfactory results.
Out of the different polyacrylamide gel percentage examined, better resolution and
clarity were obtained at 9% gel for general proteins o f adductor muscle, mantle, foot and gill tissues.However, for enzymes gill and adductor muscle gave better
result at 8% gel concentration
4.2. THE ELECTROPHORETIC PROTEIN PROFILE OF
THE GREEN MUSSEL (P.viridis)
4.2.1. Protein banding patterns in the tissues.
The general proteins extracted from the tissues, mantle, adductor muscle,
foot and gill were separately obtained by gel electrophoresis Each tissue showed
its own specific banding patterns. I he comparative gel position of the major and
minor bands among the four tissues differed significantly indicating tissue specific
nature o f the proteins in the species. (Fig .6 )
The tissue specific differences were also due to differences in the size of
some bands and also their staining intensity. I he total number of the bands was
not different among the tissues For example, the total number of bands in the
X X X■'tf CO CNII I I■ m
© 0
ffi <y
oX)o
&
CO0
rsE c ® .
05
S I
3EcI
I Sc o § § £]) iOo>£o .S?o § p 5
$ -S2 coE i
2nj? © o o<o8 |00CO W-*♦— p CD O
II00 0 co 03 2 <
CDtoto3ca>CDCDM—o®o»ZJEw5o3T3•Q<
Fig.
6. Zy
mogr
am
of ge
nera
l pr
otein
in di
ffere
nt t
issue
s of
green
and
br
own
mus
sels
p j ' » 3 ’- * 38 i , = W, ro \£ * £ * J 3tJ a s 3 & ak °CO G 2 4
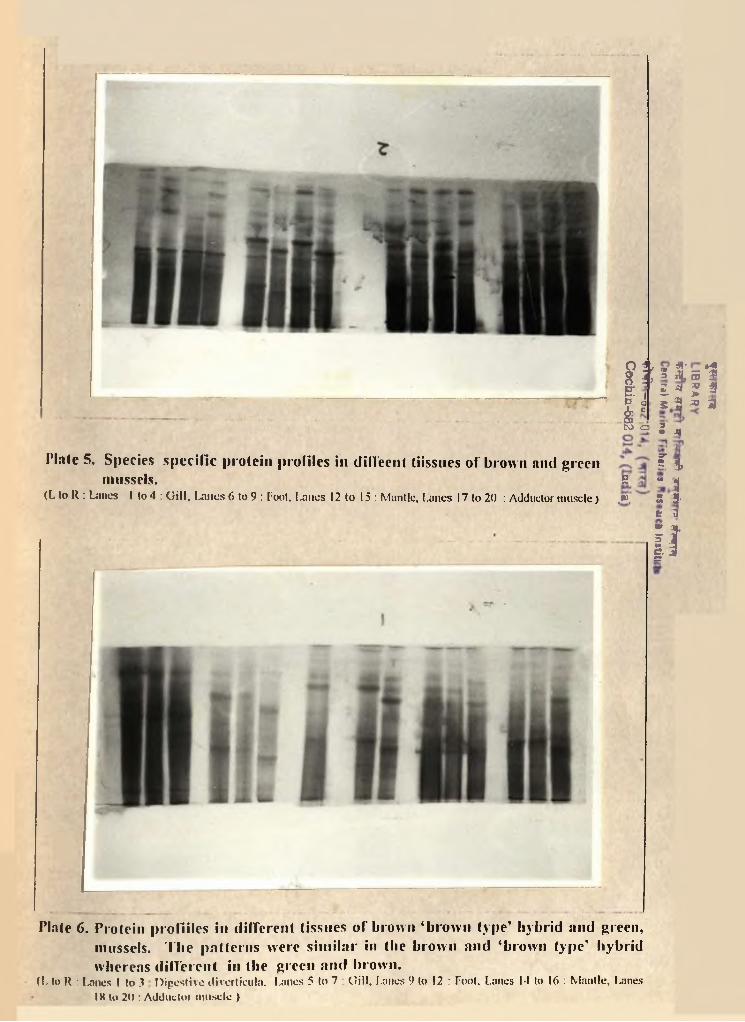
Plate 5. Species specific protein profiles in diffeeut liissues o f brown and green f $mussels. 5 - -j
(L lo R : Lancs I to4 : Gill, Lnncs 6 to 9 : Toot, Lancs 12 to 15 : Mantle, Lanes 17 to 20 : Adductor muscle) ,*>, S 3-t a
i t
Plate 6. Protein profliles in different tissues o f brown ‘brown type’ hybrid and green, mussels. T he patterns were sim ilar in the brown and ‘brown type’ hybridwhereas different in the green and brown.
(L to R : Lanes I (o 3 Digestive diverticula. Lanes 5 to 7 : (lill. Lanes 9 to 12 : Foot, Lancs 14 to 16 : Mantle, Lanes IK lo 20 : Adducloi muscle )

I I
! 1 1 K 1 1 1 1 !I f ■ i |f. 9 1 1
II 1 11 1 11 v 1
I
I II
I II
I
•I I I
I I 1
CDGO<
“ ^ CD lO (J)
Fig.7.
Zymogra
m of g
eneral
protein
in diffe
rent ti
ssues o
f green
, brown
and s
uspecte
d ‘bro
wn typ
e’ hybri
d mu
ssels
I
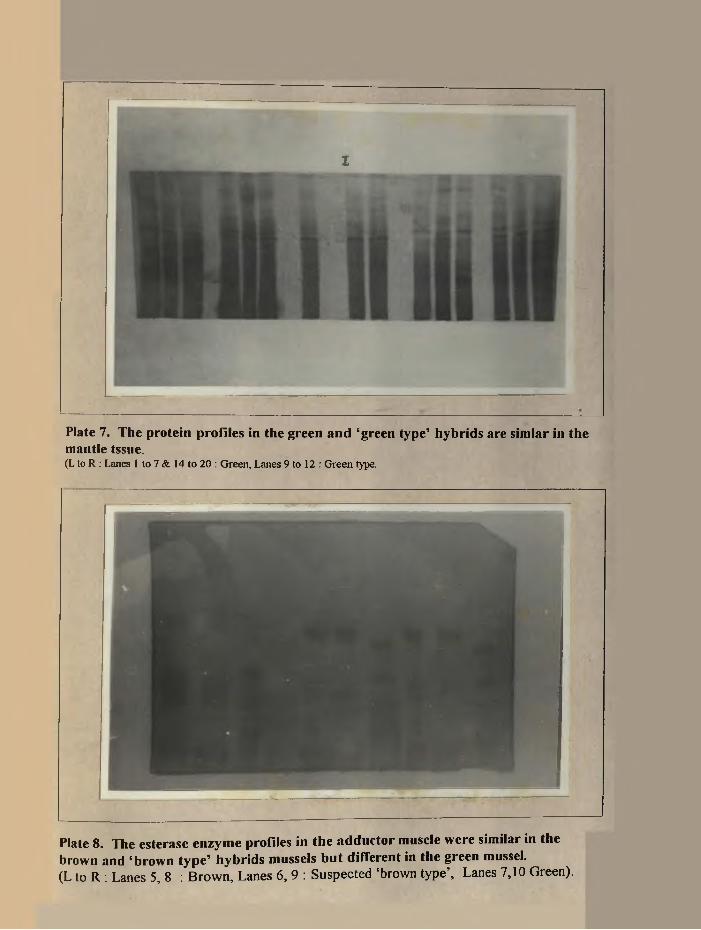
Plate 7. The protein profiles in the green and ‘green type’ hybrids are simlar in the mantle tssue.(L to R : Lanes 1 to 7 & 14 to 20 : Green, Lanes 9 to 12 : Green type.
Plate 8. The esterase enzyme profiles in the adductor muscle were similar in the brown and ‘brown type’ hybrids mussels but different in the green mussel.(L to R : Lanes 5, 8 : Brown, Lanes 6, 9 : Suspected ‘brown type’, Lanes 7,10 Green).
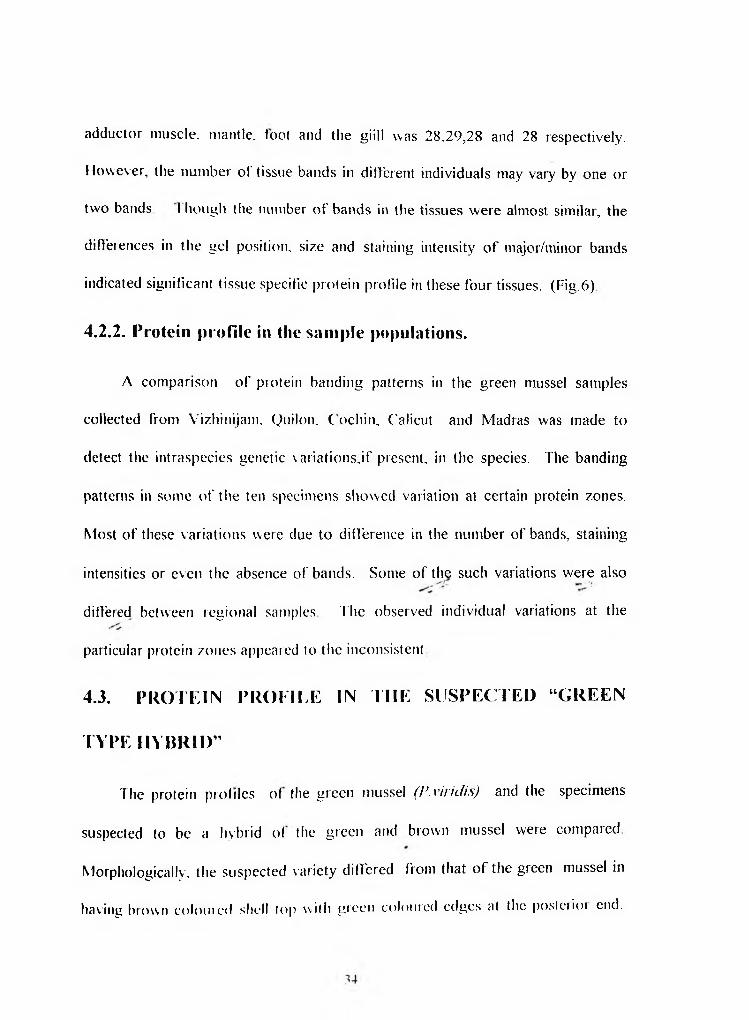
adductor muscle, mantle, toot and the giill was 28.29,28 and 28 respectively.
However, the number of tissue bands in different individuals may vary by one or
two bands I hough the number o f bands in the tissues were almost similar, the
differences in the gel position, size and staining intensity o f major/minor bands
indicated significant tissue specific protein profile in these four tissues. (Fig.6)
4.2.2. Protein profile in the sample populations.
A comparison o f protein banding patterns in the green mussel samples
collected from Yizhinijam. Quilon. C ochin, C'alicut and Madras was made to
delect the intraspecies genetic variations.if present, in the species. The banding
patterns in some of the ten specimens showed variation at certain protein zones.
Most o f these variations were due to difference in the number of bands, staining
intensities or even the absence of bands. Some of the such variations were also
differed between regional samples The observed individual variations at the
particular protein zones appeared to the inconsistent
4.3. PROTEIN PROFILE IN H IE SUSPECTED “GREEN
TYPE HYBRID”
The protein profiles of the green mussel (P.viridis) and the specimens
suspected to be a hybrid of the green and brown mussel were compared
Morphologically, the suspected variety differed from that o f the green mussel in
having brown colomed shell lop with green coloured edges at the poslerioi end.
0<
CD<
0
0CO
CD
0
0CO
CDLL
000CO0CO0
D£©§c
- 1 - $ P>3 X5E £z: o£ CDI 8- a 2o o © © to CO CO CO += ‘4= © © c ■£ o o 2 2
©
© cco cC/3
IIQ) -Q ©o o
©COCOZ)EIC^ 7n p> ^ os
© O 11
Z}E © il c ©
_ © S pI S i §. 1 i© 5 ? o
0 2.0 DO CO0 0 0
c©3?D)
O © © o ov> co 13 3E E
■■HoopX>•a<
“ ig 0 co co 05 2 5 < < <£3E&£■c©©O) © 00■Q B & 1 ° a s « © M O )'4— *♦—o o -+— +— o o o o
0
Fig.
8. Z
ymog
ram
of
gene
ral
prot
eins
in di
ffere
nt t
issue
s of
gree
n, b
rown
and
su
spec
ted
‘gree
n ty
pe’ h
ybrid
m
usse
ls

©B SB G
Fig.9. Zymogram of the esterase enzyme profiles in the adductor muscle of the green, brown and suspected ‘brown type’ hybrid mussels
B - Brown musselG - Green musselSB - Suspected 'brown type' mussel
©
© I _________________________________B SB GFig 10 Zymogram of the MDH enzyme profiles in the adductor muscle of the green, brown and suspected ‘brown type’ hybrid mussels

The protein banding patterns o f the adductor, mantle,gill and foot tissues in both
the suspected and the wild green were almost similar in spite o f the shell colour differences (Fig. 8, Table 11)
4.4. THE ELECTROPHORETIC PROTEIN PROFILE OF THE BROWN MUSSEL (Perna indica)4.4.1. Protein banding patterns in the tissues.
The total number of protein fractions in the mantle, foot, adductor and gill
tissues was 29, 27. 27and 26 respectively. However, the number of bands present
in each tissues was found to vary by one or two in different specimens tested.
Irrespective o f the number of bands present in different tissues, each tissue had
shown its characteristic bands indicating tissue specific protein profile. Tissue
specificity o f the bands was expressed by having different electrophoretic migration
of the concerned bands and thus located in different positions on the gel. (Fig.6,
Table 10) Besides, the size and staining intensity of certain bands in each tissue
also differed
4.5. PROTEIN PROFILE IN THE SUSPECTED “BROWN
TYPE” HYBRID
An electrophoregram of the general proteins in the adductor muscle, mantle,
foot and gill and that o f the enzymes, malate dehydrogenase and esterase present in
©B SB G
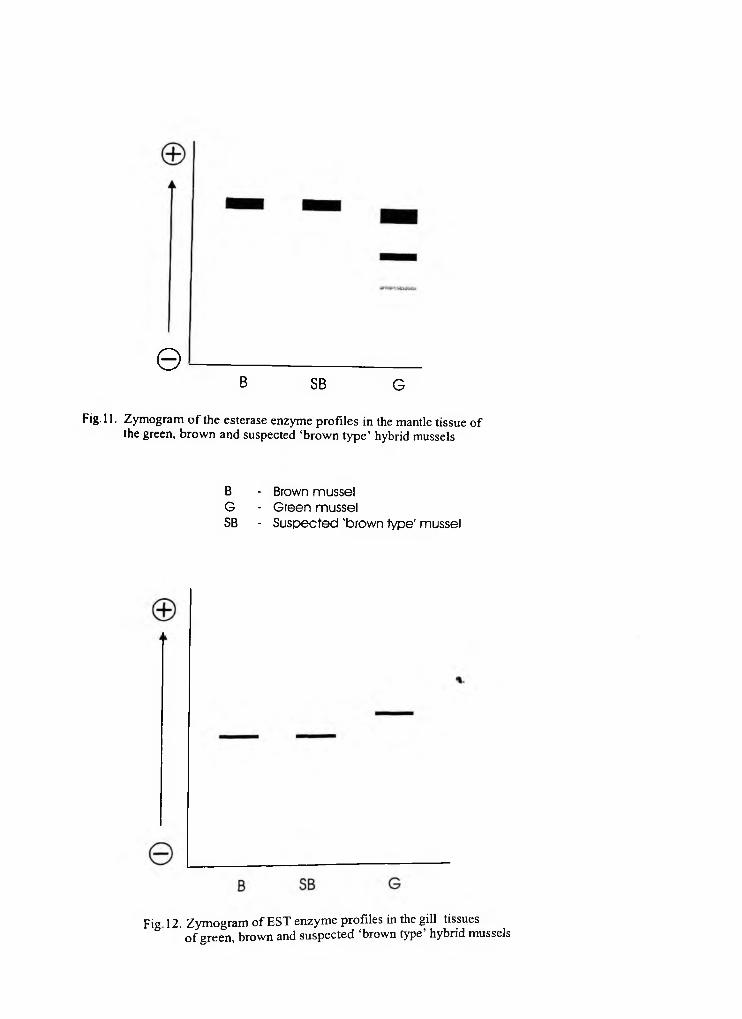
Fig-11. Zymogram o f the esterase enzyme profiles in the mantle tissue o f the green, brown and suspected ‘brown type’ hybrid mussels
B - Brown musselG - Green musselSB - Suspected 'brown type' mussel
Fig 12. Zymogram of EST enzyme profiles in the gill tissuesof green, brown and suspected ‘brown type’ hybrid mussels
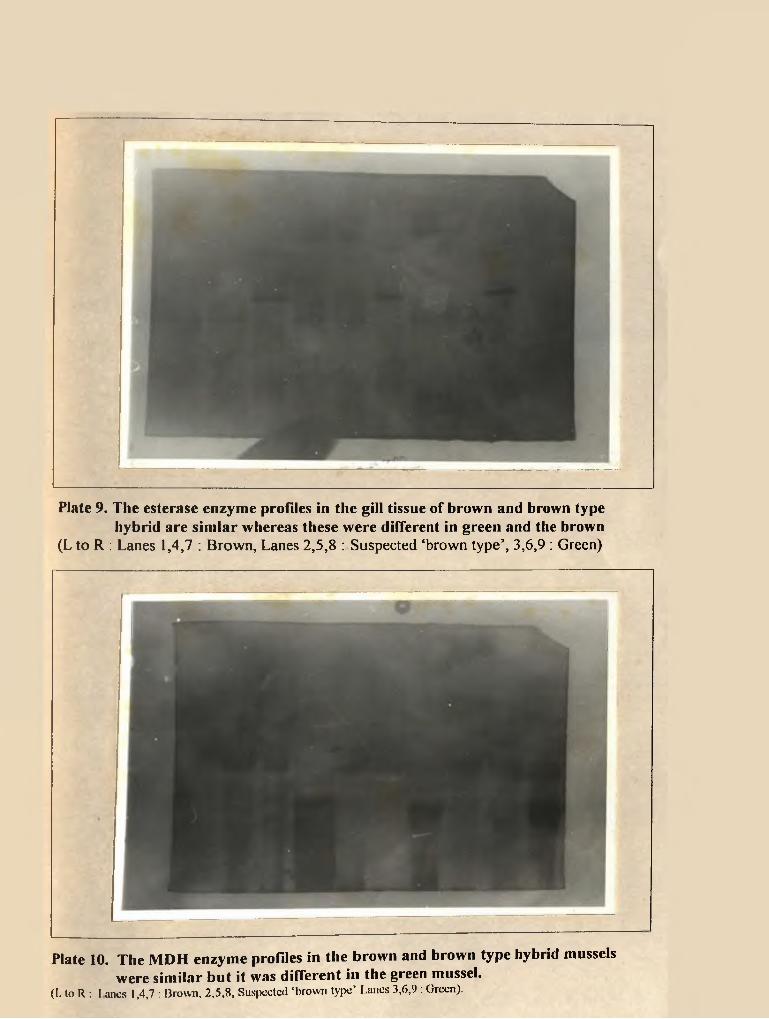
Plate 9. The esterase enzyme profiles in the gill tissue of brown and brown type hybrid are sim lar whereas these were different in green and the brown
(L to R : Lanes 1,4,7 : Brown, Lanes 2,5,8 : Suspected ‘brown type’, 3,6,9 : Green)
Plate 10. The MDH enzyme profiles in the brown and brown type hybrid mussels were similar but it was different in the green mussel.
(I. to R : l anes 1,4,7 : Brown, 2,5,8, Suspected ‘brown type’ Lanes 3,6,9 : Green).

Plate 11. The protein profiles in the green mussel sample with some inconsitent variations in the mantle and foot tissues.(L to R : Lanes 1 to 10 : Foot, Lanes 12 to 21 : Mantle)

the green , brown and the suspected brown type” hybrid were obtained (Plate 6 , Fig 7, Table 10)
A comparison of the protein and the enzyme profiles o f these hybrid types of mussels with that ot the brown mussle clearly showed that the protein/enzyme
banding patterns in the brown and the suspected hybrid mussels are almost
identical whereas the green mussel showed its species specific pattern as described earlier I hough the suspected hybrid has a shell shape o f the brown and the green colour of the green mussels, its protein/enzyme banding patterns are that o f the brown mussel
4.6 . THE COMPARATIVE PROTEIN/ENZYME PROFILES IN THE GREEN (/'. 11 RID IS) AND THE BROWN {P. INDICA) MUSSELS.
A compar ison o f the protein profiles present in the tissues, adductor muscle,
mantle, foot and gill o f the green and brown mussels showed species specific
major and minor proteins fractions. The species specific differences in the protein
pr ofile are due to differences in the electrophoretic variations of the major/minor
fractions as well as due to differences in the size and staining intensity of certain
bands The species specific difference between the green and brown mussels was
most strikingly expressed by a very intensively stained major band present in the
foot tissue and located on the gel at 5 to 5.3cm in the green mussel while at 5.7 -6.0 crns in the b r o w n mussel . The species specific protein fractions are shown as
M'y
number 14 in the brown and 15 in the green mussels (Fig .6 ) . Similarly the banding patterns of the enzymes malate dehydrogenase (MDH) and the esterase (F-.SI ) were also distinctly different in both the species (Fig 9, 10, 1 1, 12, Table 8,
A total of 29 loci in the mantle. 28 loci each in the foot, the adductor
muscle and the gill were identified and numbered in the two species. The species
specific distinct protein loci in the mantle tissue of the brown mussel were 8, 10,
14, 19, 21. 24 and 27 whereas such unique loci in the green mussel were 3, 4, 9,
13, 17, 18, 20. 22. 25, 26, 28 (Fig 6 ). In the foot tissue, the species specific loci in
the btown mussel were. 1.3.5. where as such specific loci in the green mussel were
2.4,5,9,14,20,22.24,25.27 This species specific loci in the adductor muscle of the
brown mussel were 2. 6 , 7. 10, 13. 15, 17, 19, 21, 25 and 3, 5, 8, 9, 12, 14, 16, 20,
22. 28 in the green mussel Of all the loci, the locus in the foot numbered 14 in the
brown and I 5 in the green mussels have produced intensly stained major bands
differentiating the two species easily at one glance. The species specific loci in the
gill tissue of the brown mussel were the numbers 1, 5, 8, 9, 12, 14, 16, 18, 24, 26
where as such specific bands in the green mussel were 2, 4, 7, 10, 11, 13, 15, 17,
21, 22, 23, 25, 26, 28. The species specific enzyme loci (MDFI) were 2, 4, 5 in
the green mussel whereas these were 1,3 in the brown mussel. The specis specifc
esterase (EST) enzyme loci in the adductor muscle of the green mussel were 2, 3,
5. 6. 4, 9 whereas these were 1,4,8.10 in the brown mussel.
M
4.7. M O R P I I O M E T R I C S
4.7.1. Discriininent analysis :
I mm the result of the discriminent analysis, it is concluded that both green and blown mussels ate morphologically two distinct species (Table 6). According
to the result o f discriininent ana!ysis,since P(G, /D)<(G2/D)(Table 7b) the suspected brown type hybrid,whose shell shape is morphologically similar to
brown but having external shell colouration like the green mussel, is actually
having the same morphomertics of the brown mussel. Similary, it is interesting to
note that since P(Cij/O) P (CJj/D) ( Table 7a) the suspected green type hybrid
whose shell shape is similar to green mussel but having brown colour on top with
green posterior edge is actually having the same morphometries of the green
mussel.Therefore, the suspected brown and green type hybrids are not
hybrids Since their morphometries are not different from the respective species
these green and brown types are not varieties of the green or brown mussels.•V4.7.2.Principal component analysis:
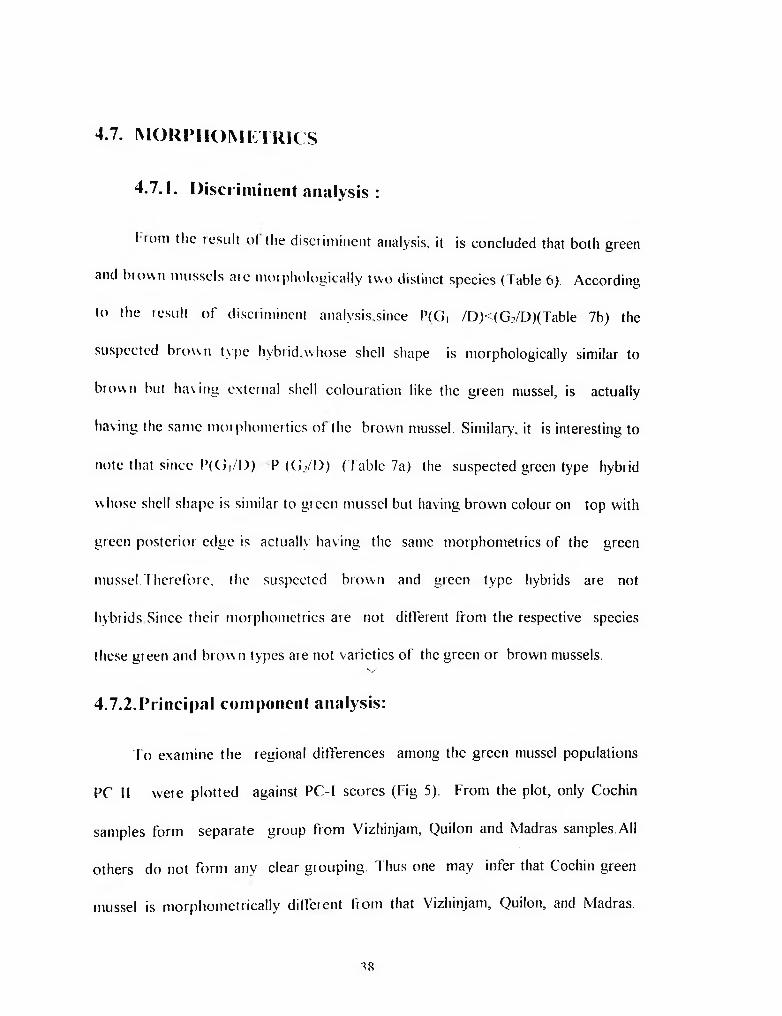
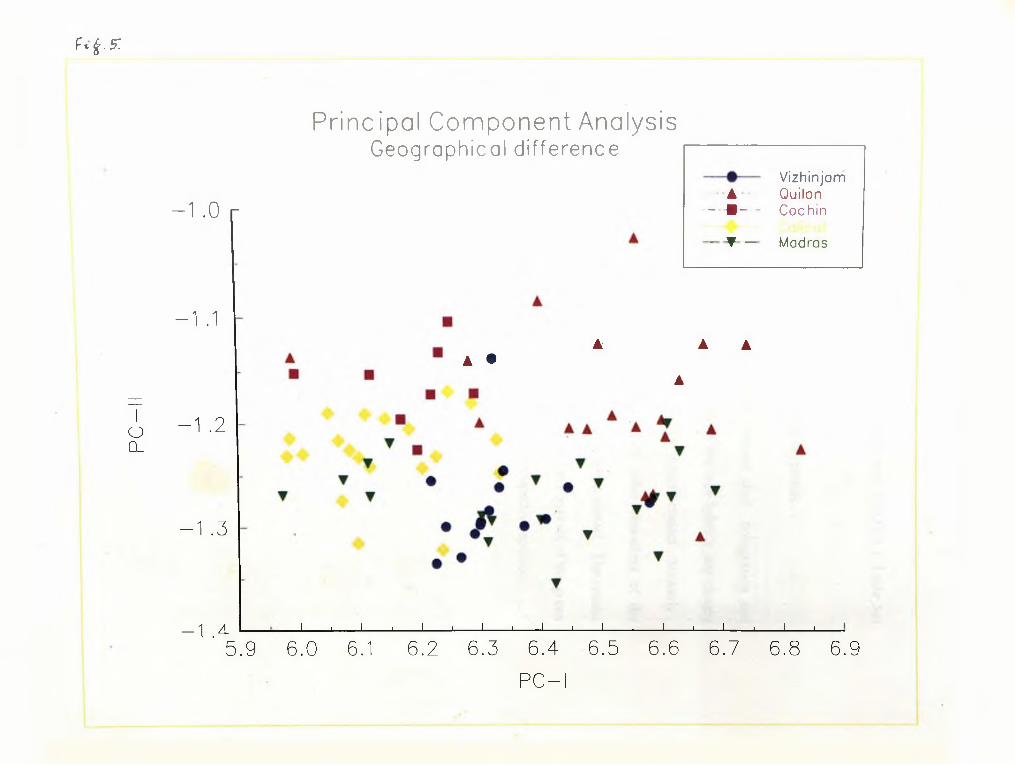
To examine the regional differences among the green mussel populations
PC II were plotted against PC-I scores (Fig 5). From the plot, only Cochin
samples form separate group from Vizhinjam, Quilon and Madras samples.All
others do not form any clear grouping. Thus one may infer that Cochin green
mussel is morphometrically different from that Vizhinjam, Quilon, and Madras.
38
PC
-II
f t £ . 5 :
Principal Component AnalysisGeographical d i f fe rence
-1 .0 r
-1 .1
-1 .2
-1 .3
-1 .4
Vizhinjam— A - • Ouilon- ■ - Cochin
- ▼ - Madras
A •A A A
A
J _____ I_____ I_____ 1_____ I_____ 1_____ I_____ I_____ I---- 1_____ I_____ I_____ 1_____ I_____ 1_____ I_____ I_____ L.
5.9 6.0 6.1 6.2 6.3 6.4 6.5 6.6 6.7 6.8 6.9
PC- I

( ochin is not that diiTerent from Calicut stock One way ANOVA ( Table 5c)
have shown significant difference between centres.
4.7.3. Morphometries of two suspected hybrids :
All the moipliologieal characters except external she!! colouration and number of hinge teeth ( i able 3) o f the suspected brown type hybrids are closely
comparable with the moi phological characters o f the brown mussel.. Similarly,
except the external shell colouration (Table.3) all other characters of the
suspected green type hyhiids are similar to that of the green mussel. The results
shows that the suspected brown and geen type hybrids are not hybrids of the green
and brown mussels but are diiTerent colour morphs of the respective species, y ' '
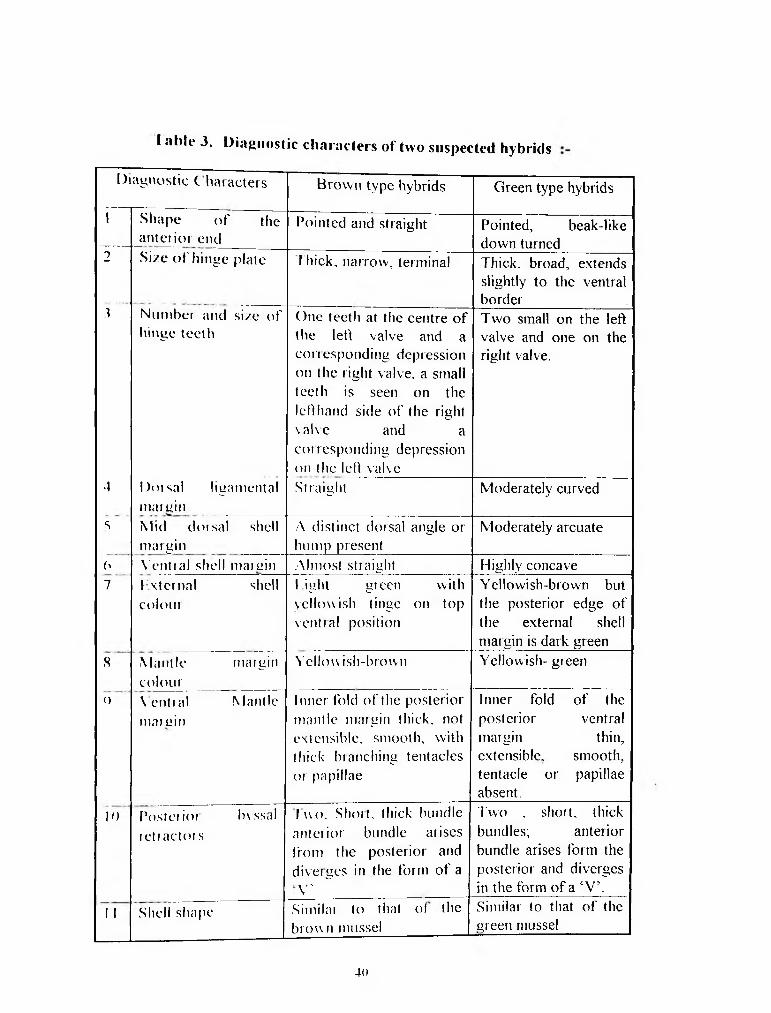
I able 3. Diagnostic characters of two suspected hybrids
1)1agnostic C haracters Brown type hybrids Green type hybrids1 Shape o f the
anterior end Pointed and straight Pointed, beak-like down turned2 Si/e of" hinge plate I hick, narrow, terminal Thick, broad, extends slightly to the ventral border1 Number and size of
hinge teethOne teeth at the centre of the left valve and a corresponding depression on the right valve, a small teeth is seen on the leflhand side of the right valve and a cot responding depression oil the leM valve
Two small on the left valve and one on the right valve.
•1 Doisal ligaincntal niii uin
Straight Moderately curveds Mid dot st) shell
marginA distinct dorsal angle or luimp present
Moderately arcuate
0 Ventral shell mamin Almost straight Highly concave7 1 \ternal shell
colour1 ight green with yellowish tinge on top ventral position
Yellowish-brown but the posterior edge of the externa! shell margin is dark green '
X Mantle margin colour
Yellowish-brown Yellowish- green
o \ ential Mantle mamin
Inner fold of the posterior mantle margin thick, not extensible, smooth, with thick blanching tentacles or papillae
Inner fold of the posterior ventral margin thin, extensible. smooth, tentacle or papillae absent.
10 Posterior In ssal tetiactois
I n o . Short, thick bundle anterior bundle arises from the posterior and diverges in the form of a V'
Two , short, thick bundles; anterior bundle arises form the posterior and diverges in the form of a ‘V’.
11 Shell shape Similar to that ol the brown mussel
Similar to that o f the green mussel
40

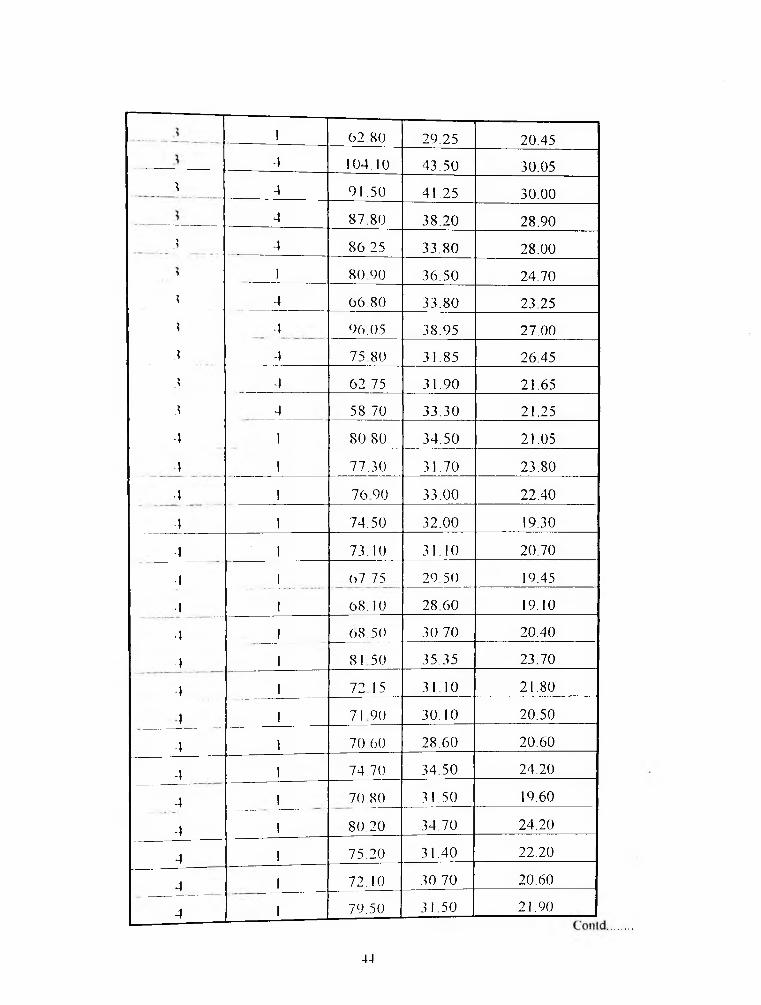
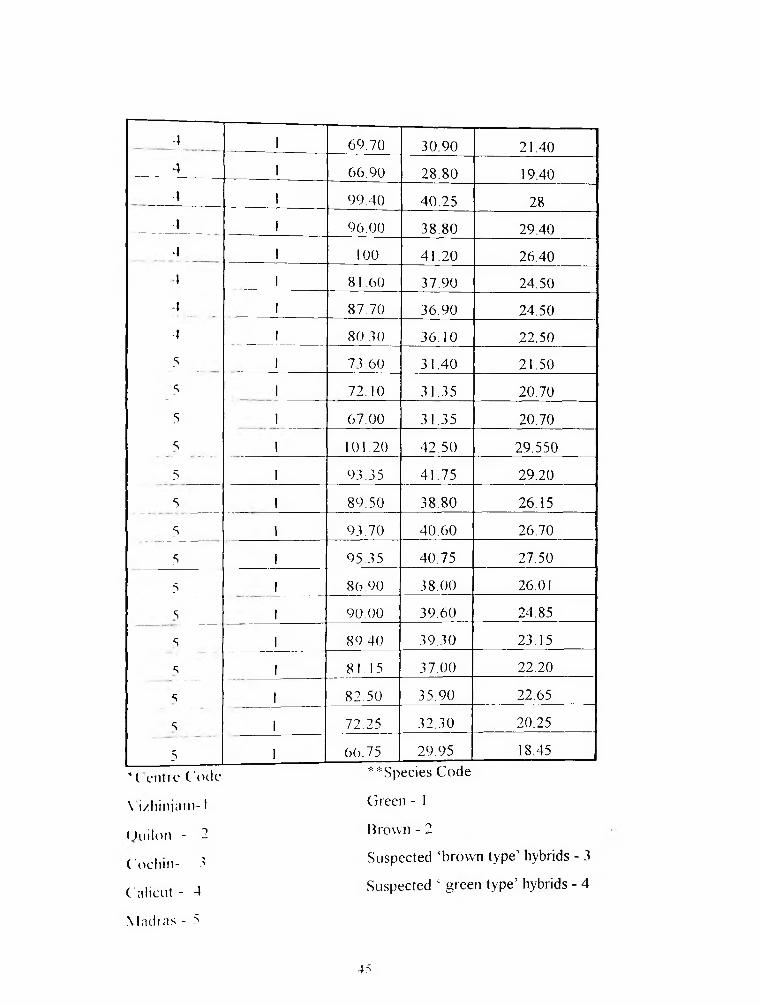
1 able 4, M o t pliom etric m easurem ents o f the mussels collected
from d ifferent regions.
M I N | R | DVL (in mni)
WIDTH (in nrai)
THICKNESS (in mm)
111
I 84 05 38.75 24.05i 84 40 45.65 27.20i 78.0 42.15 25.20
) l 73.30 37.95 20.65i i 73.0 35.15 21,851 l 80.30 39.40 23.351 i 74.90 38.65 21.301 i 77 30 37.65 22.301 i 75.30 38.55 22.35I11
i 73.85 39.35 23.40! 80 35 3110 25.55! 76 80 37.85 22.00
11
1 77 70 37.60 22.751 77.15 37.50 23.80
1 1 72 80 3 1.65 21.451 2 76.95 39.50 25.901 2 74.10 38.00 24.001 2 68.55 37.55 26.001 2 69 55 36.90 23.251 2 62.00 34.40 22.251 2 66.50 38.80 24.00! 2 (.'3 30 34.50 21.80
Could
41

1 2 6 1 1 0 37.80 22.301 2 63.20 36.60 22.25 1! 2 60.40 36.40 23.201 2 68.40 35.00 22.501 2 67.75 35.50 23.601 2 70.00 37.10 25.00! 2 65.40 36.50 21.601 2 65.10 35.80 23.801 2 66.75 34.20 20.6011!
7 63.00 35.10 22.102 68.80 35.60 23.402 71.90 36.00 25.00
1 2 65.50 36.10 24.101 2 53.60 24.20 17.901 2 55.00 28.00 19.00] 2 56.10 29.80 18.901 2 56.40 30.30 17.401 2 51.80 25.30 18.251 2 59.20 25.30 16.00I 2 51 80 26.55 18.55I 49.40 27.15 17.1511 2
5 1.90 26.55 18 1551.80 26.70 17.25
1 3 72.80 42.35 25.101 3 67.65 37.30 22.201 3 67,45 35.50 23.901 3 65.55 38.45 22.651 63.40 34.35 22.501 3 64.65 35.30 22.0
Contd.
42

____ ____ 1 59 10 30.20 21.452 i 90.25 40.90 32.35
i 74.15 40.20 32.302 i 73.20 36.30 24.05
i 57.30 31.35 20.602 i 80.30 40.30 26.85*■> ! 76.30 32.40 24.85
1 72.25 36.75 27,901 85.90 41 05 28.35
*> 1 82.65 37.10 28.902 1 82.00 38.20 26.35"> 1 102.00 47.25 33. .302 I 95.90 41.65 33.85
1 o 1 92.65 39.45 30.751 90.80 44.45 30.67
2 1 89.6:5 41.80 29.052 I 89.10 41015 29.307 1 92.60 41.65 27.50O 1 98.95 44 00 28.002 1 96.05 39 70 27.253 1 85.55 39 JO 27.853 1 74.35 32.80 22.053 1 72.20 32.05 25.003 1 72.05 32.05 22.151 1 74.45 34.50 24.423 i 73.88 32.24 23 313 I 72.27 32.20 22.233 1 67 70 31.00 22.15
Contd.
43
1 62.80 29.25 20.454 104.10 43.50 30.05>> 4 91.50 41.25 30.004 87.80 38.20 28.90
>> 4 86.25 33.80 28.00> 1 80 90 36.50 24.703 4 66.80 33.80 23.25? 4 96,05 38.95 27.00 |3 4 75 80 31.85 26.45>> 4 62.75 31.90 21.653 4 58.70 33.30 21.25-1 ! 80.80 34.50 21.054 1 77.30 31.70 23.804 1 76 90 33.00 22.404 1 74.50 32.00 19.30•1 1 73.10 31.10 20.70■1 1 67.75 29 50 19.45■1 ! 68.10 28.60 1940•I 1 68 50 30.70 20.404 1 81 50 35.35 23.704 1 72 1 5 31 10 21.80I 1 71 90 30.10 20.504 1 70.60 28.60 20.604 1 74.70 34.50 24.204 1 70 80 31.50 19.604 1 80 20 34.70 24.204 1 75.20 3 1.40 22.204 I 72.10 30.70 20.604 1 79.50 31.50 21.90
4-1
4 1 69.70 30.90 21.404 1 66.90 28.80 19.404 1 99.40 40.25 284 1 96.00 38.80 29.404 1 100 41.20 26.40I 1 8 1 60 37.90 24.50
4 ! 87.70 36.90 24.504 1 80.30 36.! 0 22.505 1 73.60 31.40 21.50s 1 72.10 31.35 20.705 1 67.00 31.35 20.70s 1 101.20 42.50 29.5505 1 93.35 41.75 29.205 1 89.50 38.80 26.155 1 93.70 40.60 26.705 1 95 35 40.75 27.505 1 86 90 38.00 26.01s 1 90.00 39.60 24.85s 1 89 40 39.30 23.15s 1 8115 37.00 22.20s 1 82.50 35.90 22.65s 1 72.25 32.30 20.255 1 66.75 29.95 18.45
** Species Code Green - !Brown - 2Suspected ‘brown type’ hybrids - 3 Suspected ‘ green type’ hybrids - 4
‘ ( f i l l t e C o d e \ i / h i n j a m - 1
O u i l o n - 2C o c h i n - 3 C a l i c u t - -4 M a d i a s - 5
45

I ulileS. Results of principal component analysisMeasurements IA [ . uidth <YV), Thickness (T)Species (.iieen nnissel
( ode No Centres :
1 Vizhinjam (15)Quilon (20).
1 Cochin (8)• Calicut (20).5 Madras (21).
(a)
I’C *1 iucn value Percentage Cum.percentage
1 3 7002 86.33 86.33 !
0 3384 7.90 94.22
> 0 2-176 5.78 100.00
(l>) I iucn >ccto rs :
IM M:
0 527305 - 0 456040 0.716345:n 548335 - 0 461014 - 0 697707:
( , (,1<>()5‘> 0 700702 0 007465 :M<IIM
* 1 i-cn \ alue is the ratio o f the between groups to within groups sums• . nines are associated with good functions (Morusis,1993)squares l arge eigen vau lts ate

(c) Analysis of variance (anova) with pc scores
Source df SS MS F Probability1 with P C I
Betweeneenties
4 1.7571 0.4393 17.8590 0.00001
Wit hin eenties
79 1.943 i 0.0246
1 otal 83 3.700211 with
| PC-IIBetween cent! es
4 0.1563 0 0391 16.9278 0
Withineenties
79 0.1823 0.0023
1 otal 83 0 3380111 with PC-Ill
Betweeneenties
4 0.1 130 0.0283 16.5878 0
\ \ ithin centres
79 0.1346 0.0017
1 otal 83 0.2476
PCI > t)Yl,
PC II > Width
[’( ' I I I > I hickncss
47

lahlt (k l it stilts of disci imineiit analysis for grouping of green and I)rown mussel
(a) Croup means and standard deviations
Species Number DVL W I1 (> 1 77 90714 35.82603 24.24254
(8 7899.} ) (4.71383) (3.76253)•> ill 62.50833 33.22667 21.50667 ,
(7.4151 1) (4.76521) (2.91943)1 ota! 9', 72.93978 34.98753 23.36
( 1 ! 03541) (4.86053) (3.72564)
(h) Pooled within - groups correlalion matrix
DYL W Tl ) \ l 1.0
\ \ 0.80953 1.0I 0 81 121 0.80222 1.0
(c) Wilks I.am hda ( I -Statistic) and univariate I--ratio with ! and 91 df
Wilks I ambda I7 Significancemi 0 56f?S’S 68.68 .0000w 0 93082 6.137 .0151i 088081 12.31 0.0007
4.S

(d) C anonical Discriminant Functions
1 unction l-igen Value % o f variance Cum % Cononicalcorrelution
1* I 4056 100 100 0.7644
After wilks
function W ilks lambda Chi-squre df Significance0 0 4157 78.563 3 0
* Marks the I canonical discriminant functions remaining in the analysis
(c) I'nstandardised canonical Discriminant function remaining in theanalysis
I U N (' I|)VI. 02170293W - 0 1803082| - 0 1280625C onstant - 0 258809Discriminant Function (DF)= 0.2176293 I)VI- - 0.1893082 W - 0.1280625 I - 6.258869
(f) C anonical DF evaluated at Croup means (Croup centroids)Group Fun I1 0 80929-» -1.69950
49

CaseNo
ActualGroup
1 lighest Ciroup Probability 2nd Highest Discrim
ScoreP (D/G) P(G/D) Group P(G/D)
I 1 1 4191 .9944 i .0056 1.6173-> 1 1 4091 .7458 2 .2542 -.01623 I** 2266 .5283 1 .4717 -.4903•1 1 1 3448 6850 2 .3150 -.13545 1 1 5264 8260 2 .1740 .17576 1 1 9149 9468 2 .0532 .70257 1 1 4167 .7520 2 .2480 -.00298 1 1 8191 9291 2 .0709 .5806l> 1 1 4005 .7384 2 .2616 -.031410 1 * * 2861 6156 1 .3844 -.63291 1 1 1 2848 .9971 2 .0029 1.878912 1 1 .7362 9090 2 0910 .47241 * 1 1 8495 9353 2 .0647 .6195II 1 1 6708 .8890 2 .1110 .384315 1 1 2717 .5962 2 .4038 -.2898If' •"> * * 1 2644 .5859 2 .4141 -.306817 1 2266 5284 2 .4716 -.3997IS -> 6 > 70 .9659 1 .0341 -.1.7785l ‘> 5393 8330 1 .1670 -.1.085720 -> 6687 .9855 1 .0145 -2.127421 6 1 3 1 9881 1 .01 19 -2.2052-> ~> 0153 968 1 1 .0319 -1.80582 ^ 2027 .9982 1 .0018 -2.9734
24 1 7 5597 9901 1 .0099 -2.2828*■> 2299 .9979 1 .0021 -2.9002
Contd.
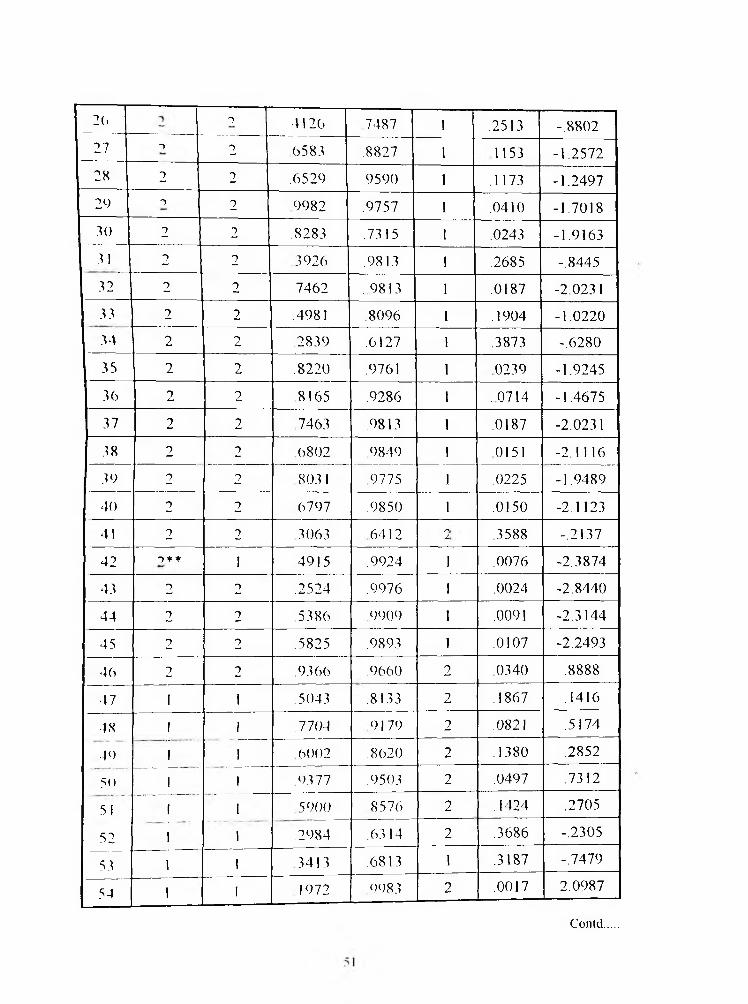
26 n 4126 7487 1 .2513 -.880227 -> 2 6583 .8827 1 1153 -1.2572 ;28 2 2 .6529 .9590 1 .1173 -1.24972C) *■> 2 9982 .9757 1 .0410 -1.701830 2 2 .8283 .7315 1 .0243 -1.916331 2 2 3926 .9813 1 .2685 -.844532 2 2 7462 .9813 1 .0187 -2.023 133 2 2 .4981 .8096 1 .1904 -1.022034 2 2 .2839 .6127 1 .3873 -.628035 2 2 .8220 .9761 1 0239 -1.924536 2 2 8165 .9286 1 .0714 -1.467537 2 2 7463 .9813 1 .0187 -2.023138 2 2 0802 9849 1 0151 -2.1 11639 2 2 803 1 9775 I .0225 -1.948940 2 2 6797 .9850 1 .0150 -2.112341 2 2 3063 6412 .3588 -.213742 *■> * * I .4915 .9924 I .0076 -2.387443 2 2 .2524 .9976 1 .0024 -2.844044 2 2 5386 9909 1 .0091 -2.314445 2 2 .5825 .9893 1 .0107 -2.249340 2 2 .9366 .9660 2 .0340 .888847 i I 5043 .8133 2 .1867 .141648 f 1 .7704 9179 2 .0821 .51744<) I 1 0002 .8620 2 .1380 .28525tv ! 1 ()377 .9503 2 .0497 .731251 ! 1 5900 8576 2 .1424 .270552 1 1 .2984 .6314 2 .3686 -.230553 1 1 3413 .6813 1 .3187 -.747954 1 I 1972 9983 2 .0017 2.0987
Contd.

55 1 1 4804 .9927 2 .0073 1.514956 1 1 .5811 .9893 2 .0107 1.361157 1 1 5381 .9909 2 .0091 1.425058 I 1 .7625 .9803 2 .0197 1.111559 1 1 .6808 .8953 2 .1047 .410160 1 1 .9141 .9467 2 .0533 .701561 1 1 .5587 .8429 2 .1571 .2245
! 62 1 1 .3464 .9960 2 .0040 1.750863 1 1 .9637 .9540 2 .0460 .763864 I 1 .7980 9779 2 .0221 1.065265 1 1 .8071 .9772 2 .0228 1.053566 1 1 .6589 .8849 2 .1151 .367867 1 1 .8940 .9434 2 .0566 .6761 168 1 1 .4730 .9929 2 .0071 1.5269
1 60 1 1 .6098 .9882 2 .0118 1.319670 1 1 8626 .9729 2 .0271 .982471 1 1 1428 .9989 2 .0011 2.274972 1 1 .6244 .8720 2 .1280 .319773 1 1 6561 8839 2 .1161 .364074 1 i 4919 ,9924 2 .0076 1.496675 | * * .8660 .9726 1 .0274 -1.868376 1 1 .2759 .6020 2 .3980 -.280277 , - 1 .5079 .9919 1 .0081 -2.361678 1 1 5092 .8162 2 .1838 .149270 I I 8251 .9759 2 .0241 1.030380 1 +1 .5259 .8257 1 . 1743 -1.065281 1 1 .8223 .9761 2 .0239 1.03388 7 1 1 ,8457 9743 2 .0257 1.003983 1 I .8639 .9728 2 .0272 .9807

HI 1 1 0548 .9997 2 .0003 2.730085 1 1 1 134 9992 2 .0008 2.392286 1 1 .0912 .9994 2 .0006 2.498487 1 1 .7262 .9825 2 .0175 1.159488 1 1 .4185 .9944 2 .0056 1.618389 1 1 .4352 .9940 2 .0060 1.589690 1 1 .0934 .9994 2 .0006 2.4872 191 1 1 0107 .9999 2 .0001 3.360292 1 1 .0047 1 0000 2 .0000 3.639293 1 1 5609 .9901 2 .0099 1.3908
* * mis identified(g) Classification results
Actual group No of cases Predicted grou p membership1 2
1 (Green) 63 57 90.5% 6 9.5%2 (Brown) 30 3 10.0% 27 90%
Percent ‘grouped” cases correctly classified : 90.32%
(h) Summaries o f Discore IBy levels o f SpeciesVariable Value levelCases
l ot entire population I 4516h-1 5 Species Species
Discriminent Score
Mean SD
I 5425511 93
1 (Green) 0.8092865 1.0946477 63
2 ( B r o w n )-1.6995016 0.7590437 30
(i) A NOVA
Sow cc SS df MS F Siglic luecn uroups 127 9107 1 127.9107 127.9107 0.0000
Within uroups 9 1 0 91 1.0I ta 0 764 I I-ta squared 0 .5 8 .4 3

Rema
rk A —
o Qo ^5 s r ^
r r ; r rV ^
6 9!A
O £
(QAOM o o o o'TOOd 0.4
376
o
0.001
0.605
4 ZOO
r iaQ
! O"o o o O 0.0
020.2
92 oNOood 0.3
847
0.025
2
r >N 7.75
4.88
7.76
5.57
3.92
0.793
7.26
3.32
0.376
2.35
Pae_
oo Oo oo
OO'l9866 0 0.562
4 oo
06660 0.394
6 0086 0
o9CL. 0.0
035 o ci r io'
oonroClo ’ 0.116
3
o'OOoooo 0.0
093
0.398
90.0
508 60c£'0
rsjrfOOOn
60 l 1.0114 1.5
70.4
2-1.
741 2.744 100 -2.03
-0.66
Discr
im
score
i4
18509
■
2.003
371.9
1640
i 2.5
2729
1.274
44-1.
0973
03.8
1318
30.8
2071 Tf
"vf1 0.0
8394
Case
1 Nu
mber
— r i rn -r o r- CO O'’ 0
54

Rema
rk
PaCl.A
acC
R - £ s
QO£X 0.7
661
0.7531
ooxr00o ’ 0.6
451 660
0.962
7 9866 0
rsaQa-
61500
00ooo' 0.2
943
0.196
50.3
836 61610 0.3
034
r - iN
2.221
218
2.319
499
0.780
853
1.191
764
0.280
091
------
-----
------
-----
------
-----
------
-----
------
-----
1.216
928
-0.74
396
QaaT 0.2
329
0.246
9 r iur>OO
On"nTtncno'
1900 0
r-mOOoo©
P (D/
G,)
orno'NOvOrnO 0.0
863
0.137
4 0Oo 0.1
415
0.007
9
NJ
-0751
64-0.
6834
9-1
.7504
1-1.
4654
8-2.
0976
-1.44
803
-2.80
774
Discrim
sco
re
-O.01
35 11900 -1.10
68-0.
7949
-1.48
69-0.
7758
-2.26
42
Case
Numb
er
— r i »/■> -6
55

Table
8. Sta
ining
intensi
ty and
thic
kness
of est
erase
bands
in dif
ferent
tissu
es of
Green
, Brow
n and
~
* sus
pected
‘bro
wn t
ype’
hybrid
muss
els.
56
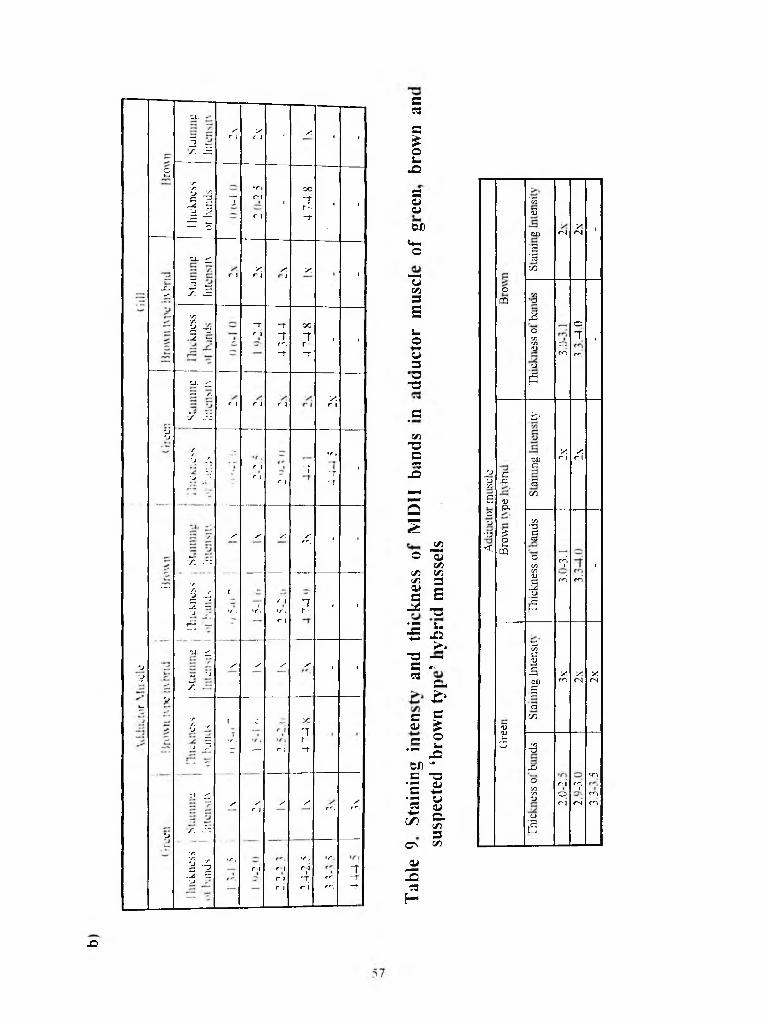
c-L 03
5 ~r. .S
/* r j y r ) ' y ♦ ■
S£Ou
£ X 5
lluck
ncs
s
ol ha
nds
-7•/"» r i
r i•
oc"Tr --T
• ■S0 >CU
o x
'5353
CXi <N Xrs| 1
U. ^
r- 1 X r j x1
X 1
«*-.0
—
;g£
00
-5 5 ~7. S.
CJy j3
0cn
v>*v2
X
i - -<i r
*T r j
~r7tr .
-r
OC
*7r- r
• •
s
u0■*—u3
c3X)O71m91
0
Oro
OT
r<-j■
SJ< rl" /. /. r |
" 3T 3 fS
7 ?zr 1 r 1 r j
_ C i -
y//•.•j /.
■ * ; ■ j , •
-
r 1 r 1 r 1
"1
• r (
~T~r
■
c/3■ ac^3
- Q
X
j j0C/3
E
c-p
0
CDC
300
X r-1 X r j
Q
S
£0 a j
or(/) C/3 </j 3 a» B
5 1
p*
.7: .r:
x x x yr<~. • 1
OO
T3<
g0Ui
ca
'y>”3cS:C3
OC/3C/)
r i1 1
— ■r.
£ * .u: ~ ‘ J
r
>/■. >r,r i »r, r i
7r- • ■
1)50s
r i r»"i
rn “ S is'J'J•r.
-j, ^
~ ■-> 7:
/ y y y • •
> * ■ a — c -!3
Cm
&
= sa» £
ung
lnte
nsit
Xm
XfN
XfN
V-V
■r
G -r z s:
7r- r
Goju.
a
a
00
5■-» x
v- r J
e 0
- 5S I ) -
73TJ
X2•O
fOm
0
Cl. ^
A . r :
y yr I
y y r'",X
r*\ Staini
nms
pecte
d 0t/3731>
L>
s
r iOrvj
r«",1
rN
■r.
2 - 3 . 2 S •->
>r,r 1 r i
r }r i
<r,r i4r i
• r>
r*",r*~,
7- r- r Ta
ble
9 s
J2

Table
10. Sta
ining
intensi
ty and
thic
kness
of gen
eral p
rotein
band
s in
differ
ent ti
ssues
of gre
en, br
own a
nd
suspec
ted ‘
brown
typ
e’ hyb
rid m
ussels
G
u.
-jr.
Xo i
Xo l
X r 1 X
r j XfN
. 4x
J
Xo j 2\ X X i i i i - i • i • ■
•SiT.'■J
~204o iOl
>/">o ii- ro i
r"!•
rn
Of"',iOC
OC
7o- r
vCvS*4'O
04
Oo
\Co• n■.c
Os1
OGsC
r -r -ioK
i i ■ • ■ i 1 ■ • 1
J J
r3
"J
cu.
CiJ
£J/n
Xr l
Xr i
Xn
X.- r
Xr j
Xo j
X04 ■ X
04 • ■ i ■ i ■ • i ■ 1
v.'/i' j
3U
r-*
r i o i r I
>n o i -T r I
•r»
os
OO7
- r
O»o»*4Tv
r ' l• c
-C•A■6
-
r -r r'.Dt
i * ■ ■ ■ ■ • i • ■
co
Cl,
3'7 .
Xr j
Xn
Xn
Xr|
X- r
X X Xr«~, X Xr l • i i i i ■ 1 • i 1
v:T.ZJ
5u
o i• roi
r'",
r<%'/*>r*~.
Or^,
«OC r*~i
r*"j
2
-T
c>
7r -- r
»/~)'/->1T•o
'T00•n
C -1
1r -
r -r -i • i •
'J■jr.
j
■6
o
Ci
3■s.
Xc l
Xo j
X r i
Xo j
Xo|
X.* r
X04
Xr-4
XTn|
X.o l
Xr-J
XfN
Xrn
Xo jX X X
o lX X X
r."J
.2
rff
— >r>
- r
X
t
“ T
f'',
•oo irn<~i
00o ir^04
r*'.ro
OC r j
2
- t
- r
Tro~r
7
- f
On
7r -- r
•n>r,tfr\>ri
TO\6
r -
«nvd
o jS■
K
- ri
roK
'OK
o
s’
"J"J
•7:
X r 1
X r I
X r J
X r i
X r |
X- r
X r 4 X r 1
Xr J X r i
X r 1
X04
Xro
Xo i
X X Xo4
X X X
Ay.
-)
Zl
/
r.■r.
J
-■ r i
T
X
r - -7
- r 'r\ r i r*~, r i
OCo irr i
r<~, <r ,i
OC
r<".
r 1
2- r
-T7
- f
vO77- f
7r -- f
« o1
•ri
or -
<ovd
04Ki
- rr - '■
s
SOK
X X X X X X r l
X X r I
X r )
X X r l
Xr i
Xo i i ■ ■ ■ ■ ■ i
T
'
rr - ii
- ro i
r J
<r .
r io4
7
r<~,
rr>
1 r- i“f
r -
T~r
r-Jr -
T>n
04r -ir -
»or -i
r :
• i • • < 1 •
58
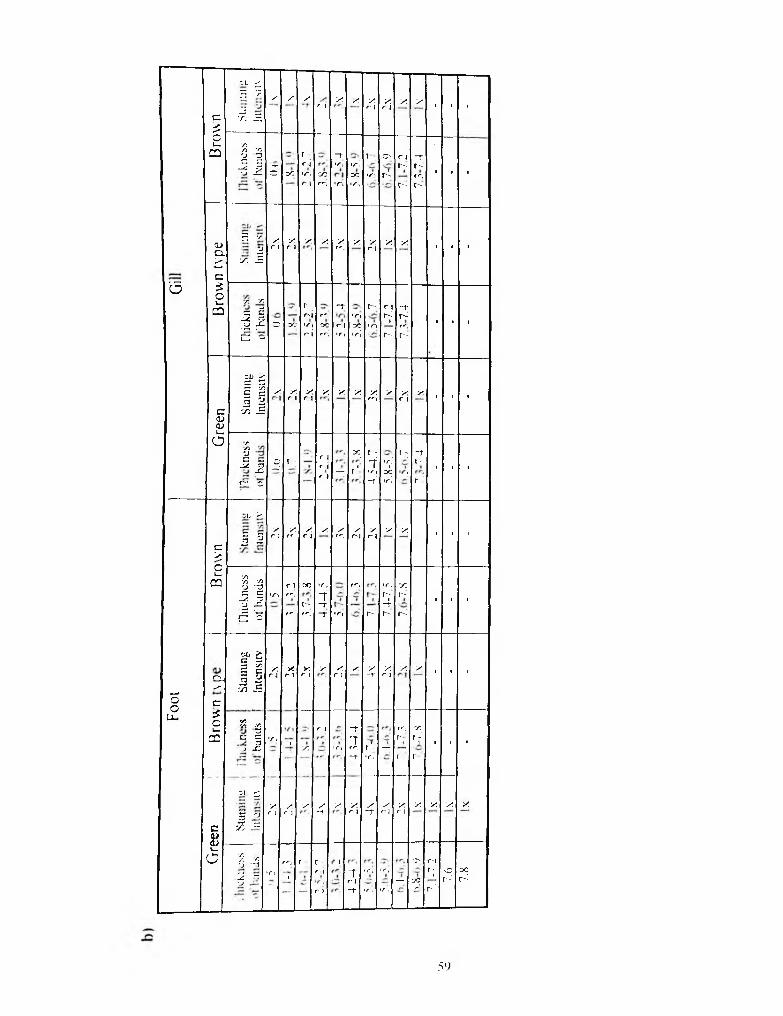
b
Br
ou
n
ci. £
5 ^r:
’7; £
/ / Xf j
X X X r J X
r 1X X
■ ■ •
■A.r. -r.
H H J2 ^'J _c 5 O C
rr i •/'■l r i
Xr*-,
~ r
ir .
T v
•riDC•ri
t
'/")
O
r-^
r tr -
r -
Tr -r»“,r -
■ • ■
Bro
wn
ty
pe
S 'r‘
3y : .5
/ r \
X. r J
/ / /r*’, X X
r 1X X
■ ■ •
- - s £
^ .-2 r z ~
d DC
r -r^i '/■> r i
r<",OCfr .
- r
r i •r*
'r\
dc*r\
T"
>r~)
r iKi
K
_ tr -rr,
r -• • i
C<D< Uu.a
Sta
inin
g
lnie
nsi
t%
X X r I
X r 1
S. X X XfO
X X r 1 X
• i •
r.Vi- j
-S j
t— ^
5 r - r 1 r i r 1 -
DC
t '
r -
T•Ai- r
'r,iX'/"i
r -
<
- f t •
r■ ■ i
Fo
ot
c>--*■oI—
CQ
zl. >
1 5X r i
xr»".
>1 r I
X XI-*-. Xo i
Xr-j
X X■ i i
| H
uc
kn
cs
s
i of
b
an
ds
*rir )r'.
rr .
DC
r -t*~.
'/■»
T - r"T •/*»
r*~,
r~
' r ,r -4r -
DCr -
r -■ i *
CL>■
c
Sta
inin
g
[nte
ns
itv
X r j
y.r 1X f' \
/ X r |
X X- r
Xr~l
X X■ i *
*cu-
c c
c
2Jv_
a
5 *t5
c s 3L> X-
i l ^
5 o
£ =
'f,i
yz
r 1
»r»
- rj
~rr '-•/■ i
-
fri
r -
t •
DCr-'i
r• * •
x.r |
xr I
x Xf
X X r- j
X- t
X r J
X r i
X X X X
2 r. *J " 3
.2 " •j
•r ir ' i
i
r r •r I
»r I
i
"7r j- r
<r,
>r ,
<r,
> r ,-
*7\
DC_r’
r-tr • i
r - ‘
vOr - '
DO ,K
59

Table
11. Sta
ining
intensi
ty and
thck
ness
of gen
eral p
rotein
band
s in
differ
ent ti
ssues
of Gr
een, B
rown
and
suspec
ted ‘
Green
ty pe’
hybrid
muss
elsCL >~ 7.
3 2 ■7: £
1 *f
!
/-T
/ Xr j
X
1 2x
.
J
s'ou.
j
-t
~r~rr*',*T
r - l
'ft•Y
OC•>c
~TKmr -
Ma
ntl
e
*_>
oi—
CJU ^
5 Soc .£■
/. r i
X. r j
XOl
X XT
X- r
X- f
Xr<~, Xn
X X X Xn
r ,•/: a ' J "O
. 2 3 id x -
- r r J r i
>r» r j -T r i
y ; < i t - r^i -T
~t'Tr'',- r
•n~T
r -
J
~r
r \*r>
■r>«A
"TKr r iK
r
o
cx r l~ r.
3 ~r. S.
/ r i
X r 1
/ r » X X- r
X X- r
Xf*",
Xr~J
X X X Xr )
■r.r. r. o O
_2 r3_> JZT «/■> r j
r j
'/•.TnJ4r J
cc r j r^- r- i
J
- r
"T7r*","T
«<n~T
r -
i
- r
r J
O•r\
o
•n
"Trprnr -
r - ;
%
'p.
uOyi
<
ZL ^P rI s■r. B .
X X r J
X r j
X- r
X r j
X X- r
X r 1 X X X
r iX
r j
■r,■r. v. o
J2 B~ ■r.
~TT -
r Jr-J
r i
r^j '/*> r }
y:rrr-r«~.
3-r
»r>~rr<~,t
«ri••r»
«ot -i-rr-
OCK
y
’j
~i, >
2 cr3 "Jr _S
X r I X r J X
r | X X- r
X Xi
X r J X r ) X r J
•r.r.
d 12 ?3
-J -Cf .
-r j >r>
r i
OC
t
'O
- r
•ri
OC
r ’'
•r^r -i- rr ‘
OCKr~r - ’
o' jL_
c/, ^p 33
5 ^7 : ^
XM X r j X r j X X- r
X X r | X r J X r J Xr \
X r ' i
’/ !i )
e'o -CnI
r j
DCr<",iT "r
'r,
7
~T
•O•r i
T •r\
OC
r -
» nr -i- rr~
OCr -r -K
<»<>
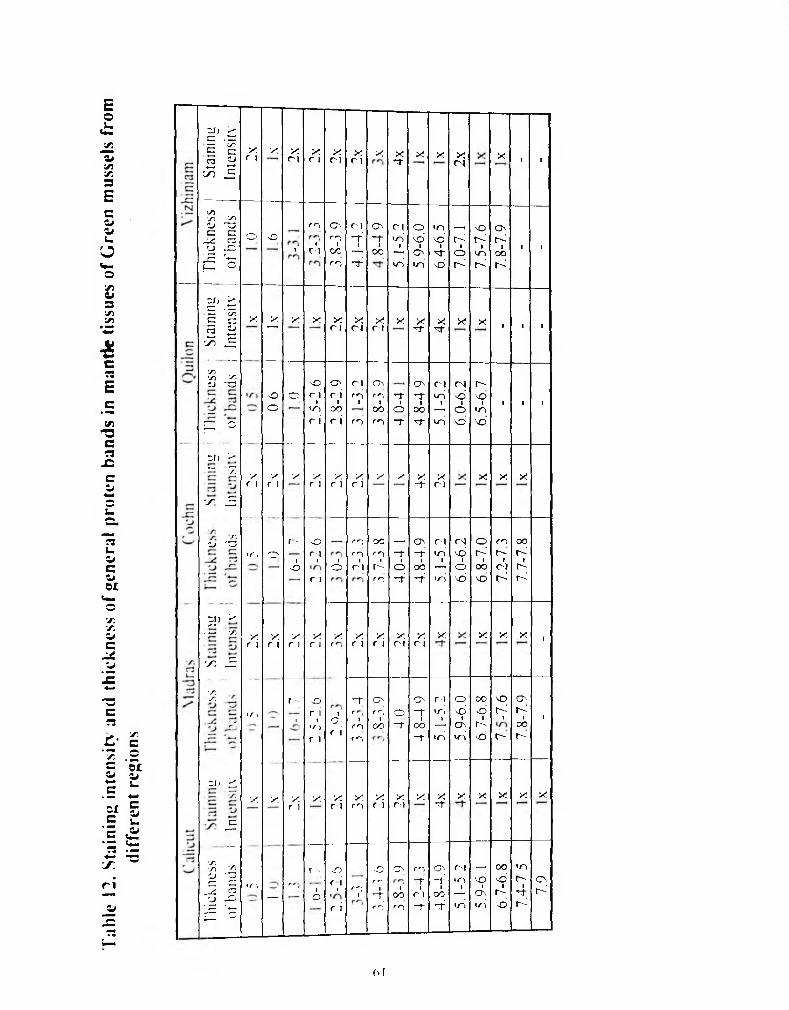
Table
12.
Staini
ng int
ensity
and
thickn
ess o
f gen
eral p
roten
bands
in ma
ntk
tissues
of G
reen
musse
ls fro
m dif
ferent
reg
ions
Staini
ngInt
ensity X r j X Xri X r i Xn X r i X 4x X X 2x X 1 I
I Thic
kness
1
ofban
ds O o tntn
ONrniCOrn 4.1-4.
2 On-riCO 5.1-5.
25.9
-6.0
6.4-6.
57.0
-7.1
7.5-7.
6 OnKiCOK■ l
Staini
ng 1 I
ntensi
ty X
X r i
»/■*
X r i
0.6 |
1\ X X XOj 2.x 2x X 4x 4x X X 1 I l
'VI-n S'. ZJ ~0 —
P- C
ZS) > “ "7!v' JE:
r.ZJ 'T3
j]) >. — xx iE■r.v:
—
Cl> >
j=
O or i ii-n r i
O'r i iCOr i
cir*~tirn
ONr**',iOOr n
-rio-r 4.8
-4.9
5.1-5.
26.0
-6.2 r"oiino'
1 l l
X r \
o
X r i
X
r-•o
X c i
X r i
oMir i
Xr j Xn X X 4x X(N X X X
i°mr n
ic - l
OOr^ i
ir->r n 4.0
-4.1
4.8-4.
95.1
-5.2
6.0-6.
26.8
-7.0 cn
r -i
o iK
OOKi
r -K
X c i
Xr
X C 1
X r i
L *? 2x X X X X 1
• a >
X X
r
i
Xr i
Or i i'f) r \
iO ; f 1
-Tr ifO f
O';r **-,
tCO o-r 4 8-4.
95.1
-5.2
5.9-6.
0 00'-bir~~-o'
oKtr-
O nK«OOr-l
X X r l Xr n
X r i 2x X 4x X X X X X
Thick
ness
ofband
s i
«/ I
—
n
r -
io
sOr i
i
r i
r i 3.4
-3.6 O
iOOn
r n
" fiC 1- r 4.8
-4.9
5.1-5.
25.9
-6.1
6.7-6.
87.4
-7.5
7.9
61

j z >
1 lie mussels within the Mytilidae have confusing morphological features.
Accurate identifications ot these mussels is a challenging job to the taxonomists.
As a icsult, many species under the Mytilidae have been redescribed or wrongly classified I he Mytihis and Perna are the major genus reported under the
Mytilidae 1 he taxonomic interrelationships of these two genus and their more
than 470 species have also been greatly confused (Siddall, 1980). The major
reason for such confusion, appears to be the consequences of the environmentally
influenced. non-genetic morphological/anatomical, often overlapping
characteristics used for taxonomic purposes (Seed 1968, Gosling 1992b).
The green and brown mussels of India was described, until recently, as
Mylihis species (Annandale 1916, Hornell, 1921, Gravely, 1941, Menon el a/.,1906) However. detailed investigation and analysis of its
morphological/anatomical features enabled Kuriakose and Nair (1976) to report
that the Indian green and brown mussels actually belong to the genus Perm and
not to the genus Myiilus Thus the green mussel was placed under the species
name / ’. vuiifis while brown mussel was described as new species under the name / ’. ini/ica However, the question is that whether these morphologically different
species o f the green and brown mussels are genetically different species ? It is
very well known that genetically controlled proteins/enzymes are present in tissues
o f organisms are potential genetic markers for accurate identification o f the species
(Ferguson 1980. Mur pin. et a!.. 1990). Thus the taxonomic problems in fishes
62
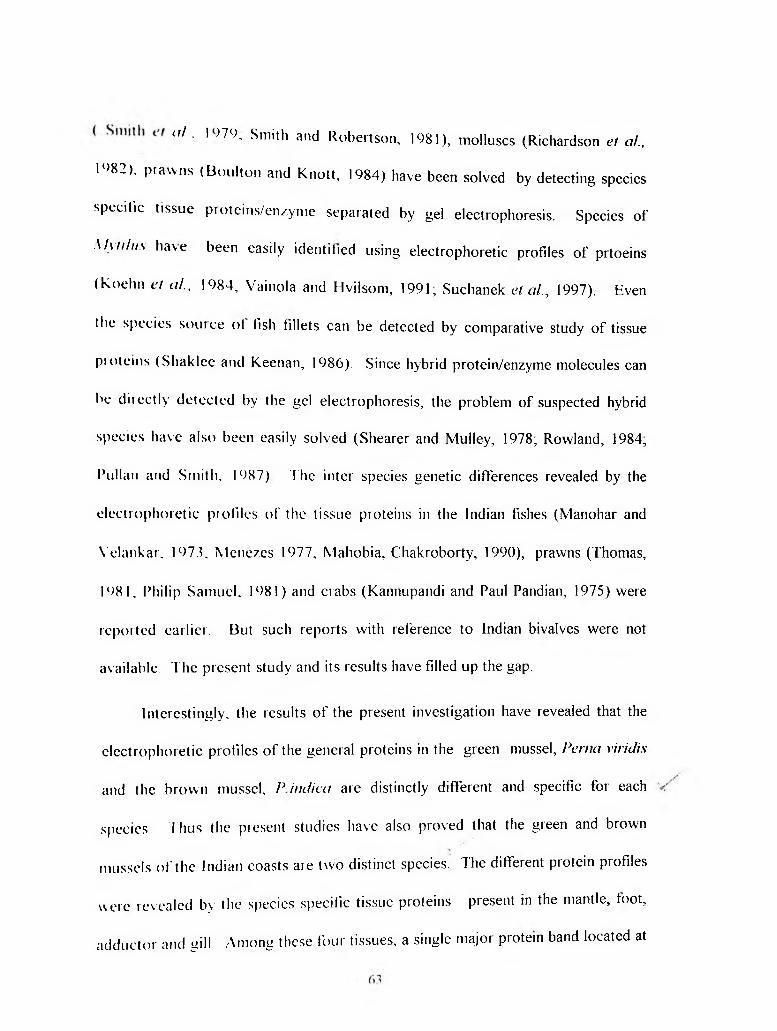
a! , 1 ,>79, Smith and Robertson, 1981), molluscs (Richardson el a!., I<>82)’ p,avvns (Boulton and Knott, 1984) have been solved by detecting species specific tissue psoteins/enzyme separated by gel electrophoresis. Species of
A A tt Ins have been easily identified using electrophoretic profiles of prtoeins
(kochn cl a/., 1984, Vainola and Hvilsom, 1991; Suchanek et al., 1997). Even
the species source of fish fillets can be detected by comparative study of tissue pioteins ( Shaklee and Keenan, 1986). Since hybrid protein/enzyme molecules can
be directly detected by the gel electrophoresis, the problem of suspected hybrid species have also been easily solved (Shearer and Mulley, 1978; Rowland, 1984,
I’ullan and Smith. 1987) The inter species genetic differences revealed by the
electrophoretic piofiies o f the tissue proteins in the Indian fishes (Manohar and
Yelankar. 1973, Menezes 1977, Mahobia, Chakroborty, 1990), prawns (Thomas,
1981, Philip Samuel, 1981) and crabs (Kannupandi and Paul Pandian, 1975) were
reported earlier. But such reports with reference to Indian bivalves were not
available. The present study and its results have filled up the gap.
Interestingly, the results o f the present investigation have revealed that the
electrophoretic profiles of the general proteins in the green mussel, Penici viridis and the brown mussel, Pittdica are distinctly different and specific for each
species Thus the present studies have also proved that the green and brown
mussels o f the Indian coasts are two distinct species. The different protein profiles
were revealed by the species specific tissue proteins present in the mantle, foot,
adductor and gill Among these four tissues, a single major protein band located ai
5 to 5 .1 cms in I'.viridis and at 5.6 to 5.9 cms in P. indica was the strongest
genetic marker that easily separated the two species (Fig.6). Besides, the
electrophoietic piotiles of the nialate dehydrogenase and esterase enzymes
obtained in these two species in the present study were also enabled to prove that
the gieen and brown mussels are two distinct species. The MDH band lacated at
I 9 to 2 6 was characteristic of the green mussel while the band (s) present in the
biown mussel was beyond 3 cm. Thus the electrophoretic profiles of general
pioteins and the enzymes, MDH and ES T, clearly established that the green
mussel I’.vindis and l \ indin are two distinct species as reported originally by
kuiiakose and Nair, (1976) on the basis o f morphological /anatomical
cluuacteiistics
The species specific protein profile in the brown and green mussels can be
described more accurately in an alternate way by quantifying species specific gene
loci in each species which actually controlled the production of the observed
protein phenotypes (Ayala and Kiger, 1980). Though the total number of protein
loci quantified in the gill, mantle, foot and adductor muscle was about 28 to 29 in
the two species, majority of the loci each tissue was distinct for each species (Fig.6) It means that the brown and green mussels o f India are two distinct genetic. ■/ species The enzyme gene loci were also species specific in the two species. It
means that the morphological/ anatomical characteristics considered by Kuriakose
and Nair (1976) were polygenic in nature and valid for the species under
considerat ion ( l a b l e I) It also means that wherever controversy on the
64
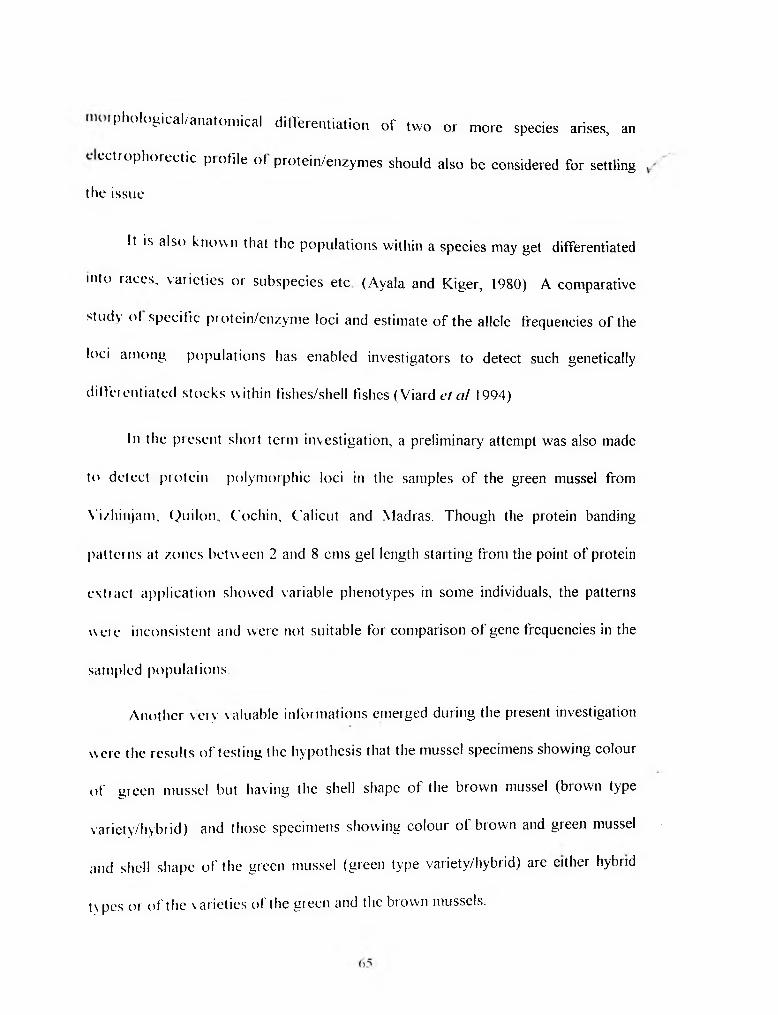
phological/anatoinical differentiation of two or more species arises, an
ectrophorectic piolile of protein/enzymes should also be considered for settling the issue
It is also known that the populations within a species may get differentiated
into races, varieties or subspecies etc (Ayala and Kiger, 1980) A comparative
study of specific protein/enzyme loci and estimate o f the allele frequencies of the
loci among populations has enabled investigators to detect such genetically
diffeientiated stocks within fishes/shell fishes (Viard el a! 1994)
In the present short term investigation, a preliminary attempt was also made
to detect protein polymorphic loci in the samples o f the green mussel from
Yi/hinjam, Quilon, Cochin, Calicut and Madras. Though the protein banding
patterns at /ones between 2 and 8 cms gel length starting from the point o f protein
extiact application showed variable phenotypes in some individuals, the patterns
were inconsistent and were not suitable for comparison o f gene frequencies in the
sampled populations
Another very valuable informations emerged during the present investigation
were the results o f testing the hypothesis that the mussel specimens showing colour
of green mussel but having the shell shape of the brown mussel (brown type
variety/hybrid) and those specimens showing colour of brown and green mussel
and shell shape o f the green mussel (green type variety/hybrid) are either hybrid
types or o f the varieties of the green and the brown mussels.

! lie electrophoretic profiles of the tissue proteins and the enzymes, malate delndrogenase (M D ll) and the esterase (ES T) obtained in these assumed
h\brids/\ aiieties and the green/brown mussels revealed very interesting results. In
title hybrids, the hybrid protein/enzyme patterns o f the suspected parents are
expected to occur I low ever, the suspected hybrid having shell shape of the
brown mussel and shell colour o f the green mussel showed almost identical protein v- and enzyme profiles of the brown mussel (P.indica). Similarly, the suspected
h> hr id having the shape o f the green mussel with brown and green shell colour also
showed identical protein/enzyme profiles of the green mussel (P. viridis), It
means that these two apparent hybrids/varieties are only two different colour
moiphs of the corresponding species and not true hybrids or varieties as suspected. v
However, the shell colour s o f these suspected varieties/hybrids were different from
the respective species and an explanation for the colour difference is required. It is
reported that such colour morphs are not genetically inherited in the blue mussel
My Ulus viiulis (Gosling , 1992). It means that the different colour morphs in these
two Indian Perna species are influenced by some non-genetic factors.
I he 'di-scrimincut analysis o f the morphometries o f the green {P. viridis) and
the brown ( / ’. nn/ua) mussels also produced very significantly different values.
The results again confirm that the green and the brown mussels of India are two
distinct morphological species. I his is an additional information to that of
Kuriakose and Nail (1976) as they did not apply the method of discriminant
analvsis for differentiating the two species. On the other hand, principal
66
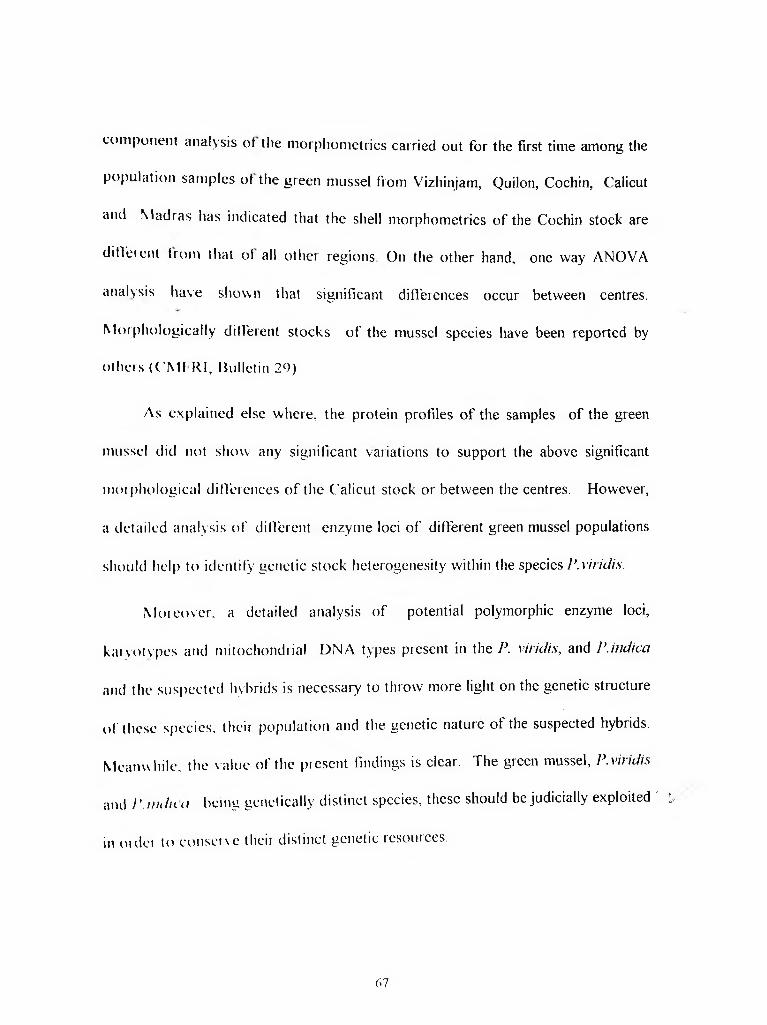
component analysis of the morphometries carried out for the first time among the population samples of the green mussel from Vizhinjam, Quilon, Cochin, Calicut
and Madras has indicated that the shell morphometries of the Cochin stock are
ditfeient from that ot all other regions On the other hand, one way ANOVA
analysis have shown that significant differences occur between centres.
Morphologically different stocks o f the mussel species have been reported by others (CM! RI, Bulletin 29)
As explained else where, the protein profiles o f the samples of the green
mussel did not show any significant variations to support the above significant
moiphological differences o f the Calicut stock or between the centres. However,
a detailed analysis o f different enzyme loci o f different green mussel populations
should help to identify genetic stock heterogenesity within the species P.viridis.
Moreover, a detailed analysis o f potential polymorphic enzyme loci,
karyotypes and mitochondrial DNA types present in the P. viridis, and P.indica and the suspected hybrids is necessary to throw more light on the genetic structure
o f these species, their population and the genetic nature of the suspected hybrids.
Meanwhile, the value of the present findings is clear. The green mussel, P.viridis and P.tndn a being genetically distinct species, these should be judicially exploited ' fy
in ordei to conserve their distinct genetic resources.
67


1 the tissue protein and the enzyme (MDH and EST) profiles in the greeni . i s i(I erna vi'rh/is) and the brown (P. indica) mussels were found distinctly
Adifferent. A striking genetic markar that easily differentiated the two
species was the protein fraction (locus) designated as number 14 in the
brown mussel and 15 in the green mussel (Fg.6). Large number of
protein loci were distinctly different in the two species. The green and brown mussels o f Indian coasts are genetically distinct species .
2 i he protein profiles in the mantle, foot, adductor muscle and gill are
tissue specific and species specific in the two species.
.V A comparative study o f the protein profiles and the morphometries in
the suspected brown and green type hybrid mussels and the
green/brown mussels revealed that the suspected hybrids are not,
infact, hybrids but different colour morphs o f the respective brown a n d /
the green mussels.
4 The principal component analysis produced significant values in the
Calicut stock of the green mussel. The ANOVA of the morphometries
in the meen mussel samples from Vizhinjam, Quilon, Cochin and Madras
also produced significant values between the centres.
68

u / j tn ia r y

1 he dissertation contains the results of a short term investigation entitled
Electrophoretic profile of the general proteins in the green ( Penia viridis Linnaeus ) and the brown (Penia indica Kuriakose & Nair) mussels”
/- 1 he aim of the investigation was of two fold. First, to study the
electrophoretic profile of proteins in the green (Penia viridis) and brown
{P. indica) mussels o f India with a view to understanding that whether the controversial green and brown mussels are genetically distinct species Second, to test the hypothesis that the mussel specimens having
shell shape of the green or the brown mussels but shell colour of the other
species or o f both may be hybrid of the two species.
2. To achieve the above aim, samples o f the green and brown mussels and
specimens o f suspected hybrids were collected..
3. Methods for extraction o f general proteins from mantle, foot, adductor
muscle and gill and their separation and detection by gel electrophoresis
were standardized A gel o f 9% using Tris HCl/Tris-glycine buffer
systems produced better separation and resolution of the protein fractions
(fa b le 10)
-i. The protein profiles in different tissues of the green mussel differed
significantly from that o f the brown mussel. The electrophoretic position
o f the many major or minor protein fractions of the green and brown
mussel were different and species specific. Majority of the 28 to 29
69
piotein fraction present in the gill, mantle, foot and adductor muscle tissue weie quantified as species specific gene loci in the brown and green mussels 1 he most striking species specific protein fraction or the locus
was revealed by the foot tissue. It was !4 in the brown and 15 in the
green mussels (Fig 6) Similarly the electrophoretic profiles of the
enzymes, MDU and esterases in the green and brown mussels were
significantly different. Hence, the green and brown mussels of India are genetically different species.
.5. I he electrophoretic profiles of the proteins in different tissues of the green
and the brown mussels were different and the pattern was tissue specific
in each species on account of the migrating differences in majority of the
protein fractions
6. Discrimiuent analysis o f morphometries of the green and the brown
mussels also showed that P. virkiis and P. itufica are morphologically
two distinct species
7. Discrimiuent analysis o f the morphometries of the green mussel (P. virkiis) with the suspected green type hybrid and that of the brown mussel
(P. i/h/ica) with that o f the brown type hybrid revealed that the
suspected hybrids are having identical morphometries of the respective
species I lie suspected hybrids are not hybrids of the green and brown
mussels but different colour morphs of the respective species.
70

S. I he principal component analysis o f the green mussel samples from
Vizhinjam, Quilon, Cochin, Calicut and Madras showed that Calicut green
mussel stock is different from the other regions. The ANOVA results
indicated that the above regional populations of the green mussel have
significantly different morphometries.
9. Finally, it was suggested that a detailed analysis of the polymorphic enzyme loci, karyotypes and mitochondrial DNA types in the green and brown mussels and their suspected hybrids may be carried out in the
future to throw more light on the topic.
71

‘kz/c.eterence#
Ahmad, M and Beardmore, J A. 1976. Genetic evidence that the “Padstow Mussel” is My Ulus galloprovinicialis. Mar. B io l, 35 : 139-147.
Ahmad, M., Skibinski, D O F. and Beardmore, J A., 1977. An estimate of the
amount ot genetic variation in the common mussel M. edulis. Biochem. Genet., 15 : 833-846.
Allendorf, F.W., N. Ryman and F.M. Utter, 1987. Genetics and fishery
management. In : N. Ryman and F.M. Utter (Eds ). Population Genetics and hishery management. Washington sea Grant program, university o f Washington press, Seattle, WA: 1-19.
*Annandale, N. 1916. Fauna o f Chilka lake. Mem. Ind. Mns. 5 : 350-360.
Ayala, F J and Kiger, J R. Jr., 1980. Modern Genetics. The Benjamin cammings
publishing company, California : 844
*Barsotti,G and Meluzzi, C , 1968 Observazioni Su Mytihis edulis. L.e My Ulus galloprovmciahs Lamarck C'onchig/ie (Milan), 4 : 50-58.
Barton N il Hewitt G M 1985. Analysis of bybrid zones.. A Rev. Kcol. Sysl.
16 113-148
Barton N 11 .1 lewitt, G.M 1989. Adaption, speciation and hybrid zones, Nature,
l and 341 497-503
Beaumont, A R Seed. R and Garcia-Martinez P., 1989. Electrophoretic and
morphometric criteria tor the identification ot the mussels M edulis and
72
M y I Hus galloprovinciahs. In : J. Ryland P.A. Tyler (Editors), Proc. 23rd Eur, Biol, Symp, Swansea, U.K., 1988. Olsen and Olsen, b'redensborg, Denmark : 251-258.
Boulton, A J , and Knott, B 1984. Morphological and electrophoretic studies of
the Pataemonidae (Crustacea) of the Perth region, Western Australia.
Australian Journal of Marine and 1'i eshwaler Research 35, 769-83.
Bulnheim, H-P and Gosling. E 1988. Population genetic structure of mussels from the Bailie sea He/gol. Meereiinlers., 42 : 113-129.
Buroker, N.E. 1983. Population genetics of the American oyster Crassoslrea virginica along the Atlantic coast and the Gulf of mexico. Mar. Biol 75 : 99-
1 12
Buroker, N E , Hershberger, W.K., Chew, K.K. 1979. Pupulation genetics of the
Family ostreidae U interspefic studies of the Genera Crassoslrea and
Saccostrea Marine Biology 54 : 171-184.
Buroker, Norman E , 1 tersheerger, William. K. and Chew, Kenneth. K. 1975.
Genetic variation in the pacific oyster ( ’. gigas. J. Pish. Res. Board. Can., Vo! 32 (12) 2471-2477.
Button, R S 1983 Protein polymorphisms and genetic differentiation of Marine
inv ertebrate populations. Marine biology letters 4 : 193-206.
7.1

Ii> e, V J and A G. Ponniah, 1983 In : Application of Genetics in Aquaculture. CMFRI. Spl. Pub/., No. 13 : 90.
C liakraborty, S.K., 1990. Electrophoretic study on muscle and eye lens proteins of
three Sciaenids. Indian J. Fish., 37 (2) : 93-98.
C Ml-Rl , Mussel farming, progress and prospects, 1980. Bulletin 29.
C MFRI, National Seminar on shellfish Resources and farming, 1988 Bulletin 42, part 1.
Comesana, A S and A. Sanjuan., 1997. Microgeographic allozyme dfferentiation
in the hybrid zone o f Myiihts gal/oprovinciafis Lmk. and M edulis on the
continental European coast. He/gokwderMeeresnnters. 51, No.l: 107-124.
( ’oustauc Renaud F „ Delay B. 1991 Genetic characterization of the hybridization
between My!Hus edulis and M galloprovincialis on the Atlantic coast of
France. A far. Biol. I l l : 87-93.
Dance, S P 1974 The encyclopedia o f shells. Blanford press, London : 288.
Doduc, II 1952 A historical review o f the mollusks o f Linnaeus. Bull. Amer. A///.V. Nat. Hist !00 :Article I . .263.
1 emuson. A . 1980. Biochemical sysffmalics and Evolution Blackie, Glasgow,
194
I etson S., Rohlf, F J and Koehn,R.K 1985. Measuring shape variation o f two
dimensional outlines Syst. Zoo/., 34 (1) : 59-68.
74
Heming, C A 1959. Notes on Newzealand Recent and Tertiary mussels (mytilidae) Dans.. Soc. N.Z., 87 : 165-178
Hank, V I , Khoo, J and Parker, G.R., 1990 Enzyme variation between littoral
and Sublittoral populations of the green-lipped mussel Perna canaliculus. ( 'omp. Biochem. Physio!., 95 (B) : 419-422.
f ujio, Y , Yamanaka, R and Smith, P J , 1983. Genetic variation in Marine
molluscs. Bull. Jap. Soc. Sci. Fish., 49 (12) : 1809-1817.
Gallardo, M U ; Carrasco, J I. 1996. Genetic cohesiveness among populations of ( 'oncholcpas concholepas (Gastropoda, Muricidae) in Southern Chile. J. -
Exp. - Mar - Bio! - Kcol Vol 197 No.2 : 237-249.
Galleguillos - G R ; Troncoso-G., -L. 1990. Protein variation in the scallop
Arxppeden pmpuratus and in the mussel ChoromytHus chorus. Mollusc- ( ’ulliire - in - Latin America :73-82
Gardner, J P A , A Pande, R.F Eyles and R.G. Wear. (1996) Biochemical
Genetic variation among populations of the Green shell mussel, Perm canaliculus, from Newzealand. Preliminary Findings. Biochemical systeniaiics and t.cology, Vol. 24, No.7/8 : 763-7/4.
Gartner - Kepkay, K E , Dickie, L.M., Freeman, K.R. and Zouros, E., 1980.
Genetic differences and environments of mussels populations in the Maritime
prov inces ( an. J. Pish. A(/uai. Sci, 37 . 775-782
75

Gartner - Kepkay, K.E., Zouros, E., Dickie, L.M. and Freeman, K.R., 1983.
Genetic dif ferentiation in the face of gene flow a study of mussel populations
from a single Novascotia embayment. Can. J.Fish, Aquat. Sci., 40 : 443- 451.
*Gmelin, J F. 1791. Linnaeus, C., Systema Naturae per Regna Tria Naturae. Ed. 13, Aucta, Reformata, Cura, J.F. Gmelin JJohniae, Vol. 1. Part 6.
Gordon, A.M., 1980. Electrophoresis o f proteins in polyarcylamide and starch
Gels. Elsevier North-Holland Biomedical press, Ameslerdam : 213.
Gosling, E M , and N P. Wilkins. 1981. Ecological genetics of the mussels
Mytihts edii/is and M galfapravincialis on the Irish coasts. Mar. Ecol. Prog. Scr 4: 221-227.
Gosling. E M , 1984. The systematic states of Mylilus gall opro > incialis in
Western Europe : a review Malacologia, 25 (2) : 551-568.
Gosling, EM, 1992 a. Systematics and geographic distribution of Mytilus. In:
EM Gosling (Editor) The mussel Mylilus : Ecology, Physiology, (ieneiics and ( 'til/nre. Elsevier, Amsterdam. Developments in Aquaculture and fisheries science, Vol-25 : 1-20.
Goslirm. EM, 1992 b. Genetics o f My tins. In : EM Gosling (Editor). The mussel Mylilus : Ecology, Physiology, Genetics and Culture. Elsevier, Amsterdam. Developments in Aquaculture and fisheries science, Vol-25 :
309 - 382 .

Grant, S 1987 South Africa’s mystery mussel AFR. WILD L./AFR- NA T U U R E W E , Vol. 41, No.4 pp - 175-179.
Grant, W S and Cherry, M l., 19B5. M gailoprovincialis LMK in Southern
Africa../. Exp.Mar. Bitt/.l-jjol., 90 : 179-191.
Grant, W S., Schneider, A C., Leslie, R.W, and Cherry, M L, 1992 Population
genetics o f the brown mussel Perm pema in Southern Africa. ,/. Exp. Mar. Biol. EcoL, 165 : 45-48.
*Gravely, F.H. 1941. Shells and other animal remains found on the Madras beach.
Part I Groups other than snails, etc. Mollusca Gastropoda. Bull Madras ( iovt. A /ns 5 : 35-37
Hall, J CJ 1985 l emperature-related kinetic ditferentiation of Glucosephosphate
-isomerase alleloenzymes isolated from the Blue mussel M edulis. Biochem. (la id .. 23 ; 705-728
* Hanley. S CM 1843. An illustrated and descriptive catalogue of Recent bivalve
shells William and Morthgate, London, XVI11 : 392.
*Hanley. S C I 1855 IPSa Linnaei Conchylia. The shells of Linnaeus determined from his manuscripts and collections also an exact reprint of the vermes
I estacea o f the “Systema Naturae” and Mantissa. London : 556.
77
Hedgecock, Dennis and Okazak, Nicole, Berthelemy. (1984). Genetic diversity
within and between populations of American oysters (Crassostrea) Malacologia, 25 (2) : 535-549.
Hepper, B.T.,1957. Notes on M galloprovincialis in Great Britain. ,/. Mar Biol Ass. UK., 36 : 33-410
Hornell, J 1917 The edible molluscs of the Madras presidency. Madras Fish. Bull. 1 1 : 1-51
Hornell, J 1921 Indian molluscs, Lamellibranchia ,/. Bombay. Nat. Hist. Soc. 19 : 50-52.
Johannesson, K . Kautsky, N. and Tedengren, M., 1990. Genotypic and
phenotypic differences between Baltic and North Sea populations of Myfilus ci/i/lis evaluated through reciprocal transplantations. II. Genetic variation. Mar. Ecol. Prog. Ser., 59 : 211-219.
Jones, S 195 I Observations on the bionomics and fishery of the brown mussel
(Myfilus sp) o f the cape region o f peninsular Inida. J. Bombay. Nat. Hist. Soc 49 519-528
Jukes - Brown, /\ J 1905. A review of the genera of the family mytilidae. Proc. Ma/acol. Soc London 6 : 2 1 1-224.
Kannupandi and P. Paulpandian, 1975. Studies on the blood and muscle proteins o f
crabs o f port o NOVO. Bull. Dept. Marine Sc. Univ. Cochin 7 (3).
78

Karakousis, Y., Spandou, E , Sophronidis, K., Triantaphyilidb, C., (1993) Morphological and allozymic variation in populations o f MytHus g a llo p r o \in c ia /is from Aegean Sea. J. M olluscan Stud, Vol - 59, No-2: 165-173
Koehn, R K., 1991. T he genetics and Taxonomy o f species in the genus Mytilus. Aquaculture, 94 : 125-145.
Koehn, R K., Bayne, B.L , Moore, M.N. and Siebenaller, J.F., 1980a. Salinity
related physiological and genetic differences between populations of Mytilus edulis. Biol. J. Linn. Soc., 14 (3/4)): 319-334.
Koehn, R K., Roger Milkman and Jeffry B. Miitton. 1976. Population genetics of
marine pelecypods. IV. Selection, migration and genetic differentiation in the
blue mussel Mytilus edulis. Involution, Vol. 30, No.l : 2-32.
KunduJI L 1965 On the marine fauna of Gulf of Kutch. Part III pelecypods J. Bombay Nat. His. Soc. 62: 84-103.
Kuriakose. P S and Nair, N B. 1976. The genus Perna along the coasts o f India
with the description o f a new species Perna indica Aquatic Biology), Vo 1 :
25-36
*1 amy. II 1936-1937 Revision des mytilidae vivantes dumuseum National d’
histoire Naturelle de paris. ./. Conchyliogie 80 : 66-102, 107-198, 229-295,
307-363, 81 : 5-71, 99-132, 169-197
79
Levinton, J.S. and Koehn, R.K., 1976. Population genetics of mussels. In : Bayne (Editor), Marine mussels their ecology and physiology. Cambridge university press, Cambridge : 357-384.
Lewis,J R and Seed, R, 1969.Morphological variations in Mytilus from S. W.England in relation to the occurance o f M galloprovincialis (LMK). ('ah.Bio. Mar., 10:231-253
* Linnaeus, C , 1758 . Systema nature per regna tria naturae. 10th Edition, Vol. 1.
Regnum animale. Laurentii Salvi, Stock holm : 1384.
Mahobia, G P , 1987. Studies on Indian cichlids. Ph.D. Thesis, Cochin University o f science and Technology, Cochin, Kerala, India.
Manohar, S V. and M K Velankar, 1973. Separation of muscle proteins of
various marine fishes o f Bombay by polyacrylamide gel electrophoresis. J. Indian hish. Association, 1 (2) : 8-14.
Marsden, J E, Spidle, - A; May, -B. 1995 . Genetic similarity among Zetra mussel,
populatons within North America and Europe. ( 'an -,/. hish - Aquat - Sci-J - ( an - Sc. - Halient - Aquat. Vol.52, No.4, pp 836-847
*Mayt E.. 1970. Populations species and evolution. Belknap press, Cambridge :
476
80
M cD onald , J H. and Koehn, R.K., 1988. The mussels Mytilus galloprovinciahs and M irossnlns on the pacific coast o f North America. Mar. Biol., 99 :!1 1- 1 1 8 .
Me Donald, J.H., Seed, R. and Koehn, R.K., 1991. Allozyme and
morphometric characters o f three species of Mytilus in the Nortern and
Southern hemispheres Mar.Biol., I l l : 323-335.
Me Donald, J.H., Koehn, R.K., Balakirev, E.S, Manchenko, G.P., Pudovkin, A.I.,
Sergiyevskii, S O. and Krutovskii, K.V. 1990. Species identity of the “Common mussel “ inhabiting the Asiatic coasts of the Pacific ocean. Biol. Morya, 1990 (I) : 13-22.
Menezes R.M 1979. Serum patterns of flat fishes Mahasagar, 12 : 45-48.
*Menon, Sareen and Tandon, 1966. On the marine fauna of Goa. A preliminary
survey part 1. Mollusca-pelecypoda. Research Bull. (N.S.) Punjab Univ. 18
317,
Muaya, Y D, Gosling, - E.M, Mercer, - J P.; Donlon, -J. 1995. Genetic variation at three polymophic loci in wild and hatchery stocks of the abaione, Haliotis tuhcrculata I .innaeus Aquaculture Vol. 136, No. 1-2: 71-80
Moraua, -D Jollivet, - D ; Denis, F. 1994 Genetic differentiation across the
western pacific populations of the hydroothermal vent bivalve Ikii/iYinm/io/us spp. And the eastern pacific (13° M) population of
81

lialhynioiiiolus thermophihis. Deep -Sea-Res. - l-()ceanogr. - Res. - Pap. Vol. 41, No. 10 .1551-1561
Murphy, R W , Sites, J.W. Jr., Buth, D G. and Haufler, C H., 1990. In: D M.
Hillis and C. Moritz (Editors)., Molecular Systematics. Sinauer associtates Inc., Massachusetts, U.S.A., :45-126.
Nevo, E. 1978. Genetic variation in natural populations : patterns and theory.
Theoretical population Biology 13 : 121-177.
*Norusis, M.J., 1993. SPSS for windows : Professional statistiics, Release 60.
SPSS line., : 385.
Paul, M D 1942 Studies on the growth and breeding of certain sedentary
organisms in the MadrasHarbour. Proc. Ind. Acad. Sci. 15 :1 -10.
Philip Samuel, P., 1987. Biochemical genetics of selected commercially important
penaeid prawns Ph D Thesis, Cochin University of Science and Technology,
Cochin, Kerala, India.
Pompa, -I A ; Espinoza. J.; Perez, -J.E. 1990 Genetic variation in Venezuelan
molluscs, the mussel, Perna p erm (L.) Bol.-lnst. - Oceanogi\ Venez. Vol.
29, No 1-2 : 97-101.
* Powell A AV B . 1958 Newzealand molluscan systematics with descriptions ofnew s p e c i e s , Part 3. Rec. Auckland. Inst. Mas., 5 :87-91.
82

Pullan, S., and Smith, P.J. (1987). Identification of hybrids between Koi (Cyprinus carpio) and gold fish (( 'arassins auratus). Newzealand o f Marine and Fresh wafer Research 21 : 41 -46
Rao, C R. (1965), Linear statistical inference and its applications, New York, John Wiley
Rawson, P D., and T.J. Hilbish. 1995 . Distribution of male and female mt DNA
lineages in populations o f blue mussels, Myfilus trossuhis and M galloprovincialis, along the pacific coast o f North America, Mar.Biol 124.
245-250.
*Retzius, A J. 1788 Dissertatio Historico Naturalis Nova Testaceaorum Genera, undue, IV : 23.
Richardson, J R ., Aldridge, A.E., and Smith, P J. (1982) Analyses of tuatua
populations - Pahies subtriangulata and P donacina. Newzealand .Journal o fZoology 9, 23 I -8.
Rowland, S.J (1984) Hybridization between the estuarine fishes yellowfin bream, Accwthopagrtts australis (Gunther), and black bream, A butcheri (Munro) (Pisces : Sparidae) Australian Journal o f Marine and Freshwater Research
35, 427-40.
83

Sanjuan, A , Quesada, H., Zapata, C. And Alvarez, G., 1990. On the occurance of Mytilus galloprovincialis Lmk. On NW coasts of the Iberian Peninsula. J. Exp. Mar. Biol. Ecol, 143 1-14
Satyamurti, S T. 1956. The mullusca & Krusadi Island (in Gulf o f mannar)ll Scaphopoda, pelecypoda and cephalopoda. Bull Madras Govt.Mus., New ser. 1:1-202.
*Scarlato, O.A. and Starobogatov, Y.I., 1979. The systematic position and distribution of mussels. In : O Scarlato (Editor), Commercial bivalve moUuscan mussels and their role in the ecosystem (in Ilusssian). Zoological. Institute o f the soviet Academy of sciences : 106-111.
*Scarlatto, O.A., 1981. Bivalve mollusks of temperate latitudes of the western portion o f the pacific ocean Opted.Eaune. USSR, 126:1-461.
Seed, R, 1978 . The systematics and evolution of Mytilus galloprovincialis (LMK). In : B. Battaglia and J.A. Beardmore (editors),marine organisms:Genetics, Ecology and Evolution. Plenum press London.: 447-468.
Seed, R. 1968. Factors influencing shell shape in the mussel Mytilus edulis. J. Mar. Biol. Ass. U.K.. 48 : 561-584
Seed. R 1992. Systematics, evolution, and distribution of mussels belonging to the genus Mytilus : an overview. Am malacol. Bull. 9 : 123-137.
84
Seed, R., 1972. Morphological variation in Mytilus from the French coasts in relation to the occurance and distribution of M galoprovincialis (LMK). ( ’ah. Biol. Mar., 13 357-384
Seed, R.,1974 Morphological variations in Mytilus from the Irish coasts in relation to the occurance and distribution o f Mytilus galloprovincialis (LMK). Cah. Biol.Mar., 15:1-25.
Shaklee, J B , and Keenan, C P. (1986). A practical laboratory guide to the
technique and methodology of electrophoresis and its application to fish fillet
identification ( 'SIRO Australia Marine Laboratories Report No. 177.
Shaw, C.R., and Prasad, R. (1979). Starch gel electrophoresis of enzymes - a
compilation of recipes. Biochemical genetics 4 : 297-320.
Shearer, K.D., and Mulley, J.C. (1978). The introduction and distribution of the
carp Cyprinus carpio Linneaus in Australia. Australian Journal o f marine and Fresh water Research 36 : 203-218.
Siddall, Scott E 1980 A clarification of the genus Verna. Bulletin o f marine science, 30(4) : 858-870
Skibinski, D.O.F., Beardmore, J.A. and cross T.F., 1983 Aspects of the population genetics of Mytilus (Mytilidae : molluscas in the British Isler.
Biol. J. Linn. Soc., 19 : 137-183.
85
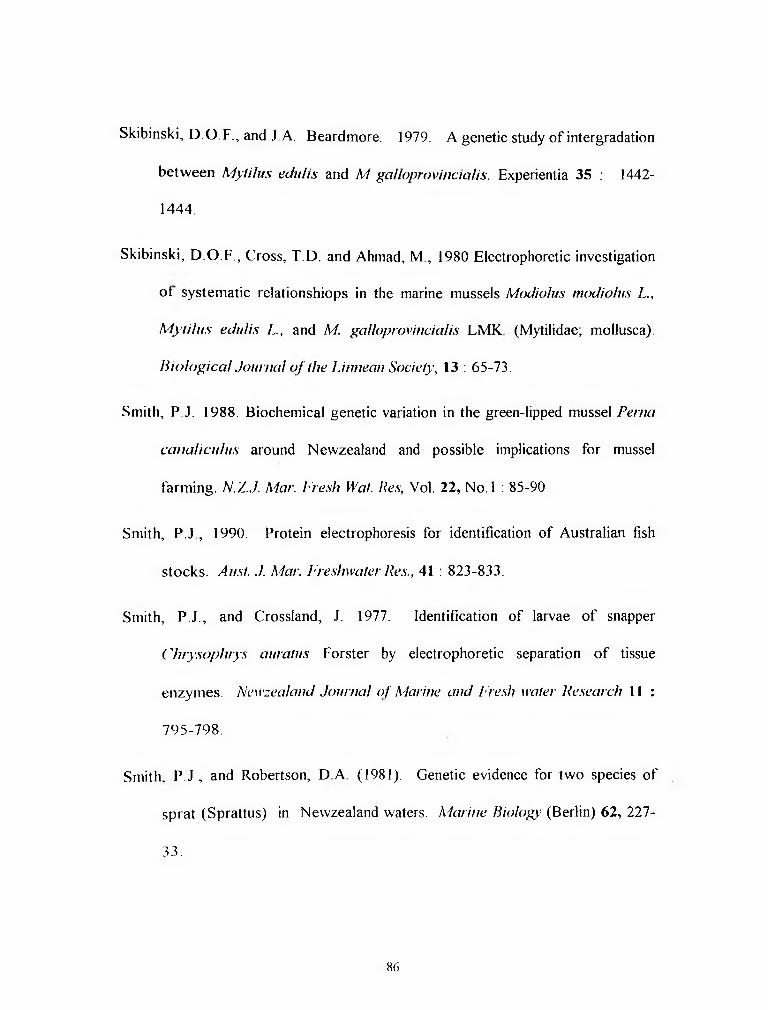
Skibinski, D.O.F., and J A. Beardmore. 1979. A genetic study of intergradation
between MytHus edulis and M galloprovincialis. Experientia 35 : 1442-1444.
Skibinski, D.O.F., Cross, T.D. and Ahmad, M , 1980 Electrophoretic investigation of systematic relationshiops in the marine mussels Modiolus modiolus L., Mytilus edulis L , and M. galloprovincialis LMK (Mytilidae; mollusca).
Biological Journal of the Unm an Society, 13 : 65-73.
Smith, P J. 1988. Biochemical genetic variation in the green-lipped mussel Perna canaliculus around Newzealand and possible implications for mussel
farming. N.Z.J. Mar. Fresh Wat. Res, Vol. 22, No.l : 85-90
Smith, P.J., 1990. Protein electrophoresis for identification of Australian fish
stocks. Aust. J. Mar. Freshwater Res., 41 : 823-833.
Smith, P.J., and Crossland, J. 1977. Identification of larvae of snapper Chrysophrys auratus Forster by electrophoretic separation o f tissue
enzymes. Newzealand Journal of Marine and Fresh water Research 11 :
795-798.
Smith. P.J., and Robertson, D A (1981). Genetic evidence for two species of
sprat (Sprattus) in Newzealand waters. Marine Biology (Berlin) 62, 227-
3 3 .
86
Smith, P.J., Wood, B A., and Benson, P G. (1979). Electrophoretic and Meristic separation of blue maomao and sweep. Newzealcind Journal o f marine and f reshwater Research 13, 549-551
*Soot - Ryen, T. 1952. Choroniytiltis, a new genus in the mytilidae. Soc.
Malacol. “ Carlos de la Torre” Habana, Rev. 8: 121-122.
* Soot-Ryen, T. 1955. A report on the family mytilidae (Pelecypoda). Han cock pacific Expd. 20 : 1-175.
Suchanek, T.H., J.B. Geller, B.R. Kreiser and J.B. Mitton. 1997. Zoogeographic Distributions of the sibling species Mytilus ga/Joprovi)icialis and M trossuhis (Bivalvia: Mytilidae) and their Hybrids in the North Pacific. Biol. Bull. 193:
187-194.
Theisen, Bent, F., 1978 Allozyme clines and evidence of strong selection in three
loci in Mytilus edulis (L) (Bivalvia) French Danish waters, Ophelia, 17 (1) .
135-142.
Thomas, M M., 1981. Preliminary results of electrophoretic studies on marine
prawns. Indian J. Fish, 28 (1 and 2): 292-294.
Vainola, R., and M M Hvilsom. 1991, Genetic divergenic and a hybrid zone between Baltic and Northsea Mytilus populations (Mytilidae : Mollusca)
Biol.J. Linn.Soc. 43 : 127-148
87

Van-der-Bank, F H. 1995. Allozyme variation in a fresh water mussel population
(Coelaturci kunenensis Mousson, 1887) from Southern Africa. Water - S.A. 1995 Vol. 21, No.2:. 53-158.
Varvio, S.-L., Koehn, R.K. and Vainola, R , 1988. Evolutionary genetics of the
Mytilus edulis complex in the North Atlantic region. Mar. Biol., 98 : 51-60.
Verduin, A., 1979. Conchological evidence for the separate specific identity of M edulis L and M gal/oprovincialis. Baxteria, 43 : 61-80
*Vermeij, G.J., 1989. Geographical restriction as a guide to the causes of
extinction : the case of the cold northern oceans during the Neocene.
Paleobiology, 15 : 335-356.
Viard F, Delay. B, Coustau. C. and Renaud. F. 1994. Evolution o f the genetic
structure of bivalve cohorts at hybridization sites of the Mylilus edulis - M galloprovincialis complex. Marine biology 119 : 535-539.
Von Ihering, H. 1901. On the South American species of mytilidae. Proc. Malacol. Soc. London 4 : 84 - 98
*Von Ihering, H. 1907. Les mollusques fossiles du Tertiaire et du Cretace superieur de 1’ Argentine Anal. Mus. Mac., Buenos Aires. Ser 3, Vol.7,
XIII : 611
88
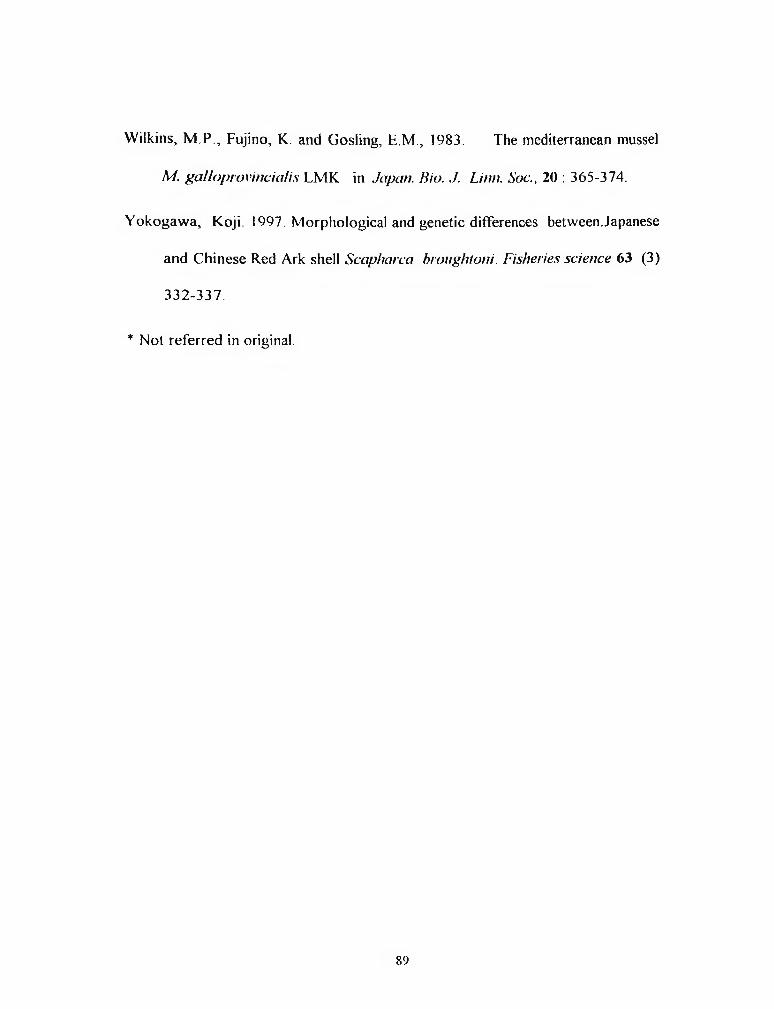
Wilkins, M.P., Fujino, K. and Gosling, E.M., 1983. The mediterranean mussel
M. gal/oprovincialis LMK in Japan. Bio. J. Linn. Soc., 20 : 365-374.
Yokogawa, Koji 1997. Morphological and genetic differences bet ween. Japanese and Chinese Red Ark shell Scapharca broughtoni. Fisheries science 63 (3) 332-337.
* Not referred in original.
89