electron,muon,and hadronlateral distributionsmeasuredinair ... · abstract measurements of...
TRANSCRIPT
arX
iv:a
stro
-ph/
0004
233v
1 1
7 A
pr 2
000
Electron, Muon, and Hadron Lateral
Distributions Measured in Air-Showers by the
KASCADE Experiment
T. Antoni a, W.D. Apel a, F. Badea b, K. Bekk a, K. Bernlohr a,1,
H. Blumer a,d, E. Bollmann a, H. Bozdog b, I.M. Brancus b,A. Chilingarian c, K. Daumiller d, P. Doll a, J. Engler a,F. Feßler a, H. J. Gils a, R. Glasstetter d, R. Haeusler a,
W. Hafemann a, A. Haungs a, D. Heck a, T. Holst a,J. R. Horandel d,2, K.-H. Kampert d,a, J. Kempa e, H. O. Klages a,
J. Knapp d,3, D.Martello a,d, H. J. Mathes a, H. J. Mayer a,J. Milke a, D. Muhlenberg a, J. Oehlschlager a, M. Petcu b,
H. Rebel a, M. Risse a, M. Roth a, G. Schatz a, F. K. Schmidt d,T. Thouw a, H. Ulrich a, A. Vardanyan c, B. Vulpescu b,J. H. Weber d, J. Wentz a, T. Wiegert a, J. Wochele a,
J. Zabierowski f
(The KASCADE Collaboration)
aInstitut fur Kernphysik, Forschungszentrum Karlsruhe, 76021 Karlsruhe,
Germany
bNational Institute of Physics and Nuclear Engineering, 7690 Bucharest, Romania
cCosmic Ray Division, Yerevan Physics Institute, Yerevan 36, Armenia
dInstitut fur Experimentelle Kernphysik, University of Karlsruhe,
76021 Karlsruhe, Germany
eDepartment of Experimental Physics, University of Lodz, 90236 Lodz, Poland
fSoltan Institute for Nuclear Studies, 90950 Lodz, Poland
1 Now at: University of Hamburg, Hamburg.2 Present address: University of Chicago, Enrico Fermi Institute, Chicago, IL 60637.3 Now at: University of Leeds, Leeds LS2 9JT, U.K.
Preprint submitted to Astroparticle Physics 22 October 2018
Abstract
Measurements of electron, muon, and hadron lateral distributions of extensive airshowers as recorded by the KASCADE experiment are presented. The data cover theenergy range from 5×10¹⁴ eV up to almost 1017 eV and extend from the inner coreregion to distances of 200 m. The electron and muon distributions are correctedfor mutual contaminations by taking into account the detector properties in theexperiment. All distributions are well described by NKG-functions. The scale radiidescribing the electron and hadron data best are ≃ 30 m and ≃ 10 m, respectively.We discuss the correlation between scale radii and ‘age’ parameter as well as theirdependence on shower size, zenith angle, and particle energy threshold.
Key words: cosmic rays; air shower; lateral distributionPACS: 96.40.Pq
1 Introduction
Since the detection of extensive air showers (EAS) [1] lateral or radial densitydistributions ρ(r) of different kinds of particles produced in EAS have been anongoing target of experimental as well as theoretical investigations. There area number of reasons why EAS lateral distributions are of importance for theair shower phenomenon. The first and most important one is that from thenumber and distribution of ground particles the energy and mass of the pri-mary particle can be deduced. While at least the energy reconstruction can bedone rather crudely from analytical considerations, more reliable algorithmsneed detailed air shower simulations to relate the observables to primary en-ergy and mass. Perhaps trivial, although experimentally very important, isthe fact that in measurements the shower particles are always sampled over alimited range of core distances r1 < r < r2 only – in most cases with an areacoverage in this range not much exceeding one percent – but showers are oftenreferred to in terms of integrated numbers of particles:
N =
r2∫
r1
2πrρ(r)dr. (1)
The total particle numbers, N , for different kinds and energy ranges of showerparticles, are obtained by choosing r1 = 0 and r2 = ∞ and are traditionallyused both as measures for the primary energy in an individual experiment aswell as a means for comparison of different experiments. Comparing experi-mental results is generally hampered by different detector characteristics likeenergy thresholds and discrimination of particle types but also by different
2
observation altitudes. These effects need to be corrected, e.g. using suitableair shower and detector response simulations.
Detector effects are, in principle, minimized by disentangling the lateral dis-tributions (and thus also the total particle numbers) for various kinds of par-ticles. For experiments using a single type of detector this is generally notan option and resulting lateral distributions correspond to some mixture ofdifferent particle types, depending on the detection technique used as wellas on absorber thicknesses and thresholds applied. Experiments with severaldetector components optimized for different particle types still measure a mix-ture of particles, but are able to disentangle various types to a large extent.The present paper follows this path to obtain lateral distributions separatelyfor the major charged particles – electrons, muons, and hadrons – in EAS ofprimary energies from 5× 10¹⁴ eV up to almost 1017 eV.
Integrating from r1 = 0 to r2 = ∞ implies an extrapolation beyond the coredistance ranges actually covered. Deviations of measured lateral distributionsfrom the expected form, as a consequence, result in systematic errors of theparticle numbers obtained. Such systematic errors can be very much reducedby using ’truncated ’ particle numbers integrated only over the experimentallycovered range of core distances. This approach is introduced for muons insection 3.1. The main drawback of such truncated particle numbers is thatcomparisons of different experiments are further complicated.
The lateral distribution functions also carry information on the related particlephysics and astrophysics. Different hadronic interaction models predict differ-ent lateral shapes. Hence, it is possible to test available interaction models.Unfortunately, from a particle physicists point of view, the expected lateralshape also depends on the mass of primary cosmic rays. Heavier primaries lead,on average, to a flatter distribution. Since the lateral distribution is only onein a group of composition-sensitive observables measured with KASCADE, noattempts are made to infer any mass parameter in the present paper. This willbe addressed in a separate article.
Historically, choices of parametrizations of both electron and muon lateraldistributions were influenced very much by the seminal review of Greisen [2].Greisen described the lateral density function (LDF ) of the electromagnetic(e.m.) component of EAS by
ρem(r,Ne) =0.4Ne
r2m
(
rmr
)0.75(
rmr + rm
)3.25(
1 +r
11.4 rm
)
(2)
over the core distance range from r = 5 cm to r = 1500 m and for atmosphericdepths of 537 g/cm2 to 1800 g/cm2. The parameter Ne is the total number ofelectrons in the shower and rm is the Moliere radius. The Moliere unit, about
3

0.25 radiation lengths in air, characterises the spread of low-energy electronsby multiple scattering.
Greisen also noted that Eq. 2, except for the last factor, is a close approxima-tion to the analytical calculations for electromagnetic showers performed byKamata and Nishimura [3] if a shower age parameter of s = 1.25 is assumed.Greisen’s approximation to the Nishimura-Kamata functions for 0.5 < s < 1.5is referred to as the NKG function:
ρNKG(r, s, Ne) =Ne
r2m
Γ(4.5− s)
2πΓ(s)Γ(4.5− 2s)
(
r
rm
)s−2(
1 +r
rm
)s−4.5
. (3)
This function, often used to describe the charged particle lateral distribution,will in the following be applied individually to electron, muon, and hadrondistributions by choosing approriate sets of parameters (s, rm). For a compar-ison of the parametrization of Kamata and Nishimura with the NKG function(Eq. 3) see [4].
Many experimental groups reported deviations of the e.m. LDF from the NKGform which are most obvious at large core distances [5–7]. This may be relatedto the problem that the NKG form has originally been formulated for zero
energy threshold of shower electrons in purely electromagnetic showers andthat higher moments of the NKG form tend to diverge, depending of the ageparameter s. More general forms were, for example, suggested by Hillas andLapikens [8] and Capdevielle et al. [9].
Traditionally, the NKG form is used with a fixed value of rm and a variableage parameter s. Thus, the scale length is kept constant while the shape of theLDF is assumed to be variable. A different LDF and a scaling relation wereproposed by Lagutin et al. [10], based on Monte Carlo calculations for pureelectromagnetic showers. They proposed a normalized LDF f(x) with
xf(x) = exp(−3.63− 1.89 lnx− 0.370 ln2 x− 0.0168 ln3 x), (4)
independent of primary energy and age at least in the range 0.05 ≤ x ≤ 25,where x is the core distance divided by a scale radius, here the root mean
square (rms) radius,√
〈r2〉, of the particle density at ground. Note that Eq. 4has finite higher order moments but is not useful for small x.
Greisen [2] also suggested a functional form for the muon LDF in EAS
ρµ(r,Nµ) = const. Nµ
(
r
rg
)
−β(
1 +r
rg
)
−2.5
, (5)
4
with β = 0.75, now referred to as the Greisen function. In the original form,which was based on a very limited number of events, the Greisen radius rgis 320 m. This form refers to a minimum muon energy of 1 GeV but a moregeneral form for the 1–20 GeV range was also quoted by Greisen. Deviationsof the muon LDF from the Greisen form (Eq. 5) were reported by severalexperimental groups, such as [11–13]. Alternatives were suggested by Linsley[14] and by Hillas et al. [15]. The KASCADE experiment allows to scrutinizethe muon LDF for different thresholds (0.23–2.4 GeV), although only for coredistances below 100–230 m.
For the hadronic (originally termed nuclear interacting or just N ) compo-nent, the LDF depends very much on the hadron energy, with more ener-getic hadrons being more concentrated near the shower core. This was alreadypointed out by Greisen [2].
Hadron lateral distributions were investigated by previous experiments mainlyclose – within 10 m or less – to the shower core. Rather wide lateral distribu-tions measured at Tien Shan initiated speculations on rising mean values oftransverse momenta or on strongly rising cross-sections of jet production [16].At Chacaltaya hadrons far away from the shower axis and with high values ofpT ≈ 2 GeV/c have been observed [17]. Similar discrepancies between obser-vations and calculations were reported repeatedly, e.g. by the Turku group,claiming an increase of large transverse momentum processes with rising en-ergy (see [18] and references therein). Features suggesting strong changes inthe characteristics of hadronic interactions in the PeV range were also claimedin [19,20].
Early parametrizations of the hadron LDF assumed a power law form, asfor instance shown in the review by Cocconi [21]. More recently, Maket-ANIreported agreement with exponential forms within 5 m from the core [22]. TheChacaltaya group found a NKG-like function to fit their lateral distributionbest for core distances up to 10 m [23]. The KASCADE hadron calorimeterwith its large detection area and large dynamic range not only provides betterstatistics but also allows to extend the hadron LDF analysis to much largercore distances than any previous experiment.
2 The KASCADE experiment
The KASCADE (KArlsruhe Shower Core and Array DEtector) experiment islocated at Forschungszentrum Karlsruhe, Germany, at an altitude of 110 ma.s.l. and has been described in detail in [24,25]. The experiment has threemajor components: an array of electron and muon detectors, a central detectormainly for hadron measurements but with substantial muon detection areas,
5
and a tunnel with streamer tube muon telescopes. Since the latter have onlybeen completed at the time of writing this article, no data from the muontunnel are included in the present analysis.
The KASCADE array covers an area of about 200×200 m2 and consists of252 detector stations located on a square grid of 13 m separation. These areorganized in 16 clusters of 16 stations each, except for the inner four clus-ters where the location of one station is blocked by the central detector. Thestations contain two types of detectors, liquid scintillation counters (e/γ de-tectors) of 0.79 m2 area each and 5 cm thickness with little shielding above andplastic scintillators of 0.81 m2 area each and 3 cm thickness (muon detectors)below a shielding of 10 cm lead and 4 cm steel. The inner four clusters areinstrumented with four e/γ detectors per station but without muon detectorswhile the outer 12 clusters house two e/γ and four muon detectors per station.For both detector types the sum of photomultiplier signals, the earliest time,and the hit pattern are recorded for all stations fired.
The central hadron calorimeter is of the sampling type and has a fiducialarea of 16×19 m2. A detailed description can be found in [26]. The energyis absorbed in an iron stack and sampled in eight layers of liquid ionizationchambers with anode segments of 0.25×0.25 m2 (appr. 38 500 channels). Thethickness of the iron slabs increases from 12 to 36 cm towards the deeper partsof the calorimeter, amounting to 154 cm in total. The 8th layer is located belowan additional concrete ceiling of 77 cm thickness. On top, a 5 cm lead layerfilters off the soft electromagnetic component. The ionization chambers areread out by logarithmic amplifiers and 13 bit ADCs, achieving a dynamicrange of 6 × 10⁴. Signals starting from single minimum ionizing muons up toenergy deposits of 10 GeV in a chamber are read out without saturation. Theresponse curve of each channel is calibrated with a reference capacitor coupledto the preamplifier, injecting known charges into the electronics chain.
Below the 8th calorimeter layer, two layers of multiwire proportional chambers(MWPCs), vertically separated by 38 cm, are used as muon detectors. In total,32 chambers are operated with 129 m2 total area per layer. Hits are registeredon anode wires and two layers of cathode strips at angles of ±34◦ with respectto the wires.
A total of 456 plastic scintillation counters of 0.48 × 0.95 m2 area each and3 cm thickness are used within the calorimeter (below 5 cm lead and 36 cmsteel) to trigger the calorimeter and the MWPCs. They also serve as muoncounters. On top of the calorimeter, an additional 50 such counters fill thecentral gap of e/γ detectors but their data are not included in the presentanalysis. A summary of the detector components used in this article togetherwith their most relevant parameters is given in Table 1.
6
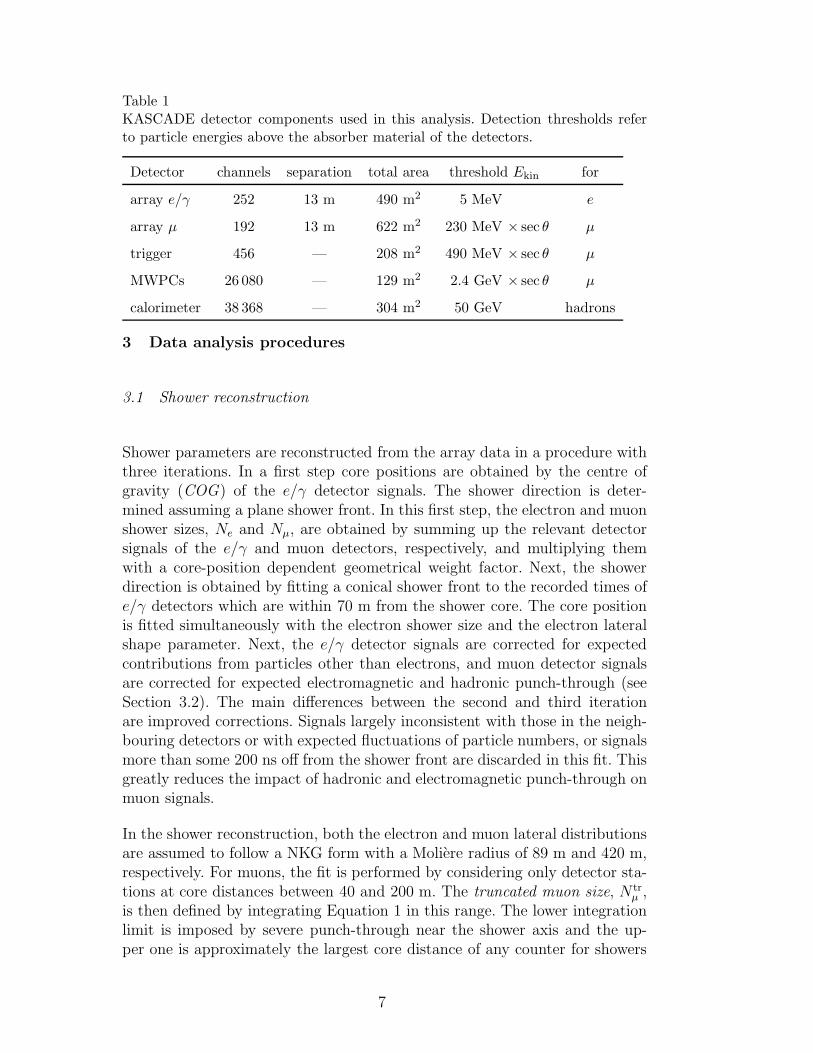
Table 1KASCADE detector components used in this analysis. Detection thresholds referto particle energies above the absorber material of the detectors.
Detector channels separation total area threshold Ekin for
array e/γ 252 13 m 490 m2 5 MeV e
array µ 192 13 m 622 m2 230 MeV × sec θ µ
trigger 456 — 208 m2 490 MeV × sec θ µ
MWPCs 26 080 — 129 m2 2.4 GeV × sec θ µ
calorimeter 38 368 — 304 m2 50 GeV hadrons
3 Data analysis procedures
3.1 Shower reconstruction
Shower parameters are reconstructed from the array data in a procedure withthree iterations. In a first step core positions are obtained by the centre ofgravity (COG) of the e/γ detector signals. The shower direction is deter-mined assuming a plane shower front. In this first step, the electron and muonshower sizes, Ne and Nµ, are obtained by summing up the relevant detectorsignals of the e/γ and muon detectors, respectively, and multiplying themwith a core-position dependent geometrical weight factor. Next, the showerdirection is obtained by fitting a conical shower front to the recorded times ofe/γ detectors which are within 70 m from the shower core. The core positionis fitted simultaneously with the electron shower size and the electron lateralshape parameter. Next, the e/γ detector signals are corrected for expectedcontributions from particles other than electrons, and muon detector signalsare corrected for expected electromagnetic and hadronic punch-through (seeSection 3.2). The main differences between the second and third iterationare improved corrections. Signals largely inconsistent with those in the neigh-bouring detectors or with expected fluctuations of particle numbers, or signalsmore than some 200 ns off from the shower front are discarded in this fit. Thisgreatly reduces the impact of hadronic and electromagnetic punch-through onmuon signals.
In the shower reconstruction, both the electron and muon lateral distributionsare assumed to follow a NKG form with a Moliere radius of 89 m and 420 m,respectively. For muons, the fit is performed by considering only detector sta-tions at core distances between 40 and 200 m. The truncated muon size, N tr
µ ,is then defined by integrating Equation 1 in this range. The lower integrationlimit is imposed by severe punch-through near the shower axis and the up-per one is approximately the largest core distance of any counter for showers
7
with their cores inside KASCADE. The scale radius of 420 m and the muon
age parameter sµ were deduced from simulations. The latter can not be fittedon a shower-by-shower basis due to limited statistics. Therefore, it is derivedfrom CORSIKA simulations [27] and parametrized as a function of Ne. Theactual values are obtained by fitting CORSIKA muon density distributionsindividually for proton and iron induced showers and taking the mean valueof both parametrizations. This leads to a mass dependent systematic error inthe reconstruction of N tr
µ in a range of up to 5 % but yields a more robustresult than trying to fit also sµ on a shower-by-shower basis.
The actual muon LDF is known to deviate from the assumed NKG formoutside the fit range. Within the limited range accessible to the experiment, theNKG form is nevertheless, on a shower-by-shower basis, as good as the Greisenfunction or any other form with suitably adapted parameters. Simulationsshow that N tr
µ provides a very good estimate of the primary energy, almostindependent of the primary particle mass [28].
The adopted electron LDF is also known to deviate from experimental data atlarge core distances, even though the age parameter is fitted on a shower-by-shower basis for core distances of 10–200 m. This results in an underestimateof Ne up to 5–8% for simulated showers.
The core position can be reconstructed with an uncertainty of about 3 mat 1 PeV, and the accuracy is typically better than 1 m for showers above4 PeV if the core is located well inside the array. In order to use data of bestquality, the analysis of average lateral distributions in this paper is restrictedto showers with core positions within 91 m from the centre of the array. Theangular resolution for such showers above 1 PeV is about 0.4◦ (68% C.L.).Statistical sampling errors on Ne (N tr
µ ) improve from about 10% (20%) at1 PeV to about 3% (10%) at 10 PeV.
3.2 Particle numbers in array detectors
The signal analysis of the e/γ detectors takes account of muons by subtractingtheir expected energy deposits from the measured energy. In the same way, theexpected e/γ and hadron punch-through contributions are subtracted from theenergy deposit in the muon detectors. Since both are mutually related, an it-erative procedure is applied. Finally, the number of particles hitting a detectoris estimated by dividing the remaining energy deposit by the expected energydeposit per particle. There are no means to discriminate against hadrons inthe array detectors.
In total, the procedure requires four lateral energy correction functions (LECFs)which are, in the most general case, a function of core distance, zenith angle,
8

Eµ(e+ +h)/n(e)γ
E (e+ +h)/n(e)γe
E (µ)/n(µ)e
E (µ)/n(µ)µ
L :A
L :B
L :C
L :D
Distance to shower core [ m ]
Ene
rgy
depo
sit p
er p
artic
le [
MeV
]
array
trigger plane
0
5
10
15
0 50 100 150 2000.03
0.05
0.10
0.20
0 50 100 150 200
(a) (b)
Fig. 1. Parametrized lateral energy correction functions as used in the analysis ofaverage LDFs. Left: LA and LB for deposits in the array e/γ counters (see text)and LD for muons in array muon counters (solid line) and trigger plane counters(dashed line). Right: Punch-through corrections (evaluated for Ne = 105) for arraymuon and trigger plane counters, corresponding to final likelihood cuts used to rejectcounters with far too large energy deposits. Correction functions left of the hatchedlines are only shown for illustration but not used in the shower reconstruction.
and shower size. Actually, there is a weak dependence on the cosmic-ray masscomposition, too. Hence, mean values of the LECFs for simulated proton andiron primaries are used. All LECFs were obtained from CORSIKA simulationsof EAS (using the QGSJET model [29]) followed by detailed detector simula-tions (based on the GEANT package for detector simulation [30]). The sameevent reconstruction is applied to simulated as to experimental data. As a re-sult, the energy deposits can be related to the numbers and types of particleshitting the detectors. For the analysis of average lateral distributions specialrefined LECF functional forms are used (see Fig. 1). They do not change fun-damental shower parameters like Ne or N tr
µ , but improve the reproductionof the average lateral distribution of simulated showers. LDFs obtained af-ter detector simulation and shower reconstruction closely match LDFs of therelevant particle type and energy threshold before detector simulation.
The following correction functions are used: LA is the average sum of energydeposits by electrons, gammas, and hadrons in the e/γ counters normalized tothe number of electrons above 5 MeV kinetic energy, n(e), hitting the counter;LB is the average energy deposit by muons in the e/γ counters per muon; LC isthe average punch-through energy deposit of electrons, gammas, and hadronsin the muon counters per electron; LD is, in turn, the average deposit of muonsin the muon counters per muon. The average energy deposits Eeγ and Eµ in
9
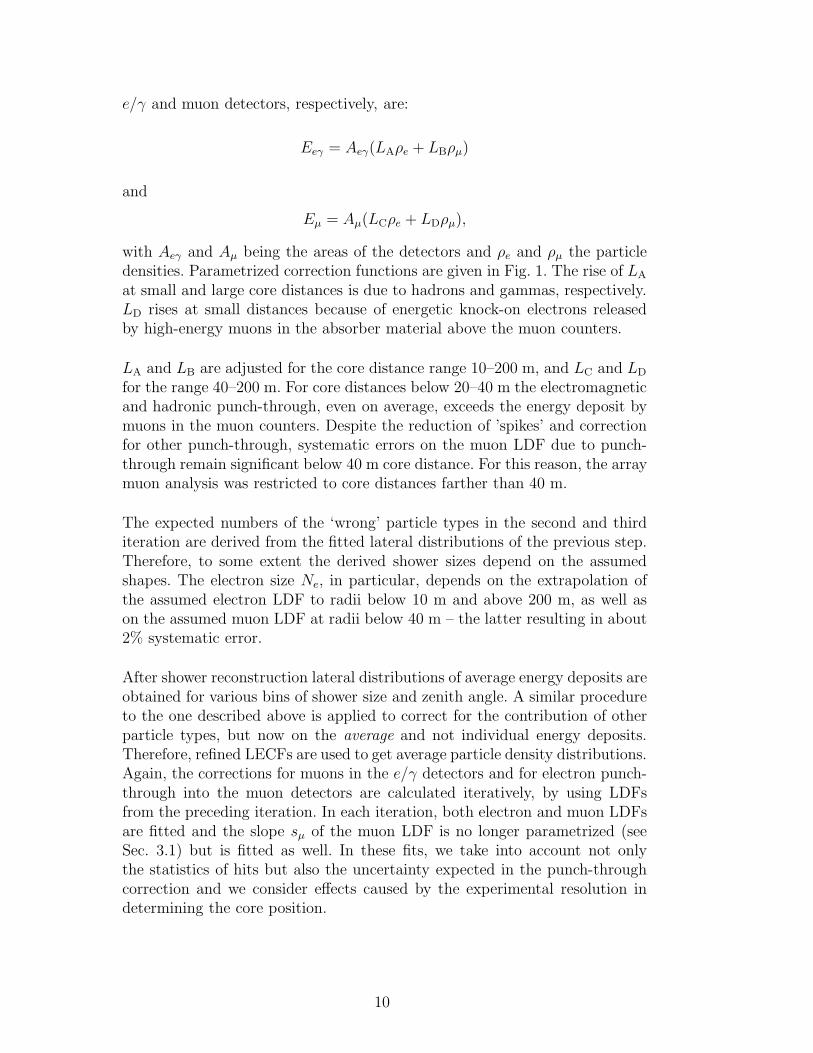
e/γ and muon detectors, respectively, are:
Eeγ = Aeγ(LAρe + LBρµ)
and
Eµ = Aµ(LCρe + LDρµ),
with Aeγ and Aµ being the areas of the detectors and ρe and ρµ the particledensities. Parametrized correction functions are given in Fig. 1. The rise of LA
at small and large core distances is due to hadrons and gammas, respectively.LD rises at small distances because of energetic knock-on electrons releasedby high-energy muons in the absorber material above the muon counters.
LA and LB are adjusted for the core distance range 10–200 m, and LC and LD
for the range 40–200 m. For core distances below 20–40 m the electromagneticand hadronic punch-through, even on average, exceeds the energy deposit bymuons in the muon counters. Despite the reduction of ’spikes’ and correctionfor other punch-through, systematic errors on the muon LDF due to punch-through remain significant below 40 m core distance. For this reason, the arraymuon analysis was restricted to core distances farther than 40 m.
The expected numbers of the ‘wrong’ particle types in the second and thirditeration are derived from the fitted lateral distributions of the previous step.Therefore, to some extent the derived shower sizes depend on the assumedshapes. The electron size Ne, in particular, depends on the extrapolation ofthe assumed electron LDF to radii below 10 m and above 200 m, as well ason the assumed muon LDF at radii below 40 m – the latter resulting in about2% systematic error.
After shower reconstruction lateral distributions of average energy deposits areobtained for various bins of shower size and zenith angle. A similar procedureto the one described above is applied to correct for the contribution of otherparticle types, but now on the average and not individual energy deposits.Therefore, refined LECFs are used to get average particle density distributions.Again, the corrections for muons in the e/γ detectors and for electron punch-through into the muon detectors are calculated iteratively, by using LDFsfrom the preceding iteration. In each iteration, both electron and muon LDFsare fitted and the slope sµ of the muon LDF is no longer parametrized (seeSec. 3.1) but is fitted as well. In these fits, we take into account not onlythe statistics of hits but also the uncertainty expected in the punch-throughcorrection and we consider effects caused by the experimental resolution indetermining the core position.
10
3.3 Muon numbers in the trigger plane
The trigger plane has a muon energy threshold of 490 MeV and, therefore, lesselectromagnetic punch-through than the array muon detectors. On the otherhand, the dynamic range of signals is smaller and hadronic punch-through ismore significant because of the outset of cascading in the absorber materialabove. The effect of hadronic punch-through is reduced by rejecting detectorelements within a distance of 1 m to identified high-energy hadrons (typicallyabove 50 GeV). Further reduction of hadronic and electromagnetic punch-through is achieved by rejecting counters with energy deposits inconsistentwith the expected numbers of muons, accounting for statistical number fluc-tuations and for fluctuations in the energy loss of muons.
Conversion of average energy deposits into particle numbers in the triggerplane closely follows the procedure outlined for the array detectors. LECFsfor trigger plane counters were derived from simulations – with the same selec-tion criteria applied as for experimental data. Most notably, the punch-throughcorrection is different for array detectors (Fig. 1b), but the different compo-sition of materials above the muon counters also results in slightly differenteffective energy loss distributions (Fig. 1a).
3.4 Reconstruction in the MWPCs
Hits of single muons in the MWPCs are characterised by signals on one or a fewanode wires and an average of 3.5 neighbouring cathode strips on each side.Hit reconstruction requires that the intersection of the two cathode signalscoincides with an anode signal. At low particle densities this reconstructionachieves a good efficiency and spatial resolutions are 1.4 cm along wires and0.7 cm perpendicular. At high densities of about 5 muons/m2, signals of severalhits start to overlap and ambiguities arise in the reconstruction.
Muon tracks are reconstructed from pairs of hits in the two detector layers.Accepted tracks are required to be in reasonable agreement with the showerdirection (∆θ ≤ 15◦; ∆φ ≤ 45◦ if θ ≥ 10◦), which effectively resolves am-biguous hits. Systematic uncertainties in calculating efficiencies are reducedby discarding those muons which, according to the shower direction, could beobserved in one layer of the MWPCs only. Thereby, hits near the edges ofthe chambers are rejected. Furthermore, muons entering from the sides of thebuilding in inclined showers would have a lower than nominal energy thresh-old. To compensate for this effect, only those areas of the MWPCs are usedwhere muons parallel to the shower directions have penetrated the entire ironabsorber of the calorimeter. Geometric and reconstruction efficiencies were ob-
11
tained from the shower and detector simulation chain followed by the normalreconstruction procedure. The particle detection efficiency in the MWPCs it-self is derived continuously by using muons observed in the trigger layer andthe other of the two MWPC layers and is typically 98%. All efficiencies areaccounted for in the lateral distributions.
3.5 Hadron reconstruction
Briefly, the algorithm for pattern recognition of hadrons in the eight layers ofionization chambers proceeds as follows [26]: Clusters of energy are searched toline up in the calorimeter and to form a track in different layers from which anapproximate angle of incidence can be inferred. Then, patterns of cascades aresearched for in the deeper layers. Going upwards in the calorimeter, clustersare formed from the remaining energy and are lined up to showers according tothe direction already found. The reconstruction efficiency for isolated hadronsis 70% at 50 GeV and reaches nearly 100% at 100 GeV.
Hadron energies are reconstructed from the sum of calibrated signals in layers2–8, weighting each layer by the relative amount of preceding absorber. Theuppermost layer is not used for the energy determination to avoid distortionsby electromagnetic punch-through. The weighted signal sum is converted toenergies by a function derived from detector simulations based on the GEANTpackage. The energy resolution is rather constant, slowly improving from 20%at 100 GeV to 10% at 10 TeV.
Due to the fine lateral segmentation of 25 cm, the minimal distance to separatetwo equal-energy hadrons with a 50% probability amounts to 40 cm. Thiscauses the reconstructed hadron number density to flatten off at about 1.5hadrons/m2. The reconstructed hadron energy density, on the other hand, isnot affected by this saturation [26]. Radiation from high-energy muons canmimic hadrons. However, their reconstructed energies are much lower thanthose of the actual muon, typically by a factor of 10. Simulations show that a1 TeV muon is identified as a hadron with a probability of about 1% [31].
4 Electron lateral distribution
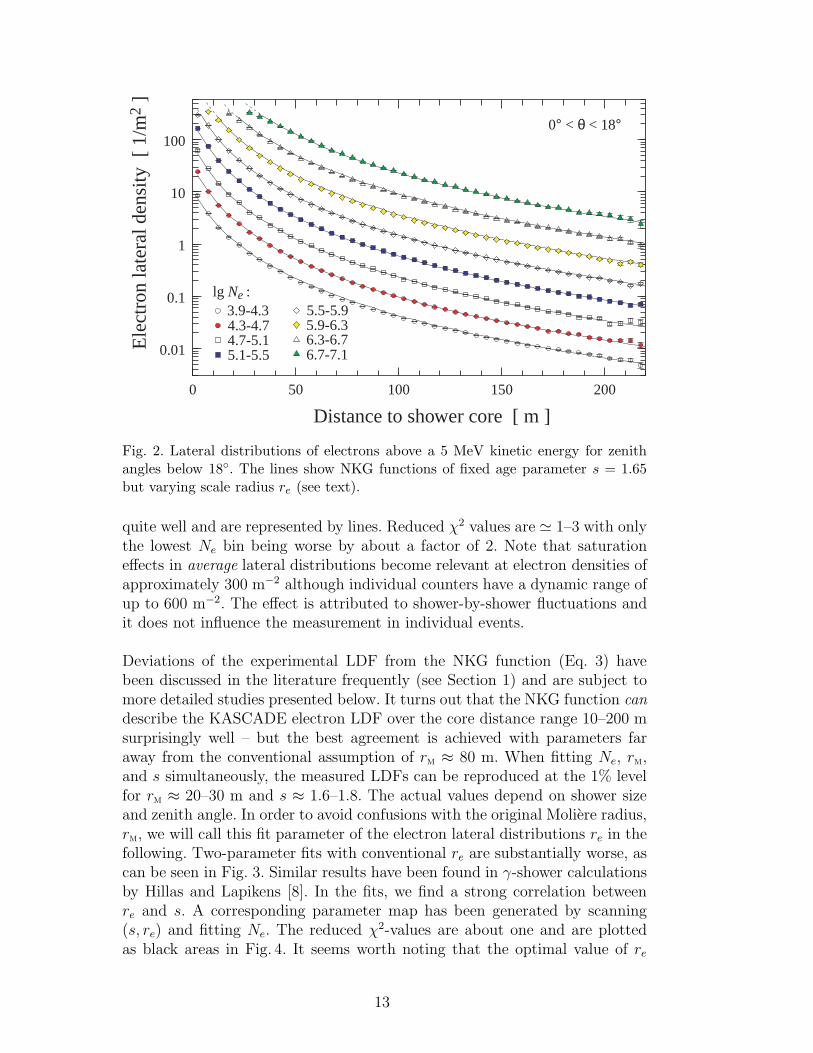
Average LDFs of electrons have been reconstructed for shower sizes from lessthan 104 to more than 107 electrons. Contributions of hadrons, muons, andgammas to energy deposits in the e/γ detectors were corrected for by theprocedure outlined in Section 3.2. Resulting lateral distributions for electronsabove 5 MeV kinetic energy are presented in Fig. 2. NKG functions fit the data
12
5.1-5.54.7-5.14.3-4.73.9-4.3 5.5-5.9
5.9-6.36.3-6.76.7-7.10.01
0.1
1
10
100
0 50 100 150 200
0° < θ < 18°
Distance to shower core [ m ]
Ele
ctro
n la
tera
l den
sity
[ 1
/m2 ]
lg Ne :
Fig. 2. Lateral distributions of electrons above a 5 MeV kinetic energy for zenithangles below 18◦. The lines show NKG functions of fixed age parameter s = 1.65but varying scale radius re (see text).
quite well and are represented by lines. Reduced χ2 values are ≃ 1–3 with onlythe lowest Ne bin being worse by about a factor of 2. Note that saturationeffects in average lateral distributions become relevant at electron densities ofapproximately 300 m−2 although individual counters have a dynamic range ofup to 600 m−2. The effect is attributed to shower-by-shower fluctuations andit does not influence the measurement in individual events.
Deviations of the experimental LDF from the NKG function (Eq. 3) havebeen discussed in the literature frequently (see Section 1) and are subject tomore detailed studies presented below. It turns out that the NKG function can
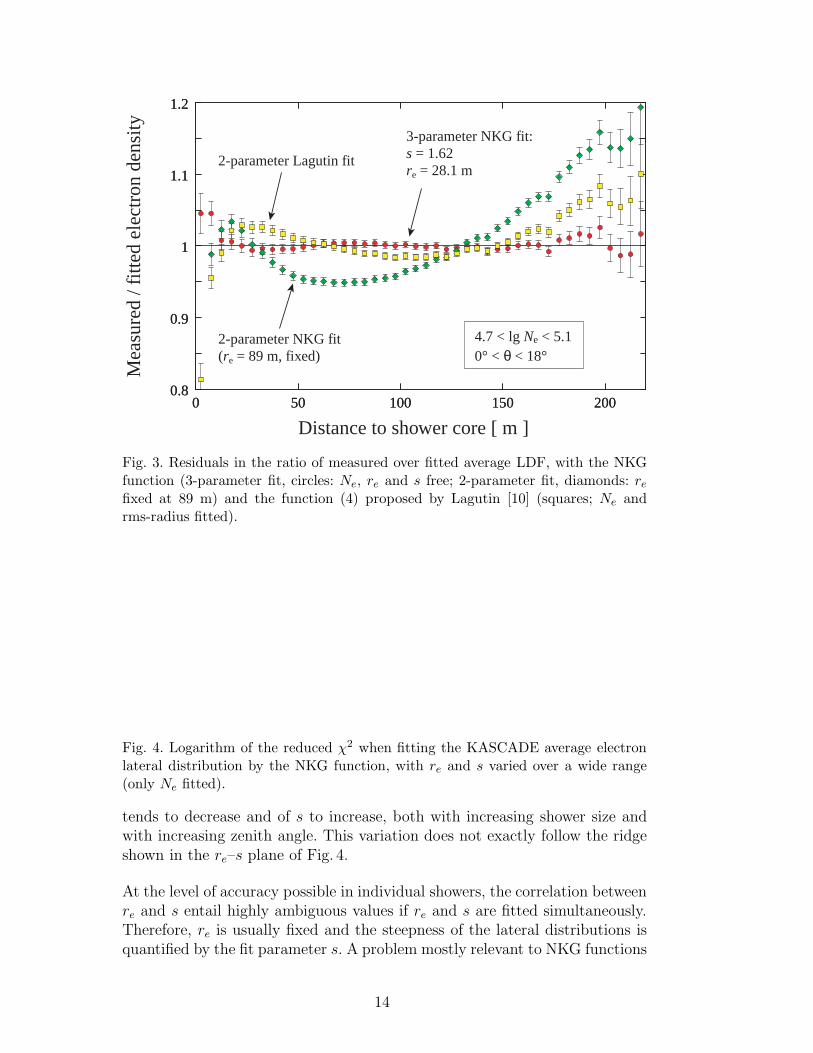
describe the KASCADE electron LDF over the core distance range 10–200 msurprisingly well – but the best agreement is achieved with parameters faraway from the conventional assumption of rm ≈ 80 m. When fitting Ne, rm,and s simultaneously, the measured LDFs can be reproduced at the 1% levelfor rm ≈ 20–30 m and s ≈ 1.6–1.8. The actual values depend on shower sizeand zenith angle. In order to avoid confusions with the original Moliere radius,rm, we will call this fit parameter of the electron lateral distributions re in thefollowing. Two-parameter fits with conventional re are substantially worse, ascan be seen in Fig. 3. Similar results have been found in γ-shower calculationsby Hillas and Lapikens [8]. In the fits, we find a strong correlation betweenre and s. A corresponding parameter map has been generated by scanning(s, re) and fitting Ne. The reduced χ2-values are about one and are plottedas black areas in Fig. 4. It seems worth noting that the optimal value of re
13
4.7 < lg Ne < 5.10° < θ < 18°
Mea
sure
d / f
itted
ele
ctro
n de
nsity
3-parameter NKG fit:s = 1.62re = 28.1 m
Distance to shower core [ m ]
2-parameter NKG fit(re = 89 m, fixed)
2-parameter Lagutin fit
0.8
0.9
1
1.1
1.2
0 50 100 150 2000.8
0.9
1
1.1
1.2
0 50 100 150 200
Fig. 3. Residuals in the ratio of measured over fitted average LDF, with the NKGfunction (3-parameter fit, circles: Ne, re and s free; 2-parameter fit, diamonds: refixed at 89 m) and the function (4) proposed by Lagutin [10] (squares; Ne andrms-radius fitted).
Fig. 4. Logarithm of the reduced χ2 when fitting the KASCADE average electronlateral distribution by the NKG function, with re and s varied over a wide range(only Ne fitted).
tends to decrease and of s to increase, both with increasing shower size andwith increasing zenith angle. This variation does not exactly follow the ridgeshown in the re–s plane of Fig. 4.
At the level of accuracy possible in individual showers, the correlation betweenre and s entail highly ambiguous values if re and s are fitted simultaneously.Therefore, re is usually fixed and the steepness of the lateral distributions isquantified by the fit parameter s. A problem mostly relevant to NKG functions
14
re = 29.3
re = 21.8
1
10
102
0 50 100 150 200
s = 1.65
Distance to shower core [ m ]
Ele
ctro
n la
tera
l den
sity
[ m-2
]
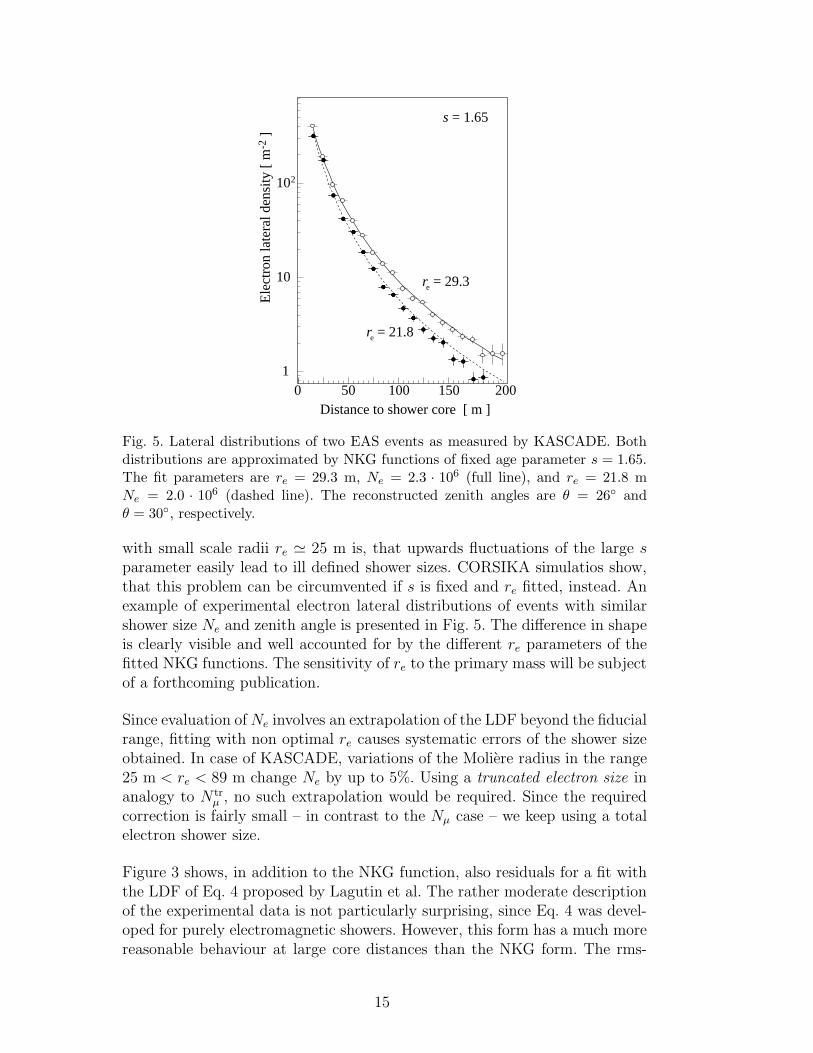
Fig. 5. Lateral distributions of two EAS events as measured by KASCADE. Bothdistributions are approximated by NKG functions of fixed age parameter s = 1.65.The fit parameters are re = 29.3 m, Ne = 2.3 · 106 (full line), and re = 21.8 mNe = 2.0 · 106 (dashed line). The reconstructed zenith angles are θ = 26◦ andθ = 30◦, respectively.
with small scale radii re ≃ 25 m is, that upwards fluctuations of the large sparameter easily lead to ill defined shower sizes. CORSIKA simulatios show,that this problem can be circumvented if s is fixed and re fitted, instead. Anexample of experimental electron lateral distributions of events with similarshower size Ne and zenith angle is presented in Fig. 5. The difference in shapeis clearly visible and well accounted for by the different re parameters of thefitted NKG functions. The sensitivity of re to the primary mass will be subjectof a forthcoming publication.
Since evaluation ofNe involves an extrapolation of the LDF beyond the fiducialrange, fitting with non optimal re causes systematic errors of the shower sizeobtained. In case of KASCADE, variations of the Moliere radius in the range25 m < re < 89 m change Ne by up to 5%. Using a truncated electron size inanalogy to N tr
µ , no such extrapolation would be required. Since the requiredcorrection is fairly small – in contrast to the Nµ case – we keep using a totalelectron shower size.
Figure 3 shows, in addition to the NKG function, also residuals for a fit withthe LDF of Eq. 4 proposed by Lagutin et al. The rather moderate descriptionof the experimental data is not particularly surprising, since Eq. 4 was devel-oped for purely electromagnetic showers. However, this form has a much morereasonable behaviour at large core distances than the NKG form. The rms-
15
lg Ne
b)
c)
a)
r e (
θ =
0°)
[m]
dk /
d se
c θ
k =
re
(se
c θ)
/ re
(θ =
0°)
sec θ
4.7 < lg Ne < 5.1
3.9 < lg Ne < 4.3
1
1.05
1.1
1.15
1.2
1 1.1 1.2 1.3
22
26
30
0
1
4 5 6
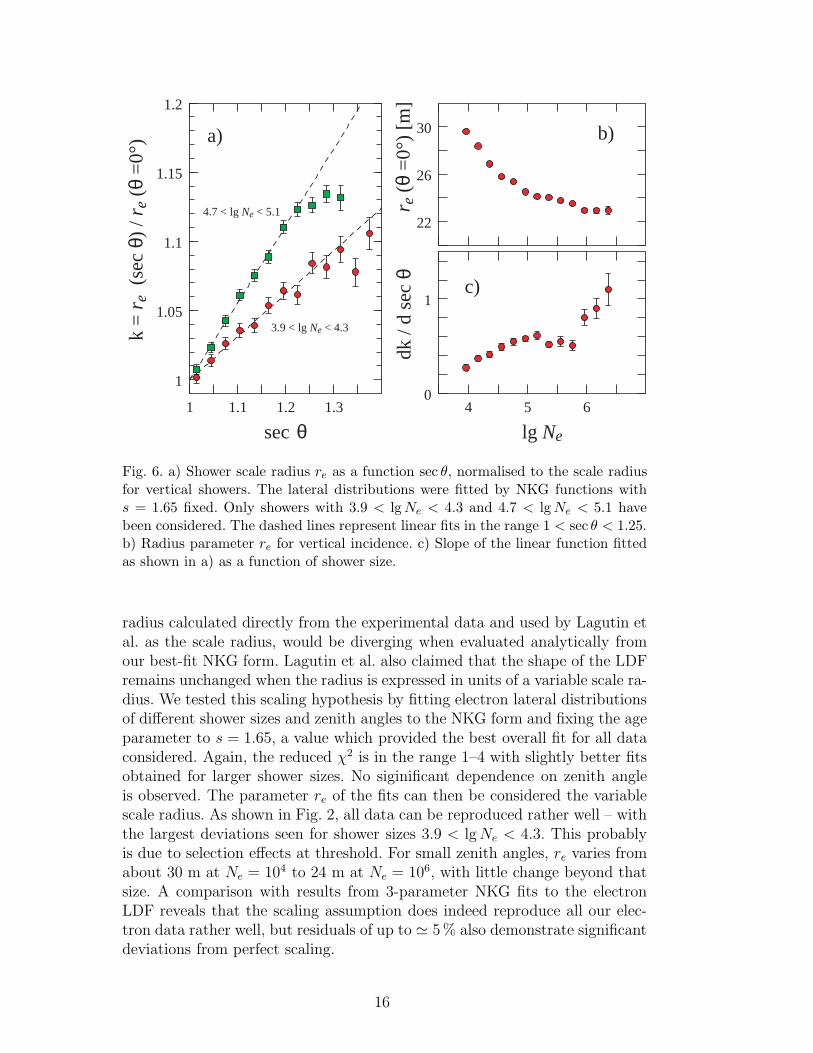
Fig. 6. a) Shower scale radius re as a function sec θ, normalised to the scale radiusfor vertical showers. The lateral distributions were fitted by NKG functions withs = 1.65 fixed. Only showers with 3.9 < lgNe < 4.3 and 4.7 < lgNe < 5.1 havebeen considered. The dashed lines represent linear fits in the range 1 < sec θ < 1.25.b) Radius parameter re for vertical incidence. c) Slope of the linear function fittedas shown in a) as a function of shower size.
radius calculated directly from the experimental data and used by Lagutin etal. as the scale radius, would be diverging when evaluated analytically fromour best-fit NKG form. Lagutin et al. also claimed that the shape of the LDFremains unchanged when the radius is expressed in units of a variable scale ra-dius. We tested this scaling hypothesis by fitting electron lateral distributionsof different shower sizes and zenith angles to the NKG form and fixing the ageparameter to s = 1.65, a value which provided the best overall fit for all dataconsidered. Again, the reduced χ2 is in the range 1–4 with slightly better fitsobtained for larger shower sizes. No siginificant dependence on zenith angleis observed. The parameter re of the fits can then be considered the variablescale radius. As shown in Fig. 2, all data can be reproduced rather well – withthe largest deviations seen for shower sizes 3.9 < lgNe < 4.3. This probablyis due to selection effects at threshold. For small zenith angles, re varies fromabout 30 m at Ne = 104 to 24 m at Ne = 106, with little change beyond thatsize. A comparison with results from 3-parameter NKG fits to the electronLDF reveals that the scaling assumption does indeed reproduce all our elec-tron data rather well, but residuals of up to ≃ 5% also demonstrate significantdeviations from perfect scaling.
16
Apart from the scaling for different shower sizes it is particularly illustrative tosee a change of the scale radius as a function of zenith angle. To be independentof the scale chosen and the precise form of the LDF used, the scale radiusshown in Fig. 6a is normalized to that for vertical showers. Using the Lagutinfunction instead of NKG, consistent results are obtained. A linear relationbetween scale radius and the secant of the zenith angle θ is obvious and ismainly a result of the increasing distance between the detector and the showermaximum. Electrons are being scattered away from the shower axis as theshower has to penetrate a larger air mass. The slope in this relation can, in fact,be used to infer the average depth of shower maximum – although additionalcorrections based on simulations have to be applied. The increase of the depthof shower maximum with increasing shower size, and thus energy, results in adecrease of the scale radius as seen in Fig. 6b. Also, the slope of the normalisedscale radius versus sec θ rises with shower size (see Fig. 6c). An exception fromthe otherwise monotonic change is apparent at shower sizes correspondingto the knee in the flux spectrum, which we observe at lgNe = 5.7 [32]. Aquantitative analysis of the phenomenon in terms of possible change of thechemical composition is beyond the scope of this paper.
5 Muon lateral distributions
The KASCADE experiment measures lateral distributions of muons for threedifferent energy thresholds (Table 1). In the following, we group the showers inbins of truncated muon numbers N tr
µ . Punch-through and efficiency correctionsare applied as described in Section 3. Ranges of core distances for the differentmuon energy thresholds are limited by uncertainties in the punch-throughcorrections at small core distances and by the geometry of the KASCADEdetector array. Since Ne/N
trµ rises with shower size, the impact of punch-
through corrections becomes more severe at higher energies and the minimumcore distances have to be increased correspondingly. For showers with coresinside KASCADE, the upper limit is about 220 m for array detectors and100 m for central detector components.
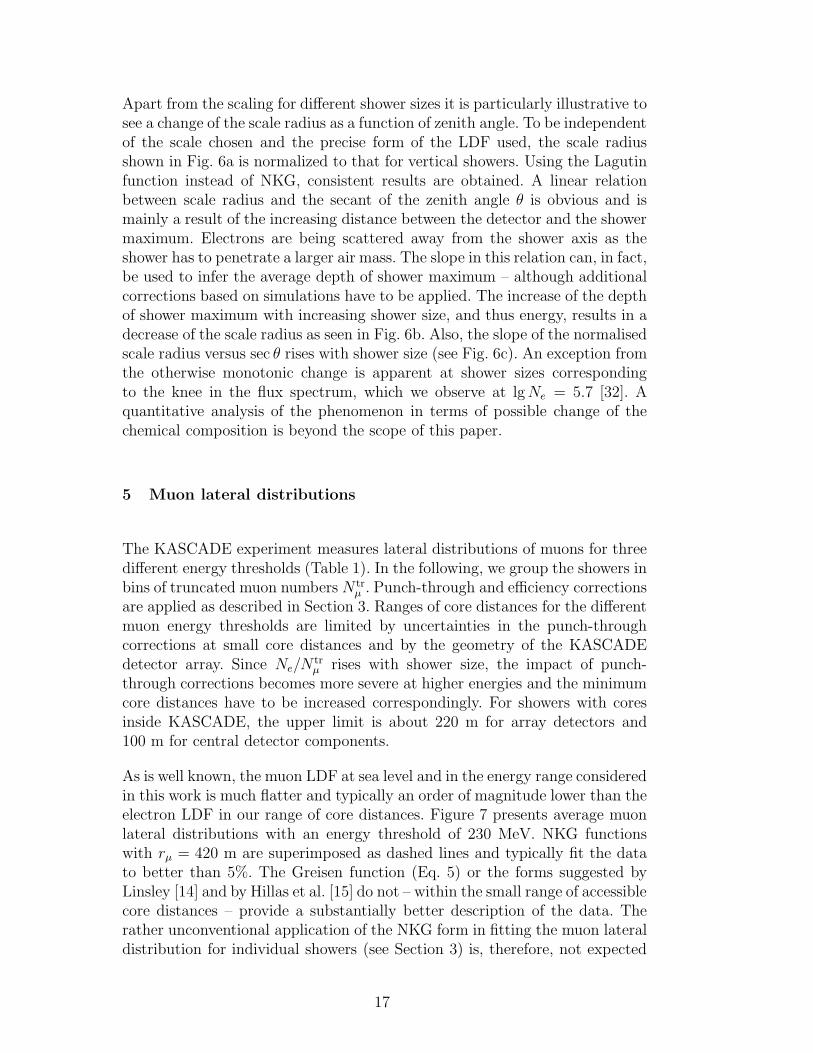
As is well known, the muon LDF at sea level and in the energy range consideredin this work is much flatter and typically an order of magnitude lower than theelectron LDF in our range of core distances. Figure 7 presents average muonlateral distributions with an energy threshold of 230 MeV. NKG functionswith rµ = 420 m are superimposed as dashed lines and typically fit the datato better than 5%. The Greisen function (Eq. 5) or the forms suggested byLinsley [14] and by Hillas et al. [15] do not – within the small range of accessiblecore distances – provide a substantially better description of the data. Therather unconventional application of the NKG form in fitting the muon lateraldistribution for individual showers (see Section 3) is, therefore, not expected
17
µ E > 230 MeV
µtrlg N :
2.9-3.33.3-3.73.7-4.14.1-4.5
4.5-4.94.9-5.35.3-5.7
Distance to shower core [ m ]
0° < θ < 18° M
uon
late
ral d
ensi
ty [
1/m2
]
0.001
0.01
0.1
1
10
0 50 100 150 200
Fig. 7. Lateral distribution of muons above 230 MeV kinetic energy, measured withthe array detectors. The lines indicate NKG functions fitted to the data. Errorbars are of statistical nature including an uncertainty of 10% on the punch-throughcorrection applied.
µ E > 490 MeV
µtrlg N :
2.9-3.33.3-3.73.7-4.14.1-4.5
4.5-4.94.9-5.35.3-5.7
Distance to shower core [ m ]
0° < θ < 18°
Muo
n la
tera
l den
sity
[ 1
/m2 ]
0.001
0.01
0.1
1
10
0 20 40 60 80 100
Fig. 8. Lateral distribution of muons above 490 MeV kinetic energy, as measuredwith the trigger plane. Data are binned according to N tr
µ as measured by the arrayand the lines represent NKG fits to the data.
18
µ E > 2.4 GeV
µtrlg N :
Distance to shower core [ m ]
0° < θ < 18° M
uon
late
ral d
ensi
ty [
1/m2
]
3.3-3.73.7-4.14.1-4.5
4.5-4.94.9-5.3
0.01
0.1
1
10
0 20 40 60 80 100
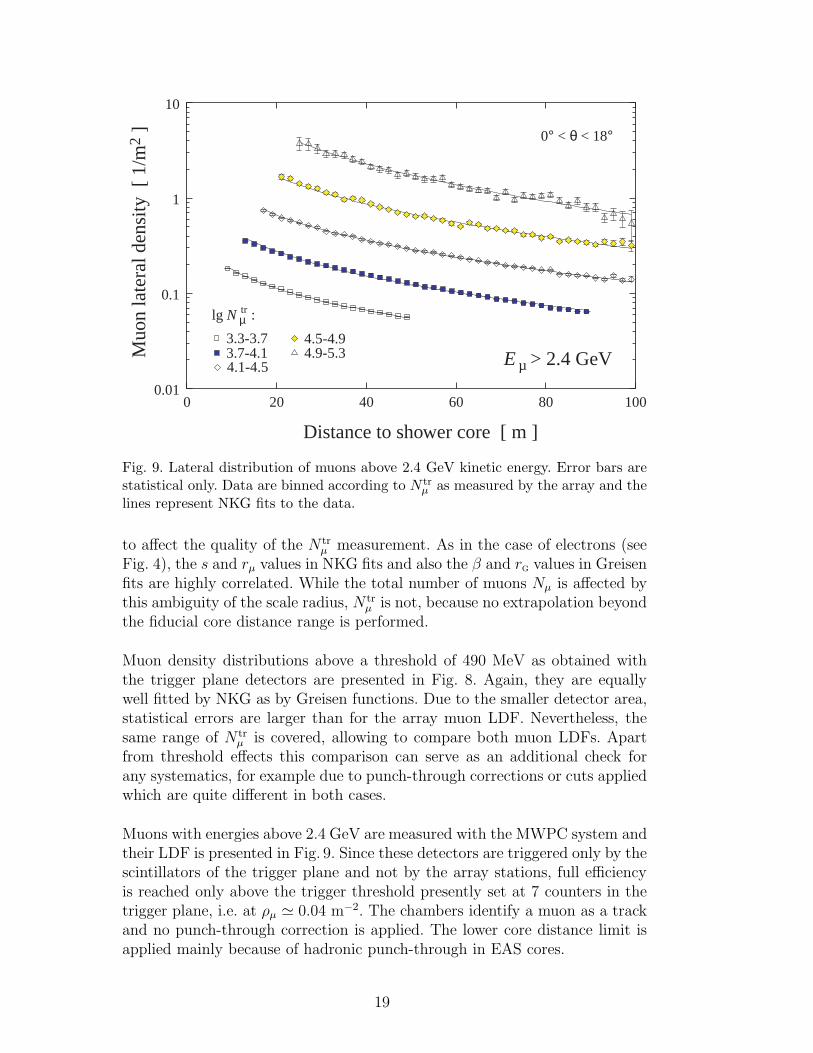
Fig. 9. Lateral distribution of muons above 2.4 GeV kinetic energy. Error bars arestatistical only. Data are binned according to N tr
µ as measured by the array and thelines represent NKG fits to the data.
to affect the quality of the N trµ measurement. As in the case of electrons (see
Fig. 4), the s and rµ values in NKG fits and also the β and rg values in Greisenfits are highly correlated. While the total number of muons Nµ is affected bythis ambiguity of the scale radius, N tr
µ is not, because no extrapolation beyondthe fiducial core distance range is performed.
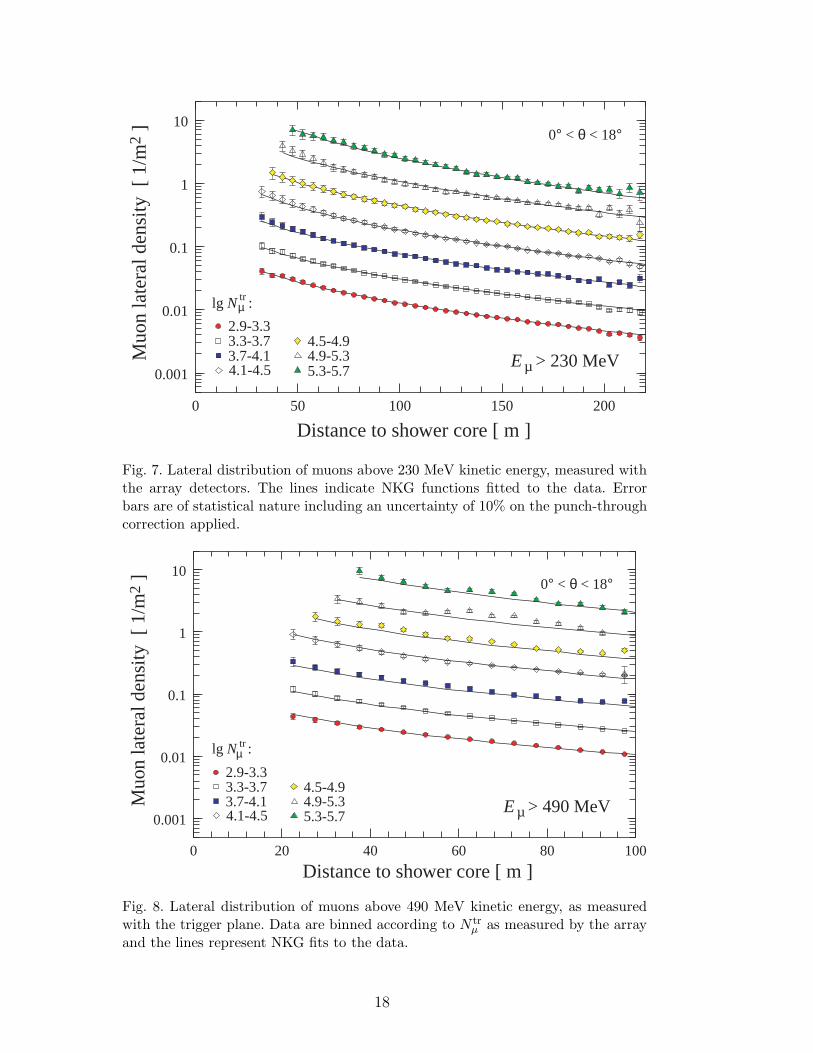
Muon density distributions above a threshold of 490 MeV as obtained withthe trigger plane detectors are presented in Fig. 8. Again, they are equallywell fitted by NKG as by Greisen functions. Due to the smaller detector area,statistical errors are larger than for the array muon LDF. Nevertheless, thesame range of N tr
µ is covered, allowing to compare both muon LDFs. Apartfrom threshold effects this comparison can serve as an additional check forany systematics, for example due to punch-through corrections or cuts appliedwhich are quite different in both cases.
Muons with energies above 2.4 GeV are measured with the MWPC system andtheir LDF is presented in Fig. 9. Since these detectors are triggered only by thescintillators of the trigger plane and not by the array stations, full efficiencyis reached only above the trigger threshold presently set at 7 counters in thetrigger plane, i.e. at ρµ ≃ 0.04 m−2. The chambers identify a muon as a trackand no punch-through correction is applied. The lower core distance limit isapplied mainly because of hadronic punch-through in EAS cores.
19
trµlg N :
µ (E > 490 MeV)
(E > 230 MeV)µ
µ (E > 2.4 GeV)
Distance to shower core [ m ]
Muo
n la
tera
l den
sity
[ 1
/m2 ]
4.5 - 4.9
4.1 - 4.5
3.7 - 4.1
array
trigger
MWPC
0.1
1
0 20 40 60 80 100
0° < θ < 18°
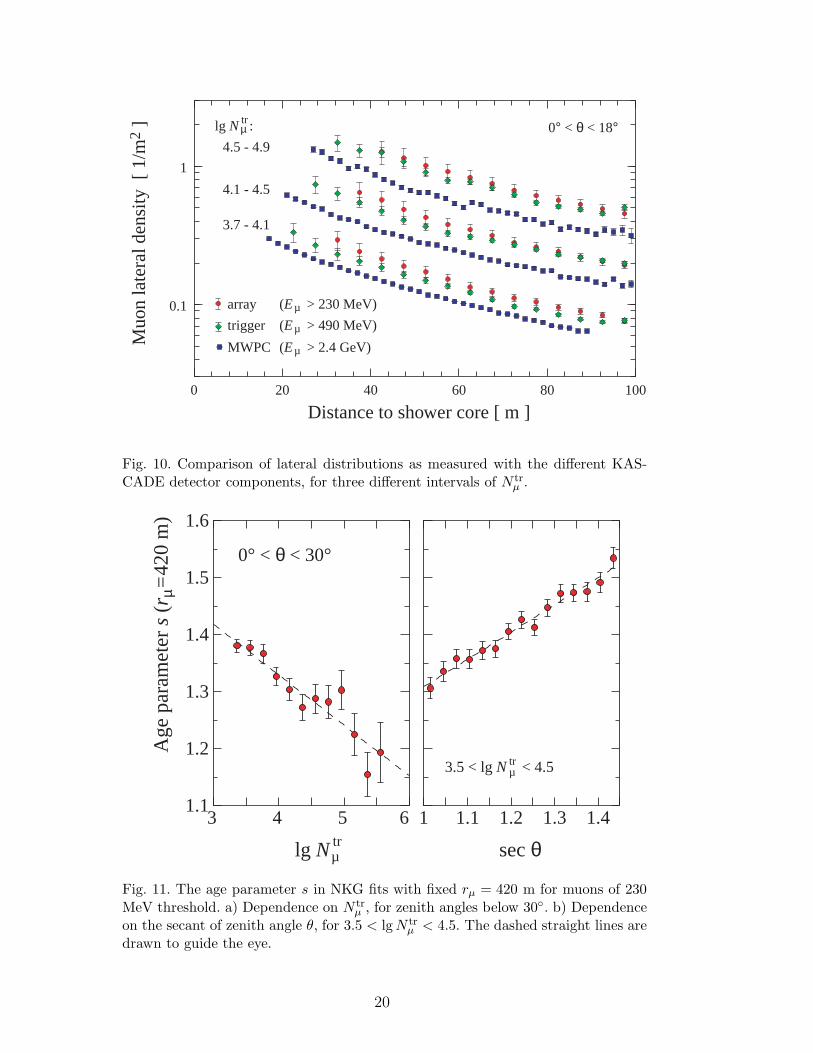
Fig. 10. Comparison of lateral distributions as measured with the different KAS-CADE detector components, for three different intervals of N tr
µ .
trµ lg N
Age
par
amet
er s (
r µ=
420
m)
trµ 3.5 < lg N < 4.5
sec θ
0° < θ < 30°
1.1
1.2
1.3
1.4
1.5
1.6
3 4 5 6 1.1 1.2 1.3 1.41
Fig. 11. The age parameter s in NKG fits with fixed rµ = 420 m for muons of 230MeV threshold. a) Dependence on N tr
µ , for zenith angles below 30◦. b) Dependenceon the secant of zenith angle θ, for 3.5 < lgN tr
µ < 4.5. The dashed straight lines aredrawn to guide the eye.
20
The lateral distributions obtained for the different thresholds are compared inFig. 10. As expected, the muon density decreases with increasing threshold.The drop of about 10% between 230 and 490 MeV and of about 50% between230 MeV and 2.4 GeV is nearly independent of primary energy and onlyweakly dependent on core distance.
For all thresholds, the muon LDF flattens with increasing zenith angle andsteepens with increasing shower size (see [33]). This is illustrated in Fig. 11for muons above 230 MeV, where the age parameter s in NKG functionsfitted with a fixed rµ = 420 m is shown. The observed effect is comparableto that of the electron LDF. With increasing primary energy, i.e. rising N tr
µ ,the shower penetrates deeper into the atmosphere resulting in steeper lateraldistributions. With increasing zenith angle, in contrast, the shower maximumrecedes from the experiment resulting in correspondingly flatter distributions.This is partly compensated by a harder muon spectrum which is due to longerdecay path lengths.
6 Hadron lateral distribution
Data on lateral distributions of hadrons studied over a large range of dis-tances to the shower core are very scarce in the literature [17]. The KASCADEcalorimeter operated jointly with the array detectors enables such investiga-tions to be performed with high quality. Different from electrons and muons,the reconstruction of individual energies of hadrons enables to study in detailalso the hadronic energy dependence of lateral distributions as well as to com-pare lateral particle and energy density distributions. As an example, Fig. 12presents hadron lateral distributions for four N tr
µ sizes corresponding approx-imately to the energy interval from 1 to 10 PeV. The densities of hadronsand of hadronic energy are given. They extend up to distances of 90 m fromthe shower core where the intensity has dropped by nearly five orders of mag-nitude. At the very centre, a saturation as mentioned in section 3.5 can benoticed for the hadron number. Hence, in this range the hadronic energy isthe more reliable observable.
Several functions have been applied to fit the data points, among others expo-nentials suggested by Kempa [34]. However, by far the best fit was obtainedwhen applying the NKG formula represented by the curves shown in the graph.Because of the mentioned saturation effects close to the shower centre, the ac-tual fit is only applied to the data points within the range of the full lines whilethe dashed curves are extrapolations to smaller distances. The distributionsare much narrower than those of the electrons and the scale radii determinedby the fit are about rh ≃ 10 m. Furthermore, a variation of the lateral shapeis observed which is similarly to that of the electron LDF. When fixing rh =
21

0 10 20 30 40 50 60 70 80 90
10-5
10-4
10-310-3
10-210-2
10-110-1
100100
101
102
103
Distance to shower core [ m ]
E = 50 GeV
3.4 < lg N µtr < 3.7
3.7 < lg N µtr < 4.0
4.0 < lg N µtr < 4.3
4.3 < lg N µtr < 4.6
ρh ρE
ρ ED
ensi
ty o
f had
roni
c en
ergy
[ G
eV /
m2
]
ρH
adro
n nu
mbe
r de
nsity
h [
1 /
m2
]
th
0° < θ < 18°
Fig. 12. Density of hadron number (left scale, open symbols) and of hadronic energy(right scale, filled symbols) versus the core distance for showers of truncated muonnumbers as indicated. Threshold energy for hadrons is 50 GeV. The curves representfits of the NKG formula to the data at r ≥ 8 m with a radius fixed to rh = 10 m.
lg Nµ
Age
par
amet
er s (r
h =
10
m)
0.6
0.8
1
1.2
1.4
1.6
3.2 3.6 4 4.4 4.8tr
0° < θ < 18°
Fig. 13. The age parameter s for fixed radius rh = 10 m versus the muon shower sizeN tr
µ . Open symbols are for hadronic particle density and full symbols for hadronicenergy density.
10 m to determine the age parameters s, we get the result presented in Fig 13.The age parameter yields values similar to the electromagnetic and muoniccomponent and decreases with increasing shower size as expected.
22
0 2.5 5 7.5 10 12.5 15 17.5 20 22.5 25
10-5
10-4
10-310-3
10-210-2
10-110-1
100100
101
102
Distance to shower core [m]
Den
sity
of h
adro
nic
ener
gy
ρ E [G
eV/m
2 ]
Had
ron
num
ber
dens
ity ρ h [1
/m2 ]
ρh ρEE th = 50 GeVE th = 150 GeVE th = 300 GeVE th = 500 GeV
3.4 ≤ lg Nµ < 3.7tr
0° < θ < 18°
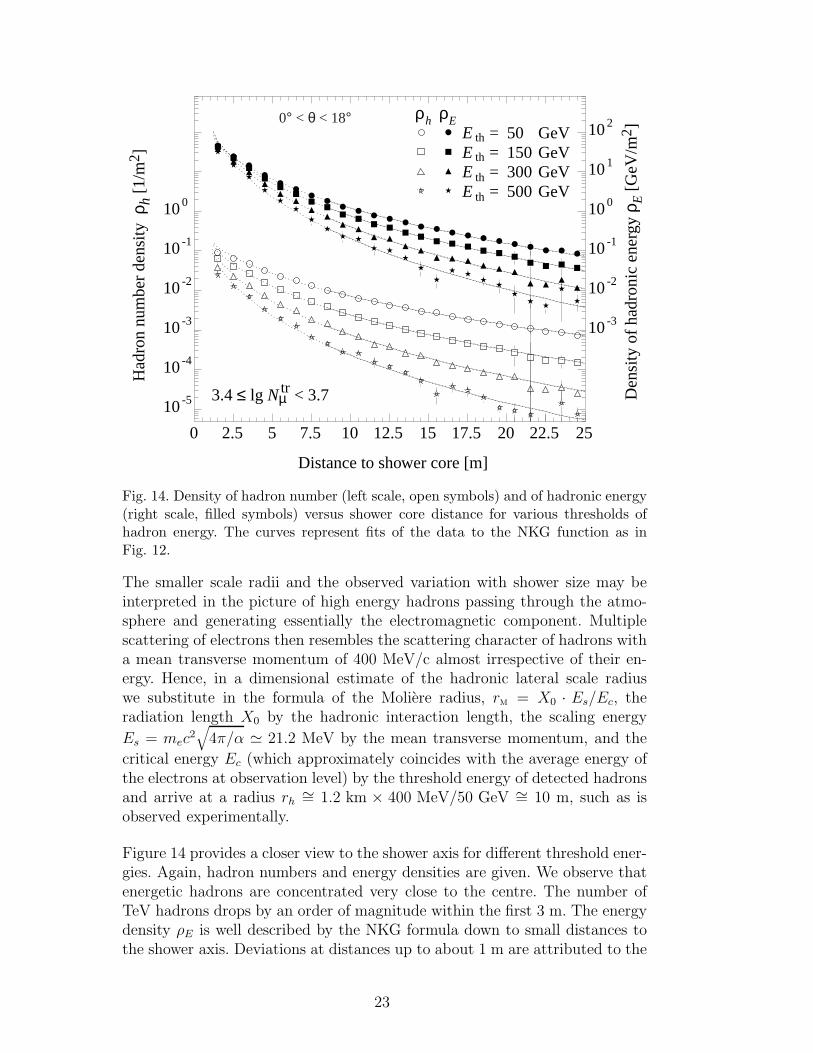
Fig. 14. Density of hadron number (left scale, open symbols) and of hadronic energy(right scale, filled symbols) versus shower core distance for various thresholds ofhadron energy. The curves represent fits of the data to the NKG function as inFig. 12.
The smaller scale radii and the observed variation with shower size may beinterpreted in the picture of high energy hadrons passing through the atmo-sphere and generating essentially the electromagnetic component. Multiplescattering of electrons then resembles the scattering character of hadrons witha mean transverse momentum of 400 MeV/c almost irrespective of their en-ergy. Hence, in a dimensional estimate of the hadronic lateral scale radiuswe substitute in the formula of the Moliere radius, rm = X0 · Es/Ec, theradiation length X0 by the hadronic interaction length, the scaling energy
Es = mec2
√
4π/α ≃ 21.2 MeV by the mean transverse momentum, and the
critical energy Ec (which approximately coincides with the average energy ofthe electrons at observation level) by the threshold energy of detected hadronsand arrive at a radius rh ∼= 1.2 km × 400 MeV/50 GeV ∼= 10 m, such as isobserved experimentally.
Figure 14 provides a closer view to the shower axis for different threshold ener-gies. Again, hadron numbers and energy densities are given. We observe thatenergetic hadrons are concentrated very close to the centre. The number ofTeV hadrons drops by an order of magnitude within the first 3 m. The energydensity ρE is well described by the NKG formula down to small distances tothe shower axis. Deviations at distances up to about 1 m are attributed to the
23
Detection threshold E [ GeV ]th
Sca
le r
adiu
s rh
(s=
1.2)
0
2
4
6
8
10
12
14
16
0 100 200 300 400 500 600
0° < θ < 18°
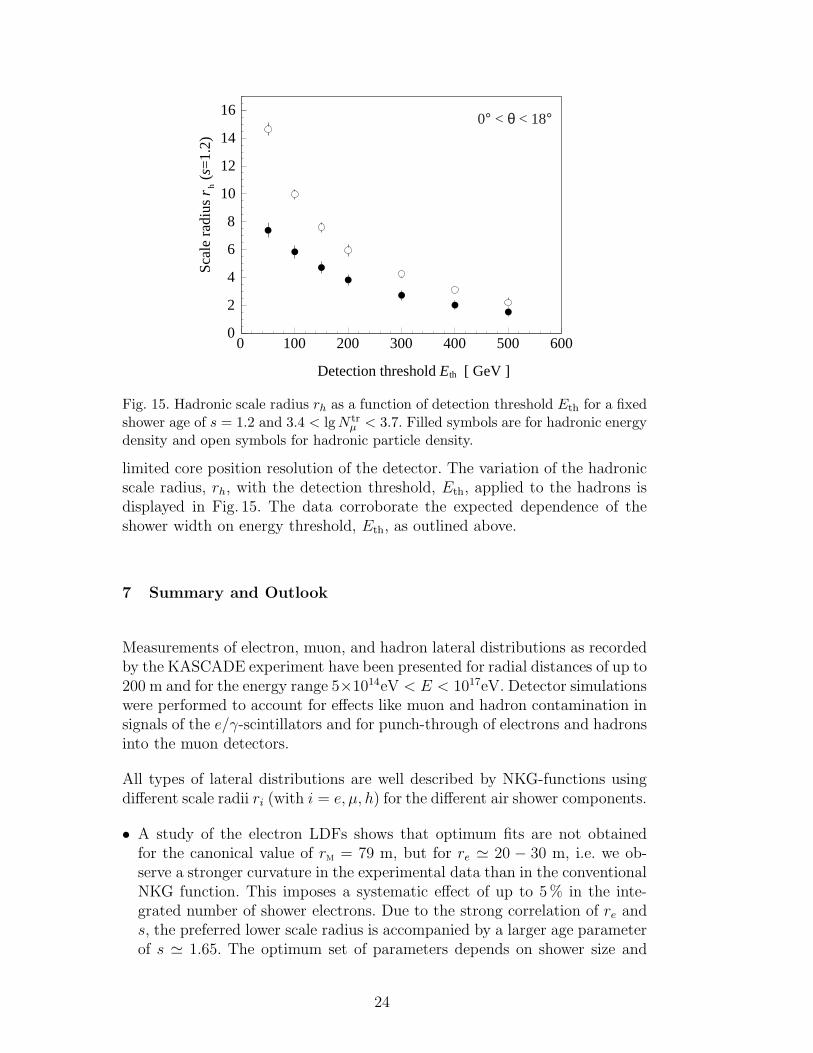
Fig. 15. Hadronic scale radius rh as a function of detection threshold Eth for a fixedshower age of s = 1.2 and 3.4 < lgN tr
µ < 3.7. Filled symbols are for hadronic energydensity and open symbols for hadronic particle density.
limited core position resolution of the detector. The variation of the hadronicscale radius, rh, with the detection threshold, Eth, applied to the hadrons isdisplayed in Fig. 15. The data corroborate the expected dependence of theshower width on energy threshold, Eth, as outlined above.
7 Summary and Outlook
Measurements of electron, muon, and hadron lateral distributions as recordedby the KASCADE experiment have been presented for radial distances of up to200 m and for the energy range 5×10¹⁴eV < E < 1017eV. Detector simulationswere performed to account for effects like muon and hadron contamination insignals of the e/γ-scintillators and for punch-through of electrons and hadronsinto the muon detectors.
All types of lateral distributions are well described by NKG-functions usingdifferent scale radii ri (with i = e, µ, h) for the different air shower components.
• A study of the electron LDFs shows that optimum fits are not obtainedfor the canonical value of rm = 79 m, but for re ≃ 20 − 30 m, i.e. we ob-serve a stronger curvature in the experimental data than in the conventionalNKG function. This imposes a systematic effect of up to 5% in the inte-grated number of shower electrons. Due to the strong correlation of re ands, the preferred lower scale radius is accompanied by a larger age parameterof s ≃ 1.65. The optimum set of parameters depends on shower size and
24
zenith angle and may be used to infer the mass of the primary particle.For practical reasons and because of limited statistics within single events,information about the shape of the electron LDF is usually extracted byfixing re and fitting only the age parameter s. A problem specific to NKGfunctions in this approach and with small scale radii re is, that upwardsfluctuations of s easily lead to ill defined shower sizes. As an alternative,we have demonstrated that a fixed age parameter but variable scale radiusprovides an equally good fit to the data. The parameter re then changes ina characteristic way and also exhibits a distinct structure at shower sizescorresponding to the knee position.
• Within the fiducial area of KASCADE, muon LDFs are well described bya NKG function, but with a scale radius of rµ = 420 m. Because of thelimitation to 40 m < r < 200 m, the experiment is not very sensitive tothe actual value chosen and the data are also equally well described by aGreisen parametrization. Significant differences would only occur at radialdistances outside the acceptance of the experiment. The unknown flat shapeof the muon LDF at large distances imposes serious problems (even formuch larger surface detector arrays) when calculating the total number ofmuons within an air shower. Most importantly, Nµ is subject to systematicshifts and increased fluctuations, thereby deteriorating the shower size andprimary energy resolution. Thus, for classifying events, we have introducedthe truncated muon number, N tr
µ , obtained from integrating the LDF onlywithin the experimental acceptance of 40-200 m. A rough scan of the lowenergy muon spectrum has been performed by analysing LDFs at Eµ ≥ 230,490, and 2400 MeV. Similarly to electrons, a steepening of the muon LDFis observed with increasing shower size and decreasing zenith angle, as isexpected for observations being increasingly closer to the shower maximum.
• Quite interestingly, also hadronic lateral energy density and particle num-ber distributions are well approximated by the NKG form up to distancesof at least 90 m. The scale radius for Eth ≥ 50 GeV is rh ≃ 10 m and scalesroughly proportional to E−1
th, as expected by a simple dimensional compar-
ison of electromagnetic multiple scattering and hadronic interactions.• The interrelation between the electromagnetic and hadronic EAS compo-nent may explain the ‘unconventional’ small preferred scale radius of theelectron LDF of 20-30 m as compared to the classical value of rm ≃ 80 m. Itshould be kept in mind that the classical Moliere radius has been derived forpure electromagnetic showers and for zero energy threshold only. However,extensive air showers are mostly initiated by primary hadrons. Therefore,the shower evolution is mostly driven by the substantially narrower hadroniccomponent, and the effective lateral scale radius of observed electrons is ex-pected to be smaller than for Ekin ≥ 0 electrons in pure γ-initiated showers.
The present paper is not focussed to detailed analyses in terms of predictionsof the EAS developments from Monte Carlo simulations and to a comparisonof different theoretical high-energy interaction approaches like VENUS [35],
25
QGSJET [29] and SIBYLL [36]. These models, continuously in the processof refinement, are generators implemented into the Karlsruhe EAS MonteCarlo code CORSIKA [27]. However, the presented results provide a coherentexperimental basis for serious tests considering simultaneously the three mainEAS components, not only concerning the interaction but also the particlepropagation procedures. It may be noted that the muon lateral distributionsare experimentally given for three different energy detection thresholds ofthe registered muons, thus implying also some sensitivity to the low energyspectrum. Most valuable for such tests are observations based on the hadroniccomponent. An example of first analyses in this scope were presented in [37]and a remarkable agreement of lateral distributions of hadrons for primaryprotons and Fe nuclei was observed. In particular, the absence of peculiarfeatures, in contrast to earlier observations by Danilova et al. [16] and Arvelaand Elo [18] can be stated, even at energies as high as 10 PeV. Such resultssupport the trust in a correct handling of the particle propagation and of thedevelopment of the hadronic component at least for hadron energies above50 GeV. More detailed comparisons of lateral distributions with CORSIKAsimulations are under study and will be subject of a forthcoming publication.
Acknowledgements
The authors are indebted to the members of the engineering and technicalstaff of the KASCADE collaboration, who contributed with enthusiasm andengagement to the success of the experiment.
The support, based on common projects of Scientific-Technological Coopera-tion Agreements (WTZ) and provided by the Ministery for Research of theGerman Federal Government and International Bureau Bonn, is gratefullyacknowledged. The collaboration has been partly supported by grants of thePolish Committee for Scientific Research, the Romanian Ministery of Researchand Technology, of the Armenian Government and an ISTC project (A116).
References
[1] P. Auger et al., Rev. Mod. Phys. 11 (1939) 288.
[2] K. Greisen, Ann. Rev. Nucl. Sci. 10 (1960) 63.
[3] K. Kamata and J. Nishimura, Prog. Theoret. Phys. Suppl. 6 (1958) 93.
[4] J. Nishimura, Handbuch der Physik, volume 46/2, pp. 1–114, Springer-Verlag,1967.
[5] S. Yoshida et al., J. Phys. G: Nucl. Part. Phys. 20 (1994) 651.
[6] A. V. Glushkov et al., Proc. 25th ICRC, Durban, Vol. 6, p. 233, 1997.
[7] R. N. Coy et al., Astroparticle Physics 6 (1997) 263.
26
[8] A. M. Hillas and J. Lapikens, Proc. 15th ICRC, Plovdiv, Vol. 8, p. 460, 1977.
[9] J. N. Capdevielle, J. Gawin, and J. Procureur, Proc. 15th ICRC, Plovdiv, Vol.8, p. 341, 1977.
[10] A. A. Lagutin et al., Proc. 25th ICRC, Durban, Vol. 6, p. 285 and p. 289, 1997.
[11] R. Armitage et al., J. Phys. G 13 (1987) 707.
[12] N. Hayashida et al., J. Phys. G 21 (1995) 1101.
[13] M. Aglietta et al., Nuovo Cimento B 112B (1997) 139.
[14] J. Linsley, Proc. 8th ICRC, Jaipur, Vol. 4, p. 77, 1963.
[15] A. M. Hillas et al., Proc. 11th ICRC, Budapest, Vol. 3, p. 533, 1969; ActaPhysica Academiae Scientarium Hungaricae 29, Suppl. 3, pp. 533-538, 1970.
[16] T. V. Danilova et al., Proc. 19th ICRC, La Jolla, Vol. 7, p. 40, 1985.
[17] H. Hasegawa et al., Proc. 9th ICRC, London, Vol. 2, p. 642, 1965.
[18] H. Arvela and A.-M. Elo, Proc. 24th ICRC, Rome, Vol. 1, p. 332, 1995.
[19] R. H. Vatcha and B. V. Sreekantan, J. Phys. A 6 (1973) 1050.
[20] R. H. Vatcha and B. V. Sreekantan, J. Phys. A 6 (1973) 1067.
[21] G. Cocconi, Handbuch der Physik, volume 46/1, pp. 215–271, Springer-Verlag,1961.
[22] S. V. Ter-Antonian et al., Proc. 24th ICRC, Rome, Vol. 1, p. 369, 1995.
[23] R. Ticona et al., Proc. 23rd ICRC, Calgary, Vol. 4, p. 331, 1993.
[24] P. Doll et al., (KASCADE Collaboration), The Karlsruhe cosmic ray projectKASCADE, Report KfK 4686, Kernforschungszentrum Karlsruhe, 1990.
[25] H. O. Klages et al., (KASCADE Collaboration), Nucl. Phys. B, Proc. Suppl.52B (1997) 92.
[26] J. Engler et al., Nucl. Instr. and Meth. A 427 (1999) 528.
[27] D. Heck et al., CORSIKA: A Monte Carlo code to simulate extensive airshowers, Report FZKA 6019, Forschungszentrum Karlsruhe, 1998.
[28] J. Weber et al., (KASCADE Collaboration), Proc. 25rd ICRC, Durban, Vol. 6,p.153, 1997.
[29] N.N. Kalmykov, S.S. Ostapchenko, A.I. Pavlov, Nucl. Phys. 52B (1997) 17.
[30] Application Software Group, GEANT - Detector Description and SimulationTool, CERN, Geneva, 1993.
[31] H.H. Mielke, Internal Report FZK 51.02.03-01, Forschungszentrum Karlsruhe,1996
[32] R. Glasstetter et al., (KASCADE Collaboration), Proc. 26rd ICRC, Salt LakeCity, Vol. 2, p.222, 1999.
[33] A. Haungs et al., (KASCADE Collaboration), Features of the EAS muondensity distributions measured with the KASCADE experiment, Report FZKA6263, Forschungszentrum Karlsruhe, 1999.
[34] J. Kempa, Nuovo Cimento 31A (1976) 568 and 581.
27
[35] K. Werner, Physics Reports 232 (1993) 87.
[36] R.S. Fletcher et al., Phys. Rev. D 50 (1995) 5710.
[37] T. Antoni et al., (KASCADE Collaboration), J. Phys. G 25 (1999) 2161.
28