electronic working paper series · 1 cesis electronic working paper series paper 90. multinational...
TRANSCRIPT
1
CESIS Electronic Working Paper Series
Paper 90.
Multinational Enterprises and Innovation:
Firm level evidence on spillover via R&D collaboration
Hans Lööf*
First version May 2007, Revised version October 2007.
* Royal Institute of Technology, Centre of Excellence for Studies in Innovation and Science, Department of Infrastructure, Drottning Kristinas väg 30B, SE-10044 Stockholm, Sweden, e-mail: [email protected], phone: +46 8 790 80 12 I gratefully acknowledge the financial support of Swedish Governmental Agency for Innovation Systems, VINNOVA, and I thank the anonymous referee, seminar participants at the Waikato University, Hamilton, New Zeeland 2007 and seminar audience at the 34th EARIE Conference,Valencia 2007, Martin Andersson, Börje Johansson, Anjum Assad and Phil Greene for comments.

2
Abstract
This paper estimates the knowledge spillovers to multinational firms (MNEs) in Sweden via
domestic and foreign R&D collaboration. Applying an augmented GMM-estimator that accounts for
both selectivity and simultaneity bias on data from 1,249 MNEs, our research has resulted in five
distinct conclusions. First, we find that the knowledge spillovers via R&D collaboration typically take
place as a network phenomenon rather than a process between the local firm and a single innovation
partner. Second, successful collaboration is conditional on foreign innovation partners in the network.
Third, output is found to be an increasing function of R&D-collaboration only among non-export
oriented firms. Fourth, foreign MNEs selling mainly to local and regional markets in Sweden benefit
more from R&D collaboration than other firms. Overall, the results show that demand driven motives
that require entrepreneurial knowledge to adapt products to local consumers and markets are more
important for successful R&D-collaboration than supply driven motives.
Keywords: Innovation, multinational enterprises, R&D collaboration, spillovers. JEL codes: D21, F23, L21, L22, O31, O32
3
1. Introduction A rather extensive body of literature has already looked at how innovation is affected by domestic
and international transmission of technology by examining different channels such as FDI, trade,
licensing, cross-patenting activities, input-output relations, labour mobility, strategic alliances, and
regional and international R&D collaboration.
The aim of this paper is to better understand some of the empirical results that have been shown in
recent research on knowledge spillover2 and innovation. Knowledge transfer provides a potential to
increase the revenues from firms’ investment in research and development through access to
technological assets of other firms.
Although it has been suggested that multinational enterprises, MNEs, are in a special position to
handle knowledge transfer, recent research in this area has identified difficulties in transferring
knowledge across networks consisting of subunits and innovation partners (see, for instance, Gupta
and Govindarajan 2000). Surveying the literature based on micro-data, Carkovic and Levine (2002)
conclude that firm level studies of particular countries often do not find positive spillovers from
foreign-owned to domestic firms. By investigating a sample of MNEs with sub-units in Sweden,
Persson (2006) has shown that only 43 % of potential receivers of knowledge for innovation within
MNE organizations were using this knowledge.
Recent studies on MNEs and spillovers have shifted the focus from hierarchical links between
headquarters and subunits to formal and non-formal arrangements with various partners linked
together by complex operating across regions and nations. Based on evidence from Belgian CIS-
survey data, Veugelers and Cassiman (2004) suggest that foreign subsidiaries are not necessarily
interesting R&D partners for knowledge spilloverd. What seems to be more important for a local firm
is to have an international network of collaborators that provides access to international technology.
World Investment Report (2005) argues that the drivers of R&D internationalization are changing. The
process is no longer only driven by the need for local adaptation or tapping into established knowledge
centers. Instead the MNEs, must use different R&D strategies simultaneously in order to enhance their
competitiveness by speeding up the process of technological development and by making better use of
the investment in R&D.
2 This paper uses knowledge spillovers as a synonym to technology transfer. However, the idea of spillovers is that there is an input that is employed without paying the full price for it. In the present analysis we have no information about how the various arrangements on R&D collaboration are financed.

4
The research strategy of this paper is to examine how markets orientation of MNEs and corporate
ownership structure influence the correlation between innovation output and R&D collaboration
within and across the border of individual firms. In order to do so, we classify a Swedish sample of
1,249 MNEs on the basis of whether their main market is international or regional (Sweden), and
whether they are foreign or domestically owned.
Our hypothesis is that the outcome of estimations is related to the nature of technological
activities within the local MNE, by the type of required knowledge in the firms’ innovation process
and by technological objectivities decided in some primary market or close to the headquarters . With
this in mind, we investigate whether the link between innovation performance of MNEs is associated
with (i) the location, number and category of R&D collaborators and (ii) ownership and market
orientation of the observed MNE. The data used in this paper is a subset of data on multinational
enterprises (MNEs) from the Community Innovation Survey (CIS) IV for Sweden. The CIS
information has been supplemented with register data.
Incorporation of markets in our analysis of R&D collaboration is motivated by findings about the
link between innovation and growth in the literature on trade and international transfer of
technological knowledge (Coe and Helpman 1995, Olley and Pakes 1996, Keller 2001, Halpern et al
2006) and by a first inspection of the data as well, which reveals a distinct difference in R&D intensity,
knowledge intensity in production and innovation sales related to the market orientation of the
observed firm.
The justification for corporate ownership structure can be traced back to the literature on
globalization of R&D, which identifies different behaviors of MNE innovative activities depending
on the nature of the technological activities and technological objectivities of the parent company. If
knowledge spillover are related to a particular R&D strategy of the MNE, one may expect that the
association between R&D collaboration and innovation tends to differ.
The analysis has highlighted some important factors that influence the efficiency of technological
transmission within and across national borders through R&D collaboration. The concluding finding is
that demand driven motives that require entrepreneurial knowledge to adapt products to local
consumers and markets are more important than supply driven scientific knowledge.
More specifically, while applying an augmented GMM estimator that accounts for both selectivity
and simultaneity bias this research has resulted in several conclusions. We find that knowledge
spillovers via R&D collaboration typically take place as a network phenomenon rather than a process
between the local firm and a single innovation partner. Successful collaboration is conditional on

5
foreign innovation partners in the network. R&D collaboration are not found to have any significant
effect on innovation by export-oriented MNEs. Innovation sales is an increasing function of R&D-
collaboration among non-export oriented firms. Foreign MNEs selling mainly to local and regional
markets in Sweden benefit more from R&D collaboration than other firms.
The remainder of the paper is organized in the following fashion: Section 2 presents the data and
puts special emphasis on the distribution of collaboration patterns and innovation activities across
firms with respect to corporate ownership structure and market orientation. In section 3, we formulate
the hypothesis on the correlation between of innovation and R&D collaboration based on what is
already known in the MNE literature. Section 4 discusses the empirical methodology. The result of the
analysis and conclusions is presented in Section 5 and Section 6 respectively.
2. Data and descriptive statistics
The data used in this paper is a subset of data on multinational enterprises (MNEs) from the
Community Innovation Survey (CIS) IV for Sweden. The survey was conducted in 2005 and covers
the period 2002-2004. The rate of response was close to 70 %. The original sample contains 3,094
firms and covers both manufacturing and service sectors. The information on innovation activities
from the survey has been supplemented with register data on firm characteristics from Statistics
Sweden for the observed firms. Our data is a subset of the original sample and is restricted to MNEs.
The total number of observations on MNEs with 10 or more employees is 1,249, of which 335
export more than 50 % of their production and the remaining 914 sell the majority of their production
on regional markets in Sweden. Before discussing the data, we will classify the observed firms into
four different groups based on ownership and market orientation. First, we separate the 1,249 firms
into two groups: those who are producing mainly for the global market and those who are targeting
regions in Sweden. Second, we define a firm as foreign if it has its headquarters outside Sweden,
otherwise it is domestic. We end up with four categories of firms: (i) F-EXP: Foreign-owned firms in
Sweden with sales income mainly from exports to the global market, (ii) D-EXP: Domestically owned
with sales income mainly from the global market, (iii) F-SWE: Foreign-owned firms with sales
income mainly from regional markets in Sweden, (iv) D-SWE: Domestically owned firms producing
mainly for regional markets within Sweden.
Table 1 shows that of all MNEs 49% are innovative firms. The average share is considerably
higher (67 %) among firms penetrating the global market. The corresponding figure among MNEs
penetrating the regional markets in Sweden is 42 %. We define “innovative” as firms reporting both

6
innovation input (mainly R&D) and innovation output (sales income from innovations launched on the
market during the period 2002-2004) for the year 2004. Ten industry classes are used in the regression
analysis. A large variation in share of innovative firms is observed, ranging from 27 % (transport,
storage and communication) to 67 % (manufacture of machinery and equipment).
Table 2 reports summary statistics on the data employed in econometric model presented in
section 4. We use traditional knowledge production variables suggested in the recent innovation
literature (Crépon, Duguet and Mairesse 1998, Leeuwen and Klomp 2006, Lööf and Heshmati 2006),
augmented by information on trade and finance. Thus, we investigate the importance of external R&D
collaboration on innovation output while controlling for factors such as the firm’s R&D intensity, size,
skill and human capital, physical capital, export as a fraction of sales, export value and external
borrowing. All variables are expressed as logarithms and are in per employee terms, except capital
structure, human capital, market and the indicator variables for collaboration on innovation, which are
given as percentages.
While Section A of Table 2 shows statistics for all firms, statistics for innovative firms only are
presented in Section B. The largest fraction (63 %) of the innovative MNEs in Sweden are oriented
towards local markets in Sweden. It is notable that local markets in Sweden are relatively more
important for foreign owned SMEs than for domestic SMEs. The pattern of external collaboration on
innovation is captured by eight dummy variables for Swedish local/regional and global collaboration (i)
within the group, (ii) with academic and other scientific partners, (iii) with vertical partners, that is
customers and suppliers, and (iv) with firms in the same industry and consultants (horizontal partners).
The majority of the innovative MNEs participate in external R&D collaboration (62 %). The largest
fraction of them has only one collaborator, while one out of four innovative firms collaborates with
both foreign and domestic innovation partners. The most frequent collaboration partners are suppliers
and customers within and outside Sweden.
Table 3 presents summary statistics for innovative firms after market focus and corporate
ownership. Rows 2-6 displays trade statistics. Row 2 shows that firms producing for the global market
sell three quarters of their production outside Sweden, while the firms producing mainly for Sweden
export only slightly more than 10 % of their production. This major difference is also reflected in the
figures for export per employee. Taking the ratio of export value to export weight indicates that export
oriented MNEs with headquarters outside Sweden are the most knowledge intensive category of firms
in Sweden. Row 4 also reveals that MNEs that focus on the Swedish market are less knowledge
intensive in their export. They are also less R&D-intensive and smaller than export oriented firms.

7
Rows 4-5 show that the difference between the two groups of firms are considerably smaller regarding
import intensity.
A comparison of pairwise foreign and domestic export oriented firms and foreign and domestic
non-export oriented firms respectively as in rows 7-9, shows that sales per employee, value added
per employee and innovation sales (sales income from new products per employee) are the highest
among the foreign owned enterprises. This finding is consistent with the literature, which shows that
within countries, foreign-owned firms generally have higher productivity than local firms (see
Ebersberger and Lööf 2005). The literature suggests some alternative explanations for the observed
difference in performance between domestic and foreign firms, for instance, (i) only firms with
superior technology or superior productivity are candidates for mergers and acquistions (M&A)
through inward FDI, (ii) inward FDI is oriented toward high productivity sectors, and (iii) M&A have
a positive impact on firm efficiency per se.
It is also worth noting that we are using two different measures each for the intensity of human
capital (the fraction of university educated personnel and wage per employee), for physical
investments (gross investment and machinery investment only per employee) and for export (value per
employee and fraction of sales). Econometric issues, related to controls in the selection equation and
appropriate instruments in the GMM regression as well, motivate this. Moreover, the capital structure
shows that export-oriented MNEs are more equity-financed than firms focusing on the Swedish
market.
The bottom of Table 3 reports the fractions of firms that collaborate with the four categories of
foreign and domestic (Swedish) R&D partners. Foreign-owned firms collaborate foremost with other
units within the group across international borders and with suppliers and customers in Sweden, while
the Swedish firms tend to collaborate most with partners within the national system of innovation
(universities, customers, suppliers, competitors, consultants) and with foreign vertical partners.
Summarizing the information provided in Table 3 shows a fairly robust pattern: Export-oriented
firms are more R&D intensive and have higher innovation sales than non-export oriented firms. They
are bigger in size, more capital-intensive and have higher knowledge intensity (approximated by the
ratio between export value and export volume) in their export products. However, their human capital
intensity is lower. The latter is explained by a larger fraction of knowledge intensive services among
non-export oriented firms.
Table 4 shows a correlation analysis for innovative MNEs producing for the global market and
regional markets in Sweden respectively. The correlation coefficients presented in Table 4, Panel A

8
reveal that R&D, human capital, skill and export are strongly associated with innovation sales among
export-oriented firms. All the variables in rows (1) - (2) and (4) - (5) are expressed in logarithm and
per employee. Human capital is the share of employees with university education. Regarding the eight
different dummy variables for R&D collaborators, the correlation coefficient is largest for units within
the group but outside of Sweden (0.11) and quite marginal for other alternatives.
The order of magnitude of the correlation coefficients for human capital and export is considerably
smaller when non-export oriented firms are considered (See Panel B) Interestingly a stronger
association can be found between R&D collaboration and innovation output compared to MNEs
producing for the global market. The correlation analysis also reveals a close correlation between log
R&D per employee and human capital, partly due to the fact that R&D personnel are a fraction of
human capital. Since our data do not separate R&D personnel from human capital, the importance of
these variables will be underestimated due to double counting if both are included in the regressions.
Therefore, we will exploit wage sum per employee as a proxy for human capital and hopefully reduce
this problem. The assumption is that wage sum includes a skill premium. The information on human
capital is, however, used as a determinant to engage in innovation in the first step of the selection
model.
3. Hypotheses regarding R&D collaboration and innovation
3.1 Theoretical framework
Several authors have usedt patent citation data in order to trace possible links between
geographical proximity and innovation (Jaffe et al 1993, Almeida 1996, Eaton and Kortum 1999,
Bottazzi and Peri 2002, Verspagen ands Schoenmakers 2004). This research typically shows that
proximity in the creation of economically useful knowledge is important. Some authors also suggest
that investors increasingly use domestic knowledge more than foreign knowledge (Sonn and Storper
2003).
Another branch of the R&D literature focuses on how global knowledge spillover affects
productivity. Inward FDI have often been emphasized as being one primary driving force for
technology transfer across regions and countries (Keller and Yeaple 2003). A growing strand of the
FDI literature is focusing particularly on the link between R&D and innovation. In this literature, it is
possible to distinguish between the headquarters (HQ)-based theory or traditional view and the
network-based approach.

9
As has been suggested by White and Poynter (1990), Nohria and Ghosal (1997), O’Donnell
(2000), Narula and Zanfei (2005) and others, a drawback with the traditional theory on foreign direct
investment in R&D, as originally suggested by Vernon (1966), is that it presumes that MNE has a
single centre in the first place with rather homogonous foreign subsidiaries serving as a group of
miniature replicas of the home country organization.
In order to allow for the possibility that the MNE may have no distinct home base for their core
R&D activities but multiple affiliates as well as a variety of local and global cooperation partners,
more recent models try to describe MNEs as a network of differentiated subsidiary units and R&D
partners in formal and non-formal collaboration arrangements linked together by complex operating
interdependies across regions and nations (see for instance Kogut and Kulantilaka 1994 and
Berkinshaw and Hood 1998). Subsidiary units are still central units of analysis, since they are assumed
to be important providers of novel knowledge for the MNEs. But while the previous, more hierarchical
view of MNE primarily concentrated on the relationship between headquarters and various subunits,
the network-based theories attempt to incorporate factors such as extensive heterogeneity where no
two units are the same, a high degree of complexity in the innovation processes, institutional and
cultural differences and information asymmetries.
3.3 Taxonomies and hypotheses
Following work by Dunning and Narula 1995, Archibugi and Michie 1995, Kuemmerle 1997,
Nobel and Birkinshaw 1998, Gassmann and von Zedtwitz 1999, Archibugi and Iammarino 2002, Le
Bas and Sierra 2002 and others, UNCTAD (2005) compiled two useful sets of taxonomies of R&D by
foreign affiliates that include aspects of the traditional view and of the network approach as well.
Despite the fact that the taxonomies are mainly drawn from the large body of literature studying
offshore R&D, we believe that they can also be applied to our observed sample of both foreign-owned
and domestically owned MNEs. The most serious objection to our proposed application is that we can
only observe the foreign-owned MNE unit in the host country and the domestically owned MNE unit
in their home country. The ideal situation would include observations on R&D activities by foreign-
owned as well as domestically owned MNEs globally. However, with this deficiency in mind, we will
now introduce the two sets of taxonomies.
The first set is based on the nature of technological activity in foreign affiliates and reflects four
different technological functions assigned to foreign affiliates: (i) Adaptive R&D in order to make
existing technologies more efficient in new environments, (ii) Innovative R&D linked to production
for local or regional markets, (iii) Global innovative R&D for new products or processes, or for basic

10
research; in this case, the local firm can be seen as the core innovating center placed on equal level
with other centers of excellence globally within the MNE, (iv) Technology scanning monitoring unit,
which does not require an R&D unit, but a business intelligence function. We will not consider the
latter category of technological activities in the following.
The second set of R&D taxonomies relates to technological objectivities of the parent company:.
In our application of this classification, we consider two categories for MNEs in the host-country (F-
EXP and F-SWE) and two categories in the home country (D-EXP and D-SWE). One obvious
deficiency here is that we will underestimate the importance of the link between the Swedish owned
MNEs and regional innovation systems to the extent that the R&D output is exploited in non-observed
foreign affiliates.
The types of father company motivated technological activities are (i) Technology-seeking: the
observed MNE seeks to offset areas of weakness in the home-country innovation system by setting up
R&D facilitates or acquiring local innovators in countries with complementary strengths, (ii) Home-
base (or asset-) exploiting: the main function of R&D is to absorb and adapt technologies transferred
by the parent company so that the MNE can effectively exploit its technological assets on regional
markets in Sweden, and (iii) Home-base (or asset-) augmenting: the MNE undertakes R&D in
technologies in which they simultaneously are strong at home and in which Sweden also has strengths.
Fischer and Frölich 2001 and Karlsson and Johansson 2004 offer a third useful category of
taxonomy. It separates knowledge for innovation into three distinct forms: (i) scientific knowledge in
the form of basic principles, (ii) technological knowledge in the form of “technical solutions”, and (iii)
entrepreneurial knowledge about products, attributes, customer preferences and market conditions,
business concepts, etc.
Fig 1: Hypotheses on motives for MNEs’ R&D collaboration
Hypothesis Demand driven Demand and supply driven
Supply driven
Technological activities
Adaptive R&D Innovative R&D for regional markets
Innovative R&D for global markets
Father-comp. motives
Technology-seeking Home-base exploiting Home-base augmenting
Required knowledge
On products, consumers, markets, concepts, etc.
Technical solutions Scientific knowledge on basic principles
Figure 1 displays our hypothesized relationship between R&D collaboration and innovation output
on the basis of demand- or supply-based motives. Column (1) illustrates that we assume that adaptive
R&D, technology-seeking motives and entrepreneurial knowledge can be grouped together under the
11
heading “demand driven” (or market driven) R&D collaboration. Under the header “supply driven (or
scientific driven) R&D collaboration, column (3) we group innovative R&D for the global market,
home-based augmenting motives and scientific knowledge on basic principles. Column (2) is a mix
between the two pure motives for foreign and regional arrangements on collaboration, which includes
innovative R&D for regional markets, home-base exploiting motives and knowledge about technical
solutions.
Although the firms have complex motives for R&D collaborations, we will test two different
alternative influences on innovation output on the basis of the taxonomy above.
• First, since the typical F-SWE and D-SWE are selling about 90 % of their production to regional
markets in Sweden, it can be assumed that most of their R&D collaboration is in conjunction
with, or in response to specific locational conditions in Sweden. This means that their motives
for R&D collaboration are mainly demand driven or are a combination of demand and supply
driven. Thus, if the observed R&D collaborations are characterized mainly by demand driven
motives we hypothesize the expected outcome of the estimations is that F-SWE and D-SWE are
benefiting more from R&D collaboration than other firms.
• Second, since F-EXP and D-EXP sell three-quarter of their production on markets outside
Sweden and on average they are considerably more R&D-intensive than firms producing mainly
for the Swedish market, we conclude that their technological activities can be characterized by
“innovative R&D for global markets.” In addition to that, we assume that the R&D activities of
these firms at least partly are science based and home-base augmenting and therefore they can
be classified as supply driven. We formulate our alternative hypothesis as follows: if the
observed R&D collaborations are characterized mainly by supply driven motives the expected
outcome of the estimations is that F-EXP and D-EXP are benefiting more from R&D
collaboration than other firms.
To summarize, we will investigate whether a typical MNE whose innovation activities mainly are
characterized as demand driven will benefit more from R&D-collaboration than a MNE with supply
driven innovation activities. The supply and demand driven motives are derived from market
orientation. In addition we ask if the outcome of the relationship between internal innovation and
external collaboration is influenced by corporate ownership structure and by the location of the
collaborating subunits. Although our data are incomplete in the sense that it only covers the return on
R&D-collaboration that shows up in local establishment in Sweden and not in their subsidiary units
elsewhere, we believe that our approach might lead to a better understanding of some recent empirical
results indicating weak spillover from R&D collaboration.
12
4. Specification and methodology
4.1 Specification of the model
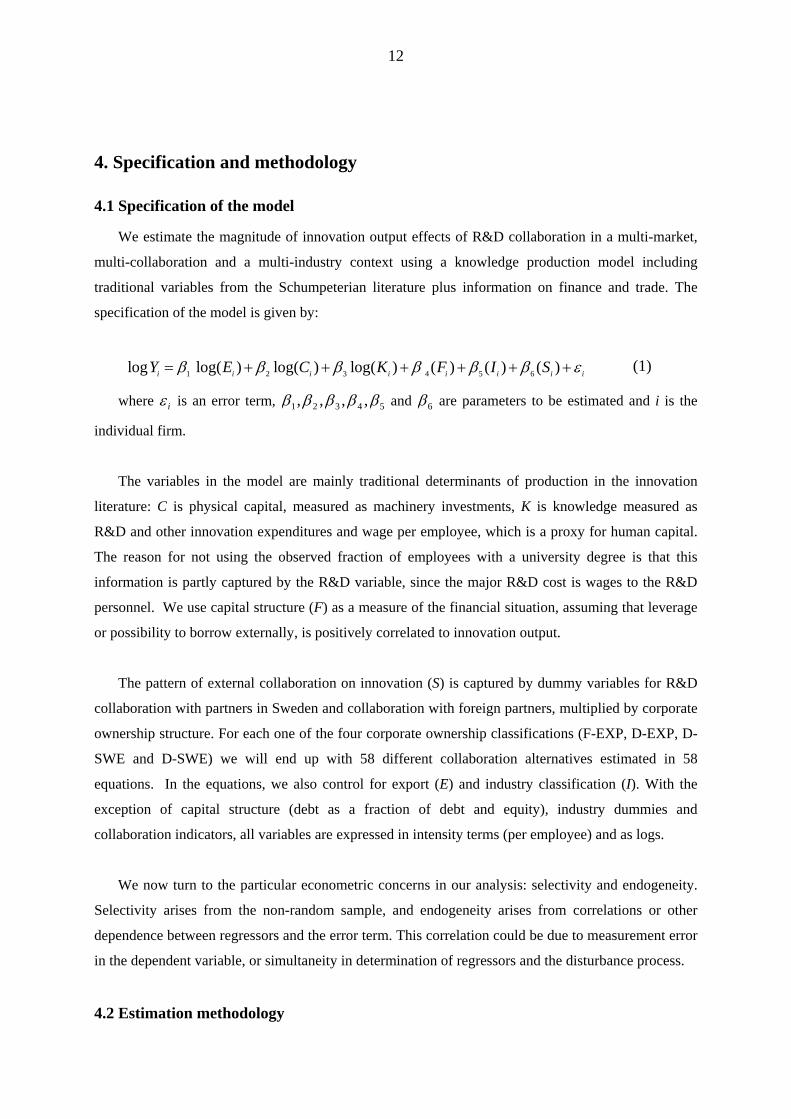
We estimate the magnitude of innovation output effects of R&D collaboration in a multi-market,
multi-collaboration and a multi-industry context using a knowledge production model including
traditional variables from the Schumpeterian literature plus information on finance and trade. The
specification of the model is given by:
1 2 3 4 5 6log log( ) log( ) log( ) ( ) ( ) ( )i i i i i i iY E C K F I S iβ β β β β β= + + + + + ε+ (1)
where iε is an error term, 54321 ,,,, βββββ and 6β are parameters to be estimated and i is the
individual firm.
The variables in the model are mainly traditional determinants of production in the innovation
literature: C is physical capital, measured as machinery investments, K is knowledge measured as
R&D and other innovation expenditures and wage per employee, which is a proxy for human capital.
The reason for not using the observed fraction of employees with a university degree is that this
information is partly captured by the R&D variable, since the major R&D cost is wages to the R&D
personnel. We use capital structure (F) as a measure of the financial situation, assuming that leverage
or possibility to borrow externally, is positively correlated to innovation output.
The pattern of external collaboration on innovation (S) is captured by dummy variables for R&D
collaboration with partners in Sweden and collaboration with foreign partners, multiplied by corporate
ownership structure. For each one of the four corporate ownership classifications (F-EXP, D-EXP, D-
SWE and D-SWE) we will end up with 58 different collaboration alternatives estimated in 58
equations. In the equations, we also control for export (E) and industry classification (I). With the
exception of capital structure (debt as a fraction of debt and equity), industry dummies and
collaboration indicators, all variables are expressed in intensity terms (per employee) and as logs.
We now turn to the particular econometric concerns in our analysis: selectivity and endogeneity.
Selectivity arises from the non-random sample, and endogeneity arises from correlations or other
dependence between regressors and the error term. This correlation could be due to measurement error
in the dependent variable, or simultaneity in determination of regressors and the disturbance process.
4.2 Estimation methodology

13
As a point of departure for the discussion, we first consider the OLS linear model:
εβ += Xy (2)
where, in matrix form, is innovation sales, X is a matrix of different categories of possible
influences on innovation performance and
y
ε is the disturbance term. In order to account for possible
selection bias, we will employ a multi-step estimator and use the two-step Heckman model estimator
(Heckman 1976). Following the notation in Lewbel (2004), the model can be formally described as
follows. In the first step, we estimate a latent binary choice (probit) model:
)0ˆ( ' ≥+= εγXID (3)
for selection by maximizing a likelihood function ),,,( γXDL yielding estimated parameter .γ̂ in
the equation is an observed dummy variable for innovation engagement that equals zero or one,
D
X is
a vector of observed determinants to innovation engagement, γ̂ is a vector to be estimated, ε is an
unobserved error with variance equal to one and I is the indicator function that equals to one if its
arguments are true and zero otherwise.
In a second step, we estimate parameters by applying the ordinary least squares to the linear
regression model:
λβ ˆ,ˆ
eXmXy ++= λγβ )ˆ( '' (4)
where y is (log) innovation sales, X is a vector of regressors, β and λ are vectors to be estimated,
is the estimated inverse mills ratio, IMR, and e is the error term. A significant coefficient
of the IMR, denoted lamda, indicates that the selection model must be used to avoid inconsistency.
)ˆ( 'γXm
A concern with multi-step estimators such as the Heckman two-step model is that, while reducing
the selection bias problem, they introduce some new problems. In particular, since they only account
for estimation error in the second stage, the associated standard error is often incorrect. Newey (1984)
suggested a theoretical solution to these problems by estimating γ̂ in the first stage and in the
second stage by applying the method or moments (MM) or generalized method of moments (GMM) to
some vector of known functions in step one and step two respectively. Empirically, the crucial issue is
to identify a regressor that is special in a sense that one might call “very exogenous” (Lewbel, 2004).
Since our dataset does not include any appropriate candidate to serve as such a variable, we construct
an “augmented GMM” estimator by using the predicted IMR from the Heckman model as a regressor
in GMM estimation.
β̂
14
Formally, the GMM estimator can be described as follows: consider first the linear model (2)
above. If X and u may be correlated, we will obtain a consistent estimator by using instrumental
variables (IV) estimation by using an instrument, defined as a matrix Z, that is highly correlated with
X and at the same time independent of u. If appropriate tests show that we have a valid instrument, we
will apply the GMM, which implies pre-multiplying (2) by Z as follows:
uZXZyZ ''' += β (5)
where X is a matrix including the key variables, the controls, the predicted IMR and the instrumented
export variables, and Z is the instrument.
4.3 Specification of the model
We specify the Heckman model as follows: The dependent variable in the first step, i.e. the
selection equation, indicates whether or not a firm is innovative. By innovative we mean a firm with
positive R&D expenditures and positive innovation sales. Our explanatory variables are motivated
from the Schumpeterian literature on R&D determinants: size, market, financing, technological
opportunities and industry classification (Cohen and Levine, 1989, Crépon, Duguet and Mairesse et
al., 1998, Klette, Moen and Griliches 2000, Hall 2005). More precisely, we specify the determinants to
be log employment, human capital, log investment in machinery and equipment per employee, capital
structure and, export as a fraction of sales and 10 industry dummies. In the outcome equation (step
two), the regressand is log innovation expenditures explained by log employment, log investment in
machinery and equipment per employee and industry.
The key equation in our analysis is the innovation function, for which we employ an augmented
GMM-model. The emergence of new firm-level data, including the European Community Innovation
Survey (CIS), has led to a surge of studies on innovation and firm behaviour. Following the seminal
papers by Pakes and Griliches (1984), Cohen and Klepper (1996) and Crépon, Duguet and Mairesse
(1998) one strand of this literature are explaining innovation output by R&D, human capital, physical
capital and firm size controlling for both selectivity bias and simultaneity bias. This paper expands the
covariates to also include also the impact of financing and trade. The importance of financing for
technological change was suggested nearly 100 years ago by Schumpeter (1911) and recent literature
on technology transfer suggests international trade one of the major channels for technology transfer.

15
In the GMM-model the dependent variable is log innovation sales per employee. The factors of
innovation sales are specified to include the following: log innovation expenditures per employee, log
wage per employee approximated by wage sum, since we cannot separate university-educated
personnel from R&D personnel, log investment in machinery and equipment per employee, log firm
size (employees), inverse mills ratio (predicted from the Heckman model), capital structure, log import
per employee and log export per employee. Since innovation output and export can be assumed to be
determined simultaneous, particularly in the case of the two categories of MNEs (F-EXP and D-EXP)
which are selling the major fraction of their production outside Sweden, we need an instrument (Z)
that has the property that changes in (Z) are associated with changes in export, but do not lead to
changes in innovation output (aside from the indirect route via export).
The cross-sectional nature of the data restricts our choice of appropriate instruments, but the test
statistics shows that log import value per employee and human capital fulfils the requirement on
independence of the instruments and the disturbance process. See table A in the Appendix. Moreover
they don’t have any direct impact on innovation sales when export and skill is included in the
innovation, and they are not correlated with the disturbance term. We now turn to the estimation
results.
5. Empirical results
This section presents the regression estimates from an augmented GMM model fitted to 1,249
foreign and domestically owned MNEs’ innovation and register data, in which the response variable is
the logarithm of innovation sales per employee. In addition to observations of R&D collaboration, the
data set contains an attribute of each observation’s firm characteristics that the theoretical and
empirical literature suggests will influence innovation output: R&D, human capital, physical capital,
financial capital, firm size, import, export and industry classification. To rule out the possibility that
results are driven by systematic differences across industries not captured by our controls, we include
a set of 10 industry dummies among the independent variables.
Our research question relates to correlation between innovation and external knowledge through
R&D collaboration ceteris paribus. R&D collaboration includes both regional innovation partners in
Sweden and innovation partners in other countries (labeled “foreign” partners). In particular, we ask if
the outcome of the relationship between internal innovation and external collaboration is influenced by
supply and demand driven motives derived from market orientation, corporate ownership structure
and the location of the collaborating partners, which are subunits within the firm, universities,
suppliers, customers, competitors and consultancies.
16
From the economic theory, we would expect that the propensity to be innovative is an increasing
function of firm size, human capital, gross investment and export, whereas firms who are highly
dependent on bank loans are less likely to be engaged in innovation activities compared to firms that
finance their R&D investments through retained profit or the stock markets. Given that the firms are
classified as innovative, our apriori assumption is that the influence on innovation output exerted by
R&D, skill, physical capital, the capacity to leverage (to increase the ratio of debt to debt plus equity)
is positive, while the importance of trade as an important channel of knowledge transfer is less studied
at the firm level. However, some recent findings suggest a positive correlation (Keller 2001, Lööf
2008).
In order to save space, we will organize the presentation in the following way. Tables 4 and 5
report results from sensitivity analysis. In Tables 6-8 the key estimates from our 58 equations are
shown in compressed shape; table 6 reports the results for collaboration arrangements between the
foreign and domestically owned MNEs in Sweden and one or several foreign innovation partners;
table 7 reports the impact of R&D collaboration between the MNEs in Sweden and a network that
includes at least one foreign partner and at least one regional partner in Sweden; table 8 finally,
shows the correlation between the MNEs innovation output and 1-3 regional innovation partners in
Sweden. On this basis, below we start with the presentation of the baseline results and sensitivity
analyses shown in Tables 5 and 6.
5.1 Comparison of models and baseline results
Table 5 reports the correlation between log innovation sales per employee and a collaboration
network that includes the local MNE in Sweden, one or several foreign units within the group and one
or several foreign scientific partner. The four key variables are foreign multinationals in Sweden
oriented towards markets outside Sweden (F-EXP), domestic multinationals in Sweden oriented
towards markets outside Sweden (D-EXP), foreign multinationals in Sweden selling mainly on the
Swedish market (F-SWE) and finally Swedish MNEs with mainly domestic customers (D-SWE). The
columns correspond to different specifications and different models.
On the basis of the taxonomy discussed in Section 3, we assume that the innovation process of the
export-oriented MNEs can be characterized as supply driven, while MNEs selling mainly on the local
markets in Sweden have a more demand driven innovation process. Hence, the estimated correlation
between R&D-collaboration and innovation output will indicate whether these arrangements foremost
foster knowledge on how to adopt to local consumers and markets or if the they mostly encourage
scientific knowledge on basic principles and innovative R&D for global markets.

17
Consider first column (1) and our preferred model which is the augmented GMM controlling for
both selectivity and simultaneity bias. The upper part of the column reports the parameter estimates of
the correlation between innovation sales and four key variables of interest as well as 18 control
variables including ten industry dummies and a predicted Mills ratio. In the middle section of column
(1), the parameter estimates of the selection part of the Heckman equation are provided. The bottom
part reports the test statistic for the GMM equation. The instrumented variable is log export per
employee and we use log import per employee and human capital (the fraction of employment with a
university degree) as instruments. Column (2) reports the GMM estimates without Mills ratio. Column
(3) provides results from the Heckman two-step model. For comparison purposes, we also show the
OLS estimates of the correlations.
Turning to the regressions results, we begin by estimation equation (1) using the augmented GMM
model. The benefit of using this made is that we can control for both selectivity bias and simultaneity
bias. We first consider the controls. The estimated effect of the control variables is mainly what can be
expected from the literature. In the row 5 is the coefficient corresponding to levels of R&D-
expenditures. The coefficients are positive, statistically highly significant, similar in size across the
four models and consistent with the literature as reported by Lööf and Heshmati (2006), indicating that
firms that decides to invest more in research and development experience greater innovation output.
In row 5 is the coefficient for international knowledge spillover through export. The results revel
that a larger export intensity is associated with a greater innovation output. Resent literature using
micro data has found that export exerts a positive influence on productivity (Jensen et al 2007,
Andersson et al 2007). Our results suggest that the productivity effect of global knowledge spillover
goes through the innovation process. The positive effect of physical capital (row 6) is consistent with
the literature. Our proxy for human capital is wage per employee, since this skill indicator is less
correlated with R&D than university educated people. The coefficient estimates in row 7 are sizeable
but only marginally significant in the two models that control for selectivity (augmented GMM and
heckman). In line with the literature, innovation intensity is a decreasing function of firm size (row8),
however the estimate is significant only in the two models that account for selectivity bias.
The point estimate for leverage is positive, highly significant and the order of magnitude is
sizeable, suggesting the importance of access to external funding for innovative firms. Our final
control the inverse Mills ratio, IMR, is significant and quite sizeable, indicating the importance of
correcting for selection bias. In doing so, we have estimated the IMR from a Heckman two-step
equation in two of the models (Augmented GMM and the Heckman model) and the middle section of

18
the Table 5 reports the coefficient estimates from the selection equation. The propensity to be engaged
in innovative activities is an increasing function of firm size, human capital, export as a fraction of
sales and gross investment. Leverage, which is significant determinant of the size of innovation
output is not associated with the firms choice to innovate or not.
The bottom part of columns 1 and 2 looks at the test statistics. The result displays that the
Andersson and Gragg-Donald statistics signal no problem of identification and that the Hansen J
statistic signals no problem of overidentification. The tests for heteroskedasticity signal no serious
problem in the estimated equation’s disturbance process below the 5% level. Moreover, the Hausman
test for endogeneity rejects exogeneity of the covariance matrix for the export variable.
Since the results from the covariates in the preferred GMM-model the test statistics and the first
step of the heckman equation displayed in column 1 are consistent with the results for all 58 equations,
these results will not be presented in Tables 6-8 in order to reduce space.
Now consider the coefficients on R&D collaboration shown in rows 1-4. An interesting and robust
pattern emerges in these coefficients: the relationship between the assumed supply driven innovation
processes among exporters and foreign collaboration within the firm and with one or several foreign
scientific partners is non-significant. See column 1 and 2. On the contrary, rows 3-4 report significant
or highly significant results suggesting that R&D collaboration is positively associated with demand
driven innovation processes where the technological activities are adaptive and/or the motives of the
father company is technology seeking and/or where the required knowledge is entrepreneurial about
products, customer preferences, market conditions, business concepts etc. To confirm our hypothesis
on the positive association between demand driven innovation and incorporation of external
knowledge in the innovation process, we will estimate 58 different collaboration arrangements. In each
of these equations we compare the impact of R&D-collaboration on innovation output with respect to
corporate ownership structure and market orientation.
Comparing the two GMM models, it is shown that the size of the significant estimates for R&D
collaboration is somewhat bigger when we account for selectivity bias, while the results for the
augmented GMM-model and the heckman model are very similar. The interpretation here is that
selectivity bias is a larger problem than simultaneity bias.

19
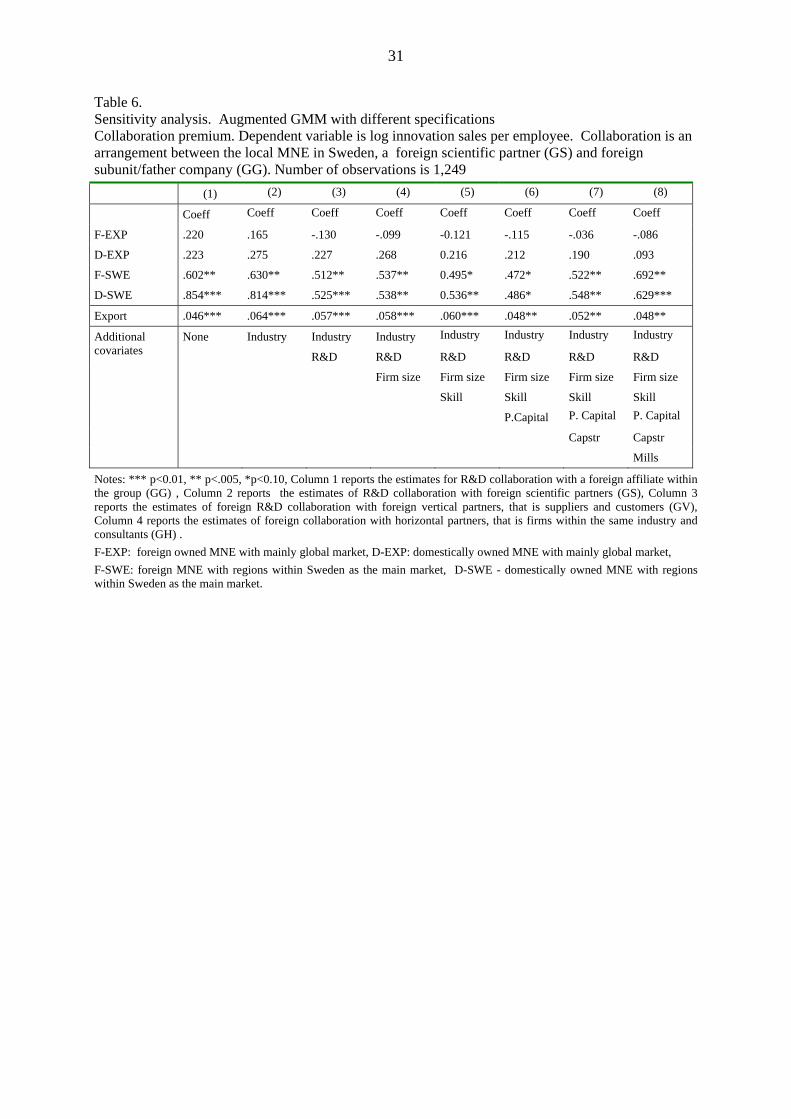
5.2 Robustness
Before estimating equation (1) using the preferred augmented GMM estimator and investigating
the outcome of 58 different collaboration alternatives, we check the robustness of the model by
comparing various specifications. The results are shown in Table 6. The columns correspond to
different specifications. Column (1) starts with only one covariate and Column (8) concludes with
seven covariates and 10 industry dummies. This specification coincides with the baseline result
presented in the first column of Table 5.
We focus on the coefficients on four different MNEs each one multiplied with an indicator
variable for a collaboration arrangement including one or several foreign affiliates and one or several
foreign scientific partners.
For the export-oriented MNEs all point estimates are non-significant irrespective of specification.
Considering non-exporting firms and controlling only for export, the point estimates is 0.60 for
foreign-owned MNEs and 0.85 for domestic firms. Including industry dummies, R&D and size, the
estimates reduces somewhat but they are still significant. When we control also for skill and physical
capital, the estimated impact of collaboration is only marginally significant. Including capital structure
and Mills increases the degrees of significance and the order of magnitude of the estimates as well.
The concluding finding is that our baseline results are somewhat sensitive to the manner of
specification. However, the main message from the regression analysis are not an artifact of the
specification but fairly robust across different specifications.
5.3 Premium on R&D collaboration
This section presents the estimated effect on innovation from various collaboration arrangements
within and across the Swedish border. We first consider foreign collaborators. Several indicators
suggest that globalization of innovation is an increasing phenomena. For instance, the share of R&D in
foreign affiliates of Swedish owned MNEs rose between 1995 and 2001 from 35% to 48 % of the total
R&D by Swedish MNEs. During the same period the fraction of R&D investment in Sweden
conducted by foreign-owned MNEs increased from 20% to 40%.
Based on our preferred augmented GMM estimator and the baseline specification the estimated
correlation between foreign collaborators and local MNEs in Sweden are reported in Table 7. Two
regularities stand out: (1) MNEs producing in Sweden and selling to a foreign market do not benefit
from foreign R&D collaboration. (2) Average innovation sales by foreign-owned firms oriented

20
towards local markets in Sweden are benefiting significantly from a network of foreign R&D
collaborators. We consider 11 such networks and 10 of these have a positive and significant impact on
innovation sales. Moreover, in 4 out 11 cases foreign network contributes to innovation output also
among Swedish MNEs selling on the home market.
Now consider R&D network including both foreign and Swedish partners. Table 8 reports the
results from 30 equations estimating the importance of R&D collaboration with at least one national
partner and at least one foreign partner. A similar pattern emerges in these coefficients: Spillovers to
the exporters do not show up the innovation output performance. In 70% of the investigated
collaboration arrangements a significant impact on innovation can be found among foreign MNEs
operating on local and regional markets in Sweden. The corresponding figure for Swedish MNE
selling mainly on the Swedish market is 20%.
Table 9 displays the results for 14 alternative collaboration arrangements with Swedish partners.
Only two cases show a positive impact. It is foreign-owned MNEs selling mainly on the Swedish
market and collaborating with a network consisting of vertical and horizontal partners and scientific,
vertical and horizontal partners respectively. However, both estimates are only weakly significant.
Overall, our results suggest that knowledge spillovers via R&D collaboration typically take place
as a network phenomena rather than a process between the local MNE and a single innovation partner.
Participation of foreign innovation partners such subunits within the group, suppliers, universities,
consultants and clients are crucial in the networks. In contrast to earlier work, we point out a
significant difference between innovative firms oriented towards the global market and firms focusing
on local markets in the home- or host country regarding premium on R&D collaboration. Foremost
knowledge spillovers encourage innovative foreign-owned firms oriented towards local and regional
markets in the host country.
6. Conclusions
Nearly to two third of the innovative firms examined in this paper participate in external R&D
collaboration within the group and with scientific, vertical and horizontal partners. Starting with a
sample of 1,249 multinational in Sweden, we estimate how spillovers to 611 innovative MNEs in via
R&D collaboration contribute to innovation output. Knowledge transfer provides a potential to
increase the revenues from firm’s investment in research and development through access to
technological assets of other firms. The aim of the paper is to better understand some empirical results
that have been shown in recent research on knowledge spillover and innovation. Although it is has

21
been suggested that multinational enterprises are in a special position to handle knowledge transfer,
resent research in this area has identified difficulties in transferring knowledge across collaboration
arrangements consisting of subunits and other innovation partners.
In this paper we distinguish between R&D-collaboration driven by demand and supply motives
respectively. We assume MNEs oriented towards the local market mainly ask for entrepreneurial
knowledge on products, consumers, markets, concepts and other demand driven knowledge in their
R&D collaboration. In contrast, firms that are selling on the global market are supposed to be
dominated by request of scientific knowledge in their R&D collaboration. In order to test this
hypothesis we separate the firms between a group of firms that on average sell 75% of their
production outside Sweden and a group that exports only slightly more than 10% of their production.
Within both groups we distinguish between foreign-owned and domestically firms.
Applying an augmented GMM-estimator that accounts for both selectivity and simultaneity bias
and considering 58 different network arrangements, our research has resulted in five distinct
conclusions. First, we find that knowledge spillovers via R&D collaboration typically take place as a
network phenomenon rather than a process between the local firm and a single innovation partner.
Second, successful collaboration is conditional on foreign innovation partners in the network. Third,
R&D collaboration is not found to have any significant effect on innovation by export-oriented MNEs.
Fourth, innovation sales is an increasing function of R&D-collaboration among non-export oriented
firms. Fifth, foreign MNEs selling mainly to local and regional markets in Sweden benefit more from
R&D collaboration than other firms.
According to the taxonomy on which we based our hypotheses, the results show that demand
driven motives that require entrepreneurial knowledge on how to adapt products to local consumers
and markets are more important for successful R&D-collaboration than supply driven motives and
requested scientific knowledge.
A possible factor that could explain why we estimate larger spillover effects on innovation output
among foreign firms penetrating the Swedish market compare to other MNEs in Sweden is the
incomplete data. The theoretical and empirical literature on MNEs has convincingly shown that the
bulk of innovation activities of international firms remain concentrated in their home location. An
important reason for the reluctance to globalize R&D in the same extent as manufacturing, sales and
marketing is that these companies are embedded in various systems of innovation in their home
countries. Many MNEs tend to utilize R&D laboratories and R&D-networks with scientific, vertical
and horizontal partners in the home country for development of knowledge that are exploited by

22
affiliates abroad. Our data allows only to examine this type of spillover among foreign MNEs in
Sweden while we don’t observe the impact of knowledge transfer from Sweden to foreign subunits.

23
References
Almeida, P (1996). Knowledge sourcing by foreign multinationals: Patent citation analysis on the
semiconductor industry. Strategic Management Journal, 17, 155-65.
Andersson, M, Johansson, S and Lööf, H. (2007). Firm Productivity and International Trade -
evidence from a small open economy. CESIS Working Paper Series in Economics and
Institutions of Innovation .
Archibugi, D. and Iammarino, S. (2002). The globalization of technological innovation: definition and
evidence. Review of International Political Economy, 9, (1) 98-122.
Birkinshaw, J. and Hood, N. (1998). Multinational subsidiary evolution: Capability and charter change
in foreign-owned subsidiary companies. Academy of Management Review, 23 (4), 773-95.
Bottazzi, L and Peri, G (2003) Innovation and spillovers in regions: Evidence from European patent
data. European Economic Review, 47, 687-710.
Carcovic, M and Levine, R (2002), Does foreign direct investment accelerate economic growth?.
University if Minnesota, Department of finance Working Paper. June.
Coe, D. T and Helpman, E. (1995). International R&D spillovers. European Economic Review, 39 (5),
859-87.
Crépon, B., Duguet, E. and Mairesse, J. (1998). Research, innovation, and productivity: an
econometric analysis at the firm level. Economics of Innovation and New Technology, 7 (2), 115-
58.
Dunning, J. M. And Narula, R. (1995). The R&D activities of foreign firms in the United States.
International Studies of Management & Organization, 25, 1-2, 39-73.
Eaton, J and Kortum, S. (1999). International technology diffusion: Theory and measurement
International Economic Review, 40 (3), 537-70.
Ebersberger, B. and Lööf, H. (2005). Multinational Enterprises, Spillover, Innovation and
Productivity. International Journal of Management Research. Dec 05.
Fischer, M.M. and Fröhlich, J. (ed.) (2001), Knowledge, Complexity and Innovation Systems.
Springer-Verlag, Berlin-Heidelberg-New York.
Gassman, O. and von Zedtwitz, M. (1999). New concepts and trends in international R&D
organization. Research Policy, 28 (3), 231-250.
Gupta, A. K and Govindarajan, V. (1994). Organizing for knowledge flows within MNCs.
International Business Review, 3 (4), 443-57.
Hall, B. H. (2005) The Financing of Innovation. In Shane, S. (ed.), Blackwell Handbook of
Technology and Innovation Management, Oxford: Blackwell Publishers, Ltd.
Halpern, L, Koren, M. and Szeidl, A. (2006). Imports and productivity,
http://ideas.repec.org/p/red/sed006/796.html

24
Heckman, J. (1976). The common structure of statistical models of truncation, sample selection and
limited dependent variables and a simple estimator for such models. Annals of Econometrics and
Social Measurement, 5, 475-92.
Jaffe, A., Trajtenberg, M. and Hendersson, R. (1993). Geographical localization of knowledge
spillovers as evidence by patent citations. Quarterly Journal of Economics, 108, 577-99.
Johansson, B and Lööf, H (2007). Innovation Activities Explained by Firm Attributes and Location.
Economics of Innovation and New Technology, 16 (8). Forthcoming.
Karlsson, C. and Johansson, B. (2004) Towards a Dynamic Theory for the Spatial Knowledge
Economy. CESIS Electronic Working Paper Series, No 20, Royal Institute of Technology.
Keller, W. (2001). Trade and Transmission of Technology. NBER no 8150.
Keller, W. and Yeaple, S.R. (2003). Multinational Enterprises, International Trade and Productivity
Growth: Firm Level Evidence from the United States. National Bureau of Economic Research
Working Paper No 9504.
Klette, T.J, Moen, J and Griliches, Z. (2000). Do Subsidies to Commercial R&D Reduce market
Failires? Microeconometric Evaluation Studies. Research Policy 29, 471-496.
Kogut, B. and Kulantilaka, N. (1994). Operating Flexibility, Global Manufacturing, and the Option
Value of a Multinational Network. Management Science, 40 (1), 123-39.
Kuemmerle, W. (1997). Foreign direct investment in industrial research in the pharmaceutical and
electronics industries – results from a survey of multinational firms. Research Policy, 28 (2-3),
179-93.
La Bas, C and Sierra, C. (2002). Location versus home country advantages in R&D activities: some
further results on multinationals´location strategies. Research Policy, 31 (4), 589-609.
van Leeuven, G. and Klump, L. (2006). On the contribution of innovation to multi-factor productivity
growth. Economics of Innovation and New Technology, 15 (4-5), 367-90.
Lewbel, A (2004). Simple estimators for hard problems: Endogeneity in Discret Choice Related
Models. Boston College Working Papers in Economics No 604.
Lööf, H. and A. Heshmati (2006). On the Relationship Between Innovation and Performance: A
Sensitivity Analysis. Economics of Innovation and New Technology, 15 (4-5), 317-45.
Lööf, H. (2008). Technological Diffusion and Innovation: The importance of domestic and foreign
sources. In Cees van Beers, Alfred Kleinknects, Roland Ortt & Robert Verburg (eds.) Innovation
Systems and Firm performance. (Forthcoming)
Narula, R and Zanfei, A (2005). Globalization and Innovation: The Role of Multinational Enterprises.
In J Fagerberg, D. C Mowery and R. R Nelson (Eds) The Oxford Handbook of Innovation.
Oxford University Press.

25
Newey, W (1984). A method of momemts interpretation of sequential estimators. Economics Letters,
14, 201-206.
Nobel, R. and Birkinshaw, J. (1998) Innovation in multinational cooperations: Control and
communication patterns in international R&D operations. Strategic Management Journal, 19, (5),
479-96.
Nohria, N and Ghoshal, S. (1997). The Differentiated Network. Jossey-Bass, San Francisco.
O’Donell, S. (2000). Managing Foreign Subsidiary – Agents of Headquarters or an Interdependent
Network? Strategic Management Journal, 21, 525-48.
Olley, G. S. and Pakes, A. (1996). The Dynamics of Productivity in Telecommunications Equipment
Indistry. Econometrica, 64, 1263-97.
Persson, M. (2006). Unpacking the Flow, Knowledge Transfer in the MNCs. PhD-dissertation,
Uppsala University.
Sonn, J.W. and Stolper, M. (2003). The Increasing Importance of Geographical Proximity in
Technological Innovation, An Analysis of U.S. Patent Citations, 1975-1997. Paper presented at
the conference: What do we know about Innovation? In Honour of Keith Pavitt, Sussex 13-15
November, 2003.
UNCTAD (2005). World Investment Report: Transnational Corporations and the Internationalization
of R&D, New York and Geneva.
Vernon, R (1966), International investment in international trade in the product cycle. The Quarterly
Journal of Economics, 80(2), 190-207.
Verspagen, B., Schoenmakers, W. (2004). The spatial dimension of patenting by multinational firms
in Europe. Journal of Economic Geography 4, 23-42.
Veugelers, R. and Cassiman, B. (2004). Foreign Subsidiaries as a Channel of International Technology
Diffusion, Some Direct Firm Level Evidence from Belgium. European Economic Review, 48 (2),
455-76.
White, R.E. and Poynter, T.A. (1990). Organization for World-wide advantage. In Barlett, C., Doz, A
and Hedlund, G (eds) Managing the Global Firm. Routledge, London.

26
Table 1: Summary statistics Total Innovative Observed multinational enterprises in Sweden 1, 249 49 % Panel A: Trade Firms that export more than 50 % of its production 335 67 % Firms that export 50 % or less of its production 914 42 % Panel B: Corporate ownership structure Foreign owned firms selling mainly on export markets, F-EXP 180 61 % Domestically owned firms selling mainly on export markets, D-EXP 155 74 % Foreign owned firms selling mainly on Swedish markets, F-SWE 431 39 % Domestically owned firms selling mainly on Swedish markets, D-SWE 481 46 % Panel C: Industry classes Manufacture of food products, beverages and tobacco; Textile and textile products; Leather and leather products; Manufacturing N.E.C, %
170 43 %
Manufacture of pulp, paper and paper products: Publishing and printing, % 98 36 % Manufacture of coke, refined petroleum products and man made fibres; Rubber and plastic products, %
115 65 %
Manufacture of other non-metallic mineral products; Basic metals and fabricated products, %
119 51 %
Manufacture of machinery and equipment, % 104 67 % Manufacture of electrical and optical equipment, % 117 59 % Manufacture of transport equipment, % 81 58 % Wholesale and retail, % 117 40 % Transport, storage and communication, % 122 27 % Business activities, % 206 49 %

27
Table 2: Summary statistics, key variables, total sample 1,249 observations, and innovative firms 611 observations Mean SD Min Max
All firms
Selection variable; Innovative firms= R&D>0 and Innovation sales >0 0.49 0.50 0 1
Log size (employment), all 4.47 1.50 2.30 10.57
Capital structure (debt/ debt+equity) 0.68 0.22 0.1 1
Human capital (university education>=3 years/employment) 0.17 0.19 0 1
Export as a fraction of sales 0.20 0.34 0 1
Log gross investment per employee 11.18 2.06 0.69 17.50
Innovative firms
Log size (employment) 4.78 1.51 2.30 9.87
Log R&D per employee 10.59 1.79 3.55 14.89
Log investment in machinery and investment per employee 9.67 2.57 0.69 14.09 Log innovation sales per employee 12.44 1.34 5.99 16.50
Human capital 0.19 0.20 0 0.88 Lag wage per employee 5.79 0.26 5.00 7.09 Trade
Log export per employee 17.41 6.09 0 23.28
Log import per employee 17.13 5.39 0.01 23.54 Corporate ownership structure Foreign owned firms selling mainly on export markets, F-EXP 0.18 0.38 0 1 Domestically owned firms selling mainly on export markets, D-EXP 0.19 0.38 0 1 Foreign owned firms selling mainly on Swedish markets, F-SWE 0.27 0.44 0 1 Domestically owned firms selling mainly on Swedish markets, D-SWE 0.36 0.48 0 1 Collaboration on innovation Global Scientific, GS 0.16 0,36 0 1 Sweden Scientific, SwS 0.39 0.44 0 1 Global Group, GG 0.36 0.47 0 1
Sweden Group, SwG 0.23 0.41 0 1
Global Vertical, GV 0.41 0.49 0 1
Sweden vertical, SwV 0.49 0.50 0 1
Global Horizontal, GH 0.23 0.42 0 1
Sweden Horizontal, SwH 0.38 0.48 0 1

28
Table 3: Summary statistics for innovative firms after market focus and ownership (mean values)
Mainly Global markets Export fraction > 50%
Mainly Swedish markets Export fraction <= 50%
F-EXP D-EXP F-SWE D-SWE
Observations 110 114 167 220
Trade
Export/Sales 0.74 0.75 0.12 0.13
Log export value per employee 21.21 21.07 15.60 14.97
Import/Sales 0.25 0.19 0.20 0.10
Log import value per employee 19.75 19.15 17.22 14.70
Knowledge intensity in exports approximated by log (export value/export weight)/emp
7.13 6.45 6.20 5.69
Other firm characteristics
Log sales/emp 14.62 14.49 14.51 14.20
Log valued added/emp 13.36 13.24 13.23 13.17
Log Innovation sales/emp 12.73 12.63 12.42 12.21
Log R&D/emp 10.89 11.08 10.12 10.55
Employment 506 511 469 396
Human capital 0.15 0.18 0.19 0.23
Skill, log wage sum per employee 5.76 5.81 5.82 5.79
Log machinery and equip invest per emp. 10.23 9.98 9.62 9.16
Capital structure 0.63 0.63 0.68 0.69
Log gross investment per employee 11.92 11.79 11.39 10.97
Collaboration on innovation
Global Scientific, GS 0.17 0.18 0.15 0.14
Sweden Scientific, SwS 0.14 0.25 0.16 0.30
Global Group, GG 0.53 0.32 0.44 0.23
Sweden Group, SwG 0.45 0.46 0.33 0.37
Global Vertical, GV 0.48 0.46 0.35 0.40
Sweden vertical, SwV 0.53 0.51 0.43 0.51
Global Horizontal, GH 0.30 0.25 0.19 0.20
Sweden Horizontal, SwH 0.40 0.50 0.30 0.36
Notes: Table 3 reports mean values of key variables for four different categories of multinational firms, classified after ownership and main market.

29
Table 4 Correlation analysis: Innovative firms Panel A: Innovative MNEs in Sweden focusing on the global market, n = 224
1. 2. 3. 4. 5. 6. 7. 8. 9. 10. 11. 12. .13
1. Inn sales .00
2. R&D .25 .00
3. Hcap .23 .55 .00
4. Skill .19 .42 .58 .00
5. Export .43 .19 .09 .24 .00
6. GS -.04 .20 .20 .16 .10 .00
7. SwS -.00 .15 .14 .18 .11 .46 .00
8. GG .11 .14 .04 .05 .18 .22 .31 .00
9. SwG .01 .04 -.03 .13 .20 .21 .27 .22 .00
10. GV -.04 .16 .15 .10 .03 .40 .51 .52 .18 .00
11. SwG -.04 .04 .03 .07 .02 .33 .52 .42 .32 .57 .00
12. GH -.04 .15 .11 .12 .07 .46 .46 .40 .12 .53 .40 .00
13. SwH .03 .20 .20 .20 .03 .35 .52 .43 .27 .47 .61 .46 .00
Panel B: Innovative MNEs in Sweden focusing on the Swedish market, n = 387
1. 2. 3. 4. 5. 6. 7. 8. 9. 10. 11. 12. .13
1. Inn sales .00
2. R&D .22 .00
3. Hcap .04 .33 .00
4. Skill .16 .21 .58 .00
5. Export .10 -.00 -.37 -.22 .00
6. GS .19 .26 .19 .20 .07 .00
7. SwS .02 .19 ..06 .08 .10 .40 .00
8. GG .11 .16 .10 .19 .08 .39 .44 .00
9. SwG -.04 .08 .00 .04 -.03 .23 .42 .32 .00
10. GV .14 .23 .15 .16 .13 .47 .53 .53 .37 .00
11. SwG .08 .20 .05 .07 .14 .31 .62 .55 .44 .59 .00
12. GH .11 .26 .18 .15 .10 .63 .49 .31 .28 .53 .40 .00
13. SwH .06 .14 -.00 .05 .12 .32 .60 .36 .35 .52 .59 .48 .00
Notes: Table 4 reports correlation analysis for innovative multinationals. Panel A shows the correlation for firms focusing on the global market, that is, firms that are selling more than 50 % of their production on the export markets. Panel A shows the corresponding variables for firms selling 50 % or more of their production on local and regional markets in Sweden

30
Table 5: Sensitivity analysis. Comparison of four different models Collaboration premiums. Dependent variable is log innovation sales per employee. Collaboration is an arrangement that includes the local MNE in Sweden, a foreign affiliate and a foreign scientific partner. Augmented GMM
controlling for selectivity and endogeneity
Ordinary GMM, controlling for endogeneity
Heckman, controlling for
selectivity
OLS, not controlling for selectivity or
endogeneity
Observations 1,249 1,249 1,249 611
Collaboration partners GS + GE GS + GE GS + GE GS + GE MNE and market focus Coeff Std Err Coeff Std Err Coeff Std Err Coeff Std Err
F-EXP -.086 .482 -.036 .479 -.095 .333 -.030 .328
D-EXP .093 .372 .190 .380 .080 .382 .182 .376
F-SWE .629** .269 .522** .261 .617** .248 .514** .252
D-SWE .629*** .239 .548** .242 .629** .291 .529* .297
Controls
Log R&D/ emp .143*** .033 .161*** .033 .145*** .030 .164*** .030
Log exp/emp .048** .020 .052** .020 .027*** .010 .022* .012
Log invest in machinery and equiment /emp
.059*** .022 .064*** .022 .064*** .020 .071*** .020
Skill 1 .466* .266 .641** .256 .407* .222 .586*** .217
Log firms size -.100** .039 -.053 .036 -.095** .043 -.038 .037
Capital structure 1.152*** .236 .1.000*** .242 1.144*** .246 .950*** .224
IMR -.686** .295 - - (-.875***) (.006)
10 Industry dummies Included Included Included Included
Prob to be innovative
Log firms size .093*** .025 .093*** .025
Human capital 1.019*** .198 1.019*** .198
Capital structure -.259 .170 -.259 .170
Export/Sales .751*** .114 .751*** .114
Log Gross invest/emp .050*** .019 .050*** .019
Test statistics Coeff P-value Coeff P-value
Anderson corr LR stat 256.7*** .000 258.5*** .000
Gragg-Donald stat 153.8*** .000 155.3*** .000
Hansen J stat .212 .644 2.35 .124
Pagan-Hall, general 26.63 .363 21.65 .359
Pagan-Hall, normality 35.81* .092 27.76 .115
White/Koeneker 23.26 .330 27.39 .319
Breuch-Pagan 32.90** .047 33.52* .061
Notes: *** p<0.01, ** p<.005, *p<0.10, Definition: F-EXP - foreign owned MNE with mainly global market. D-EXP - domestically owned MNE with mainly global market. F_SWE- foreign MNE with regions within Sweden as the main market. D-SWE - domestically owned MNE with regions within Sweden as the main market. Interpretation of test statistics; Anderson corr LR stat: The null hypothesis that the model is underidentified. Gragg-Donald stat: The Null hypothesis is weak identification. Hansen J-stat: Null hypothesis is not overidentified. Pagan-Hall, general, Pagan-Hall, normality, White/Koeneker, Breuch-Pagan: The null hypothesis is that the disturbances are homoskedastic. .
31
Table 6. Sensitivity analysis. Augmented GMM with different specifications Collaboration premium. Dependent variable is log innovation sales per employee. Collaboration is an arrangement between the local MNE in Sweden, a foreign scientific partner (GS) and foreign subunit/father company (GG). Number of observations is 1,249 (1) (2) (3) (4) (5) (6) (7) (8)
Coeff Coeff Coeff Coeff Coeff Coeff Coeff Coeff
F-EXP .220 .165 -.130 -.099 -0.121 -.115 -.036 -.086
D-EXP .223 .275 .227 .268 0.216 .212 .190 .093
F-SWE .602** .630** .512** .537** 0.495* .472* .522** .692**
D-SWE .854*** .814*** .525*** .538** 0.536** .486* .548** .629***
Export .046*** .064*** .057*** .058*** .060*** .048** .052** .048**
None Industry Industry Industry Industry Industry Industry Industry Additional covariates R&D R&D R&D R&D R&D R&D
Firm size Firm size Firm size Firm size Firm size
Skill Skill Skill Skill
P.Capital P. Capital P. Capital
Capstr Capstr
Mills
Notes: *** p<0.01, ** p<.005, *p<0.10, Column 1 reports the estimates for R&D collaboration with a foreign affiliate within the group (GG) , Column 2 reports the estimates of R&D collaboration with foreign scientific partners (GS), Column 3 reports the estimates of foreign R&D collaboration with foreign vertical partners, that is suppliers and customers (GV), Column 4 reports the estimates of foreign collaboration with horizontal partners, that is firms within the same industry and consultants (GH) . F-EXP: foreign owned MNE with mainly global market, D-EXP: domestically owned MNE with mainly global market, F-SWE: foreign MNE with regions within Sweden as the main market, D-SWE - domestically owned MNE with regions within Sweden as the main market.

32
Table 7. Regression results: Collaboration premium. Global R&D collaboration with one partner, two partners or three partners. Dependent variable: Log innovation sales per employee. Coefficient estimates and frequency (fraction of firms collaborating). Number of observations is 1,249 Panel A GS GG GV GH GG + GS GS + GV GS + GH
Coeff Freq Coeff Freq Coeff Freq Coeff Freq Coeff Freq Coeff Freq Coeff Freq
F-EXP -.079 .17 .210 .53 -.010 .30 -.134 .48 -.086 .14 -.040 .15 -.043 .15
D-EXP -.225 .18 .182 .17 -.252 .25 -.197 .46 .093 .10 -.244 .17 -.166 .11
F-SWE .607** .15 .200 .48 .249 .19 .437* .35 .629** .15 .541* .14 .749*** .13
D-SWE .241 .15 -.001 .30 .015 .20 -.091 .40 .629*** .08 .246 .13 .191 .10
Panel B GG + GV GG + GH GV + GH GS+GG+GV GS+GG+GH GS+GV+GH GG+GV+GH
Coeff Freq Coeff Freq Coeff Freq Coeff Freq Coeff Freq Coeff Freq Coeff Freq
F-EXP .171 .39 -.008 .25 -.056 .28 -.048 .13 -.061 .12 -.057 .23 .078 .23 D-EXP .217 .26 .364 .17 -.300 .22 .092 .10 .242 .08 -.239 .14 .312 .14 F-SWE .265 .32 .492** .18 .448* .17 .565** .14 .772*** .13 .686** .16 .479* .16 D-SWE .060 .18 .230 .08 .104 .18 .685*** .08 .696** .05 .175 .07 .461* .07
Notes: The table reports the parameter estimates of the correlation between innovation sales and 4 key variables of interest using the augmented GMM estimator. The table also reports the frequency of collaboration. In the regression 17 control variables are included. ***: p<0.01, **: p<.005, *: p<0.10, F-EXP - foreign owned MNE with mainly global market, D-EXP - domestically owned MNE with mainly global market, F-SWE - foreign MNE with regions within Sweden as the main market, D-SWE - domestically owned MNE with regions within Sweden as the main market. GS – scientific collaboration with a global partner, GG collaboration with foreign affiliates within the group, GV –vertical collaboration with a global partner, GH – horizontal collaboration with a global partner.

33
Table 8. Regression results: Arrangements for R&D collaboration including both foreign partner(s) and regional partner in Sweden. Dependent variable: Log innovation sales per employee. Number of observations is 1,249 Panel A GS+ SwS GS + SwV GS + SwH GG+ SwS GG+ SwV GG+ SwH
Coeff Freq Coeff Freq Coeff Freq Coeff Freq Coeff Freq Coeff Freq
F-EXP -.044 .16 -.001 .16 -.093 .14 .136 .32 .265 .38 .175 .33
D-EXP -.284 .18 -.138 .15 -.153 .16 .331 .22 .252 .26 235 .26
F-SWE .660** .12 .725*** .13 .754** .11 .311* .29 .250 .38 .341* .27
D-SWE .329 .12 .422* .12 .402 .09 -.139 .16 -.070 .20 -.077 .12 Panel B GV + SwS GV + SwV GV + SwH GH + SwS GH + SwV GlH + SwH
Coeff Freq Coeff Freq Coeff Freq Coeff Freq Coeff Freq Coeff Freq
F-EXP -.001 .33 .058 .39 .138 .27 -.062 .25 -.113 .26 -.127 0.22 D-EXP -.152 .36 -.034 .39 -.153 .39 -.157 .21 -.122 .20 -.155 0.24 F-SWE .176 .24 .268 .31 .322 .23 .374 .16 .472* .17 .449* 0.16 D-SWE -.099 .27 .012 .34 -.092 .25 -.186 .16 .213 .17 -.038 0.15
Panel C GS + GG+SwS GS +GG+SwV GS+GG+SwH GG+GV+SwS GG+GV+SwV GG+GV+GwH
Coeff Freq Coeff Freq Coeff Freq Coeff Freq Coeff Freq Coeff Freq
F-EXP -.049 .13 -.035 .13 -.184 .12 .131 .26 .241 .32 .222 .25
D-EXP .001 .09 .102 .10 .149 .09 .334 .19 .301 .24 .249 .22
F-SWE .676** .12 .727*** .13 .756** .11 .198 .23 .298* .30 .353* .23
D-SWE .751*** .07 .642** .07 .694** .05 .001 .13 .063 .17 -.090 .11 Panel D GG +GH+SwS GG +GH+SwV GG+GH+SwH GS + GV +SwS GS+ GV + SwV GS+GV+GwH
Coeff Freq Coeff Freq Coeff Freq Coeff Freq Coeff Freq Coeff Freq
F-EXP -.014 .21 -.012 .22 -.018 .20 -.047 .15 -.010 .15 -.056 .12
D-EXP .449 .13 .442 .14 .357 .16 -.318 .16 -.143 .15 -.214 .15
F-SWE .439* .16 .495** .17 .504* .16 .578* .11 .655** .12 .680** .11
D-SWE .173 .07 .465* .07 .422 .07 .316 .12 .398* .12 .394 .0 Panel E GS+GH+SwS GS+ GH+ SwV GS+GH+SwH GV+GH+SwS GV+GH+SwV GV+GH+GwH
Coeff Freq Coeff Freq Coeff Freq Coeff Freq Coeff Freq Coeff Freq
F-EXP -.056 .15 -.025 .15 -.037 .10 -.037 .23 -.045 .25 -.0341 .20
D-EXP -.247 .11 -.107 .10 -.255 .11 -.255 .18 -.142 .19 -.248 .21
F-SWE .662** .11 .719*** .13 .751** .11 .3332 .14 .404 .16 .409 .15
D-SWE .061 .10 .424 .10 .358 .09 .044 .15 .194 .16 .119 .15
Notes: The table reports the parameter estimates of the correlation between innovation sales and 4 key variables of interest using the augmented GMM estimator. The table also reports the frequency of collaboration. In the regression 17 control variables are included. ***: p<0.01, **: p<.005, *: p<0.10, F-EXP - foreign owned MNE with mainly global market, D-EXP - domestically owned MNE with mainly global market, F-SWE - foreign MNE with regions within Sweden as the main market, D-SWE - domestically owned MNE with regions within Sweden as the main market. GS – scientific collaboration with a global partner, GG collaboration with foreign affiliates within the group, GV –vertical collaboration with a global partner, GH – horizontal collaboration with a global partner, SwS – scientific collaboration with a Swedish partner, SwG collaboration with a Swedish affiliates within the group, SwV –vertical collaboration with a Swedish partner, SwH – horizontal collaboration with a Swedish partner
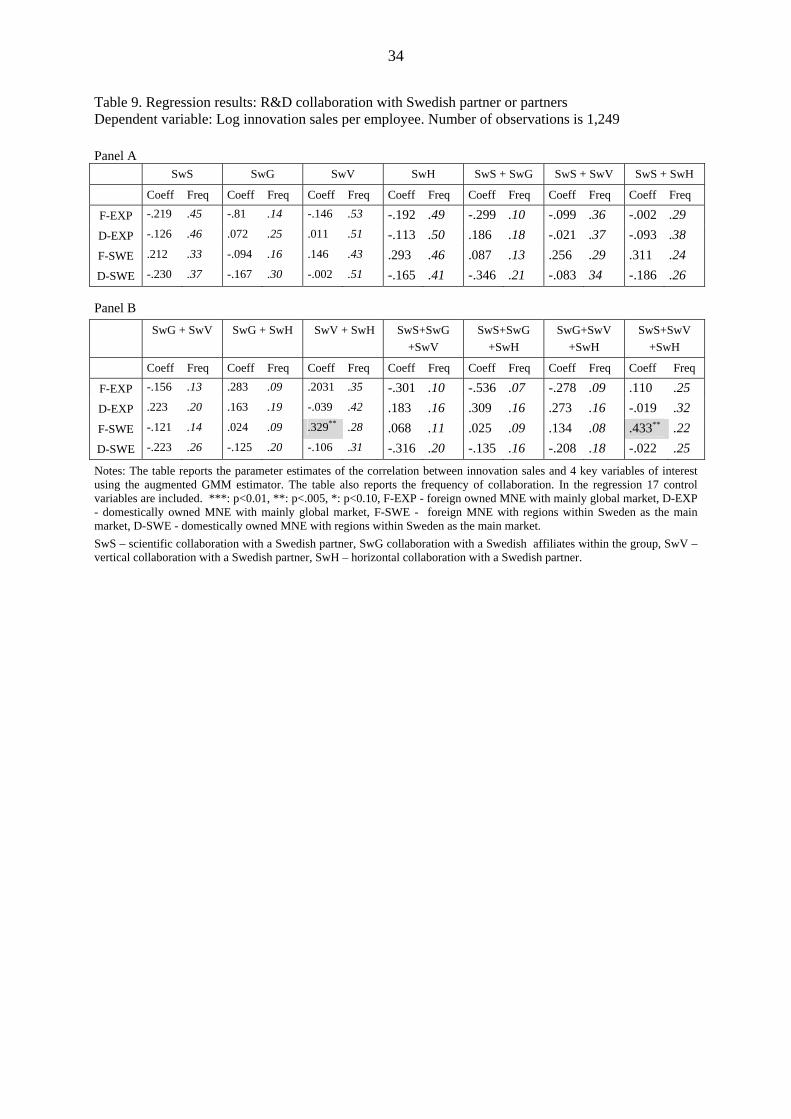
34
Table 9. Regression results: R&D collaboration with Swedish partner or partners Dependent variable: Log innovation sales per employee. Number of observations is 1,249 Panel A SwS SwG SwV SwH SwS + SwG SwS + SwV SwS + SwH
Coeff Freq Coeff Freq Coeff Freq Coeff Freq Coeff Freq Coeff Freq Coeff Freq
F-EXP -.219 .45 -.81 .14 -.146 .53 -.192 .49 -.299 .10 -.099 .36 -.002 .29 D-EXP -.126 .46 .072 .25 .011 .51 -.113 .50 .186 .18 -.021 .37 -.093 .38 F-SWE .212 .33 -.094 .16 .146 .43 .293 .46 .087 .13 .256 .29 .311 .24 D-SWE -.230 .37 -.167 .30 -.002 .51 -.165 .41 -.346 .21 -.083 34 -.186 .26
Panel B SwG + SwV SwG + SwH SwV + SwH SwS+SwG
+SwV SwS+SwG
+SwH SwG+SwV
+SwH SwS+SwV
+SwH
Coeff Freq Coeff Freq Coeff Freq Coeff Freq Coeff Freq Coeff Freq Coeff Freq
F-EXP -.156 .13 .283 .09 .2031 .35 -.301 .10 -.536 .07 -.278 .09 .110 .25 D-EXP .223 .20 .163 .19 -.039 .42 .183 .16 .309 .16 .273 .16 -.019 .32 F-SWE -.121 .14 .024 .09 .329** .28 .068 .11 .025 .09 .134 .08 .433** .22 D-SWE -.223 .26 -.125 .20 -.106 .31 -.316 .20 -.135 .16 -.208 .18 -.022 .25
Notes: The table reports the parameter estimates of the correlation between innovation sales and 4 key variables of interest using the augmented GMM estimator. The table also reports the frequency of collaboration. In the regression 17 control variables are included. ***: p<0.01, **: p<.005, *: p<0.10, F-EXP - foreign owned MNE with mainly global market, D-EXP - domestically owned MNE with mainly global market, F-SWE - foreign MNE with regions within Sweden as the main market, D-SWE - domestically owned MNE with regions within Sweden as the main market. SwS – scientific collaboration with a Swedish partner, SwG collaboration with a Swedish affiliates within the group, SwV –vertical collaboration with a Swedish partner, SwH – horizontal collaboration with a Swedish partner.

35
Appendix Table A. The correlation between the instrumented variable export, the two instruments import and human capital and the residual.
Export Import Human capital Residual Log export per employee 1.00 Log import per employee 0.69 1.00 Human capital -0.34. -0.29 1.00 Residual -0.06 0.01 0.01 1.00