electronic supporting information deciphering the ... · 1 electronic supporting information...
TRANSCRIPT

1
Electronic Supporting Information
Deciphering the influence of structural distortions on single
ion magnetic anisotropy of pentagonal bipyramidal Ni(II)
complexes
Mamon Dey, Prashurya Pritam Mudoi , Anup Choudhury, Bipul Sarma and Nayanmoni
Gogoi
Department of Chemical Sciences
Tezpur University, Napaam-784028, Sonitpur, Assam, INDIA
Email: [email protected]
Electronic Supplementary Material (ESI) for Chemical Communications.This journal is © The Royal Society of Chemistry 2019

2
Materials and Methods
Starting materials were procured from commercial sources and used as received.
Solvents were purified by conventional techniques and distilled prior to use. Elemental
analyses were performed on a Perkin Elmer Model PR 2400 Series II Elemental
Analyzer. Infrared spectra were recorded on a Nicolet Impact I-410 FT-IR spectrometer
as KBr diluted discs and a Perkin Elmer MIR-FIR FT-IR spectrometer. Thermo-
gravimetric analyses were performed on a Shimadzu TGA-50 thermal analyzer. The UV-
visible spectra were recorded in a Shimadzu UV 2550 spectrophotometer. Melting points
were recorded on a Buchi M-560 Melting Point apparatus and are reported uncorrected.
Magnetic susceptibility data were collected on microcrystalline samples over 300-2 K
temperature range with an applied field of 1000 Oe using a MPMS SQUID
magnetometer. Magnetization studies were performed between 0-5/7 T at 2-3.6 K, 5 K,
7 K and 10 K. Fitting of magnetization data was performed by PHI 3.1.5 software using
a two-step procedure. Initially, χMT vs T plots were fitted to evaluate the isotropic g
parameters. During the fitting of χMT vs T plots, D parameter was also introduced to fit
low temperature regime. Thereafter, simultaneous fitting of χMT vs T plots and M vs H
plots were carried out by using PHI programme to estimate the D and E parameters
reliably. The isotropic g values obtained from fitting of χMT vs T plots were kept fixed
during the simultaneous fitting of χMT vs T plots and M vs H plots.
2,6-diacetylpyridine bis(semicarbazone) i.e., L1, 2, 6-diacetylpyridine bis(benzoyl
hydrazone) i.e., L2 , [Ni(L1)(H2O)2](NO3)2 and [Ni(L2)(H2O)2](NO3)2 were prepared
according to the reported literature procedure.1-2
Single Crystal X-Ray Diffraction Studies
Suitable single crystals of all the compounds were obtained directly from the reaction
mixtures were used for diffraction measurements. The diffraction data for the compounds
were collected on a Bruker APEX-II CCD diffractometer using MoK radiation
(=0.71073 Å) using φ and ω scans of narrow (0.5◦) frames at 90-100K. All the structures
were solved by direct methods using SHELXL-97 as implemented in the WinGX
program system.3 Anisotropic refinement was executed on all non-hydrogen atoms. The
aliphatic and aromatic hydrogen atoms were placed on calculated positions but were
allowed to ride on their parent atoms during subsequent cycles of refinements. Positions
of N-H and O-H hydrogen atoms were located on a difference Fourier map and allowed

3
to ride on their parent atoms during subsequent cycles of refinements. Disordered lattice
water molecules and two nitrate counter anions present in structure of 1 are removed
using PLATON SQUEEZE program.4 The geometry around the Ni(II) center of
mononuclear compounds 1-3 was examined using continuous shape measures analysis
carried out with SHAPE program.5 The data obtained from the analysis for compounds
1-3 are listed in Table S4-S5. Crystallographic data (excluding structure factors) for the
structure in this paper have been deposited with the Cambridge Crystallographic Data
Centre, CCDC, 12 Union Road, Cambridge CB21EZ, UK. Copies of the data can be
obtained free of charge on quoting the depository number CCDC 1936566 (1), CCDC
1936571 (2) and CCDC 1425683 (3) (Fax: +44-1223-336-033; E-Mail:
[email protected], http://www.ccdc.cam.ac.uk).
Computational details
All calculations were performed with the ORCA 4.1.0 package using the experimental
geometries without any further structure optimization.6 Resolution of identity (RI)
approximation with the decontracted auxiliary def2-TZVP or def2-TZVP/C Coulomb
fitting basis set along with tight SCF convergence criteria were employed in all
calculations. The d8 configuration of NiII gives rise to ten S = 1 and fifteen S = 0
electronic multiplets. We computed nonrelativistic energy levels and wave functions
using the complete active space self-consistent field (CASSCF) method, averaging over
the electron densities of all considered states and taking an active space with eight
electrons distributed over the five 3d orbitals CAS(8,5).7 In order to incorporate dynamic
correlation, N-electron valence perturbation theory to second order (NEVPT2)
calculations were performed on configurational interaction matrices obtained from
CASSCF calculations.8 The zero field splitting parameters (D & E) were extracted from
effective Hamiltonian approach where all matrix elements of the anisotropic spin
Hamiltonian are calculated from the ab initio energies and wave functions.9 In order to
rationalize the magnitude and sign of zero field splitting parameters, the perturbative
method implemented in the ORCA code are also performed and the D values extracted
by this method are found to be slightly overestimated as compared to those obtained from
effective Hamiltonian method. One electron eigen values of the five d-orbitals in
compound 1-3 were obtained from ab-initio Ligand Field calculations.10

4
Synthesis of [Ni(L1)(imz)2](NO3)2.2H2O (1)
To a solution of [Ni(L1)(H2O)2](NO3)2 (0.1 mmol, 0.0513 g) in methanol (20 mL), a
solution of imidazole (0.35 mmol, 0.0238 g) in methanol (10 mL) was added. The
reaction mixture was refluxed with stirring for 2 hours. The reaction mixture was cooled
to room temperature, filtered and the filtrate was kept undisturbed for slow evaporation.
Green block shaped crystals were observed after 10 days. The mother liquor was
decanted and crystals were washed with minimum amount of ethanol and then dried with
diethyl ether. Yield: 0.046 g (73 % based on Ni); M. p. >250 ◦C; Elemental analysis:
Found C, 32.71%; H, 4.12%; N, 28.61%. C17H27N13O10Ni requires C, 32.28%; H, 4.31%;
N, 28.81%. IR (KBr, cm-1): 3191(br), 1675(s), 1621(m), 1537(s), 1384(s), 1352(w),
1196(s),1070(s), 943(w), 826(w), 801(m), 758(m), 662(m), 517(m).
Synthesis of [Ni(L1)(SCN)2].2H2O (2)
To a solution of [Ni(L1)(H2O)2](NO3)2 (0.2 mmol, 0.1026 g) in methanol (20mL), an
aqueous solution of KSCN (0.42 mmol, 0.0407 g) (5 mL) was added. The reaction
mixture was stirred for 2 hours. The reaction mixture was then filtered and the filtrate
was kept undisturbed for slow evaporation. Green block shaped crystals were observed
after 10 days. The mother liquor was decanted and crystals were washed with minimum
amount of ethanol and then dried with diethyl ether. Yield: 0.068 g (70 % based on Ni);
M. p. >250 ◦C; Elemental analysis: Found C, 31.92%; H, 3.99%; N, 25.87%.
C13H19N9O4S2Ni requires C, 31.98%; H, 3.93%; N, 25.84%. IR (KBr, cm-1): 3396(br),
2102(s), 2074(s), 1681(s), 1531(m), 1445(w), 1384(m), 1278(m), 1210(m),1094(s),
805(m), 756(m), 520(m), 462(w).
Synthesis of [Ni(L2)(SCN)2].3H2O (3)
To a solution of [Ni(L2)(H2O)2](NO3)2 (0.027 mmol, 0.0176 g) in methanol (20 mL), a
solution of KSCN (0.056 mmol, 0.0056 g) in H2O (10 mL) was added. The reaction
mixture was stirred at room temperature for 3 hours. The reaction mixture was filtered
and the filtrate was kept undisturbed for slow evaporation at room temperature. Green
block shaped crystals were observed after a week. The mother liquor was decanted and
crystals were washed with minimum amount of ethanol and then dried with diethyl ether.
Yield: 0.010 g (59 % based on Ni); M. p. >250 ◦C; Elemental analysis: Found C, 47.91%;
H, 4.21%; N, 15.23%. C25H27N7O5S2Ni requires C, 47.78%; H, 4.33%; N, 15.61%. IR
(KBr, cm-1): 3470(br), 2107(w), 2069(s), 1637(s), 1516(m), 1444(m), 1381(w), 1269(s),
1184(s),1129(w), 1012(m), 897(w), 801(m), 711(m), 554(m), 464(w).

5
References:
[1] T.J. Giordano, G. J. Palenik, R. C. Palenik and D. A. Sullivan, Inorg. Chem., 1979,
18, 2445.
[2] D. Wester and G. J. Palenik, J. Am. Chem. Soc., 1974, 96, 7565.
[3] G. M. Sheldrick, A short history of SHELX. Acta Cryst. Section A: Foundations of
Crystallography, 2008, 64, 112-122.
[4] A. L. Spek, Acta Crystallogr. Sect. C 2015, 71, 9.
[5] M. Llunell, D. Casanova, J. Cirera, J. M. Bofill, P. Alemany, S. Alvarez, M. Pinsky
and D. Avnir, SHAPE: Continuous shape measures of polygonal and polyhedral
molecular fragments; University of Barcelona: Barcelona, 2005.
[6] F. Neese, Wiley Interdiscip. Rev. Comput. Mol. Sci. 2012, 2, 73.
[7] CASSCF: B.O. Roes, P.R. Taylor and P.E.M. Siegbahn, Chem. Phys., 1983, 48, 157;
P.-Å. Malmqvist, B. O. Roos, Chem. Phys. Lett., 1989, 155, 189.
[8] NEVPT2: C. Angeli, R. Cimiraglia and J. -P. Malrieu, Chem. Phys.
Lett., 2001, 350, 297; C. Angeli, R. Cimiraglia, S. Evangelisti, T. Leininger and J. -
P. Malrieu, J. Chem. Phys., 2001, 114, 10252; C. Angeli, R. Cimiraglia and J. -P.
Malrieu, J. Chem. Phys., 2002, 117, 9138; C. Angeli, B. Bories, A. Cavallini and R.
Cimiraglia, J. Chem. Phys. 2006, 124, 054108.
[9] R. Maurice, N. Guihery, R. Bastardis and C. de Graaf, J. Chem. Theory Comput.,
2010, 6, 55.
[10] M. Atanasov, D. Ganyushin, K. Sivalingam and F. Neese, A modern first-principles
view on ligand field theory through the eyes of correlated multireference
wavefunctions, in: D.M.P. Mingos, P. Day and J.P. Dahl (Eds.), Molecular Electronic
Structures of Transition Metal Complexes II, Springer, Berlin, Heidelberg, 2012, pp.
149.
6
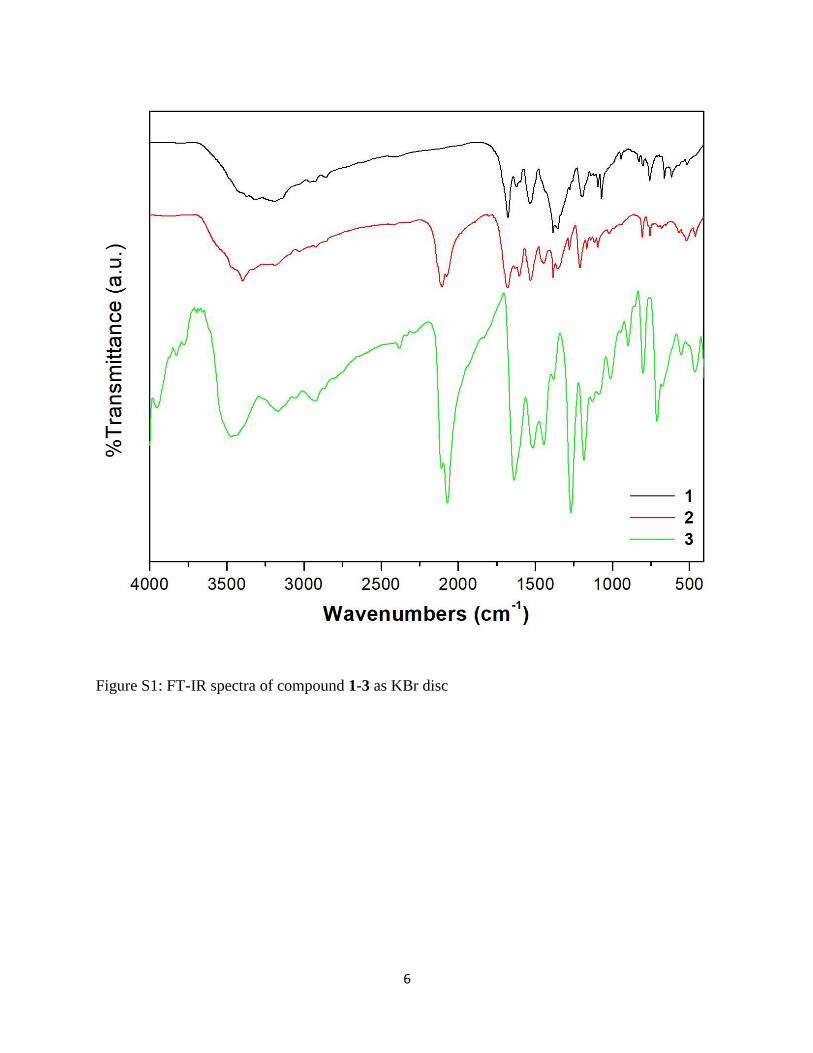
Figure S1: FT-IR spectra of compound 1-3 as KBr disc

7
Figure S2: UV-visible spectra of compound 1-3 in DMSO medium

8
Figure S3: TGA pattern of compound 1-3

9
Figure S4: Powder X-ray diffraction pattern of as synthesized compound 1 and simulated
diffraction pattern generated from single crystal x-ray diffraction data.

10
Figure S5: Powder X-ray diffraction pattern of as synthesized compound 2 and simulated
diffraction pattern generated from single crystal x-ray diffraction data.

11
Figure S6: Powder X-ray diffraction pattern of as synthesized compound 3 and simulated
diffraction pattern generated from single crystal x-ray diffraction data.

12
Figure S7: Hydrogen bonding network present in compound 2
Figure S8: Hydrogen bonding network present in compound 3

13
Figure S9: M vs HT-1 plot of 1 at different temperatures. Circles represent experimental data while
solid lines are best fits obtained by PHI.

14
Figure S10: M vs HT-1 plot of 2 at different temperatures. Circles represent experimental data
while solid lines are best fits obtained by PHI.

15
dz2
dx2
-y2
dxy
dxz
dyz
E
dz2
dxz
dyz
E
dz2
dxz
dyz
E
Ground Triplet State
1st Triplet Excited State
2nd TripletExcited State
dz2
dxz
dyz
E
3rd TripletExcited State
dx2
-y2
dxy
dx2
-y2
dxy
dx2
-y2
dxy
Figure S11: M vs HT-1 plot of 3 at different temperatures. Circles represent experimental data
while solid lines are best fits obtained by PHI.
Figure S12: Electronic arrangement in the ground triplet and 1st, 2nd and 3rd excited triplet states

16
Figure S13: One electron eigen values of d-orbitals in 1-3 obtained from AI-LFT calculations

17
Table S1. Crystal data and refinement parameters of compounds 1-3
Complex 1 2 3
Empirical formula C17H23N11O2Ni C13H15N9O4S2Ni C25H19N7O5S2Ni
Formula weight 472.17 484.15 620.28
Temperature/K 293 293 100
Crystal system Tetragonal Triclinic Orthorhombic
Space group I41/a P-1 P212121
a/Å 32.159 (12) 8.758 (4) 10.330 (52)
b/Å 32.159 (12) 11.248 (5) 11.455 (3)
c/Å 10.031 (4) 12.524 (6) 23.668 (6)
α/° 90 65.78 (6) 90
β/° 90 84.96 (7) 90
γ/° 90 71.81 (6) 90
Volume/Å3 10374.6 (9) 1067.8 (9) 2801.06 (12)
Z 16 2 4
ρcalc, mg m-3 1.209 1.506 1.471
μ/mm-1 0.780 1.142 0.890
Crystal size, mm3 0.30x0.24x0.20 0.24x0.23x0.21 0.32x0.27x0.22
Theta range for data collection 1.266 to 28.411° 2.450 to 28.776° 1.721 to 27.710°
F(000) 3936 496 1272
Reflections collected 37717 10441 13706
Independent reflections 6507 5086 6128
Completeness to theta 99.9% 96.3% 99.3%
Data/parameters/restraints 6507/6/314 5086/286/0 6128/363/0
Goodness-of-fit on F2 1.026 1.032 1.057
Final R indexes [I>=2σ (I)] R1= 0.0641, wR2=0.1894 R1= 0.0588, wR2=0.1625 R1= 0.0489, wR2=0.1201
Final R indexes [all data] R1= 0.1076 wR2=0.2088 R1= 0.0861, wR2=0.1808 R1= 0.0604, wR2=0.1364
Largest diff. peak and hole 0.296 and -0.366 e.Å-3 0.604 and -0.541 e.Å-3 0.296 and -0.366 e.Å-3

18
Table S2: Selected bond lengths (Å) and bond angles (◦) of compounds 1-3
Bonds lengths 1 2 3
Ni(1)-N(1) 2.076(3) 2.021 (8) 2.013(4)
Ni(1)-N(2) 2.142(2) 2.192 (7) 2.081(5)
Ni(1)-N(4) 2.228(3) 2.122 (9) 2.158(5)
Ni(1)-O(1) 2.290(2) 2.692 (8) 2.314(4)
Ni(1)-O(2) 2.495 2.393 (1) 2.685
Ni(1)-Naxial-1 2.066(3) 1.999 (9) 2.027(5)
Ni(1)-Naxial-2 2.051(3) 2.003 (7) 2.006(5)
Bond Angles
O(1)-Ni(1)-N(2) 71.24 (1) 65.15 (1) 72.38(2)
N(2)-Ni(1)-N(1) 74.28 (1) 74.67 (1) 76.30(2)
N(1)-Ni(1)-N(4) 73.13 (1) 75.46 (2) 75.38(2)
N(4)-Ni(1)-O(2) 66.99 70.49 (2) 65.07
O(2)-Ni(1)-O(1) 74.37 74.16 (1) 71.16
N(1)-Ni(1)-Naxial-1 94.34 (1) 95.52 (1) 93.72(2)
N(1)-Ni(1)-Naxial-2 93.59 (1) 99.02 (2) 93.02(2)
Table S3. Hydrogen bonding parameters of compounds 2-3
Complex Interactions H...A (Å) D...A(Å) ∠D–H..A (°) Symmetry
2
N(3)-H(3D)...S(1) 2.60 3.421(16) 159.0 2-x,-y,1-z
N(5)-H(5D) ...O(102) 2.04 2.852(14) 159.0 1+x,y,z
N(6)-H(6D) ...O(102) 2.22 3.106(15) 142.0 1+x, y, z
N(7)-H(7E) ...O(103) 1.99 2.960(14) 165.0 1+x, y, z
3 N(3)-H(3A)...S(2) 2.602 3.421 153.56 2-x, ½+y, ½-z

19
Table S4: Continuous SHAPE analysis of 1-3 to measure deviation from ideal seven coordinate
geometries.
Complex HP-7 HPY-7 PBPY-7 COC-7 CTPR-7 JPBPY-7 JETPY-7
1 33.840 24.231 0.340 8.249 6.481 2.512 24.159
2 33.403 23.223 0.902 8.341 6.607 2.212 23.939
3 33.394 24.703 0.763 7.570 5.788 2.486 23.053
HP-7: Heptagon (D7h); HPY-7: Hexagonal pyramid (C6v); PBPY-7: Pentagonal
bipyramid (D5h); COC-7: Capped octahedron (C3v); CTPR-7: Capped trigonal
prism(C2v); JPBPY-7: Johnson pentagonal bipyramid (D5h); JETPY-7: Johnson
elongated triangular pyramid (C3v)
Table S5: Continuous SHAPE analysis of the equatorial plane in 1-3 to measure deviation from
ideal five coordinate geometries.
PP-5: Pentagon (D5h); vOC-5: Vacant octahedron (C4v);
TBPY-5: Trigonal bipyramid (D3h); SPY-5: Spherical
square pyramid (C4v); JTBPY-5: Johnson trigonal
bipyramid (D3h)
Complex PP-5 vOC-5 TBPY-5 SPY-5 JTBPY
1 0.254 31.044 36.108 32.318 35.552
2 0.612 30.506 35.827 31.863 34.842
3 0.663 29.237 34.085 30.631 33.260

20
Table S6: D(experimental) values of reported PBP Ni(II) complexes along with contribution from
first three triplet excited states.
L3= 2,6-diacetylpyridine bis-(4-phenyl)benzohydrazide; L4=3,12-bis(2-methylpyridine)-3,12,18
-triaza-6,9-dioxabicyclo[12.3.1]octadeca-1,14,16-triene;L5=3,12,18-triaza-6,9-dioxabicyclo[12.
3.1]octadeca-1(18 ),14,16-triene; L6=3,12,18-triaza-6,9-dioxabicyclo[12.3.1]octade ca-1,14,16-
triene-3,12-diacetic acid
Compound SHAPE
PP-5
Dexp
(cm-1)
Contribution of excited triplet states to
D (cm-1)
Ref
1st 2nd 3rd
[Ni(L3)(NO3)(CH3OH)]NO3 0.174 -12.5 -91.1 36.4 35.7 11
[Ni(L2)(H2O)2](NO3)2.2H2O 0.403 -13.9 -66.2 22.5 23.2 10
[Ni(L4)](ClO4)2 0.875 -12.8 -23.1 0.0 -1.4 12
[Ni(L5)Cl2] 1.212 -6.0 -49.4 21.6 19.7 13
[Ni(L6)].H2O 1.252 -8.5 - - - 14

21
Table S7: CASSCF-NEVPT2 calculated contribution of different excited states in compound 1
towards D and E
Block Multiplicity Root D E
0 3 0 0 0
0 3 1 -93.603 0
0 3 2 20.552 -19.97
0 3 3 18.289 17.639
0 3 4 1.27 -1.031
0 3 5 1.543 1.366
0 3 6 1E-3 0
0 3 7 0.065 0.065
0 3 8 0.034 -0.034
0 3 9 0 0
1 1 0 0.056 0
1 1 1 0 0
1 1 2 18.867 0
1 1 3 -6.473 6.465
1 1 4 -6.188 -6.179
1 1 5 0.025 0
1 1 6 -0.103 -0.102
1 1 7 -0.208 0.208
1 1 8 0 0
1 1 9 0.058 0
1 1 10 -1.475 -1.478
1 1 11 -0.056 -0.032
1 1 12 -1.239 1.258
1 1 13 1.087 0.019
1 1 14 1E-3 0

22
Table S8: CASSCF-NEVPT2 calculated contribution of different excited states in compound 2
towards D and E
Block Multiplicity Root D E
0 3 0 0 0
0 3 1 -69.445 0.011
0 3 2 22.598 -19.523
0 3 3 20.558 17.496
0 3 4 1.301 -0.492
0 3 5 0.741 0.191
0 3 6 0.007 -1E-3
0 3 7 0.04 0.032
0 3 8 0.042 -0.036
0 3 9 -1E-3 0
1 1 0 0.03 0
1 1 1 0 0
1 1 2 17.076 0
1 1 3 -6.782 6.728
1 1 4 -6.639 -6.608
1 1 5 0.002 0
1 1 6 -0.158 -0.14
1 1 7 -0.324 0.278
1 1 8 -0.002 -1E-3
1 1 9 0.011 1E-3
1 1 10 0.974 -0.004
1 1 11 0.58 -0.011
1 1 12 -1.162 -1.184
1 1 13 -1.127 1.116
1 1 14 0 0

23
Table S9: CASSCF-NEVPT2 calculated contribution of different excited states in compound 3
towards D and E
Block Multiplicity Root D E
0 3 0 0 0
0 3 1 -60.987 -0.011
0 3 2 21.346 -17.43
0 3 3 19.698 15.528
0 3 4 0.851 -0.447
0 3 5 0.409 0.102
0 3 6 0.039 0.021
0 3 7 0.027 0.025
0 3 8 0.03 -0.03
0 3 9 -1E-3 0
1 1 0 0.03 -1E-3
1 1 1 0 0
1 1 2 16.557 -1E-3
1 1 3 -6.765 6.622
1 1 4 -6.621 -6.511
1 1 5 1E-3 0
1 1 6 -0.162 -0.114
1 1 7 -0.238 0.243
1 1 8 -1E-3 0
1 1 9 0.003 0.009
1 1 10 0.401 -0.002
1 1 11 0.758 -0.114
1 1 12 -0.746 -0.659
1 1 13 -1.026 0.726
1 1 14 1E-3 0

24
Table S10: CASSCF-NEVPT2 calculated contribution of different excited states in
[Ni(L3)(NO3)(CH3OH)]NO3 towards D and E
Block Multiplicity Root D E
0 3 0 0 0
0 3 1 -91.149 -0.289
0 3 2 36.4 -31.014
0 3 3 35.745 28.838
0 3 4 0.799 0.475
0 3 5 0.516 -0.482
0 3 6 0.326 -0.188
0 3 7 0.002 0.002
0 3 8 0.025 -0.016
0 3 9 0.016 0.006
1 1 0 -0.015 0.017
1 1 1 -0.014 0.014
1 1 2 8.478 -2.132
1 1 3 -7.567 6.973
1 1 4 0.886 -4.925
1 1 5 -0.025 -0.024
1 1 6 -0.052 0.038
1 1 7 -0.443 -0.312
1 1 8 -0.379 0.18
1 1 9 -0.056 0.042
1 1 10 -1.201 0.897
1 1 11 -0.739 -1.033
1 1 12 -0.339 0.334
1 1 13 1.933 -0.098
1 1 14 0 0