electronic supplementary information non-classical · pdf fileelectronic supplementary...
TRANSCRIPT

S1
Electronic Supplementary Information
Non-classical growth of water-redispersible spheroidal gold
nanoparticles assisted by leonardite humate
Alexander Yu. Polyakov,† Vasily A. Lebedev,†§ Evgeny A. Shirshin,‡ Artem M. Rumyantsev,‡
Alexander B. Volikov,§ Alexander Zherebker, § Alexey V. Garshev, †§║ Eugene A. Goodilin,†§
and Irina V. Perminova*§
† Department of Materials Science, Lomonosov Moscow State University, Leninskie Gory 1-73,
199991 Moscow, Russia;
‡ Department of Physics, Lomonosov Moscow State University, Leninskie Giry 1-2, 119991
Moscow, Russia;
§ Department of Chemistry, Lomonosov Moscow State University, Leninskie Gory 1-3, 119991
Moscow, Russia;
║ Baikov Institute of Metallurgy and Materials Science of RAS, Leninskiy Prospect 49, 199991
Moscow, Russia.
Pages: 10
Figures: 11
Tables: 0
* Corresponding author: Tel./Fax: +7-495-939-55-46; e-mail: [email protected]
Electronic Supplementary Material (ESI) for CrystEngComm.This journal is © The Royal Society of Chemistry 2017
S2
Real-time registration of UV-visible (UV-Vis) absorption spectra For real-time registration of UV-visible absorption spectra, a custom-built set-up was used. The reaction mixture was constantly pumped through the U-shaped plastic cuvette (Malvern, UK) with 1 mm optical path. Xenon lamp HPX-2000 (OceanOptics, US) was used as a light source. An incident beam was directed to the cuvette using QP600 UV-Vis (OceanOptics, US) optical fiber. The other optical fiber attached to the QE65000 spectrometer (OceanOptics, US) was used to collect the transmitted light. Absorbance spectra were measured every 3-5 seconds and processed using the lab-made software based on Python 2.7 to calculate position, integral intensity and FWHM of the surface plasmon resonance (SPR) peak. The software performs spectra averaging by time, automatically removes false spectra (which stem from bubbles traveling through the U-shape cuvette), cuts selected wavelength range (from 300 to 800 nm), and reduces constant background, caused mainly by detector's thermal drift and partly by unexpected scattering on solution. The obtained array of averaged spectra sent to a fitting module, where for every spectrum we automatically reduce exponential background with respect to peak presence, then fit the whole spectrum points by a 5th order spline, refine all peaks and their borders position by derivative curves, select a main maximum, calculate a position and integral intensity of source spectrum peaks in a selected region, with respect to exponential background (M.S. Twardowski, E.Boss, J.M. Sullivan and P.L. Donaghay, Marine Chemistry, 89, 1-4, 69-88).
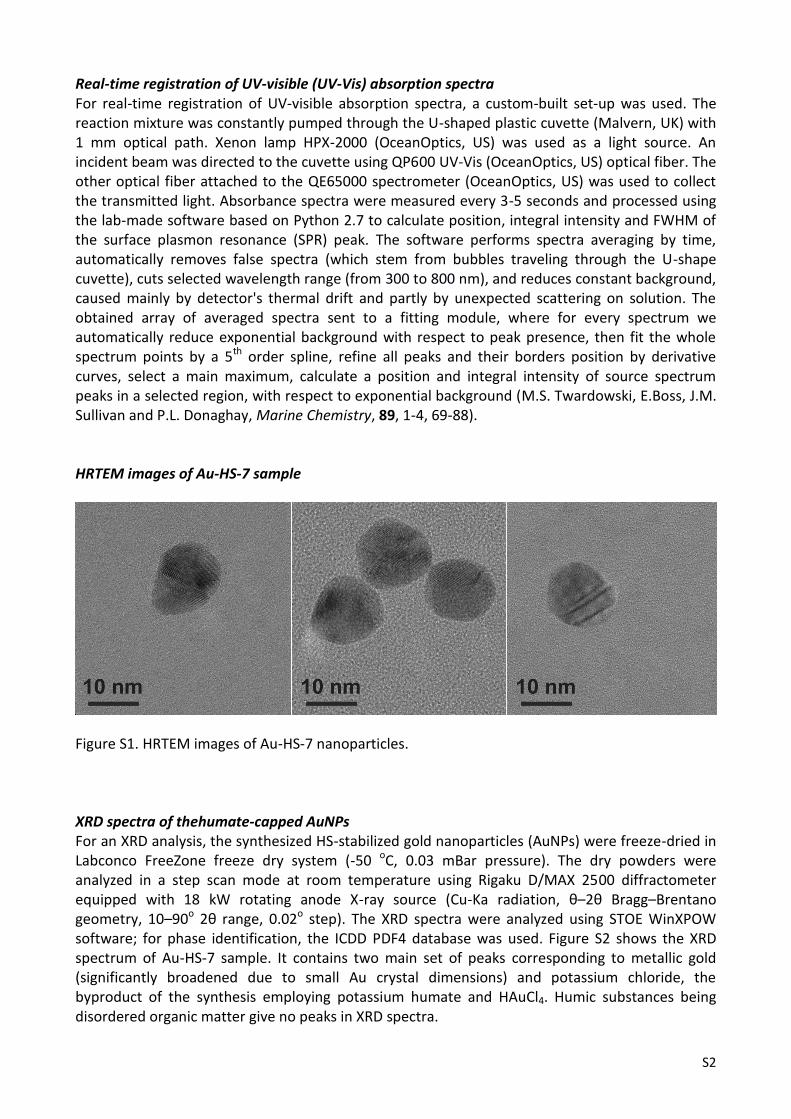
HRTEM images of Au-HS-7 sample
Figure S1. HRTEM images of Au-HS-7 nanoparticles.
XRD spectra of thehumate-capped AuNPs For an XRD analysis, the synthesized HS-stabilized gold nanoparticles (AuNPs) were freeze-dried in Labconco FreeZone freeze dry system (-50 oC, 0.03 mBar pressure). The dry powders were analyzed in a step scan mode at room temperature using Rigaku D/MAX 2500 diffractometer equipped with 18 kW rotating anode X-ray source (Cu-Ka radiation, θ–2θ Bragg–Brentano geometry, 10–90o 2θ range, 0.02o step). The XRD spectra were analyzed using STOE WinXPOW software; for phase identification, the ICDD PDF4 database was used. Figure S2 shows the XRD spectrum of Au-HS-7 sample. It contains two main set of peaks corresponding to metallic gold (significantly broadened due to small Au crystal dimensions) and potassium chloride, the byproduct of the synthesis employing potassium humate and HAuCl4. Humic substances being disordered organic matter give no peaks in XRD spectra.

S3
Figure S2. XRD spectrum of the Au-HS-7 sample; indexes of the metallic Au peaks are given. Humate-capped AuNPs size distributions (extension of Fig. 1)

S4
Figure S3. Particle size distributions for a) Au-HS-9, b) Au-HS-7, c) Au-HS-5, d) Au-HS-3 (all particles, transversal size), e) Au-HS-3 (triangular prismatic particles, triangle sides), f) citrate-stabilized AuNPs (0.25 mM HAuCl4 + 1.75 mM Na3C6H5O7, 100oC). Colloidal stability of the HS-stabilized gold sols To characterize the stability of HS-stabilized gold sols, UV-visible absorption spectra were registered using Perkin-Elmer Lambda 950 spectrophotometer (transmission geometry, wavelength range of 200−1000 nm, 1 nm step). The spectra were collected immediately after AuNPs synthesis, 2 month and 2 years later. The spectra of SPR peak of AuNPs did not change over 2 years since the AuNPs preparation (Fig. S2). This indicates stability of HS-stabilized AuNPs against aggregation and shape/size changes.
Figure S4. UV-visible absorption spectra of HS-stabilized AuNP samples: Au-HS-3 – a), Au-HS-5 – b), Au-HS-7 – c), Au-HS-9 – d), collected immediately after the syntheses, 2 month and 2 years later.

S5
Evolution of SPR peak parameters and pH during Au-HS-7 synthesis
Figure S5. Time evolution of SPR peak parameters ((curve 1 – area, curve 2 – λmax, curve 3 - FWHM) and pH (curve 4) during Au-HS-7 synthesis. Aggregates formed within the first minutes of Au-HS-7 synthesis
Figure S6. Large dendritic or fluffy aggregates observed at the first minutes of reaction of HAuCl4 with humate at the initial pH value of 7. Fluorescence spectroscopy of HS During the growth of gold nanoparticles, a gradual decrease of fluorescence intensity (λexc = 266 nm) at the red edge shoulder of HS fluorescence spectra was observed (see the main article text). We note that these changes could not be attributed to pH variations during the synthesis process (within 6-8 range), that was verified by measuring fluorescence spectra of HS at selected pH values, set by addition of 1 M HCl to alkaline potassium humate solution.

S6
Figure S7. The dependence of HS fluorescence spectra on the solution pH in 6-8 pH range. Fourier transform ion cyclotron resonance mass spectrometry Materials and methods All experiments were performed using a LTQ FT Ultra (Thermo Electron Corp., Bremen, Germany) mass-spectrometer equipped with a 7T superconducting magnet located at the facilities of the Institute of Biochemical Physics of RAS (Moscow, Russia). Ions were generated by an IonMax Electrospray ion source (Thermo Electron Corp., Bremen, Germany) in negative ESI modes. The length of the desolvating capillary was 105 mm and its inner diameter was 0.5 mm. The infusion rate of the sample was 1 μL/min and the needle voltage was 3 kV. Full-scan MS spectra (m/z 200–2000) were acquired in the FTICR with a resolution R = 400 000 at m/z 400. Internal calibration was systematically done by known peak series of natural organic matter reaching accuracy values < 200 ppb. Formula assignment was performed using the lab-made “Transhumus” software1. Obtained data were plotted on Van Krevelen with highlighted region of condensed tannins, oxidized aromatic compounds, lignins and saturated compounds and their contribution in total molecular space2–4.
Before the FT ICR MS analysis, the humate samples were desalted using ultrafiltration through 3 kDa membrane. The samples were prepared in methanol-water solution (1:1 V/V). All concentrations were 0.4 mg/mL.
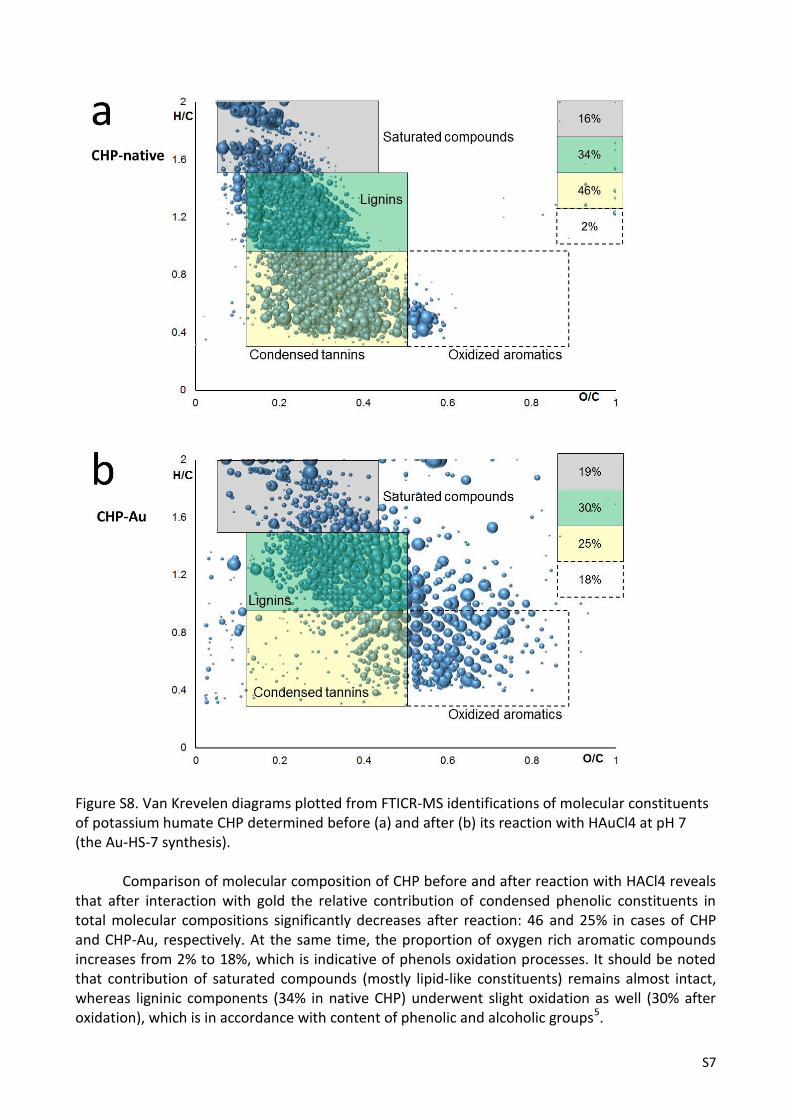
Results and discussion FTICR MS resolved thousands of molecular formulas in CHP before and after its reaction with HAuCl4.The conventional way of FTICR MS data visualization is Van Krevelen diagram, which represents all identified compounds as a plot of O/C versus H/C atomic ratios3. According to elemental compositions, all dots can be subdivided into regions of saturated compounds with high H/C ratio, lignin-like molecules with 1<H/C<1.4 and O/C>0.5, condensed phenols, and oxidized aromatic compounds2–4 with O/C>0.5 as it is shown in Fig. S8.
S7
Figure S8. Van Krevelen diagrams plotted from FTICR-MS identifications of molecular constituents of potassium humate CHP determined before (a) and after (b) its reaction with HAuCl4 at pH 7 (the Au-HS-7 synthesis).
Comparison of molecular composition of CHP before and after reaction with HACl4 reveals
that after interaction with gold the relative contribution of condensed phenolic constituents in total molecular compositions significantly decreases after reaction: 46 and 25% in cases of CHP and CHP-Au, respectively. At the same time, the proportion of oxygen rich aromatic compounds increases from 2% to 18%, which is indicative of phenols oxidation processes. It should be noted that contribution of saturated compounds (mostly lipid-like constituents) remains almost intact, whereas ligninic components (34% in native CHP) underwent slight oxidation as well (30% after oxidation), which is in accordance with content of phenolic and alcoholic groups5.
S8
References:
1 E. V Kunenkov, A. S. Kononikhin, I. V Perminova, N. Hertkorn, A. Gaspar, P. Schmitt-Kopplin, I. A. Popov,
A. V Garmash and E. N. Nikolaev, Anal. Chem., 2009, 81, 10106–10115.
2 W. C. Hockaday, J. M. Purcell, A. G. Marshall, J. A. Baldock and P. G. Hatcher, Limnol. Oceanogr., 2009, 7,
81–95.
3 I. V Perminova, I. V Dubinenkov, A. S. Kononikhin, A. I. Konstantinov, A. Y. Zherebker, M. A. Andzhushev,
V. A. Lebedev, E. Bulygina, R. M. Holmes, Y. I. Kostyukevich, I. A. Popov and E. N. Nikolaev, Environ. Sci.
Technol., 2014, 48, 7461–8.
4 A. Y. Zherebker, Y. I. Kostyukevich, A. S. Kononikhin, E. N. Nikolaev and I. V Perminova, Mendeleev
Commun., 2016, 26, 446–448.
5 A. Y. Zherebker, D. Airapetyan, A. I. Konstantinov, Y. I. Kostyukevich, A. S. Kononikhin, I. A. Popov, K. V
Zaitsev, E. N. Nikolaev and I. V Perminova, Analyst, 2015, 140, 4708–19.
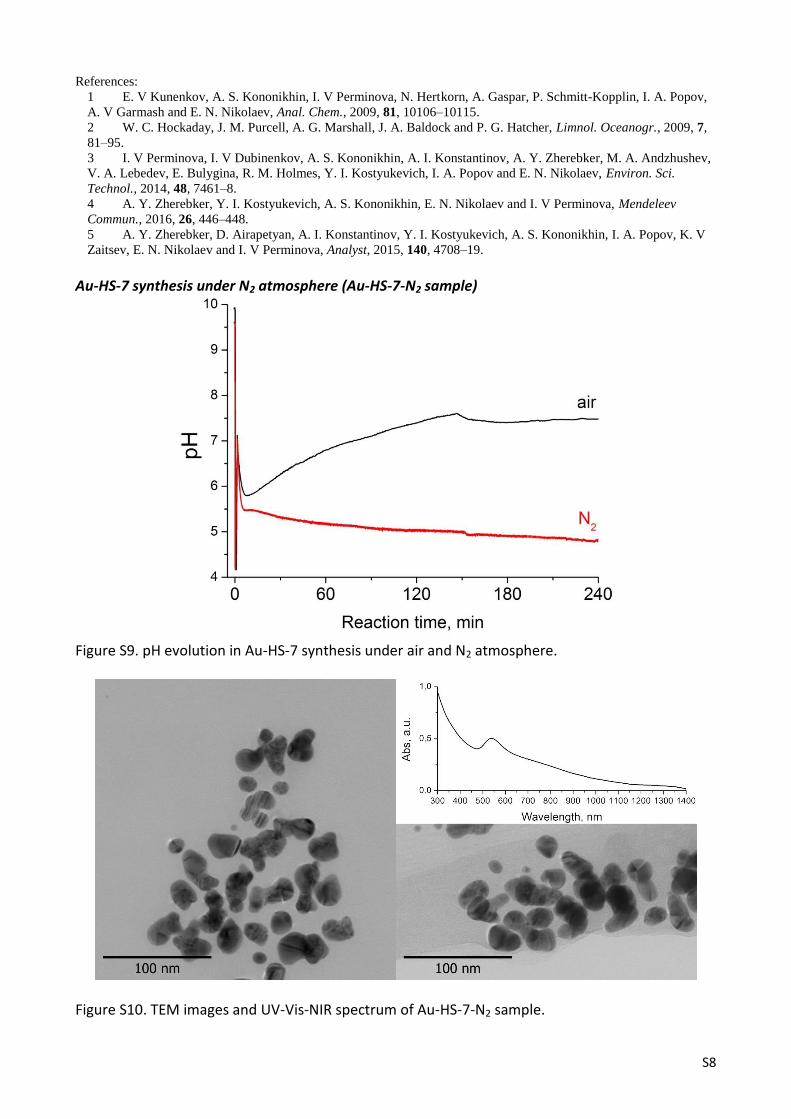
Au-HS-7 synthesis under N2 atmosphere (Au-HS-7-N2 sample)
Figure S9. pH evolution in Au-HS-7 synthesis under air and N2 atmosphere.
Figure S10. TEM images and UV-Vis-NIR spectrum of Au-HS-7-N2 sample.
S9
Theoretical calculations on colloidal stability of AuNPs stabilized by humate and citrate The total energy of colloid nanoparticles interaction 𝑉𝑡𝑜𝑡 expressed in 𝑘𝐵𝑇 units (𝑘𝐵 and 𝑇 are Boltzmann constant and absolute temperature, respectively) comprises three terms:
𝑉𝑡𝑜𝑡 = 𝑉𝑣𝑑𝑤 + 𝑉𝑒𝑙−𝑠𝑡 + 𝑉𝑠𝑜𝑙𝑣 Hamaker expression corresponding to van den Waals attraction between the spherical particles reads (H.C. Hamaker, Physica, 1937, 4, 10, 1058-1072):
𝑉𝑣𝑑𝑤
𝑘𝐵𝑇= −
𝐴
6𝑘𝐵𝑇[
2𝑎2
ℎ2 + 4𝑎ℎ+
2𝑎2
ℎ2 + 4𝑎ℎ + 4𝑎2+ ln (
ℎ2 + 4𝑎ℎ
ℎ2 + 4𝑎ℎ + 4𝑎2)]
Here we use the value of gold/water/gold Hamaker constant 𝐴 = 2.5 ∙ 10−19 J, which has been measured in AFM experiments (S. Biggs and P. Mulvaney, J. Chem. Phys., 1994, 100, 8501-8505).
Since we consider the stage of the synthesis when the most part of Au is already reduced, particle size was assumed to be 𝑎 = 8.5 nm, in agreement with TEM results of citrate-AuNPs. The second term 𝑉𝑒𝑙−𝑠𝑡 in the total interaction energy takes into consideration electrostatic repulsion of colloidal nanoparticles due to electrical double layers overlapping. Since the ratio between the particle radius 𝑎 and Debye radius of the solution given by
𝑟𝐷 = (𝑒2 ∑ 𝑛𝑖𝑧𝑖2 𝜀𝜀0𝑘𝐵𝑇⁄ )−1 2⁄ is high enough, 𝑎 𝑟𝐷 < 5⁄ , the Ohshima expression for the
electrostatic repulsion potential is used (H. Ohshima, Colloid Interface Sci., 1995, 174, 1, 45-52; K. Lee et al., Colloids and Surfaces A: Physicochemical and Engineering Aspects, 1998, 144, 115-125; T. Kim et al., Langmuir, 2005, 21, 9524-9528):
𝑉𝑒𝑙−𝑠𝑡
𝑘𝐵𝑇=
𝑎2
(2𝑎 + ℎ)𝑙𝑏 𝑌2 exp (−
ℎ
𝑟𝐷)
𝑌 =8 tanh (
𝑒𝜓0
4𝑘𝐵𝑇)
1 + √1 −2𝑎 𝑟𝐷⁄ + 1
(𝑎 𝑟𝐷 + 1⁄ )2 tanh2 (𝑒𝜓0
4𝑘𝐵𝑇)
Here 𝜓0is the surface potential, 𝜀 is the solution dielectric constant, 𝜀0 is vacuum permittivity, 𝑛𝑖 and 𝑧𝑖 are concentrations and integer charge numbers of respective types of ions in the solutions, 𝑒 is the elementary charge. Bjerrum length 𝑙𝑏 = 𝑒2 4𝜋𝜀𝜀0𝑘𝐵𝑇⁄ is assumed to be 0.6 nm, owing to syntheses have been performed at temperatures about 𝑇 = 350 − 373 K. This value of 𝑙𝑏 is slightly lower than one at room temperature (𝑙𝑏 = 0.7 nm at 𝑇 = 300 K). Debye radius for classical citrate-mediated synthesis approximately equals 𝑟𝐷 = 1.8 nm. Indeed, in the performed citrate synthesis concentrations of citrate Na3C6H5O7 ca. 1.75 mM and HAuCl4 of 0.25 mM provide solution ionic strength around 2.4*10-2 M (corresponding to Debye radius 𝑟𝐷 = 1.8 nm) since citrate ions C6H5O7
3- charge equals 𝑧𝑐𝑖𝑡 = 3. Finally, the third contribution to the total interaction potential is responsible for solvation forces. Because solvation forces are known to be exponentially decaying, with decay length of the order of 𝑙 ∼1 nm, Derjaguin approximation (ℎ ≪ 𝑎) is applied to get the solvation energy (G.H. Bogush and C.F. Zukoski, J. Colloid Interface Sci. 1990, 142, 1, 19-34):
𝑉𝑠𝑜𝑙𝑣 = 2𝜋 𝐵𝑠𝑎𝑙
𝑘𝐵𝑇 exp (−
ℎ
𝑙)
Exact values of the parameters 𝑙 and 𝐵𝑠 for our systems are unknown, and we use 𝑙 = 0.5 nm and 𝐵𝑠 = 2.2 ∙ 10−2 J∙m-2. Chosen values belong to the typical range of these parameters, 𝑙 ∼ 1 nm and 0,3 ∙ 10−2 J∙m-2 ≤ 𝐵𝑠 ≤ 3 ∙ 10−2 J∙m-2 (J.N. Israelachvili, Intermolecular and Surface Forces, Second Edition. Academic Press, New York, 1992). Our rough calculations shows that slight changes in the values of these parameters do not affect principal results of the theoretical consideration. To prove it, case of another values of these parameters, 𝑙 = 0.7 nm and 𝐵𝑠 =0.8 ∙ 10−2 J∙m-2, is considered as well (see Fig. S11, right plot).
S10
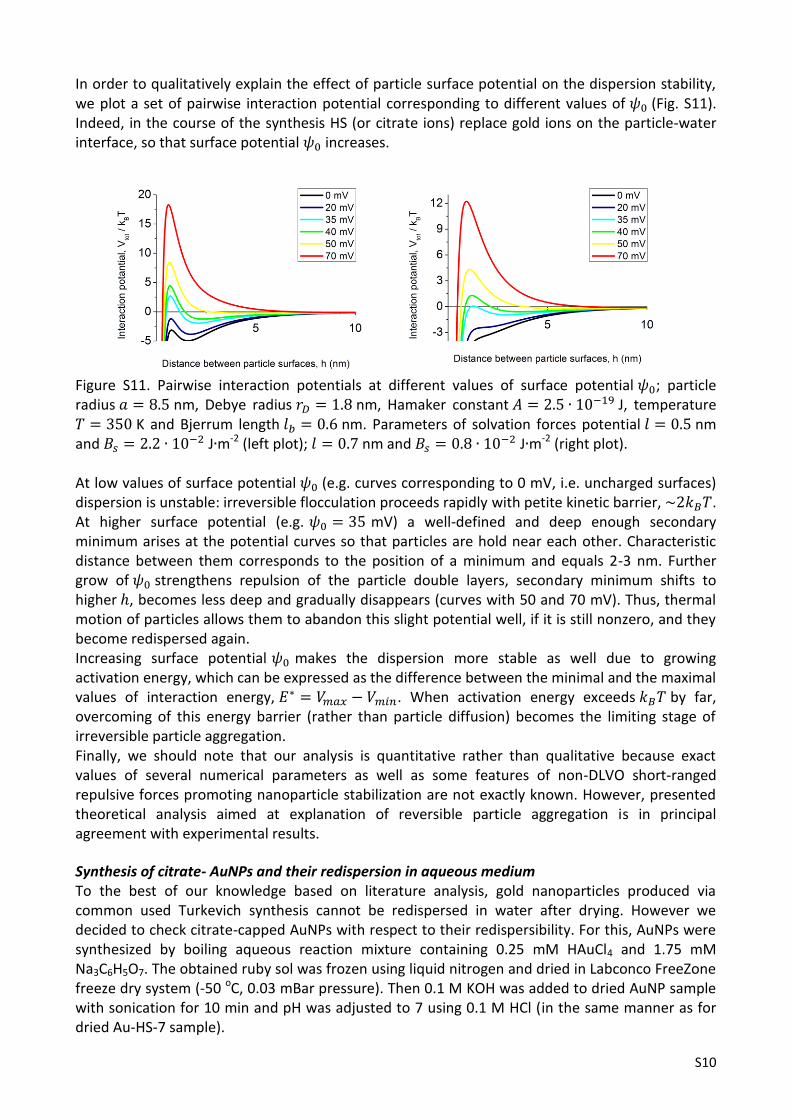
In order to qualitatively explain the effect of particle surface potential on the dispersion stability, we plot a set of pairwise interaction potential corresponding to different values of 𝜓0 (Fig. S11). Indeed, in the course of the synthesis HS (or citrate ions) replace gold ions on the particle-water interface, so that surface potential 𝜓0 increases.
Figure S11. Pairwise interaction potentials at different values of surface potential 𝜓0; particle radius 𝑎 = 8.5 nm, Debye radius 𝑟𝐷 = 1.8 nm, Hamaker constant 𝐴 = 2.5 ∙ 10−19 J, temperature 𝑇 = 350 K and Bjerrum length 𝑙𝑏 = 0.6 nm. Рarameters of solvation forces potential 𝑙 = 0.5 nm and 𝐵𝑠 = 2.2 ∙ 10−2 J∙m-2 (left plot); 𝑙 = 0.7 nm and 𝐵𝑠 = 0.8 ∙ 10−2 J∙m-2 (right plot). At low values of surface potential 𝜓0 (e.g. curves corresponding to 0 mV, i.e. uncharged surfaces) dispersion is unstable: irreversible flocculation proceeds rapidly with petite kinetic barrier, ~2𝑘𝐵𝑇. At higher surface potential (e.g. 𝜓0 = 35 mV) a well-defined and deep enough secondary minimum arises at the potential curves so that particles are hold near each other. Characteristic distance between them corresponds to the position of a minimum and equals 2-3 nm. Further grow of 𝜓0 strengthens repulsion of the particle double layers, secondary minimum shifts to higher ℎ, becomes less deep and gradually disappears (curves with 50 and 70 mV). Thus, thermal motion of particles allows them to abandon this slight potential well, if it is still nonzero, and they become redispersed again. Increasing surface potential 𝜓0 makes the dispersion more stable as well due to growing activation energy, which can be expressed as the difference between the minimal and the maximal values of interaction energy, 𝐸∗ = 𝑉𝑚𝑎𝑥 − 𝑉𝑚𝑖𝑛. When activation energy exceeds 𝑘𝐵𝑇 by far, overcoming of this energy barrier (rather than particle diffusion) becomes the limiting stage of irreversible particle aggregation. Finally, we should note that our analysis is quantitative rather than qualitative because exact values of several numerical parameters as well as some features of non-DLVO short-ranged repulsive forces promoting nanoparticle stabilization are not exactly known. However, presented theoretical analysis aimed at explanation of reversible particle aggregation is in principal agreement with experimental results.
Synthesis of citrate- AuNPs and their redispersion in aqueous medium To the best of our knowledge based on literature analysis, gold nanoparticles produced via common used Turkevich synthesis cannot be redispersed in water after drying. However we decided to check citrate-capped AuNPs with respect to their redispersibility. For this, AuNPs were synthesized by boiling aqueous reaction mixture containing 0.25 mM HAuCl4 and 1.75 mM Na3C6H5O7. The obtained ruby sol was frozen using liquid nitrogen and dried in Labconco FreeZone freeze dry system (-50 oC, 0.03 mBar pressure). Then 0.1 M KOH was added to dried AuNP sample with sonication for 10 min and pH was adjusted to 7 using 0.1 M HCl (in the same manner as for dried Au-HS-7 sample).