electronic supplementary information analysis enrichment
TRANSCRIPT

S1
Electronic Supplementary Information
Development of magnetic LuPO4 microspheres for highly selective
enrichment and identification of phosphopeptides for MALDI-TOF MS
analysis
Xing-yu Long1,2, Qun Song1, Hong-zhen Lian1*
1. State Key Laboratory of Analytical Chemistry for Life Science, Collaborative Innovation
Center of Chemistry for Life Sciences, School of Chemistry & Chemical Engineering and
Center of Materials Analysis, Nanjing University, 22 Hankou Road, Nanjing 210093, China
2. Editorial Department of Journal, Guizhou Normal University, 180 Baoshan North Road,
Guiyang 550001, China
*Corresponding author. Tel.: +86-25-83686075; fax: +86-25-83325180. E-mail:
[email protected] (H. Z. Lian).
Electronic Supplementary Material (ESI) for Journal of Materials Chemistry B.This journal is © The Royal Society of Chemistry 2015

S2
Part 1. Supporting figures
Fig. S1. SEM (left) and TEM (right) images of Fe3O4 (a, c), Fe3O4@SiO2 (b, d), respectively.

S3
Fig. S2. EDX spectra of the prepared Fe3O4, Fe3O4@SiO2, Fe3O4@Lu(OH)CO3 and
Fe3O4@LuPO4 microspheres (From top to down).

S4
Fig. S3. MALDI-TOF MS spectra of phosphopeptides from tryptic digests of bovine β-casein
and BSA (1:50 molar ratio) with different affinity materials. a. Without enrichment; b. Fe3O4;
c. Fe3O4@SiO2; d. Fe3O4@Lu(OH)CO3; e. Fe3O4@LuPO4; f. Commercial TiO2. The data in
parentheses represent S/N ratios.

S5

S6
Fig. S4. MALDI-TOF MS spectra of phosphopeptides from tryptic digests of bovine β-casein
and BSA with Fe3O4@LuPO4 microspheres affinity materials. Left: Without enrichment;
Right: After enrichment. a. 1:0; b. 1:10; c. 1:20; d. 1:50. “*” β1, β2, β3, β4: Phosphopeptides;
[β4]2+: Doubly charged; “#”: Metastable ions; “^”: Na+ adducted ions.
Fig. S5. MALDI-TOF MS spectra of a
tryptic digests of bovine β-casein treated by
Fe3O4@LuPO4 microspheres. a. 2 pmol; b.
0.5 pmol; c. 0.2 pmol. The data in
parentheses represent S/N ratios.
S7
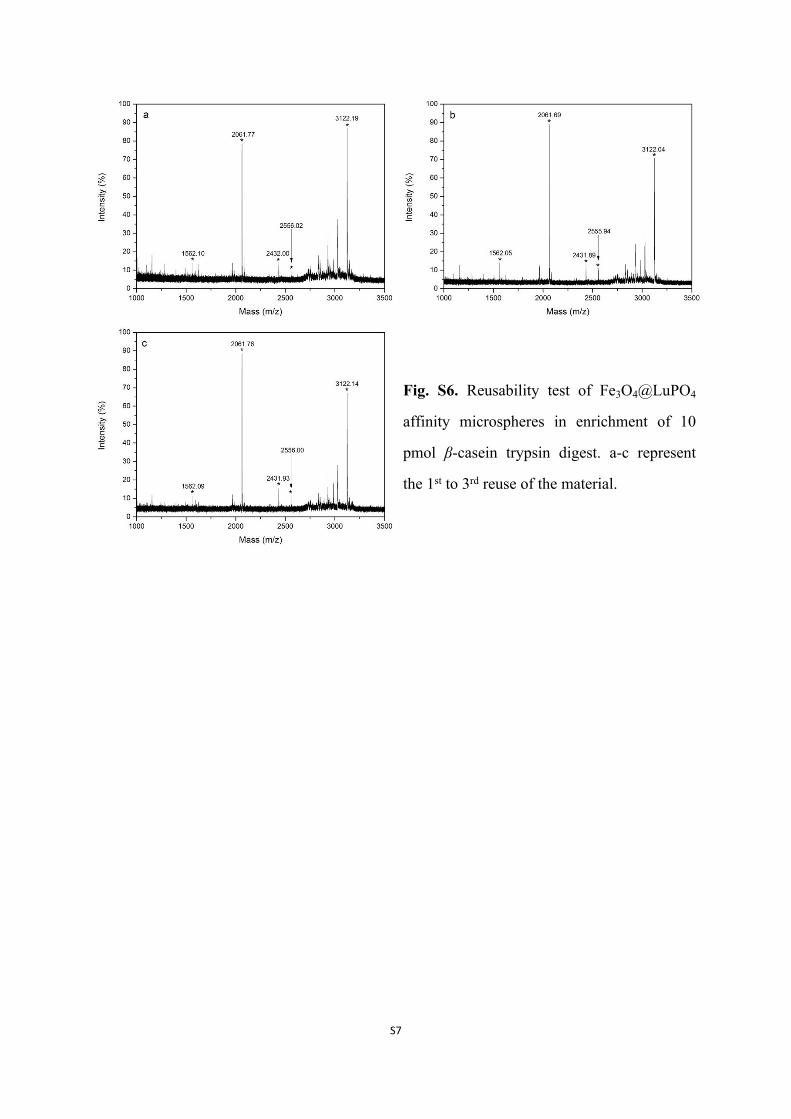
Fig. S6. Reusability test of Fe3O4@LuPO4
affinity microspheres in enrichment of 10
pmol β-casein trypsin digest. a-c represent
the 1st to 3rd reuse of the material.
S8
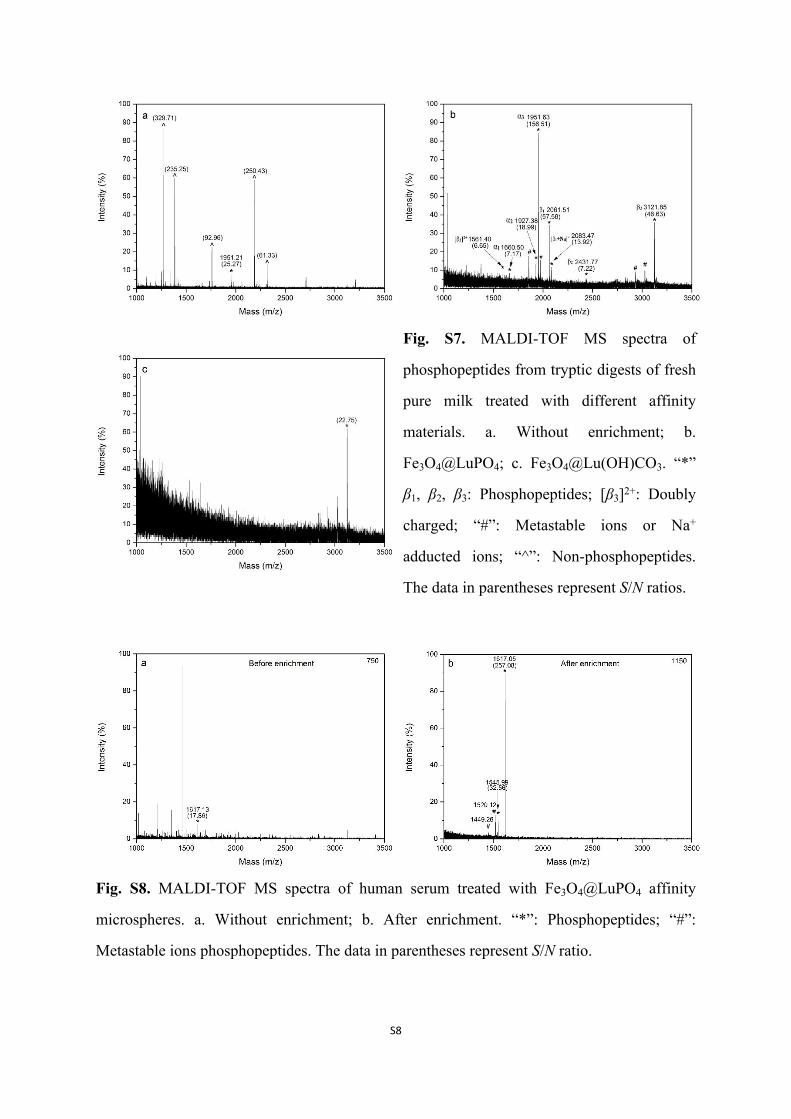
Fig. S7. MALDI-TOF MS spectra of
phosphopeptides from tryptic digests of fresh
pure milk treated with different affinity
materials. a. Without enrichment; b.
Fe3O4@LuPO4; c. Fe3O4@Lu(OH)CO3. “*”
β1, β2, β3: Phosphopeptides; [β3]2+: Doubly
charged; “#”: Metastable ions or Na+
adducted ions; “^”: Non-phosphopeptides.
The data in parentheses represent S/N ratios.
Fig. S8. MALDI-TOF MS spectra of human serum treated with Fe3O4@LuPO4 affinity
microspheres. a. Without enrichment; b. After enrichment. “*”: Phosphopeptides; “#”:
Metastable ions phosphopeptides. The data in parentheses represent S/N ratio.
S9
Part 2. Supporting tables
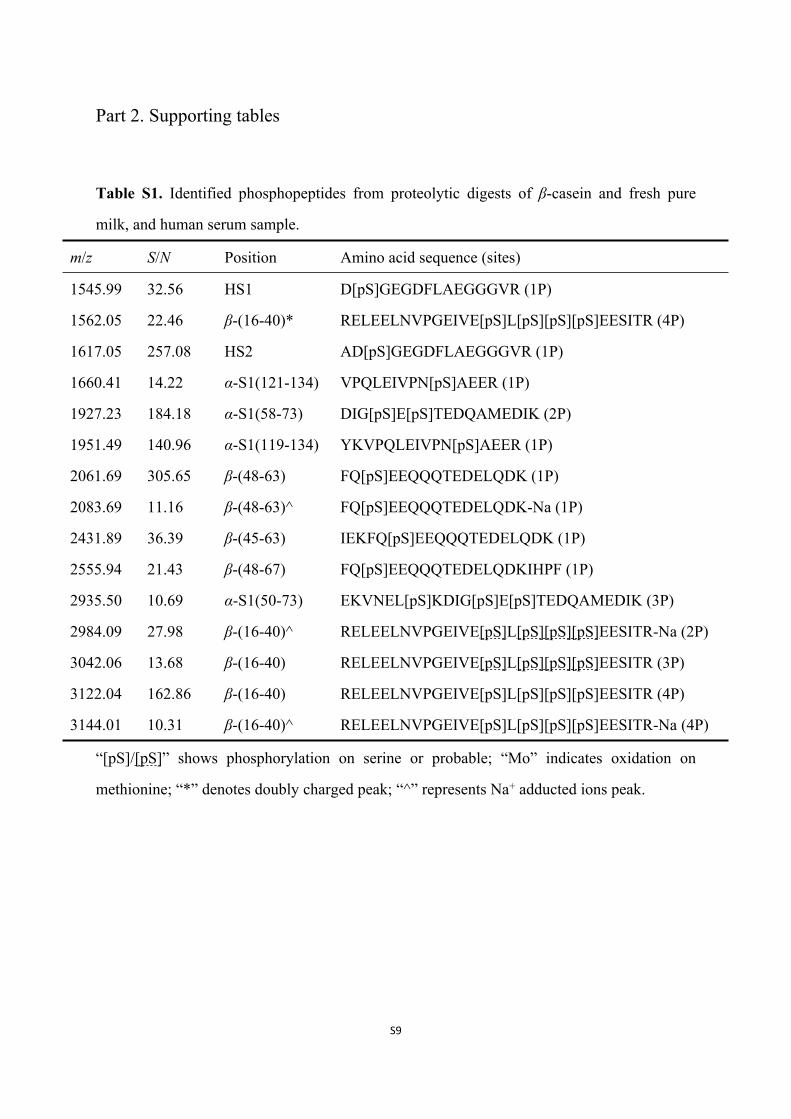
Table S1. Identified phosphopeptides from proteolytic digests of β-casein and fresh pure
milk, and human serum sample.
m/z S/N Position Amino acid sequence (sites)
1545.99 32.56 HS1 D[pS]GEGDFLAEGGGVR (1P)
1562.05 22.46 β-(16-40)* RELEELNVPGEIVE[pS]L[pS][pS][pS]EESITR (4P)
1617.05 257.08 HS2 AD[pS]GEGDFLAEGGGVR (1P)
1660.41 14.22 α-S1(121-134) VPQLEIVPN[pS]AEER (1P)
1927.23 184.18 α-S1(58-73) DIG[pS]E[pS]TEDQAMEDIK (2P)
1951.49 140.96 α-S1(119-134) YKVPQLEIVPN[pS]AEER (1P)
2061.69 305.65 β-(48-63) FQ[pS]EEQQQTEDELQDK (1P)
2083.69 11.16 β-(48-63)^ FQ[pS]EEQQQTEDELQDK-Na (1P)
2431.89 36.39 β-(45-63) IEKFQ[pS]EEQQQTEDELQDK (1P)
2555.94 21.43 β-(48-67) FQ[pS]EEQQQTEDELQDKIHPF (1P)
2935.50 10.69 α-S1(50-73) EKVNEL[pS]KDIG[pS]E[pS]TEDQAMEDIK (3P)
2984.09 27.98 β-(16-40)^ RELEELNVPGEIVE[pS]L[pS][pS][pS]EESITR-Na (2P)
3042.06 13.68 β-(16-40) RELEELNVPGEIVE[pS]L[pS][pS][pS]EESITR (3P)
3122.04 162.86 β-(16-40) RELEELNVPGEIVE[pS]L[pS][pS][pS]EESITR (4P)
3144.01 10.31 β-(16-40)^ RELEELNVPGEIVE[pS]L[pS][pS][pS]EESITR-Na (4P)
“[pS]/[pS]” shows phosphorylation on serine or probable; “Mo” indicates oxidation on
methionine; “*” denotes doubly charged peak; “^” represents Na+ adducted ions peak.

S10
Table S2. Apparent and true m/z of metastable ions of phosphopeptides*
m/z
Ma Mb Mx Mc (Observed) Mc’ (Calculated)r �̅�
2061.76 1963.76 1870.42 1965.32 1965.44 0.992
3122.21 3024.21 2929.29 3027.05 3025.17 0.988
3122.21 2926.21 2742.51 2929.62 2930.30 0.996
1617.05 1519.05 1426.99 1520.96 1520.96 0.991
1545.99 1447.99 1356.20 1449.20 1449.88 0.993
0.992
* Calculated by Eq. 1 (Harvey derivation formula). Ma: Precursor ion; Mb: Product ion; Mc:
Metastable ion.
𝑀𝑥 =𝑀2
𝑏
𝑀𝑎 𝑟 =
𝑀𝑏 ‒ 𝑀𝑐 + 𝑀𝑐(𝑀𝑎 ‒ 2𝑀𝑏 + 𝑀𝑥)(𝑀𝑐 ‒ 𝑀𝑥)
𝑀'𝑐 = 𝑀𝑎[1 +𝑀𝑏
𝑀𝑎𝑟
(1 + 𝑟) ]2 (1)

S11
Table S3. High-abundant nonphosphopeptides from proteolytic digests of β-casein and BSA
at molar ratio of 1:50.
m/z S/N Position Amino acid sequence
1037.46 6.45 BSA(310-318)^ SHCIAEVEK-Na
1154.58 24.08 β-(113-122) VKEA[Mo]APKHK
1249.59 29.89 BSA(35-44) FKDLGEEHFK
1416.68 27.95 BSA(569-580) TV[Mo]ENFVAFVDK
1495.77 11.65 BSA(387-399) DDPHACYSTVFDK
“Mo” indicates oxidation on methionine; “^” represents Na+ adducted ions peak.
Table S4. High-abundant non-phosphopeptides from proteolytic digest of fresh pure milk
(S/N > 60)
m/z S/N Position Amino acid sequence
1267.22 329.71 α-S1 (106-115) YLGYLEQLLR
1384.19 235.25 α-S1(38-49) FFVAPFPEVFGK
1759.30 92.96 α-S1(23-37) HQGLPQEVLNENLLR
2185.37 250.43 α-S2(18-36) TMEHVSSSEESIISQETYK
2315.30 61.33 α-S1 (148-166) EPMIGVNQELAYFYPELFR