electronic structure of surfaces (gga, perdew-wang pw91) and the local density approxima-tion (lda,...
TRANSCRIPT
ELECTRONIC STRUCTURE OFSURFACES
C. Franchini, D. Vogtenhuber, R. Podloucky and J. RedingerCenter for Computational Materials Science (CMS)
Vienna University of TechnologyGetreidemarkt 9
A-1060 Wien
1 Ab-initio study of quasi one-dimensional Bromineadsorption on Platinum(110)
IntroductionThe central issue of this part of the project is a first-principles investigation of thestructural and electronic properties of halogen-metal systems, such as Br and Cladsorbed on both, the ideal unreconstructed Pt(110) surface and the missing-rowtype reconstructed Pt(110)-(1x2) surface.The phenomena of spontaneous reconstruction by adsorption of atoms (mole-cules) on a surface are strong motivations in modern surface science and tech-nology. On the one hand, surfaces or ad-layers constitute good testing grounds fortheoretical models of phase transitions and self-organization in two-dimensional(2D) systems. On the other hand microscopic models of adsorption and migrationmechanisms are essential in the fast-growing area of nanotechnology aiding to thedesign of low-dimensional systems by controlling the growth on the atomic scale.With respect to that, the adsorption of halogens on metal surfaces was found torepresent systems with good prospects for the study of manipulation of individualatom on surfaces at room temperature in a scanning tunneling microscope (STM)[1] [2] [3].
MethodologyThe calculations were performed using both, the all-electron Full-potential Lin-earized Augmented Plane-wave (FLAPW) method [4], as implemented in thepackage FLEUR, and the Vienna Ab-initio Simulation Package (VASP) [5] apackage for performing ab-initio quantum-mechanical molecular dynamics (MD)using pseudopotentials and a plane wave basis set in its recent incarnation, im-plementing the Projector Augmented Wave formalism. The Generalized Gradient

Approximation (GGA, Perdew-Wang PW91) and the Local Density Approxima-tion (LDA, Perdew-Zunger PZ) to the Density Functional Theory (DFT) wereused throughout this work. The accuracy of the calculations with respect to thenumber of layers taken into account was checked by performing VASP calcula-tions for a 15 layers slab were 4 layers on one side had been frozen to bulk geom-etry: in this way errors in the geometry due to the numbers of substrate layers ofall the different structure models investigated may be judged straightforwardly. Inboth methods the geometry was optimized until all forces were smaller than 0.01eV/A. Constant height (ch) STM images were calculated according the Tersoff-Hamann approach [6] assuming a small bias voltage. The images were calculatedfor a tip-sample distance equal to 4A.
The clean Pt(110) surfaceThe very similar 1xn reconstructions of the (110) surface of the fcc 5d metals Ir, Ptand Au have been intensively studied both theoretically and experimentally. Nev-ertheless, no first principles analysis of the unreconstructed Pt(110) surface hasbeen performed to the best of our knowledge up to now. Both the clean Pt(110)surface and its (1x2) missing-row reconstruction (MRR) are investigated. The ge-ometry and electronic properties of the two structures are characterized, to shedsome light on the origin of the reconstruction. By now, the missing-row modelfor the structure of the (1x2) reconstructed surface is well established by variousmeasurements and calculations. In this model, alternative (110) rows are missingfrom the top surface layer. A buckling in the third layer, probably caused by atendency to smooth the large corrugation of the surface, and a lateral row-paringin the second and forth layers are the main features of the (1x2) MR pattern. InFig. 1 we show a drawing of the Pt(110) surface unit cell and the corresponding(1x2) missing row reconstruction.
The unreconstructed Pt(110) surfaceAll our results and the available theoretical data for the unreconstructed surface
are listed in Table 1. The theoretical lattice constants used were obtained frombulk calculations performed by the respective methods. The VASP and FLEURGGA-PW91 lattice constants are almost identical, 2.817 A and 2.809 A respec-tively, and overestimate slightly the experimental lattice constant of 2.77 A. Onthe contrary the VASP LDA lattice constant, 2.764 A, is in very good agreementwith the experimental value. The 9 layers repeated slab data, compiled in the firsttwo rows of the table, are in excellent agreement with each other, lending furthersupport to the already established equivalent accuracy of both packages. Both pre-dict an inward relaxation of the topmost surface layer and of the third layer, onlypartially compensated by an outward relaxation of the sub-surface layer. Goingto thicker slabs, investigated by VASP, the situation changes a bit, not in the top-

Figure 1: Drawing of the ideal Pt(110) surface unit cell (left) and of the Pt(110)-(1x2) missing-row reconstructed surface unit cell (right), side view (top) and topview (bottom). Geometrical parameters of the missing-row model with multi-layer relaxations are indicated. In the top-views gray circles represent sub-surfaceatoms.
SIDE VIEW
[001]
[110]3.92Å
∆d12
∆d23
∆d34
∆d45
exp.
∆d12
3b∆d23
∆d34
SIDE VIEW
3.92Å [001]
[110]
p p2 4
exp.
TOP VIEW
2.77Å
3.92Å [001]
_[110]
exp.
exp.
TOP VIEW
2.77Å
Missing Row7.83Å [001]
_[110]
exp.
exp.
∆d45
layer relaxation but regarding the sub-surface relaxations. In fact a reduction offew % of ∆d12 and a reduced expansion od ∆d23 is noticed. Taking into account15 layers one can even calculate the changes in the inter-layer distances furtherinside, but relaxations in that region are almost negligible as is evident looking at∆d45 and ∆d56. To this end one may conclude that the net-effect of consideringa thicker slab, matching the experimental semi-infinite system better, is only aslightly larger compression of the structure. The 9 layers calculation gives a totalcompression equal to −0.13 A. For the LDA-PZ and GGA-PW91 15 layers calcu-lation the total compression is respectively −0.14 A and −0.16 A. In the last tworows other available theoretical data are listed. At the time in which those calcula-tions have been done (1985, 1986) owing to the complexity of the problem it wasnot possible to perform first principle calculations so both, the Embedded AtomMethod (EAM) and the Tight Binding (TB) approach severely depend on severalparameters which make these methods less accurate. Both methods EAM and TByield the missing row reconstructed surface to be the more stable one, but the opti-mum geometry obtained for the unreconstructed surface is in bad agreement withthe present data, which are believed to be more accurate because our two differentfirst-principles approaches give the same results and because, as we will see forthe reconstructed Pt(110) surface, for which experimental data are available, theagreement between our calculated results and the experimental data in that caseis excellent. Despite its approximations the EAM still gives a top-layer relaxation

Table 1: Summary of calculated changes in inter-layer spacings of the meta-stableunreconstructed Pt(110)-(1x1) surface. ∆di,i+1 denote the changes in the inter-layer spacing with respect to the ideal bulk inter-layer spacing d0 = a
2 A. L denotesthe thickness of the slab (number of layers). All values are given in A.
Method Ref. ∆d12 ∆d23 ∆d34 ∆d45 ∆d56 aFLEUR-GGA 9L this work – 0.22 0.14 – 0.05 – – 2.809VASP-GGA 9L this work – 0.23 0.15 – 0.05 – – 2.817VASP-LDA 15L this work – 0.22 0.11 – 0.03 0.00 0.00 2.764VASP-GGA 15L this work – 0.23 0.12 – 0.04 – 0.01 0.00 2.817EAM Ref. [7] – 0.24 0.04 – – – 2.770TB Ref. [8] – 0.06 0.01 0.00 – – 2.830
very similar to the present values but fails in predicting any second inter-layer re-laxation. On the contrary the TB agrees with the present results only in the signof the displacement.
The (1x2) reconstructed Pt(110) surfaceThe results of a structural optimization for the missing row system are listed in
Table 2. A compilation of the most relevant theoretical and experimental works isalso included. Even for the reconstructed surface our two theoretical approaches,all-electron FLEUR and PAW VASP, give very similar results and both are in ex-cellent agreement with latest LEED data, apart for the vertical buckling in thethird layer. One finds in that the numbers of layers (thickness of the slab) playsan important role not only in the global contraction of the slab as for the unrecon-structed surface, but also in the local relaxation of the structure. In fact one noticesa considerable change in the vertical buckling b3 that increases by ∼ 13% for asmaller number of layers. Furthermore the pairing in the the second and fourthlayer undergoes a considerable change as well, with a value of p2 that almostvanishes and p4 that increases by ∼ 50%, in disagreement with the experiment.One may interpret these finding, that in the case of the thicker slab, resemblingthe actual semi-infinite system best, the atoms have more freedom to relax, as theenergy gained is distributed over a larger set of spacings. Relaxation occurs moregradually and the rearrangement of the atoms is found to reach down to the sixthlayer. This, however, is not possible in a thinner slab, e.g., for the present symmet-ric 9 layer slab relaxations can only occur down to the fourth layer, giving rise tolarger local changes in the distances. If one sums up all the lateral pairings in the15 layers slab one obtains 0.21 A for the LDA-PZ and 0.22 A for the GGA-PW91case; doing the same sum for the 9 layer slab on gets 0.19 A using the VASP code
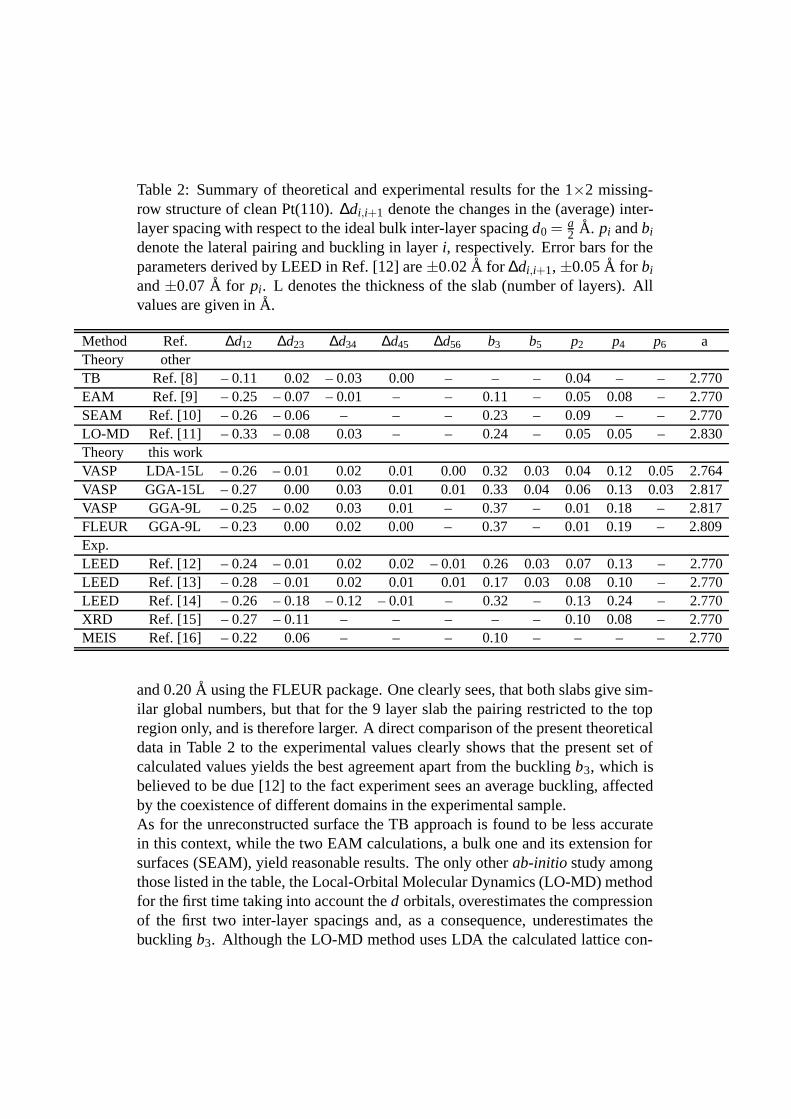
Table 2: Summary of theoretical and experimental results for the 1×2 missing-row structure of clean Pt(110). ∆di,i+1 denote the changes in the (average) inter-layer spacing with respect to the ideal bulk inter-layer spacing d0 = a
2 A. pi and bi
denote the lateral pairing and buckling in layer i, respectively. Error bars for theparameters derived by LEED in Ref. [12] are ±0.02 A for ∆di,i+1, ±0.05 A for bi
and ±0.07 A for pi. L denotes the thickness of the slab (number of layers). Allvalues are given in A.
Method Ref. ∆d12 ∆d23 ∆d34 ∆d45 ∆d56 b3 b5 p2 p4 p6 aTheory otherTB Ref. [8] – 0.11 0.02 – 0.03 0.00 – – – 0.04 – – 2.770EAM Ref. [9] – 0.25 – 0.07 – 0.01 – – 0.11 – 0.05 0.08 – 2.770SEAM Ref. [10] – 0.26 – 0.06 – – – 0.23 – 0.09 – – 2.770LO-MD Ref. [11] – 0.33 – 0.08 0.03 – – 0.24 – 0.05 0.05 – 2.830Theory this workVASP LDA-15L – 0.26 – 0.01 0.02 0.01 0.00 0.32 0.03 0.04 0.12 0.05 2.764VASP GGA-15L – 0.27 0.00 0.03 0.01 0.01 0.33 0.04 0.06 0.13 0.03 2.817VASP GGA-9L – 0.25 – 0.02 0.03 0.01 – 0.37 – 0.01 0.18 – 2.817FLEUR GGA-9L – 0.23 0.00 0.02 0.00 – 0.37 – 0.01 0.19 – 2.809Exp.LEED Ref. [12] – 0.24 – 0.01 0.02 0.02 – 0.01 0.26 0.03 0.07 0.13 – 2.770LEED Ref. [13] – 0.28 – 0.01 0.02 0.01 0.01 0.17 0.03 0.08 0.10 – 2.770LEED Ref. [14] – 0.26 – 0.18 – 0.12 – 0.01 – 0.32 – 0.13 0.24 – 2.770XRD Ref. [15] – 0.27 – 0.11 – – – – – 0.10 0.08 – 2.770MEIS Ref. [16] – 0.22 0.06 – – – 0.10 – – – – 2.770
and 0.20 A using the FLEUR package. One clearly sees, that both slabs give sim-ilar global numbers, but that for the 9 layer slab the pairing restricted to the topregion only, and is therefore larger. A direct comparison of the present theoreticaldata in Table 2 to the experimental values clearly shows that the present set ofcalculated values yields the best agreement apart from the buckling b3, which isbelieved to be due [12] to the fact experiment sees an average buckling, affectedby the coexistence of different domains in the experimental sample.As for the unreconstructed surface the TB approach is found to be less accuratein this context, while the two EAM calculations, a bulk one and its extension forsurfaces (SEAM), yield reasonable results. The only other ab-initio study amongthose listed in the table, the Local-Orbital Molecular Dynamics (LO-MD) methodfor the first time taking into account the d orbitals, overestimates the compressionof the first two inter-layer spacings and, as a consequence, underestimates thebuckling b3. Although the LO-MD method uses LDA the calculated lattice con-

stant, which one would expect to underestimate the experimetal value, is closer tothe present GGA-PW91 lattice constant that is by ∼ 1.5 % larger than the experi-mental one. So one may conclude that in this context the present approach to in-vestigate the Pt(110) surface using two highly precise ab-initio packages FLEURand VASP, represents the most accurate procedure up to now.
Density of states and STM simulationsIn order to highlight the differences between the ideal Pt(110) and the Pt(110)-(1x2) MRR surface, the layer resolved partial density of states (L)PDOS has beencalculated. The PDOS shown in Fig. 2 is taken from a 9 layer slab FLEUR cal-culation. The PDOS shows that differences between the two structures occur not
−8 −6 −4 −2 0 2Energy (eV)
0
1
2
0
1
2
0
1
2
PD
OS
(sta
tes/
eV−
atom
)
0
1
2
3
Pt(110) d−states
−8 −6 −4 −2 0 2Energy (eV)
0
1
2
0
1
2
0
1
2
0
1
2
3
Pt(110)−(1x2) MRR, d−states
S−1
S−2
S−5
S−1
S−2
S−5
surface (S)surface (S)
Figure 2: Layer-resolved Partial Density of States (PDOS) for p(1x1) Pt(110) andPt(100)-(1x2).
only in the uppermost surface layer but extend fairly deep into the bulk. First of alla big change, both in shape and in energy location, is found for the d states aroundthe Fermi level: The ideal surface shows a pronounced peak right at EF , whichis broadened and shifted away from EF for the reconstructed surface leading to areduction of the PDOS at EF . Furthermore, the narrowing of the surface PDOS,is larger for the Pt(100)-(1x2) structure, best seen for the surface and sub-surfacelayers. For bonding this means a stronger interaction between the atoms in thesurface and those in the sub-surface layer. Therefore, the more compact shape ofthe d states near the surface and the reduction of the PDOS around the Fermi levelleads one to conclude that the Pt(110)-(1x2) MRR surface is found to be more sta-ble. The total energy values confirm this picture, in agreement with experimental
0.0 15.7(001)
0.0
3.0
(110
)
0.0 3.9 7.8 11.8 15.7(001)
0.0
3.0
(110
)
10-5
10-6
11.1
(110
)
0.0 15.7(001)
0.0
3.0
(110
)0.0 3.9 7.8 11.8 15.7
(001)
0.0
3.0
(110
)
10-5
11.1
(110
)
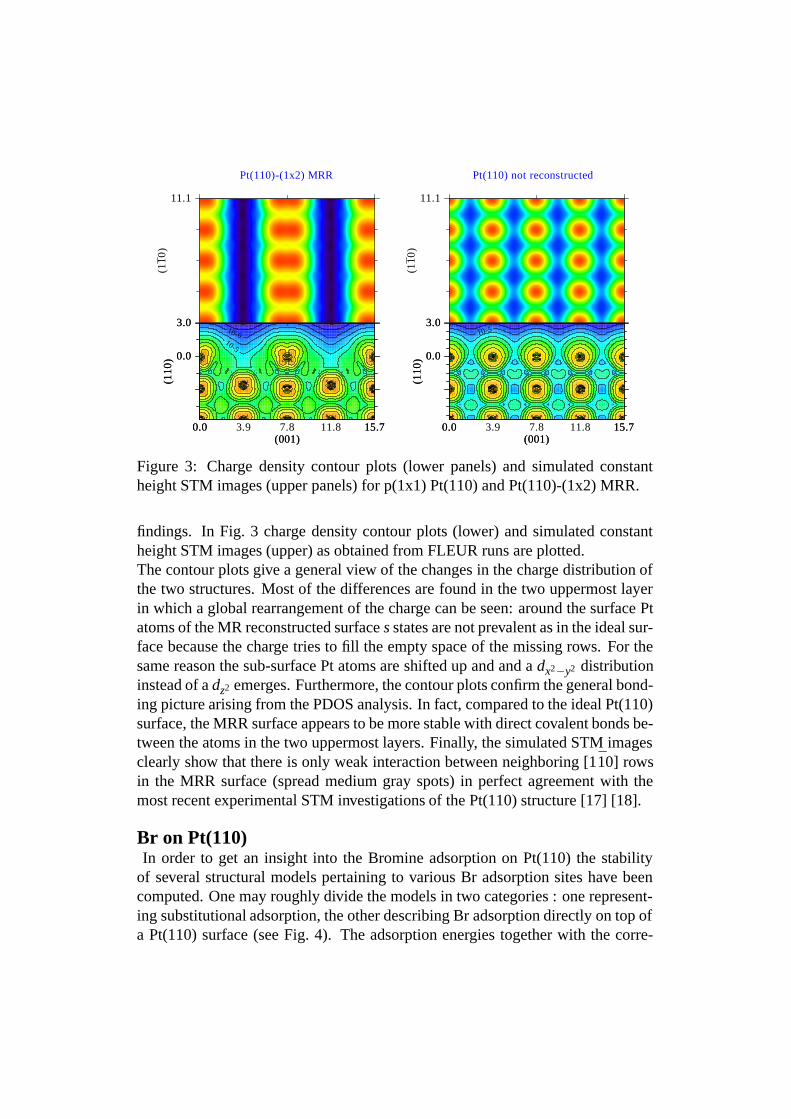
Pt(110)-(1x2) MRR Pt(110) not reconstructed
Figure 3: Charge density contour plots (lower panels) and simulated constantheight STM images (upper panels) for p(1x1) Pt(110) and Pt(110)-(1x2) MRR.
findings. In Fig. 3 charge density contour plots (lower) and simulated constantheight STM images (upper) as obtained from FLEUR runs are plotted.The contour plots give a general view of the changes in the charge distribution ofthe two structures. Most of the differences are found in the two uppermost layerin which a global rearrangement of the charge can be seen: around the surface Ptatoms of the MR reconstructed surface s states are not prevalent as in the ideal sur-face because the charge tries to fill the empty space of the missing rows. For thesame reason the sub-surface Pt atoms are shifted up and and a dx2−y2 distributioninstead of a dz2 emerges. Furthermore, the contour plots confirm the general bond-ing picture arising from the PDOS analysis. In fact, compared to the ideal Pt(110)surface, the MRR surface appears to be more stable with direct covalent bonds be-tween the atoms in the two uppermost layers. Finally, the simulated STM imagesclearly show that there is only weak interaction between neighboring [110] rowsin the MRR surface (spread medium gray spots) in perfect agreement with themost recent experimental STM investigations of the Pt(110) structure [17] [18].
Br on Pt(110)In order to get an insight into the Bromine adsorption on Pt(110) the stability
of several structural models pertaining to various Br adsorption sites have beencomputed. One may roughly divide the models in two categories : one represent-ing substitutional adsorption, the other describing Br adsorption directly on top ofa Pt(110) surface (see Fig. 4). The adsorption energies together with the corre-
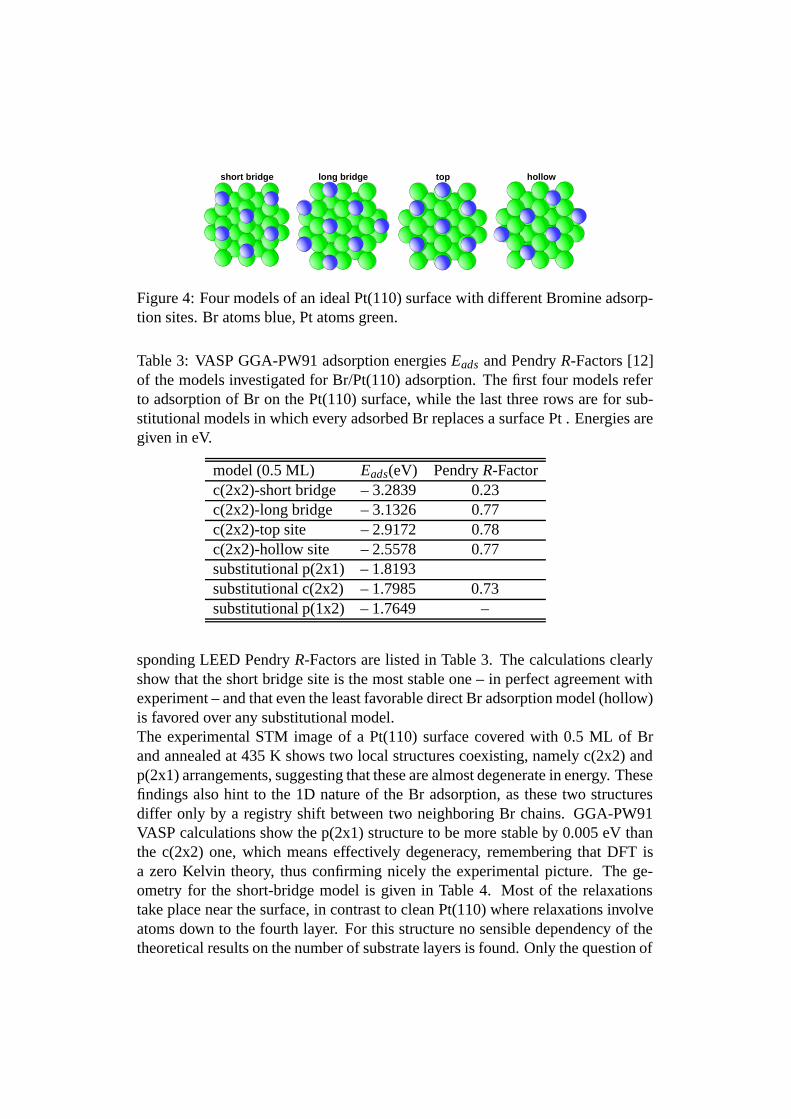
short bridge long bridge hollowtop
Figure 4: Four models of an ideal Pt(110) surface with different Bromine adsorp-tion sites. Br atoms blue, Pt atoms green.
Table 3: VASP GGA-PW91 adsorption energies Eads and Pendry R-Factors [12]of the models investigated for Br/Pt(110) adsorption. The first four models referto adsorption of Br on the Pt(110) surface, while the last three rows are for sub-stitutional models in which every adsorbed Br replaces a surface Pt . Energies aregiven in eV.
model (0.5 ML) Eads(eV) Pendry R-Factorc(2x2)-short bridge – 3.2839 0.23c(2x2)-long bridge – 3.1326 0.77c(2x2)-top site – 2.9172 0.78c(2x2)-hollow site – 2.5578 0.77substitutional p(2x1) – 1.8193substitutional c(2x2) – 1.7985 0.73substitutional p(1x2) – 1.7649 –
sponding LEED Pendry R-Factors are listed in Table 3. The calculations clearlyshow that the short bridge site is the most stable one – in perfect agreement withexperiment – and that even the least favorable direct Br adsorption model (hollow)is favored over any substitutional model.The experimental STM image of a Pt(110) surface covered with 0.5 ML of Brand annealed at 435 K shows two local structures coexisting, namely c(2x2) andp(2x1) arrangements, suggesting that these are almost degenerate in energy. Thesefindings also hint to the 1D nature of the Br adsorption, as these two structuresdiffer only by a registry shift between two neighboring Br chains. GGA-PW91VASP calculations show the p(2x1) structure to be more stable by 0.005 eV thanthe c(2x2) one, which means effectively degeneracy, remembering that DFT isa zero Kelvin theory, thus confirming nicely the experimental picture. The ge-ometry for the short-bridge model is given in Table 4. Most of the relaxationstake place near the surface, in contrast to clean Pt(110) where relaxations involveatoms down to the fourth layer. For this structure no sensible dependency of thetheoretical results on the number of substrate layers is found. Only the question of
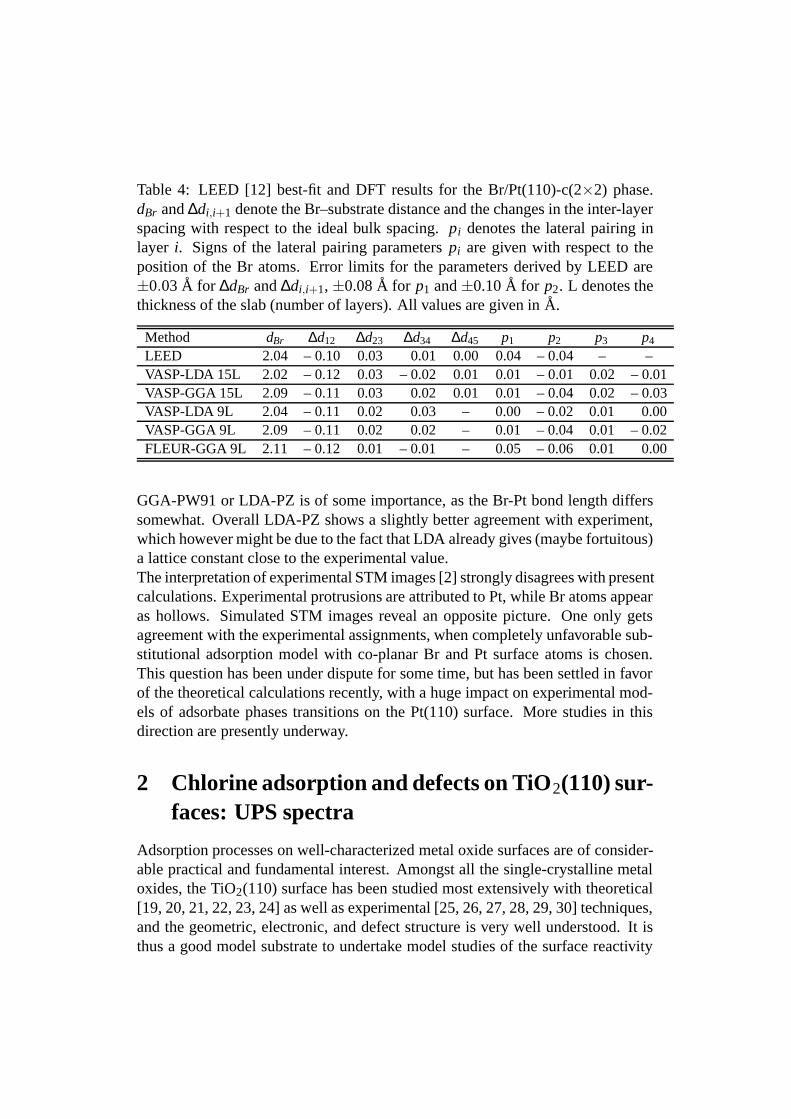
Table 4: LEED [12] best-fit and DFT results for the Br/Pt(110)-c(2×2) phase.dBr and ∆di,i+1 denote the Br–substrate distance and the changes in the inter-layerspacing with respect to the ideal bulk spacing. pi denotes the lateral pairing inlayer i. Signs of the lateral pairing parameters pi are given with respect to theposition of the Br atoms. Error limits for the parameters derived by LEED are±0.03 A for ∆dBr and ∆di,i+1, ±0.08 A for p1 and ±0.10 A for p2. L denotes thethickness of the slab (number of layers). All values are given in A.
Method dBr ∆d12 ∆d23 ∆d34 ∆d45 p1 p2 p3 p4
LEED 2.04 – 0.10 0.03 0.01 0.00 0.04 – 0.04 – –VASP-LDA 15L 2.02 – 0.12 0.03 – 0.02 0.01 0.01 – 0.01 0.02 – 0.01VASP-GGA 15L 2.09 – 0.11 0.03 0.02 0.01 0.01 – 0.04 0.02 – 0.03VASP-LDA 9L 2.04 – 0.11 0.02 0.03 – 0.00 – 0.02 0.01 0.00VASP-GGA 9L 2.09 – 0.11 0.02 0.02 – 0.01 – 0.04 0.01 – 0.02FLEUR-GGA 9L 2.11 – 0.12 0.01 – 0.01 – 0.05 – 0.06 0.01 0.00
GGA-PW91 or LDA-PZ is of some importance, as the Br-Pt bond length differssomewhat. Overall LDA-PZ shows a slightly better agreement with experiment,which however might be due to the fact that LDA already gives (maybe fortuitous)a lattice constant close to the experimental value.The interpretation of experimental STM images [2] strongly disagrees with presentcalculations. Experimental protrusions are attributed to Pt, while Br atoms appearas hollows. Simulated STM images reveal an opposite picture. One only getsagreement with the experimental assignments, when completely unfavorable sub-stitutional adsorption model with co-planar Br and Pt surface atoms is chosen.This question has been under dispute for some time, but has been settled in favorof the theoretical calculations recently, with a huge impact on experimental mod-els of adsorbate phases transitions on the Pt(110) surface. More studies in thisdirection are presently underway.
2 Chlorine adsorption and defects on TiO2(110) sur-faces: UPS spectra
Adsorption processes on well-characterized metal oxide surfaces are of consider-able practical and fundamental interest. Amongst all the single-crystalline metaloxides, the TiO2(110) surface has been studied most extensively with theoretical[19, 20, 21, 22, 23, 24] as well as experimental [25, 26, 27, 28, 29, 30] techniques,and the geometric, electronic, and defect structure is very well understood. It isthus a good model substrate to undertake model studies of the surface reactivity

at the molecular level. In this work, a simple, diatomic molecule, Cl2, has beenchosen as a test molecule. Chlorine is a common impurity in polycrystalline pow-der materials, and its presence is known to affect reaction processes [31]. Thus,a detailed knowledge of adsorption geometries and adsorption-related effects onthe electronic structure might be interesting from an applied view as well.Depending on temperature, experimental results suggest two different adsorptionmodes [32, 33]: Whereas Cl adsorbs along the rows of undercoordinated Ti atoms(Ti[5]) at room temperature, the most favourable adsorption type at elevated T(ca. 200◦ C) is in the O defects of the reduced surface. These adsorption modesshow different behaviour in STM (Scanning Tunneling Microscopy), ISS (ion sur-face scattering) and PES (photoelectron spectroscopy).To investigate these differences, we continued our study of chlorine adsorption onthe rutile surface from ab initio [34], applying the full potential augmented planewave (FLAPW) method [4] in its version for free single slabs. For several modeladsorption geometries of Cl on the stoichiometric and reduced TiO2 (110) surface5 the adsorption energies of were calculated. For these adsorption energetics, thefully relaxed (equilibrium) geometries were taken into account. The optimiza-tion of the geometry was done [34, 35, 36] by force minimization [37]. As seenfrom Fig. 5, we considered two substrate coverage densities (0.5 ML, Fig. 5aband 0.25 ML, Fig. 5c-f, respectively) in the high coverage regime. For all studiedadsorption symmetries, low-coverage adsorption is favoured energetically, whichcorresponds very well with experiment, where a maximum coverage density of≈ 0.4ML was found. Based on the calculated adsorption energies, adsorption ofCl in an O defect of the reduced surface (Fig. 5e), as found at elevated temera-tures by experiment, is the most favourable adsorption type. The absence of suchan adsorption geometry is probably due to kinetic hindering at low T. However,comparison of several adsorption energies, corresponding to a Cl atom which ap-proaches an O vacancy as it diffuses along a Ti[5] row (as shown in Figs. 5b,d,and f) suggests that an activated region exists in the vicinity of each O defect [34],leading an approaching adsorbate atom into the vacancy. It has been shown previ-ously that diffusion of Cl along the Ti rows must be easy, because most probablyall transition states of Cl as it moves along the Ti[5] rows are (at least slightly)bonding [35].STM images were calculated within the Tersoff-Hamann model [6]. Within thismodel, which assumes an s-like wavefunction of the STM tip and elastic tunnelingat the applied tip–sample bias voltage, the tunneling current is proportional to thecharge density of the sample states at the position of the tip apex atom. For thepresent system, the densities of the states contributing to the tunneling current( EF – +1.6 eV) were intrgrated, according te the experimental bias voltage of1.6 V. A simulation of linescans along the bridging O and the Ti [5] rows (along[001] direction) was in excellent agreement with experiment [34]: The adsorbed

(5a) clean stoichiometric (5b) top on Ti
(5c) clean reduced (5d) zig-zag, on Ti
(5e) in O vacancy (5f) in-line, on Ti
[110]
[1-10]
[001][001]
[1-10]
(5a) (5b)
(5c) (5d)
(5e) (5f)
Figure 5: Model adsorption geometries of Cl-adsorption on the stoichiometric andreduced rutile-TiO2 (110) surface. Small dark-red circles: bridging O, small redcircles: all other O ; small light-grey circles: Ti, large white circles: Cl. Onlythe upper part of the slab is shown. Panels (a,c) show the clean substrates, panels(b,d,e,f) the Cl-adsorbed slabs.
Cl atoms appear as large protrusions (large white spots) on the surface, if adsorbedon Ti[5]. Cl atoms lying within the bridging O rows also appear brighter, but thecalculated corrugation shows that this spot must be much smaller than for the low-T adsorption type. It is comparable to the spot corresponding to an O defect of thereduced clean surface (see Fig. 5 c) [21, 38]In order to compare the electronic structure of the valence band with measuredPES data, we calculated valence band photoelectron spectra (VB-PES), shown asbold lines in Fig. 6, within the single-scatterer final state approximation. For theexperimental photon energy of 40.8 eV, the tunneling matrix elements of Ti andCl are smaller than the matrix elements of O by a factor of about ten. Furthermorethey decrease significantly with increasing binding energy. As the calculated spec-tra correspond to the cross-section weighted local densities of states (LDOS), the

intensities of the spectra decrase towards the lower O-p-band edge, in contrast tothe DOS, which is almost constant within the whole energy range of the valenceband. Furthermore, the intensity of the Cl-3p peak at the upper edge of the va-lence band is smaller in the photoelectron spectra than in the DOS because of theCl-3p → (s,d) matrix element. [34]. To summarize, the presented calculations
0
5
0
5
0
5
0
5
10
-25 -20 -15 -10 -5 0 5
ENERGY [eV]
clean
(a)
in O-def
(b)
in-line
(c)
zig-zag
(d)
0
5
10
0
5
10
-25 -20 -15 -10 -5 0 5
ENERGY [eV]
clean
(e)
top
(f)
Figure 6: Densities of states (DOS) and calculated photoelectron spectra (VB-PES) of the clean and Cl-adsorbed rutile surfaces in states/eV. Left panels: re-duced substrate surface, right panels: stoichiometric substrate surfaces. Bold fulllines correspond to the VB-PES, full lines give the total DOS, divided by ten.Dotted lines: partial Cl-DOS, and dashed-dotted lines: partial Ti-DOS of the Tiatom responsible for the STM tunneling current (in DOS/atom). The grey-shadedboxes: energy region of the states which contribute to the tunneling current.
are in excellent agreement with experimental data. They helped to clarify someopen questions about the positions of the Cl adsorbates on the surface and theirvisibility in several experimental (especially the spectroscopy) techniques.

References
[1] K. Swamy, Modification of the geometric and electronic structure of metalsurface by adsorbates, (PhD Thesis, University of Innsbruck, Austria, 1999).
[2] K. Swamy, P. Hanesch, P. Sandl, and E. Bertel, Surf. Sci. 466, 11 (2000).
[3] A. Menzel, K. Swamy, R. Beer, P. Hanesch, E. Bertel, and U. Birkenheuer,Surf. Sci. 454–456, 88 (2000).
[4] E. Wimmer, H. Krakauer, M. Weinert, and A. J. Freeman, Phys. Rev. B24(1981) 864.
[5] G. Kresse and J. Furthmuller, Comput. Mat. Sci. 6, 15 (1996).
[6] J. Tersoff and D. R. Hamann, Phys. Rev. B, 31, 805 (1985);
[7] S.M. Foiles, M.I. Baskes, and M.S. Daw, Phys. Rev. B 33, 7983 (1986).
[8] H.-J. Brocksch and K.H. Bennemann, Surf. Sci. 161, 321 (1985).
[9] S.M. Foiles, Surf. Sci. 191, L779 (1987).
[10] M.I. Haftel, Phys. Rev. B 48, 2611 (1993).
[11] M.-H. Tsai and K.C. Hass, Phys. Rev. B 52, 16420 (1995).
[12] V. Blum, et al., The structure of the c(2×2)-Br/Pt(110) surface, Phys. Rev.B (submitted).
[13] P. Fery, W, Moritz, and D. Wolf, Phys. Rev. B 38, 7275 (1988)
[14] E.C. Sowa, M.A. Van Hove, and D.L. Adams, Surf. Sci. 199, 174 (1988).
[15] E. Vlieg, I.K. Robinson, and K. Kern, Surf. Sci. 233, 248 (1990).
[16] P. Fenter and T. Gustafsson, Phys. Rev B 38, 10197 (1988).
[17] J. Kuntze et al., Surf. Sci. 355, L300 (1996).
[18] K. Swamy, E. Bertel,and I. Vilfan, Surf. Sci. 425, L369 (1999).
[19] D. Vogtenhuber, R. Podloucky, A. Neckel, S. G. Steinemann, and A. J. Free-man, Phys. Rev. B 49, 2099 (1994).
[20] M. Ramamoorthy, R.D. King-Smith, and D. Vanderbilt, Phys. Rev. B 49,16721 (1994).
[21] M. Ramamoorthy, D. Vanderbilt, and R.D. King-Smith, Phys. Rev. B 49,7709 (1994).
[22] N. M. Harrison, X. G. Wang, J. Muscat, and M. Scheffler, Faraday Discuss114, 305 (1999).
[23] P. J. D. Lindan, N. M. Harrison, M. J. Gillan, and J. A. White, Phys. Rev. B55, 15919 (1997).
[24] S. P. Bates, G. Kresse, and M. J. Gillan, Surf. Sci. 385 386 (1997).
[25] Y. Iwasawa, H. Onishi, and K. Fukui, Bull. Chem. Soc. Jap. 68, 2447 (1995).
[26] Oxide Surfaces, Volume 9 in The Chemical Physics of Solid SurfacesD. P. Woodruff (ed.) (Elsevier, Amsterdam, 2001).
[27] U. Diebold, J. F. Anderson, K. O. Ng, and D. Vanderbilt, Phys. Rev. Lett. 77,1322 (1996).
[28] G. Charlton, P. B. Hoowes, C. L. Nicklin, et al., Phys. Rev. Lett. 78, 495(1997).
[29] B. Hird and R. A. Armstrong, Surf. Sci. 420, L131 (1999).
[30] G. N. Raikar, P. J. Hardman, C. A. Muryn, G. van der Laan, P. L. Wincott,G. Thornton, and D. W. Bullett, Solid State Commun 80, 423 (1991).
[31] C. N. Satterfield, Heterogeneous Catalysis in Industrial Practice (McGraw-Hill, Inc., New York 1991).
[32] U. Diebold, W. Hebenstreit, G. Leonardelli, M. Schmid, and P. Varga,Phys. Rev. Lett. 81, 405–408 (1998).
[33] E. L. D. Hebenstreit, W. Hebenstreit, H. Geisler, C. A. Ventrice Jr.,P. T. Sprunger, and U. Diebold, Surf. Sci. submitted (2001).
[34] D. Vogtenhuber, R. Podloucky, J. Redinger, E.L.D. Hebenstreit, W. Heben-streit, U. Diebold, Phys. Rev. B, in print.
[35] D. Vogtenhuber, R. Podloucky, J. Redinger, Surf. Sci. 454–456, 369 (2000).
[36] D. Vogtenhuber, to be published.
[37] R. Yu, D. Singh, and H. Krakauer, Phys. Rev. B43 (1991) 6411; A. DiPom-ponio, A. Continenza, R. Podloucky and J. Vackar, Phys. Rev. B53 (1996)9505.
[38] D. Vogtenhuber, R. Podloucky and J. Redinger, to be published.