electronic spectroscopy of oxygen atoms trapped in solid xenon
TRANSCRIPT

Electronic spectroscopy of oxygen atoms trapped in solid xenon W. G. Lawrence and V. A. Apkarian Department of Chemistry, University of California, Irvine, California 92717
(Received 16 March 1992; accepted 28 August 1992)
The electronic spectroscopy of oxygen atoms trapped in solid xenon are reported. Excitation of the solid between 220 and 260 nm leads to two main emissions centered at 3.35 and 1.65 eV, both of which arise from the same upper state. The excitations are assigned to charge- transfer absorptions in interstitial Oh sites; the emitting state, which has a lifetime of 227 ns, is assigned to Xe+O- (‘xc+). An avoided crossing between the ionic and covalent Ix+ states, and differential solvation of these states, explains the main trends of the spectroscopy of XeO in the gas and condensed phases. Implications regarding ionic and
- covalent many-body surfaces are discussed.
I. INTRODUCTION
The electronic spectroscopy of atomic impurities iso- lated in crystalline rare-gas solids can be used to probe the many-body potentials that are, in principle, related to the guest-host pair potentials. For weakly interacting systems, reliable constructs for developing many-body surfaces from known pair potentials would be highly useful in dynamical studies. In the ground electronic state, the interaction be- tween most atomic species and rare-gas atoms is domi- nated by dispersive forces, as such, in the case of guest atoms of ‘Sa symmetry, pairwise additivity is expected to be a good approximation. For all other states site symme- try splittings arise leading to multisurface potentials and, therefore, a simple pair-wise additivity is an inappropriate approximation. By taking advantage of high-symmetry sites of isolation in crystalline rare-gas solids, it is, in prin- ciple, possible to evaluate the extent of such interactions. In the case of excited electronic states, charge-transfer con- tributions become important. In this context, the investi- gation of guest-host charge-transfer states and their rela- tion to the gas-phase ion-pair states are quite informative. Charge delocalization is essential for the description of charge-transfer states of a guest atom isolated in a sym- metric environment of equivalent host atoms. Whether de- localization is limited to the immediate neighbors’ or better described as truly extended states of the solid2 depends on the details of electronic structure of both the guest atom and the host solid. In solids doped with atomic halogen2 and hydrogen,3 delocalized charge-transfer states are ob- served which are understood in the framework of a Ryd- berg progression of holes: a negative ion core and an or- biting holea Those systems, except for the inversion of signs, are isoelectronic with Rydberg excitations in alkali atoms. Extension of the same analogy to oxygen-doped solid xenon leads to the possibility of observing two-hole progressions, mirroring the isoelectronic alkaline earth ex- citations. Although the pertinent spectral range has not yet been studied to identify such resonances, it is clear that in the lowest-lying charge-transfer states in the case of O/Xc, delocalization is limited to the immediate nearest neigh- bors and, as such, directly related to the diatomic charge transfer configuration.
The electronic spectroscopy of oxygen atoms trapped in rare-gas solids, in principle, allows the investigation of a variety of potential surfaces arising from the interaction of O( 3P, ‘D, ‘S) with Rg( ‘S). The relevant Rg-0 pair po- tentials have been characterized theoretically.‘-* Gas-phase spectroscopic investigations have only yielded fragmentary information about these potentials.’ Using the gas-phase theoretical pair potentials, crystal-field potentials have been constructed to describe 0 atoms trapped in Ne, Ar, Kr, and Xe,“>” and these surfaces have been used to pro- vide a qualitative interpretation of observed emissions. In the case of 0 atoms trapped in matrix argon and krypton, two emissions are observed which are assigned to the for- mally dipole forbidden transition of atomic parentage 0(‘S * ‘D), which splits in the octahedral trapping site into two components ‘A,, -+ ‘Eg and ‘Ai, -+ ’ Tzrl’ The same behavior is expected in all rare-gas solids. Although two bands are observed in Ne they are assigned to the atomic O( ‘S + ‘D) and 0 ( ‘D + 3P) transitions, in con- tradiction with the theory.12 In the case of O/Xc, Mona- han and Rehn have observed a broad emission which peaks at 750 nm and have assigned it to 0( ‘D + 3P).‘3 This assignment is also in contradiction with theory, according to which the ‘D relaxation should be strictly nonradiative and the crystal-field split transitions, ‘A,, -+ ‘Eg, ‘A i + ‘Tzs should be prominent with a splitting of 0.07 eV. 16
The discrepancies in these studies are in part ascribed to the nature of the transitions which could lead to experi- mental difficulties. Since the transitions are formally dipole forbidden, matrix enhancement of as much as 6 orders of magnitude for the radiative rates are to be invoked to ex- plain the observed spectra. Variations in observed lifetime depending on method of preparation, sample temperature, dilution, and nature of precursor are ascribed to the details of the perturbations that lead to these induced transi- tions.‘4’15 Note that all of these discussions are based on data obtained by VUV excitation of the solids at energies above 9 eV.‘2-‘7 At these excitation energies the charge- transfer states become accessible. Yet the possible contri- butions of these ionic states to the observed emissions has not been considered until very recently.”
The gap between gas-phase XeO- and O-doped solid xenon is bridged by studies of XeO doped in lighter rare-
J. Chem. Phys. 97 (4), 15 August 1992 0021-9606/92/l 62229-08$006.00 @ 1992 American Institute of Physics 2229 Downloaded 17 Feb 2004 to 128.200.47.19. Redistribution subject to AIP license or copyright, see http://jcp.aip.org/jcp/copyright.jsp
gas solids. The ionic states of XeG in solid Ar have been observed, first in absorption by Ault and Andrews18 and subsequently studied by laser-induced fluorescence by Goodman et aLI Higher-lying ionic states in the same system between 8.6 and 10 eV were observed by Scott and Walker.20 We argue that the emission spectrum of UV excited O/Xc is due to the charge-transfer transitions which would correlate with the diatomic Xe+O-(‘Z+) -+XeO( 1 ‘8+ ‘Il) transitions. While the , emitting excited state corresponds to a localized diatomic configuration with minor delocalization contributions, the lower states in these transitions correspond to the neutral many-body cage potential surfaces. Due to the eccentric binding of the 0 atom in the ionic state, a very different portion of the cage potentials are explored in these emis- sions as compared to the expected neutral-neutral emis- sions observed in the lighter rare gases.
The emission spectra to be discussed are commonly observed in solid Xe after intense ultraviolet laser irradia- tion without the deliberate introduction of oxygen atom precursors. Atmospheric contaminants at the ppm level are the most common impurities. The same spectra are also observed in 02-doped solids. In our controlled experiments we rely on photodissociation of N20. In all cases the emis- sion spectra are observed to develop with irradiation time by an indiscriminate two-photon process. The kinetics of the process is consistent with two-photon access of excitons and subsequent dissociation upon exciton-molecule en- counters. Detailed kinetic studies of this process will be presented in a forthcoming publication.21
II. EXPERIMENT
The experimental studies were conducted in 1 cc free- standing polycrystalline xenon solids. The solids are pre- pared by deposition of a premixed gas sample of NzO in xenon (A), through a Pyrex mold, onto the tip of a closed cycle cryostat. A backing pressure of -200 Torr is used during the deposition. The process yields optically clear solids shaped by the mold. The Pyrex mold is then retracted, leaving behind the free-standing solid. Xenon of 99.999% stated purity (Cryogenic Rare Gases) and NzO of 99% stated purity (Matheson) were used without fur- ther purification.
The frequency-doubled output of an excimer pumped dye laser was used to dissociate the N20 and to excite the xenon oxide charge-transfer states. Spectra were recorded using a $ m monochromator and photomultiplier tube (PMT), or a i m polychromator and optical multichannel analyzer (OMA) . Time-resolved dispersed fluorescence was recorded with a digitizing oscilloscope (Tektronix 2440) which was interfaced to a personal computer using the monochromator PMT combination. Excitation spectra were taken at discrete excitation wavelengths between 220 and 260 nm using five laser dyes. At each excitation wave- length, the emission spectrum was recorded using the OMA. The intensities of the 370 and 750 nm emissions were ratioed with the laser power to obtain the excitation spectra of both emissions simultaneously. Continuous ex-
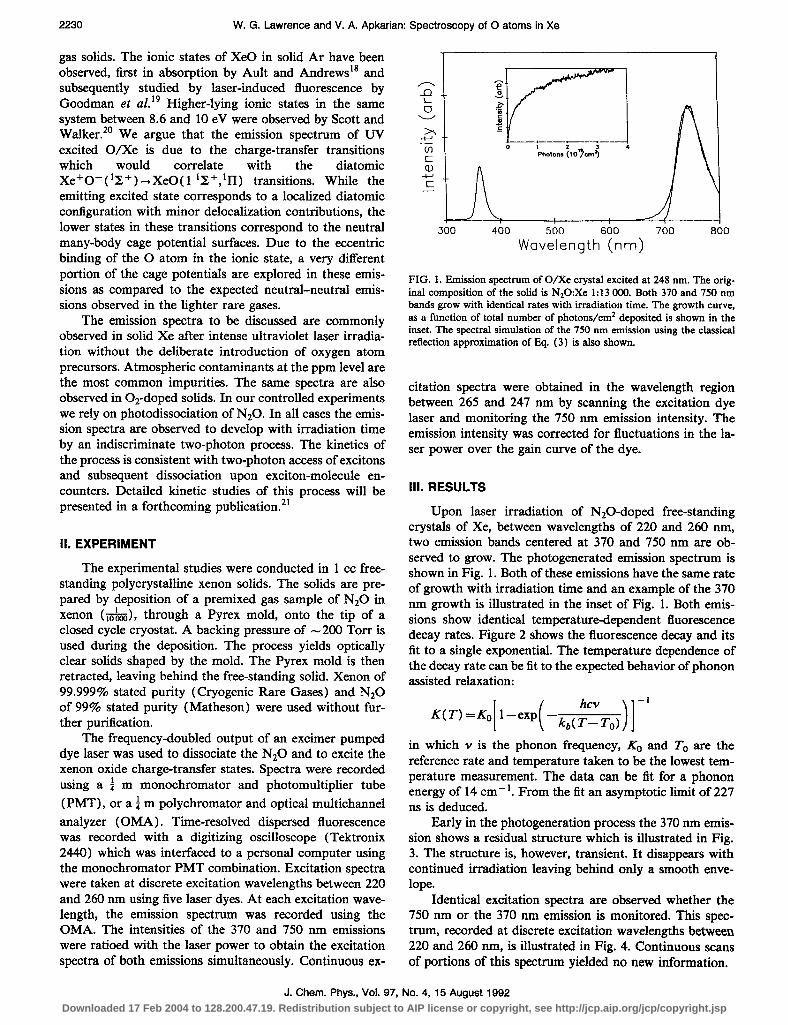
as a function of total number of photons/cm* deposited is shown in the inset. The spectral simulation of the 750 nrn emission using the classical reflection approximation of IQ. (3) is also shown.
citation spectra were obtained in the wavelength region between 265 and 247 nm by scanning the excitation dye laser and monitoring the 750 nm emission intensity. The emission intensity was corrected for fluctuations in the la- ser power over the gain curve of the dye.
FIG. 1. Emission spectrum of O/Xc crystal excited at 248 nm. The orig- inal composition of the solid is N20:Xe 1:13 000. Both 370 and 750 nm bands grow with identical rates with irradiation time. The growth curve,
Ill. RESULTS
2230 W. G. Lawrence and V. A. Apkarian: Spectroscopy of 0 atoms in Xe
400 500 600 700 800 Wavelength (nm)
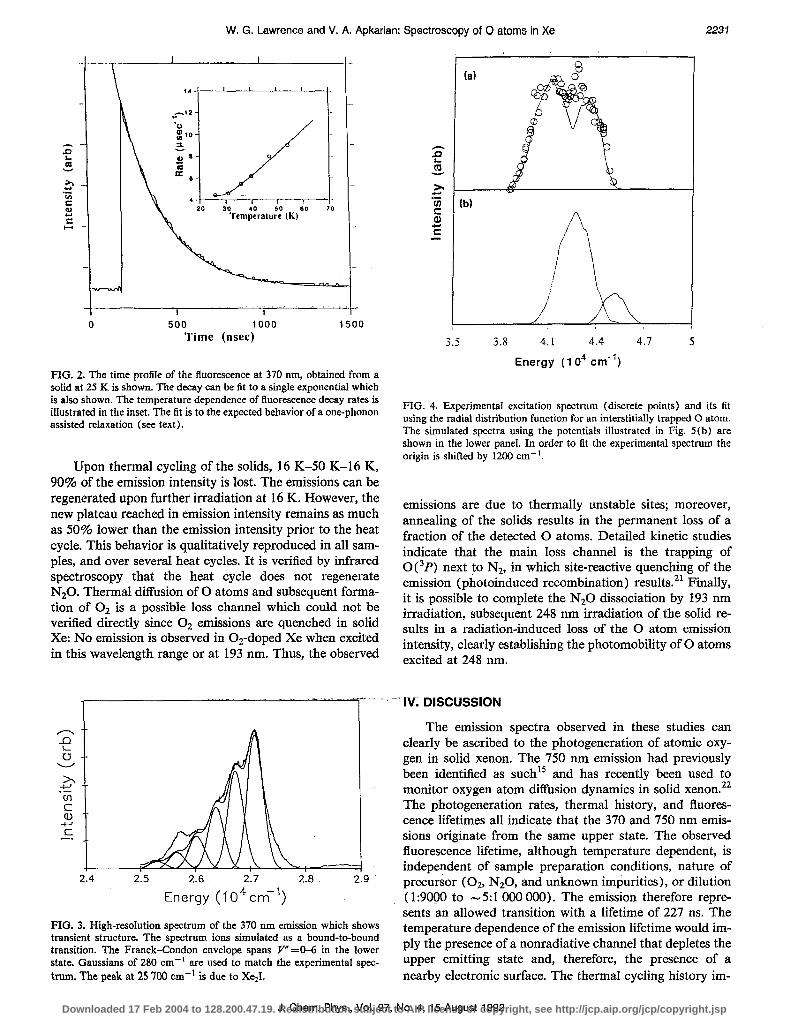
Upon laser irradiation of N20-doped free-standing crystals of Xe, between wavelengths of 220 and 260 nm, two emission bands centered at 370 and 750 nm are ob- served to grow. The photogenerated emission spectrum is shown in Fig. 1. Both of these emissions have the same rate of growth with irradiation time and an example of the 370 nm growth is illustrated in the inset of Fig. 1. Both emis- sions show identical temperature-dependent fluorescence decay rates. Figure 2 shows the fluorescence decay and its fit to a single exponential. The temperature dependence of the decay rate can be fit to the expected behavior of phonon assisted relaxation:
in which Y is the phonon frequency, K. and To are the reference rate and temperature taken to be the lowest tem- perature measurement. The data can be fit for a phonon energy of 14 cm-‘. From the fit an asymptotic limit of 227 ns is deduced.
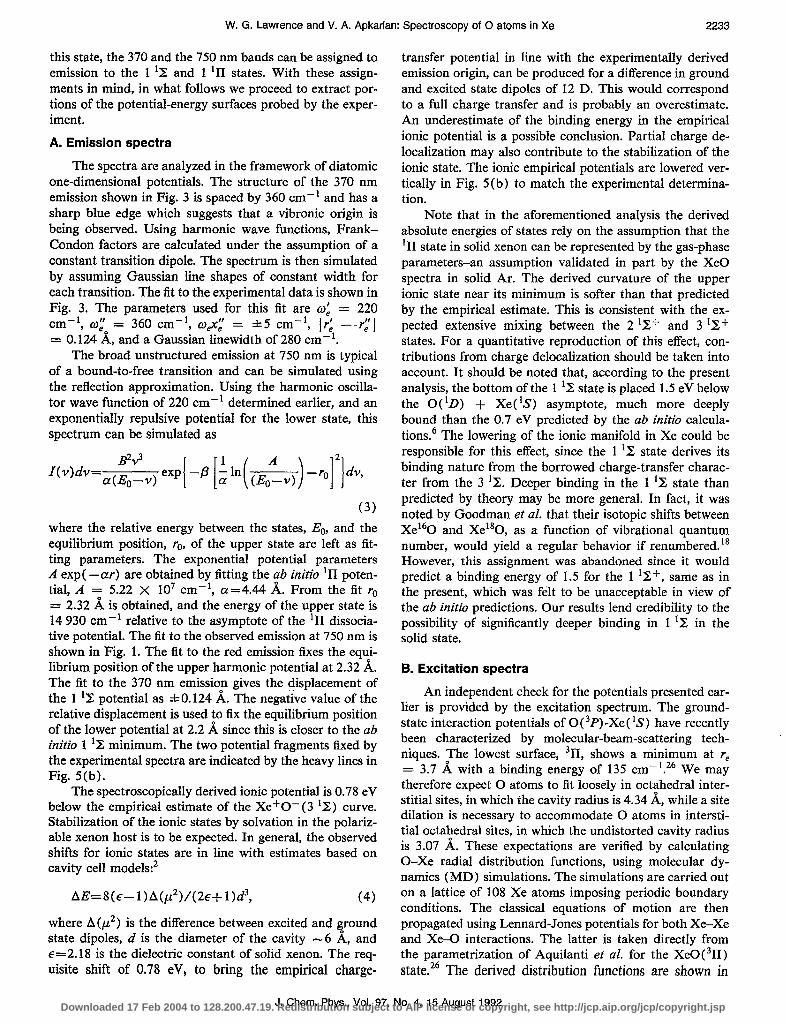
Early in the photogeneration process the 370 nm emis- sion shows a residual structure which is illustrated in Fig. 3. The structure is, however, transient. It disappears with continued irradiation leaving behind only a smooth enve- lope.
Identical excitation spectra are observed whether the 750 nm or the 370 nm emission is monitored. This spec- trum, recorded at discrete excitation wavelengths between 220 and 260 nm, is illustrated in Fig. 4. Continuous scans of portions of this spectrum yielded no new information.
J. Chem. Phys., Vol. 97, No. 4, 15 August 1992 Downloaded 17 Feb 2004 to 128.200.47.19. Redistribution subject to AIP license or copyright, see http://jcp.aip.org/jcp/copyright.jsp
W. G. Lawrence and V. A. Apkarian: Spectroscopy of 0 atoms in Xe 2231
0 500 1000 Time (nsec)
1500
FIG. 2. The time profile of the fluorescence at 370 nm, obtained from a solid at 25 K is shown. The decay can be fit to a single exponential which is also shown. The temperature dependence of fluorescence decay rates is illustrated in the inset. The fit is to the expected behavior of a one-phonon assisted relaxation (see text).
Upon thermal cycling of the solids, 16 K-50 K-16 K, 90% of the emission intensity is lost. The emissions can be regenerated upon further irradiation at 16 K. However, the new plateau reached in emission intensity remains as much as 50% lower than the emission intensity prior to the heat cycle. This behavior is qualitatively reproduced in all sam- ples, and over several heat cycles. It is verified by infrared spectroscopy that the heat cycle does not regenerate N20. Thermal diffusion of 0 atoms and subsequent forma- tion of O2 is a possible loss channel which could not be verified directly since O2 emissions are quenched in solid Xe: No emission is observed in 02-doped Xe when excited in this wavelength range or at 193 nm. Thus, the observed
. . .__ _~ --e-.
1
x .-f”_ u-l 5 sz -
2.4 2.5 2.6 2.7 2.8 2.9
Energy (1 O4 m-T’)
FIG. 3. High-resolution spectrum of the 370 nm emission which shows transient structure. The spectrum ions simulated as a bound-to-bound transition. The Franck-Condon envelope spans V”=O-6 in the lower state. Gaussians of 280 cm-’ are used to match the experimental spec- trum. The peak at 25 700 cm-’ is due to XqI.
(b) f / \ -Aa+
3.5 3.8 4.1 4.4 4.7 5
Energy (1 O4 cm-‘)
FIG. 4. Experimental excitation spectrum (discrete points) and its fit using the radial distribution function for an interstitially trapped 0 atom. The simulated spectra using the potentials illustrated in Fig. 5(b) are shown in the lower panel. In order to Et the experimental spectrum the origin is shifted by 12M) cm-‘.
emissions are due to thermally unstable sites; moreover, annealing of the solids results in the permanent loss of a fraction of the detected 0 atoms. Detailed kinetic studies indicate that the main loss channel is the trapping of O(3P) next to N2, in which site-reactive quenching of the emission (photoinduced recombination) results.21 Finally, it is possible to complete the N20 dissociation by 193 nm irradiation, subsequent 248 nm irradiation of the solid re- sults in a radiation-induced loss of the 0 atom emission intensity, clearly establishing the photomobility of 0 atoms excited at 248 nm.
_’ IV. DISCUSSION
The emission spectra observed in these studies can clearly be ascribed to the photogeneration of atomic oxy- gen in solid xenon. The 750 nm emission had previously been identified as such15 and has recently been used to monitor oxygen atom diffusion dynamics in solid xenon.22 The photogeneration rates, thermal history, and fluores- cence lifetimes all indicate that the 370 and 750 nm emis- sions originate from the same upper state. The observed fluorescence lifetime, although temperature dependent, is independent of sample preparation conditions, nature of precursor ( 02, N20, and unknown impurities), or dilution ( 1:9000 to - 5: 1 000 000). The emission therefore repre- sents an allowed transition with a lifetime of 227 ns. The temperature dependence of the emission lifetime would im- ply the presence of a nonradiative channel that depletes the upper emitting state and, therefore, the presence of a nearby electronic surface. The thermal cycling history im-
J. Chem. Phys., Vol. 97, No. 4, 15 August 1992 Downloaded 17 Feb 2004 to 128.200.47.19. Redistribution subject to AIP license or copyright, see http://jcp.aip.org/jcp/copyright.jsp

W. G. Lawrence and V. A. Apkarian: Spectroscopy of 0 atoms in Xe 2232
5
4 ^ E 03
b T a. $2
15
1
0
\I/ ’ 2’1
3 ‘E’ _- 2’1’
~
‘A
‘I
, ‘I’
‘x I ‘I ‘\, L
’ (a)! 5
Ij 4
X..O”S t
3
F 2 -X~,o_l’DI
- 1 1
:, ,, :, ., , ‘r ‘, ; :s ‘, : i _:‘, ‘, ‘, I ‘L’ ‘~ II .- ,.- .:z x.to(bm
--+c$” 1 2 ,” ,,,A 5 6 ’ 2 R”,..,d 5 6
FIG. 5. (a) Gas-phase pair potentials for XeO. For the covalent states, the ab initio curves of Ref. 6 are used. The ionic ‘It curve is from Ref. 24. The ionic ‘Z state is empirically devised (see text). (b) Potentials in solid Xe. The gas phase 1 ‘II surface is used without any modification. The fragments of curves derived experimentally from emission spectra are shown as heavy lines. The ionic curves are vertically lowered to match the experimentally determined Xe+O- minimum; in effect these are the solvated ionic potentials in solid Xe.
plies that not all 0 atoms are probed: either optically in- accessible or because emission from some sites is com- pletely quenched.
The covalent Xe-0 pair potentials from the ab initio calculations of Dunning and Hay are collected in Fig. 5(a). These potentials are in qualitative agreement with the spectroscopic data. Spectral analyses have provided re- fined parameters for the 2 ‘Z+ and 1 ‘II potentials which, in the gas phase, are bound by 690 and 460 cm-‘, respec- tively.’ However, the most deeply bound 1 ‘Z+ state has defied rigorous analysis due to its extensive predissocia- tion.’ In the case of XeO isolated in solid Ar, the extrap- olated Morse oscillator well depth for the 1 ‘II state is found to be 505 cm-‘, in good agreement with the gas phase.t8 Thus, although at the time it was believed that the 1 ‘lI state is stabilized relative to the gas phase,18 it is now clear that this state is essentially unperturbed by the Ar environment. As in the gas phase, the solid state studies have not allowed a clear interpretation of transitions ter- minating on the 1 ‘Z state. In both cases, extensive predis- sociation via several crossings is believed to give highly irregular spectra. As such, the theoretical curves remain as the main guideline for this potential. It should, however, be noted that in the case of XeO the adiabatic states are only well defined in terms of R, the total angular momentum projection. Accordingly, all of the crossings between the 1 ‘B state and the triplet states result in avoided crossings.
Broad unstructured emission from the ionic states of Xe+O- at 235 nm have been observed in the gas phase and assigned to the Xe+O- (2 311) -. Xc0 (1 311) transi- tion.23*24 This ionic state, as parametrized from the gas phase emission spectrum,24 is also shown in Fig. 5(a). Note that Xe+O- is isoelectronic with IF and, as such, the lowest-energy state should be the ‘Z+. An estimate for this surface is possible under the assumption that the Xe+O- charge-transfer states can be described by a sum of contri- butions from the IF core and a Coulombic interaction be-
xco/xc 3’2‘
I!zl 2’2’ cl PIG. 6. Schematic representation of the effect of differential solvation between ionic and covalent surfaces: (a) gas phase; (b) in solid Ar, (c) in solid Xe.
tween the ion pair. The empirical form of a sum of Morse, exponential repulsion, and Coulombic attraction are taken to represent the relevant surfaces:
V(311)xe+o-= V(311)lF+A+B exp( -br) -e’/r, (1)
V(1Z)x,+o-=Y(1Z)rr+A+Bexp(--br)-e2/r, (2) in which A= 10.6 eV is the difference between ionization potential of Xe and electron affinity of 0; for the V(311)1F and V( ‘Z)rr the Morse forms are adopted from the gas phase IF(A) and IF(X) parameters.25 The Morse parameters used for this calculation were De=7638 cm-‘, /3=2.135 A-‘, and r, = 1.91 A for the IF(A) state, and De=23 229 cm-‘, p=1.85 A;-‘, and r, = 1.91 A for the IF(X) state. Using the Xe0(311) potential given by Simons et al., the exponential repulsion parameters B and b are extracted from Eq. (1) as 6.4 X lo6 cm-’ and 2.52 A-‘, respectively. These parameters are then used to pro- duce a best estimate for the gas phase V( ‘Z)xe+o- which is also shown in Fig. 5(a) and termed 3 lx+.
Although approximate, the charge-transfer potentials generated by this scheme are useful for the description of the spectroscopy and dynamics of these ionic states. It should be clear, for example, that an avoided crossing is to be expected between the ionic 3 ‘Z+ and neutral 2 ‘8+ states. In the gas phase the absence of emission from the singlet ionic state and the observation of aurora1 emis- sions23 are good indications that the crossing occurs above the neutral 2 ‘z+ potential minimum, leaving Xe+O- ( 311) as the lowest bound charge-transfer state. In solid Ar, we may expect the ionic state to be lowered by solvation and, therefore, to create a double minimum which is shown schematically in Fig. 6. Such a state would be consistent with the experimental observations in Ar, in which in addition to the aurora1 lines UV bands are ob- served to emanate from an ionic state, termed F, which is indirectly populated from the initially pumped ionic state, presumably the Xe+O- ( 311> surface.19 Moreover, it is ob- served that the F state is thermally unstable, and under- goes nonradiative relaxation to populate the neutral 2 ‘B state.t8 Vertical absorption to above the crossing point and subsequent curve crossings to populate both the ionic and covalent minima would be consistent with the observed photodynamics in solid Ar. In solid Xe we may expect the ionic singlet state to be further stabilized to form a real minimum, as shown schematically in Fig. 6(c). With the assumption that the observed spectra are entirely due to
J. Chem. Phys., Vol. 97, No. 4, 15 August 1992 Downloaded 17 Feb 2004 to 128.200.47.19. Redistribution subject to AIP license or copyright, see http://jcp.aip.org/jcp/copyright.jsp
this state, the 370 and the 750 nm bands can be assigned to emission to the 1 *B and 1 ‘II states. With these assign- ments in mind, in what follows we proceed to extract por- tions of the potential-energy surfaces probed by the exper- iment.
A. Emission spectra
The spectra are analyzed in the framework of diatomic one-dimensional potentials. The structure of the 370 nm emission shown in Fig. 3 is spaced by 360 cm-’ and has a sharp blue edge which suggests that a vibronic origin is being observed. Using harmonic wave functions, Frank- Condon factors are calculated under the assumption of a constant transition dipole. The spectrum is then simulated by assuming Gaussian line shapes of constant width for each transition. The fit to the experimental data is shown in Fig. 3. The parameters used for this fit are w: = 220 cm-‘, 0.1: = 360 cm-‘, o&’ = *5 cm-‘, 1 ri - ri 1 = 0.124 A;, and a Gaussian linewidth of 280 cm-‘.
The broad unstructured emission at 750 nm is typical of a bound-to-free transition and can be simulated using the reflection approximation. Using the harmonic oscilla- tor wave function of 220 cm-’ determined earlier, and an exponentially repulsive potential for the lower state, this spectrum can be simulated as
B2y3 I(v)dv= dEo-~> exp( 4 [aln( cE,A_y,)-ro]2)d~, (3)
where the relative energy between the states, EO, and the equilibrium position, ro, of the upper state are left as fit- ting parameters. The exponential potential parameters A exp( -or) are obtained by fitting the ab initiu ‘II poten- tial, A = 5.22 X 10’ cm-‘, a=444 A. From the fit r. = 2.32 8, is obtained, and the energy of the upper state is 14 930 cm-’ relative to the asymptote of the ‘II dissocia- tive potential. The fit to the observed emission at 750 nm is shown in Fig. 1. The fit to the red emission fixes the equi- librium position of the upper harmonic potential at 2.32 A. The fit to the 370 nm emission gives the displacement of the 1 ‘Z potential as f 0.124 A. The negative value of the relative displacement is used to fix the equilibrium position of the lower potential at 2.2 A since this is closer to the ab initio 1 ‘I: minimum. The two potential fragments fixed by the experimental spectra are indicated by the heavy lines in Fig. 5(b).
The spectroscopically derived ionic potential is 0.78 eV below the empirical estimate of the Xe+O-(3 ‘2) curve. Stabilization of the ionic states by solvation in the polariz- able xenon host is to be expected. In general, the observed shifts for ionic states are in line with estimates based on cavity cell models:2
AE=8(e- l>A(p2>/(2e+ 1>d3, (4)
where A(p2) is the difference between excited and ground state dipoles, d is the diameter of the cavity -6 A, and e=2.18 is the dielectric constant of solid xenon. The req- uisite shift of 0.78 eV, to bring the empirical charge-
transfer potential in line with the experimentally derived emission origin, can be produced for a difference in ground and excited state dipoles of 12 D. This would correspond to a full charge transfer and is probably an overestimate. An underestimate of the binding energy in the empirical ionic potential is a possible conclusion. Partial charge de- localization may also contribute to the stabilization of the ionic state. The ionic empirical potentials are lowered ver- tically in Fig. 5(b) to match the experimental determina- tion.
Note that in the aforementioned analysis the derived absolute energies of states rely on the assumption that the ‘II state in solid xenon can be represented by the gas-phase parameters-an assumption validated in part by the XeO spectra in solid Ar. The derived curvature of the upper ionic state near its minimum is softer than that predicted by the empirical estimate. This is consistent with the ex- pected extensive mixing between the 2 ‘Z+ and 3 ‘8+ states. For a quantitative reproduction of this effect, con- tributions from charge delocalization should be taken into account. It should be noted that, according to the present analysis, the bottom of the 1 ‘Z state is placed 1.5 eV below the O( ‘0) + Xe( ‘S) asymptote, much more deeply bound than the 0.7 eV predicted by the ab initio calcula- tions.6 The lowering of the ionic manifold in Xe could be responsible for this effect, since the 1 ‘Z state derives its binding nature from the borrowed charge-transfer charac- ter from the 3 ‘2. Deeper binding in the 1 ‘Z state than predicted by theory may be more general. In fact, it was noted by Goodman et al. that their isotopic shifts between Xe160 and Xe180, as a function of vibrational quantum number, would yield a regular behavior if renumbered.18 However, this assignment was abandoned since it would predict a binding energy of 1.5 for the 1 tZ+, same as in the present, which was felt to be unacceptable in view of the ab initio predictions. Our results lend credibility to the possibility of significantly deeper binding in 1 ‘B in the solid state.
B. Excitation spectra
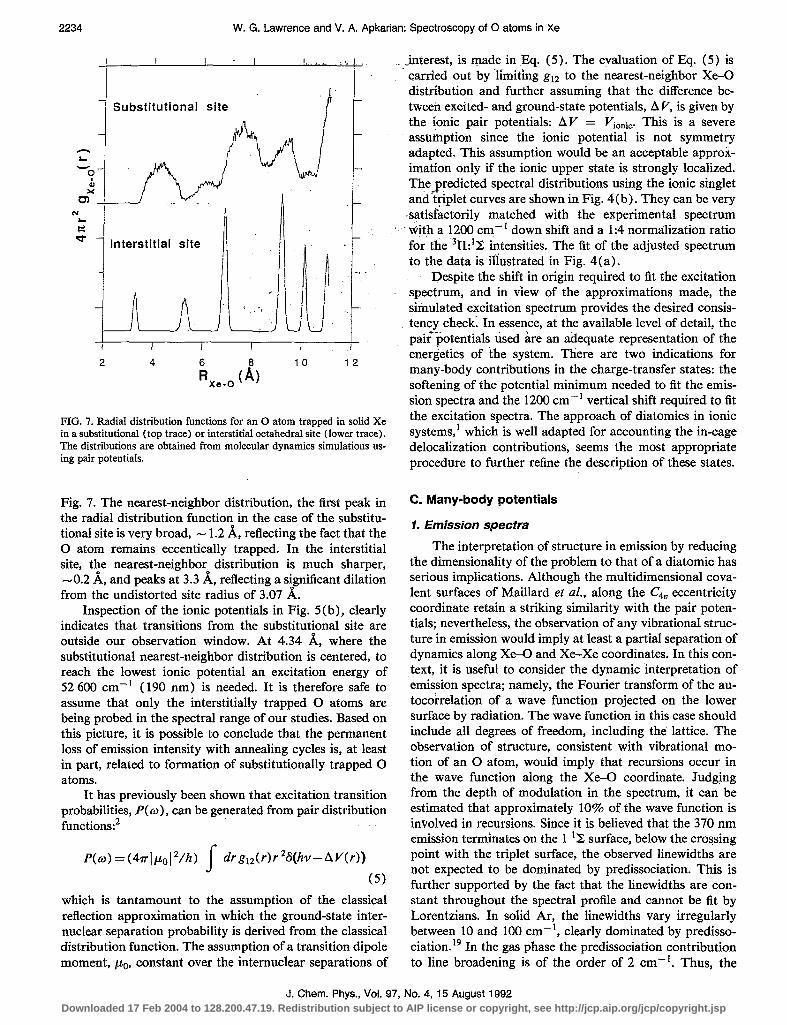
An independent check for the potentials presented ear- lier is provided by the excitation spectrum. The ground- state interaction potentials of 0 (3P) -Xe ( ‘S) have recently been characterized by molecular-beam-scattering tech- niques. The lowest surface, 311, shows a minimum at r, = 3.7 A with a binding energy of 135 cm-1.26 We may therefore expect 0 atoms to fit loosely in octahedral inter- stitial sites, in which the cavity radius is 4.34 A, while a site dilation is necessary to accommodate 0 atoms in intersti- tial octahedral sites, in which the undistorted cavity radius is 3.07 A. These expectations are verified by calculating 0-Xe radial distribution functions, using molecular dy- namics (MD) simulations. The simulations are carried out on a lattice of 108 Xe atoms imposing periodic boundary conditions. The classical equations of motion are then propagated using Lennard-Jones potentials for both Xe-Xe and Xe-0 interactions. The latter is taken directly from the parametrization of Aquilanti et al. for the Xe0(311) state.% The derived distribution functions are shown in
W. G. Lawrence and V. A. Apkarian: Spectroscopy of 0 atoms in Xe 2233
J. Chem. Phys., Vol. 97, No. 4, 15 August 1992 Downloaded 17 Feb 2004 to 128.200.47.19. Redistribution subject to AIP license or copyright, see http://jcp.aip.org/jcp/copyright.jsp
2234 W. G. Lawrence and V. A. Apkarian: Spectroscopy of 0 atoms in Xe
i ’ I L !- i:.. .A I
I i Substitutional site
I I I I I 1 I
2 4 Fi ,..,(b lo l2
FIG. 7. Radial distribution functions for an 0 atom trapped in solid Xe in a substitutional (top trace) or interstitial octahedral site (lower trace). The distributions are obtained from molecular dynamics simulations us- ing pair potentials.
Fig. 7. The nearest-neighbor distribution, the first peak in the radial distribution function in the case of the substitu- tional site is very broad, - 1.2 A, reflecting the fact that the 0 atom remains eccentically trapped. In the interstitial site, the nearest-neighbor distribution is much sharper, -0.2 A, and peaks at 3.3 A, reflecting a significant dilation from the undistorted site radius of 3.07 A.
Inspection of the ionic potentials in Fig. 5(b), clearly indicates that transitions from the substitutional site are outside our observation window. At 4.34 A, where the substitutional nearest-neighbor distribution is centered, to reach the lowest ionic potential an excitation energy of 52 600 cm-’ (190 nm) is needed. It is therefore safe to assume that only the interstitially trapped 0 atoms are being probed in the spectral range of our studies. Based on this picture, it is possible to conclude that the permanent loss of emission intensity with annealing cycles is, at least in part, related to formation of substitutionally trapped 0 atoms.
It has previously been shown that excitation transition probabilities, P(o), can be generated from pair distribution functions:2
~(0)=(4+,l”/h, j- drgt,(r)r26(hv--hV(r)) (5)
which is tantamount to the assumption of the classical reflection approximation in which the ground-state inter- nuclear separation probability is derived from the classical distribution function. The assumption of a transition dipole moment, po, constant over the internuclear separations of
interest, is made in Eq. (5). The evaluation of Eq. (5) is carried out by -limiting g12 to the nearest-neighbor Xe4) di&ibution and further assuming that the difference be- tween excited- and ground-state potentials, A V, is given by the ionic pair potentials: AV = Vionic This is a severe assumption since the ionic potential is not symmetry adapted. This assumption would be an acceptable approx- imation only if the ionic upper state is strongly localized. The predicted spectral distributions using the ionic singlet andyriplet curves are shown in Fig. 4(b). They can be very .satis&torily matched with the experimental spectrum
‘- Gith a 1200 cm- * down shift and b 1:4 normalization ratio for the 311:‘2 intensities. The fit of the adjusted spectrum to the data is illustrated in Fig. 4(a).
Despite the shift in origin required to fit the excitation spectrum, and in view of the approximations made, the simulated excitation spectrum provides the desired consis- tency check; In essence, ai the available level of detail, the pairpotentials used are an adequate representation of the enerietics of the system. Tliere are two indications for many-body contributions in the charge-transfer states: the softening of the potential m inimum needed to fit the emis- sion spectra and the 1200 cm-’ vertical shift required to fit the excitation spectra. The approach of diatomics in ionic systems,’ which is well adapted for accounting the in-cage delocalization contributions, seems the most appropriate procedure to further refine the description of these states.
C. Many-body potentials
1. Emission spectra
The interpretation of structure in emission by reducing the dimensionality of the problem to that of a diatomic has serious implications. Although the multidimensional cova- lent surfaces of Maillard et al., along the C,, eccentricity coordinate retain a striking similarity with the pair poten- tials; nevertheless, the observation of any vibrational struc- ture in emission would imply at least a partial separation of dynamics along Xe-0 and Xe-Xe coordinates. In this con- text, it is useful to consider the dynamic interpretation of emission spectra; namely, the Fourier transform of the au- toco;relation of a wave function projected on the lower surface by radiation. The wave function in this case should include all degrees of freedom, including the lattice. The observation of structure, consistent with vibrational mo- tion of an 0 atom, would imply that recursions occur in the wave function along the Xe-0 coordinate. Judging from the depth of modulation in the spectrum, it can be estimated that approximately 10% of the wave function is involved in recursions. Since it is believed that the 370 nm emission terminates on the 1 ‘B surface, below the crossing point with the triplet surface, the observed linewidths are not expected to be dominated by predissociation. This is further supported by the fact that the linewidths are con- stant throughout the spectral profile and cannot be fit by Lorentzians. In solid Ar, the linewidths vary irregularly between 10 and 100 cm-‘, clearly dominated by predisso- ciation.” In the gas phase the predissociation contribution to line broadening is of the order of 2 cm-‘. Thus, the
J. Chem. Phys., Vol. 97, No. 4, 15 August 1992 Downloaded 17 Feb 2004 to 128.200.47.19. Redistribution subject to AIP license or copyright, see http://jcp.aip.org/jcp/copyright.jsp

Gaussian linewidths for the individual peaks of 280 cm-’ * may be related to the dephasing time of the wave function
along the cage coordinates, a time scale of - lo-i3 s. Dis- sipation into the bulk phonon modes should proceed on a longer time scale.
An enigmatic aspect of the structured emission spec- trum is its transient nature. Quite clearly, cage distortions and trapping in different sites (in particular, relative to the N2 fragment) can produce inhomogeneous contributions to wash out the observed structure. However, contrary to typical inhomogeneous contributions, annealing does not eliminate them. It would seem that the 0 atom population created early in the dissociation process occupy undis- torted interstitial trapping sites. In the case of N20 mole- cules trapped in doubly substitutional sites, it is to be ex- pected that the photogenerated 0 atoms will occupy distorted interstitial sites due to the nearby defect cavity. We therefore speculate that the early dissociation may be due to N20 molecules trapped in highly impacted singly substitutional sites, which upon dissociation yield intersti- tial 0 atoms without the creation of a cavity.
2. ionic potentials
The spectral analysis is consistent with the localized diatomic charge-transfer state, Xe+O-, as the emitter. In halogen-doped Xe, the lowest charge-transfer states ob- served in emission are the triatomics, RgzX-.2 The same is not expected here, since the Xe+O- core (in contrast with Rg+X- in which binding is strictly Coulombic) in- volves electron pair sharing. The binding energy gain from the interhalogen core configuration, of 2.8 eV, is larger than the binding energy of the Xez configuration of 1.06 eV, which explains the absence of the triatomic. The suc- cessful simulation of the spectral distribution in excitation using the gas-phase ionic potential would imply that (i) the diatomic ionic potential is the lowest energy state, (ii) that for in-cavity transitions, the unscreened Coulombic potential adequately represents the potential gradient, (iii) charge delocalization within the cage is a minor contribu- tion to the overall energetics of the ionic state and can be estimated from the excitation spectral simulations to be of the order of 0.15 eV.
3. Delocalized charge-transfer states The expected excitation resonances of the two-hole
Rydberg states can be estimated in analogy with those of halogen doped solid Xe. The ionization limit of delocalized charge-transfer states in O/Xc corresponds to the creation of O- and a valence-band hole.2 The ionization limit in this case differs from that of the halogens, by the difference in electron affinities of 0 vs 1. Using an electron affinity of 1.27 eV for 0, a hole ionization limit Of &‘i = 6.67 eV can be estimated for the present case. As in the case of alkaline earths, a dense manifold of interacting triplet and singlet series of hole excitations are, in principle, possible. A re- quirement for the stability of these Wannier-type states is that the Rydberg radius of the hole be larger than the first
shell radius of the trap site. The minimum energy, Em, above which delocalized states can be sustained, can there- fore be estimated as
in which EB is the binding energy of a hole with a Rydberg radius equal to the first shell radius, r, = 3.3 A, in a dielec- tric medium of index e=2.18 ( a0 is the Bohr radius). Thus, the widest energy window associated with intersti- tially trapped 0 atoms, in which delocalized states would be congested corresponds to 5.67 to 6.67 eV (the spectral range between 218 and 186 nm). This spectral range has not yet been studied. It is nevertheless possible to predict the expected prominent resonances using effective quan- tum numbers from the isoelectronic Mg Rydberg states.27 Sorting out these resonances will be complicated since the same spectral window is shared by the diatomic charge- transfer transitions of substitutionally trapped 0 atoms. Evidently, delocalization contributions to intracavity tran- sitions is not significant. This is rationalized by the directed bonding contribution to the empirical ionic pair potential from the interhalogen core configuration.
V. CONCLUSIONS
The near UV excitation spectrum of O-doped solid xenon, and subsequent emissions in this medium, can be broadly understood in terms of transitions among diatomic covalent and charge-transfer potentials. The ionic poten- tials are synthesized empirically as a sum of Coulomb and Morse contributions based on the known gas-phase poten- tials of IF and Xe+O- (311>. The only solid-state contri- bution to the ionic states is taken in the form of a vertical solvation. An avoided crossing between ionic and covalent states is then predicted. A very similar construct, differing in quantitative details, has been offered in a recently com- pleted study of rare-gas oxides in rare-gas matrices of which we have become aware during the writing of this manuscript.17 The ionic singlet state is predicted to be en- tirely predissociative in the gas phase, to sustain some bound character in solid Ar, and to be the stable surface in solid Xe (see the illustration in Fig. 6). This scheme of potentials is successful in explaining the following. (i) The absence of ionic 3 ‘Z + emission in the gas phase due to its predissociation via 2 ‘8+. (ii) The absence of atomic-like 0( ‘S) emission in solid Xe, in contrast to solid Ar and Kr, due to the stabilization of the charge-transfer state in this polarizable host. (iii) The observation of both ionic and neutral emissions from XeO in solid Ar. (iv) The observed temperature dependence of fluorescence decay rates, as due to the crossing of the ionic state with the ‘A repulsive surface.
Although a limited range of internuclear separations are probed by the excitation and emission spectra, the di- atomic ionic potentials consistently reproduce all spectral features. Among the main findings of the spectral analysis are the following: (i) the covalent 1 ‘Z state is bound by - 1.5 eV, twice as deeply as the gas phase ab initio predic- tion, presumably due to the increased admixture of charge- transfer character in this state; (ii) 0 atoms trapped in
W. G. Lawrence and V. A. Apkarian: Spectroscopy of 0 atoms in Xe 2235
J. Chem. Phys., Vol. 97, No. 4, 15 August 1992 Downloaded 17 Feb 2004 to 128.200.47.19. Redistribution subject to AIP license or copyright, see http://jcp.aip.org/jcp/copyright.jsp

2236 W. G. Lawrence and V. A. Apkarian: Spectroscopy of 0 atoms in Xe
interstitial Oh sites are being probed, in which a site dila- tion of -0.23 A is calculated by MD simulations using pair potentials; (iii) the transient structure in the 370 run emission band is interpreted as a direct probe of the mul- tidimensional cage potential; (iv) the lowest-energy charge-transfer state in this system is predominantly the diatomic Xe+O- configuration, the triatomic exciplex is neither observed nor predicted to be present. Both theoret- ical and experimental work is desirable to better character- ize these relatively “simple” systems. Excitation spectros- copy in the 5.5 to 9 eV spectral range should be particularly useful in sorting out the possible resonances of two-hole delocalized excitations.
ACKNOWLEDGMENTS
This research was supported by the U.S. Air Force Phillips Laboratory under Contract No. SO46 11-90-K- 0035, and by a grant from the National Science Founda- tion ECS-8914321. Helpful discussions with D. Imre are gratefully acknowledged. We are grateful to M . Fritsch for making a copy of his thesis available to us. A fellowship to V.A.A. by the Alfred P. Sloan Foundation is gratefully acknowledged.
‘I. Last and T. F. George, J. Chem. Phys. 93,8925 (1990); I. Last, T. F. George, M. E. Fajardo, and V. A. Apkarian, ibid, 87, 5917 (1987).
*MM. E. Fajardo and V. A. Apkarian, J. Chem. Phys. 89, 4102 (1988). ‘H. Kunz, J. G. McCaffery, M. Chergui, R. Schriever, 0. Unal, V. Stepanenko, and N. Schwentner, J. Chem. Phys. 95, 1466 (1991).
4N. Schwentner, M. E. Fajardo, and V. A. Apkarian, Chem. Phys. L&t. 154, 237 (1989).
5P. S. Julienne, M. Krauss, and W. Stevens, Chem. Phys. Lett. 38, 374 (1976).
6T. H. Dunning and P. J. Hay, J. Chem. Phys. 66, 3767 (1977). ‘J. S. Cohen, W. R. Wadt, and P. J. Hay, J. Chem. Phys. 71, 2955
(1979). *S. Langhoff, J. Chem. Phys. 73,2379 (1980). ‘J. D. Simons, A. G. Maki, and J. T. Hougen, J. Mol. Spectrosc. 74,70
(1979). “D Maillard, J. Foumier, H. H. Mohammed, and C. Girardet, J. Chem.
Phys. 78, 5480 (1983). “0 Dammak, D. Maillard, C. Girardet, Chem. Phys. 83, 247 (1984). t*W C. Walker, R. V. Taylor, and K. M. Monahan, Chem. Phys. Lett.
84; 288 (1981). t3 K. M. Monahan and V. Rehn, J. Chem. Phys. 68, 3814 (1978). 14D. Maillard, C. Giiardet, and J. Foumier, Chem. Phys. Lett. 118, 348
(1985). tsC Girardet, D. Maillard, and J. Foumier, J. Chem. Phys. 84, 4429
(1986). 16R. V. Taylor and W. C. Walker, J. Chem. Phys. 70, 284 (1979). “M. Fritsch, PhD. thesis, University of Hamburg, 1991. tsB. S. Ault and Lester Andrews, Chem. Phys. Lett. 43, 350 (1976). “J Goodman, J. C. Tully, V. E. Bondybey, and L. E. Brus, J. Chem.
Phys. 66, 4802 (1977). *‘W. F. Scott and W. C. Walker, J. Chem. Phys. 81, 4903 (1984). *’ W. G. Lawrence and V. A. Apkarian, J. Chem Phys. (submitted). **H. Krueger and E. Weitz, J. Chem. Phys. 96, 2846 (1992). 23 J. Xu, D. W. Setser, and J. K. Ku, Chem. Phys. Lett. 132, 427 (1986). 24A. Kvaran, A. Ludviksson, W. S. Hartree, and J. P. Simons, Chem.
Phys. Lett. 137, 209 (1987). 25J W. Birks, S. D. Gablnick, and H. S. Johnston, J. Mol. Spectrosc. 57,
23 (1975). 26V Aquilanti, R. Candor-i, and F. Pirani, J. Chem. Phys. 89, 6157
(1988). “R. F. Bather and S. Goudsmit, Atomic Energy States (Greenwood,
New York, 1968).
J. Chem. Phys., Vol. 97, No. 4, 15 August 1992 Downloaded 17 Feb 2004 to 128.200.47.19. Redistribution subject to AIP license or copyright, see http://jcp.aip.org/jcp/copyright.jsp