electron 'spin resonance studies on titanium(ill)...
TRANSCRIPT
Indian Journal of ChemistryVol. 29A, November 1990, pp. 1039-1044
Papers
Electron 'spin resonance studies on titanium(ill) chloride in aqueous2-methyl- 2-butanol (z-amyl alcohol)
PI PremovicLaboratory for Geochemistry, Department of Chemistry, Faculty of Science, University of Nis,
18000 Nis, Yugoslavia
Received 26 February 1990; revised and accepted 4 June 1990
On addition of small amounts of water (1% to 2%, v/v) to TiCl3 (0.02 M, pH 1.4 to 1.8) partially dis-solved in t-amyl alcohol, an electron spin resonance signal (&= 1.9589 ± 0.0002) with well-resolved su-perhyperfine structure due to water protons is observed (the coupling constant equals 0.187 ± 0.003mT). Confirmation of splitting to be due to water hydrogens has been obtained by using D20 in equiva-lent experiments. Aqueous solutions of Ti2(S04h, TiBr3 or TiI3 (0.01 Mto 1.0 M, pH 0.8 to 1.8) saturat-ed with t-amyl alcohol (ca. 5%, vIv) give no electron spin resonance signal. Addition of NaCI or LiCI (1.0M) to the ••e solutions produces a signal identical in hyperfinepattem and-close in the value of g factor(1.9580::t 0.0002) to that for TiCl3 solution. It is proposed that there are axial atkoxide and chloride ionsand four equatorial water molecules in the first coordination sphere of this ESR-active Ti(ill) complexion. Approximate spin concentration measurements, made employing deuterated samples, indicate thatmaximum ESR signal intensity (at ca. 2% added water) represents only 15'± 5% of the nominal Ti(ill)that is present.
Bolton and his coworkers I reported the first obser-vation of proton hyperfine splitting by coordinatedwater of the dectron spin resonance (ESR) signal ofa transition metal complex. This they observed onrecording the ESR spectrum of Ti(III) chloride inacidic aqueous z-butanol'.
Although complete assignment of the structure ofthe Ti(III) species was not made, it was proposedthat at least one t-butanol molecule and four watermolecules were among the ligands. Computer simu-lation of the splitting of the central line indicatedeight equivalent water hydrogens. The tertiary alco-hol was, therefore, located axially with water ligandsin equatorial positions, e.g., trans-Ti(H20)4 (ROH)L.The remaining ligand L was unspecified. The par-tially resolved hyperfine structure indicated delocal-ization of the 3d- electron onto the ligands suggest-ing partially covalent bonding. Hence, further infor-mation was needed to complement the data alreadyobtained on the Ti(III) complex ions in aqueous so-lutions.
Preliminary experiments confirmed the report onthe aqueous t-butanol system except that laTdvalueobtained was 1.82 mT rather than 1.55 mT report-ed by Bolton et al,' However, the poor central lineresolution led us to survey other tertiary alcohols.The central line splitting pattern showed significant-ly better resolution in the case of aqueous TiCl3 sat-urated with I-amyl alcohol and I-amyl alcohol con-
taining small amounts of water. Accordingly, all fur-ther investigation was focussed on z-amyl alcoholcontaining solvents.
Materials and MethodsPhysical measurements
All the spectra were recorded on aVarian E-6SX-band ESR spectrometer operating at 100 kHzmodulation. Frozen solution samples were taken incylindrical quartz cells (5 nun, o.d.). Solution spectraat room temperature were recorded in standardVarian E-248 flat cells.
The variable temperature measurements employ-ed an apparatus based on the Varian V-4502 ap-proach, constructed from Dewar components sup-plied by Scanco Quartz (California). A controller si-milar to the Varian V-6040 was modified to use aplatinum-platinum resistance sensor (EO-100,'WOn) (Rdf. Corp.). The calibration was achievedusing a Hewlett-Packard 2802 A thermometer.Samples maintained at 210 ± 3K (CHCI3-C02 slushbath) or at 197.5 ± 3K (powdered dry ice) were con-tinuously monitored by the digital thermometerprobe with the sample adjacent in the coolant.
The g-factors are quoted relative to diphenylpic-ryhydrazyl (DPPH) using a solid sample (linewidth~Hp_p =0.10 ± 0.01 mT, g= 2.0036 ± 0.0002) thatwas permanently maintained in a dual cavity assem-bly (Varian E-232). The field shift between the two
103<:1
INDIAN J CHEM. SEC A, NOVEMBER 1990
cavities had been carefully measured. DPPH pow-der, to be used as a primary standard in determiningg-factors, was prepared by drying at ca. 340 K for4-5 h. A weighed and powdered sample of DPPHreagent (Aldrich) was used as received. Hyperfin,esplitting constants were determined relative to a so- 'lution of potassium nitrosodisulphonate (Fremy'ssalt) for which g= 2.0055 ± 0.0001 and the nitrogenhyperfine splitting, aN= 1.309 ± 0.001 mTZ.
Frozen solutions (measured only at 77 K) wereobtained by rapidly quenching the sample in liquidnitrogen, maintaining the sample in the VarianE-246 insert Dewar. Details of temperature varia-tion experiments are included with the results.
Spin concentrationsSpin concentrations were measured by a compar-
ison of the derivative signal for the unknown withthat for a standard sample containing a stable par-amagnetic species. Such a method compensates for'variations due to instrument drift when spectra arebeing measured over an extended period of time.The cavity Q-factor was kept constant by using thesame solvent and same flat cell for both standardand unknown. However, a limitation on the accura-cy of the comparison is imposed.by the necessity ofremoving and repositioning flat cell while changingthe sample. The spin concentration (C) is given bythe following equation, ,
C-K 1\ . g;t. 5(5+ 1)st- 1\t g; 5(5+ n
where x indicates the unknown sample and st indi-cates the standard, A is the area under absorptioncurve (arbitrary units as long as they are the samefor the unknown and the standard). 5 and g are thespin quantum and g-factor of the paramagnetic spe-cies, respectively.
K is mainly an instrumental constant and may bedefined as
K= Rx(scanJ . GstMstR.bcao,t)2 G x M,
where scan is the horizontal scale; G is the gain; M isthe modulation amplitude; and
illR==:::lDk
where D, is the degeneracy of the line for which thearea was measured and ~Dj is the sum of the degen-eracies of all the lines in the spectrum.
The C relation applies provided that the same in-cident microwave power is used, there is no powersaturation or unknown, and the same sample cell,
1040
solvent and temperature are used. The areas andconcentrations were evaluated by means of a deskcalculator that performed an integration, with base-line correction, and computed the concentrationsfrom the C expression.
Further details of the rneasuririg procedure and'associated controls, for precision and accuracy aregiven by Premovic'.
Preparation oftitaniuniJIf) solution and complexesTi(III) solution was prepared by dissolving the
.metallic sponge (Fisher) with gentle heating in ap-proximately 1-2 M hydrochloric or sulphuric acid.An N2 atmosphere was employed, to minimize oxi-dation of Ti(III) ion. Alternatively,' Fisher reagentgrade Ti(1Il) chloride solution (20%) or BDH rea-gent grade Ti(III) sulphate solution (15%) was useddirectly without qualitative change in any of the re-sults reported in this paper., ,
Ti(III) bromide and iodide solutions in aqueousacid were also prepared using the following meth-ods:
(I) Ti(III) carbonate was precipitated from Ti(III)chloride or sulphate solution and thoroughlywashed with water until no further chloride orsulphate ion was detected. Ti(III) carbonate wasthen dissolved in cone. hydrobromic or hydroiodicacid and diluted to the desired concerrration".
(II) Dilute reagent grade Ti(III) chloride or sulph-ate solution was transferred to the ~p of an ion-ex-change column (i.d. 50-80 mmlcontaining 150 g(dry) 100-200 mesh Dowex AG 50-X12 cation ex-change resin. The column was loaded with the metalion by passing the dilute solution until the effluenthad the violet colour. The column was then washedfree of chloride or sulphate by ~xtended washingwith oxygen-free distilled water. The Ti(III) wasthen immediately removed from the column by a2M solution of the desired acid.
(III) This method was employed for preparationof Ti(III) iodide solution only. Addition of a concen-trated solution of potassium iodide to the blue solu-tion of Ti(IlI) chloride in methanol precipitated po-tassium chloride", Methanol was removed by sever-al evaporations to dryness employing water as thesolvent in the second and subsequent cycles. The so-lution was then filtered.
The concentrations of anions were varied by eith-er addition of the Fisher reagent grade salts (sodiumchloride, potassium bromide, potassium iodide andsodium sulphate) or concentrated acids (37.5%HCI, 48% HBr, 56°/~HI, 98% H2S04), For study inheavy water, the appropriate diluted THIll) solutionwas added to heavy water (Merck 98%) such that
PREMOVIC: ESR STUDIES ON TITANIUM(III) CHLORIDE
the final sample contained from 1% to 98% of wateras required.
Reagent grade (either Fisher or Aldrich) alcoholswere used without further purification.
The final concentration of Ti(III) ions was deter-mined volumetric ally by titration with a eerie sulph-ate solution using o-phenanthroline as indicator. Ty-pical values obtained for either stock solutions orsolutions prepared by dissolving the metal lay in therange 95-97%.
Results and DiscussionESR observations
The concentration range of t-amyl alcohol in wa-ter was limited by the solubility of the alcohol in wa-ter. In the acidified salt solutions that were used, sat-uration occurred at approximately 5 volume percent t-amyl alcohol. As a result, essentially two me-dia could be conveniently employed: (a) aqueous so-lutions saturated with alcohol, and (b) alcohol con-taining 1-2% water.
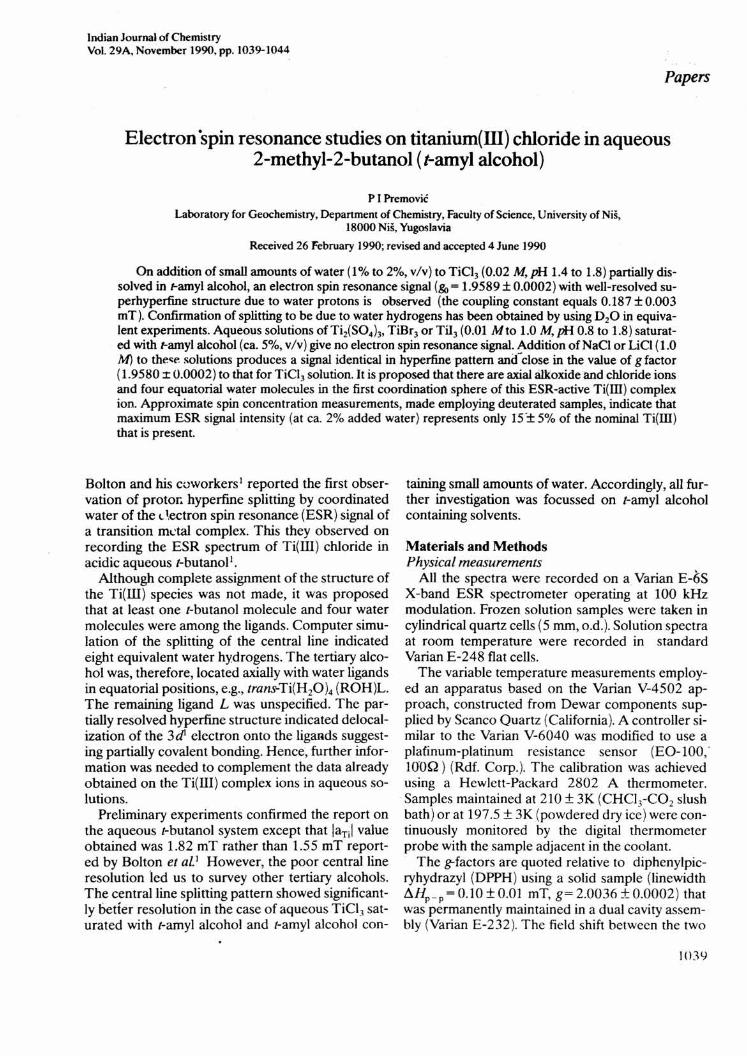
(a) Aqueous solution-When aqueous solution ofTi2(S04))' TiI)or rrs-, (0.02M; pH, 1.8) was satu-rated with alcohol no signal was observed. How-ever, a saturated (0.02 M) TiCl3 solution providedthe ESR spectrum shown in Fig. 1. Addition of amolar concentration of NaCI or LiCI to the Tisulphate, bromide or iodide sample produced anESR signal identical in hyperfine pattern and" ~factor. In water alone at pH 1.0, the dominant[Ti(H20)6P+ species had no detectable ESR signal.Clearly, the complex ion must contain both r-amylalcohol and chloride ion ligands.
(b) t-Amyl alcohol solution-Anhydrous TiCl3was only very slightly soluble in the pure alcohol. Inany event no signal was recorded from the supernat-ant alcohol. On addition of small amounts of water,TrCl, partially dissolved and an ESR signal was ob-tained that attained maximum intensity at approxi-mately 2% added H20. Alternatively, concentratedaqueous TiCI) could be added directly to the alco-hol. Identical samples prepared using Ti2(S04)3 or
Fig. I-ESR spectrum of iTi(H,O))C,HIIO-)Cljt ions iTiCI..(0.02 .'if) in H20 containing 5°;;,(v/v) I-amyl alcohol, pH 1.8).
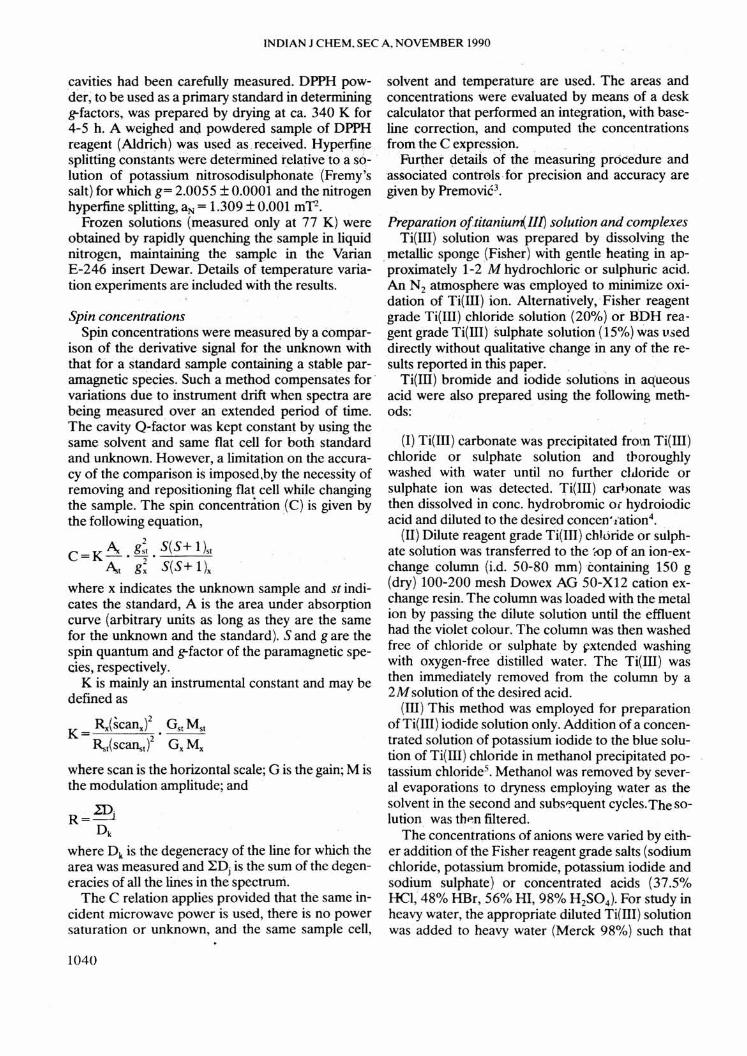
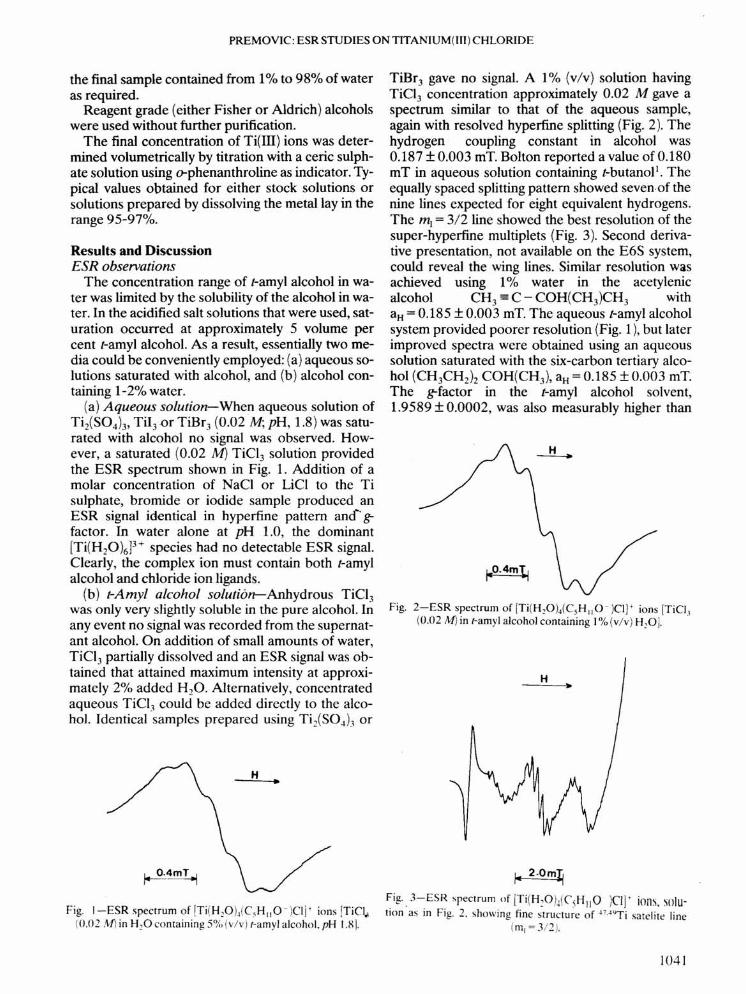
TiBr3 gave no signal. A 1% (v/v) solution havingTiCl3 concentration approximately 0.02 M gave aspectrum similar to that of the aqueous sample,again with resolved hyperfine splitting (Fig. 2). Thehydrogen coupling constant in alcohol was0.187 ± 0.003 mT. Bolton reported a value of 0.180mT in aqueous solution containing z-butanol'. Theequally spaced splitting pattern showed seven of thenine lines expected for eight equivalent hydrogens.The m,= 3/2 line showed the best resolution of thesuper-hyperfine multiplets (Fig. 3). Second deriva-tive presentation, not available on the E6S system,could reveal the wing lines. Similar resolution wasachieved using 1% water in the acetylenicalcohol CH3 == C - COH(CH3)CH3 withaH = 0.185 ± 0.003 mT. The aqueous z-amyl alcoholsystem provided poorer resolution (Fig. 1), but laterimproved spectra were obtained using an aqueoussolution saturated with the six-carbon tertiary alco-hol (CH)CH2h COH(CH)), aH = 0.185 ± 0.003 mT.The g-factor in the z-amyl alcohol solvent,1.9589 ± 0.0002, was also measurably higher than
~o.4rn~
Fig. 2-ESR spectrum of[Ti(HP)4(C5HIIO-)CJ]+ ions mer,(0.02 M) in I-amyl alcohol containing I%(v/v) H20]. .
fo. 2.0rn~
Fig .. 3-ESR spectrum of [Ti(HP)4(C')H110 )ew ions. xolu-tion as in Fig. 2. showing fine structure of 47AoTisatelite line
(rn, = 3/2).
1041

INDIAN J CHEM, SEC A, NOVEMBER 1990
that for the sample in the aqueous phase,&) = 1.9580 ± 0.0002.
(c) Deuterated solvent-Confirmation of the splitt-ing to be due to water hydrogen was obtained by us-ing D20 in equivalent experiments. In Fig. 4a, thespectrum of an aqueous phase sample containingjust 5% (v/v) D20 showed nearly complete loss ofthe hyperfine splitting. At 10% D20 the signalshowed no trace of hyperfine structure, but retainedvirtually the same overall signal linewidth. Even at33% D20 (Fig. 4b) the measured linewidth (0.62mT) was further reduced only by 11%. In 98% DzO(Fig. 4c) the linewidth was reduced to 0.30 mT indi-cating significant unresolved hyperfine structure inthe D20/H20 mixtures. The effect of a smallamount of D20 (e.g. 5%) on the linewidth may ap-
H
1--0.4mT ~
H
Fig. 4-Effect of deuterium exchange on ESR spectrum of[Ti(HP)4(C,H110c)Cl]+ ions [TjCl, (0.02 M), 5% (v/v) r-amylalcohol in: (a) 20:1 mixture of H20:D,O; (b) 2: 1 mixture of
HP:D20; and(c)Dp (LJ8°/r»)].
1042
pear to be too great at first glance. However, ex-change of a single deuterium alters the coupledspins to an odd number, exactly interposing a spec-trum of identical splitting with an even number oflines. Rapid effective loss of resolution occurs.Combination of 8, 7, 6 and 5 protons, etc., in a rangeof partially exchange complexes present at 33%D20 provided a signal with no hyperfine splitting(Fig.4b).
As expected, loss of hyperfine structure also oc-curred when D20 was used to prepare the complexin alcoholic solution. Solid TiCl3 (0.1 g) was su-spended in 20 ml of t-amyl alcohol-OD (approxi-mately 75-85% minimum CSHl10D prepared byequilibrating with DzO) and 0.2 ml DzO (98%) wasadded. After thorough agitation, the undissolvedTiCl3 was allowed to settle. The resultant spectrumhad a single narrow line (~Hp_p=0.30 mT). Onceagain, if 20 ml of CSH110H was employed (e.g., ap-proximately 1:1, HzO:DzO is created after ex-change) the linewidth increased to 0.60 mT. In fact,the spectrum was then identical with that in Fig. 4b(save for the shift in g value) showing the same re-markably smooth absorption curve for the partiallyexchanged complex.
The narrow line of the deuterated samples wasfound to be the most suitable for the g-value mea-surements. Though the ~g between the two solventsystems was rather small, it was found that the regu-lar spacing of the sharpened 47,49Tisatellite in theexchanged complexes served as an approximatefield linearity check over the field separation ofDPPH and the central line. In addition, the g-shiftwas reproduced in measurements taken monthsapart.
(d) Concentration of active species-Approxim-ate intensity measurements were best made employ-ing deuterated samples. As shown in Fig. 1and Fig.2, the intensity was actually ca. 100% greater in thealcoholic medium-containing only small amounts ofwater. However, even then the signal representedonly 15 ± 5% of the Ti(III) chloride that was present.Disappointingly, it was evident that the active spe-cies was not suitable for characterization of thecomplexiometric equilibrium of the system.
Examination of frozen solution spectrum at 77 Kshowed clearly that other complex ions were pres-ent (Fig. 5, 1% H20 in t-amyl alcohol). It may benoted that the spectrum has &1 and g1. values alm-ost identical with those for [Ti(H20 )6)3 + ion infrozen aqueous solutions'', Indeed, variable temper-ature study of frozen alcohol-water solution againshowed a sharp disappearance of the signal in theregion 193 K to 213 K, as the ESR signal associatedwith [Ti(HzO)"P+ ions:'.

PREMOVIC: ESR STUDIES ON TITANIUM(III) CHLORIDE
H
iJO.OmT-lFig. 5-ESR spectrum of [Ti(HP)6P+ complex ions [TiCI3
(0.02 M) in r-amyl alcohol containing 1% H20, 77 K, frozen so-lution: g= 1.994 ± 0.002 and g= 1.896 ± 0.001 J
To summarise then, the requirements of chlorideion, z-amyl alcohol and four water molecules in thefirst coordination shell of a complex with axialsymmetry are necessarily met in the structure, trans-[Ti(HzO)4 XCl], where X = CsHIlOH opr CsHIlO-.It is further proposed that the complex reported byBolton I has an analogous structure incorporatingone z-butanol species in an axial position.
Metal hyperfine structure and axial perturbationThe observation of resolved hyperfine structure
due to the hydrogens of water ligands in transitionmetal complexes is relatively rare. In this study ESRspectra obtained for the same complex ion both inthe aqueous phase and in a much less polar tertiaryalcohol medium exhibit such structure.
Since the &>-value of trans-[Ti(H20 )4XClj com-plex (1.9585) lies rather close to the free electronvalue of 2.0023 (compare trans-[Ti(H20)4F2j+,&>= 1.9467 and [Ti(HzO)4(OHlzj+, &>=1.941)8 ,onecan propose a relatively strong axial component ofthe ligand field. The Ti-CI bonding may contributeto distortion from pureO, symmetry since CI- is anaccepted strong .7l-donor. However, since neitherthe [Ti(H20)sCl]2+ nor the [Ti(H20)4Clzj+ complexion? seems to give an observable ESR spectrum atroom temperature, an important and specific role isindicated for the r-amyl alcohol in the axial position.In analogy to V02 +, we could expect a much strong-er axial perturbation (by an a1koxide axial ligand) in
trans-[Ti(H20)4(CsHIlO-)CW than that in trans-[Ti(H20)4(CsHllOH)CW One may suggest thatsome multiple bond character between Ti(lli) andthe alkoxide axial ligand, analogous to that for thevanadium-oxide bond, may exist. The increased ne-gative charge on the oxygen would also facilitatemore covalent o- and zr-bonding.
In summary, it is proposed that simultaneous ef-fects of both the alkoxide group and chloride ionlead to the rather strong axial perturbation.
The observation of discrete hydrogen splitting inthe ESR spectrum requires that both the aquationand proton exchange rates be slow compared to thefrequency separation of the hyperfine components.In Fig. 2, especially, we note that line broadeningdue to either exchange process has not become sign-ificant, i.e., mean lifetime of the hydrogen in theaquo ligand is of the order 1O-6s (ref. 9). Previouswork based on NMR technique indicates thatTm = 5 X 10⁻⁶ s for an alcohol ligand in the TiCl3
complex in methanol!". Any destablizing steric ef-fect of the alcohol is then not reflected in a markedincrease in lability of the water ligands.
At high acid concentration, loss of hyperfinesplitting does occur in spectra recorded in bothaqueous and alcohol media. In alcohol medium (Fig.3), with 1% (vIv) added aqueous TiCl3 (20% techni-cal stock TiCI3), we recorded a nominal pH of 0.8that has no direct correspondence with aqueoussamples. However, addition of a further 3% (v/v)HCl completely eliminated the hyperfine structure.
In water, hyperfine structure disappeared belowpH 1.4 although the complex could be observed' as a-single line at pH values as low as.0.8. At pH 1.0 itwas possible to work at TiCl3 concentrations in therange 0.01-1.0 M. No further line broadening due tospin-spin exchange effects was observed. These ob-servations are a basis for study of proton exchangerates of aquo ligands. For example, the aH(OH)splitting in the CHzOH species (0.096 mT) was lostat pH 1, leading to a value of acid-catalysed ex-change k= 1.8 x 10⁸L mol-1 s -I (ref. 10).
Finally, Waters and Maki recorded a spectrum ofTi(III) chloride in dry methanol after addition of oneequivalent of methoxide ion 11. The narrow line, Tihyperfine coupling (1.82 mT) and isotropic g-value(1.9532) that they reported are clearly comparableto the parameters obtained in the tertiary alcohol!1% H20 solvent. Goldberg and coworkers pu-blished spectra of TiCI} in methanol containingsmall amounts of water!". The spectral parameters ofthe principal line were: &1= 1.9548, aTi = 1.835 mTand linewidth (peak to peak), 6Hp_p =0.29 mT.
The axial perturbation due to alkoxide and chlo-ride ligands may be common to all these systems.
1043

INDIAN J CHEM, SEC A, NOVEMBER 1990
Further study should involve a reexamination of thealkoxide addition experiments to determine theirgenerality and the nature of the remaining ligands inorder to test this hypothesis.
ConclusionThe structural evidence for the Tiflll) complex
formed in t-amyl alcohol-water solutions containingCl- ion, is consistent with both axial alkoxide andchloride ligands having significant 0- and n-bonding. A narrow line allows observation of well-resolved equatorial water proton splitting. .
AcknowledgementThis research has been supported by the Re-
search Fund of Srbija (research project 1.12). I thankthe referee for helpful criticisms.
1044
References1 Johnson R, Murchison P W, Bolton J R, JAm chem Soc. 92
(1972) 6354.2 Faber RJ & FraenkeI G K,] chem Phys, 47 (1967) 2462.3 Premovic P I, Ph D Dissertation, UVIC, VICTORIA,
(1975).4 Semenova E I, Dokl akad Nauk, SSSR, 143 (1962) 1368.5 GiggenbachW & Brubaker (Jr) C H, Inorg Chern, 7 (1968)
129.6 Prernovic P I & West P R, Can] Chern, 53 (1975) 1630.7 Premovic P I & West P R, Can] Chern, 53 (1975) 1593.8 Premovic P I & West P R, Can] Chern, 52 (1974) 2919.9 Garif'yanov N S & Semenova E I, Zh strukt Khim, 3 (1969)
596.10 Chmelnick A M & Fiat D,] chem Phys, 51 (1969) 4238.II Waters E L & Maki A H, Phys Rev, 125 (1962) 233.12 (a) Goldberg I B & Goeppinger W F, Inorg Chern, II (1972)
3129;(b) Parry E P, Goldberg I B, Hern D H & Goeppinger W F,]phys Chern, 77 (1973) 678.