electron spin resonance in natural … minerals (1975), 10, 313. electron spin resonance in natural...
TRANSCRIPT
Clay Minerals (1975), 10, 313.
E L E C T R O N S P I N R E S O N A N C E IN N A T U R A L K A O L I N I T E S C O N T A I N I N G Fe 3+ A N D O T H E R
T R A N S I T I O N M E T A L I O N S
R . E . M E A D S AND P . J . M A L D E N *
Department of Physics, University of Exeter, Exeter and *E.C.L.P. Ltd., St. Austell, Cornwall
(Received 28 April; revised 17 October 1974)
A B S T R A C T : A number of natural kaolinites from a variety of world sources have been investigated using electron spin resonance at both X-band and Q-band. The results show systematic differences some of which are related to the crystailinity of the material, some to the presence of transition metal ions other than Fe 3+ and hole-trapping defects.
The results provide evidence for at least three sites for substitution of Fe 3+ having large crystal fields : (i) a site with near maximum rhombic character having crystal field parameters D > 1 "2, A = �89 the occurrence of which is correlated with lack of crystal- line perfection due to stacking defects or to the proximity of surfaces, (ii) a site with less rhombic character with A = 0.234, D = 0-585 as likely parameters, and (iii) a site with parameters near the values A = 0.207, D = 0.322.
M6ssbauer and ESR evidence suggests that the principal sites of Fe 3+ substitution are octahedral. The presence of Fe 3+ in adjacent cation sites leads to a very broad resonance centred near gefr = 2. Other resonances in the spectra are attributed to the effect of trapped holes, some at least of which are situated at oxygen sites adjacent to A13+ ions substituting in sites normally Occupied by SP +.
Hyperfine effects due to the presence of the transition ions Mn 2+ and (VO) 2+ are also observed.
I N T R O D U C T I O N
Previous E S R work on kaolini te and other silicate minerals
T h e l i t e ra tu re on the a p p l i c a t i o n of e l ec t ron sp in r e s o n a n c e to the s tudy of the
p a r a m a g n e t i c S-s ta te ions F e 3+ a n d M n ~+ o c c u r r i n g in s i l ica te mine ra l s is v e r y
extens ive . A useful r e v i e w of w o r k o n F e 3+ has b e e n p u b l i s h e d by G h o s e & T s a n g
(1973). In tha t p a p e r the crys ta l f ield p a r a m e t e r s fo r A P + sites d e t e r m i n e d by n u c l e a r
m a g n e t i c r e s o n a n c e a re c o m p a r e d w i t h those fo r F e 3+ subs t i tu t ed in s imi la r sites,
as d e t e r m i n e d by e l ec t ron sp in resonance .
E S R of F e 3+ in micas has b e e n s tud ied by a n u m b e r o f worke r s (see, for e x a m p l e ,
K e m p (1971, 1972, 1973)) bu t there has been r e l a t i ve ly l i t t le p r e v i o u s w o r k on
kao l in i t e a n d its c lose re la t ives . B o e s m a n & S c h o e m a k e r (1961) p u b l i s h e d E S R
spec t ra of kao l in i t e s im i l a r to t hose o b t a i n e d in t he p r e sen t work . O t h e r r e l evan t
o b s e r v a t i o n s h a v e b e e n m a d e by F r i e d l a n d e r et al. (1963) a n d by W a u c h o p e &

314 R. E. Meads and P. J. Malden
Haque (1971). Recently, Angel & Hall (1973) have reported more extensive measurements.
When working with natural materials spin resonance signals may arise from many transition metal ions or defects both in the primary substance under investigation and also in impurity phases which may be present. Another factor which has dis- couraged others from work on kaolinite is, doubtless, the fact that single crystal specimens of reasonable size are rare. No single crystal ESR work on kaolinite has yet been reported, although single crystal studies of kaolinite of Russian origin using electron and X-ray diffraction respectively, have been reported by Zvyagin (1960, 1964) and by Drits & Kashaev (1960). These provide information regarding the deviations of the kaolinite structure from that proposed by Brindley & Robinson (1946). Because of the possibility of substantial distortions in relatively large single crystals, it is likely that the most reliable structural information on kaolinite is to be deduced from the work of Newnham (1961) on dickite and Blount, Threadgold & Bailey (1969) on nacrite.
All the ESR experiments on kaolinite reveal two principal features, namely, a group of broad resonances near ge~ = 4 and a further group of resonances near get* = 2. Certain other features also appear and will be described and discussed later. It is practically certain that the ge,~ = 4 group is attributable to Fe 3+ but the origin of some of the ge~f = 2 resonances is less certain.
The present work
In the work reported here, ESR spectra at X-band (9.27 GHz) and Q-band (35.98 GHz) are presented, of samples of kaolinite obtained from a number of world-wide sources. The relative intensities of the features of the spectra vary substantially from sample to sample and some correlation with other physical properties can be detected. The results at X-band can be interpreted on the assump- tion that at least two Fe 3+ sites are present, but the complex resonance pattern obtained at Q-band appears to require the existence of more than two sites. Some measurements on sedimented samples, in which the angle between the magnetic field and the normal to the kaolinite layer is varied, have assisted in the identification of the Fe 3+ sites.
Malden & Meads (1967) have shown, from M6ssbauer experiments on magnetically refined specimens, that Fe 3+ substitutes in the kaolinite lattice itself as well as in impurities. The M6ssbauer results are consistent with substitution in octahedral AP + sites. This is most plausible, since substitution in Si 4+ tetrahedral sites would require charge compensation. An extensive M6ssbauer study of micas by Hogg & Meads (1970) has provided no clear evidence for tetrahedrally co-ordinated iron. This and other evidence on this point will be discussed later, but it is the view of the present authors that the ESR spectra may be interpreted without the need for assuming the presence of Fe ~+ in tetrahedral sites.
ESR of Fe 3+ in powder samples
The interaction between an Fe 3+ ion and the crystalline electric field and external

Electron spin resonance in natural kaolinites 315
magnetic field is represented by a spin Hamiltonian, the details of which are dis- cussed in the Appendix to this paper. In general, six energy levels occur, the positions of which depend on the strength of the applied field B and the orientation of B with respect to the symmetry axes of the crystal field. Spin resonances occur as a result of transitions between pairs of these levels and, for a given microwave quantum energy, it is usually possible to predict the values of B for which reson- ances occur. The resonances are often specified by the effective spin value gent defined so that
(h~) gefr-- BR~
where hv is the microwave quantum energy, /3 the Bohr magneton, and B~ the resonant value of the magnetic field.
For appropriate site symmetry (see Appendix) and strong crystal field the effect of the crystal field on the spin resonance spectrum can be expressed in terms of two parameters D and E (or D and k ---- D/E) where, for fields of axial symmetry, A = 0. Increasing rhombic character in the crystal field results in increasing h up to a maximum value of �89 When the crystal axes are randomly oriented with respect to the magnetic field B, as in a powder specimen, certain resonances are still observ- able the origins of which are also discussed in the Appendix.
Some features of the powder ESR spectrum for Fe 3+ in strong rhornbic crystal fields are very characteristic, viz: (i) for X -- ~- a strong resonance at ge~ ---- 4"27 Occurs, (ii) for X < ] a triplet of resonances occurs in the ge~ = 4 region. Both these features are observed in the ESR spectra of kaolinites reported here.
Figure 1 shows a plot of the resonant fields expected for D ---- 3, h = 0,2-0.33 for a microwave quantum of 0.309 cm -1 (9-2703 GHz-X-band).
D - -
0.3~ --
0-2~
0.2,
0.2c I ~ I 1200 1400 1600 1800 2000
Field ( G )
= 9 .2703 GHz (0 .309 cm-I), D=5.O0, hu/D=O.103.
FIG. 1. R e s o n a n t f ields fo r 34 t r an s i t i on , D = 3, ~ = 0 .20~) .33 .

316 R. E. Meads and P. J. Malden
In the analysis of the present results, the conventions regarding labelling of transitions used by Aasa (1970) are adopted. The energy levels are labelled 1-6 in order of increasing energy. If, as B is varied, states cross each other, the labels are changed over so that numbering in order of energy is retained. Thus, a transition quoted as 34X is that between levels 3 and 4 corresponding to B directed along the x principle axis of the crystal field.
M A T E R I A L S
The ESR spectra were obtained using a number of clay samples from different sources. The samples are labelled (a)-(f) and the following is a brief description of their nature and origins.
La Frontina mine, State of Jalisco, Mexico. (a)
The < 2/~m fraction of the sample was used in this study. The 0nly mineral impurities are 0.35% TiO2 and 1~ quartz (percentage by weight is quoted). The remainder is kaolinite of very high crystallinity with a crystallinity index of 1.7 (Hinckley, 1965). The iron concentration, after removal of free oxides, is 0-62~/o measured as FezO3.
St A ustell region, Cornwall. (b)*
This material is the l-2"5t~m fraction of a well-crystalized kaolinite, purified by magnetic extraction and containing the iron equivalent of 0-31~ Fe203. The crystallinity index is 1.2. The principal contaminant of the original clay is mica.
Washington County, Georgia U.S.A. (c)
The 1-2"5~m fraction of the sample was used, crystallinity index 0.9. The princi- pal impurity is 1.55% TiOz (anatase). The iron content is equivalent to 0 .34~ Fe203.
Mount Crawford, Adelaide, Australia. (d)
This specimen of kaolinite is 80% by weight < 2~m. Free iron oxides were removed by treatment with sodium dithionite, and organic matter by treatment in aqueous suspensions with ozone. The clay contains about 2% talc and 0.42% anatase. It was chosen for this work because it has an unusually high concentration of iron in the kaolinite--l.38~ as FelOn. The crystallinity index is 0-65
East African Fireclay, Pugu, Tanzania. (e)
This material has been studied by Robertson, Brindley & Mackenzie (1954). In the present work the < 2/~m fraction was used. This, after removal of free iron oxide and organic matter, contains 1.71% TiO~ (anatase). The iron concentration is 1'43~ as Fe~O3. This clay is a good example of b-axis disordered kaolinite. The
* The clay is identical to the refined sample A referred to in the work of Malden & Meads (1967)

Electron spin resonance in natural kaolinites 317
above authors found a cation exchange capacity of 7.4 mEq per 100 g for the < 5~m fraction. The crystallinity index is very low ~ 0.07.
Eureka Halloysite, Utah, U.S.A. (f)
Chemical analysis showed no evidence of Fe 3+, although this is observed in the ESR experiments.
R E S U L T S A N D D I S C U S S I O N
X-band spectra of kaolinite
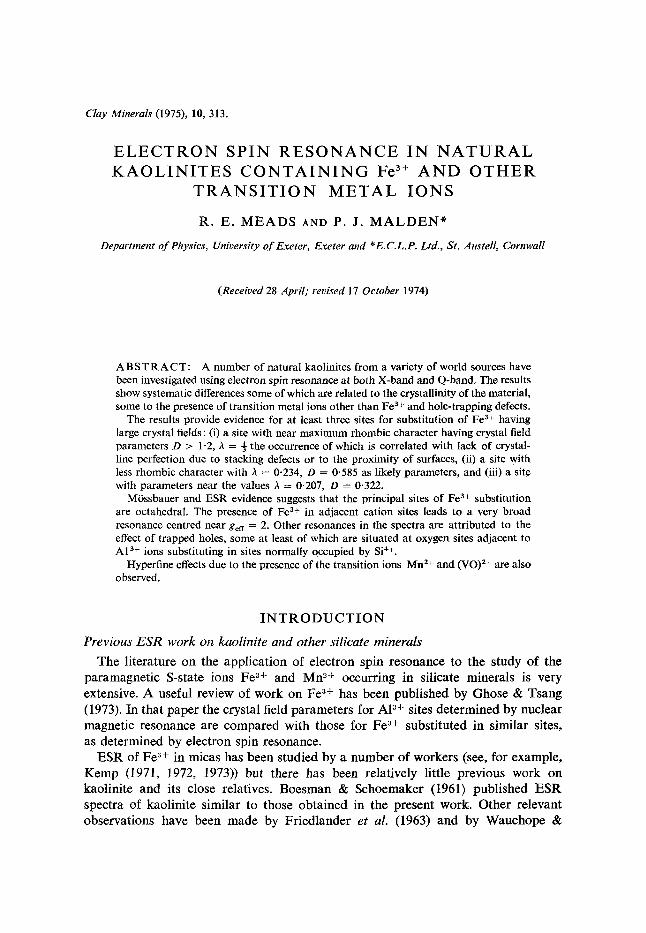
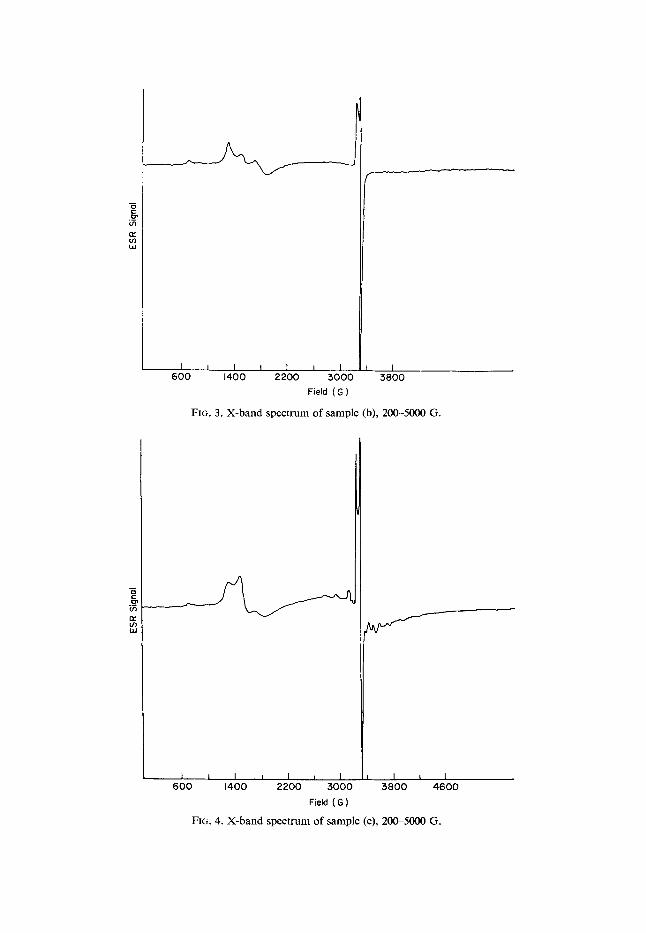
In general, observations on randomly orientated powders at X-band agree quite well with those of Angel & Hall (1973) although the interpretation differs significantly from theirs. Figures 2, 3, 4, 5, 6 and 7 show iull-range spectra of the clays listed above.
Similar features are present in all the spectra and these will be discussed in detail in the order of the field values at which they occur, in the following sections. They are as follows.
(A) Resonances below 2000 G. Since these are believed to occur for related reasons they will be discussed together. All spectra show a single resonance at 740 + 20 G ( g e ~ 9) and a triplet of resonances at 1356 + 20 G, 1558 _+ 20 G, 1820 _+ 30 G, (gear, -~ 4) through the intensity of the 1558 G resonance relative to the other two members of the triplet varies markedly from sample to sample. The field values quoted are averages based on measurements on different samples. Figure 8 shows an expanded spectrum of sample (b) covering the range 500-2100 G. A fifth resort-
b~
ta3
I I I I I I I I 600 1400 2200 5000 3800
Field ( G )
FIG. 2, X-band spectrum of sample (a), 200-5000 G.
~n b~ n,,- 03 t.iJ
I I I 6 0 0
t i [ I 1400 2200 5 0 0 0 5800
Field ( G )
FIG. 3. X-band spectrum of sample (b), 200-5000 G.
s
h i
I I I = I I I I I I 6 0 0 1400 2200 3 0 0 0 3 8 0 0 4 6 0 0
Field ( G )
FIG. 4. X-band spect rum of sample (c), 200-5000 G.

-L;
t I I I I I I I l 600 1400 2::)00 3000 5800
Field (G)
FIG. 5. X-band spectrum of sample (d), 200-5000 G.
, , y ~ ) I.,iJ
I 600
I I I . . . . . . . i I ~ I 1400 2200 3000 3800
Field (G)
FIG. 6. X-band spectrum of sample (e), 200-5000 G.

m
n,," t / ) W
r r L t )
1 740 G
h 6oo
, I ~ I , I i I 1400 2200 3000 3800
Field (G)
FIG. 7. X-band spectrum of sample (f), 200-5000 G.
1356 G 1558 G 1820 G
I ,500
Field ( G ) F[o. 8. X-band spectrum of sample (b), 500-2100 G.
2100

Elec tron spin resonance in na tura l kaol in i tes 321
ance reported by Angel & Hall (1972) on the high field side of the triplet, has not been observed.
Figure 9 shows spectra obtained with a specimen of a Cornish clay (b) carefully sedimented so as to produce a sample in which there is marked preferential orienta- tion of crystals with the silicate sheet parallel to the sample face. In one spectrum of Fig. 9 the magnetic field is perpendicular to the sample face (4' = 0) and there- fore more or less perpendicular to the kaolinite layers. In the other spectrum the field is preferentially directed parallel to the layers (4' = 90~ Crystal orientation in the ab plane still remains random. Measurements at intermediate angles show progressively changing intensities. A decrease in intensity of the 1356 G resonance is observed as the angle 4, between the normal to the kaolinite layers and the field is increased from 0 to 90 ~ The intensity of the 1558 G resonance stays roughly constant. A marked increase in the intensity of the 740 and 1820 G resonances is noticed as 4, is increased.
(B) Broad resonance centred near 3000 G (gett~ 2). All spectra show a very broad resonance centred at go t t~ 2. This is most marked in the spectrum of sample (d).
((7,) Resonances in the range 3200-3400 G (gett~ 2). All spectra show resonances
gS= 0 ~
o=
n,. (1) LU
I = I , I I I , I 500 9 0 0 1300 1700 2100
F i e l d ( G )
Fie. 9. X-band spectrum of sedimented sample (b), 200-2500 G, ~b = 0 ~ ~b = 90 ~

322 R. E. Meads and P. J. Malden
in this region. In some cases a simple doublet is obtained, but in others the spectrum is more complex and includes hyperfine structure containing at most, about 19 lines occurring at intervals of about 7'6 Gauss.
(D) Multiplets, near gett = 2. In addition to the ge~ = 2 resonances mentioned above other multiplets of resonances centred at about 3300 G are found in the spectra of different samples. A typical group, containing six principal lines, is observed in the case of sample (d), (Fig. 10). A spectrum of halloysite sample (f), (Fig. 7) shows a complex resolved multiplet of this type.
8
tZ
laJ
I i I I i I ~ - - 3000 3200 3400 5600
F i e l d ( G )
FIG. 10. X-band spectrum of sample (d), 3000-3700 G showing Mn s 5 hyperfine structure.
Discussion of X-band results
Comment on intensities of resonances, type (,4) and (C). Examination of the spectra shows that resonance of type (A) show large linewidths ( ~ 5 0 G ) a n d that the overall relative intensity of type (A) with respect to type (C) of which the principal features have linewidths ~ 1 0 G, varies widely from sample to sample. I t has not proved possible, so far, to correlate this overall relative intensity with any other chemical or physical property of the materials. These points lead, plausibly, to an initial assumption that features of type (A) and type (C) have a totally different origin. The detailed discussion below does not cause modification of this view.
Interpretation of type .4 resonances. As stated above, the relative intensity of the

Electron spin resonance in natural kaolinites 323
" I I I 0 0,5 1,0 !.5 2.0
Fl~. 11. % o f 1558 G resonance in g~ff = 4 group, v. H inddey crystall inity index.
middle line (1558 G) of the ge~ = 4 triplet varies with respect to those of the lines at 1356 G and 1822 G for different materials. By integration of the spectra and rough measurement of areas, the distribution of intensities among the ge~f = 4 triplet has been obtained. In Fig. 11 the fraction of total triplet intensity in the 1558 G resonance is plotted against the Hinckley index of crystallinity of the material. A good general correlation is obtained, indicating that the central resonance is particu- larly strong in a specimen which is imperfectly crystallized. More complex correla- tions with similar general conclusions have been obtained by Parker (1969) who measured the ratio of 2695 to 3625 cm -1 infra-red absorption band intensities in random and oriented specimens from the same range of kaolinites. A low ratio in oriented specimens is frequently associated with poor crystallinity. Parker observes that other factors such as particle size and aspect ratio are of importance.
Noble (1971a) has estimated the average number of layers between stacking defects for various clays and this property also proves to be correlated with the crystallinity index. An estimate of some forty layers between defects is estimated for the Mexican clay (a) in which the 1558 G resonance has a relative area of ~-, 2Yo. It is therefore plausible to assume that at low defect concentrations, sites giving rise to this reson- ance are located in layers adjacent to a stacking defect. At higher stacking defect densities the relative intensity of the 1558 G resonance increases much more rapidly than the density itself suggesting strong interactions between defects giving rise to much larger numbers of source sites. It is worth noting that in the highly crystalline sample (a) the interval between the stacking defects is of the same order as the

324 R. E. Meads and P. J. Malden
dimensions of the crystal l i tes measured a long the c-axis, so that the 'defect ' may in many cases be the crysta l surface itself. In hal loysi te (sample ( 0 ) the a luminos i l ica te layers are separa ted by layers of water molecules and the s tacking of the layers is random. Under these c i rcumstances one would expect a lmost every site of F e ~+ subst i tut ion to be ad jacent to a 'defect ' in the above sense. This is conf i rmed by the spec t rum of Fig. 7 in which the only observed resonance in the gef~ ---- 4 region is at 1558 G. In the E S R spectra of powdered muscovi tes (not i l lustrated) this resonance is also dominant .
TABLE 1. X-band results and predictions hv --- 0.309 cm -1
Experimental Calculations results (Gauss) (Gauss)
(Resonances with very low relative intensity omitted)
(Mean values (1) A = 0.234 (3))~ = 0"333 (4) A = 0.207 for all samples) hv/D = 0"528 hv/D=O'103 hv/D = 0-960
740 717 12Y 685 12Y 727 12Y 56z
1356 1370 34z 1335 34z 1558 1546 34x,Y,z
1683 34x 1822 1850 34Y 1820 34x
Calcula t ions (see Tab le 1, site (3) ) show tha t the pred ic ted field of the Fe '~+ resonance for ~ ---- ] and large D (ger~ ---- 4'27) is at abou t 1546 G so that the central resonance m a y be identif ied with a Fe 3+ site of near m a x i m u m rhombic character . Since this resonance is isotropic, no more resonances near ge~f ---- 4 can arise f rom this site, so tha t the other observed lines at 1356 G and 1822 G mus t or iginate f rom different sites. The occurrence of a s trongly d is tor ted site in associa t ion with a s tacking defect or surface is, of course, ent i rely plausible . I t is, however , impor t an t to recognize that an isotropic resonance at ge~ ---- 4"27 will ar ise for a wide range of values of D, p rov ided ;~ is abou t �89 so tha t we cannot exclude the p o s s i b i l i t y tha t several sites of near m a x i m u m rhombic content associa ted with s tacking defects, cont r ibu te to the observed l ine at 1558 G.
The stacking d i sorder of kaol in i te may arise f rom one or more of several types of in ter layer defect descr ibed in terms of 120 ~ rotat ions, d isp lacements a long the b-axis of b /3 , inclusions of le f t -handed kaol in i te into a r igh t -handed crystal , inser t ion of dicki te layers etc. Because of the i so t ropy of the ge~ =- 4-27 resonance i t does not appea r l ikely, even if single crystals were avai lable , that the type of defect is ident if iable using E S R spectra.
A resonance near 700 G is pred ic ted for Fe 3+ for wide ranges of )~ and D for the transi t ions 56Z and 12Y. Calcula t ions show that the 12Y t ransi t ion should be marked ly more intense. The observed resonance at 740 G is due a lmos t cer ta inly to these transi t ions, domina ted by 12Y.
Two al ternat ive in terpre ta t ions are poss ible for the lines at 1356 G and 1822 G
Electron spin resonance in natural kaolinites 325
depending on whether one assumes ei ther tha t they are the t ransi t ions 34Z and 34Y or the t ransi t ions 34Z and 34X of a t r iple t for a F e '~+ site with X = 0-20 -- 0.25. Ange l & Ha l l (1972) prefer the second al ternat ive, having observed a fur ther reson- ance at higher fields which they a t t r ibute to 34Y. This resonance has not been seen in this study.
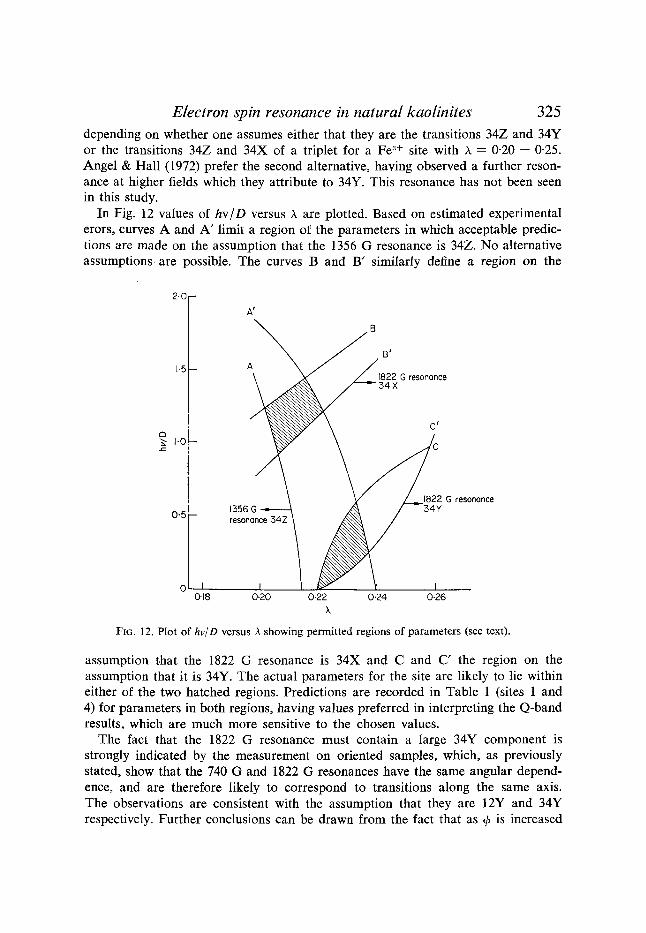
In Fig. 12 values of hv/D versus X are plot ted. Based on es t imated exper imenta l erors, curves A and A ' l imi t a region of the pa rame te r s in which acceptable predic- tions are made on the assumpt ion that the 1356 G resonance is 34Z. N o al ternat ive a s s u m p t i o n s are possible. The curves B and B" s imi lar ly define a region on the
2-0-- A S
A L l / J, 22 G,e,ononce ~ 34 X
~ b O - - C
2 G resononce
o
0 I , ] 0"18 0.20 0-22 0'24 0'26
>,
FIG. ]2. Plot of hv/D versus A showing permitted regions of parameters (see text).
assumption that the ]822 O resonance is 34X and C and C' the region on the assumption that it is 34Y. The actual parameters for the site are likely to fie within either os the two hatched regions. Predictions are recorded in Table 1 (sites 1 and 4) for parameters in both regions, having values preferred in interpreting the Q-band results, which are much more sensitive to the chosen values.
The fact that the ]822 O resonance must contain a large 34Y component is strongly indicated by the measurement on oriented samples, which, as previously stated, show that the 740 G and ]822 O resonances have the same angular depend- ence, and are therefore likely to correspond to transitions along the same axis. 3?he observations are consistent with the assumption that they are 12Y and 34Y respectively. Further conclusions can be drawn from the fact that as @ is increased

326 R. E. Meads and P. J. Malden
the intensities of the 740 G and 1822 G lines increase whilst that of the 1356 G line decreases. These facts suggest that the z-axis of the site is nearer to the normal to the ab plane than to the plane itself whilst the y-axis lies in the ab plane. A simple interpretation in terms of Fe 3+ substitution in octahedral sites, is thus possible.
In kaolinite the AP + ions are surrounded by 4 O H - ions and 2 0 5 - ions. The anions lie roughly in two planes parallel to the ab plane of the crystal. One of these planes, containing both the 02% is adjacent to the silica tetrahedral layer and the 0 2 - form the coupling between the alumina octahedra and silica tetrahedra since they are common to both. Expressing nearest neighbour symmetry in terms of ionic species and neglecting distortions from the ideal structure, an A13+ site has C2~ symmetry with its z-axis bisecting the O-A1-O angle and inclined at an angle of about 55 ~ to the ab plane. Of the remaining principal axes, one will lie in the ab plane (say y) along the line joining adjacent A13+ sites and the other (say x) will be at an angle of 35 ~ to the ab plane. This model is consistent with the observations of angular dependence. It is less easy to explain the results on the assumption of substitution in idealized Si x+ sites since the basic requirement of C2v or D~h symmetry is not satisfied (see Appendix).
The above interpretation must, however, be treated with caution, since the X-ray
} h i
I i 1 i I I I I 600 14OO 2200 3000 3800
Field (G)
FIG. 13. X-band spectrum of sample (b) prior to extraction of Fe rich impurities, 400-5000 G.

Electron spin resonance in natural kaol ini tes 327
and electron diffraction results for kaolinite, dickite and nacrite (Drits & Kashaev, 1960; Zvyagin, 1960; Newnham, 1961; Blount et al., 1969) all reveal substantial distortions from the ideal structure with the tetrahedral environment of S? + and the octahedral environment of A1 ~+ being far from perfect. Two distinct environ- ments for each cation are revealed, and F. R. Noble (personal communication) has noted that, whilst the S? + ions are centrally placed in their tetrahedra, displacement of A1 ~+ sites toward the hydroxyl triad at the kaolinite surface occurs. Such distortion would tend to increase the angle of the proposed z-axis to the ab plane beyond 55 ~
To summarize, the X-band results indicate the presence of at least two Fe 3+ sites, one of which has X = �89 and is associated in some way with stacking defects. The other has X in the range 0.22 and 0.24 and hv/D between 0 and 0-7. The presence of other sites is not excluded and is, as we shall see, required by the Q-band results.
Interpretation of broad resonance type B. The very broad ( ~ 1000 G) resonance centred near go~ =- 2 may be interpreted as due to transitions within the super- exchange multiplet (Reid et al., 1968) resulting from the coupling of two S-----5/2 ions in adjacent cation sites either in the kaolinite lattice or in an impurity phase. The transition is strong in the spectrum of sample (d) where the residual iron content is high. It is of interest also to compare the spectrum of sample (b) (Fig. 3) with that (Fig. 13) of the parent clay prior to magnetic extraction. The broad ge~ = 2 resonance is relatively much weaker in the magnetically extracted material than in the original, suggesting that, in this case, the resonance originates largely in the extractable impurity (mainly mica):
A broad resonance of type B was observed by Kemp (1972) in his work on phlogopite and was attributed to inclusions of ferrimagnetic material (magnetite). We prefer the above alternative explanation because the ESR spectrum of iron-rich biotites is dominated by the broad geff = 2 resonance, whilst the M6ssbauer spectra of the same materials (Hogg & Meads, 1970) show no evidence of significant amounts of a phase magnetically ordered at room temperature.
Interpretation of the get1 =2 resonances, type C. Figure 14 shows the ge~f~2 region of the spectrum of the highly crystalline sample (a) obtained at room temperature and at 140 K. Similar results are shown in Fig. 15 for the somewhat less perfectly crystallized sample (b). Room temperature spectra for samples (c) and (e) are shown in Figs. 16 and 17. It is believed that these rather complex and different results can be interpreted by postulating a minimum of three features labelled I, II and III, present to different relative amounts in the spectra.
Feature I. All the spectra show a basic doublet of the type expected in a powder (Searl, Smith & Wyard, 1959, 1961) for an S-state centre in a site of axial symmetry, so that two principal values of ge~ are obtained, depending on whether the magnetic field is applied parallel or at right angles to the symmetry axis. Almost identical values, gj~ = 2.046 _ 0-002, g• = 2-000 + 0.002 are obtained from all spectra. Feature I does not show any resolved hyperfine structure. Its relative intensity within the type C group increases progressively as the sample crystallinity decreases.
Feature II. The hyperfine pattern (Fig. 14) of sample (a) contains a total of nineteen lines, whilst that of sample (b) (Fig. 15) at reduced temperature shows

13E ( /3 h i
I I I I I 3150 3200 3250 3300 3350
Field ( G )
FIG. 14. X-band spectrum of sample (a), 3150-3350 G, at room temperature and 140 K.
i ==
b3 t Y s IJJ
T=290K
T=I40K
t -J I I 5150 3200 32'50 3350 3500
Field (G)
FIG. 15. X-band spectrum of sample (b), 3150-3350 G, at room temperature and 140 K.

Electron spin resonance in natural kaolinites 329
=o
(3:
laJ
j
ensitivity x 4
I i I i i t 3220 3260 -3300
Fie~,d ( G )
FIG. 16. X-band spectrum of sample (c), 3200-3320 G.
twelve strong lines with several other weak ones) arranged in two groups of six. The spacing of the hyperfine lines (7.6 G) is typical of that obtained for positive holes trapped near AP + ions substituting in Si ~+ sites in silica and some other alumino- silicates (see, for example Griffiths, Owen & Ward, 1955; O'Brien & Pryce, 1955; Hentz & Wickenden, 1969; Schnadt & R~iuber, 1971). Since the nuclear spin of A12~ is 5 /2 a single hyperfine multiplet should contain six lines. Feature II is most clearly distinguished in Fig. 15 and consists of another doublet similar to I but with gll = 2-028 + 0.002 and g• = 1.988. Both the g!T and g• resonance show six line hyperfine splittings which are enhanced on cooling. Feature II is relatively strongest in sample (a).
Feature III. Although traces of this feature are seen in the spectra of sample (b), it is clearly apparent in that of sample (a) (Fig. 14). A group of hyperfine lines weaker than those of II are observed on the low field side of the reson- ance. Further lines are observed in the region between the hyperfine multiplets due to II. Assuming a third doublet subject to hyperfine splitting we obtain gll = 2-047 +_ 0-002. Because of overlap of hyperfine patterns it is not easy to establish g• Possible values are, g j .= 2.014 + 0.002, 2-010 ___ 0.002, 2.006 _+ 0.002 and 2.001 _+ 0.002. It will be noted that the last of these values, together with the

330 R. E. Meads and P. J. Malden
I:r. o3
3 2 2 0 3 2 6 0 3 3 0 0 Field ( G )
FIG. 17. X-band spectrum of sample (e), 3200-3320 G.
fairly well-established value of g LI are identical with the corresponding parameters for feature I. I t is therefore possible that I and I I I are very closely related, the difference being the occurrence of hyperfine structure in III .
Figure 18 shows the g,~c = 2 region of the spectrum for an oriented specimen of sample (b). For ~ = 0 ~ the gll component of feature I is enhanced and the g• component diminished by comparison with ~b = 90 ~ There is an indication also that gii is enhanced at 90 ~ for feature II. These results suggest that the principal crystal field axis of feature I is orientated in a direction near the perpendicular to the kaolinite sheet whilst that of feature I I is more nearly parallel to the sheet. The hyperfine structure of feature I I is somewhat enhanced at q~ = 0 ~ Figure 19 shows the complete spectrum of a sample (a) after heating in air to 290~ for 23 h. I t will be noted that the overall intensity of the type C resonance is greatly dimin- ished relative to type A, which shows slight enhancement of the 1558 G resonance. Within the type C group resonances, feature I alone is observable after heating (Fig. 20). Spectra have been obtained after heating to higher temperatures at which structural changes occur resulting in the formation of metakaolin. These show the

Electron spin resonance in natural kaolinites 331
5=90 o
Ca')
G: CO Ld
o o
3 2 0 0 3220 I I I I I I I Z
3 2 4 0 3260 3 2 8 0 3300
Field ( G )
FIG. 18. X-band spec t rum of sedimented sample (b), 3200-3300 G, ~ = 0 ~ ~ = 90 ~
almost complete disappearance of type C resonances and of type A resonance which consists of a strong 1558 G line only (Fig. 21).
The occurrence of a hyperfine structure in feature I I having the form of two groups of six lines with hyperfine structure constant A ~ 7.6 G establishes that a hole trapped on an oxygen ion adjacent to an A1 '~+ ion substituted in a Si 4+ site is responsible. The variation of feature I I with angle suggests that site I I may be an 02- ion located at the surface of the kaolinite layer. Such an oxygen ion bridges a substituted AP + and a normal Si 4+. Feature III , exhibiting a somewhat weaker hyperfine structure, may be due to a hole located at the site of an inner oxygen ion bridging a substituted and a normal A1 ~+. In this case, since the hole interacts with two AP + ions, one might expect the hyperfine structure to contain more than twelve lines (Grunin et a/.,1973). Because of overlap of hyperfine multiplets this possibility cannot be excluded.
Because of the absence of hyperfine structure in feature I it would, at first sight, seem plausible to assume that site I does not involve the presence of a substituted A13+ but rather some other form of hole-trap such as an oxygen near another sub- stituted cation with zero nuclear spin or a non-bridging oxygen adjacent to a cation vacancy, possibly near a surface or stacking defect. However, there remains the

( / ) ILl
I ! I f I J I I I 600 14OO 21900 3000 3800
Field ( G )
FIG. 19. X-band spectrum of sample (a) after heating in air for 23 h at 290K, 400-5000 G.
o=
b5 0r 0 3 h i
I I I , I 5200 3250 ?,300 3350
Field ( G )
FIG. 20. X-band spectrum of sample (a) after heating in air for 23 h at 290K, 3150-3350 G.

Electron spin resonance in natural kaolinites 333
b3
~J
1 600
I I ~ I ~ I I I 1 4 0 0 2 2 0 0 3 0 0 0 5 8 0 0
Field ( G )
FIG. 21. X - b a n d s p e c t r u m o f m e t a k a o l i n , 2 0 0 - 5 0 0 0 G .
evidence that the g-values for sites I and I I I may be closely similar. This, together with the angular data, indicates the further possibility that site 1 may be a perturbed version of the inner oxygen site to which feature I I I has been tentatively attributed. The variation of feature intensities with crystallinity suggests that site I is associated in some way with stacking defects or crystal surfaces which may be the origin of the perturbation. The absence of hyperfine interaction does not preclude this inter- pretation. The origins of the hyperfine structure has been discussed by O'Brien & Pryce (1955). It is assumed that the hole consists of a vacancy in a molecular orbital consisting primarily of a non-bonding spz or px orbital on an oxygen atom with a small admixture of an orbital of aluminium with appropriate symmetry. The hole will spend most of its time 'on' the oxygen atom and a small proportion 'on' the aluminium. The degree of admixture of aluminium orbital will depend strongly on interatomic distances and bond angles and may, in a given case, produce no discern- able hyperfine structure. Conclusive identification of site I is not at this stage possible. It is clear, however, that it forms the most stable defect site in a poorly crystalline material.
It is suggested that, in a highly crystalline kaolin the principal defect sites (I1 and III) stable at room temperature are the 'outer ' and 'inner' oxygen atoms adjacent

334 R. E. Meads and P. J. Malden
to substituted A13+ ions as indicated above. On heating, diffusion of holes occurs, some of which are electrically discharged at surfaces, others being trapped at more stable sites (I) near surfaces. As heating is continued or the temperature raised almost complete annealing of the hole defects occurs. There are no grounds for assuming that changes in the type A resonances due to the kaolin-metakaolin transition are significantly related to the defect annealing process.
I t would be of interest to investigate the electrical conductivity and optical proper- ties of kaolinite in the temperature range 200-300~ at which defect annealing occurs. Following the work of Hentz & Wickenden (1969) on defects in irradiated silica gel it would also be useful to study the effect on the defect ESR signal of exposure to various chemical reagents.
Interpretation of hyperfine rnultiplets, type D. A typical X-band example of this type of spectrum is that perviously mentioned in sample (d), the Mount Crawford kaolin (Fig. 10) where six sharp resonances with some intermediate structure, centred at gof~ = 2 occurs in addition to the C-type resonance. Figure 22 shows the corresponding region of the Q-band spectrum.
This particular resonance pattern is closely similar, both at X-band and Q-band with that observed in a medelling clay by Bleaney & Rubins (1961)~ The X-band
m o=
b5 r ~
e l ) h i
I 1 I t I I 12.0 12-5 13.0 xlO 3
Field ( G )
FIG. 22. Q-band spectrum of sample (d), 12000-14000 G showing Mn 55 hyperfine structure.

Electron spin resonance in natural kaolinites 335
spectrum shows subsidiary resonances between the principal ones, whilst the Q-band spectrum does not. This spectrum is attributed to Mn 2+, the hyperfine effects occur- ring because of the nuclear spin I = 5/2 of Mn ~. Bleaney & Rubins showed that a well-resolved hyperfine spectrum is to be expected in a powder for an ion with spin > �89 In this case, provided the ratio D2/gBB is not large, the electron transition between magnetic substates + �89 of the ionic spin in the external field is only very weakly dependent on angle and the linewidths in the hyperfine spectrum in a powder are consequently narrow. The principal hyperfine lines correspond to A m ---- 0 for the nuclear magnetic quantum number. The subsidiary 'forbidden' lines correspond to /km--- + 1.
The requirement that DZ/gflB is small, suggests that the site involved has nearly cubic symmetry. This requirement is not fulfilled by either of the normal sites in kaolinite, although it is possible that transition ions may substitute in inter-layer sites in which the crystal field is weak. Some interesting and relevant observations on the ESR spectrum of Cu 2+ in interlayer sites, co-ordinated with water molecules, have recently been reported by Clementz et al. (1973). At present it is not possible to go further in identifying the site of Mn 2+ substitution. It is possible that it is located in an impurity phase.
The striking and complex hyperfine pattern observed in halloysite (sample ( f ) ) Fig. 7 and, with much lower intensity, in the Georgia clay sample (c ) (Fig. 5) is characteristic of the vanadyl ion (VO) 2+. Trace analysis of clays from the Georgia region yield, typically ~ 1000 p.p.m, by weight of vanadium. In the vanadyl ion, the vanadium is permanently bonded to a single oxygen so that the single d-electron in vanadium is normally in a ligand field of strongly axial symmetry. The spin Hamiltonian is defined by parameters gll and g• together with two different hyper- fine parameters All and A• coupling the electron to the 7 /2 nuclear spin of V 51. The powder spectrum consists essentially of two overlapping eight-line patterns with different centroids and splittings. Spectra of this type were observed in super- cooled solutions of (VO) 2+ in hydrochloric acid, by Garif'yanov & Kamenev (1964). Recently Chasteen et al. (1973) have obtained similar spectra in a study of the bonding of vanadium to insulin. Hutton (1971)' has studied (VO) 2+ in single crystals of zoisite and concludes that the ion substitutes in AI ~+ sites in this material.
The distinction between resonances of types C and D is as follows. Since AP + is "diamagnetic, hyperfine structure (type C) due to A127 may only arise if the ion is associated with a defect trapping a hole or electron or if it is, at least in part, covalently bonded to a paramagnetic ligand (ligand hyperfine structure). The type D resonance is due to the nuclear spin of an ion which itself is paramagnetic.
Q-Band spectra of kaolinite
Figures 23, 24 and 25 show full range spectra at Q-band (35.98 GHz) for samples (b), (d) and (e) and Figs. 26, 27 and 28 show expanded versions of spectra in the range 5000 to 7000 G. This region is important since it corresponds at this frequency to ge~f ~-4, at which resonances of type A may be expected. The geff = 4.27 resonance is predicted at 6063 G. g~f~ = 2 at Q,band corresponds to

if) w
~ - C O - o ~ ~- ~I" ~e~'~ 0 ',D 0'~
o - -
m ~
~ tD
(M
I I I 5.0 IO.0 15.O xlO 3
Field ( G )
FIG. 23. Q - b a n d spectrum o f sample (b), 2 0 0 0 - ] 8 0 0 0 G .
b3
I ~ I ~ 1 ~" O~
~ - t - - E 0"~
p.. CO ~J
I :>.5
I I I I I 5.0 7-5 I0-0 12.5 15.0 xl03
Field (G)
FIG. 24. Q-band spectrum of sample (d), 2000-]8000 G.

to tOtO GO 0
tO
tO
I I I I I I I 2'5 5"0 7'5 I0.0 12-5 15'0 xtO 3
Fie ld ( G )
FIG. 25. Q-band spectrum of sample (e), 2000-18000 G.
03
i , i
tO - - O0 ~ OJ ~ tO o t O t O tO tO
I I I I I i I i I 5 0 0 0 5500 6000 6500 7000
Fie ld ( G )
FIG. 26. Q-band spectrum of sample (b), 5000-7000 G.

cr- 113 ILl
CO ~ to tD cO ',~ b,-
I I I t . I t I I 5000 5500 6000 6500
Field (G)
F[o. 27. Q-band spectrum of sample (d), 5000-7000 G.
I 7 0 0 0
i l i t i I I 1 I . . . . ] 5 0 0 0 5 5 0 0 6 0 0 0 6 5 0 0
F ie ld ( G )
FI(~. 28. Q-band spectrum of sample (e), 5000-7000 G.

( ' 4
II
O
d~
~ , 8 ~ II
m
g o ,-, N ~ r~ { N
8 N N N ~
,,_.,
m ~
% . - , g ~ s
II
N ~ N
{ N t,N ~,1
N r - i
N
{"4
('N
t ~
t ~
I 'N
{"4
N
0 ~ {'-I
m m
N ~ N ;~N
N
N
{ }
{ '4
)< )< )<
("4
)<)<
o{} {'-.I
; ~ ) < N
~ N
)<
)<
I '--

340 R. E. Meads and P. J. Malden
12800 G so that at least part of the structure observed which centres near this frequency is likely to be due to type C and D resonances.
It is clear that the Q-band spectra are much more complex than those at X-band. Progressive differences between samples, related to crystailinity, are apparent.
In Table 2, principal resonances at Q-band for samples (b), (d) and (e) are listed, with the omission of sharp resonances and hyperfine detail near ge~f = 2. There are many recurrent features which are indicated in the Table but the relative intensities vary from sample to sample.
In the analysis of the following section, it is assumed that all the listed resonances are due to Fe d+ although it cannot be taken as certain that this assignment is correct in every case.
Interpretation of Q-band spectra. We require to interpret the Q-band results in a manner which is consistent with the interpretation at X-band. At the higher quantum energy the transitions become more sensitive to D so that, hopefully, values may be obtained for this parameter as well as for X. Analysis of resonances is, for the present, confined to the range 2000-13000 G although evidence for reson- ances at higher fields is occasionally seen. The simplest problem of interpretation is that presented by the line observed at a field of about 6070 G (average) in all the samples, with increasing intensity as the crystallinity index decreases. This clearly corresponds to the degenerate 34X, 34Y, 34Z transitions for X = I , and corresponds to the 1558 G line at X-band. For values of hv/D < 1 the line position is insensitive to D so that the most that can be said is that D is likely to be greater than 1.2 for this site. (hv at Q-band is 1.200 cm-1). Column 3 of the calculations section of Table 2 shows the predicted resonances for D = 3 and X = I. The experimental result agrees well with the predicted field of 6063 G. The predicted line at 2662 G is likely to be much weaker and was not observed. These results are entirely con- sistent with the interpretation of the 1558 G line at X-band.
The X-band results suggest that a less distorted Fe d+ site with X between 0-22 and 0.24 exists in kaolinite and a long series of calculations has been done to fit Q-band results to values of x in this range and values of D consistent with the requirements that hv/D < 0-7 at X-band, that is D > 0-44. The greatest success has been achieved with X = 0.234 and D between 0.58 and 0-60. Predictions are listed in columns 1 and 2 of Table 2. The positions of resonances predicted for X = 0.234 and hv/D between 1.80 and 2.10 are shown in Fig. 29. A value of D = 0-585 seems to give the best fit. Predictions of the resonances at 5760 and 6200 G, assuming that they are 34X, is critically dependent on D because of the maximum which occurs in the graph of hv/D v. field (Fig. 29) for this line in the relevant region. In order to interpret the resonance at 5541 G in sample (b) it is necessary to invoke a powder resonance corresponding to a stationary field value for transition 34 in the yz plane. The predicted field is 5600 G. For X = 0 234, D = 0-585 a resonance (34X) at 7688 G is predicted. The nearest observed resonance is at about 8000 G.
The probability that at least one other Fe d+ site is involved is indicated by the failure of the above parameters to predict the resonances observed at 8000, 10050 and 11897 G. The 11897 G resonance is observed only in the spectrum of sample

Electron spin resonance ht natural kaolinites 341
Q
2.10
2.00
1"90 --
1"80 I Z
~ 2 5 Z I4YZ
4Z 5Y/45Z
i I i I I I r I 2000 4000 6000 8000 Field (G) Q-Band,hv =1.200 cm, X =0.254-
12~
I I I I iO,O00 12,000
FIG. 29. Predict ions of resonant fields at Q-band (hv = 1.200 cm -1) for A = 0.234 and
hv/D = 1-80-2"10, 0-15000 G.
(b). The 8000 G resonance is observed in all the samples studied but is weak in the spectrum of sample (b). The intensity variations suggest that these resonances may be due to impurity phases. The resonance at 10050 G is, however, strong in the spectra of all the samples. Attempts were made to fit these resonances by parameters chosen within the upper hatched region of Fig. 12 which would give X-band spectra reasonably consistent with observations. Columns (4), (5) and (6) of Table 2 show three sets of predictions so obtained. On the whole, 2~ = 0.207, D ---- 0.322 seem to give the best fit and also predict a low field resonance at 2113 G which may correspond to that observed in several samples.
I t will be seen that for ~ ~ 0.2 a Q-band Fe 3+ resonance near 12800 G (gear = 2) is predicted, so that it is likely that a portion of the resonance observed near this field is due to type A processes involving Fe d+ as well as to type B, C and D processes.
The sites of Fe s+ substitution in kaolinite
M6ssbauer spectra obtained for many kaolinite samples by Hogg (personal com- munication) and the authors (Malden & Meads, 1967) show only one feature firmly attributable to Fe n+ in the kaolinite lattice, namely, a quadrupole doublet with

342 R. E. Meads and P. J. Malden
splitting of about 0-58 mm s -1 and isomer shift, relative to sodium nitroprusside, of about 0-65 mm s -1. The quadrupole splitting is characteristic of Fe ~+ in a site of moderate distortion and the isomer shift is at the lower end of the range to be expected for octahedrally co-ordinated Fe ~+. M(Sssbauer work on micas indicates the values of isomer shift to be expected for Fe ~+ M6ssbauer resonances in sheet silicates. Hogg & Meads (1970) have shown that a typical Fe 3+ isomer shift for an octahedral site in muscovites and biotites is 0-7 mm s -1 and the range of values obtained overlaps the value given above for kaolinite. Annersten et al. (1971) have shown that the isomer shift for tetrahedral Fe 3+ in a synthetic phlogopite is much smaller, about 0-3 mm s -1. Values of isomer shift appear, therefore, to distinguish clearly between octahedral and tetrahedral co-ordination and leave very little doubt that the principal site of iron substitution in kaolinite is indeed octahedral. In an integrated ESR spectrum, resonances in the geft = 4 region are much the largest component and must therefore be due to Fe 3+ in octahedral co-ordination. The strongest feature of the ESR spectrum of muscovites is a strong resonance at ge~ = 4-27 which is also almost certainly due to octahedral Fe +3.
As stated earlier, heating of kaolinites to ~ 300~ for some hours drastically reduces the intensity of the type C resonances and slightly enhances the 1558 G line of type A. The spectrum (Fig. 20) taken after heating beyond the tempera- ture at which dehydroxylation occurs show very strong enhancement of the 1558 G resonance and virtually no type C resonance. The product of the dehydroxylation process, metakaolin, is said to have a structure in which the aluminium sites undergo substantial modification from those of kaolinite. The AP + co-ordination is tetra- hedral, two oxygen ligands being linked to SP + ions. The SP + site is also tetrahedral. Thus Fe ~+ in a tetrahedral site in metakaolin gives a ge~ = 4.27 line. This is reasonable since with appropriate distortion, a tetrahedral site may have the required local symmetry. The change in the type A triplet on dehydroxylation does not provide any new evidence about the co-ordination of the original kaolinite Fe ~+ site. The results merely show that the moderately distorted (;~ ~ 0.2) site is con- verted into one with greater distortion (;~ ~ 3). In an integrated spectrum, the area (representing intensity) of the type C resonance is, in all cases, small compared with type A, so that the assumption that the increase of A and decrease of C on heating occurs as a result of the disappearance of Fe 3+ in octahedral sites and its reappearance in tetrahedral ones is not satisfactory.
S U M M A R Y A N D C O N C L U S I O N S
The observed ESR spectra of a series of kaolinites can be interpreted in terms of the following :
(a) Transitions of Fe ~+ ions in sites in which the crystal fields are large. There is strong evidence that the sites responsible arise by substitution of Fe 3+ for AP + in the octahedral sheet of kaolinite.
(b) Transitions involving Fe ~+ in adjacent cation sites in which superexchange effects are dominant.

Electron spin resonance in natural kaolinites 343
(c) Resonance of trapped holes. Some, at least, of the holes are situated at oxygen sites adjacent to A13+ ions substituting in sites normally occupied by Si 4+.
(d) Hyperfine interactions of the transition metal ions Mn z+ and (VO) ~+. Detailed examination of X-band and Q-band resonances of type A suggests the presence of three sites at least :
(i) A site with near maximum rhombic character having crystal field parameters D > 1.2, X =- �89 the occurrence of which is correlated with lack of crystalline perfec- tion of the material due to stacking defects.
(ii) A site with less rhombic character, with )~ ----- 0.234 D = 0.585 as likely parameters.
(iii) A site with parameters near the values X ---- 0.207 D = 0.322. It seems probable that sites (ii) and (iii) are occupied by Fe z+ in kaolinite well
away from stacking defects or crystal surfaces whilst site (i) is specifically associated with discontinuities in the structure.
The detailed X-ray and electron diffraction studies of kaolinite and closely related materials referred to earlier all show the presence of two distinct sites for both Si 4+ and AP + so the ESR evidence that at least two Fe z+ substituted sites are present in well-ordered crystals is quite plausible.
A C K N O W L E D G M E N T S
Thanks are due to Drs J. E. Cousins, J. R. Sambles and Mr M. Hardiman for obtaining ESR spectra on the X-band spectrometer in the Department of Physics, University of Exeter; also to Dr J. F. Gibson of the Inorganic Chemistry Department, Imperial College for the use of a Q-band spectro- meter; to Dr R. D. Dowsing of University College, Swansea for the use of his computer program.
The work has been supported by English Clays, Lovering, Pochin and Co. Ltd., St. Austell, Cornwall.
R E F E R E N C E S
AASA R. (1970) J. Chem. Phys. 52, 3919. ANNERSTEN H., DEVANARAVANAN S., HAGGSTROM L. & WAPPLrNG R. (1971) Phys. Stat. SoL B 48,
K137. ANGEL B.R. & HALL P.L. (1973) Proc. Int. Clay Conf. Madrid, 71. BI.EANEY B. & RUBENS R.S. (1961) Proc. Phys. Soc. Lond. 77, 103. BLOUNT A.M., THREADGOLD I.M. & BAILEY, S.W. (1969) Clays Clay Miner. 17, 185. BLLtMBERG W.E. (1967) Magnetic Resonance in Biological Systems (Ed. by Ehrenberg A., Malstr/Sm
B.E. & V~inngard T.), p. 119. Pergamon Press, London. BOESMAN E. & SCHOEMARER D. (1961) Compt. Rend. Acad. Sci. 252, 1931. BR~NDLEY G.W. & ROBINSON K. (1946). Min. MaR. 27, 242. CASTNER T., NEWELL G.S., HOLTON W.C. • SLICHTER C.P. (1960) J. Chem. Phys. 32, 668. CHASTEEN N.D., DEKOCH R.J., ROGERS B.L. & HANNA M.W. (1973) J. Am. Chem. Soc. 95, 1301. CLEMENTZ D.M., PINNAVAIA T.J. & MORTLAND M.M. (1973) J. Phys. Chem. 77, 196. DOWSING R.D. & GIBSON J.F. (1969) J. Chem. Phys. 50, 294. DRITS, V.A. & KASHAEV A.A. (1960) Kristallografiya 5, 224. FRIEDLANDER H.Z., FRINK C.R. & SALDICK J. (1963) Nature, 199, 61. GARIF'YANOV N.S. & KAMENEV S.E. (1964) Soviet Phys. JETP, 19, 340. GHOSE S. & TSANG T. (1973) Am. Miner. 58, 748. GRIFFITH J.S. (1964) Mol. Phys. 8, 213, 217. GRIFFITHS J.H.E., OWEN J. & WARD I.M. (1955) Rep. Conf. Defects in Cryst. Solids, Bristol (Phys,
Soc.) p. 81.

344 R. E. Meads and P. J. Malden GRUNIN V.S., IOFFE V.A. & YANCHEVSKAYA I.S. (1973) Soviet Phys. solidst. 14, 1839. HENTZ R.R. & WICKENDEN D.K. (1969) J. Phys. Chem. 73, 817. HINCKLEY D.N. (1965) Clays Clay Miner. 13, 229. HOGG C.S. & MEADS R.E. (1970) Min. Mag. 37, 606. HUTTON D.R. (1971) J. Phys. C. (Sol. St. Phys.) 4, 1251. KEMP R.C. (1971)J. Phys. C. (Sol. St. Phys.) 4, 11. KEMP R.C. (1972) J. Phys. C. (Sol. St. Phys.) 5, 3566. KEMP, R.C. (1973) Phys. Stat. Sol. b, 57, K79. MALDEN P.J. & MEADS R.E. (1967) Nature, 215, 844. NEWNHAM R.E. (1961) Min. Mag. 32, 683. NOBLE F.R. (1971) Clay Miner. 9, 71. O'BRIEN M.C.M. & PRYCE M.H.L. (1955) Rep. Conf. on Defects in Cryst. Solids, Bristol (Phys. Soc.)
p. 88. PARKER T.W. (1969) Clay Miner. 8, 135. REID A.F., PERKINS H.K. & SIENKO M.J. (1968) Inorg. Chem. 7, 119. ROBERTSON R.H.S., BRINDLE'/ G.W. & MACKENZIE R.C. (1954) Am. Miner. 39, 118. SCHNADT R. & R~.UBER A. (1971) Sol. St. Commun. 9, 159. SEARL J.W., SMITH R.C. • WYARD S.J. (1959) Proc. Phys. Soc. Lond. 74, 491. SEARL J.W., SMITH R.C. & WYARD S.J. (1961) Proc. Phys. Soe. Lond. 78, 1174. WAUCHOPE R.D. & HAQUE R. (1971) Nature Phys. Sci. 233, 141. WICKMAN H.H., KLEIN M.P. & SHIRLEY D.A. (1965) J. Chem. Phys. 42, 2113. ZVYAGIN B.B. (1960) Kristallografiya, 5, 40. ZVYAGIN B.B. (1964) Electron-diffraction Analysis of clay mineral structures. Plenum Press, London.
A P P E N D I X
The spin Hamil tonian appropriate to the interaction of the S-state ions Fe a+ (or Mn ~+) with strong crystal fields is of the form
~ = 3 ( B . g . S ) + F~ 8 7 0 7 + Y~ B 7 0 7 m=0,2 m=O,2,4-
where B is the external magnetic field,/3 the Bohr magneton, g, the g-factor tensor
and S the operator corresponding to the ion's spin. The 0 m are functions of the k
operators S~ Sy and S~ corresponding to components of S along the principal axes
of the crystal field. The B m are related to the coefficients in the expansion of the k
crystal potential in terms of spherical harmonics. Some single crystal experiments require the inclusion of the fourth order terms, but it appears that powder spectra can generally be interpreted using a Hamil tonian containing only second order crystal field terms. This may be written
( 1 S ( S + 1 ) ) + E ( S ~ - S 2 y ) . ~,~ = g B . S + D S ~ -
Here D = 3B ~ E = BE and it has been assumed that g is isotropic. The "second and third terms in the expression represent the effects of axial and rhombic components of the crystat "field respectively.
The case D = E = 0 corresponds to a free ion in the magnetic field B. E = 0

E l e c t r o n sp in r e s o n a n c e in n a t u r a l k a o l i n i t e s 345
implies a field of axial symmetry and increasing values of X ( = E/D) correspond to increasing rhombic character. In the absence of B diagonalization of the Hamil- tonian for the ~$5/z ground state of high-spin Fe 3+ gives a level structure comprising three Kramer's doublets whose degeneracy is removed when B is applied. A detailed discussion of the eigenfunctions and eigenvalues was given by Wickman et aI. (1965). Castner et al. (1960) showed that for large 4, the transitions between the levels (3, 4) of the middle Kramer's doublet is isotropic and gives rise to the resonance men- tioned in section 1-3 at ge~ = 4.27. Castner et al. (1960) found this resonance in experiments on Fe ~+ in glasses. In amorphous or polycrystalline samples, spin reson- ances which are rapidly varying functions of the angle between B and the principal axes of the crystal field, will not be observed. The gef~ -=-- 4-27 resonance has sub- sequently been observed in a number of other polycrystalline materials containing Fe3+.
The above treatment was subsequently modified by Blumberg (1967) who noted that maximum rhombic character is achieved when ~ = �89 and further increase from ;~ = k to X = 1 implies regression toward the axial field situation with change of axes. The ge~f = 4-27 resonance will be observed when )~ = �89 and hv/D < ~ 1, where h,. is the microwave energy. Consideration of the crystal potential giving rise to the above simplified Hamiltonian led Griffith (1964) to predict that this isotropic resonance should be characteristic of Fe 3+ in certain symmetries, namely, those hav- ing point groups C2v and Dzh.
A considerable advance in the prediction of resonance positions and intensities was made by Dowsing & Gibson (1969) and Aasa (1970). The conditions under which reasonably well-defined resonances may be observed in powdered specimens is as follows: a resonance will be observed only for those angles of magnetic field with respect to crystal field axes for which the resonant field is varying slowly with angle, i.e. values for which the resonant magnetic field passes through a stationary value. In practice, this occurs when crystallites in the powder are oriented with the magnetic field along the x-, y- or z-axes of the crystal field, hence the notation for powder resonances given in 1.3. Aasa (1970) showed that further powder lines arise for certain angles of B lying in the xy, yz and zx planes. Dowsing & Gibson (1969) and Aasa (1970) have compiled the eigenvalues of the Hamiltonian as a function of D and ;t and, using somewhat different forms of presentation, have plotted the fields at which powder resonances are to be expected for different microwave frequencies. The computations of resonant fields required to interpret the present results have been carried out using a programme kindly supplied by Dr R. D. Dowsing. Gibson and others have applied their calculations to interpret Fe 3+ and Mn 2+ ESR spectra in, mostly, inorganic crystals, whilst the work of Aasa is motivated by interest in biochemicals containing Fe 3+.
As shown in Fig. l, when ~ is less than 5- the geff = 4 resonance is no longer isotropic and the powder spectrum in that region is a triplet corresponding to B along each of the three principal axes. A further characteristic feature of the Fe 3+ spectrum in fields of high anisotropy is the resonance near ge~ = 9 due, largely, to the transition 12Y.