electrodialytic remediation of soil fines (< 63μm) · the occurrence of water splitting is well...
TRANSCRIPT

General rights Copyright and moral rights for the publications made accessible in the public portal are retained by the authors and/or other copyright owners and it is a condition of accessing publications that users recognise and abide by the legal requirements associated with these rights.
Users may download and print one copy of any publication from the public portal for the purpose of private study or research.
You may not further distribute the material or use it for any profit-making activity or commercial gain
You may freely distribute the URL identifying the publication in the public portal If you believe that this document breaches copyright please contact us providing details, and we will remove access to the work immediately and investigate your claim.
Downloaded from orbit.dtu.dk on: Jan 01, 2020
Electrodialytic Remediation of Soil Fines (<63m) in SuspensionInfluence of Current Strength and L/S.
Jensen, Pernille Erland; Ottosen, Lisbeth M.; Ferreira, Célia
Published in:Electrochimica Acta
Link to article, DOI:10.1016/j.electacta.2006.03.116
Publication date:2007
Link back to DTU Orbit
Citation (APA):Jensen, P. E., Ottosen, L. M., & Ferreira, C. (2007). Electrodialytic Remediation of Soil Fines (<63m) inSuspension: Influence of Current Strength and L/S. Electrochimica Acta, 52, 3412-3419.https://doi.org/10.1016/j.electacta.2006.03.116

Electrodialytic Remediation of Soil Fines (< 63μm) in Suspension
- Influence of Current Strength and L/S.
Pernille E. Jensen a * , Lisbeth M. Ottosena, Célia Ferreirab
aDepartment of Civil Engineering, Kemitorvet, Building 204, Technical University of
Denmark, 2800 Lyngby, Denmark. b CERNAS, Escola Superior Agrária, 3040-316
COIMBRA, Portugal.
ABSTRACT
Current treatment of the remaining soil fines from soil wash is onerous and
expensive, and therefore, in this work, we investigated the feasibility of
electrodialytic remediation (EDR) as an alternative treatment. The study focuses on
EDR efficiency as a function of current strength, liquid-to-solid-ratio (L/S), pH and
time. We found out that during the experiments, Pb was easily dissolved by the
acidification resulting from water splitting at the anion-exchange membrane. When
higher currents and/or higher L/S ratios were applied, it was found that water
splitting occurring at the cation-exchange membrane increased the pH, and this
resulted in decreased remediation efficiency. It was shown that complete
remediation of the soil-fines is possible, with the majority of the Pb being
transported into the catholyte and precipitated at the cathode. Based on the results
it is recommended that EDR is implemented using a number of reactors in series,
* Corresponding: author [email protected]
1

where the initial reactor works at the highest possible removal rate, and the final
reactor works at the target Pb-concentration.
KEYWORDS: Electrodialysis; Pb; soil remediation; soil washing; water splitting.
1 INTRODUCTION
1.1 Soil washing
Particle separation techniques based on size or density differences are standard
operations in the supply of clean sand for concrete, road-building and in mining
technology . Variations of such techniques namely soil washing have been
investigated for their potential application in remediation of contaminated soil , and
constitute one of few options in the treatment of heavy metal (HM) contaminated
soil. Through soil washing, the oversize material can be cleaned simply by water-
rinse. The fine and coarse sands can be treated by density/gravity separation
processes, followed by an extractive soil washing where an appropriate extractant
is added. The remaining silts and clays, which generally contain the highest
concentrations of contaminants, are dewatered and treated by
stabilization/solidification techniques to immobilize the contaminants . However,
fines are dewatered with difficulty: minimum 45% water-content after thickening
and pressurized belt filter press . Including a volume increase due to the
stabilization/solidification-process, the final volume of contaminated material may
well resemble the initial even though a considerable volume of clean materials has
been obtained. The limited success of soil washing can largely be attributed to this
troublesome treatability and handling of the fine fraction. Attempts have been made
2

to use the contaminated fines for brick- and roof-tile fabrication for which clay is a
natural raw material. However, legacy- and confidence matters have restrained this
solution . An introduction of an efficient unit-process for decontamination of the
fines is necessary to make soil washing an environmentally and economically
profitable process, where contaminated soil is remediated and well-defined
materials for construction-purposes are produced.
With the objective to develop a method for treatment of the remaining fines
from soil washing, this work aims at investigating the feasibility of Electrodialytic
remediation (EDR) of Pb-contaminated fines in suspension. Influence of L/S and
current were identified as important, basic parameters, and therefore this work
focuses on elucidation of remediation dependency on these.
1.2 EDR of Pb from fine-grained material in suspension
EDR is an electrokinetic remediation method, where ion-exchange membranes
function as barriers, which physically hinder intrusion of hydrogen and hydroxide-
ions from the electrode processes into the contaminated material. EDR of HM
contaminated soils has up till now been tested only for stationary set-ups.
However, EDR of fine materials was already tested in suspension (non-stationary
set-up) for fine-grained material, such as municipal solid waste incineration (MSWI)
fly ash , wood combustion fly-ash , straw combustion fly-ash , wastewater sludge
and contaminated harbor sediments . These materials are difficult to handle in solid
form, and therefore the suspended EDR setup was introduced .
In MSWI fly ash, Pb was found to be the least mobile of the contaminating
metals, and only 8% was removed after 3 weeks of remediation (0.796 mA/cm2 and
3
L/S-ratio 6.5) . The low removal led to introduction of desorbing agents, such as
sodium-citrate (12% removal after 2 weeks for the same ash and experimental
conditions) and ammonia/ammonium citrate (20% removal after 70 days) . From a
different fly ash, 30.7% Pb was removed after 12 days (0.8mA/cm2 and L/S 5.25) .
From contaminated harbor sediments, Pb was removed more efficiently: 76% Pb
was removed after 21 days (0.6 mA/cm2 and L/S 4) in distilled water . Remediation
was shown to depend on L/S-ratio and current-strength as well as time, and 91-
96% was removed from various harbor sediments after 14 days (1.393mA/cm2 and
L/S 8) .
1.3 Ion-exchange membranes and water splitting
For all the fine-grained materials referred above, as well as in EDR of soil in
stationary set-up , water splitting was observed at the surface of the anion-
exchange membrane. The occurrence of water splitting is well known from dialysis
of liquid samples , and accelerated water splitting is used for electro-synthesis of
acids and bases in industry. Accelerated water splitting is obtained through
application of bipolar ion-exchange membranes at the surface of which the
dissociation rate is 107-108 times faster than in free solution . The presence of soil
also affects the water splitting rate positively e.g. application of iron
hydroxide/oxide and silica sol at cation-exchange membranes increased the rate
up to 104-105 times . Due to the negatively charged surface of soil-constituents
such as clay and organic matter, the interface between an anion-exchange
membrane and soil constituents is in effect bipolar, and very little cation-exchange
4

capacity or clay is necessary for water splitting to occur at the bipolar interface
between anion-exchange membrane and soil .
Initiation of water splitting is related to the limiting current ( limi ). As current is
increased, the ion-concentration at the surface of the membrane approaches zero
(concentration polarization), and limi is reached:
blim m bl
zD c(t t )Fi
δ=
− (1)
Here z is the charge, F is Faraday’s constant, bc is the ion-concentration in the
bulk solution, δ is the boundary layer thickness. mt and blt are the transport
numbers of the counter-ions transported in the membrane and the boundary layer
respectively, and D is the diffusion coefficient of the counter ions in the boundary
layer . A region exists, where voltage is increased dramatically with an increase in
the current. In this region the additional energy (ΔV) is a result of increasing
resistance associated with the concentration polarization in the boundary layer at
the polarized membrane side . The limiting current density increases with
increasing ionic concentration ( bc ) and decreases with thickness of the boundary
layer (δ ). Consequently the limiting current increases with decreased L/S-ratio
(more ions available). Furthermore limi increases in a stirred system compared to
a stationary set-up because the boundary layer is decreased. In EDR of soil in
stationary systems, the limiting current density for the cation-exchange membrane
was in two cases found to be around 0.4 mA/cm2 , while the limiting current for the
anion-exchange membrane is close to zero. The water splitting at the anion-
5
exchange membrane results in acidification of the soil with dissolution of HM’s as a
consequence. This acidification is the foundation of unenhanced EDR of HM-
containing materials . Water splitting at the cation-exchange membrane is in most
cases unwanted due to production of hydroxide-ions and decreased mobility of
most HM’s under alkaline conditions, why the ideal current density is found just
below limi for the cation-exchange membrane.
2 MATERIALS AND METHODS
2.1 Soil
The experimental soil is an industrially contaminated Danish soil of unknown origin,
characterized in as soil 10 to be rich in carbonate and feldspar, low in organic
matter and relatively rich in phosphate. SEM-EDX analysis revealed a mixed Pb-
pool, where Pb was identified in association with iron/aluminum-minerals, metallic
alloys, solder, chloride and pure (possible metallic) Pb .
The soil-fines were obtained by simple wet-sieving of the original soil with
distilled water through a 0.063mm sieve. A concentrated slurry of fines was
obtained by centrifugation at 3000rpm for 10 min. followed by decantation of the
supernatant. The soil-fines were kept as slurry and stored at 5ºC in presence of
oxygen. Prior to an experiment, distilled water was added to the slurry to obtain the
wished L/S-ratio.
2.2 Characterization
6

The original soil as well as the fines were analyzed for the following parameters:
Metals (Fe, Pb) were measured by AAS/graphite furnace. Soil samples were
digested according to the Danish standard method DS259 , which includes acid
digestion of 1g soil with 20.00mL of half concentrated HNO3 in autoclave at 200kPa
and 120ºC for 30 minutes and filtration through a 0.45µm filter. Liquid samples with
pH > 4 were digested with one part of conc. HNO3 to four parts of liquid in
autoclave at 200 kPa and 120ºC for 30 minutes prior to AAS measurement.
Carbonate content was determined volumetrically by the Scheibler-method when
reacting 3g of soil with 20mL of 10% HCl. The amount was calculated assuming
that all carbonate is present as calcium-carbonate. Organic matter was
determined by loss of ignition in a heating furnace at 550ºC for 1 hour. CEC was
decided by ion exchange of 10g dry soil with NH4+, followed by exchange of NH4
+
for Na+. The ammonium concentration of the centrifugate was measured by
spectrophotometer via flow-injection. Phosphate was measured after digestion of
0.2-0.5g sample at 550ºC followed by boiling with HCl. The sample was reacted
with ammonium molybdate to form yellow phosphor-molybden acid, which was
reduced by ascorbic acid in the presence of antimony. The strong blue color was
measured by spectrophotometer Shimadzu UV-1601. pH was measured by
electrode MeterLab® CDM220 after shaking of 5.0g dry soil with 12.5mL 1M KCl
constantly for 1 hour, followed by settling for 10min. Pb concentration in each
grain-size fraction was measured according to DS 259 after wet-sieving (with
0.002M Na4P2O7) approximately 100g naturally wet soil through a 0.063mm sieve
followed by separation by dry sieving of the larger fractions (>0.063 mm). Each
fraction was grounded thoroughly with a mortar and pestle in order to obtain a
7

homogeneous distribution of Pb. Desorption dependency on pH: 5.00g of dry,
crushed soil was mixed with 25.00ml reagent at a shaking table at 200rpm for 7
days. pH was measured after 10min settling, and the liquid was filtered through a
0.45μm filter for subsequent measurement on AAS. The reagents were: 1.0M
NaOH, 0.5M NaOH, 0.1M NaOH, 0.05M NaOH, 0.01M NaOH, distilled water,
0.01M HNO3, 0.05M HNO3, 0.1M HNO3, 0.5M HNO3, 1.0M HNO3. Sequential
extraction was made according to the method from the Standards, Measurements
and Testing Program of the European Union : 0.5g of dry, crushed soil was treated
in four steps as follows: I) Extraction with 20.0ml 0.11M acetic acid pH 3 for 16
hours. II) Extraction with 20.0 ml 0.1M NH2OH∙HCl pH2 for 16 hours. III) Extraction
with 5.0ml 8.8M H2O2 for one hour and heating to 85ºC for one hour with lid
followed by evaporation of the liquid at phase 85ºC until it had reduced to < 1ml by
removal of the lid. The addition of 5.0 ml 8.8M H2O2 was repeated followed by
resumed heating to 85ºC for one hour and removal of the lid for evaporation until
almost dryness. After cooling down, 25.0 ml 1M NH4OOCCH3 pH 2 was added,
and extraction took place for 16 hours. IV) Finally digestion according to DS 259
was made for identification of the residual fraction. Between each step the sample
was centrifuged at 3000rpm for 15min, and the supernatant was decanted and
stored for AAS analysis. Before addition of the new reagent the sample was
washed with 10.0ml distilled water for 15min, centrifuged at 3000rpm for 15min and
the supernatant was decanted. All extractions were performed at room temperature
while shaking at 100rpm unless otherwise mentioned. All analyses were made in
triplicate except CEC and sequential extraction which were made in double.
8

2.3 Remediation experiments
Electrodialysis experiments were made in cylindrical Plexiglas-cells with three
compartments. Compartment II, which contained the soil-slurry was 10 cm long
and 8 cm as an inner diameter. The slurry was kept in suspension by constant
stirring with plastic-flaps attached to a glass-stick and connected to an overhead
stirrer (RW11 basic from IKA). The anolyte was separated from the soil specimen
by an anion-exchange membrane, and the catholyte was separated from the soil
specimen by a cation-exchange membrane. Figure 2.1 shows a schematic drawing
of the setup. Both membranes were obtained from Ionics® (types AR204SZRA and
CR67 HVY HMR427). Electrolytes were circulated by mechanical pumps (Totton
Pumps Class E BS5000 Pt 11) between electrolyte chambers and glass bottles.
Platinum coated electrodes from Permascand® were used as working electrodes,
and the power supply was a Hewlett Packard® E3612A. The electrolytes initially
consisted of each 500mL 0.01 M NaNO3 adjusted to pH 2 with HNO3.
OH-
Figure 2.1: Schematic view of a cell used for experimental EDR remediation of
soil-fines in suspension. AN = anion-exchange membrane. CAT = cation-exchange
membrane.
9
Current, voltage and pH in all chambers as well as conductivity in chamber II, were
measured approximately once every 24 hours. During the electrodialysis
experiments current passed between the electrodes. Due to electrode processes
pH-changes occurred in the electrolytes, and pH in the electrolytes was manually
kept between 1 and 2 by addition of HNO3 and NaOH.
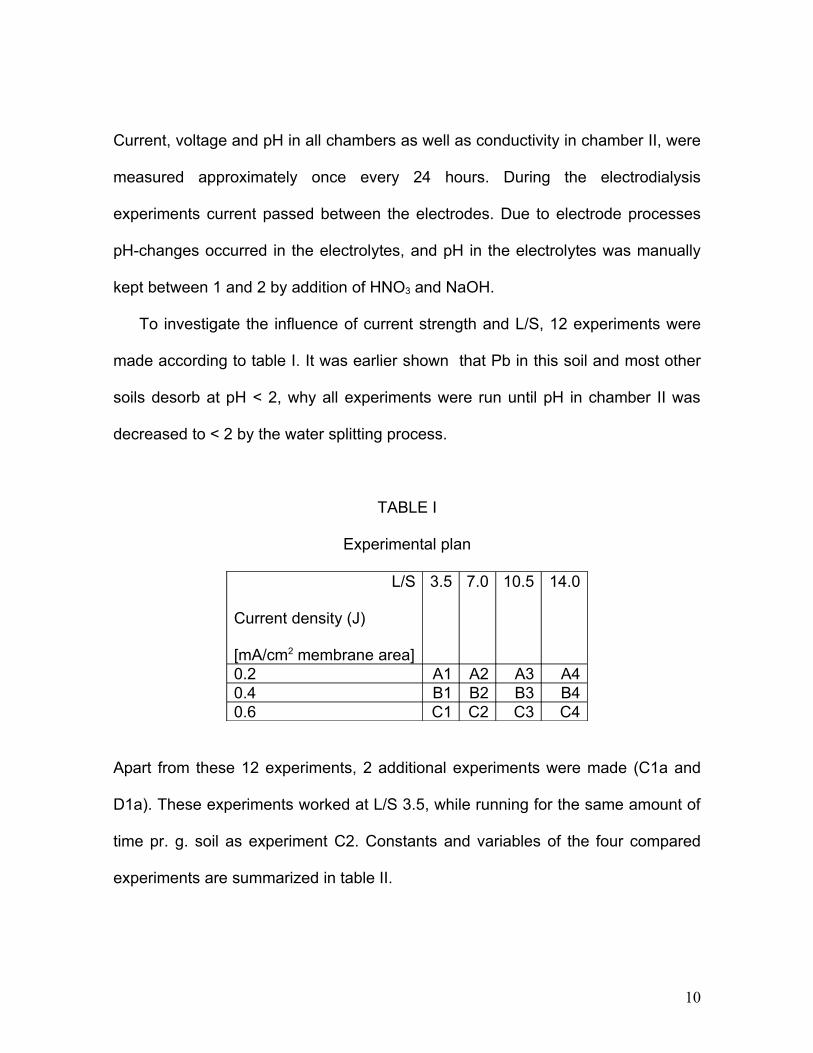
To investigate the influence of current strength and L/S, 12 experiments were
made according to table I. It was earlier shown that Pb in this soil and most other
soils desorb at pH < 2, why all experiments were run until pH in chamber II was
decreased to < 2 by the water splitting process.
TABLE I
Experimental plan
L/S
Current density (J)
[mA/cm2 membrane area]
3.5 7.0 10.5 14.0
0.2 A1 A2 A3 A40.4 B1 B2 B3 B40.6 C1 C2 C3 C4
Apart from these 12 experiments, 2 additional experiments were made (C1a and
D1a). These experiments worked at L/S 3.5, while running for the same amount of
time pr. g. soil as experiment C2. Constants and variables of the four compared
experiments are summarized in table II.
10

TABLE II
Constants and variables of two additional experiments and
the experiments with which they are compared.
Experiment C1 C1a C2 D1aCurrent density (i)
[mA/cm2 membrane area]
0.6 0.6 0.6 0.8
L/S 3.5 3.5 7.0 3.5Treatment-time (hours/gram
soil)
6.0 11.5 11.5 11.5
3 RESULTS AND DISCUSSION
3.1 Soil characteristics
Characteristics of the original soil and the soil fines are listed in table III. The soil
fines contain more Pb, carbonate, organic matter and iron than the original soil.
Also CEC is higher, probably due to higher fraction of organic matter and clay-
minerals. In contrast the phosphate-content is lower.
TABLE III
Characteristics of the soil fines and the original soil
Pb
[mg/kg]
pH CaCO3
[%]
Organic matter
[%]
CEC
[meq/100g
]
PO43-
[mg/kg]
Fe
[g/kg]
Soil fines 1170 7.8 17.3 7.8 14.1 559 27.3Original
soil
1090 7.8 9.2 2.8 4.5 1547 13.6
11

Figure 3.1 reveals that Pb is concentrated in the < 63µm fraction as well as in the
fraction between 0.25 and 1mm. In this larger fraction Pb is unevenly distributed
(large standard deviation on analysis of Pb), and may well be found as discrete
particles of contaminating metal, which may be separated from the soil matrix by
density-separation during soil washing. It should be stressed that no attempts have
been made to optimize the soil washing process, and an even more pronounced
concentration in the fines could be expected if this was done.
1632
558 594 544
1785
334 40768
0
500
1000
1500
2000
1 2 3 4 5 6 7 8
Size fraction
Pb [m
g/kg
]
Figure 3.1: Distribution of Pb in soil fractions. 1: 0-0.063mm; 2: 0.063-0.080mm; 3:
0.080-0.125mm; 4: 0.125-0.250mm; 5: 0.250-1.000mm; 6:1.000-2.000mm; 7:
2.000-4.000mm; 8: > 4.000mm.
In figure 3.2, the desorption dependency on pH from the original soil and the soil
fines is illustrated. At pH below 2 most of the Pb is desorbed from both materials,
and their extraction-patterns are very similar.
12

0102030405060708090
100
0 2 4 6 8 10 12 14
pH
Pb e
xtra
cted
(%)
original soilfines
Figure 3.2: Desorption dependency of Pb in original soil and soil fines.
Sequential extractions of the soil-fines and original soil show (figure 3.3) a large
residual fraction of Pb in the original soil, while most of the Pb in the fines is
released during oxidization. The higher mobility of Pb in the fine fraction suggests
that Pb in the coarse fractions may exist in stabile e.g. metallic compounds. As the
stabile compounds are slowly transformed under environmental conditions, the Pb
may preferably bind to organic matter and clay-particles prevailing in the fine
fraction.
0%20%40%60%80%
100%
Originalsoil
Fines
Residual
Oxidiseable
Reducible
Carbonates +exchangeable
13

Figure 3.3: Sequential extraction of Pb from soil fines and original soil.
3.2 EDR experiments
Table IV gives results of the 12 experiments listed in table I.
14

TABLE IV
Results of EDR experiments.
Best results in each series are emphasized by bolding.
Exp.
No.
Mass-
balance
[%]
Hours
to
reach
pH <
2
Hours
pr. g
soil
Current
efficiency
[‰]
Pb
removed
from II
[%]
Pb in
liquid
in II
[%]
Hours
pr. mg
Pb
removed
Final
Pb soil
conc.
[mg/kg]
A1 126 713 6.9 0.4 21 43 29.5 681
A2 130 403 7.5 0.5 25 35 22.9 753
A3 125 330 8.9 1.0 63 14 9.9 407
A4 134 265 9.5 1.2 72 5 8.5 426
B1 113 495 4.8 0.4 32 38 13.9 584
B2 133 334 6.2 0.6 51 21 8.2 506
B3 115 240 6.5 0.9 86 0.6 5.6 224
B4 161 474 17.0 0.5 87 1.6 10.4 212
C1 159 621 6.0 0.7 72 15 4.6 309
C2 87 621 11.5 0.3 90 0.7 12.7 119
C3 132 788 21.3 0.2 96 1.4 14.3 42
C4* 91 809 28.9 0.1 93 0.0 29.3 133
*Reached maximum voltage (137.1V) after 330 hours and continued with variable
current density (0.3-0.5mA/cm2) until 447hours, where the current density
increased to 0.6mA/cm2 again and remained stabile. pH in this experiment did not
reach 2 when the experiment was terminated.
3.2.1 Mass balances
15

Mass-balances for Pb were obtained between 87 and 161%. Since the initial Pb-
concentration was determined as a triplicate measurement in a batch of soil-slurry,
containing slurry for several experiments, and the final amount was specifically
calculated for the single experiment, the final concentration is regarded the most
precise, and therefore used when calculating removal percentages. In each
experiment a weight-loss approximately equivalent to the amount of CaCO3 in the
soil was observed.
3.2.2 Water splitting and current efficiency
In the A-series of experiments, the time to reach pH <2 decreased with increased
L/S, as expected, due to presence of less soil and therefore less buffer capacity of
the slurry. In the B-series and even more pronounced in the C-series however,
other mechanisms influence the acidification of the slurry. In the B-series time to
reach pH <2 was decreasing from experiment 1 through 3; while increasing
dramatically in experiment 4. In the C-series time to reach pH <2 is increased
compared to the B-series although current was increased, and within the series
itself an increase was observed throughout the whole series. The effect was even
more pronounced when calculated as hours to reach pH <2 pr. g of soil. The
reason for this increase we believe is the exceeding of the limiting current-density
for the cation-exchange membrane resulting in production of hydroxide-ions. The
lack of ions becomes more pronounced as L/S and current increases due to less
soil material to supply the ions and more ions necessary for transport. With
production of both hydrogen and hydroxide-ions in the cell, acidification was
impeded. In addition, part of the current was transported by hydrogen and
16

hydroxide-ions, resulting in a decreased current efficiency (‰ of the charge carried
by Pb2+) as seen for experiments B4 and C2-C4. The described processes became
more pronounced the more current was forced at the system. In general however,
current efficiency was approximately 10 times larger than when remediating harbor
sludge probably because the soil contains less soluble salts competing for the
current. Experiment C4 is an example of the utmost consequence of forcing too
much current over the system: the lack of ions became pronounced, and even
water splitting was unable to compensate. As a result resistance increased
dramatically, and the constant current-density could not be kept.
The mechanisms are illustrated in detail in figure 3.4 showing the conductivity
of the soil-slurry as a function of time; figure 3.5 illustrating the pH-development
and figure 3.6 showing the voltage-development. After a “lag-period”, conductivity
increased in all experiments except C4. The extent of the “lag-period” was related
to the current-density and L/S relationship with a longer “lag-period” for
experiments with high current density and high L/S. The conductivity of the soil-
slurry in all experiments in the A-series, as well as B1-B3 and C1 started to
increase after approximately 150 hours. While the conductivity increase for
experiment B4, C2 and C3 appeared after almost 400, 450 and 620 hours
respectively and the conductivity increase in C4 was never observed.
17

0
5
10
15
20
25
0 100 200 300 400 500 600 700 800 900
time (hours)
cond
uctiv
ity (m
S/cm
)
A1A2A3A4B1B2B3B4C1C2C3C4
Figure 3.4: Conductivity in the soil-slurry of the 12 experiments as a function of
time.
In figure 3.5 the pH-development is illustrated. All experiments except C4 reached
<2, and were then terminated. As already discussed, the time to reach pH<2 within
each series of experiments depends on the L/S-ration for experiments not affected
by water splitting at the cation-exchange membrane (A1, A2, A3, A4, B1, B2, B3).
During the lag-phase we believe that soluble salts including carbonates were
removed from the soil. As the buffer-capacity was spend, the excess production of
H+-ions in the soil-slurry resulted in the simultaneous pH-decrease and conductivity
increase.
18

1357
0 200 400 600 800time (hours)
pH
1357
0 200 400 600 800time (hours)
pH
1357
0 200 400 600 800time (hours)
pH
A1 A2 A3 A4
B1 B2 B3 B4
C1 C2 C3 C4
Figure 3.5: pH-development in the 12 experiments as a function of time.
In figure 3.6 it is illustrated how the voltage in all experiments in the A-series was
low (<10V) throughout the experimental time. Experiment B2, B3, C1 and C2
showed a few incidents of high voltage caused by precipitation of hydroxides in the
cation-exchange membrane in connection with high pH in the catholyte. In these
cases voltage decreased immediately after pH-adjustment. In comparison the
voltage-increases in experiments B4, C3 and C4 were more constant and not
related to pH-increases in the catholyte. These voltage increases we believe
appear due to extensive concentration polarization and water-splitting at the anion-
exchange membrane, and the observations suggest that under continuous pH-
19
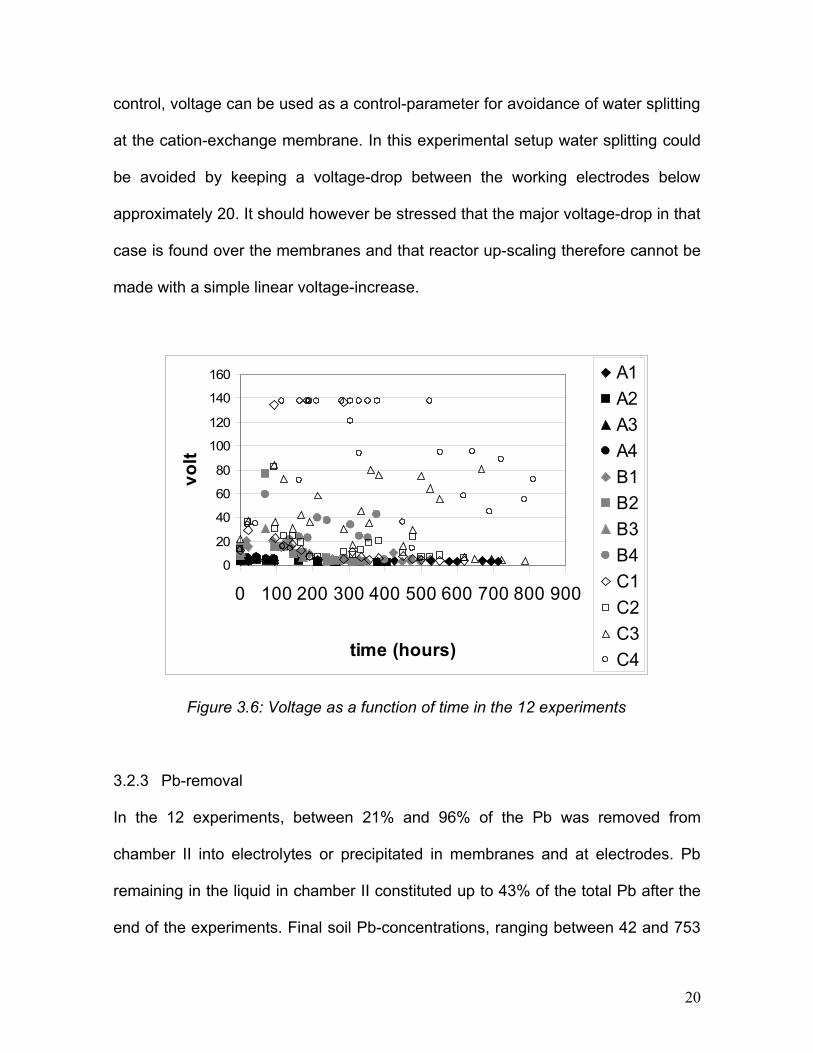
control, voltage can be used as a control-parameter for avoidance of water splitting
at the cation-exchange membrane. In this experimental setup water splitting could
be avoided by keeping a voltage-drop between the working electrodes below
approximately 20. It should however be stressed that the major voltage-drop in that
case is found over the membranes and that reactor up-scaling therefore cannot be
made with a simple linear voltage-increase.
0
20
40
60
80
100
120
140
160
0 100 200 300 400 500 600 700 800 900
time (hours)
volt
A1A2A3A4B1B2B3B4C1C2C3C4
Figure 3.6: Voltage as a function of time in the 12 experiments
3.2.3 Pb-removal
In the 12 experiments, between 21% and 96% of the Pb was removed from
chamber II into electrolytes or precipitated in membranes and at electrodes. Pb
remaining in the liquid in chamber II constituted up to 43% of the total Pb after the
end of the experiments. Final soil Pb-concentrations, ranging between 42 and 753
20

mg/kg, were obtained, showing how remediate of soil-fines was possible with the
suspended EDR-setup.
An expected effect of acidification was that current-efficiency decreased with
time due to production of H+-ions competing with Pb2+ for transport. Therefore
longer acidification-times per gram of soil were expected to result in an increase of
current-efficiency for Pb-removal. Indeed this was seen in the experiments not
affected by water splitting at the cation-exchange membrane (A1 through B3 and
C1). In addition, when looking at the remediation rate (hours pr. mg Pb removed),
the experiments with the longer acidification-time (A4 and B3) showed better
remediation results than those with very fast acidification when looking at the
remediation rate (hours pr. mg Pb removed). Therefore in the search of the most
efficient remediation, it is not necessarily the fastest acidification which is
preferential. Considering the total Pb removal, experiments affected by water
splitting at the cation-exchange membrane (B4 and C2-C4) showed superior due to
the longer remediation times. In addition the low concentration of ions in the liquid
phase of chamber II of these experiments resulted in immediate removal of any
ions released and higher removal of Pb from the soil solution.
3.2.4 Final distribution of Pb
Figure 3.7 shows the final distribution of Pb in the experimental cells. The majority
of the Pb was transported towards the cathode as Pb2+. Only in experiments where
a large fraction of the Pb remained in solution in chamber II, Pb was found in small
amounts in the anolyte, and Pb appears to have been transferred into the anolyte
as co-ions. Both at the anode- and the cathode-sides a negligible fraction of the Pb
21

was found in the membranes. At the anode-side all Pb was found dissolved in the
anolyte, while at the cathode-side the major Pb-pool was found in the catholyte in
experiments A1, A2 and precipitated at the cathode as a porous substance in the
remainder experiments.
A1
14
44
40
2A2
20
35
43
2A3
0
6115
24
A4
0
72523
B1
323
38
36
B2
0
48
21
31
B3
86
131
1
B4
86
12
12
C2
89
1
101
C1
6815
152
C3
96
112
C4
92
710
Anode side Cathode side M solution Soil
Figure 3.7: Final distribution of Pb in the 12 experiments (%).
3.2.5 Influence of time
At figure 3.8 the relation between final Pb concentration and remediation-time is
visualized. Time pr. g. of soil is thought to be a crucial parameter in the case of up-
scaling and commercial benefit, because it relates directly to residence-time and
thereby size of equipment. It is evident that a relation exists; however, some
22

experiments show higher removal-rates than other. The experiments with the
lowest removal-rates (points above the line in figure 3.8) are A1, A2 and C4. A1
and A2 due to the low current and C4 due to ion-deficiency caused by the
combination of high L/S and high current. The experiments that show faster
remediation than average (points below the line in figure 3.8) are B3, C1 and C2.
B1B2
B3
A1A2
B4
C3C4
C1aD1a
C1A3
A4
C2
0100200300400500600700800
0.0 10.0 20.0 30.0 40.0
time (h/g)
Pb fi
nal (
mg/
kg)
Figure 3.8: Relation between remediation-time (hours/g soil) and final Pb
concentration (mg/kg). Initial Pb- concentration ≈ 1170 mg/kg.
Based on these findings, it was decided to repeat experiment C1 (experiment C1a)
however, now running for 11.5 hours/gram soil for direct comparison with
experiment C2. An additional experiment with further increased current density and
high L/S (D1a) was also run for 11.5 hours/gram soil (see table II for details).
Results of these two experiments are included in figure 3.8. The result of
experiment D1a showed that remediation is possible to levels below the
23

governmental limit set by the Danish EPA for sensitive land use (40 mg/kg).
Results of experiments C1 and C1a show how the removal rate decreases as the
removal proceeds, because increasing amounts of H+-ions compete for the
transport. In consistence with this, current efficiency also decreases. In order to
remediate efficiently it could therefore be beneficial to apply a number of reactors
in series, where the initial reactor works at the highest possible removal rate, and
the final reactor works at the target Pb-concentration. As conductivity increases
with time the removal rate could be increased in secondary reactors by increasing
current.
TABLE V
Results of experiments C1a and D1a
Exp.
No.
Mass-
balance
[%]
Current
efficiency
[‰]
Pb
removed
from II
[%]
Pb in
liquid
in II
[%]
Hours
pr. mg
Pb
removed
Final
Pb soil
conc.
[mg/kg]C1a 111 0.3 95 1.5 10.7 78D1a 104 0.2 100 0 11.0 34
In table VI the optimal experiments at each L/S-ration are highlighted. It appears
that the optimal current density increases linearly with decreased L/S in this region
with the relation:
Jopt = 0.057(L/S) + 1 (2)
TABLE VI
24

Dependency of optimal current density (bolded) on L/S.
C4C4C3C3C2C2C1C10.60.6
------D1D10.80.8
B4B4B3B3B2B2B1B10.40.4
A4A4A3A3A2A2A1A10.20.2
14.014.010.510.57.07.03.53.5L/SL/SJ J [mA/cm2]
C4C4C3C3C2C2C1C10.60.6
------D1D10.80.8
B4B4B3B3B2B2B1B10.40.4
A4A4A3A3A2A2A1A10.20.2
14.014.010.510.57.07.03.53.5L/SL/SJ J [mA/cm2]
4 CONCLUSIONS AND FUTURE RECOMMENDATIONS
With EDR in suspension, it is possible to remediate soil-fines completely, even
from a soil with a high carbonate-content. During EDR of soil-fines in
suspension, the lack of free anions results in water splitting at the anion-
exchange membrane, resulting in acidification of the soil-slurry and mobilization
of Pb. At high current densities and/or L/S, the lack of free cations results in
water splitting at the cation-exchange membrane, resulting in production of
hydroxide-ions and impeding the acidification of the soil. Water-splitting and
remediation are highly dependent on L/S and current density. The optimal
current density decreases linearly with increased L/S in the investigated region.
The most efficient remediation is obtained when applying a current just below
the limiting current for the cation-exchange membrane. Best results considering
remediation rate were obtained at L/S 3.5 and current density of 0.8 mA/cm2.
Voltage can be used as a control-parameter for application of the ideal current.
25

In this experimental setup water splitting can be avoided by keeping a voltage-
drop between the working electrodes below 20. The removal rate decreases as
the removal proceeds. In order to remediate efficiently it could therefore be
beneficial to apply a number of reactors in series, where the initial reactor works
at the highest possible removal rate, and the final reactor works at the target
Pb-concentration at an increased current density.
26