electricity storage and renewables · to open up new economic opportunities. battery storage...
TRANSCRIPT
ELECTRICITY STORAGE AND RENEWABLES: COSTS AND MARKETS TO 2030
ELECTRICITY STORAGEAND RENEWABLES: COSTS AND MARKETS TO 2030
October 2017www.irena.org

2 ELECTRICITY STORAGE AND RENEWABLES: COSTS AND MARKETS TO 2030
© IRENA 2017
Unless otherwise stated, material in this publication may be freely used, shared, copied, reproduced, printed and/or stored, provided that
appropriate acknowledgement is given of IRENA as the source and copyright holder. Material in this publication that is attributed to third
parties may be subject to separate terms of use and restrictions, and appropriate permissions from these third parties may need to be secured
before any use of such material.
ISBN 978-92-9260-038-9 (PDF)
Citation: IRENA (2017), Electricity Storage and Renewables: Costs and Markets to 2030, International Renewable Energy Agency, Abu Dhabi.
About IRENA
The International Renewable Energy Agency (IRENA) is an intergovernmental organisation that supports countries in their transition to a
sustainable energy future, and it serves as the principal platform for international co-operation, a centre of excellence, and a repository of
policy, technology, resource and financial knowledge on renewable energy. IRENA promotes the widespread adoption and sustainable use
of all forms of renewable energy, including bioenergy, geothermal, hydropower, ocean, solar and wind energy, in the pursuit of sustainable
development, energy access, energy security and low-carbon economic growth and prosperity. www.irena.org
Acknowledgements
IRENA is grateful for the valuable contributions of [contributors other than main authors] in the preparation of this study. This report benefited
from the reviews and comments of numerous experts, including Mark Higgins (Strategen Consulting), Akari Nagoshi (NEDO), Jens Noack
(Fraunhofer Institute for Chemical Technology ICT), Kai-Philipp Kairies (Institute for Power Electronics and Electrical Drives, RWTH Aachen
University), Samuel Portebos (Clean Horizon), Keith Pullen (City, University of London), Oliver Schmidt (Imperial College London, Grantham
Institute - Climate Change and the Environment), Sayaka Shishido (METI), Maria Skyllas-Kazacos (University of New South Wales).
Contributors: Pablo Ralon (IRENA) and Michael Taylor (IRENA), with assistance from Andrei Ilas (IRENA).
For further information or to provide feedback: [email protected]
This report is available for download: www.irena.org/publications
Disclaimer
This publication and the material herein are provided “as is”. All reasonable precautions have been taken by IRENA to verify the reliability of
the material in this publication. However, neither IRENA nor any of its officials, agents, data or other third-party content providers provides a
warranty of any kind, either expressed or implied, and they accept no responsibility or liability for any consequence of use of the publication
or material herein.

3ELECTRICITY STORAGE AND RENEWABLES: COSTS AND MARKETS TO 2030

4 ELECTRICITY STORAGE AND RENEWABLES: COSTS AND MARKETS TO 2030
It is truly remarkable what a difference five years can make in the ongoing transformation of the energy sector. As recently as 2012, questions about high generation costs still overshadowed the rise of solar and wind power. But what was already clear, to those watching closely, was that economies of scale, technological improvements, greater competition in supply chains and the right policy conditions had started a continuous process, driving down the cost of electricity from these sources.
Today, the competitiveness of renewable power generation options is increasingly evident to all. Yet the hard work continues, as governments, industry and investors plan the next stage of the energy transformation. This involves pro-active discussions to create new policies, regulations, market structures and industry strategies, particularly to support the stable integration of the highest possible shares of power generation from variable renewables (i.e. solar and wind). Strategies are also needed to decarbonise end uses, from transport and industry to the buildings in which we live and work.
This brings the role of electricity storage, and in particular battery systems, to centre stage. Storage – from the batteries in solar home systems to those in electric vehicles – will be crucial to accelerating renewable energy deployment. It can also provide some of the flexibility that future electricity systems will need to accommodate the fluctuating availability to solar and wind energy. Longer-term, as countries strive to significantly reduce emissions from power generation, the importance of storage will only grow.
Although pumped hydro storage dominates total electricity storage capacity today, battery electricity storage systems are developing fast, with falling costs and improving performance. By 2030, the installed costs of battery storage systems could fall by 50-66%. As a result, the costs of storage to support ancillary services, including frequency response or capacity reserve, will be dramatically lower. This, in turn, is sure to open up new economic opportunities.
Battery storage technology is multifaceted. While lithium-ion batteries have garnered the most attention so far, other types are becoming more and more cost-effective. As the present report indicates, battery storage in stationary applications is poised to grow at least seventeen-fold by 2030.
We have the technologies, and we have a template for success. Industry growth, access to new markets, and continued support policies where needed can make stored power highly competitive, like solar and wind power before it. As governments set market forces to work, electricity storage is poised to play a decisive role in the transition to a sustainable energy future.
Foreword
Adnan Z. AminDirector-General
International Renewable Energy Agency

5ELECTRICITY STORAGE AND RENEWABLES: COSTS AND MARKETS TO 2030
Contents
FOREWORD .............................................................................................................................................................................................................4
EXECUTIVE SUMMARY ....................................................................................................................................................................................... 10
INTRODUCTION: THE ROLE OF ELECTRICITY STORAGE IN THE ENERGY TRANSITION .............................................................. 23
Purpose and objectives ...................................................................................................................................................................... 24
The energy transition in IRENAs REmap analysis and storage needs .................................................................................. 25
Current electricity storage deployment in the energy sector ................................................................................................. 28
Current use of energy storage systems in various applications ............................................................................................. 33
ELECTRICITY STORAGE SYSTEM CHARACTERISTICS AND APPLICATIONS ..................................................................................... 36
Stationary storage systems and technologies ..............................................................................................................................36
Electricity storage technology characteristics and suitability for different applications ................................................ 40
Electricity storage applications analysed in the cost of service tool .................................................................................... 45
ELECTRICITY STORAGE SYSTEM COSTS AND PERFORMANCE TO 2030 ......................................................................................... 50
Pumped hydro storage ....................................................................................................................................................................... 50
Compressed air energy storage ....................................................................................................................................................... 54
Flywheel energy storage .....................................................................................................................................................................58
Lithium-ion batteries .............................................................................................................................................................................63
Lead-acid batteries................................................................................................................................................................................82
Flow batteries ........................................................................................................................................................................................ 86
High temperature batteries .................................................................................................................................................................95
Cost and performance overview of battery electricity storage .............................................................................................. 99
GLOBAL ELECTRICITY STORAGE MARKET OUTLOOK TO 2030 ........................................................................................................ 103
REFERENCES ...................................................................................................................................................................................................... 110
Annex 1: Characteristics of stationary electricity storage systems from 2016 to 2030 .................................................. 124
Annex 2: Cost of service tool methodology ................................................................................................................................ 126
6 ELECTRICITY STORAGE AND RENEWABLES: COSTS AND MARKETS TO 2030
Figure 1: Electricity sector capacity and total electricity generation by technology in the reference and REmap
Reference and Doubling cases, 2015-2050 ........................................................................................................................................ 26Figure 2: Electricity storage needs in the energy transition ............................................................................................................................ 28Figure 3: Global operational energy storage power capacity by technology group, mid-2017 ....................................................... 29Figure 4: Global operational pumped hydro storage power capacity by country, mid-2017 ............................................................30Figure 5: Thermal, electro-chemical and electro-mechanical energy storage power capacity by technology,
mid-2017 ........................................................................................................................................................................................................ 31Figure 6: Global electro-chemical storage capacity, 1996-2016 ................................................................................................................... 32Figure 7: Global energy storage power capacity shares by main-use case and technology group, mid-2017 ................................. 35Figure 8: Electricity storage systems classification and report coverage ................................................................................................... 36Figure 9: Schematic of the different components of battery storage systems, including its balance of system
auxiliaries ....................................................................................................................................................................................................... 39Figure 10: Potential locations and applications of electricity storage in the power system ..................................................................40Figure 11: Positioning of diverse energy storage technologies per their power rating and discharge times at
rated power ................................................................................................................................................................................................... 41Figure 12: Comparison of power density and energy density for selected energy storage technologies ....................................... 42Figure 13: Suitability of storage technologies for different applications .......................................................................................................44Figure 14: Technology and application dependencies in the Cost of Service tool ................................................................................. 45Figure 15: Schematic of a typical conventional pumped hydro storage system .....................................................................................50Figure 16: Properties of pumped hydro storage systems, 2016 and 2030 .................................................................................................... 52Figure 17: Schematic of a combined wind and pumped hydro storage pilot project in Germany .................................................. 53Figure 18: Schematic diagram of diabatic (left) and adiabatic (right) compressed air energy storage systems .............................. 55Figure 19: Properties of compressed air energy storage systems in 2016 and 2030 ............................................................................... 56Figure 20: Key components of a high-speed flywheel energy storage system .......................................................................................... 59Figure 21: Types of bearings for flywheel energy storage systems .................................................................................................................60Figure 22: Properties of flywheel energy storage systems, 2016 and 2030 ................................................................................................... 62Figure 23: Lithium battery family................................................................................................................................................................................. 63Figure 24: Main components and operating principle of a lithium metal oxide cathode and carbon-based anode
lithium-ion cell ..............................................................................................................................................................................................64Figure 25: Comparison of lithium-ion chemistry setups ..................................................................................................................................... 65Figure 26: Properties of selected chemistries of lithium-ion battery electricity storage systems, 2016 ................................................68Figure 27: Cost breakdown of lithium-ion battery electricity storage system from selected sources .................................................69Figure 28: Cost component distribution of lithium-ion battery energy storage systems of different storage sizes,
2016 ................................................................................................................................................................................................................. 70
Figures

7ELECTRICITY STORAGE AND RENEWABLES: COSTS AND MARKETS TO 2030
Figure 29: Home storage lithium-ion system offers in Germany from Q4 2014 to Q1 2017 .................................................................... 70Figure 30: Cost reduction drivers of battery electricity storage systems ........................................................................................................ 71Figure 31: Lithium-ion yearly production capacity expansion, 2016 and 2020 estimates ...................................................................... 72Figure 32: Development of specific energy and energy densitiy compared to costs per watt hour for consumer
lithium-ion cells between 1991 and 2005 ........................................................................................................................................... 74Figure 33: Properties of selected chemistries of lithium-ion battery electricity storage systems, 2016 and 2030 ............................ 78Figure 34: Cost reduction potential by source for a typical LFP battery energy storage systems, 2016-2030 .................................. 79Figure 35: Working principle of a lead-acid battery ............................................................................................................................................ 82Figure 36: Properties of lead-acid battery energy storage systems 2016 and 2030 .................................................................................86Figure 37: Categories of flow battery systems and focus on technologies ................................................................................................. 87Figure 38: Operation mechanism of a vanadium redox flow battery system ............................................................................................88Figure 39: Schematic of a zinc-bromine flow battery system ...........................................................................................................................90Figure 40: Properties of flow battery electricity storage systems in 2016 and 2030 .................................................................................. 92Figure 41: Classification of redox flow battery energy storage systems by their chemistry type ..........................................................94Figure 42: Cost breakdown of vanadium redox flow battery systems ...........................................................................................................94Figure 43: Potential pathway to reach cost effective vanadium redox flow battery storage ................................................................ 95Figure 44: Operating principle of a sodium sulphur (NaS) battery ...............................................................................................................96Figure 45: Properties of high temperature battery electricity storage systems, 2016 ................................................................................ 97Figure 46: Properties of high temperature battery electricity storage systems, 2016 and 2030 ............................................................98Figure 47: Energy and power density ranges of selected battery storage technologies, 2016 ............................................................99Figure 48: Reference cycle life and energy installation cost of selected battery storage technologies, 2016 .............................. 100Figure 49: Energy installation costs central estimate for battery technologies, 2016 and 2030 ......................................................... 100Figure 50: Energy installation costs and cycle lifetimes of battery storage technologies, 2016 and 2030 ...................................... 101Figure 51: Energy installation costs and roundtrip efficiencies of battery storage technologies, 2016 and 2030 ................................ 102Figure 52: Electricity storage energy capacity growth by source, 2017-2030 ........................................................................................... 104Figure 53: Concentrating solar power tender and auction results by year of announcement, 2011-2017 ................................... 105Figure 54: Battery electricity storage energy capacity growth in stationary applications by sector, 2017-2030 ............................................ 106Figure 55: Battery electricity storage energy capacity growth in stationary applications by main-use case, 2017-2030 .......................... 108

8 ELECTRICITY STORAGE AND RENEWABLES: COSTS AND MARKETS TO 2030
Table 1: Electricity storage family nomenclature in the “United States Department of Energy Storage Database”,
mid-2017 ........................................................................................................................................................................................................ 29Table 2: Stationary energy storage power capacity by technology type and country, operational by mid-2017 ............................30Table 3: Announced, Contracted and Under Construction Storage Capacity by Technology Type .............................................. 33Table 4: Electricity energy storage power capacity by technology type and primary-use case, mid-2017 ................................. 33Table 5: Key definitions .............................................................................................................................................................................................. 37Table 6: Storage applications and discharge time ......................................................................................................................................... 43Table 7: Advantages and disadvantages of pumped hydro storage systems ....................................................................................... 51Table 8: Indicative cost breakdown for a pumped hydro storage system .............................................................................................. 53Table 9: Key features of the Huntorf and McIntosh compressed air energy storage plants .............................................................. 55Table 10: Cost breakdown for an indicative compressed air energy storage system ........................................................................... 57Table 11: Plant cost of various compressed air energy storage configurations ....................................................................................... 57Table 12: Cost estimates for thermal storage for AA-CAES systems, 2016 and 2030 ............................................................................... 58Table 13: Advantages and disadvantages of flywheel energy storage systems ..................................................................................... 59Table 14: Research and development avenues flywheel energy storage systems ................................................................................. 63Table 15: Overview of possible research and development avenues for lithium-ion cells technological improvements ............................ 76Table 16: Advantages and disadvantages of flooded lead-acid battery energy systems .................................................................. 83Table 17: Advantages and disadvantages of valve-regulated lead-acid battery energy systems ...................................................84Table 18: Research and development avenues for lead acid batteries .................................................................................................... 85Table 19: Advantages and disadvantages of flow battery energy storage systems ..............................................................................88Table 20: Advantages and disadvantages of vanadium redox flow battery electricity storage systems .......................................89Table 21: Advantages and disadvantages of zinc-bromine battery electricity storage systems ......................................................... 91Table 22: Research and development avenues for flow batteries ................................................................................................................ 93Table 23: Balancing market value in the United Kingdom by service, 2016/17 and 2017/18 ...........................................................107
Tables

9ELECTRICITY STORAGE AND RENEWABLES: COSTS AND MARKETS TO 2030
Abbreviations AA-CAES advanced adiabatic compressed energy storage
BES battery electricity storage
BEV battery electric vehicles
BoS balance of system
CAES compressed air energy storage
CO2 carbon dioxide
CSP concentrating solar power
DOE Department of Energy, United States
EP electric power
ESS electricity storage system
EV electric vehicle
FES flywheel energy storage
GW gigawatt
GWh gigawatt hour
kWh kilowatt hour
LCO lithium cobalt oxide
LED light-emitting diode
LFP lithium iron phosphate
Li-ion lithium-ion
LMO lithium manganese oxide
LTO lithium titanate
MW megawatt
MWh megawatt hour
NaS sodium sulphur
NCA lithium nickel cobalt aluminum
NMC nickel manganese cobalt
PHS pumped hydro storage
PHEV plug-in hybrid vehicles
PV photovoltaic
RE renewable energy
TES thermal storage system
VRE variable renewable electricity
VRFB vanadium redox flow battery
ZBFB zinc bromine flow batteries

10 ELECTRICITY STORAGE AND RENEWABLES: COSTS AND MARKETS TO 2030
Electricity storage will play a crucial role in enabling the next phase of the energy transition. Along with boosting solar and wind power generation, it will allow sharp decarbonisation in key segments of the energy market.
The 2015 United Nations Climate Change Conference in Paris set the framework for a rapid global shift to a sustainable energy system in order to avoid the risk of catastrophic climate change. The challenge for governments has shifted, from discussing what might be achieved to determining how to meet collective goals for a sustainable energy system.
This is a task that demands urgent action. Greenhouse gas emissions must peak in the near future if the world is to steer clear of the costly and dangerous effects of climate change.
Given the sharp, and often rapid, decline in the cost of renewable power generation technologies in recent years, the electricity sector has made concrete progress on decarbonisation. Renewable power deployment, however, needs to accelerate. Decarbonisation in the end-use sectors, such as direct energy uses in industry, transport and residential and commercial buildings, also has to speed up given progress is lagging in these areas.
All this has brought into sharp relief the significant potential, and the crucial importance, of electricity storage to facilitate deep decarbonisation. Storage based on rapidly improving batteries and other technologies will permit greater system flexibility – a key asset as the share of variable renewable electricity (VRE) increases. More directly, electricity storage makes possible a transport sector dominated by electric vehicles (EVs), enables effective, 24-hour off-grid solar home systems and supports 100% renewable mini-grids.
As variable renewables grow to substantial levels, electricity systems will require greater flexibility. At very high shares of VRE, electricity will need to be stored over days, weeks or months. By providing these essential services, electricity storage can drive serious electricity decarbonisation and help transform the whole energy sector.
Electricity systems already require a range of ancillary services to ensure smooth and reliable operation (Figure ES1). Supply and demand need to be balanced in real time in order to ensure supply quality (e.g., maintaining constant voltage and frequency), avoid damage to electrical appliances and maintain supply to all users. All electricity systems require a degree of flexibility services, which allow grid operators to react to unexpected changes in demand or the loss of large chunks of supply (e.g. large stations tripping offline, loss of an interconnection). Flexibility gives operators the tools to rapidly restore system equilibrium.
In today’s power systems, solar and wind power still have limited impact on grid operation. As the share of VRE rises, however, electricity systems will need not only more flexibility services, but potentially a different mix that favours the rapid response capabilities of electricity storage. This key shift in system operation needs to be part of the energy planning process. The International Renewable Energy Agency (IRENA), analysing the effects of the energy transition until 2050 in a recent study for the G20, found that over 80% of the world’s electricity could derive from renewable sources by that date. Solar photovoltaic (PV) and wind power would at that point account for 52% of total electricity generation.
Electricity storage will be at the heart of the energy transition, providing services throughout the electricity system value chain and into the end-use sectors. Electricity storage capacity
Executive Summary

11ELECTRICITY STORAGE AND RENEWABLES: COSTS AND MARKETS TO 2030
can reduce constraints on the transmission network and can defer the need for major infrastructure investment. This also applies to distribution, regardless of whether constraints reflect growth in renewables or a change in demand patterns. Behind-the-meter applications allow consumers to manage their bills, reducing peak demand charges and increasing “self-consumption” from rooftop PV panels. Along with providing multiple services and user benefits, an electricity storage project can unlock multiple revenue streams from the provision of a range of services. With the very high shares of wind and solar PV power expected beyond 2030 (e.g. 70— 80% in some cases), the need for long-term energy storage becomes crucial to smooth supply fluctuations over
days, weeks or months. Along with high system flexibility, this calls for storage technologies with low energy costs and discharge rates, like pumped hydro systems, or new innovations to store electricity economically over longer periods. Although such challenges extend beyond the time horizon of this report and, hence, the scope of the present analysis, they need to be kept in mind, as foreseeing future needs sheds light on long-term market potential. This, in turn, gives the necessary impetus for storage development today. Research and development (R&D) in the period to 2030 is therefore vital to ensure future solutions are available, have been demonstrated and are ready to scale up when needed.1
1 There are a range of solutions to this requirement to smooth the variability of solar and wind over a longer time horizon that spans not only electricity storage. It
could be, for instance, economically viable to use bioenergy plants (i.e. solid or biogas) in what currently would be termed “peaker roles”; that is, high capacity plants
that are used for relatively few hours during the year. Alternatively, “power-to-X” pathways, where surplus VRE is used to produce renewable gas or hydrogen,
which is then stored for later use (a power-to-fuel approach). Similarly, electricity could provide heat or cooling with highly efficient heat pumps, stored for short
or long periods (e.g. existing seasonal thermal energy stores) before being released to the end-user as required. Given that thermal energy stores are significantly
less expensive than electrical energy storage, this could make sense.
Bulk energyservices
Electric energytime-shift(arbitrage)
Regulation Transmissionupgrade deferral
Distributionupgrade deferral Power quality
Ancilaryservices
Electric supplycapacity
Spinning, non-spinning andsupplemental
reserves
Transmissioncongestion relief Voltage Support Power rellability
Voltage support Retail electricenergy time-shift
Black start Demand chargemanagement
Transmissioninfrastructure
services
Distributioninfrastructure
services
Customerenergy
managementservices
Solar homesystems
Mini-grids:System stability
services
Mini-grids:Facilitating high
share of VRE
O�-grid
Electric 2/3wheelers, buses,
cars and commercialvehicles
TransportSector
Boxes in red: Energy storage services directly supporting the integration of variable renewable energy
Increasedself-consumption
of Solar PV
Figure ES1: The range of services that can be provided by electricity storage

12 ELECTRICITY STORAGE AND RENEWABLES: COSTS AND MARKETS TO 2030
Electricity storage can directly drive rapid decarbonisation in key segments of energy use. In transport, the viability of battery electricity storage in electric vehicles is improving fast. Batteries in solar home systems and off-grid mini-grids, meanwhile, are decarbonising systems that were heavily reliant on diesel fuel, while also providing clear socio-economic benefits.
Electricity storage technologies are emerging as a critical part of the solution to increase access to electricity in conjunction with solar PV in solar home systems, as well as providing stability services to mini-grids, improving the power quality and increasing the potential share of variable renewables in such remote grids. At the end of 2016, as many as 55 million households, or 275 million people, benefitted from the electricity or light provided by solar lanterns, solar home systems and PV mini-grids. This has been driven by the fall in the cost of solar PV and the price reductions which have made these systems more affordable. For instance, in Africa, solar home systems using small batteries are now able to provide better quality energy services to off-grid households at an annual cost that is less than what they already pay for inferior lighting (e.g., kerosene lanterns) and other energy services (IRENA, 2016b).
Decarbonising the transport sector — for long, a challenge — is also gathering momentum, with the scale up of EV deployment and the drive to lower battery costs. The cost of an EV battery fell by 73% between 2010 and 2016 (BNEF, 2017) and, at the end of 2016, the total stock of electric cars reached 2 million after having gone beyond the level of 1 million in 2015 (OECD/IEA, 2017). Smaller, two- and three-wheel EV numbers have surpassed 250 million globally, while there now are 300 000 electric buses in China alone.
While the focus of this report is on electricity storage in stationary applications, the sheer volume of batteries needed for the transport sector — if the sector is to be decarbonised — implies the essentiality of including total market figures in any analysis of the electricity storage market. To ensure a consistent and integrated global perspective, this report applies transport sector projections for all types of EV from IRENAs REmap analysis (IRENA, 2016e and 2017b). As EVs are unlikely to be passive participants in the process towards energy transformation, their potential to provide vehicle-to-grid flexibility services will also become a significant factor to
consider. A number of pilot projects have been implemented to integrate demand-side management and vehicle-to-grid services to be able to the manage demand and provide electricity to the grid during peak demand hours or when flexibility services are called for.
Stationary electricity storage can provide a range of key energy services in an affordable manner. As the cost of emerging technologies falls further, storage will become increasingly competitive, and the range of economical services it can provide will only increase.
Electricity storage is currently an economic solution off-grid in solar home systems and mini-grids where it can also increase the fraction of renewable energy in the system to as high as 100% (IRENA, 2016b). The same applies in the case of islands or other isolated grids that are reliant on diesel-fired electricity (IRENA, 2016c; IRENA, 2016d). Emerging market segments include the pairing of storage with residential or commercial rooftop solar PV to increase self-consumption of PV electricity and/or to avoid peak demand charges by levelling load. For instance, with some financial support for battery storage, approximately 40% of small-scale solar PV systems in Germany have been installed with battery systems in the last few years. In Australia, with no financial support in place, approximately 7 000 small-scale battery systems were installed in 2016.
Pumped hydro storage historically has been implemented to shift the electricity supply from times of low demand to times of high demand to reduce generation costs (Figure ES2). The economics of providing grid services is more challenging today for batteries and other mechanical and thermal storage systems for electricity. Relatively high costs and often low-cost alternative flexibility options mean that current economics are very much market specific. Despite this, battery electricity storage technologies are providing a range of services competitively today and this will only grow in the future as costs fall and performance improves. On a utility-scale, competitive projects are becoming increasingly common. To name just a few examples: the recent UK capacity auction saw winning bids from 225 megawatts of electricity storage; Tesla will establish a 100 megawatt battery system in South Australia; and grid-scale projects are on the increase in Germany.

13ELECTRICITY STORAGE AND RENEWABLES: COSTS AND MARKETS TO 2030
A critical issue for electricity storage that will assist in its economics is the ability to derive multiple value streams by providing a range of services with one storage system. This will enable the “stacking” of revenue streams and improve projects revenues. In many countries, this will require changes to market structure and regulations, or the creation of new markets for ancillary grid services. It will also, ideally, require behind-the-meter applications to have access to utility-scale markets through aggregators to maximise the potential for storage to contribute fully. Alternatively, in more regulated markets, the applicable valuation tools available to assess the potential multiple cost savings from battery systems from generation system ancillary services, transmission and distribution congestion relief, investment deferral and energy time shift,
among others, need to be robust and easily available in order to compare storage options to the alternatives (IRENA, 2015a).
Future energy systems will rely on a large array of services based on effective, economical electricity storage. This plethora of service needs, with varying performance requirements, suggests an important role for many different storage technologies.
The growth in the electricity storage market to 2030 is not likely to be a one horse race. Although Lithium-ion (Li-ion) batteries are likely to dominate the EV market, this is not necessarily going to be the case in stationary applications. The very different requirements of the range of services that
Thermal Storage
Sha
re o
f to
tal r
ate
d p
ow
er
0%
10%
20%
30%
40%
50%
60%
70%
80%
90%
100%
Sha
re o
f to
tal r
ate
d p
ow
er
0%
10%
20%
30%
40%
50%
60%
70%
80%
90%
100%
Sha
re o
f to
tal r
ate
d p
ow
er
0%
10%
20%
30%
40%
50%
60%
70%
80%
90%
100%
Sha
re o
f to
tal r
ate
d p
ow
er
0%
10%
20%
30%
40%
50%
60%
70%
80%
90%
100%
Pumped hydro storage Electro-chemical Electro-mechanical
Service/Use Case (PHS group)Electric Energy Time ShiftElectric Supply CapacityBlack StartRenewables Capacity FirmingElectric Supply Reserve Capacity - SpinningAll other
Service/Use Case (elec-chem group)Frequency RegulationElectric Supply Reserve Capacity - SpinningElectric Bill ManagementElectric Energy Time ShiftRenewables Capacity FirmingAll other
Service/Use Case (elec-mech group)On-Site PowerBlack StartElectric Supply CapacityElectric Energy Time ShiftFrequency RegulationAll other
Service/Use Case (thermal storage group)Renewables Capacity FirmingRenewables Energy Time ShiftOnsite Renewable Generation ShiftingElectric Energy Time ShiftElectric Bill ManagementAll other
Figure ES2: Global energy storage power capacity shares by main-use case and technology group, mid-2017

14 ELECTRICITY STORAGE AND RENEWABLES: COSTS AND MARKETS TO 2030
electricity storage can provide — and the varying performance characteristics of each group of electricity storage technologies — means that a diverse group of storage technologies will prosper.
It is therefore likely that a range of technologies will find different market segments where they can compete on performance and cost. The electricity storage market in stationary applications will therefore remain a diverse one to 2030 and beyond.
Ancillary grid services, such as primary (fast) frequency regulation, secondary frequency regulation, voltage support, capacity reserve and spinning reserve, among others, will grow in significance as VRE penetration increases, although they have different dynamics in terms of performance, varying by market and time of year. Some applications require high power for short durations (e.g. fast frequency regulation response), while others call for power over longer periods (e.g. firm capacity supply). These different services imply various charge/discharge cycles. In some cases, uniform charge and discharge cycles are likely to be the norm (e.g. in electricity time shift) while in others, highly variable charge/discharge patterns could be the standard.
This has implications in terms of which electricity storage technologies are most economically suited to provide this array of services. For instance, contrast between (i) pumped hydro storage with a very low “self-discharge” rates at idle that are well suited to longer storage durations and (ii) flywheels that have very high-discharge rates at idle, but have high power ratings and can be distributed within the electricity system to provide high power/rapid discharge services, such as frequency or voltage regulation.
There are also practical considerations that impact the most appropriate electricity storage technology. In residential applications or in densely populated cities, for example, space may be a constraint, and technologies with a higher-electricity storage density may have an economic advantage. Similarly, in very hot or cold environments, the performance characteristics and lifetime of the battery can be affected.
The result of these varied application requirements, performance characteristics of electricity storage systems and the practical or environmental considerations that need to be
taken into account when matching a storage technology to an application is that there is likely to be a diverse eco-system of electricity storage technologies and application combinations that will support the economic future of a wide range of storage technologies.
Total electricity storage capacity appears set to triple in energy terms by 2030, if countries proceed to double the share of renewables in the world’s energy system.
With growing demand for electricity storage from stationary and mobile applications, the total stock of electricity storage capacity in energy terms will need to grow from an estimated 4.67 terawatt hours (TWh) in 2017 to 11.89-15.72 TWh (155-227% higher than in 2017) if the share of renewable energy in the energy system is to be doubled by 2030.
Today, an estimated 4.67 TWh of electricity storage exists. This number remains highly uncertain, however, given the lack of comprehensive statistics for renewable energy storage capacity in energy rather than power terms. The estimated gigawatt-hour (GWh) storage capacity currently is dominated by pumped hydro storage, with approximately 96% of the total. By 2030, pumped hydro storage capacity will increase by 1 560-2 340 GWh above 2017 levels in the REmap Doubling case. The more rapid growth of other sources of electricity storage will see its share fall to 45-51% by 2030 in the REmap Doubling case.
In IRENAs REmap analysis of a pathway to double the share of renewable energy in the global energy system by 2030, electricity storage will grow as EVs decarbonise the transport sector, CSP is deployed at increasing scale and electricity system flexibility needs increase. At the same time, falling battery costs will open up new economic opportunities for storage technologies to provide a wide range of grid services and boost the economic value of using distributed batteries to increase the self-consumption of rooftop solar PV. The result of this is that non-pumped hydro electricity storage will grow from an estimated 162 GWh in 2017 to 5 821-8 426 GWh in 2030. (Figure ES3).
The storage capacity of battery electricity storage (BES) systems in stationary applications by 2030 has to increase by a factor of at least 17 compared to today’s estimated level, to meet the requirements for doubling renewables in the global

15ELECTRICITY STORAGE AND RENEWABLES: COSTS AND MARKETS TO 2030
energy mix. This boom in storage will be driven by the rapid growth of utility-scale and behind-the-meter applications.
Focusing on the battery electricity storage market in stationary applications to 2030 highlights that there is significant potential for growth in applications behind-the-meter, notably in order to increase the self-consumption share of the output of rooftop solar PV. There may also be emerging demand driven by incentives from distribution or generation companies to manage grid feed-in (Figure ES4). At present, where the right regulatory structure is in place (e.g. Germany) or in areas with high electricity prices, excellent
solar resources and relatively low grid feed-in remuneration (e.g. Australia), significant battery storage with regard to new PV installations is taking place.
Total battery capacity in stationary applications could increase from a current estimate of 11 GWh to between 100 GWh and 167 GWh in 2030 in the Reference case and to as much as 181-421 GWh in the REmap Doubling case. This represents a nine- to 15-fold increase over the present in the REmap Reference case and a 17- to 38-fold increase in the REmap Doubling case.2
2 The high and low variations to the REmap Reference and Doubling cases are based on varying the extent of storage used in each application. There remains
significant uncertainty, for instance, about what will be the average residential battery pack size in 2030 on a global basis. Similarly, the actual mix of EVs deployed
by 2030 is uncertain; it is neither clear whether the current sales mix will be representative (e.g. in terms of EV class size), nor to what extent falling battery costs
will result in increased battery size to extend the range. This uncertainty is explored in the high and low cases.
2017 2030
Reference Reference Doubling
TWh
4.67
11.89
15.27
2017Reference
2030Reference Doubling
Low
2017Reference
2030Reference
High
Technology
2/3 wheelers - electricBuses - electricCAES/flywheels/other thermalCommercial LDVs - electricRooftop PVRooftop PV retrofitUtility-scale batteries
CSPPassenger EVsPHS
0
2
4
6
8
10
12
14
16
6.62
7.82
02
4
6
8
10
12
14
16
18
TWh
Doubling
02
4
6
8
10
12
14
16
18TW
h
97%88%
16%
22%
51%
97%83%
23%
21%
45%
Figure ES3: Electricity storage energy capacity growth by source, 2017-2030
16 ELECTRICITY STORAGE AND RENEWABLES: COSTS AND MARKETS TO 2030
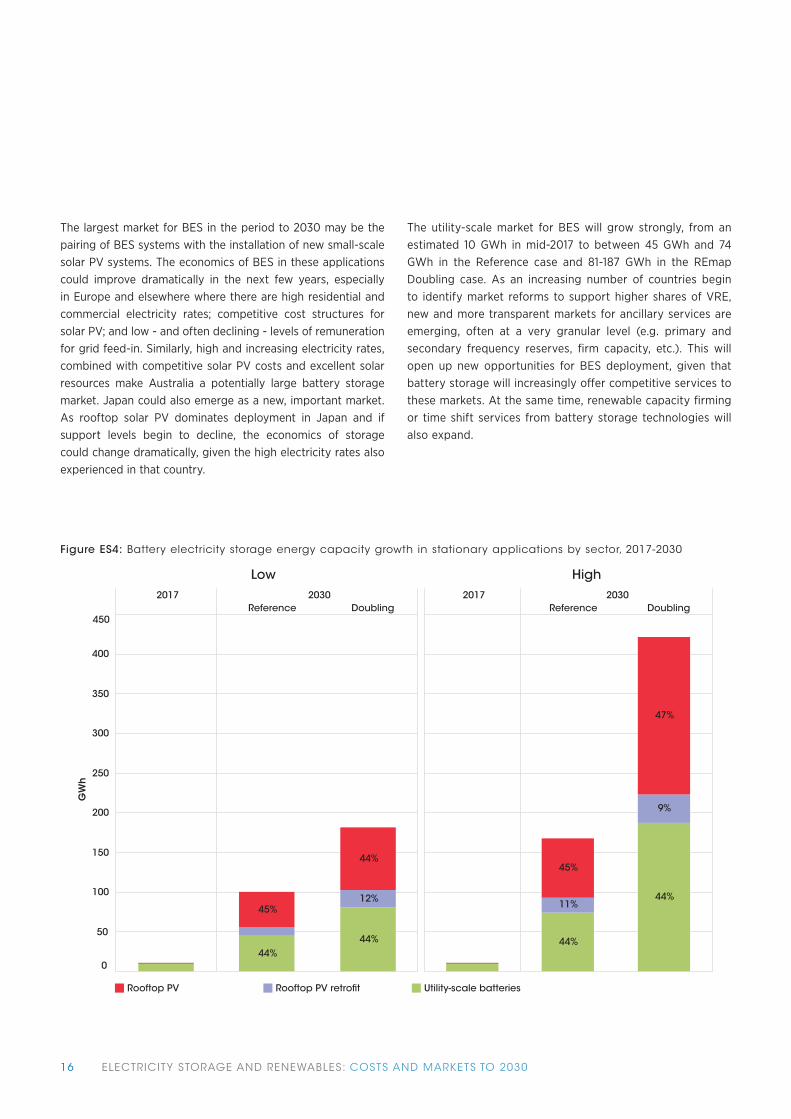
The largest market for BES in the period to 2030 may be the pairing of BES systems with the installation of new small-scale solar PV systems. The economics of BES in these applications could improve dramatically in the next few years, especially in Europe and elsewhere where there are high residential and commercial electricity rates; competitive cost structures for solar PV; and low - and often declining - levels of remuneration for grid feed-in. Similarly, high and increasing electricity rates, combined with competitive solar PV costs and excellent solar resources make Australia a potentially large battery storage market. Japan could also emerge as a new, important market. As rooftop solar PV dominates deployment in Japan and if support levels begin to decline, the economics of storage could change dramatically, given the high electricity rates also experienced in that country.
The utility-scale market for BES will grow strongly, from an estimated 10 GWh in mid-2017 to between 45 GWh and 74 GWh in the Reference case and 81-187 GWh in the REmap Doubling case. As an increasing number of countries begin to identify market reforms to support higher shares of VRE, new and more transparent markets for ancillary services are emerging, often at a very granular level (e.g. primary and secondary frequency reserves, firm capacity, etc.). This will open up new opportunities for BES deployment, given that battery storage will increasingly offer competitive services to these markets. At the same time, renewable capacity firming or time shift services from battery storage technologies will also expand.
2017 2030Reference Doubling
0
50
100
150
200
250
300
350
400
450
GW
h
45%
44%
44%
12%
44%
Low2017 2030
Reference Doubling
45%
11%
44%
47%
44%
9%
High
Rooftop PV Rooftop PV retrofit Utility-scale batteries
Figure ES4: Battery electricity storage energy capacity growth in stationary applications by sector, 2017-2030

17ELECTRICITY STORAGE AND RENEWABLES: COSTS AND MARKETS TO 2030
In terms of the services battery electricity storage systems could provide, the economics of behind-the-meter storage opportunities — notably when paired with new PV installations — could make this application the largest driver of battery storage growth. Behind-the-meter storage could become the primary-use case for 60-64% of total BES energy capacity in stationary applications in 2030.
The main-use case for battery storage to 2030 is likely to be influenced by the economic opportunities to provide electricity time-shift services to increase self-consumption or avoid peak demand charges in the residential and commercial sectors. Moreover, providing renewable capacity firming at the utility scale will effectively contribute to between 11% and 14% of total battery electricity storage capacity in 2030, depending on the case.
Frequency regulation is another market where BES is likely to become increasingly competitive as costs fall, given its rapid response characteristics. By 2030, the primary use case of frequency regulation could account for 10-15% of total installed BES capacity. It is worth noting that these are the primary services that BES systems provide. Their ability, in some cases, to provide multiple grid services will enable some systems to “stack” the value of multiple services, so as to capture higher revenue streams and improve the economics of BES projects. This will be of particular importance in the short- to medium-term, as costs continue to decrease and BES projects compete in a challenging environment.
2017 2030
2030 2030 2030 2030
GW
h
GW
h
200
250
300
350
400
450
0
50
100
150
LowHigh
167
100
421
181
Refe
ren
ce
REm
ap
Do
ub
ling
Refe
ren
ce
REm
ap
Do
ub
ling
0
50
100
150
200
250
300
350
400
450
ReferenceLow High
REmap DoublingLow High
DistributionElectricity supply capacityFrequency regulationOtherRenewable capacity firming
TransmissionElectricity time shiftPV retrofit - Electricity time shiftPV new - Electricity time shift
Figure ES5: Battery electricity storage energy capacity growth in stationary applications by main-use case, 2017-2030

18 ELECTRICITY STORAGE AND RENEWABLES: COSTS AND MARKETS TO 2030
The cost reduction potential for new and emerging electricity storage technologies is significant. The total installed cost of a Li-ion battery could fall by an additional 54-61% by 2030 in stationary applications.
Although pumped hydro storage is the largest single source of electricity storage capacity today, it is a mature technology with site-specific cost. There is little potential to reduce the total installed cost from a technology perspective; lead times for project development tend to be long and it is not as modular as some of the new and emerging electricity storage technologies, which can scale down to very small sizes.
The cost of Li-ion batteries have fallen by as much as 73% between 2010 and 2016 for transport applications. Li-ion batteries in stationary applications have a higher installed cost than those used in EVs due to the more challenging charge/discharge cycles that require more expensive battery management systems and hardware. In Germany, however, small-scale Li-ion battery systems have seen their total installed cost fall by 60% between Q4 2014 and Q2 2017. Benefitting from the growth in scale of Li-ion battery manufacturing for EVs, the cost could decrease in stationary applications by another 54-61% by 2030. This would reflect a drop in the total installed cost for Li-ion batteries for stationary applications to between USD 145 kilowatt hour (kWh) and USD 480/kWh, depending on battery chemistry (Figure ES 6).
0
500
1000
-80%
-60%
-40%
-20%
0%
-50% -50%-56% -60%
-66% -66%
2016 2030 2016 2030 2016 2030 2016 2030 2016 2030 2016 2030 2016 2030 2016 2030 2016 2030 2016 2030
-59% -60% -61%-54%
Ene
rgy
inst
alla
tion
co
st (
USD
/kW
h)
Lead-AcidFlooded LA VRLA
High TemperatureNaS NaNiCl
FlowVRFB ZBFB
Li-IonNCA NMC/LMO LFP LTO
Figure ES6: Battery electricity storage system installed energy cost reduction potential, 2016-2030
While economies of scale and technology improvements that reduce material needs will drive overall cost reductions, cost decreases also still occur across the manufacturing value chain, as in the example of lithium iron phosphate batteries (Figure ES7).
Given the present small scale of development and the rapid growth, significant uncertainty remains around these numbers, and higher or lower values for each battery storage family are possible.

19ELECTRICITY STORAGE AND RENEWABLES: COSTS AND MARKETS TO 2030
3 Expressed in DC-to-DC terms, the DC-to-AC efficiency depends on the inverter losses.
2016 2030
2016
USD
/kW
h
0
100
200
300
400
500
600
2016
USD
/kW
h
Tota
l 201
6
An
od
e
Ca
tho
de
Ele
ctr
oly
te
Sep
ara
tor
Oth
er m
ate
rials
Lab
or
Ove
rhe
ad
Pro
fit m
arg
in
Rest
Tota
l 203
0
0
100
200
300
400
500
600
0%
20%
40%
60%
80%
100%
Perc
en
tag
e (
%)
Total 2016AnodeCathodeElectrolyteSeparatorOther materialsLaborOverheadProfit marginRestTotal 2016
2016 2030
Figure ES7: Cost reduction potential by source of lithium iron phosphate battery energy storage systems, 2016 and 2030
As installed costs decrease, continued improvement in technology will increase performance. The calendar life of Li-ion batteries could increase by approximately 50% by 2030, while the number of full cycles possible could potentially increase by as much as 90%. At the same time, round-trip efficiencies3 will improve a couple of percentage points to between 88% and 98%, depending on battery chemistry.
Other battery storage technologies also offer large cost reduction potential. The total installed cost of “flow batteries” could drop two-thirds by 2030. These batteries themselves offer valuable operational advantages, since they work at ambient temperatures, and their power and energy storage characteristics are independently scalable.
Flow batteries differ from conventional rechargeable batteries in that the electroactive materials are not all stored within the electrode but, instead, are dissolved in electrolyte solutions that are stored in tanks (i.e. one each on the anode and cathode sides). These tanks are separate from the main regenerative cell stack, and their contents are pumped into the cell stacks (i.e. reaction unit) as required during charging
and discharging of the system. Flow batteries have a lower energy density than Li-ion batteries, but the advantage of operating at close to ambient temperatures and are able to independently scale their energy and power characteristics, as previously mentioned.
The two main flow battery technologies – vanadium redox flow and zinc-bromine – had total installation costs in 2016 of between USD 315 to USD 1 680/kWh. By 2030, the cost is expected to come down to between USD 108 and USD 576/kWh. Round-trip efficiencies for these particular flow batteries are expected to improve from between 60% and 85% in 2016 to between 67% and 95% by 2030, as a result of improved electrode, flow and membrane design.
Although they presently indicate high upfront investment costs compared to other technologies, these batteries often exceed 10 000 full cycles, enabling them to make up for the high initial cost through very high lifetime energy throughputs. Their long-term electrolyte stability, however, is key to this longevity and is the focus of an important avenue of research effort.

20 ELECTRICITY STORAGE AND RENEWABLES: COSTS AND MARKETS TO 2030
High temperature sodium sulphur (NaS) and sodium nickel chloride batteries will also become much more affordable. Their installed cost could fall 56-60% by 2030, at the same time that their performance improves.
High temperature batteries utilise liquid active materials and a solid ceramic electrolyte made of beta-aluminum that also serves as the separator between the battery electrodes. Typically, the anode material in these systems is molten sodium and the anodes rely on sodium-ion transport across the membrane to store and release energy. In the case of the NaS battery, the cathode for the most common configuration is molten sulphur, although there is also the “sodium nickel chloride” battery.
NaS batteries have been providing grid services in Japan (e.g., load leveling at wind farms) since the 1990s, with more than 300 MW of NaS storage power installed in more than 170 projects throughout the country. For example, the Tokyo Electric Power Company has been operating a 6 megawatt/48 megawatt hour system for load levelling in Tokyo, since the 1990s. In recent years, deployment has increased and the technology is now used more widely. Advantages of the NaS battery include its relatively high energy density which is at the low end of Li-ion batteries, but significantly higher than the redox-flow and lead-acid technologies. It also benefits from using non-toxic materials.
Currently, the total energy installation cost for an NaS BES system ranges between USD 263 and USD 735/kWh, although data suggest that typical systems are able to be installed for below USD 400/kWh. While the NaS battery offers the potential for high cycle lifetimes at comparably low costs, there are nevertheless some challenges. The main disadvantage of the NaS system is the relatively high annual operating cost, which can be USD 40-80/kW/year, mostly for heating.
Corrosion issues are a major aging mechanism of high temperature cells. To achieve lower production costs, there is a need to continue developing robust materials, coatings and joints to address the corrosion issue and, hence, increase the lifetime of the battery. Another avenue of research focuses on lowering the high operating temperature needed to achieve satisfactory electrochemical activity in the battery by improving ion transfer through the ceramic electrolyte.
Cost reductions of up to 75% could be achieved by 2030, with NaS battery installation cost decreasing to between USD 120
and USD 330/kWh. In parallel, the energy installation cost of the sodium nickel chloride high temperature battery could fall from the current USD 315 to USD 490/kWh to between USD 130 and USD 200/kWh by 2030.
Flywheels could see their installed cost fall by 35% by 2030. Compressed air energy storage (CAES), although based on a combination of mature technologies, could see a 17% cost decline by 2030.
Flywheels store energy as rotational kinetic energy by accelerating and braking a rotating mass. They have a high power potential. Due to their high energy installation cost, which ranges between USD 1 500 and USD 6 000/kWh, and their very high self-discharge of up to 15% per hour, they are most suitable for short-term storage applications. The energy installation cost of a flywheel system is expected to decline to a range of between USD 1 000 and 3 900/kWh by 2030. The cycle lifetime will extend as materials and efficiencies improve as efforts to reduce friction losses bear fruit (i.e. notably with regard to the magnetic bearings).
CAES systems store energy in the form of compressed air (i.e. potential elastic energy) in a reservoir and works in a similar way to conventional gas turbines. To charge a CAES system, excess or off-peak power is directed towards a motor that drives a chain of compressors to store air in the reservoir. When discharging, the compressed air is released from the reservoir (i.e. expanded), cooling down in the process, and needs to be reheated. This is achieved by mixing compressed air with fuel (e.g. natural gas) in a combustion chamber that drives the turbine system. Similar to pumped hydro, accurately estimating the cost of a CAES system is extremely challenging, as the cost is site-specific and depends largely on local environmental constraints for the reservoir. The typical installation cost is estimated to be approximately USD 50/kWh, possibly dropping to USD 40/kWh if an existing reservoir is available. The disadvantage of this system is the relatively low rate of discharge and the poor round-trip efficiency that raises the cost of service.
Materials availability is unlikely to be a constraint on the growth of battery electricity storage technologies in the period to at least 2025. Systems for the end-of-life recycling, reuse and disposal of battery packs are being tested and will need to scale in the 2020s.

21ELECTRICITY STORAGE AND RENEWABLES: COSTS AND MARKETS TO 2030
With the increased uptake of battery electricity storage (BES) technologies, the availability of raw materials — particularly for use in lithium-ion BES systems — has gained much attention in the last few years as question marks over the availability of sufficient supply to scale up BES have been raised. While often mentioned, it appears unlikely that a shortage of lithium will occur in the near future.
Recent analysis suggests total demand for lithium could increase to 80 150 tonnes (t) per annum by 2025, while a conservative supply expansion scenario indicates total lithium extraction could reach 88 000 t per annum by 2025. Under a more optimistic supply scenario the surplus of supply over demand in 2025, of around 8 000 t in the conservative supply estimate, could rise five-fold to around 40 000 t in 2025, or 50% higher than projected demand. However, uncertainty in both the supply and demand evolution remains and short-term supply and demand imbalances could lead to volatile prices. A similar situation could conceivably play out for the production of cobalt – also extensively used in some battery chemistries – as this is usually obtained as a by-product of nickel and copper mining and supply growth will require some forward planning.
Currently, the recycling of lead-acid batteries is economical and widely undertaken (e.g. a recycling rate of more than 99% in Europe). Academia and industry have become active in seeking recycling paths for other chemistries, including the Li-ion family. The initial focus has been on portable technologies, given that the current volume of batteries being sent to end-of-life processes is too low to justify distributed sites. Much progress in recycling methods continues for Li-ion, with demonstrations now taking place. Larger battery formats and the diversity of Li-ion chemistries, however, pose added challenges to their recycling but promising pathways are being explored that provide different trade-offs in terms of costs and materials recovery. These will need to begin to scale commercially in the 2020s as larger volumes of batteries reach the end of their calendar life.
There is significant confusion regarding when electricity storage is essential in the energy transition, as opposed to when it is an economic opportunity. Pumped hydro storage can be economic at present when providing flexibility to the electricity system. Battery costs — although falling rapidly — remain high at present with their economic applications mainly found in off-grid markets, transportation and, increasingly, behind-the-meter uses. As costs fall further, batteries will provide more grid services.
The confusion about the role and necessity of electricity storage in the energy transition, particularly in terms of BES, is natural, since these technologies (aside from pumped hydro) are nascent in terms of deployment. In some ways, this fact mirrors the uncertainty that relates to the role of onshore wind and solar PV, five, ten or 15 years ago, when these technologies were also in their infancy and costs were higher and performance lower. IRENAs analysis highlights the important role electricity storage can play in the energy transition and shows the contribution storage will play in different sectors and applications.
Pumped hydro storage currently dominates total installed storage power capacity, with 96% of the total of 176 GW installed globally in mid-2017. The other electricity storage technologies already in significant use around the world include thermal storage, with 3.3 GW (1.9%); batteries, with 1.9 GW (1.1%) and other mechanical storage with 1.6 GW (0.9%).
Pumped hydro storage is a commercially mature technology that dominates both the total installed power capacity (in GW) and the energy storage capacity (in GWh). Over three-quarters of energy storage power capacity was installed in only ten countries, with only three – China (32.1 GW), Japan (28.5 GW) and the United States (24.2 GW) – accounting for almost half (48%) of global energy storage capacity. These countries are home to the largest capacities of pumped hydro storage, although they are emerging as significant locations for new and emerging electricity storage technologies.
Thermal electricity storage, batteries and non-pumped hydro mechanical electricity storage technologies contribute a total of 6.8 GW of energy storage globally (Figure ES8). Thermal energy storage applications, at present, are dominated by concentrating solar power plants, with the storage enabling them to dispatch electricity into the evening or around the clock. Molten salt technologies are the dominant commercial solution deployed today and they account for three-quarters of the globally deployed thermal energy storage used for electricity applications. Other mechanical storage deployment, to date, is the result of a relatively small number of projects, with total installed power capacity of flywheels at 0.9 GW and CAES at 0.6 GW. In both technologies, two-three large projects dominate total deployment.
Electro-chemical storage is one of the most rapidly growing market segments, although operational installed battery

22 ELECTRICITY STORAGE AND RENEWABLES: COSTS AND MARKETS TO 2030
GW
ra
ted
po
we
r
20
40
60
80
100
120
140
160
Pum
pe
d h
ydro
sto
rag
e
The
rma
l Sto
rag
e
Ele
ctr
o-c
he
mic
al
Ele
ctr
o-m
ec
ha
nic
al
ThermalStorage
Chilled Water Thermal StorageHeat Thermal Storage IceThermal StorageMolten Salt Thermal StorageOther Thermal Storage
Electro-chemical
Electro-chemical CapacitorFlow BatteryLead-acid BatteryLithium Polymer BatteryLithium-ion BatteryNickel-based BatteryOther electro-chemicalSodium-based BatterySodium-sulfur BatteryVanadium Redox Flow Battery
Electro-mechanical
Compressed Air StorageFlywheel
0.0 0.5 1.0 1.5 2.0 2.5 3.0
GW rated power
75%15%
4%
2%
59%
19%
4%
3%0%
2%
8%3%
59%
Figure ES8: Global operational electricity storage power capacity by technology, mid-2017
storage power capacity is only approximately 1.9 GW. Although there are a number of emerging battery electricity storage technologies with great potential for further development, Li-ion batteries account for the largest share (59%) of operational
installed capacity at mid-2017. There also are small but important contributions from high-temperature NaS batteries, capacitors and flow batteries.

23ELECTRICITY STORAGE AND RENEWABLES: COSTS AND MARKETS TO 2030
Renewable energy technologies can meet countries policy goals for (i) secure, reliable and affordable energy; (ii) electricity access for all; (iii) reduced price volatility; and (iv) promoting social and economic development. Recent and expected cost reductions in renewable power generation technologies clearly demonstrate that renewables are becoming an increasingly cost-effective solution to achieve these goals (IRENA, 2017a). New capacity additions of renewable power generation technologies have grown year-on-year since 2001, reaching a record 161 gigawatts (GW) of new capacity additions in 2016. Support policies around the world have become increasingly effective, resulting in increased deployment, technology innovation and cost reductions, thus driving a virtuous cycle. This virtuous cycle, stimulated by policy support for renewable power generation technologies, has had a profound effect on the power generation sector. It also sets the premise for what will eventually be a complete transformation of the energy sector by renewable technologies, based on their economic advantages.
The 2015 United Nations Climate Conference in Paris was a watershed moment for renewable energy. It reinforced what advocates have long argued: that a rapid and global transition to renewable energy technologies offers a realistic means to achieve sustainable development and avoid catastrophic climate change. Now that renewable energy is recognised as central to achieving climate and sustainability objectives, the
challenge facing governments now has shifted from discussing what might be achieved to how to meet the world’s collective goals for a sustainable energy system. In the power sector, this has paralleled a shift in many countries from the identification of which technologies need to be commercialised and scaled up to how best to achieve system-wide decarbonisation with renewable energy. This has been driven by the recent, sometimes rapid, cost reductions for renewable power generation technologies and the potential for continued cost reductions in the future (IRENA, 2016a).
The growing share of renewables in power generation – with significant shares of wind and solar photovoltaic (PV) in countries such as Denmark, Ireland, Italy, Spain and Uruguay, to list a few – is sharpening minds on the next stage of the energy transition. For many countries, the emphasis on support for individual technologies to drive down costs through learning is not only shifting to a more energy system-wide approach that is seeking the most efficient and cost-effective ways to integrate different renewable power generation technologies; it is also looking to address the need to decarbonise end-use sectors.
This shift in dynamic, as this second stage of energy transition accelerates, brings into the limelight a number of technologies, market design changes, new business models and “systems thinking” at the energy sector level, which will be required or become economic. The increased need for system flexibility as the share of variable renewables grows; the importance
Introduction: The role of electricity storage in the energy transition

24 ELECTRICITY STORAGE AND RENEWABLES: COSTS AND MARKETS TO 2030
4 Although not widely deployed yet, BES are currently economic in some situations. Such as peaker substitution (particularly peaker power plants have low utilization
rates), in the provision of ancillary services (fast frequency regulation), transmission and distribution investment deferral and in customer bill management when
demand charges are high or time of use tariffs have a high spread. However, for the moment BES systems contributions to these markets remain modest.
of electric vehicles (EVs) to decarbonise the transport sector; and the important inter-linkages between sectors that emerge when the goal is to provide this flexibility at least cost at a system level all serve to highlight the potential contribution of electricity storage systems (ESS) — and energy storage more generally — as an important part of the energy transition.
There is, however, some confusion about the necessity of battery electricity storage (BES) in various sectors and when — or even if — it will be required. This, in part, reflects the natural uncertainty about what role BES will play in the least-cost energy transition, given that BES is in its infancy in terms of deployment. In some ways, this narrative mirrors the uncertainty regarding the role of onshore wind and solar PV five, ten or fifteen years ago, when these technologies were also emerging in terms of deployment and when costs were higher, with performance poorer than at present.
BES systems represent a tiny fraction of the utility-scale electricity storage capability that is currently in place. Pumped hydro storage (PHS) systems currently represent approximately 97% of total installed capacity of electricity storage systems. The cost of BES systems is decreasing, however, while their performance is improving. This will open the way for BES systems to be used economically today (e.g. in off-grid applications, in conjunction with renewables, and on islands and in the provision of some utility services)4, in the near future (e.g. EVs in the transport sector and increased self-consumption of solar PV) and in the more distant future (e.g. providing a greater contribution to flexibility services to the grid and longer-term electricity storage).
PURPOSE AND OBJECTIVES
With the growing importance of ESS technologies to the energy transition and the rapid progression in the costs and performance of BES technologies in particular, it is important that policy makers, researchers, energy modellers and other decision makers have access to the latest data. This is a relatively new topic for many decision makers that are already trying to get a better understanding of the complexities of the next stage of the energy transition and its implications for policy, regulation
and investment. This report is designed to bring together in one report a comprehensive overview of the costs and performance of ESS, with a focus on BES, to 2030 for stationary applications.
BES technologies are currently in their infancy in terms of deployment in the energy sector. At the same time, there is a wide range of different BES technologies and a variation in battery chemistries, even within a given family of technologies. For instance, there is a range of materially different battery chemistries within what are commonly referred to as lithium-ion (Li-ion) batteries, including the lithium titanate and lithium manganese cobalt batteries to name two. More importantly, battery performance characteristics vary quite significantly between technologies and sometimes between individual technologies within a battery family. This suggests that they can be more or less suited to different applications. A BES technology that is suitable for the rapid delivery of power in frequency response situations may not be so for daily or weekly storage. At the same time, data on battery costs and performance are somewhat scarce, with significant doubt about what they actually measure in some cases.
There is a tendency to simplify discussion to a point where the impression is that all battery technologies are equivalent. Similarly, there can be some confusion about the validity of cost metrics being similar across applications, when performance requirement impacts may be significant. For instance, electric vehicle battery packs face a relatively simple charge/discharge regime, allowing for inexpensive battery management and other balance of system costs. This is not the case in most stationary applications, where the system may be required to oscillate between charging and discharging over minutes or seconds. Maintaining battery lifetimes under more challenging regimes of operation requires a higher balance of system costs. Nevertheless, it is common to see blended cost metrics that appear to mix the specific costs of EV and stationary storage BES systems, despite the typically higher total costs of stationary application BES systems, despite the fact that they may have similar battery cell costs.
This report is designed to clarify these and other issues by providing a comprehensive overview of the:

25ELECTRICITY STORAGE AND RENEWABLES: COSTS AND MARKETS TO 2030
5 See IRENA and IEA (2017) for a detailed discussion of the energy transition to 2050 in the G20 countries and the contribution of EVs to the decarbonisation of the
transport sector.
• current state of BES deployment and use in various applications;
• currently available ESS and their suitability in various applications;
• current costs and performance of ESS systems in stationary applications;
• future cost reduction and performance improvements for ESS systems to 2030; and
• outlook for growth in ESS technologies to 2030.
This report provides governments, policy makers, regulators, investors, researchers and energy sector modellers with the most up-to-date overview of these issues. It serves to ensure a robust debate about the role of ESS systems in providing services to the energy sector as the latter gathers pace to transition to a truly sustainable base. It is important to note four aspects to this report:
• Although the report discusses a range of electricity storage technologies, the the focus of the report is BES technologies.
• The report centres only on the costs and performance of electricity storage systems for stationary applications. Where appropriate, however, EV market growth is taken into account to allow for possible global learning impacts on BES costs and performance.5
• The outlook for this report is to 2030. Given the rapid pace of BES innovation and change, this constitutes a challenge, particularly in the attempt to assess the likely pathways for individual BES technologies towards this date. The results in this report should therefore be treated with caution.
• The outlook for the energy transition to 2050 is discussed in this report for context only, as it has implications for the pathway in 2030, but is not the focus of this report given the technology uncertainty beyond 2030 rends any discussion highly speculative.
These boundaries ensure that this report remains focussed on a manageable and digestible subset of technologies and applications over a timeframe where developments are not entirely speculative. As with any forward-looking analysis of a disruptive technology that is rapidly innovating in terms of technology and applications, the results remain highly uncertain and they are designed to inform debate around the potential contribution of ESS technologies in the energy transition. Actual progress in coming years in some areas is likely to be more rapid than postulated in this report, while in other areas, the hoped for progress may not materialise. The results of the analysis presented should therefore be treated with caution.
THE ENERGY TRANSITION, IRENAS REMAP ANALYSIS AND STORAGE NEEDS
Electricity storage will play a key role in facilitating the next stage of the energy transition by helping to enable higher shares of VRE, by accelerating off-grid electrification and in directly decarbonising the transport sector. However, the pace at which electricity storage needs to be deployed in each of these cases varies depending on progress in the energy sector transformation, the economics of alternative technologies that can provide similar or alternative solutions and progress in electricity storage costs and performance.
Accelerated deployment of renewable energy and policy support for energy efficiency are the key elements of energy transition in the coming decades. The “REmap” analysis of the International Renewable Energy Agency (IRENA) presents, in a series of reports, the pathway to 2030 and 2050 for a truly sustainable energy sector (IRENA, 2016e; IRENA and IEA, 2017). This body of analyses clearly shows that renewables and energy efficiency could meet the vast majority of emission reduction needs (90%), with some 10% achieved by fossil fuel switching and carbon capture and storage to 2050 (IRENA and IEA, 2017). This requires the share of renewable energy in the total energy supply to increase from approximately 15% of the primary energy supply in 2015 to 65% in 2050, with energy demand remaining at approximately 2015 levels due to efficiency improvements.

26 ELECTRICITY STORAGE AND RENEWABLES: COSTS AND MARKETS TO 2030
6 It is important to note that in this report “power capacity” and “energy capacity” have precise meanings (see Table 5), with the former representing capacity in
power terms (e.g. GW) and the latter in energy terms (e.g. GWh). Where a paragraph includes a discussion of one or the other, unless explicitly noted any reference
to “capacity” alone in that paragraph is referring to the first use of the term in that paragraph.
Decarbonising the electricity sector by 2050 is a top priority, given that it is the single largest source of energy sector carbon dioxide (CO2) emissions. Fortunately, as a result of wide-ranging policy efforts, technology improvements and cost reductions, the sector has the opportunity to scale up deployment and deliver the necessary emissions reductions – notably due to the growth in deployment of solar and wind power technologies – if policy support continues. Unfortunately, this cannot be said for the end-use sectors where the policy frameworks and deployment of energy efficiency measures and renewables still lags behind what is necessary, despite promising signs in some areas. In the REmap analysis, the share of renewable energy in electricity generation increases from 23% in 2015 to 82% by 2050 (twice the level of the Remap Reference Case), which is nearly four times higher than in 2015 (Figure 1) (IRENA and IEA, 2017).
Although the elements are currently in place for a successful transformation of the electricity sector, the transition requires an acceleration of current efforts to scale up the deployment of renewables in the electricity sector. In recent years, the share of renewable energy in the electricity sector has increased by approximately 0.7 percentage points per annum.
The energy transition will require this rate to more than triple to 2.4 percentage points per annum until 2030, so that the share of renewables reaches 59% of energy generation in 2030. The increase must then continue at a rate of at least one percentage point per annum until 2050.
In the Reference Case, total installed electricity generation power capacity6 increases by approximately 180 GW per annum to reach 12 400 GW by 2050 (Figure 1). The largest additions are in solar PV and wind onshore and offshore power, representing 70-80% of the total. In the REmap Doubling case, more renewable power capacity is added than in the Reference Case. Solar PV capacity climbs to 6 000 GW, while wind capacity reaches 4 800 GW in 2050. While oil-based capacity drops to zero, total installed nuclear capacity remains the same as at present, supplemented with a back-up natural gas capacity of almost 6 000 GW worldwide by 2050. A range of renewables, including biomass, concentrating solar power (CSP) and hydropower would offer flexible generation. With these changes, total installed electricity generation capacity in REmap reaches more than 20 000 GW in 2050, a three-fold increase from today.
Figure 1: Electricity sector capacity and total electricity generation by technology in the reference and REmap Reference and Doubling cases, 2015-2050
Power genera�on capacity and total electricity genera�on by technologyin the Reference Case and REmap, 2015-2050
Total powergeneration(TWh/yr)
Total installedpower generationcapacity (GW)
50000
40000
30000
20000
10000
0
24000
20000
16000
12000
4000
8000
02015 2030 2050 2030 2050 2015 2030 2050 2030 2050
Coal
Oil
Natural gas
Nuclear
Hydropower
Biopower
Solar PV
CSP
Wind
Geothermal
Ocean / Tide / Wave
Reference Case REmap Reference Case REmap
Source: IRENA and IEA (2017b).

27ELECTRICITY STORAGE AND RENEWABLES: COSTS AND MARKETS TO 2030
The very rapid growth in solar PV and wind power capacity and generation has significant implications for the operation of the electricity system. Under the REmap Doubling case, the share of wind and solar increases to 31% by 2030 and to 52% by 2050. In terms of capacity, this changes the balance of dispatchable versus non-dispatchable capacity, with the latter rising to around half of the total. This will require a different approach to the management of the electricity system.
System flexibility requirements will grow and change in nature as the electricity sector becomes decarbonised. Although biomass, geothermal CSP and hydropower provide some of this flexibility, new sources will need to be developed. This could include BES, demand-side management, smart appliances or thermal energy storage in end-use sectors (e.g. either decentralised or large centralised stores for district heating/cooling networks).
The synergies between the end-use sectors and renewable electricity generation can be utilised to increase the flexibility of the energy system, thus assisting in the decarbonisation process, since it can increase the share of the renewable energy used in heating, cooling and transport. For example, the power and road transport sectors will be coupled by recharging EVs at times of renewable power surpluses, a form of demand-side management. It relates, however, to more than demand-side management, as the EVs also can provide a storage function that feeds the power from plugged-in car batteries back into the grid, or directly into homes and businesses, when more electricity is needed in the system. In heating and cooling end-uses, heat pumps that operate on a flexible schedule can adjust their operation to account for peaks or dips in electricity supply, in combination with cold or heat storage. Smart thermal grids (i.e. district heating and cooling) offer even more flexibility by adding thermal storage.
Although the transport sector currently has the lowest share of renewable energy, it is undergoing a fundamental change, particularly in terms of the light-duty vehicle segment where EVs are an emerging solution. Daunting challenges remain, however, in long-range freight transport, aviation and shipping. These uses account for approximately half of the global transport sector’s total energy demand, and the potential for electrification is limited. Biofuels are currently the main solution for these transport modes.
In the light-duty vehicle segment, EVs and information and
communication technologies (i.e., “self-driving” or autonomous vehicles) are revolutionising the mobility sector, with the potential to change our current concept of personal mobility and the transport sector as a whole. As performance improves and battery costs fall, the sale of EVs, electric buses and electric two- and three-wheelers is growing. In countries such as the the Kingdom of the Netherlands and Norway, 10-30% of cars sold at present are electric. Many other countries, such as China, are seeking to boost the sales of EVs by setting targets or offering incentives.
In the REmap Doubling case, the number of four-wheel EVs in use would reach 195 million by 2030 and 830 million by 2050. Carmakers now offer affordable models that are able to travel more than 380 kilometres on a single charge, reducing drivers’ anxiety about being stranded without power, thanks to improvements in battery engineering and recharging options. The numbers of electric buses and electric two-wheelers are growing as well, especially in China. In the REmap analysis, 11 million electric buses and light-duty vehicles would be on the road by 2030 and 21 million by 2050. Achieving these numbers will require at least 10% of the total passenger car vehicle stock by 2030 and more than one-third by 2050 to be battery-electric cars or plug-in hybrids. Yearly sales of these cars would need to average approximately 25 million.
Another area where renewables is scaling up is in the provision of energy services to those without access to the grid. Falling solar PV and light-emitting diode (LED) light costs (IRENA, 2016b) have led to rapid growth in the use of solar home systems and solar lighting products, as well as an increase in solar PV mini-grids. These are estimated to be providing electricity access to about 60 million people in Africa (10% of the off-grid population, or 5% of the total). Of these, about 36.5 million use small solar lights; 13.5 million use solar home systems with the capacity to power lights, mobile phones and radios; and another 10 million are connected to mini-grids or have stand-alone systems with a higher power rating (IRENA, 2016c). In Asia, these systems are providing electricity access to as many as 300 million people. Solar lighting products and solar home systems incorporate batteries to provide energy services when the sun is not shining, while small batteries allow stable operation of mini-grids with relatively low shares of solar PV. As their costs fall, however, they also have made higher shares of solar PV in mini-grids economic. This is reducing fuel costs not only in off-grid mini-grids, but any isolated grid that previously has been reliant on diesel, such as islands or other isolated locations (IRENA, 2016d).

28 ELECTRICITY STORAGE AND RENEWABLES: COSTS AND MARKETS TO 2030
Electricity storage is thus set to become one of the key facilitating technologies of the energy transition. In the REmap analysis, electricity storage power capacity reaches more than 1 000 GW by 2030, when total installed solar and wind capacity will be 5 000 GW. This storage power capacity is split into 600 GW from EVs, 325 GW from pumped hydro and 175 GW from stationary battery storage. Total storage capacity grows to nearly 3 000 GW by 2050, with EVs in operation accounting for a majority of this total.
It is thus clear that BES systems will play an important role in the ongoing energy transition. In many cases, however, they compete with other technologies and fuels to provide the services needed to achieve the energy transition at least cost. Per a recent analysis of the demand for electricity storage
capacity required in the power market of Germany, the ancillary services market and the distribution grid (Agora, 2014), further renewable power generation expansion in Germany does not have to await the installation of new electricity storage capacity. In the next 10 to 20 years, the flexibility required in the power system could be delivered by other more cost-effective options, such as electricity trade with neighbouring countries, flexible power plants or demand-side management.
The importance of BES therefore depends on the sector, application, availability and economics of alternative solutions; in addition to the performance and costs of BES solutions. Figure 2 highlights the potential contribution of BES technologies to the energy transition by sector, and their relative importance.
CURRENT ELECTRICITY STORAGE DEPLOYMENT IN THE ENERGY SECTOR
The provision of electricity over transmission and distribution lines to consumers requires the real-time balancing of supply and demand to ensure an equilibrium that maintains the voltage and frequency of the alternating current (AC) system. This is typically done by varying the supply to meet current demand although, in many markets, efforts to adjust demand also exist in an attempt to reduce overall electricity system supply costs, notably through price signals (i.e. for
large and, increasingly, small users – either real-time pricing or time-of-use tariffs) or demand-side management. Electricity is sometimes referred to as an “energy carrier” or “secondary” energy source, as it is produced from other sources of energy.
Electricity does not exist naturally, although natural phenomena are able to create electricity. It also has been historically expensive and difficult to store for long periods; hence, the necessity to balance electricity generation and demand in real-time. Pumped hydro storage is the major exception to the difficulty and expense of storing
Figure 2: Electricity storage needs in the energy transition
Solar home systems,mini grids, islands
Increaseddeployment, very
high-100% VRE shares
Very high-100%VRE shares evenon large islands
High power low energyapplications (e.g.
frequency response)
Increasinglyeconomic for higherenergy applications(e.g. firm capacity)
Economic for highpower and energyservice provision
Small role, for REcapacity firming and
short duration time-shift
Large capacityfirming role, time -shift within the day
Providing firm capacityand VRE time-shift up to
intra-day
Today 2020s 2030sOff-grid &
isolated grids
Grid services
VRE integration
Self-consumption
Electromobility
In high retail price/lowrooftop PV cost
locations with rightregulatory support
Economic in marketswith competitive
rooftop PV costs &moderate retail prices
Economic formost rooftop PV
systems to be coupledwith some battery storage
Competitive costs for2/3 wheelers, some EV
offerings/markets.Modest V2G potential
EVs economic for passengervehicles, increasingly for
light commercial.Growing V2G potential
Highly competitiveEVs, public transport& light commercial.Large V2G potential
Source: International Renewable Energy Agency.

29ELECTRICITY STORAGE AND RENEWABLES: COSTS AND MARKETS TO 2030
electricity, and it represents the largest source of today’s electricity storage at around 169 GW of power, accounting for 96% of the approximate 176 GW of total energy storage of all types estimated to have been operational in mid-2017 (U.S. DOE, 2017)7, followed by thermal storage with 3.3 GW (1.9%), electro-chemical batteries with
1.9 GW (1.1%) and electro-mechanical storage with 1.1 GW (0.9%) (Figure 3) (Table 1). Over three-quarters of all energy storage was installed in only ten countries, while only three – China (32.1 GW), Japan (28.5 GW) and the United States (24.2 GW) – accounted for almost half (48%) of global energy storage capacity (Table 2).
Table 1: Electricity storage family nomenclature in the “United States Department of Energy Storage Database”, mid-2017
Subtechnology TypeTechnology Type
Electro-mechanicalChemical
Pumped hydro storage
Thermal storage
Electro-chemical Electro-chemical capacitor, lithium-ion battery, �ow battery, vanadium redox�ow battery, lead-acid battery, metal air battery, sodium-ion battery
Closed-loop pumped hydroelectricity storage,open-loop pumpedhydroelectricity storage
Chilled water thermal storage, concrete thermal storage, heat thermal storage,ice thermal storage, molten salt thermal storage
Compressed air storage, �ywheelHydrogen storage, liquid air energy storage
Source: U.S. DOE, 2017
GW
20
0
40
60
80
100
120
140
160
180
Pum
pe
d h
ydro
sto
rag
e
The
rma
l sto
rag
e
Ele
ctr
o-c
he
mic
al
Ele
ctr
o-m
ec
ha
nic
al
Source: U.S. DOE, 2017.
Figure 3: Global operational energy storage power capacity by technology group, mid-2017
7 Note these are preliminary estimates and are likely to change once the 2017 data is validated. As such, the data for 2017 should be treated with caution and reference
made to the US DOE storage database for 2016 values when firm power estimates are required for analysis.
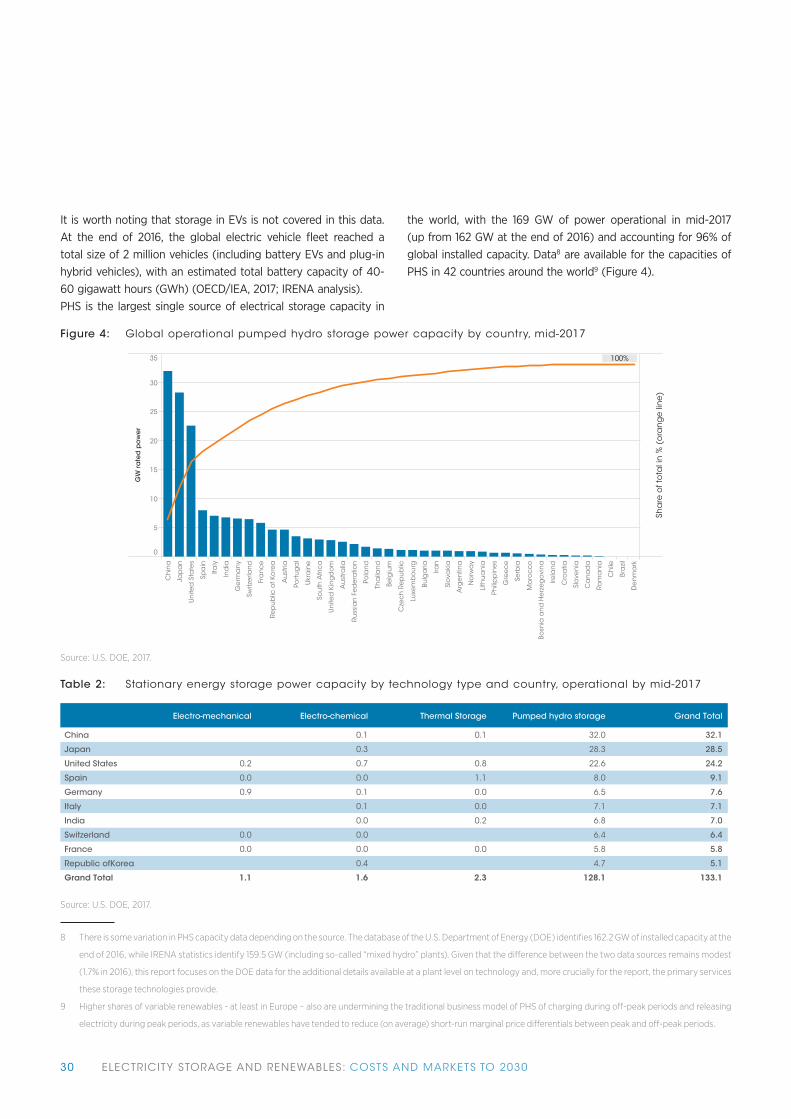
30 ELECTRICITY STORAGE AND RENEWABLES: COSTS AND MARKETS TO 2030
It is worth noting that storage in EVs is not covered in this data. At the end of 2016, the global electric vehicle fleet reached a total size of 2 million vehicles (including battery EVs and plug-in hybrid vehicles), with an estimated total battery capacity of 40-60 gigawatt hours (GWh) (OECD/IEA, 2017; IRENA analysis). PHS is the largest single source of electrical storage capacity in
the world, with the 169 GW of power operational in mid-2017 (up from 162 GW at the end of 2016) and accounting for 96% of global installed capacity. Data8 are available for the capacities of PHS in 42 countries around the world9 (Figure 4).
8 There is some variation in PHS capacity data depending on the source. The database of the U.S. Department of Energy (DOE) identifies 162.2 GW of installed capacity at the
end of 2016, while IRENA statistics identify 159.5 GW (including so-called “mixed hydro” plants). Given that the difference between the two data sources remains modest
(1.7% in 2016), this report focuses on the DOE data for the additional details available at a plant level on technology and, more crucially for the report, the primary services
these storage technologies provide.
9 Higher shares of variable renewables - at least in Europe – also are undermining the traditional business model of PHS of charging during off-peak periods and releasing
electricity during peak periods, as variable renewables have tended to reduce (on average) short-run marginal price differentials between peak and off-peak periods.
Figure 4: Global operational pumped hydro storage power capacity by country, mid-2017
Sha
re o
f to
tal i
n %
(o
ran
ge
lin
e)
0
5
10
15
20
25
30
35
GW
ra
ted
po
we
r
100%
Ch
ina
Jap
an
Un
ited
Sta
tes
Spa
in
Italy
Ind
ia
Ge
rma
ny
Switz
erla
nd
Fra
nc
e
Rep
ub
lic o
f Ko
rea
Au
stria
Port
ug
al
Ukr
ain
e
Sou
th A
fric
a
Un
ited
Kin
gd
om
Au
stra
lia
Russ
ian
Fe
de
ratio
n
Pola
nd
Tha
ilan
d
Belg
ium
Cze
ch
Re
pu
blic
Luxe
mb
ou
rg
Bulg
aria
Iran
Slo
vaki
a
Arg
en
tina
No
rwa
y
Lith
ua
nia
Phili
pp
ine
s
Gre
ec
e
Serb
ia
Mo
roc
co
Bosn
ia a
nd
He
rze
go
vin
a
Irela
nd
Cro
atia
Slo
ven
ia
Ca
na
da
Rom
an
ia
Ch
ile
Bra
zil
De
nm
ark
Source: U.S. DOE, 2017.
Table 2: Stationary energy storage power capacity by technology type and country, operational by mid-2017
China
Japan
United States
Spain
Germany
Italy
India
Switzerland
France
Republic ofKorea
Grand Total
Electro-mechanical Electro-chemical Thermal Storage Pumped hydro storage Grand Total
0.1
0.3
0.7
0.0
0.1
0.1
0.0
0.0
0.0
0.4
1.6
0.0
0.2
0.0
0.9
0.0
1.1
0.0
0.8
0.1
1.1
0.0
0.2
0.0
2.3 128.1
4.7
5.8
6.4
6.8
7.1
6.5
8.0
22.6
28.3
32.0
133.1
5.1
5.8
6.4
7.0
7.1
7.6
9.1
24.2
28.5
32.1
Source: U.S. DOE, 2017.

31ELECTRICITY STORAGE AND RENEWABLES: COSTS AND MARKETS TO 2030
Thermal energy, electro-chemical and electro-mechanical storage technologies contribute a total of 6.8 GW of energy storage globally. Thermal energy storage applications currently concentrate on CSP, allowing them to store energy, in order to provide the flexibility to dispatch electricity outside of peak sunshine hours into the evening or around the clock (IRENA, 2016a). Molten salt technology is the dominant commercial solution currently deployed and it accounts for three-quarters
of the globally deployed thermal energy storage used for electricity applications (Figure 5).10 Electro-mechanical storage deployment, to date, is the result of a relatively small number of projects, with total installed power of flywheels of 0.9 GW, predominantly deriving from only three large projects. Total deployment of compressed air energy storage (CAES) has reached 0.6 GW of power, although it is concentrated in only three large projects.
Electro-chemical storage is one of the most rapidly growing market segments, although operational installed battery storage power capacity is still only around 1.9 GW. Although there are a number of emerging BES technologies with great potential for further development, Li-ion batteries account for the largest share (59%) of operational installed capacity at mid-2017. Nevertheless, there are small but important contributions from high temperature sodium-sulphur batteries, capacitors and flow batteries.
During the last 20 years, global installations of electro-chemical storage deployment grew exponentially (Figure 6), as rapidly decreasing costs and performance improvements
stimulated investment. The United States with 680 megawatts (MW), Republic of Korea (432 MW), Japan (255 MW) and Germany (132 MW) are the major markets and accounted for 78% of total deployment in mid-2017. In Japan, Republic of Korea and the United States, utility-scale projects in the MW scale dominate deployment to date. In Germany, however, policy support for distributed, behind-the-meter, battery storage has seen 60 000 small-scale systems deployed, with an estimated total capacity of approximately 68 MW. Based on the latest deployment data (ISEA/RWTH, 2017), this then raises the actual installed power capacity of battery storage in Germany as of mid-2017 to somewhere in the range of 152 MW to 162 MW.
10 This dataset excludes the use of thermal energy storage to provide heat in end-use sector applications. Sensible heat energy stores, such as domestic hot water
tanks, provide considerable quantities of storage in end-use applications, although no reliable global statistics are available. Similarly, large-scale sensible energy
stores (sometimes designed for seasonal storage), used in association with solar thermal collectors and in district heating systems, are an important source of
storage, with 24 such systems in place in Europe. See http://solar-district-heating.eu/ServicesTools/Plantdatabase.aspx.
Figure 5: Thermal, electro-chemical and electro-mechanical energy storage power capacity by technology, mid-2017
GW
Thermal Storage Chilled Water Thermal Storage
Heat Thermal Storage
Ice Thermal Storage
Molten Salt Thermal Storage
Other Thermal Storage
Electro-mechanical Compressed Air Storage
Flywheel
7%
15%
4%
4%
2%
59%
19%
4%
2%
3%
0%
2%
8%
3%
0%
41%
59%
Electro-chemical Electro-chemical Capacitor
Flow Battery
Lead-acid Battery
Lithium Polymer Battery
Lithium-ion Battery
Nickel based Battery
Other electro-chemical
Sodium based Battery
Sodium-sulfur Battery
Vanadium Redox Flow Battery
0.0 0.2 0.4 0.6 0.8 1.0 1.2 1.4 1.6 1.8 2.0 2.2 2.4 2.6
Source: U.S. DOE, 2017.

32 ELECTRICITY STORAGE AND RENEWABLES: COSTS AND MARKETS TO 2030
In the next three to five years, the storage industry in these leading countries is positioned to scale up and it could follow the now familiar pattern of rapid growth that is evident in solar and wind technologies. Incremental improvements in energy storage technologies; developments in regional regulatory and market drivers; and emerging business models are poised to
make energy storage a growing and viable part of the electricity grid (Navigant Research, 2016). In the stationary sector, increased economic applications due to cost declines are expected for grid services, as well as a growing penetration of renewable electricity on islands/mini-grids and off-grid.
Upcoming battery ESS projects (i.e. announced, contracted or under construction per the “Global Energy Storage Database”) are expected to add another 1.2 GW within the next few years. Half of this additional ESS power capacity is being constructed in the United States (51.2%) (Table 3).11 Other major countries in this list include Australia (10.8%), Germany (10.1%) and India (9.1%). While most of this new power capacity is only classified
as “electro-chemical” (64.7%), more than two-thirds of the remaining part is attributed to Li-ion battery projects (27.5%). Other types, such as flow batteries (including redox flow batteries, 5%), lead-acid batteries (1.8%), metal-air batteries (including zinc-air batteries, 0.5%) and sodium-ion batteries (0.4%), do have their specific market niches, although they are inconsequential in quantitative terms.
Figure 6: Global electro-chemical storage capacity, 1996-2016
Rate
d p
ow
er (
GW
)
0.0
0.2
0.4
0.6
0.8
1.0
1.2
1.4
1.6
1996
1997
2000
2001
2003
2004
2006
2006
2007
2008
2009
2010
2011
2012
2013
2014
2015
2016
Source: U.S. DOE, 2017.
11 This figure may be overestimated due to a potential regional bias in the “Global Energy Storage Database”.

33ELECTRICITY STORAGE AND RENEWABLES: COSTS AND MARKETS TO 2030
CURRENT USE OF ENERGY STORAGE SYSTEMS IN VARIOUS APPLICATIONS
Pumped hydro storage is the largest contributor to storage deployment to date. Given that 89% of PHS plants main-use case is energy time-shifting, this also means that today’s installed stationary ESSs are overwhelmingly used (85%), primarily for the time-shifting of electric energy (Table 4). Other key applications
include the provision of on-demand electric supply capacity (4%), black start capability (4%) and renewables capacity firming (3%), as well as spinning reserve, on-site power and frequency regulation (1% each). It is worth taking this data, nevertheless, inconsequentially, since most ESSs generally provide more than one service. Hence, they can be remunerated for, while simultaneously contributing to a range of services.
Table 3: Announced, Contracted and Under Construction Storage Capacity by Technology Type
Country
Australia
United States
Germany
India
Republic of Korea
Canada
Egypt
Italy
Kazakhstan
United Kingdom
Top 10
World
Electro-chemical
(unspecified)
Electro-chemicalCapacitor
Lithium-Ion
Battery
FlowBattery
VanadiumRedox
Flow Battery
Lead-acidBattery
Metal-AirBattery
SodiumbasedBattery
Total (kW)
500 398 61 959 3 030 20 250 21 500 14 250 621 397
122 010 9 400 131 410
30 000 92 000 210 122 210
110 000 125 110 125
48 500 48 500
12 150 12 010 4 000 5 000 33 160
30 000 30 000
1 920 20 000 1 950 4 000 27 870
25 000 25 000
1 000 20 300 140 21 440
775 558 1 920 294 304 34 330 25 250 21 500 14 250 4 000 1 171 112
784 258 2 920 333 404 34 965 25 250 21 500 5 650 4 800 1 212 747
Source: U.S. DOE, 2017.
Table 4: Electricity energy storage power capacity by technology type and primary-use case, mid-2017Service/Use Case 1
Electric Energy Time Shift
Electric Supply Capacity
Black Start
Renewables Capacity Firming
Electric Supply Reserve Capacity - Spinning
Frequency Regulation
On-Site Power
Electric Bill Management
Renewables Energy Time Shift
Demand Response
Voltage Support
Onsite Renewable Generation Shifting
Resiliency
Transportation Services
Grid-Connected Commercial (Reliability & Quality)
Microgrid Capability
Electric Bill Management with Renewables
Ramping
Distribution upgrade due to solar
Stationary Transmission/Distribution Upgrade Deferral
Distribution upgrade due to wind
Load Following (Tertiary Balancing)
Transmission Congestion Relief
Electric Supply Reserve Capacity - Non-Spinning
Transportable Transmission/Distribution Upgrade Defer..
Grid-Connected Residential (Reliability)
Transmission Support
Grand Total (GW)
Grand Total (GW)Thermal StoragePumped hydro storage Electro-chemical Electro-mechanical
0.30
0.42
0.38
0.14
2.00
3.20
5.92
6.91
149.94
169.21 3.32
0.00
0.21
0.48
0.10
0.00
0.00
2.39
0.00
0.14
1.91
0.00
0.00
0.00
0.00
0.00
0.00
0.00
0.01
0.01
0.02
0.02
0.01
0.02
0.04
0.03
0.02
0.00
0.01
0.05
0.16
0.00
0.95
0.18
0.10
0.04
0.07
0.15
1.57
0.01
0.00
0.00
0.00
0.01
0.00
0.00
0.00
0.86
0.04
0.01
0.00
0.32
0.20
0.11
176.01
0.00
0.00
0.00
0.00
0.00
0.00
0.01
0.01
0.01
0.02
0.02
0.02
0.02
0.04
0.04
0.23
0.31
0.43
0.54
0.64
1.00
1.00
2.18
5.68
6.29
7.18
150.34
Source: U.S. DOE, 2017.
34 ELECTRICITY STORAGE AND RENEWABLES: COSTS AND MARKETS TO 2030
Excluding PHS, the primary applications for implemented ESS are renewable capacity firming (36.8%), on-site power (13.3%), frequency regulation (13.2%) and RE time-shift (8.4%). The renewable energy-specific applications account for almost half (49%) of all main capacity applications, excluding PHS (rated power). This clearly indicates the important role that thermal and battery storage now plays in terms of the ongoing ramping up of renewable electricity.
Smaller, yet growing applications — in particular, for battery storage systems — include residential and commercial PV owners, notably those in pioneering countries such as Australia and Germany (i.e. in their attempt to increase their self-consumption). These applications are a growing market and are also used on islands and mini-grids (e.g. higher solar fractions, allowing solar PV to substitute diesel generator sets); solar home systems/off-grid electrification; and EVs. Their market shares may be underestimated in the “Global Energy Storage Database” due to a potentially high number of unreported small projects.
In addition to electricity time-shifting, PHS provides significant levels of power capacity (as a main-use case) to contribute to firm supply capacity (6.9 GW), black start capability (5.9 GW), renewables capacity firming (3.2 GW) and spinning reserve (2 GW). These four use cases represent the remaining 11% of PHS global main-use-case applications. By country, the main-use case is predominantly electricity time-shifting, although in Spain, with its significant share of wind and solar power generation, approximately one-quarter of its 8 GW PHS power capacity’s main-use case is renewables capacity firming, with another 16% providing general supply capacity. Japan also dedicates significant PHS to other main-use cases, including 2.8 GW (10%) to black start services and 2 GW (7%) to firm supply capacity. Austria has the most diverse use case for PHS in its system, with 54% of its total of 4.7 GW to electricity time-shifting, 17% to providing firm capacity, 16% to providing black start services and 13% to firming renewable generation capacity.
Despite their much lower levels of deployment, the main services provided by electro-chemical, electro-mechanical and thermal ESSs are more diverse than those of PHS plants (Figure 7). This is particularly true for BES systems (i.e. electro-chemical in the “DOE Global Energy Storage Database”), where the capacity of the top five main-use cases amounts to 80% — still less than the share of electricity time-shifting for PHS.
Of the 740 BES systems in the DOE database that had an average project size of 3.2 MW12, half of the global installed storage power capacity’s main-use case was providing frequency regulation services. The next largest main-use cases are spinning reserve capacity (9%), electric bill management (8%), electricity time-shifting (8%) and renewables capacity firming (5%). Around 4% of BES systems power capacity’s main-use case is firm supply capacity provision, 3% for renewable electricity time-shifting and 2% each for black start, resiliency and grid transportation services.
Around 55% of the world’s electro-mechanical ESS power capacity’s main-use case is for on-site power, while 20% is dedicated to black start services (the German CAES project), 13% to providing firm supply capacity (i.e. from the Adele CAES project), 7% to electricity time-shifting and 3% to frequency regulation. The world’s thermal energy storage deployment is currently dominated by the molten salt storage in CSP plants and, therefore, 72% of the capacity in today’s main-use case is categorised as renewable capacity firming. This is somewhat open to debate, however, as it could also be classified as electricity time-shift. It also does not take into account that the flexibility this gives to a CSP plant could result in it providing a range of other services.
12 This average excludes the small-scale battery systems in Germany.

35ELECTRICITY STORAGE AND RENEWABLES: COSTS AND MARKETS TO 2030
Thermal Storage
Sha
re o
f to
tal r
ate
d p
ow
er
0%
10%
20%
30%
40%
50%
60%
70%
80%
90%
100%
Sha
re o
f to
tal r
ate
d p
ow
er
0%
10%
20%
30%
40%
50%
60%
70%
80%
90%
100%
Sha
re o
f to
tal r
ate
d p
ow
er
0%
10%
20%
30%
40%
50%
60%
70%
80%
90%
100%
Sha
re o
f to
tal r
ate
d p
ow
er
0%
10%
20%
30%
40%
50%
60%
70%
80%
90%
100%
Pumped hydro storage Electro-chemical Electro-mechanical
Service/Use Case (PHS group)Electric Energy Time Shift
Electric Supply Capacity
Black Start
Renewables Capacity Firming
Electric Supply Reserve Capacity - Spinning
All other
Service/Use Case (elec-chem group)Frequency Regulation
Electric Supply Reserve Capacity - Spinning
Electric Bill Management
Electric Energy Time Shift
Renewables Capacity Firming
All other
Service/Use Case (elec-mech group)On-Site Power
Black Start
Electric Supply Capacity
Electric Energy Time Shift
Frequency Regulation
All other
Service/Use Case (thermal storage group)Renewables Capacity Firming
Renewables Energy Time Shift
Onsite Renewable Generation Shifting
Electric Energy Time Shift
Electric Bill Management
All other
Figure 7: Global energy storage power capacity shares by main-use case and technology group, mid-2017
Source: U.S. DOE, 2017.
In the current transport sector, electric mobility plays only a marginal role, with EVs representing less than 0.1% of the global vehicle fleet (OECD/IEA, 2016). Most of the EVs are hybrid electric (HEV), generating electricity primarily from recovering braking energy and use relatively small electro-chemical batteries (i.e. nickel–metal hydride or Li-ion). In some countries such as China, the Kingdom of the Netherlands, Norway and the United States, however, PHEVs and BEVs have increased their sales numbers in the last few years, effectively supported by government support schemes (e.g. purchase subsidies, tax reductions and preferential treatment in urban transport). In 2016, some 750 000 EVs (HEV+PHEV+BEV) were sold worldwide (BNEF, 2016). EV selling numbers have grown exponentially, and Market Analyst, Tony Seba, predicts a disruptive change towards EVs well before 2030, mainly due to the price drop for Li-ion batteries from USD 1 000/kilowatt hour (kWh) to below USD 100 USD/kWh in 2030 (Seba, 2016).
The crucial near-future role of batteries in the transport sector becomes visible when examining the newly established production capacity for EV batteries. For instance, the projected annual capacity of Tesla’s Gigafactory (a Li-ion battery factory under construction at the Tahoe-Reno Industrial Center in Nevada, United States) for 2020 is 35 GWh of cells, as well as 50 GWh of battery packs. Production could be the equivalent of supplying 500 000 Tesla cars per annum. When completed, Gigafactory 1 plans to produce more lithium-ion batteries in a year than were produced in the entire world in 2013 (Tesla, 2016). Tesla plans to build more such factories in the near future (e.g. Gigafactory 2 is to be located in Europe).

36 ELECTRICITY STORAGE AND RENEWABLES: COSTS AND MARKETS TO 2030
STATIONARY STORAGE SYSTEMS AND TECHNOLOGIES
While this report focuses on stationary battery storage applications, some battery technologies are suitable for both the stationary and the mobility markets. The contribution of electromobility to total storage capacity is expected
to continue to increase and, by 2050, the REmap analysis forecasts that EVs in operation would account for the majority of the total of electricity storage capacity (IRENA and IEA, 2017).
There are diverse methods for categorising ESS, depending on various key parameters such as suitable storage duration,
Figure 8: Electricity storage systems classification and report coverage
SuperconductiveMagnetic Coil
Electrical
Super-Capacitor
Flow BatteriesVanadium
Zn/BrZn/Fe
Nickel basedNiCdNiMHNiFe
Gas StorageHydrogenMethane
Lithium-Ion BatteriesNMC/LMO
NCALFPLTO
Lead-Acid BatteriesFlooded
VRLA
High TemperatureBatteries
NaNiClNaS
Pumped Hydro
Mechanical
Technologies covered in this report are surrounded by a dark blue box
Compressed Air
Flywheels
Source: International Renewable Energy Agency.Note: NMC/LMO = nickel manganese cobalt oxide/lithium manganese oxide; NCA = nickel cobalt aluminum oxide; LFP = lithium iron phosphate; LTO = lithium titanium oxide; VRLA = valve-regulated lead-acid; NaNiCI = sodium nickel chloride; NaS = sodium-sulpur; Zn/Br = zinc/bromine; Zn/Fe = zinc/iron; NiCd = nickel–cadmium; NiMH = nickel–metal hydride; NiFe = nickel-iron.
Electricity storage system
characteristics and
applications
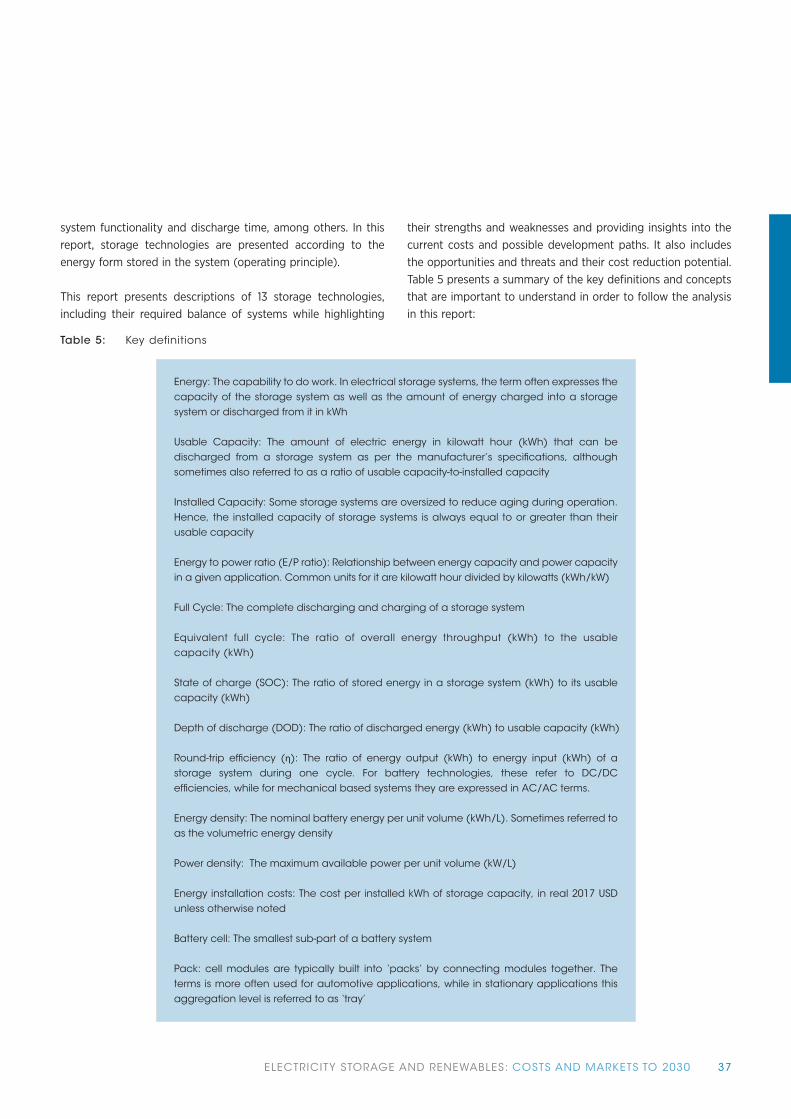
37ELECTRICITY STORAGE AND RENEWABLES: COSTS AND MARKETS TO 2030
system functionality and discharge time, among others. In this report, storage technologies are presented according to the energy form stored in the system (operating principle).
This report presents descriptions of 13 storage technologies, including their required balance of systems while highlighting
their strengths and weaknesses and providing insights into the current costs and possible development paths. It also includes the opportunities and threats and their cost reduction potential. Table 5 presents a summary of the key definitions and concepts that are important to understand in order to follow the analysis in this report:
Table 5: Key definitions
Energy: The capability to do work. In electrical storage systems, the term often expresses the capacity of the storage system as well as the amount of energy charged into a storage system or discharged from it in kWh
Usable Capacity: The amount of electric energy in kilowatt hour (kWh) that can be discharged from a storage system as per the manufacturer’s speci�cations, although sometimes also referred to as a ratio of usable capacity-to-installed capacity
Installed Capacity: Some storage systems are oversized to reduce aging during operation. Hence, the installed capacity of storage systems is always equal to or greater than their usable capacity
Energy to power ratio (E/P ratio): Relationship between energy capacity and power capacity in a given application. Common units for it are kilowatt hour divided by kilowatts (kWh/kW)
Full Cycle: The complete discharging and charging of a storage system
Equivalent full cycle: The ratio of overall energy throughput (kWh) to the usable capacity (kWh)
State of charge (SOC): The ratio of stored energy in a storage system (kWh) to its usable capacity (kWh)
Depth of discharge (DOD): The ratio of discharged energy (kWh) to usable capacity (kWh)
Round-trip ef�ciency (η): The ratio of energy output (kWh) to energy input (kWh) of a storage system during one cycle. For battery technologies, these refer to DC/DC ef�ciencies, while for mechanical based systems they are expressed in AC/AC terms.
Energy density: The nominal battery energy per unit volume (kWh/L). Sometimes referred to as the volumetric energy density
Power density: The maximum available power per unit volume (kW/L)
Energy installation costs: The cost per installed kWh of storage capacity, in real 2017 USD unless otherwise noted
Battery cell: The smallest sub-part of a battery system
Pack: cell modules are typically built into ‘packs’ by connecting modules together. The terms is more often used for automotive applications, while in stationary applications this aggregation level is referred to as ‘tray’
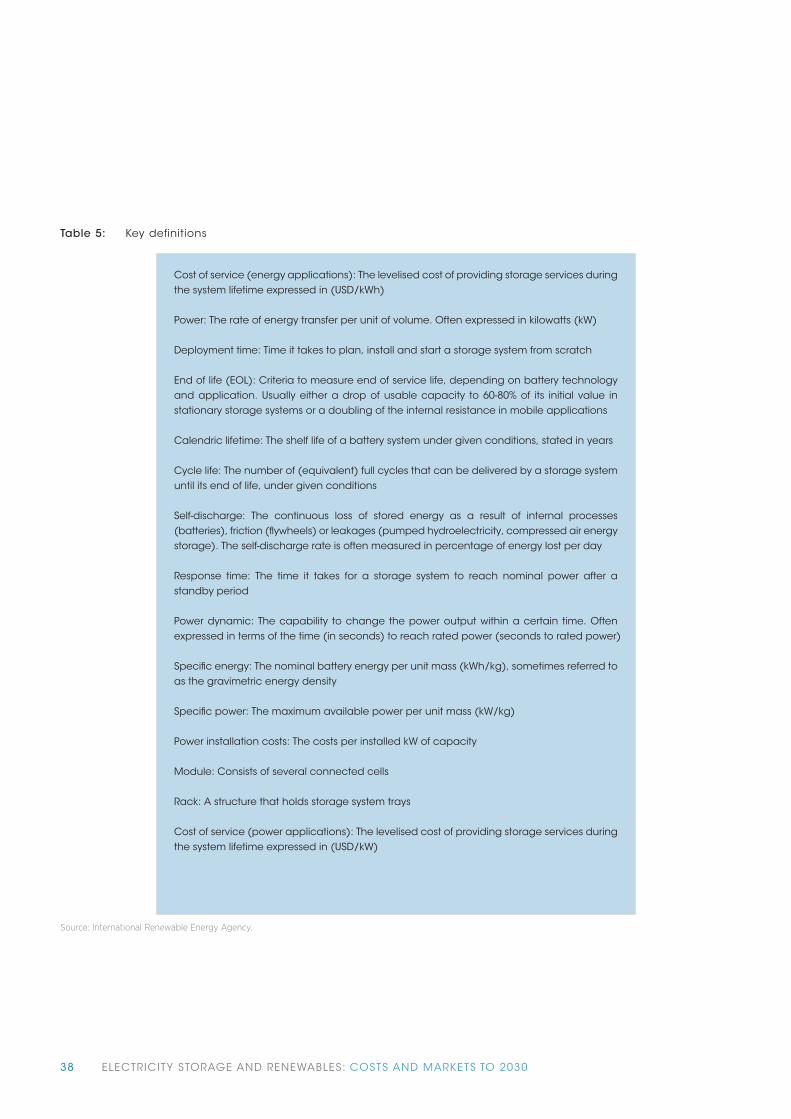
38 ELECTRICITY STORAGE AND RENEWABLES: COSTS AND MARKETS TO 2030
Source: International Renewable Energy Agency.
Table 5: Key definitions
Cost of service (energy applications): The levelised cost of providing storage services during the system lifetime expressed in (USD/kWh)
Power: The rate of energy transfer per unit of volume. Often expressed in kilowatts (kW)
Deployment time: Time it takes to plan, install and start a storage system from scratch
End of life (EOL): Criteria to measure end of service life, depending on battery technology and application. Usually either a drop of usable capacity to 60-80% of its initial value in stationary storage systems or a doubling of the internal resistance in mobile applications
Calendric lifetime: The shelf life of a battery system under given conditions, stated in years
Cycle life: The number of (equivalent) full cycles that can be delivered by a storage system until its end of life, under given conditions
Self-discharge: The continuous loss of stored energy as a result of internal processes (batteries), friction (�ywheels) or leakages (pumped hydroelectricity, compressed air energy storage). The self-discharge rate is often measured in percentage of energy lost per day
Response time: The time it takes for a storage system to reach nominal power after a standby period
Power dynamic: The capability to change the power output within a certain time. Often expressed in terms of the time (in seconds) to reach rated power (seconds to rated power)
Speci�c energy: The nominal battery energy per unit mass (kWh/kg), sometimes referred to as the gravimetric energy density
Speci�c power: The maximum available power per unit mass (kW/kg)
Power installation costs: The costs per installed kW of capacity
Module: Consists of several connected cells
Rack: A structure that holds storage system trays
Cost of service (power applications): The levelised cost of providing storage services during the system lifetime expressed in (USD/kW)

39ELECTRICITY STORAGE AND RENEWABLES: COSTS AND MARKETS TO 2030
Figure 9: Schematic of the different components of battery storage systems, including its balance of system auxiliaries
Ener
gy M
anag
emen
t Sys
tem
s
Pack / Rack / Tray
Battery Management System
Cell Cell Cell Cell
Thermal Management
Pack / Rack / Tray
Battery Management System
Cell Cell Cell Cell
Thermal Management
Ther
mal
Man
agem
ent
Container / Housing
Power Electronics
Transformer
Thermal Management
Fire Protection System
Grid Connection
Source: International Renewable Energy Agency.

40 ELECTRICITY STORAGE AND RENEWABLES: COSTS AND MARKETS TO 2030
Figure 10: Potential locations and applications of electricity storage in the power system
Source: IRENA, 2015a based on EPRI.
ELECTRICITY STORAGE TECHNOLOGY CHARACTERISTICS AND SUITABILITY FOR DIFFERENT APPLICATIONS
ESS can enhance the integration of higher shares of VRE generation as they support local VRE power generation in distribution networks, support grid infrastructure to balance VRE power generation and aid self-generation and self-consumption
of VRE by customers. ESS are expected to become widely deployed as the energy transition progresses ( IRENA, 2015a; IRENA 2016e; IRENA and IEA, 2017; ). Wider availability of current and future cost estimates will support a better understanding of the role of ESS in the global energy transition and through the various functions they will have in supporting future electricity systems at the various levels (Figure 10).

41ELECTRICITY STORAGE AND RENEWABLES: COSTS AND MARKETS TO 2030
Energy storage technologies have different intrinsic properties that determine their technical suitability for certain applications or provide certain services to electricity systems. For example, depending on their discharge times — at a rated power ranging from seconds to hours and with system power ratings from the kW level up to the GW order – these technologies are more suited to specific applications within electricity systems. On the one hand, for example, PHS and CAES technologies are typically used to provide bulk power management, since they both can discharge for up to tens of hours economically. On the other hand, flywheel technologies
have much shorter discharge times and are typically used for uninterruptable power supply applications or to improve power quality (Figure 11). Figure 11, however, should not be considered more than a guide to the recent experience with EES technologies. As performance improves and costs fall, the strict lines between technologies is becoming less pronounced.
Figure 11: Positioning of diverse energy storage technologies per their power rating and discharge times at rated power
UPSPower Quality
Flow Batteries: Zn-Cl Zn-Air Zn-BrVRB PSB New Chemistries
High- EnergySupercapacitors
Advanced Lead-Acid Batery
Lead-Acid BateryNiCd
NiMH
High-Power Flywheels
High-Power Supercapacitors SMES
NaNiCl2 BatteryLi-Ion Battery
PumpedHydro
CAES
NaS Battery
T&D Grid SupportLoad Shifting
Bulk Power Mgt
System Power Ratings, Module Size1 kW 1 MW 10 MW 100 MW 1 GW10 kW 100 kW
Dis
char
ge T
ime
at R
ated
Pow
erSe
cond
sM
inut
esH
ours
Source: US DOE/EPRI, 2015.

42 ELECTRICITY STORAGE AND RENEWABLES: COSTS AND MARKETS TO 2030
Figure 12: Comparison of power density and energy density for selected energy storage technologies
Energy density (Wh/L)
Pow
er d
ensi
ty (W
/I)
100 000
10 000
1 000
100
10
11 10 100 1 000 10 000
Capacitor
SMES FlywheelLi-ion
Fuel cell
NaS
PHS CAES
NiCd
VRB PSB
Supercapacitor
Lead - acid
ZnBr
Decreasing storage volume
Increasing storage volume
Source: Luo et al., 2015.
In addition, the relationship between energy and power densities may constrain the use of certain technologies in specific applications, yet favour their use in others based on the importance of the size of storage devices. At a given amount of energy, high power and energy densities signify that smaller ESSs are feasible. Conversely, lower energy or power densities for a given energy amount may mean that the ESS would require larger volumes and footprints and are, therefore, unsuitable for volume-constrained applications (Figure 12). Figure 12 is also somewhat indicative of typical projects in the past, though newer projects may exceed some of the constraints depicted in it. For example, in 2016 the China National Energy Administration approved the a 200MW/ 800MWh Vanadium Redox Flow Batteries system. Such a
system would see the technology’s module size range extend into the bulk power management region (Utility Dive, 2016).
Lithium batteries, however, have high power and energy density (Figure 12). This explains, in part, their use and consideration for a wide variety of applications, such as portable applications, electromobility and as stationary storage devices to support the grid. Nevertheless, no single metric can fully determine their suitability for a specific application. For example, in stationary applications, costs and lifetime are often more important than energy density or specific density, since the applications are not as volumetrically or weight constrained as mobile or portable applications (Xu et al., 2010).
Energy storage systems suitability for different applications is also influenced by the duration ranges of the continuous charging and discharging of the storage system required. In
this respect, they can be classified as “short-term”, “daily” or “long-term” storage.
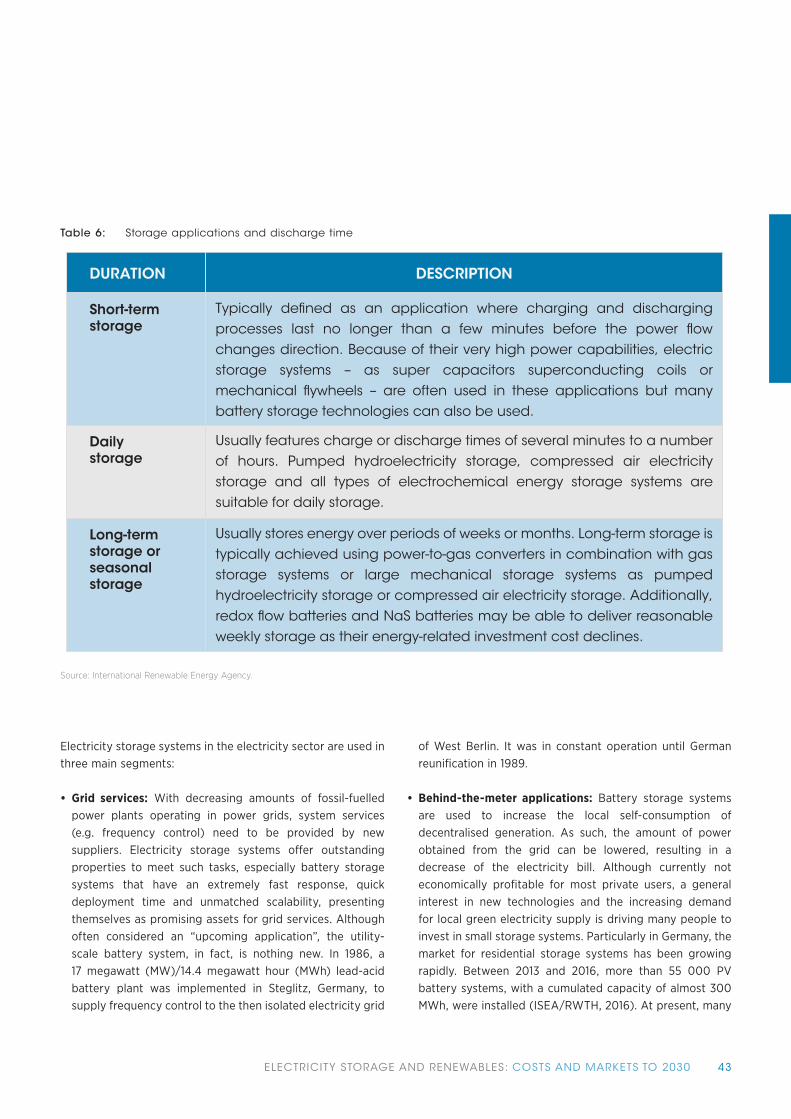
43ELECTRICITY STORAGE AND RENEWABLES: COSTS AND MARKETS TO 2030
Table 6: Storage applications and discharge time
Short-termstorage
DURATION
Dailystorage
Long-termstorage orseasonalstorage
DESCRIPTION
Typically defined as an application where charging and discharging processes last no longer than a few minutes before the power flow changes direction. Because of their very high power capabilities, electric storage systems – as super capacitors superconducting coils or mechanical flywheels – are often used in these applications but many battery storage technologies can also be used.
Usually features charge or discharge times of several minutes to a number of hours. Pumped hydroelectricity storage, compressed air electricity storage and all types of electrochemical energy storage systems are suitable for daily storage.
Usually stores energy over periods of weeks or months. Long-term storage is typically achieved using power-to-gas converters in combination with gas storage systems or large mechanical storage systems as pumped hydroelectricity storage or compressed air electricity storage. Additionally, redox flow batteries and NaS batteries may be able to deliver reasonable weekly storage as their energy-related investment cost declines.
Source: International Renewable Energy Agency.
Electricity storage systems in the electricity sector are used in three main segments:
• Grid services: With decreasing amounts of fossil-fuelled power plants operating in power grids, system services (e.g. frequency control) need to be provided by new suppliers. Electricity storage systems offer outstanding properties to meet such tasks, especially battery storage systems that have an extremely fast response, quick deployment time and unmatched scalability, presenting themselves as promising assets for grid services. Although often considered an “upcoming application”, the utility-scale battery system, in fact, is nothing new. In 1986, a 17 megawatt (MW)/14.4 megawatt hour (MWh) lead-acid battery plant was implemented in Steglitz, Germany, to supply frequency control to the then isolated electricity grid
of West Berlin. It was in constant operation until German reunification in 1989.
• Behind-the-meter applications: Battery storage systems are used to increase the local self-consumption of decentralised generation. As such, the amount of power obtained from the grid can be lowered, resulting in a decrease of the electricity bill. Although currently not economically profitable for most private users, a general interest in new technologies and the increasing demand for local green electricity supply is driving many people to invest in small storage systems. Particularly in Germany, the market for residential storage systems has been growing rapidly. Between 2013 and 2016, more than 55 000 PV battery systems, with a cumulated capacity of almost 300 MWh, were installed (ISEA/RWTH, 2016). At present, many
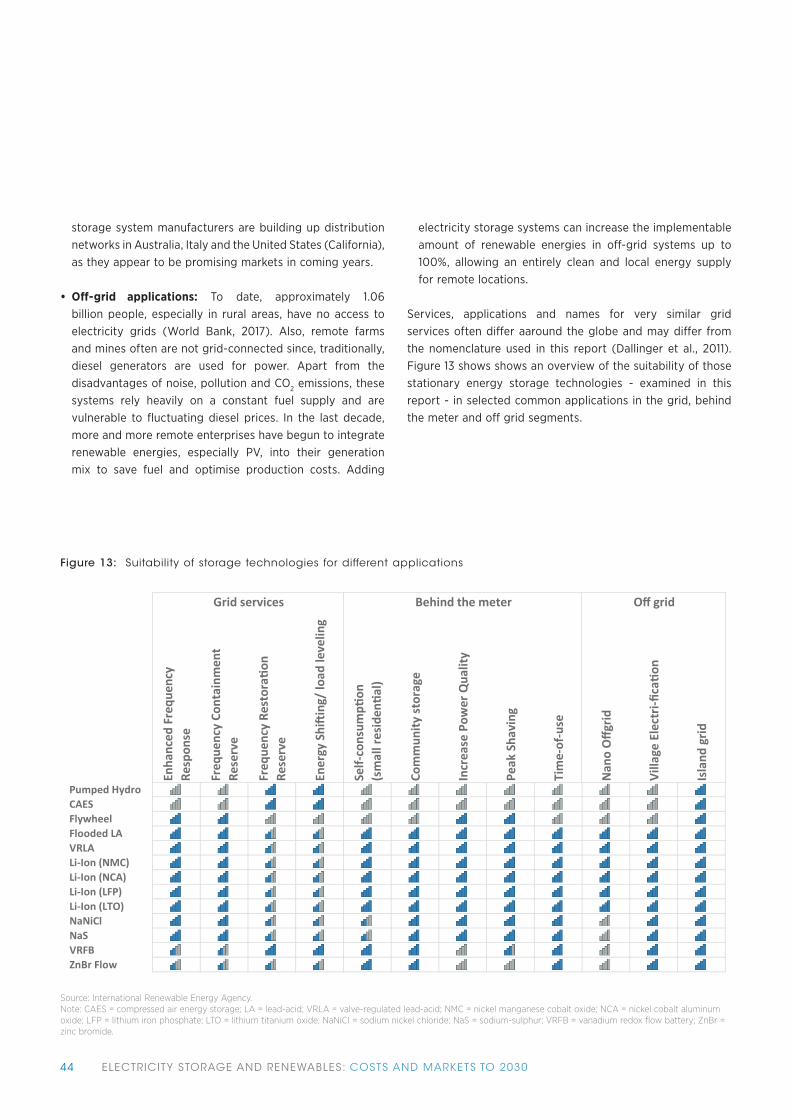
44 ELECTRICITY STORAGE AND RENEWABLES: COSTS AND MARKETS TO 2030
storage system manufacturers are building up distribution networks in Australia, Italy and the United States (California), as they appear to be promising markets in coming years.
• Off-grid applications: To date, approximately 1.06 billion people, especially in rural areas, have no access to electricity grids (World Bank, 2017). Also, remote farms and mines often are not grid-connected since, traditionally, diesel generators are used for power. Apart from the disadvantages of noise, pollution and CO2 emissions, these systems rely heavily on a constant fuel supply and are vulnerable to fluctuating diesel prices. In the last decade, more and more remote enterprises have begun to integrate renewable energies, especially PV, into their generation mix to save fuel and optimise production costs. Adding
electricity storage systems can increase the implementable amount of renewable energies in off-grid systems up to 100%, allowing an entirely clean and local energy supply for remote locations.
Services, applications and names for very similar grid services often differ aaround the globe and may differ from the nomenclature used in this report (Dallinger et al., 2011). Figure 13 shows shows an overview of the suitability of those stationary energy storage technologies - examined in this report - in selected common applications in the grid, behind the meter and off grid segments.
Figure 13: Suitability of storage technologies for different applications
Enha
nced
Fre
quen
cy
Resp
onse
Freq
uenc
y Co
ntai
nmen
t Re
serv
e
Freq
uenc
y Re
stor
a�on
Re
serv
e
Ener
gy S
hi�
ing/
load
leve
ling
Self-
cons
ump�
on
(sm
all r
esid
en�a
l)
Com
mun
ity s
tora
ge
Incr
ease
Pow
er Q
ualit
y
Peak
Sha
ving
Tim
e-of
-use
Nan
o Offg
rid
Villa
ge E
lect
ri-fic
a�on
Isla
nd g
rid
Pumped HydroCAESFlywheelFlooded LAVRLALi-Ion (NMC)Li-Ion (NCA)Li-Ion (LFP)Li-Ion (LTO)NaNiClNaSVRFBZnBr Flow
Grid services Behind the meter Off grid
Source: International Renewable Energy Agency.Note: CAES = compressed air energy storage; LA = lead-acid; VRLA = valve-regulated lead-acid; NMC = nickel manganese cobalt oxide; NCA = nickel cobalt aluminum oxide; LFP = lithium iron phosphate; LTO = lithium titanium oxide; NaNiCI = sodium nickel chloride; NaS = sodium-sulphur; VRFB = vanadium redox flow battery; ZnBr = zinc bromide.

45ELECTRICITY STORAGE AND RENEWABLES: COSTS AND MARKETS TO 2030
ELECTRICITY STORAGE APPLICATIONS ANALYSED IN THE COST OF SERVICE TOOL
The following section is an overview of key requirements for each of the selected applications and the ways in which specific storage technologies are able to fulfil them. The focus is on the technical requirements. A detailed analysis of the combined technological and economic suitability of the wide range of applications and service provision possibilities in diverse local contexts involves a much more profound examination. It also involves an examination of the costs and benefits of energy storage in the specific electricity system context where this service is provided. A robust analysis of the value that the storage systems provide at the electricity system level requires detailed modelling of the specific electricity system that is investigated. It is heavily influenced by the specific market design and the costs and benefits of providing these services through alternative means within the studied market. It also involves a determination of the locations and the size of ESSs that minimise the cost of serving-system demand and a study of the real-time operation of proposed storage systems.
The result is a detailed analysis of the multiple value streams for ESS, including the potential incentive scenario. Such analysis is beyond the scope of this report. IRENA’s Power
Sector Transformation group is, however, developing a Global Valuation Framework for Energy Storage, designed with the intention to assist in this process. The framework, soon to be available, includes an energy storage valuation toolkit to provide further insight.
However, in the interest of providing some initial insights prior to the IRENA valuation tool being available, this report is accompanied by an a spreadsheet "Cost of Service" tool that allows a user to identify promising electricity storage technologies that merit more detailed analysis. This is a simple tool that allows a very quick analysis of the approximate annual cost of electricity storage service in different applications. It is not a detailed simulation on which investment decisions can be made, but allows those interested in specific applications to identify some of the potentially more cost-effective options available for future screening and more detailed analysis of their suitability for the specific application, their performance in the specific real world application and relative economics.
One main objective is to provide an easy-to-use calculation tool to estimate the current and future cost of service of various storage technologies in an array of applications. The input data of the spreadsheet tool consists of current technology data and future expected developments as presented in the following sections.
Figure 14: Technology and application dependencies in the Cost of Service tool
Cell prices
E�ciency
Balance of system
Lifetime
E/P ratio
Application
Technology
Source: International Renewable Energy Agency.Note: E/P = electricity-to-power ratio

46 ELECTRICITY STORAGE AND RENEWABLES: COSTS AND MARKETS TO 2030
It is important to note in the following sections that ESS can provide more than one service and that depending on the market specific requirements for each service, the delivery of multiple services by ESS will result in better utilisation, more economic operation and unlock multiple value streams for project owners
Enhanced frequency response and frequency containment reserve
Size: Typically, 1 to 50 MW installations; with a 1-1.5 (approximate) electricity-to-power ratio (EP) achieved by pooling smaller units.
Requirements: High to very high power dynamics; relatively small energy throughput (~1 cycle per day).
Due to the high requirements regarding power dynamics, PHS, and CAES are not typically suitable for these applications:
• Some PHS plants do not have fine-control capabilities, and when not idle, operation is limited to either pumping or generating mode. Some modern PHSs can be operated in a hydraulic short circuit (i.e. pumping and generating simultaneously for increased granularity of power levels).
• Due to the complex energy conversion process, especially in the case of thermal management, CAES appears unsuitable for applications with (very) high power dynamics.
• Due to their functioning principle (i.e. mechanically pumping fluids that react at a membrane), redox flow batteries have an inherent inertia, however, with electrolyte already in the cell stack rapid operation is possible. A possible constraint in some markets, depending on the market rules, is that Zinc-bromine flow (ZNBF) batteries need to be fully discharged once a week.
Due to their very high power ability and relatively low electricity storage capability, flywheels are a natural choice for these applications, and have been used accordingly for many years. Due to their constant fluctuations, the high self-discharge of flywheels is not a hindrance in these applications.
Generally, all types of battery are suitable to provide these services. Because the power fluctuations in both applications are usually insignificant, the overall energy throughput is relatively weak (~1 equivalent full cycle per day). Hence, the cyclic aging of the batteries is not as important (1 cycle per
day = 3 650 cycles in ten years) and the batteries do not suffer from major cycling aging.
Li-ion chemistries are well suited from a technical point of view, and Li-ion BES systems have accounted for most installations in these applications during the last two years. Lead-acid batteries are sometimes combined with other high power storage technologies, such as Li-ion batteries or flywheels, to create cost-efficient hybrid battery systems that work well. In addition to this, high temperature batteries are technically well-suited to these applications and have been commercially used for many years.
Frequency Restoration Reserve
Size: Typically, 10 to 1 000 MW with E/P ratios > 5, which be achieved by pooling of smaller units.
Requirements: Moderate power requirements and energy throughput that strongly depend on the current composition of the electricity supply system and demand variations, market design (e.g. spot market regulation, tendering periods) and soft factors such as weather prognosis, quality or demand-side management potentials.
PHS and CAES are able to be implemented to provide frequency restoration reserve services. On a global scale, both technologies have many years of operating experience in grid service. While a storage system made up of Li-ion or lead-acid batteries —created only for frequency restoration reserves — would be uneconomic due to high energy costs, the pooling of many small installations, particularly electric cars, is proposed as a technically feasible and economically interesting business concept for the near future. This would require, however, an update of the grid codes of many countries. Similar considerations would apply for the utilisation of high temperature batteries that are installed for other primary use cases. However, both these technologies could be used to provide frequency restoration reserve services as part of a multi-use business case where other revenues are available. Similarly, hybrid battery configurations (e.g. Li-ion/NaS or even Li-ion/Lead-acid hybrids) can help address these feasibility issues
Redox flow batteries may be used for frequency restoration reserves in the future. To date, however, they remain uneconomical to use in this application.

47ELECTRICITY STORAGE AND RENEWABLES: COSTS AND MARKETS TO 2030
Frequency restoration reserves are able to be delivered from variable renewable generation units by using weather prognosis. For example, they can operate at 80% of their potential power output and can be regulated by +-20% if needed. This would open additional revenue streams for renewable power plants that come off their feed-in tariffs.
Energy shifting/load levelling
Size: Usually between 10 MW and 1 000 MW installations with an E/P >5 (energy shifting); and between 5 MW and 100 MW installations with an E/P of 3 to 6 (load levelling).
Requirements: High EP ratio at reasonable cost.
Energy shifting
Energy shifting always has been the major-use case for PHS and CAES. Due to the relatively low energy cost of these storage technologies, with low discharge rates at idle they can perform optimally and economically if charged/discharged over many hours (e.g. from four to forty hours is not uncommon). Most worldwide installations of PHS and CAES operate as energy shifting units.
Redox flow batteries may be used for energy shifting in the future, as cost reductions occur.
Zinc-bromine flow batteries, in particular, are not well suited to energy shifting, as the EP ratio is limited due to the depletion reaction in the stack. This is a result of large energy capacities requiring large cell stacks, making this (hybrid) flow battery less suitable for this application.
Other battery technologies and flywheels are technically capable of delivering energy shifting services. They are, however, economically unsuitable today due to their high energy cost compared to PHS and CAES, but may feature other technical advantages (modularity, fast deployment, almost no geographical constraints) that make them interesting for these applications.
Load levelling
As the demand for load levelling usually occurs in densely built areas, large-scale storage systems such as PHS or CAES are unsuitable. In this respect, sodium-sulphur batteries are a
proven technology for small-scale load levelling of between 1 MW and 100 MW, and have been used in many projects around the world since the early 2000s. High-temperature batteries are already in use for load levelling, while redox flow batteries (notably VRFBs) can also be a cost-effective option for load levelling in many countries where wholesale and retail electricity costs are high.
Flywheels are economically unsuitable due to their comparatively high energy costs.
Lead-acid and Li-ion batteries, or a combination of both, may be used for load levelling in the future. Multi-use scenarios (e.g. combinations of frequency control, electric car charge boosting, load levelling, uninterruptable power supply functionality can significantly increase the profitability of these battery systems.
The choice of subtechnologies will depend strongly on additional use cases; should additional high power capabilities for short time periods be required (such as to boost electric car charging), high power Li-ion batteries (such as lithium titanium oxide could be used, or be combined with inexpensive flooded lead-acid batteries. If the use case leans towards load levelling combined with solar self-consumption, the less expensive li-ion technologies (e.g. nickel-manganese-cobalt or lithium iron phosphate) are more likely to be used.
Self-consumption (residential and small commercial) and time-of-use management
Size: Usually installations of between 2 kW and 200 kW.
Requirements: Moderate power requirements and energy throughput (0.5 to 1 cycle per day). Due to their size, PHS and CAES are not suitable for these small applications, and the high self-discharge of flywheels also excludes them.
All types of batteries (e.g. lead-acid, Li-ion, redox flow, high temperature) are generally feasible for self-consumption and time-of-use management:
• The market is currently dominated by Li-ion systems. For instance, NMC and LFP; in Germany, the market share in the first half of 2017 was 97%).

48 ELECTRICITY STORAGE AND RENEWABLES: COSTS AND MARKETS TO 2030
• Li-ion titanate batteries have not been extensively commercialised due to their comparatively high cost, but some are being used today for self-consumption.
• Li-ion nickel manganese cobalt oxide (NCA) batteries have not been used in residential applications due to their higher cost, lower lifetimes and because their increased energy and power densities are not strictly necessary in this low-requirement application.
• Lead-acid batteries have been used for many years in these applications and are technically well suited, although they have been rapidly replaced by li-ion batteries in many markets due to their superior performance. Li-ion systems provide the following relative advantages: higher lifetime, no maintenance, no gassing, easier to install (lead-acid batteries need to be filled with electrolyte at the installation site, which requires special skills), can be installed hanging to a wall (i.e. better aesthetics for consumers), higher efficiencies and lower total cost of ownership due to lifetime and efficiency.
• High temperature batteries are not well suited to small applications such as residential self-consumption, since they need a constant power throughput to maintain temperature. Otherwise, they need to be heated electrically, which results in thermal self-discharge and loss of energy.
• Although redox flow batteries have been commercialised for home-storage systems, they are significantly more expensive than Li-ion batteries and are unlikely to be used in this application in the foreseeable future.
Community storage and village electrification
Size: Usually 100 kW to 500 kW installations (community storage) and 10 kW to 100 kW (village electrification).
Requirements: Moderate power requirements and energy throughput (0.5 to 1 cycle per day).
Li-ion and lead-acid batteries are well suited to both applications; from a technical standpoint, they can be designed as embedded residential, self-consumption units, or scaled to central plants serving rural mini-grids. Their use in mini-grids is growing in Africa and on islands where expensive diesel-fired generation is the norm.
Due to their size, PHS and CAES are not suitable for these small applications, although community storage can be an interesting field for the application of high temperature batteries, since the power flows of many individual households can aggregate to a more continuous power flow, leading to better thermal efficiency. This could be an interesting option, assuming that individual power profiles within the community are somewhat distributed between small businesses, people who are at home during the day or at work outside, among others.
Redox flow batteries are technically well suited to community storage solutions and large village electrification, and have been demonstrated in several projects. Where economics allow they can be implemented for such applications, especially for E/P ratios over 2 (Zhang et al., 2016).
Increase of power quality and peak shaving
Size: 50 kW to 5 MW.
Requirements: High power requirements; low-to-moderate energy throughput.
All types of lead-acid and Li-ion batteries are well suited to both these applications due to their high power dynamics (i.e. fast response), scalability and existing operating experience. Their use in this application is governed by similar characteristics as discussed in the residential self-consumption application section.
High temperature batteries are well suited to both applications as they are capable of providing the required power dynamics and are scalable (compared to a small-scale energy shifting). Vanadium redox flow battery systems have also recently been demonstrated for such applications (Shibata, 2017).
Depending on the individual load profile, flywheels can be a very attractive technology for both applications. They are, nevertheless, only feasible if there are predictable periodic power peaks in the grid. Typical applications for flywheels are metro stations with underground trains that regularly brake and accelerate. In this case, the flywheel system takes up the recuperated energy and supplies it following the stop, thus increasing significantly the energy efficiency of the transport system. If, however, load peaks occur only a few times a day (or over a week) — as in the case of many industrial sites —low-speed flywheels are not suitable due to their very high

49ELECTRICITY STORAGE AND RENEWABLES: COSTS AND MARKETS TO 2030
self-discharge. New high-speed flywheels, however, have lower discharge rates may make them attractive in these applications in the future. Due to their size, PHS and CAES are not suitable for these small applications,
Nano- and off-grid applications
Size: 20 W to 1 kW.
Very small power requirements; low to moderate energy throughput.
Only lead-acid and Li-ion batteries are suitable for this application, as other storage systems are typically not designed for this scale. To date, lead-acid batteries are most common, given their availability, low cost and existing operating experience. When sized correctly, lead-acid batteries can be directly connected to a PV module, using only a simple switch to trigger charging. Since no DC-DC (direct current) converter is needed, capital expenditure decreases the system becomes technically simplified.
Island electrification
Size: 100 kW to 100 MW.
Requirements: Should provide the services of a traditionally connected grid.
An island system designed to operate predominantly on renewable energy requires many services that could be supplied by storage systems: enhanced frequency responses/frequency containment reserves, frequency restoration reserves, energy shifting (or community storage/village electrification, depending on the size of the island grid). Additionally, a number island grids are now incorporating storage systems for residential self-consumption that are pooled to deliver some of the services listed above, this trend is likely to grow over time. To date, CAES installations are too large for islands and require a complicated BoS.
Geographic and energy conditions on islands vary substantially. In general, however, if hydropower is available, the potential can be tapped, within ecologic and economic boundaries, to provide a low cost source of power, that may have some storage potential. The installation of additional pumps with PHS capability will provide inexpensive energy
shifting capacity. By adding a high power battery storage system (e.g. Li-ion) to the PHS, a versatile storage system can be achieved.
Should PHS not be feasible (technically or economically), however, storage needs can be met with battery storage systems. A typical island electrification system, for example, could comprise a high power storage system (e.g. a 5 MW Li-ion battery container system) to cover enhanced frequency responses and frequency containment reserves, as well as parts of the frequency restoration reserve. A high capacity ESS (e.g. a 50 MWh redox flow battery) could then provide parts of the frequency restoration reserve and most of the energy shifting.
However, other high power ESS could be used, such as flywheels in conjunction with a high energy technology, such as lead-acid batteries or the more versatile high temperature batteries. It should also not be forgotten that solar and wind technologies can provide part of the flexibility needs themselves with some forethought to the technology choice. In most cases, cost efficiency will be achieved with a mix of generation service supply and storage assets.

50 ELECTRICITY STORAGE AND RENEWABLES: COSTS AND MARKETS TO 2030
PUMPED HYDRO STORAGE
PHS is the most widely deployed, large-scale energy storage technology by far. It is a mature technology that was commercialised in the 1890s. At least 150 GW of PHS power was installed and operational by the end of 2016 (IHA, 2017a), with other estimates pointing to higher capacities (U.S. DOE, 2017). PHS stores energy in the form of gravitational potential energy by pumping water between two reservoirs located at different heights. When electricity demand is low, water is pumped through the penstock from the lower end towards the
upper water reservoir, using external power. This constitutes the charging process of the ESS. The pump and turbine unit are attached to a reversible electric generator/motor system. When demand for electricity is high, water flow is reversed and the accumulated water in the upper reservoir is released towards the lower reservoir, passing through the electricity generating turbine system. The electricity generated is then fed into the grid (Figure 15).
Figure 15 : Schematic of a typical conventional pumped hydro storage system
Higher reservoir
Intake
Dam
Water�ow whenpumping
Water�ow whengenerating electricity Turbine and pump unitControl valve
Powerhouse
Generator & motor unitTransformer
Long distance transmission lines
Lower reservoir
Discharge
Source: Luo et al., 2015.
Electricity storage system costs
and performance to 2030

51ELECTRICITY STORAGE AND RENEWABLES: COSTS AND MARKETS TO 2030
The energy stored in a PHS plant is directly proportional to the water volume that is stored in the upper reservoir and the height difference between reservoirs. Large lakes or rivers are often used as lower reservoirs to reduce costs by saving on construction of one reservoir. There are, however, additional design possibilities that are technically feasible. For example, flooded mine shafts or other cavities can be used as lower reservoirs. Such projects are often referred to as “subsurface” or “underground” PHS plants. Although no projects have been completed so far, the concept has gained attention once more, particularly in Europe, due to the increasing scarcity of suitable above-surface locations and their potential for lower environmental impact (EERA, 2016; Akinyele and Rayudu, 2014). The Okinawa Yanbaru Seawater Pumped Storage Power Station in Japan, although no longer in commercial operation, was the only plant in the world to use salt water, but other projects have been proposed, notably in Chile. With a capacity of 30 MW, the Japanese project utilises the Pacific Ocean as the lower reservoir and has a man-made upper reservoir (Oshima et al., 1999; Hiratsuka, Arai and Yoshimura, 1993).
PHS plants have been historically used for medium- or long-term storage, with discharge times ranging from several hours to a few days. Typical round-trip efficiencies of PHS range between 70% and 84% and the plants have a very long expected lifetime from between 40 and 60 years, although major refurbishments
can result in longer calendar lifetimes, up to 100 years have been reported. A significantly low self-discharge of 2.0% maximum a day has been reported for PHS plants.
In the past, most PHS plants have been used to balance the discrepancy between generation and load during high and low demand times in power systems with many base-load power plants. Typically, reservoirs are filled with inexpensive off-peak electricity which is then sold during the morning and evening hours of maximum demand. With the increased penetration of VRE in electricity systems, especially solar PV that can flatten daytime peaks, this traditional business model is under threat. PHS is having to evolve and identify new operational concepts to unlock profitable revenue streams from adapting to provide additional flexibility options to balance system operation, a market that is set to grow as VRE penetration grows. In the past, PHS could provide power regulation when generating, but not when pumping. However, PHS are increasingly looking at the introduction of a variable-speed PHS system that allows power regulation during both the pumping and generation processes. This system also achieves a higher efficiency level than does the traditional setup. A ternary system that features an electric machine (generator/motor) and a separate pump and turbine on a single shaft will enable simultaneous pumping and generation to provide a finer frequency control (IHA, 2017b; ANL, 2013; Ciocan, Teller and Czerwinski, 2012).
Table 7: Advantages and disadvantages of pumped hydro storage systems
ADVANTAGES DISADVANTAGES
Established technology with high technical maturity and extensive operational experience
Very low self-discharge
Reasonable round-trip efficiency
Large volume storage and long storage periods are possible
Low energy installation costs
Good start/stop flexibility
Long life and low costs of storage
Geographic restrictions, since a suitable site with large land use is needed
Low energy density (large footprint)
High initial investment costs, long construction period and long time to recover investment
Environmental concerns
Source: International Renewable Energy Agency, based on ISEA, 2012.

52 ELECTRICITY STORAGE AND RENEWABLES: COSTS AND MARKETS TO 2030
Raw materials for PHS plants, primarily concrete and steel, are widely available. Suitable plant locations are, however, unequally distributed around the world. Some countries have significant remaining potential, while others have already exhausted their economic potential for PHS. Other limitations, such as environmental restrictions or investor hesitation to invest the significant sums necessary in the construction of PHS plants in a rapidly changing market, may constrain deployment. For example, while more than 7 GW of PHS plants are currently under construction in China, many projects in Europe have been cancelled due to unprofitability, environmental concerns and/or public opposition.
Costs and performance outlook of pumped hydro storage systems
Traditional PHS plants are well understood and are a mature technology with decades of operating experience. No major technology improvements are therefore anticipated in the coming years in terms of cost, structure or transformation efficiency. The technological and economic features of PHS systems are therefore assumed to remain broadly unchanged in the period to 2030 (Figure 16).
The stock of suitable sites for PHS plants is not increasing, with the exception of novel concepts, while at the same time stricter environmental standards for hydropower and PHS costs makes new developments more time consuming and expensive. It is therefore, essential that civil engineering techniques improve to offset the potential cost increases from these more stringent environmental protections in order to ensure that PHS costs don't rise in the period to 2030 (IRENA, 2012). This also highlights the potential importance of the novel concepts to exploit abandoned underground mines where environmental concerns may be less of an issue.
Table 8 shows the cost structure for an indicative PHS project that is utilising an existing lake or river as the lower storage reservoir. However, given the very site-specific nature of PHS systems, cost component contributions for individual projects are likely to vary significantly. This will be particularly true for the reservoir construction costs and the engineering, procurement and other construction costs.
Figure 16: Properties of pumped hydro storage systems, 2016 and 2030
Depth of discharge (%) Round-trip efficiency (%)
0 10 20 30 40 50 60 70 80 90 100 0 10 20 30 40 50 60 70 80
PumpedHydro
20162030
Energy density (Wh/L) Energy installatuon cost (USD/kWh) Cycle life (equivalent full-cycles) Calendar life (years)
0 1 2 0 20 40 60 80 100 0 50000 100000 0 20 40 60 80 100
PumpedHydro
20162030
Source: International Renewable Energy Agency.Notes: Wh = watt-hour; L = litre; USD = U.S. dollar; kWh = kilowatt hour.

53ELECTRICITY STORAGE AND RENEWABLES: COSTS AND MARKETS TO 2030
Designs that integrate PHS plants with other VRE sources have been explored in a variety of forms (Rehman, Al-Hadhrami and Alam, 2015). For instance, hybrid PHS plants that rely on wind power for frequent pumping have been proposed as economically viable solutions in a variety of geographic locations (Tuohy and O’Malley, 2011; Caralis et al., 2010; Dursun and Alboyaci, 2010). Beyond these, newer concepts are beginning to appear in pilot projects that could expand PHS deployment. The utilisation of wind turbine structures as upper reservoirs for
a combined wind-PHS plant, for instance, will be implemented in a project by Germany’s Max Bögl Group and General Electric. The pilot onshore wind farm with PHS integration will be built in the Swabian-Franconian Forest in Germany. The proposed hydroelectric capacity of the project is at least 16 MW, while the wind farm is rated at 13.6 MW. Figure 17 illustrates the 178 meter wind farms atop a hill, resting on a man-mad reservoir, with an additional reservoir capacity integrated within the base of the turbines (Grumet, 2016).
Table 8: Indicative cost breakdown for a pumped hydro storage system
SUBCOMPONENT SHARE OF TOTAL COSTS, 2016(IN PERCENT)
Powerhouse 37
Upper reservoir 19
Owner's costs 17
Powerhouse excavation 4
Tunnels 6
Engineering, procurement, constructionand management
17
Source: International Renewable Energy Agency, based on NREL and Black & Veatch, 2012.
Figure 17: Schematic of a combined wind and pumped hydro storage pilot project in Germany
DN 1600-2500 16 / 24 / 32 MW
Exchange
Exchange
PhotovoltaicInstalation
Integrated WaterReservoir
Source: Illustration credit: Max Bögl Group.

54 ELECTRICITY STORAGE AND RENEWABLES: COSTS AND MARKETS TO 2030
Using the ocean as the lower reservoir is appealing as it reduces the need for one reservoir. However, there are challenges as well. A saltwater PHS has to deal with higher maintenance costs due to the corrosive environmental issues and due to marine growth on hydraulic components. These higher maintenance costs may partially offset the savings from having only one reservoir Their long-term economic feasibility is therefore still somewhat uncertain (ESA, 2017; McLean and Kearney, 2014; Kotiuga et al., 2013). Another challenge is that it is not so common to find high elevations close to the sea to allow sufficient head to make the PHS plant economic in many parts of the world.
While subsurface PHS concepts that use abandoned mines or underground caves continue to be assessed, newer subsurface PHS concepts have also recently been proposed. One such — known as hydraulic hydro storage, hydraulic rock storage or gravity storage — is comparable to a traditional PHS system. It converts electrical energy to potential energy by lifting a large mass of rock in the form of a piston that is detached from the surrounding bedrock. The rock piston is elevated within the surrounding cylinder by pumping water beneath it in the charging mode. When electricity is needed, the rock piston pushes the pressurised water through a turbine to generate electricity to be fed into the grid. The system is estimated to reach an efficiency of 80%. The piston and the cylinder are sealed against water, although some challenges exist in sealing the significantly large radius that is required. For the rock mass to support the mechanical stress, adequate formations need to be found. Since the technology becomes feasible only for particular minimum sizes, prototype investment in the double-digit million range is required, thus presenting a challenge to the construction of a demonstration project (Heindl Energy, 2017; Heindl, 2014a, 2014b).
COMPRESSED AIR ENERGY STORAGE
A CAES system stores energy in the form of compressed air (potential elastic energy) in a reservoir. Large-volume air reservoirs are essential for large-scale CAES plants. In order to find suitable storage caverns for the compressed air, old natural salt deposits or depleted gas fields can be conditioned for use. Costs are significantly lower where an existing and suitable cavern is available. Constructing a purpose-built cavern to hold the compressed air increases the energy storage costs dramatically. Metal vessels, as reservoirs, are technically
feasible, albeit too expensive in most cases to be considered economically feasible.
CAES systems work under similar principles as conventional gas turbines, although in the case of CAES systems, the compression and expansion phases are decoupled instead of simultaneous. To charge a CAES, excess or off-peak power is directed towards a motor that drives a chain of compressors to store it in the reservoir. During this process, the air heats up. In a classic (diabatic) CAES system, this heat is removed by an air cooler (radiator) and released to the atmosphere. The compressed air is typically stored in underground caverns (predominantly salt caverns), typically at a pressure of between 4.0 megapascals (MPa) and 8.0 megapascals (Chen et al., 2009).
To discharge the CAES system when energy demand is high, the stored air typically runs a gas-fired turbine generator. As the compressed air is released from the reservoir (i.e. expanded), it consequently cools down and needs to be heated to improve the power quality of the turbine/generator unit. This is achieved by mixing compressed air with fuel (i.e. natural gas) in a combustion chamber to drive the turbine system. Often, combustion exhaust gases are recuperated to improve efficiency. The classic CAES design involves fossil-fuel combustion in the turbine chambers to provide heat during the expansion phase, with the drawback of emitting CO2.
Advanced adiabatic compressed energy storage (AA-CAES) systems are a more recently developed concept that addresses this issue. In the AA-CAES concept, the heat that normally would be released to the atmosphere during the compression phase is stored in a thermal storage system (TES). This heat is added back through heat exchangers to the air being released from the reservoir during expansion-mode operation. This enables AA-CAES systems to convert the energy in the compressed air to electricity without involving a combustion process and avoiding related emissions. Figure 18 schematically compares these two systems.

55ELECTRICITY STORAGE AND RENEWABLES: COSTS AND MARKETS TO 2030
Figure 18: Schematic diagram of diabatic (left) and adiabatic (right) compressed air energy storage systems
Power InDuring Charging
Power OutDuring Discharging
Motor Motor
Combustionchamber
Fuel
Air
Air cooler
Compressor Turbine
Compressor
Heat exchanger
Turbine GeneratorGeneratorAir
M G G
Cavern Cavern
Heat Storage
a) b)
Power InDuring Charging
Power OutDuring Discharging
M
Air
Air
Heat Storage
Source: International Renewable Energy Agency, based on ISEA, 2012.
Table 9: Key features of the Huntorf and McIntosh compressed air energy storage plants
LOCATION YEAR RATED POWER(MW)
RATED ENERGY(MWh)
PREASURE(MPa)
HEATSOURCE
ROUND TRIPEFFICIENCY(in percent)
Huntorf,Germany 1978 290 580 4.6 - 6.6
Naturalgas 42
McIntosh,Alabama,
United States 1991 110 2860 4.5 - 7.4Natural
gas 54
Source: Wang et al., 2017; Rummich, 2009.
In CAES systems, significant amounts of heat are generated when the storage system is charged. Conversely, the compressed air cools down rapidly when released out of the cavern during discharge, potentially freezing and damaging the system. Therefore, CAES systems are traditionally installed next to gas-fuelled power plants, making use of their waste heat to inject it into the processed air in the CAES system.
Although CAES technology has received much attention in recent years, as of 2016 only two large-scale plants are connected to the grid: a 290 MW plant in Huntorf in Germany and one in McIntosh in Alabama, United States, while a planned 270 MW CAES project in Iowa, United States, was recently cancelled after years of planning due to the financial risk. Table 9 shows the key characteristics of these two systems.

56 ELECTRICITY STORAGE AND RENEWABLES: COSTS AND MARKETS TO 2030
Costs and performance outlook of compressed air energy storage systems.
Accurately estimating the development cost of CAES is extremely challenging, as the civil engineering costs involved are particularly site-specific and often depend largely on local environmental constraints. In the best of circumstances (e.g. using a readily accessible gas cavern), low overall costs would result. If, conversely, the cavern needs to be excavated out of hard rock, building costs can easily rise by an order of magnitude. Another difficulty lies in the incomparability to previous CAES projects, due to the limited number in operation or the difficulties to compare these to pumped hydropower
projects that were built decades earlier under considerably different energetic and economic frameworks.
Energy installation costs for CAES in 2016 were estimated to be USD 53/kWh for a typical future project. By 2030, this typical cost could decline to USD 44/kWh. CAES systems can reach cycle lifetimes of up to 100 000 equivalent full cycles, but with relatively poor depth of discharge potential. Increased utilisation of compression-phase heat is expected to contribute to improved average efficiencies by 2030 (Figure 19). A key challenge remains the lack of projects under development and with other electricity storage technologies attracting greater investment the outlook for CAES is highly uncertain.
Figure 19: Properties of compressed air energy storage systems in 2016 and 2030
Depth of discharge (%) Round-trip efficiency (%)
0 5 10 15 20 25 30 35 40 45 50 0 10 20 30 40 50 60 70
CAES 20162030
Energy density (Wh/L) Energy installa�on cost (USD/kWh) Cycle life (equivalen� ull-cycles) Calendar life (years)
0 2 4 6 0 20 40 60 80 0 50000 100000 0 20 40 60 80 100
CAES 20162030
Source: International Renewable Energy Agency.Notes: Wh = watt-hour; L = litre; USD = U.S. dollar; kWh = kilowatt hour.

57ELECTRICITY STORAGE AND RENEWABLES: COSTS AND MARKETS TO 2030
AA-CAES systems require a TES, that increases the complexity of the system and significantly raises investment costs. In order to function effectively, the TES should be capable of storing heat at very high temperatures, up to 600 degrees centigrade (oC), with the potential for AA-CAES systems to then achieve round-trip efficiencies of up to 70% (Gulagi et al., 2016; Barbour et al., 2015). The most promising recent proposals regarding AA-CAES systems include the use of molten salt-based TESs that are comparable to those applied in concentrated solar power plants. These systems enable compression-stage heat reutilisation to compensate the cooling effect on discharge. Other TESs, such as bedrock, thermo oils and solid-state heat storage have also been considered (Bullough et al., 2004).
Bedrock thermal storage was proposed in the Adele project, which was subsequently cancelled (RWE, 2010). Although many adiabatic CAES projects have been proposed in the last two decades, none have reached the stage of commercial operation. Nevertheless, some research projects remain on the topic. For example, a service shaft of the recently completed Gotthard Tunnel in Switzerland is being transformed into an adiabatic CAES by researchers of ETH Zürich. Using thermal storage based on a packed bed of rocks that are encased by a concrete container, the operators plan to reach efficiencies in the range of 72% (ALACAES, 2016).
Cavern, turbine and compressor costs typically amount to more than 80% of the total costs of CAES system (Table 10). However, significant uncertainty must attach to these values given the lack of recent development. Table 11 shows a typical 200 MW CAES configuration with diverse air storage media
and their associated cost estimates. As can be seen, the most competitive projects will rely on existing natural reservoirs that can be prepared for use. The creation of a cavern in hard rock exclusively for a CAES project increased the estimated installed costs by as much as 80%.
Table 10: Cost breakdown for an indicative compressed air energy storage system
SUBCOMPONENT SHARE OF TOTAL COSTS, 2016(IN PERCENT)
Cavern 40Turbine 30
Owner's costs 7
Engineering, procurement,construction management
3Balance of plant 6
Compressor 14
Source: International Renewable Energy Agency, based on NREL and Black & Veatch, 2012.
Table 11: Plant cost of various compressed air energy storage configurations
STORAGEMEDIA FORCAES PLANT
Salt
SIZE (MWE)
200
COST FOR POWERRELATED PLANTCOMPONENTS
(2002 USD/KW)
350
COST FOR ENERGYRELATED PLANTCOMPONENTS
(2002 USD/KWH)
1
TYPICAL HOURSOF STORAGE
10
TOTAL COST(USD/KWE)
360
Hard rock(new cavern) 200 350 30 10 650
Porousmedia 200 350 0.1 10 351
Source: EPRI, 2002.

58 ELECTRICITY STORAGE AND RENEWABLES: COSTS AND MARKETS TO 2030
Table 12: Cost estimates for thermal storage for AA-CAES systems, 2016 and 2030
TYPE OF STORAGE SYSTEM 2016(USD/KILOWATT HOUR
THERMAL)
COST 2030(USD/KILOWATT HOUR
THERMAL)
Sensible high temperature
heat storage in liquids
22-77 -
Sensible high temperature
heat storage in solids
17-44 -
High temperature
storage (not speci�ed)
39 < 15
Molten salt storage 34 10
Thermocline with quartzite 22 -
Source: International Renewable Energy Agency based on EASE/EERA, 2015, 2017; IRENA and IEA-ETSAP, 2013; Pacheco et al., 2002.
FLYWHEEL ENERGY STORAGE
Flywheels store energy as rotational kinetic energy by accelerating and braking a rotating mass. Fywheel energy storage system (FESS) consist of a rotating mass around a fixed axis (i.e. the flywheel rotor) which is connected to a reversible electrical machine that acts as a motor during charge that draws electricity from the grid to spin the flywheel up to operating speed and as a generator during discharge when the already spinning flywheel delivers torque to the generator to provide power to the external grid or load.
The amount of energy that can be stored in a FESS depends primarily on the moment of inertia of the rotor (its weight) and by the speed at which it rotates. The moment of inertia of the rotating mass is a function of its mass and shape, although the rotor’s material properties - in particular, its strength (i.e. tensile strength) - determine the maximum speed at which it can be rotated, given material stress restrictions. Based on these properties, two key broad categories of flywheels have been developed: a low-speed FESS (not exceeding 10 000 revolutions a minute) and a high-speed FESS (up to 100 000 revolutions a minute) (Peña-Alzola et al., 2011).

59ELECTRICITY STORAGE AND RENEWABLES: COSTS AND MARKETS TO 2030
Historically, rotor masses for a low-speed FESS were generally designed with metallic materials, since the rotational stress requirements are don’t exceed the safety threshold for steel, which is a common material choice for such systems. For high-speed systems, stronger yet lighter materials are attractive and their rotor is commonly made of fibre composite, which fulfils these requirements, albeit at a higher cost than steel. For cost reasons, particularly for high power rating systems, steel is sometimes used for the low end of a high-speed FESS (Arani et al., 2017; Amiryar and Pullen, 2017; Sensible, 2016). For safety reasons, given the high rotational speeds of both systems, the flywheel housing is designed to contain any catastrophic failure during operation.
To minimise friction losses, a FESS also contains sets of bearings. The most commonly used bearings are traditional mechanical ball bearings and magnetic bearings, however, some systems with a hybrid bearing design have been implemented. High-speed systems typically rely on magnetic bearings because these have lower friction losses. As an enclosure for the FESS, an evacuated housing is often used, reducing self-discharge and energy conversion lossed by reducing friction losses from the drag induced by the air that would otherwise be inside the housing. A power conditioning unit acts as an electronic converter to interact with the external grid or load. Figure 20 displays a simplified scheme of a modern FESS.
Figure 20: Key components of a high-speed flywheel energy storage system
Powerconditioning
Externalgrid
Bearing
Bearing
Generatormotor unit
Flywheel
Vacuum pump
Vacuum chamber
Source: International Renewable Energy Agency, based on Luo et al., 2015.

60 ELECTRICITY STORAGE AND RENEWABLES: COSTS AND MARKETS TO 2030
Bearings are among the most critical mechanical components of FES systems. Although there are various bearing system options (Figure 21), recent research has focused mainly on improving magnetic bearings, since they have the highest friction reduction potential. While passive or permanent magnetic bearings — commonly used in auxiliary systems —are low in cost, they are rather stiff and, thus, are unable to provide full rotor stability on their own.
Active magnetic bearings, alternatively, operate through magnetic fields that are generated by coils that carry current. While it is an efficient system, it necessitates a complex and relatively expensive control strategy, and overall costs may be higher than for permanent magnets. In addition, the active magnetic bearings consume electricity which reduces the overall efficiency of the system.
Cost aside, systems that are based on superconducting magnetic bearings are considered the best option for high-speed FES systems because they can provide excellent operational stability and a long lifespan, with the lowest degree of frictional loss. Superconducting magnetic bearings, however, rely on the flux pinning properties that superconductor materials exhibit, which are only unlocked at low temperature operation and, therefore, require FESS to include cryogenic cooling systems. These additional costs can be mitigated somewhat by applying high temperature superconductors, instead, since they can reduce the energy required for cooling (Amiryar and Pullen, 2017; Daoud et al., 2012; Nagaya et al., 2001).
Figure 21: Types of bearings for flywheel energy storage systems
Types of FESSbearings
Mechanical (ball,roller, sleeve)
Magnetic
Hybrid (mechanicaland magnetic)
Passive/Permanent(PMB)
Active (AMB)
Superconducting(SMB)
Lowtemperature
Hightemperature
Source: International Renewable Energy Agency, based on Daoud et al., 2012.Note: FESS = flywheel energy storage system; PMB = permanent magnetic bearings; AMB = active magnetic bearings; SMB = superconducting magnetic bearings.

61ELECTRICITY STORAGE AND RENEWABLES: COSTS AND MARKETS TO 2030
Flywheels have a high power density (i.e. up to 10 kW/L), fast charge capabilities and excellent cycle life (i.e. up to 1 million cycles). Because of their fast response times (i.e. approximately 10 milliseconds), FES systems usually are used in when short-term storage is required. Applications include frequency stabilisation in power grids (e.g. often used in the United States) or power buffering for trams and underground trains. Since they store kinetic energy in a mass rotating at high velocity, flywheels can pose a risk to their surroundings. Inadequate design, insufficient maintenance or excessive speed can cause a flywheel to break apart or come loose from its mounts and cause severe damage to the building and workers. To operate safely, comprehensive security measures are essential.
Especially for high-speed FES, it is essential that any design either has a rotor which can be guaranteed never to burst or has containment to fully contain a burst in the event this occurs. It is also important to ensure the rotor is kept within its casing in the event of a bearing failure. This is achieved by suitable casings including emergency bearings and commonly applied for larger flywheels, putting them in underground bunkers. Excessive speed, typically a risk with mechanically driven flywheels is often managed by inverter controlled drives plus additional overspeed trips that can be installed.
Table 13: Advantages and disadvantages of flywheel energy storage systems
ADVANTAGES DISADVANTAGES
Fast charge capabilities
Long life cycle and no capacity degradation (lifetime largely unaffected by number of charge/discharge cycles)
High power density, largely independent of stored energy level
Low maintenance required
State of charge is easy to determine (through rotational speed)
Wide operational experience (due to use in motors and other industrial applications)
Low energy density compared with battery systems
Very high idle losses (self-discharge rates)
Need for bearing maintenance or power for energising magnetic bearings
Unexpected dynamic loads or external shocks can lead to failure
Source: International Renewable Energy Agency, based on Arani et al., 2017; Amiryar and Pullen, 2017; Sensible, 2016; ISEA, 2012; Daoud et al., 2012.

62 ELECTRICITY STORAGE AND RENEWABLES: COSTS AND MARKETS TO 2030
Costs and performance outlook of flywheel energy storage systems
Due to their high energy installation costs, of between USD 1 500 and USD 6 000/kWh, and a significantly high self-discharge of
up to 15% an hour, FES systems are not suitable for medium- or long-term storage applications. Energy installation costs for flywheel systems are expected to decline to between USD 1 000 and USD 3 900/kWh as cycle and calendar lifetimes substantially improve (Figure 22).
There are numerous on-going developments that aim to improve performance of flywheels for energy storage. The most important ones include:
• New materials: The development of new materials with high strength and low density can allow higher energy densities. However, the increased size and weight of the containment vessel required mean the economics of such developments must be carefully studied. Developments in lightweight yet effective containment could yield improvements in energy density, but again must be balanced against any increased cost.
• Superconducting bearings: The reduction of friction losses is the main focus of research and development for flywheel systems, since it enables increased rotating speeds and decreases self-discharge rates. Using high-temperature superconducting materials for the bearings can significantly increase the performance of flywheels by reducing friction loss, while minimising cooling costs. A practical example of a flywheel, featuring superconducting magnetic bearings, was put into operation in Japan in 2015. The 300 kW/100 kWh storage device contains a carbon-fibre, reinforced, plastic disc that weighs four tonnes and is used in combination with a megawatt-class solar park for grid stabilisation (Furukawa, 2015).
• Electric machines: Innovative concepts for electric machines (the motor/generator) with fewer permanent magnets could decrease system costs in the future while, at the same time, reducing dependency on materials such as rare earths. Switched reluctance machines that have no permanent magnets but, instead, operate by reluctance torque appear promising. As these machines have no physical friction parts, they are suitable for exceptionally high speeds with almost no maintenance cost. Advanced control mechanisms are required, however, to maintain reliability with the increased system complexity.
Figure 22: Properties of flywheel energy storage systems, 2016 and 2030
Energy density (Wh/L) Energy installa�on cost (USD/kWh) Cycle life (equivalent full-cycles) Calendar life (years)
0 50 100 150 200 0 2000 4000 6000 0 500000 1000000 0 10 20 30
Flywheel 20162030
Depth of discharge (%) Round-trip efficiency (%)
0 10 20 30 40 50 60 70 80 90 0 10 20 30 40 50 60 70 80 90
Flywheel 20162030
Source: International Renewable Energy Agency.
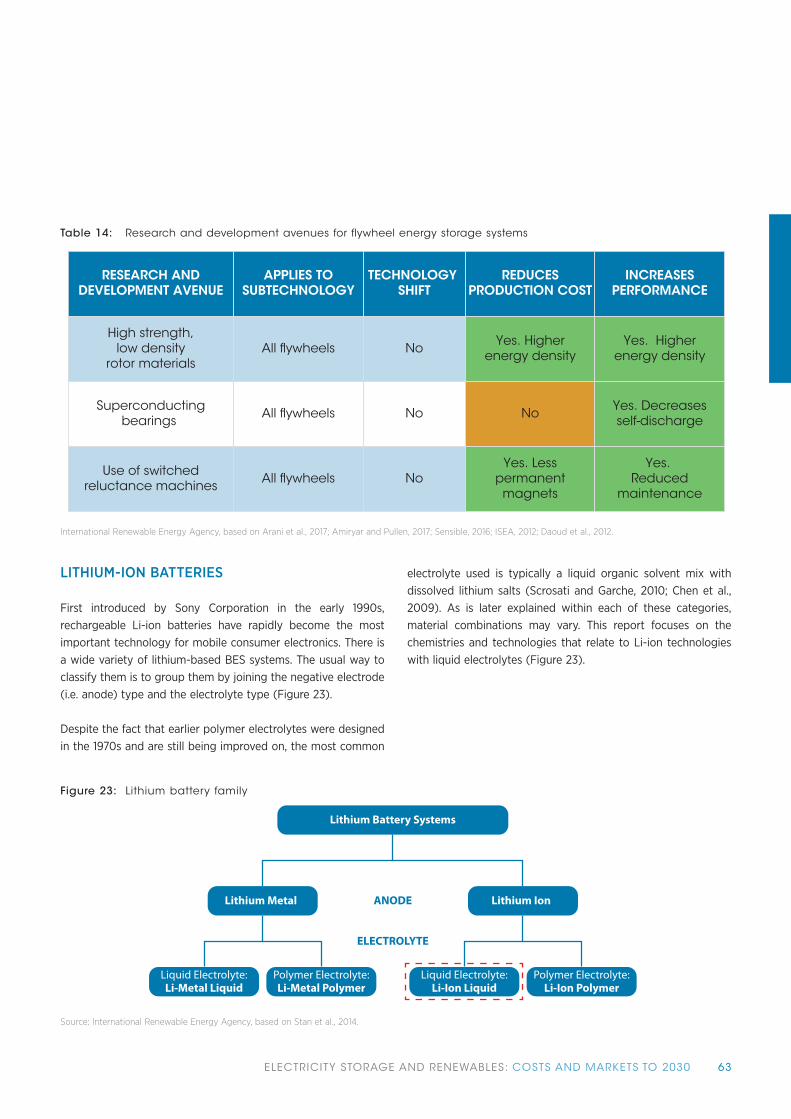
63ELECTRICITY STORAGE AND RENEWABLES: COSTS AND MARKETS TO 2030
LITHIUM-ION BATTERIES
First introduced by Sony Corporation in the early 1990s, rechargeable Li-ion batteries have rapidly become the most important technology for mobile consumer electronics. There is a wide variety of lithium-based BES systems. The usual way to classify them is to group them by joining the negative electrode (i.e. anode) type and the electrolyte type (Figure 23).
Despite the fact that earlier polymer electrolytes were designed in the 1970s and are still being improved on, the most common
electrolyte used is typically a liquid organic solvent mix with dissolved lithium salts (Scrosati and Garche, 2010; Chen et al., 2009). As is later explained within each of these categories, material combinations may vary. This report focuses on the chemistries and technologies that relate to Li-ion technologies with liquid electrolytes (Figure 23).
Figure 23: Lithium battery family
Lithium Battery Systems
Lithium Metal Lithium Ion
Liquid Electrolyte:Li-Metal Liquid
Polymer Electrolyte:Li-Metal Polymer
Liquid Electrolyte:Li-Ion Liquid
Polymer Electrolyte:Li-Ion Polymer
ANODE
ELECTROLYTE
Source: International Renewable Energy Agency, based on Stan et al., 2014.
Table 14: Research and development avenues for flywheel energy storage systems
RESEARCH ANDDEVELOPMENT AVENUE
APPLIES TOSUBTECHNOLOGY
TECHNOLOGY SHIFT
REDUCESPRODUCTION COST
INCREASESPERFORMANCE
High strength,low density
rotor materialsAll �ywheels No Yes. Higher
energy densityYes. Higher
energy density
Superconductingbearings All �ywheels No No Yes. Decreases
self-discharge
Use of switchedreluctance machines All �ywheels No
Yes. Lesspermanentmagnets
Yes. Reduced
maintenance
International Renewable Energy Agency, based on Arani et al., 2017; Amiryar and Pullen, 2017; Sensible, 2016; ISEA, 2012; Daoud et al., 2012.

64 ELECTRICITY STORAGE AND RENEWABLES: COSTS AND MARKETS TO 2030
Li-ion batteries exchange lithium-ions (Li+) between the anode and the cathode, which are made from lithium intercalation compounds. For example, lithium cobalt oxide (LiCoO2), originally introduced in the 1980s, was the active positive material of Sony’s original Li-ion battery design (Ozawa, 1994; Mizushima et al., 1980). That material combination features a significantly higher energy density compared to other Li-ion types, although it exhibits disadvantages such as a short lifespan, limited charging rates and a moderate thermal stability that, at present, mean its use is almost exclusively confined to the computer, consumer electronics and communications (3C) market where energy density is
of paramount importance. Given that LiCoO2 cathode (LCO) batteries are not typically used in the stationary applications market, they are not discussed in this report.
Li-ion batteries usually have a cathode made of a lithium metal oxide (LiMEO2), while the anode is often made of graphite (Díaz-González et al., 2012; Linden and Reddy, 2002). Figure 24 illustrates in abstract terms the operating principle, and the general structure of a lithium metal oxide cathode/carbon-based anode Li-ion cell. This is just one specific example and doesn’t represent the manifold cathode and anode material combinations that are possible.
As a group, Li-ion batteries have the advantage of high specific energy, as well as high energy and power density relative to other battery technologies. They also exhibit a high rate and high power discharge capability, excellent roundtrip efficiency, a relatively long lifetime and a low self-discharge rate. Issues relating to the thermal stability and safety of Li-ion batteries relate to chemical reactions that release oxygen when lithium metal oxide cathodes overheat. This “thermal runaway” may cause leaks and smoke gas venting, and may lead to the cell catching fire. While this is an inherent risk of Li-ion batteries, it can be triggered by external non-design
influences such as external heat conditions, overcharging or discharging or high current charging. Therefore, Li-ion BES systems contain integrated thermal management and monitoring processes, and much effort is being placed on their improvement (Khan, Swierczynski and Kær, 2017; IRENA, 2015a; Albright and Al-Hallaj, 2012; Dahn et al., 1994).
The advantageous characteristics and the promising avenues to further improve the key characteristics of Li-ion batteries has made them the dominant battery technology of choice for the portable electronics and electromobility markets. As
Figure 24: Main components and operating principle of a lithium metal oxide cathode and carbon-based anode lithium-ion cell
Negative electrode Positive electrode
Oxygen
Metal
Lithium-ion
Carbon
Separator
Discharge
Charge
ElectrolytesSource: ISEA, 2012.

65ELECTRICITY STORAGE AND RENEWABLES: COSTS AND MARKETS TO 2030
the cost of Li-ion BES systems decline, they are increasingly becoming an economic option for stationary applications and their presence in that segment is increasing.
While Li-ion batteries are often discussed as a homogeneous group, this is far from reality. The various material combinations (i.e. chemistries or subchemistries) of Li-ion BES yield unique performance, cost and safety characteristics. The chemistry choice often relates to the desire to optimise the BES system to meet various performance or operational objectives, and such considerations may lead to a different electrode (or electrolyte) material selection. For example, some Li-ion BES systems may be designed for applications where high power
or high energy density is required, while for other applications prolonged calendric life or the lowest capital cost possible maybe the goal.
Some of the Li-ion material combinations that are most commonly used at present in stationary applications are covered by this report and highlighted in Figure 25. This displays the anode and cathode materials combination and the chemistry abbreviation (common name for the Li-ion subtechnology), a qualitative analysis of some of the key properties of typical Li-ion technologies, as well as some of their advantages and disadvantages.
A wide range of materials and combinations beyond those shown in Figure 25 have been researched for application in anode, cathode or electrolytes of BES systems, and research activities are ongoing. Each setup has its own economical, electric performance and safety characteristics. To discuss
each in detail would be beyond the scope of this report. Nevertheless, short descriptions are presented of the most relevant chemistries in terms of their commercialisation and applicability to the stationary storage segment.
Figure 25: Comparison of lithium-ion chemistry setups
Key ac�ve materiallithium nickel manganese
cobal oxidelithium manganese oxide lithium nickel cobalt
aluminumlithium iron phosphate lithium �tanate oxide
Technology short name NMC LMO NCA LFP LTO
Cathode LiNixMnyCo1-x-yO2 LiMn2O4 (spinel) LiNiCoAlO2 LiFePO4 variable
Anode C (graphite) C (graphite) C (graphite) C (graphite) Li4Ti5O12
Safety
Power Density
Energy Denisty
Cell costs advantage
Life�me
BESS performance
Advantages
-good proper�es combina�on-can be tailored for high power or high energy-stable thermal profile-can operate at high voltages
-low cost due to manganese abundance-very good thermal stability-very good power capability
-very good energy and good power capability-good cycle life in newersystems-long storage calendar life
-very good thermal stability-very good cycle life-very good power capability-low costs
-very good thermal stability-long cycle life�me-high rate discharge capability-no solid electrolyte interphase issues
Disadvantages-patent issues in some countries
-moderate cycle life insufficient for some applica�ons-low energy performance
-moderate charged state thermal stability wich can reduce safety-capacity can fade at temperature 40-70°C
-lower energy density due to lower cell voltage
-high cost of �tanium-reduced cell voltage-low energy density
Source: International Renewable Energy Agency, based on Nitta et al., 2015; Müller et al., 2017; Blomgren, 2017; and data from Navigant Research (Tokash and Dehamna, 2016).

66 ELECTRICITY STORAGE AND RENEWABLES: COSTS AND MARKETS TO 2030
Lithium nickel manganese cobalt/lithium manganese oxide
Nickel-manganese-cobalt (NMC) cells are a common choice for stationary applications and the electromobility sector. An evolution from the LCO concept, these types of cells emerged from research which, for cost reasons, aimed to combine cobalt with other less expensive metals while retaining structural stability (Yabuuchi and Ohzuku, 2003; Rossen, Jones and Dahn, 1992).
A layered crystal-structured material, composed of equal parts of nickel, cobalt and manganese, is referred to as (1/1/1), which denotes that equal (i.e. third) parts of each element are combined13. In order to reduce the utilisation of the relatively more expensive cobalt, yet still maintain performance, manufacturers have also developed batteries with an NMC blend of five parts of nickel, three parts of cobalt and two parts of manganese (5/3/2). These two combinations are commonly used, although sometimes NMC cells with a ratio of 4/4/1 are used by some manufacturers. The NMC cathode material provides a good combination of energy, power and cycle life. NMC cells have better thermal stability than LCO cells due to their lower cobalt content.
Lithium manganese oxide (LMO) cells have high power capabilities and have the advantage of relying on manganese, which is about five times less expensive than cobalt. The three-dimensional spinel crystal structure of LMO cells favours the Li+ ion flow which, in turn, provides the LMO cells with high current discharging capabilities. LMO cells, however, have a lower energy performance and only moderate life cycle properties (Thackeray, 2004; Thackeray et al., 1987). These disadvantages may have an impact on the attractiveness for stationary applications, and the BES systems in this segment often apply a blend of NMC and LMO cells. The NMC/LMO-combined BES system provides a balance between performance and cost, and these systems are included in this report.
Lithium cobalt aluminium
As a progression from the early LCO cells, cathode materials with the same crystal structure, but utilising nickel instead of cobalt, were developed. These cells, based on lithium nickel oxide, benefit from higher energy density and lower costs compared to the early cobalt-based structures. Unfortunately, they have the drawback of lithium diffusion issues that potentially occur, while their thermal stability is comparable to LCO cells. Adding small quantities of aluminum to them, however, has improved the electrochemical and thermal stability properties, while maintaining some of the other benefits (Chen et al., 2004). These advances have led to the rise of lithium cobalt aluminium (NCA) battery chemistries and their increased use in the mobility market (e.g. notably, in Tesla Motors EVs). Storage systems based on NCA cells tend to rely on a nickel cobalt aluminum cathode with a 5% Al doping. NCA cells and their BES systems feature a higher energy density than NMC-based Li-ion batteries, with the additional advantage that aluminum increases performance and is more cost effective than cobalt. Higher voltage operation of NCA cells leads to the degradation of electrolytes, and research continues to tackle this challenge (Krause, Jensen and Chevrier, 2017; Downie, Hyatt and Dahn, 2016). If successfully overcome, it may create an increased presence of NCA-based BES systems in other applications beyond mobility.
Lithium iron phosphate
The olivine crystalline structure of the lithium iron phosphate (LFP) chemistry ensures it’s a better thermal stability compared to other Li-ion cells and, while they still require single-cell management systems, LFP cells may be marketed as “inherently safe”. The technology possesses relatively high power capability, the environmental advantage of an inexpensive and non-toxic cathode material and a long lifetime. These characteristics, as well as the relative low discharge rate, makes the LFP BES system a very attractive technology for stationary applications (Stan et al., 2014).
13 Sometimes referred to as LiNi1/3Mn1/3Co1/3O2 or LiNi0.33Mn0.33Co0.33O2 for that specific composition and, in general, as LiNixMnyCo1-x-yO2 for other composition ratios.

67ELECTRICITY STORAGE AND RENEWABLES: COSTS AND MARKETS TO 2030
Using iron phosphate as the active material in the Li-ion battery has the disadvantage, however, of a lower-rated cell voltage and, hence, lower achievable energy density due to the lower electrical and ionic conductivity of the material structure. There are numerous R&D efforts to reduce such impacts, most concentrating on reducing the material particle size, to a nanosize, and improving particle conductivity through carbon coating. In addition, the doping of some metals, such as vanadium or titanium, may yield promising results in terms of increasing the LFP cell performance (Su et al., 2017; Kosova and Podgornova, 2015; Wang et al., 2013; Wang and Sun, 2012; Chung et al., 2002).
Lithium titanate
Despite the fact that graphite remains the most common anode material in Li-ion cells, the utilisation of the spinel structure of lithium titanate (LTO) is gaining traction due to some advantages over graphite that may be relevant to stationary applications. In particular, LTO cells exhibit benefits in terms of power and chemical stability, while the increased ion agility in the LTO structure enables fast charging (i.e. high rate operation). LTO cells are very stable in thermally in the charge and discharge states (Scrosati and Garche, 2010; Bruce et al., 2008).
Due to the higher reference potential of titanate compared to graphite, the cell voltage is reduced to approximately 2-2.5 volts,14 thus lowering its maximum energy density, although it is still higher than batteries of lead acid and nickel-cadmium. Despite its lower energy density restriction, LTO is inherently safer compared to other Li-ion technologies. The LTO anode high potential prevents issues that relate to electrolyte material decomposition, which can result in the growth or breakdown of the solid electrolyte interphase and its related tendency to overheat and see capacity fade and other aging issues. This is a significant advantage, since solid electrolyte interphase challenges, which are typical to all other Li-ion technologies, represent their main disadvantage. Consequently, much effort centres on gaining a better understanding of the phenomenon
in order to identify solutions to reduce its impact on the battery cells (Soto et al., 2015; Pinson and Bazant, 2012).
Another benefit of the high potential of the LTO anode is that even at high rates, the issue of microscopic fibres of lithium (dendrites) sprouting onto the anode surface does not occur (Chen et al., 2013; Jiang, Chen and Dahn, 2004; Ferg, 1994). These properties make LTO the most durable Li-ion technology so far, and extremely high cycle lifetimes of 20 000 equivalent full cycles or more can be reached. Due to a low worldwide production volume, however, cell prices remain high.
Current costs and performance of Li-ion battery electricity storage systems in stationary applications
Current energy densities for Li-ion cell technologies analysed in this report range between 200 watt hours/litre (Wh/L) to a high of 735 Wh/L in the best case, for the NMC/LMO configuration.
Energy installation cost estimates range between USD 473 and USD 1 260/kWh for LTO-based systems and between USD 200 and 840/kWh for the other Li-ion battery chemistries. The depth of discharge of these chemistries varies between 80% and 100%, while the central round-trip efficiency estimate of Li-ion technologies (i.e. a key advantage) ranges between 92% and 96%.
14 A high anode lithiation potential (vis-à-vis graphite) of approximately 1.55 volt results in an overall lower cell voltage for LTO configurations, compared to LCO or LFP cells.

68 ELECTRICITY STORAGE AND RENEWABLES: COSTS AND MARKETS TO 2030
Figure 26: Properties of selected chemistries of lithium-ion battery electricity storage systems, 2016
Energy density (Wh/L) Energy installa�on cost (USD/kWh) Cycle life (equivalen �ull-cycles) Calendar life (years)
0 200 400 600 0 500 1000 0 5000 10000 15000 20000 0 5 10 15 20
NCANMC/LMO
LFPLTO
Depth of discharge (%) Round-trip efficiency (%)
0 10 20 30 40 50 60 70 80 90 100 0 10 20 30 40 50 60 70 80 90 100
LFPNCA
NMC/LMOLTO
Source: International Renewable Energy Agency.
The lifetime of Li-ion batteries varies depending on cell design and operating conditions, although it can range between 500 and 20000 equivalent full cycles for the technologies considered in this report. Apart from impacting performance and safety, the operating temperature of a BES system has a significant impact on cycle lifetime (Leng et al., 2015). In general, operation at higher temperatures can accelerate battery aging and reduce lifetimes. For example, as a rule of thumb, every temperature increase of approximately 10°C over the design operating temperature lowers the calender lifetime by 50%. This is because the rate of unwanted chemical reaction inside the battery increases with temperature, degrading the cells and resulting in reduced battery cycle life (Lawson, 2017; Friedrischková, Vala and Horák, 2015). The best lifetime performance for most Li-ion BES systems is achieved at moderate temperatures of between 20°C and 30°C (Shabani and Biju, 2015; Choi and Lim, 2002). In hot climates, this means that cooling of the battery storage location is often necessary.
At the other extreme, operation at very low (e.g. below zero °C temperatures) may lead to severe power loss. Research is ongoing in this field to address this issue, especially regarding its application in the electromobility sector where this could become a significant limitation for EVs in some locations (Wang et al., 2016; Ji, Zhang and Wang, 2013).
BES system costs are experiencing a downward trend in recent years, which has been widely documented. Nevertheless,
detailed cost breakdowns for battery ESSs are often scarce or difficult to obtain due to confidentiality restrictions. Another hurdle to obtain more granular insight is that sometimes the difference in system design or technology used, depending on the application, as well as system sizing and cost boundaries vary sufficiently to make comparison difficult.
Some data are available in the literature and are presented in Figure 27. The differences in individual cost components as a share of the total are significant. For example, in Figure 27, the contribution of material-related cost items ranges from less than one-third in one study to between 55-63% of total system costs in the other four studies. Nevertheless, when looking at just the material-related cost components, their individual contribution to total materials cost appears more evenly distributed among sources. Across all five sources, electrode materials (anode, cathode and electrolyte) contribute approximately half of the cost. The principal contributor to total materials cost is the cathode which between 31% and 39% of total material cost (between 10% and 23% of total BES system cost). It is worth noting that as energy density improves, the share of materials costs in the total should fall and represents an important cost reduction avenue, as it may outweigh raw material reductions from manufacturing process improvements. Much research centres on this and on increasing overall cell kWh output, either through increased efficiencies or chemistry innovation.

69ELECTRICITY STORAGE AND RENEWABLES: COSTS AND MARKETS TO 2030
Figure 27: Cost breakdown of lithium-ion battery electricity storage system from selected sources
0%
10%
20%
30%
40%
50%
60%
70%
80%
90%
100%
% o
f Tot
al C
ontr
ibu�
on (%
)
Material cost components as % o �otal material costs
0%
10%
20%
30%
40%
50%
60%
70%
80%
90%
100%
% o
f Tot
al C
ontr
ibu�
on (%
)
Cost components as % of total system costs
AnodeCathodeElectrolyteSeparatorOthermaterialsLaborOverheadProfitmarginRest
Source: International Renewable Energy Agency, based on Qnovo, 2016; Pillot, 2015; Sakti et al., 2015; Roland Berger, 2012; Lowe et al., 2010.
The contribution of cell costs to the total BES system cost will vary, depending on the BES system size. A lower contribution of cell cost components as system size increases can be expected, since for larger systems, the power electronics and periphery costs become more relevant (Müller et al., 2017). For example, aggregated cost breakdown estimates for Li-ion
BES systems in various market segments place cell costs at 35% for large systems, compared to 46% for residential systems (Figure 28).

70 ELECTRICITY STORAGE AND RENEWABLES: COSTS AND MARKETS TO 2030
Figure 28: Cost component distribution of lithium-ion battery energy storage systems of different storage sizes, 2016
cell power electronics periphery
residen�al mul�family community large-scale residen�al mul�family community large-scale residen�al mul�family community large-scale0%
10%
20%
30%
40%
50%
Perc
enta
ge c
ost c
ontr
ibuo
n (%
)
Source: International Renewable Energy Agency, based on Müller et al., 2017.
Figure 29: Home storage lithium-ion system offers in Germany from Q4 2014 to Q1 2017
Lithium-ion2014 2015 2016 2017
Q4 Q1 Q2 Q3 Q4 Q1 Q2 Q3 Q4 Q1
1000
2000
3000
4000
5000
2016
USD
/kW
hus
able
(net
)cap
acity
2515
21081771
15881381
1161 1170 1121 1070 101710th
percentile
90thpercentile 60% median price
decline since Q4 2014
Source: International Renewable Energy Agency, based on EuPD Research, 2017.
Drivers of market growth and cost reduction potential for Li-ion technologies
Li-ion technologies have benefitted from significant investment in recent years due to their versatility that enables them to be deployed in a wide variety of applications, many of which show important synergies in terms of technology development. Numerous promising research activities and a manufacturing landscape that is not just growing, but also increasing in scale mean that there will be continuing improvements in the energy, power and safety characteristics of Li-ion BES. These improvements will mean the cost competitiveness of Li-ion BES systems will continue to improve.
The recent history of cost declines for Li-ion BES systems have been impressive. The battery pack costs for EVs have fallen by 73% between 2010 and 2016 as EV deployment has accelerated. Consistent time series data for Li-ion BES systems is typically not readily available, with some exceptions. Germany has been supporting the deployment of small-scale ESS since 2013 and data on the cost of residential storage systems in Germany is available from a number of sources. Figure 29 shows the quarterly BES system prices offered by installers in Germany for Li-ion batteries since Q4 2016. Between Q4 2016 to Q1 2017 the median system price offered to German customers has fallen by around 60%, although declines have slowed in recent quarters from the very rapid declines seen in 2015.

71ELECTRICITY STORAGE AND RENEWABLES: COSTS AND MARKETS TO 2030
Figure 30: Cost reduction drivers of battery electricity storage systems
Liquid Electrolyte:Li-Metal Liquid
Increasingproductioncapacities
Lower prices New materials
Newapplications
More �eldeperience
Research &Development
Improvedbatteries
Source: International Renewable Energy Agency.
Li-ion is a relatively new technology and its cost reduction potential is large and based on a number of drivers. The main technical factors that are likely to significantly influence Li-ion technology costs are an increase in the scale of production capacity, improvements in materials, more competitive supply chains, performance improvements and the benfits of broader operating experience feeding back into product design and development (Figure 30). These drivers are not exclusive to Li-ion, as other storage technologies are likely to experience a similar dynamic as their deployment grows. However, with
the dominance of Li-ion batteries in the EV market and the synergies in the development of Li-ion batteries for EVs and stationary applications (as seen with Tesla’s EV and stationary battery offerings), the scale of deployment that Li-ion batteries are likely to experience will be orders of magnitude higher than for other battery technologies. This doesn’t translate into order of magnitude cost savings, but this scale-up of Li-ion batteries will result in significant cost reduction opportunities.
Global manufacturing for Li-ion cells has ramped up considerably, and plans to further expand capacities continue. The annual manufacturing capacity for Li-ion batteries today, for all chemistry types, may be 100 GWh or more and may possibly exceed 250 GWh by 2020 (Enerkeep, 2016). Li-ion production capacity expansion is underway from current
established players and a number of new entrants, primarily driven by Chinese stakeholders. Apart from so-called megafactories, an increase from approximately 29 GWh in 2016 to 234 GWh by 2020 is envisaged (Benchmark Mineral Intelligence, 2017).

72 ELECTRICITY STORAGE AND RENEWABLES: COSTS AND MARKETS TO 2030
Figure 31: Lithium-ion yearly production capacity expansion, 2016 and 2020 estimates
Company
20 40 60 80 100
GWh
Tesla Motors (US)
LG Chem (US)
LG Chem (Nanjing)
LG Chem (Poland)
LG Chem (Korea)
BYD China (Shenzhen)
Boston Power 1
Boston Power 2
Samsung SDI (Xian)
Samsung SDI (Korea)
Panasonic (Dalian)
Lishen (Tianjin)
CATL (NingDe)
CALB (Luoyang)
SK Innova�on
Dynavolt
Northvolt
cell produc�on capacity 2016 (GWh)Benchmark Mineral Intelligence cell produc�on capacity forecast in 2020 (GWh)
0
Source: International Renewable Energy Agency, based on Benchmark Mineral Intelligence, 2017.
Apart from the much-discussed “Gigafactory 1” (Tesla Motors/Panasonic), all the major suppliers of Li-ion cells, including Samsung SDI, China Aviation Lithium Battery Co. Ltd., LG Chem and SK innovation, are now investing in new worldwide production capabilities. Although the bulk of the capacity has been announced in Asian facilities, a consortium of several German companies recently announced the creation of a 35 GWh per annum Li-ion cell production plant in Germany (pv magazine, 2017a).
At the pack level, new facilities and innovations continue to advance worldwide. Companies, such as Volkswagen and Daimler, are investing billions of Euros into facilities for pack assembly for stationary and mobile applications (pv magazine, 2017b; Bloomberg, 2017). With such an increased manufacturing landscape, continuous price declines for Li-ion battery cells and packs will most likely continue. Learning rates based on cumulative production experience curves for
Li-ion stationary systems have been recently estimated at 12-16%. These estimates may not be directly comparable to learning rate estimates for electric vehicle battery technologies, which may differ from this range, depending on the research scope (Schmidt et al., 2017; Kittner et al., 2017; Nykvist and Nilsson, 2015).
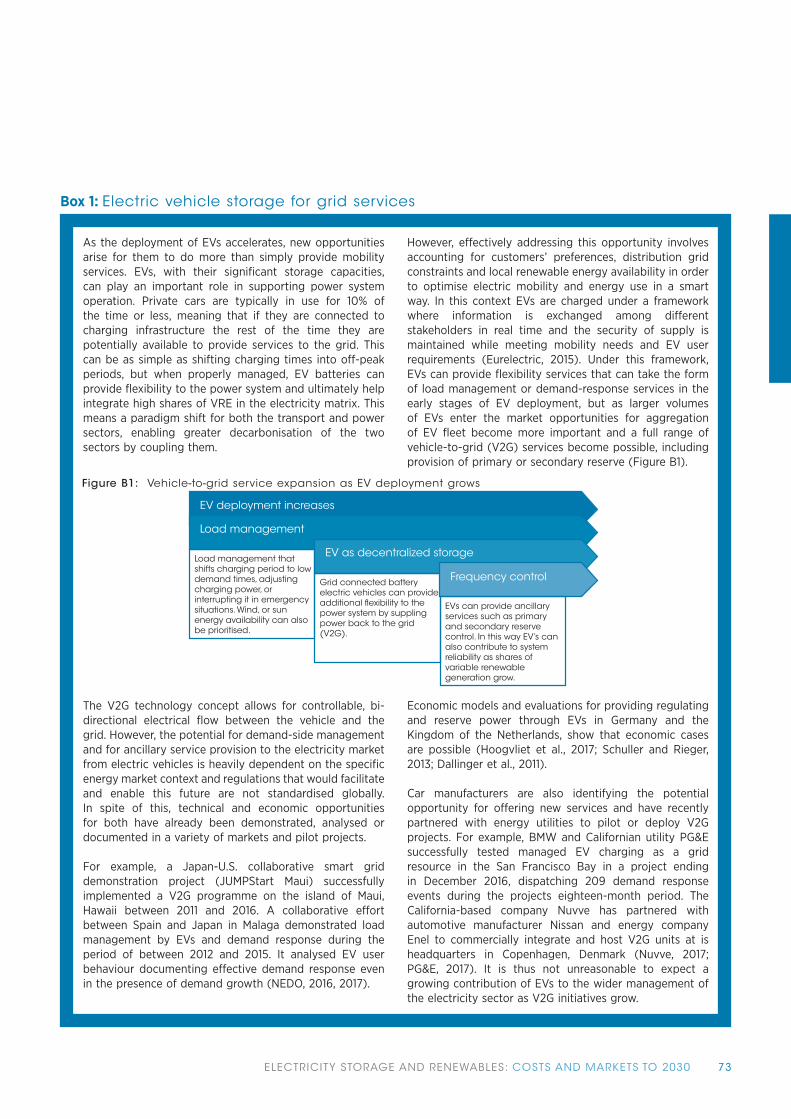
73ELECTRICITY STORAGE AND RENEWABLES: COSTS AND MARKETS TO 2030
As the deployment of EVs accelerates, new opportunities arise for them to do more than simply provide mobility services. EVs, with their significant storage capacities, can play an important role in supporting power system operation. Private cars are typically in use for 10% of the time or less, meaning that if they are connected to charging infrastructure the rest of the time they are potentially available to provide services to the grid. This can be as simple as shifting charging times into off-peak periods, but when properly managed, EV batteries can provide flexibility to the power system and ultimately help integrate high shares of VRE in the electricity matrix. This means a paradigm shift for both the transport and power sectors, enabling greater decarbonisation of the two sectors by coupling them.
However, effectively addressing this opportunity involves accounting for customers’ preferences, distribution grid constraints and local renewable energy availability in order to optimise electric mobility and energy use in a smart way. In this context EVs are charged under a framework where information is exchanged among different stakeholders in real time and the security of supply is maintained while meeting mobility needs and EV user requirements (Eurelectric, 2015). Under this framework, EVs can provide flexibility services that can take the form of load management or demand-response services in the early stages of EV deployment, but as larger volumes of EVs enter the market opportunities for aggregation of EV fleet become more important and a full range of vehicle-to-grid (V2G) services become possible, including provision of primary or secondary reserve (Figure B1).
The V2G technology concept allows for controllable, bi-directional electrical flow between the vehicle and the grid. However, the potential for demand-side management and for ancillary service provision to the electricity market from electric vehicles is heavily dependent on the specific energy market context and regulations that would facilitate and enable this future are not standardised globally. In spite of this, technical and economic opportunities for both have already been demonstrated, analysed or documented in a variety of markets and pilot projects.
For example, a Japan-U.S. collaborative smart grid demonstration project (JUMPStart Maui) successfully implemented a V2G programme on the island of Maui, Hawaii between 2011 and 2016. A collaborative effort between Spain and Japan in Malaga demonstrated load management by EVs and demand response during the period of between 2012 and 2015. It analysed EV user behaviour documenting effective demand response even in the presence of demand growth (NEDO, 2016, 2017).
Economic models and evaluations for providing regulating and reserve power through EVs in Germany and the Kingdom of the Netherlands, show that economic cases are possible (Hoogvliet et al., 2017; Schuller and Rieger, 2013; Dallinger et al., 2011).
Car manufacturers are also identifying the potential opportunity for offering new services and have recently partnered with energy utilities to pilot or deploy V2G projects. For example, BMW and Californian utility PG&E successfully tested managed EV charging as a grid resource in the San Francisco Bay in a project ending in December 2016, dispatching 209 demand response events during the projects eighteen-month period. The California-based company Nuvve has partnered with automotive manufacturer Nissan and energy company Enel to commercially integrate and host V2G units at is headquarters in Copenhagen, Denmark (Nuvve, 2017; PG&E, 2017). It is thus not unreasonable to expect a growing contribution of EVs to the wider management of the electricity sector as V2G initiatives grow.
Box 1: Electric vehicle storage for grid services
EV deployment increases
Load management
EV as decentralized storageLoad management that shifts charging period to low demand times, adjusting charging power, or interrupting it in emergency situations. Wind, or sun energy availability can also be prioritised.
Grid connected battery electric vehicles can provide additional �exibility to the power system by suppling power back to the grid (V2G).
Frequency control
EVs can provide ancillary services such as primary and secondary reserve control. In this way EV’s can also contribute to system reliability as shares of variable renewable generation grow.
Figure B1: Vehicle-to-grid service expansion as EV deployment grows

74 ELECTRICITY STORAGE AND RENEWABLES: COSTS AND MARKETS TO 2030
Beyond mere increased deployment and economies of scale from a larger manufacturing base, continuous innovation and technological improvements are likely to have a large impact on the cost decline potential of Li-ion BES systems. Much of this comes from material improvements, new materials and innovative design. The two most relevant are the following:
• Solid-state Li-ion batteries: Proposed in the 1980s, these cells feature a solid lithium metal anode instead of alloys, as in the case of NMC or NCA chemistries. The solid-state approach promises much higher energy density than other Li-ion technologies. Initially, researchers struggled to satisfactorily control dendrite growth during charging, resulting in undesired safety issues. With new technology, however — most notably, polymer electrolytes — these restrictions appear to be surmountable and several companies, including Bosch, are currently working on their commercialisation (Handelsblatt, 2015). The current conductivity of solid electrolytes, nevertheless, usually
is significantly lower than that of liquid ones, resulting in intrinsically lower power capability and reduced efficiency. Solid-state designs also have been proposed for other chemistries apart from Li-ion, although concepts based on Li-ion have been the most prevalent (J. G. Kim et al., 2015).
• Increased energy densities: Higher energy density enables the manufacturing of batteries of equal capacities, using less active materials and thus unlocks cost savings in much the same way higher efficiency solar cells do for solar PV modules. Since the 1990s, the energy density of the very small Li-ion consumer electronics cells increased by a factor of more than two (Figure 32). This means that for the same amount of energy, less material is required and fewer production steps may be needed, resulting in lower costs. Energy density improvements can therefore contribute to further price decline.
Figure 32: Development of specific energy and energy densitiy compared to costs per watt hour for consumer lithium-ion cells between 1991 and 2005
Spec
ific
ener
gy in
Wh/
kg, e
nerg
y de
nsity
in W
h/l
Cos
ts in
USD
/ W
h
0
0.5
1
1.5
2
2.5
3
0
100
200
300
400
500
600
1991 1992 1993 1994 1995 1996 1997 1998 1999 2000 2001 2002 2003 2004 2005
energy densityspecific energycosts
Source: Dick and van Hoek, 2010.

75ELECTRICITY STORAGE AND RENEWABLES: COSTS AND MARKETS TO 2030
Given the significant cost reduction potential of higher energy densities, it is worth examining in more detail some of the on-going research to further increase the energy density of Li-ion batteries, including the following:
• High-voltage electrolytes: By allowing charging voltages of up to 5 volts (given current systems often capped at 4.4 volts in order to limit electrolyte oxidation and protect cell lifetime), the energy density of Li-ion batteries can be significantly increased with these new electrolytes showing promising stability (Petibon et al., 2016).
• Silicon anode: Inserting a small amount of silicon particles into the graphite anode of Li-ion batteries can boost the achievable cell energy density, but at the expense of increasing mechanical stress during charging as the active material expands. This needs to be overcome before this will be a practical solution, as the electrode volume expansion is approximately 400% during lithiation, reducing cycle life to as few as several hundred cycles. Overcoming low electrode lifetimes through improved silicon nanoparticle and electrode designs and enhanced fabrication processes is therefore the focus of research in this area (Casimir et al., 2016).
• Durable LMO: Several research and development activities focus on improving the cycle lifetime of LMO cells (Saulnier et al., 2016; E.-Y. Kim et al., 2015; Lee et al., 2014). Since manganese is a low-cost and abundantly available basic cathode material, the LMO technology could outpace other, more expensive lithium batteries in the long term. Yet, LMO cells are currently unsuitable for many applications due to their limited lifetime. During cycling, manganese leaches out of the cathode and dissolves in the electrolyte, thus destabilising the solid electrolyte interface on the anode and decreasing the available battery capacity. Some approaches to stop the dissolution process include a graphene coating of the cathode, as well as cationic doping.
Post Li-ion technologies that explore new approaches towards lithium as a material for energy storage have been explored in past years. Some of the most promising materials pathways that could increase energy densities include:
• Lithium sulphur batteries: These batteries use sulphur as an active material, which is abundantly available at reasonable price and allows for very high energy densities
of up to 400 Wh/kg; today’s NMC battery typically reaches values between 150 Wh/kg and 220 Wh/kg. Furthermore, its chemical composition offers an inherent protection against overcharging, making it considerably safer than the commercial Li-ion battery. These batteries are still the early stage of development and must overcome a range of challenges – including a high self-discharge rate, a low internal conductivity and a very low cycle lifetime of only 50 to 100 full cycles – before they can be considered a commercial opportunity.
• Lithium air: Since one of the active materials, oxygen, can be drawn from the ambient air, the lithium-air battery features the highest potential energy and power density of all battery storage systems. Furthermore, the use of only one active material increases the battery’s inherent safety and promises improved environmental compatibility. Many practical problems persist to date, however, such as low storage capacities and a high vulnerability to environmental influences, especially humidity. Due to the existing challenges, large-scale commercialisation of the lithium-air battery is not expected within the next years.
The commercialisation of either of these “post Li-ion battery” technologies promises to lead to significantly improved properties of future lithium-based storage technologies. To compete with the comparably well-understood and inexpensive Li-ion batteries that are currently entering mass production, however, will prove taxing and it will require considerable additional investment. Therefore, it is unclear whether or not the potential of post Li-ion batteries will be realised. There is at least one school of thought that suggests the broad application of post Li-ion batteries prior 2030 is unlikely (Fraunhofer ISI, 2015).
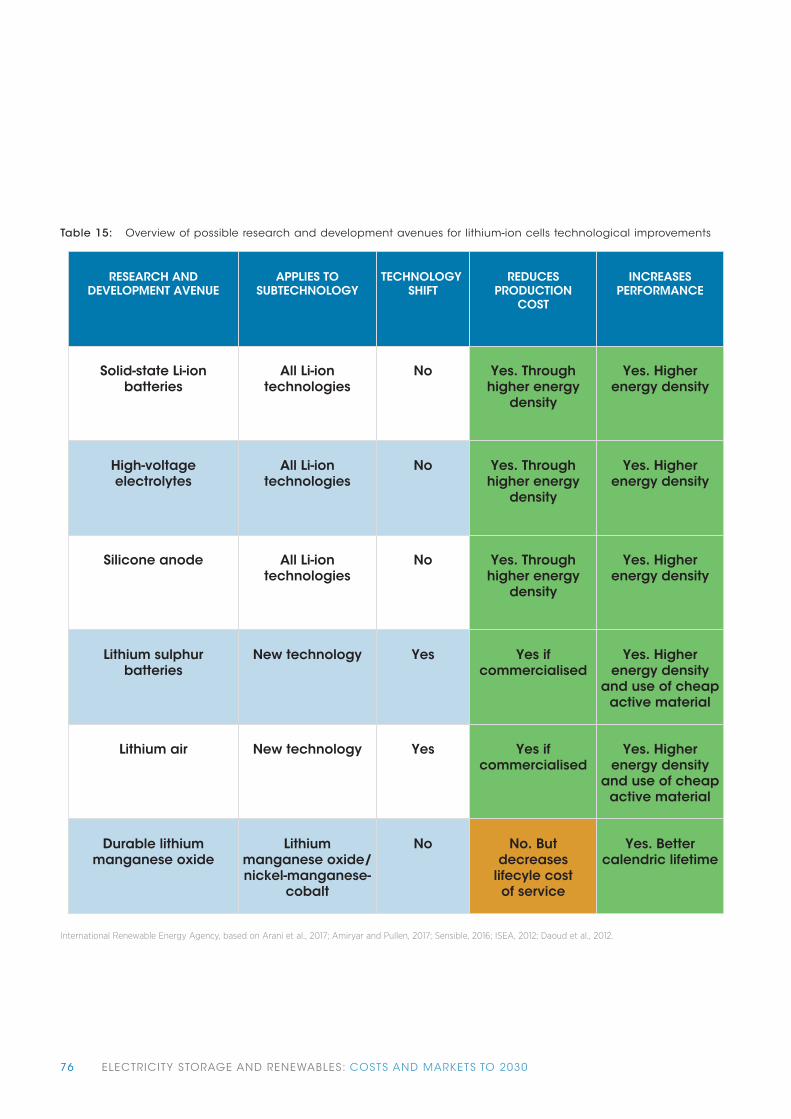
76 ELECTRICITY STORAGE AND RENEWABLES: COSTS AND MARKETS TO 2030
Table 15: Overview of possible research and development avenues for lithium-ion cells technological improvements
RESEARCH ANDDEVELOPMENT AVENUE
APPLIES TOSUBTECHNOLOGY
TECHNOLOGY SHIFT
REDUCESPRODUCTION
COST
INCREASESPERFORMANCE
Solid-state Li-ionbatteries
All Li-iontechnologies
No Yes. Throughhigher energy
density
Yes. Higherenergy density
High-voltageelectrolytes
All Li-iontechnologies
No Yes. Throughhigher energy
density
Yes. Higherenergy density
Silicone anode All Li-iontechnologies
No Yes. Throughhigher energy
density
Yes. Higherenergy density
Lithium sulphurbatteries
New technology Yes Yes ifcommercialised
Yes. Higherenergy density
and use of cheapactive material
Lithium air New technology Yes Yes ifcommercialised
Yes. Higherenergy density
and use of cheapactive material
Durable lithiummanganese oxide
Lithiummanganese oxide/nickel-manganese-
cobalt
No No. Butdecreases
lifecyle costof service
Yes. Bettercalendric lifetime
International Renewable Energy Agency, based on Arani et al., 2017; Amiryar and Pullen, 2017; Sensible, 2016; ISEA, 2012; Daoud et al., 2012.

77ELECTRICITY STORAGE AND RENEWABLES: COSTS AND MARKETS TO 2030
Another important aspect when analysing the future installed cost reduction potential and cost of service for Li-ion batteries is the aspect of field experience. Increasing operational data promotes a deeper understanding of the field behaviour of BES systems under different operating regimes. This can be used to optimise battery management and cell design, as well as allowing smaller safety margins and, hence, improved utilisation of the active materials, as well as better lifetimes of the batteries due to smart charging strategies. This can even benefit existing batteries, where the changes are predominantly to software.
Cost and performance outlook of lithium-ion battery electricity storage system in stationary applications
Improving the competitiveness of Li-ion battery systems will require a combination of improvements in performance and installed cost reductions. Although reducing installed costs is a priority, there are different avenues to achieve this from a manufacturing perspective (e.g. economies of scale) and a technology perspective (e.g. higher energy densities that reduce materials use). Achieving higher calendar lifetimes is also becoming a priority as many applications are unlikely to use the equivalent full cycle potential of today’s batteries. Improving efficiency of the cycle is also important, as well as efforts to improve cell stability to achieve higher depth of discharge in order to make the highest proportion of nameplate capacity as possible available for use.
Material improvements linked to the discussed research and development avenues and increased scale in manufacturing and deployment will drive the cost reduction potential of Li-ion batteries to 2030. Energy installation costs for utility-scale applications are expected to decline from between USD 200 and 1 260/kWh in 2016 to between USD 77 and USD 574/kWh by 2030 (Figure 33). The central estimate for each Li-ion subtechnology is expected to decline from between USD 350 and USD 1 050/kWh in 2016 to between USD 145 and USD 574/kWh by 2030, although the low end of that range reflects the current less expensive NCA chemistry. By 2030, NCA, NMC/LMO and LFP battery chemistries are projected to have costs that fall within roughly the same range of from USD 80 to USD 340/kWh. The central estimates for their costs in 2030 are also similar, with NMC Li-ion technologies for stationary applications at USD 145/kWh, NMC/LMO at USD 167/kWh and LFP somewhat higher at USD 224/kWh. LTO
technologies are expected to remain more expensive, with the central estimate for their energy installation costs falling to USD 480/kWh. However, as we will see, LTO technologies also mainatian a performance advantage over the other Li-ion battery chemistries.
Overall, the central projection for costs of each of these technologies between 2016 and 2030 represent a decline of between 54% and 61% (Figure 33). Such a cost decline expectation is in line with recent estimates that place large-scale stationary Li-ion BES system costs between USD 245/kWh and USD 620/kWh (Schmidt et al., 2017; Feldman et al., 2016; Darling et al., 2014).
The energy density of Li-ion stationary systems is expected to range between 200 Wh/L and 735 Wh/L by 2030. The NMC/LCO combined systems have the highest potential in this respect.
The central estimate round-trip efficiencies (DC-to-DC) are expected to increase two percentage points from between 92% and 96% in 2016 to between 94% and 98% by 2030. The other factor that will affect the overall efficiency and cost competitiveness of the complete system, is the rate of self-discharge. The central estimate for self-discharge of Li-ion batteries range between 0.05% and 0.20% a day in 2016 and are expected to stay flat to 2030.

78 ELECTRICITY STORAGE AND RENEWABLES: COSTS AND MARKETS TO 2030
Figure 33: Properties of selected chemistries of lithium-ion battery electricity storage systems, 2016 and 2030
Energy density (Wh/L) Energy installa on cost (USD/kWh) Cycle life (equivalent full-cycles) Calendar life (years)
0 200 400 600 0 500 1000 0 10000 20000 30000 0 10 20 30
NCA 20162030
NMC/LMO 20162030
LFP 20162030
LTO 20162030
Depth of discharge (%) Round-trip efficiency (%)
0 10 20 30 40 50 60 70 80 90 100 0 10 20 30 40 50 60 70 80 90 100
LFP 20162030
NCA 20162030
NMC/LMO 20162030
LTO 20162030
Source: International Renewable Energy Agency.
In terms of the sources of cost reductions for the energy installation costs, significant cost reductions are expected to come from improved cathode technology, based on research efforts to increase the efficiency of material use, the use of less expensive materials themselves and reduced particle sizing, with complementary approaches in terms of doping innovation, among others. Innovative higher energy density solutions will also raise cell capacity for the same raw material input, or allow reduced material use for the same capacity.
Other materials that relate to cell connection or modules and pack assembly — which are not directly related to cell chemistries — will also see some reduction in cost from higher energy densities as physical volumes for a given capacity decline, but also from economies of scale, as deployment and manufacturing volumes increase. There will also be opportunities to amortise overhead costs over greater volumes, reducing this component as well.
Although the future pathway for cost reductions is somewhat uncertain and the results should be treated with caution given much depends on a variety of R&D efforts that need to be commercialised, as well as manufacturing improvements, supply chain competition, manufacturing scale, etc.; the relative contribution of different cost components to the overall reduction for LFP batteries is presented in Figure 34. While labour costs are very location dependant, it is expected that there will be a general trend towards increased automation as the market for BES systems scales and competition intensifies. Figure 34 highlights that the contribution of materials to the total cost of LFP BES is expected to fall from 47% in 2016 to 43% by 2030.

79ELECTRICITY STORAGE AND RENEWABLES: COSTS AND MARKETS TO 2030
2016 2030
2016
USD
/kW
h
0
100
200
300
400
500
600
2016
USD
/kW
h
Tota
l 201
6
An
od
e
Ca
tho
de
Ele
ctr
oly
te
Sep
ara
tor
Oth
er m
ate
rials
Lab
or
Ove
rhe
ad
Pro
fit m
arg
in
Rest
Tota
l 203
0
0
100
200
300
400
500
600
0%
20%
40%
60%
80%
100%
Perc
en
tag
e (
%)
Total 2016AnodeCathodeElectrolyteSeparatorOther materialsLaborOverheadProfit marginRestTotal 2016
2016 2030
Source: International Renewable Energy Agency.
Figure 34: Cost reduction potential by source for a typical LFP battery energy storage systems, 2016-2030

80 ELECTRICITY STORAGE AND RENEWABLES: COSTS AND MARKETS TO 2030
With the increased uptake of battery electricity storage (BES) technologies, the availability of raw materials — particularly for use in lithium-ion (Li-ion) BES systems — has gained much attention in the last few years as question marks over the availability of sufficient supply to scale up BES have been raised. While often mentioned, it appears unlikely that a shortage of lithium will occur in the near future, even after accounting for increased demand projections (Nitta et al., 2015; Speirs et al., 2014; Gruber et al., 2011). A recent analysis by Germany’s DERA suggests total demand for lithium content could increase to 80 150 tonnes (t) per annum by 2025, a 9.2% compounded annual growth from 2015. At the same time, their conservative supply scenario indicates total lithium extraction growing from 33 011 t in 2015 to 88 000 to by 2025. This assumes 2015 supply capacity is maintained and that planned expansions to existing capacity, will be realised at a rate of 70%. Under a more optimistic supply scenario the surplus of supply over demand in 2025 of 8 000 t for the central demand estimate could rise five-fold to around 40 000 t in 2025, or 50% higher than projected demand. However, uncertainty continues regarding the actual development of demand (Schmidt, 2017).
Current lithium reserves are estimated at approximately 14 million t, while the world’s total resources are estimated today at about 46.9 million t (USGS, 2017). Despite the
fact that overall Li-ion material resources and reserves are sufficiently abundant to support the expected increased uptake of the technology, aggressive demand scenarios could pose challenges for the mining industry to react sufficiently rapidly given the uncertainty in terms of demand growth makes supply planning difficult. Another issue is that the current industry is highly concentrated in terms of resources and reserve distribution, meaning there is not a diverse view on market opportunities, which may result in overly conservative supply expansion plans from existing players. As a result, the main challenge arising from rapid demand growth is likely to be upward pressure on the price of lithium. A similar situation could conceivably play out for the production of cobalt, as this is usually obtained as a by-product of nickel and copper mining and supply growth will require some forward planning.
Although supply risks for lithium and cobalt for BES system do not appear sufficiently threatening to endanger the future uptake of the technology, they do point to the growing importance of sustainable end-of-life management strategies for BES systems that include effective recycling. To enable an enduring positive impact to the global energy transformation, it is essential that the dominant battery chemistries anticipate the importance of developing end-of-life programmes that increase recycling, reuse, or remanufacturing methods (Figure B2).
Box 2: Materials availability and end-of-life management of battery electricity storage systems
Figure B2: Battery electricity storage manufacturing and end-of-life flows
Testing
Cleaning
Inspection
Treatment
Reassembly
Raw materials manufacture
Battery manufacture
Use
Diassembly
Disposal
Re-m
an
ufa
ctu
re
End of productlife
Reu
se
Rec
ycle
Source: IRENA based on Ramoni and Zhang, 2013.

81ELECTRICITY STORAGE AND RENEWABLES: COSTS AND MARKETS TO 2030
Currently, the recycling of lead-acid batteries is economical and widely undertaken (e.g. a recycling rate of more than 99% in Europe). Academia and industry have become active in seeking recycling paths for other chemistries, including the Li-ion family. Initial focus has been on portable technologies, given that the current volume of EVs and stationary application batteries, so
far, have been low. Much progress in recycling methods continues for these, with demonstrations now taking place. Larger battery formats and the diversity of Li-ion chemistries, however, pose added challenges to their recycling. Table B1 summarises four recycling technologies out of the various that exist.
Hydrometallurgical methods have the advantage of being highly selective and energy efficient. The main disadvantage is the variety of chemical reagents used and the need for a large amount of water that then needs to also be treated for reuse.
Pyrometallurgical operations, in contrast, do not incur water waste, have moderate area demands and are fast and easy to setup and manage. Fuel consumption can be reduced when organics, electrolyte, or carbonate are burned. However, the burning of organic components creates complex and costly off-gas treatment issues
and, more importantly, metal formations in this process are inherently less selective and it is more difficult to obtain specific metals for resuse. Due to its need for high temperatures, pyrometallurgy is also energy intensive, adding to costs. Research and demonstration on recycling methods for combinations of subcomponents go beyond those mentioned previously. Research institutes, as well as the recycling sector in China, Europe, Japan and North America continues to intensify efforts in developing innovative approaches to this increasingly essential field (Peters and Friedrich, 2017; JRC, 2016; ELIBAMA, 2014).
MECHANICAL
Dismantling to cellor pack level
Crushing(hammer mill)
Classifying
Scrap fractionsgenerated
Black mass withvaluable metals(cobalt, nickel,manganese, lithium,etc. are recovered)
PIROMETALURGICAL
High temperature processing aimed at recovery or re�nement of metals at elevated temperature
Works under a separation principle producing two phases
Slag phase where Li, Mn, Al are lost
Recovers Co, Ni, Cu, Fe in a metal phase (allow)
Electric are furnace and shaft furnace are used
HYDROMETALURGICAL
Treatment of aqueous solutions to separate components
Black mass is treated by leaching, cementation, puri�cation, solvent extraction or precipitation methods to extract valuable components
THERMAL PRE-TREATMENT +
HYDROMETALURGICAL
Low-temperature thermal treatment aimed at removing organic compounds and graphite (carbon oxidation)
Allows phase transformation into water solube lithium carbonate
Has low energy requirements
Source; IRENA based on Peters and Friedrich, 2017; JRC, 2016; ELIBAMA, 2014.Notes: Li = lithium; Mn = manganese; Al = aluminum; Co = cobolt; Ni = nickel; Cu = copper; Fe = iron.
Table B1: Lithium-ion battery electricity storage system recycling pathways

82 ELECTRICITY STORAGE AND RENEWABLES: COSTS AND MARKETS TO 2030
LEAD-ACID BATTERIES
Lead-acid batteries were first developed more than 150 years ago and are the oldest and most widely deployed rechargeable battery in terms of technology, based on the number of installations and cumulated installed capacity. They typically have a good cost-performance ratio in a wide range of applications. However, they have a relatively low energy density, are very heavy, typically don’t respond well to deep discharging and lead may be a restricted material in some applications or locations due to its toxicity. However, lead-acid batteries are relatively easily recycled and there is a large existing market.
There are two main design forms of lead-acid batteries available: ‘flooded’ (often also called ‘vented’) and valve-regulated (often also referred to as ‘sealed’). At present, lead-acid batteries are used in a multitude of applications, including as starter batteries in cars; in uninterruptable power supply systems; as traction batteries in forklifts or golf carts; and in off-grid applications such as communication towers in rural areas. These batteries have been widely applied to the deployment of renewables, notably in solar home systems in off-grid applications around the world (e.g. in Bangladesh and Morocco under various programmes) (IRENA, 2015b).
Flooded lead-acid batteries
Flooded lead-acid batteries use liquid sulphuric acid as an electrolyte (Figure 35). They primarily consist of stacked cells immersed in aqueous sulfuric acid (H2SO4) solution (usually 37% acid by weight) as an electrolyte. Each cell has a positive electrode made of lead dioxide (PbO2) and a negative electrode made of metallic lead (Pb) in a high-surface-area porous structure (sponge lead). A separator is used to insulate electrodes from one another, although these are sufficiently porous to enable the transport of acid. Electrochemical reactions during the discharge phase of operation turn the electrodes into lead sulphate (PbSO4), while the concentration of sulfuric acid diminishes, resulting in the electrolyte solution consisting primarily of water at that point. When the battery is charged by an external power source, the direction of the reaction reverses, causing the electrodes to return to their original state, as well as the acid content of the electrolyte.
Figure 35: Working principle of a lead-acid battery
Posi
tive
Ele
ctro
dePb
O2
+
Neg
ativ
e El
ectr
ode
Pb–
HSO4-
ElectrolyteH2SO4
H+
Source: ISEA, 2012.

83ELECTRICITY STORAGE AND RENEWABLES: COSTS AND MARKETS TO 2030
The main benefits of the flooded lead-acid battery are its low cost and the maturity of the technology. Although, there is relatively less operational experience with managing them in providing grid services. Well-known weaknesses, such as poor cycle life and comparably low round-trip efficiency can be offset in some instances by lifecycle costs — including cell replacement and energy loss — that depending on the application can be among the lowest on the market.
Due to the gassing process that occurs during charging, the flooded lead-acid battery will lose water on a continual basis, which will require replacing. Hydrogen and oxygen gassing can occur as a result of water electrolysis as the cell approaches full charge or when it is overcharged and the cell voltage exceeds the gassing voltage of approximately 2.39 V. These gassing effects bring about water loss in the electrolyte solution (Linden and Reddy, 2002)
Operating the battery with insufficient electrolyte levels may lead to permanent damage. Sulfuric acid has the potential to separate from the electrolyte solution to form lead sulphate. This process is known as “sulfation” or “acid stratification” and accelerates the aging of the battery. To avoid this, large lead-acid cells are often equipped with small pumps to circulate air through the electrolyte to achieve a uniform acid density. The typical design of a large lead-acid battery in stationary applications is the OPzS15 type, a flooded lead-acid battery that features tubular plates for increased lifetime performance. Table 16 lists the advantages and disadvantages of the flooded lead-acid battery.
Table 16: Advantages and disadvantages of flooded lead-acid battery energy systems
ADVANTAGES DISADVANTAGES
Low cost compared to other rechargeable battery technologies
High reliability and round-trip ef�ciency (70-90%)
Ample manufacturing and operational experience
Can be implemented in large-scale storage applications
Good temperature performance
Easy state of charge indication
Established recycling and high recovery rateof materials
Low cycling times (up to 2 500)
Low energy density (50 to 100 watt hour/litre)
Poor performance at low or high ambient temperatures (need for thermal management system)
Needs periodic water replacement
Sulfation, if stored long-term in discharge condition
Asymmetrical charging and discharging capabilities
Source: International Renewable Energy Agency, based on Sensible, 2016; Akinyele and Rayudu, 2014; ISEA, 2012; Linden and Reddy, 2002.
15 O = Ortsfest (stationary) Pz = Panzerplatte (tubular plate) S = Flüssig (flooded).

84 ELECTRICITY STORAGE AND RENEWABLES: COSTS AND MARKETS TO 2030
Valve-regulated lead-acid batteries
The valve-regulated lead-acid battery, also known as a “sealed” lead-acid battery, reflects an advance in the development of traditional flooded batteries. Designed to prevent electrolyte loss, the valve regulates the cell’s maximum overpressure, venting only when the pressure reaches over 100 millibars. The release of gas occurs only at that stage, compared with the traditional and simpler vent cap used in flooded systems, which are less restrictive and less efficient in managing the gassing (Luvishis, 2009). By maintaining the internal pressure,
the pressure release valve also aids in the recombination of oxygen and hydrogen into water, lengthening the gas retention time to enable diffusion (Linden and Reddy, 2002). A gel or absorbent glass mat immobilises the electrolyte, preventing acid stratification and controlling the cycling of the hydrogen and oxygen that is produced within the sealed housing. The valve-regulated lead-acid battery is usually more expensive than the flooded lead-acid battery, but have the advantage of being able to last more than ten years without maintenance due to its self-regulating nature.
Cost and performance outlook of lead-acid batteries in stationary applications
Although the stationary lead-acid battery is a mature technology, manufacturers are not standing still as competition from other battery technologies increases. Manufacturers are implementing performance improvements and making an effort to reduce costs even further. Some of these efforts include:
• Production automation: Due to the small market, stationary lead-acid batteries continue to be produced in
semi-automated production plants. Increasing production volume that can justify automation — comparable to automotive starter batteries — has the potential to decrease battery cell and module prices (EASE/EERA, 2015). It is yet uncertain, however, whether manufacturers are willing to invest in the large-scale production of this battery in an environment where investment and research is directed more to the emerging BES technologies, notably Li-ion, redox flow and high temperature batteries.
• Hybrid systems: Lead-acid batteries are increasingly used in hybrid storage systems that combine high power storage
Table 17: Advantages and disadvantages of valve-regulated lead-acid battery energy systems
ADVANTAGES DISADVANTAGES
Very low maintenance and no water addition required
Non-�ooded electrolyte design allows for operation in areas without the need for special ventillation
No special ventilation required
Established recycling and high materials recovery rate
More sensitive to higher temperature environment than �ooded lead-acid systems
Should not be stored in discharged state
Safer because of reduced spillage risk
Shorter lifetime than �ooded design
More sensitive to over and under charging
Source: International Renewable Energy Agency, based on Linden and Reddy, 2002; Newman, 1994.

85ELECTRICITY STORAGE AND RENEWABLES: COSTS AND MARKETS TO 2030
solutions, such as flywheels (Energy Storage News, 2016; Qianzhi et al., 2014; Piller, 2011) or Li-ion batteries (Bocklisch, 2016; Thien, 2015; BOS AG, 2015; Mahmoud and Xu, 2011), with low-cost, but less performant, lead-acid batteries for their high energy potential at relatively low cost. These types of hybrid storage systems have the potential to provide low-cost solutions to providing a diverse range of storage services from one system and also allow for the optimisation in the use of the lead-acid battery and complementary technology that would not be achievable with a single technology. As a result, these hybrid systems could meet multiple objectives to achieve a lower levelised cost of storage.16
• Carbon electrode: Some developments embed high-surface carbon layers into one or both of the electrodes of a lead-acid battery. The carbon structure is intended to prevent sulphation which, if avoided, will increase performance and lifetime, especially during partial state of charge operation. Without the danger of sulphation, the battery can be
operated at a lower average state of charge, decreasing corrosion of the positive plate and preventing water loss due to electrolysis.
• Copper stretch metal: The performance of the traditional OPzS (flooded) lead-acid battery can be increased by integrating a copper stretch mesh into the negative electrode. The higher conductivity of copper will lead to a lower internal resistance and will improve the performance significantly during battery charge and discharge. This technology — originally created for and implemented in submarine batteries — has been adapted for stationary applications (Electro.tec, 2016). The Open Copper Stretch Metal battery is used in the hybrid battery storage system, M5BAT, as mid-term storage (M5BAT, n.d.).
• A summary of these developments and their implications is presented in Table 18.
Table 18: Research and development avenues for lead acid batteries
RESEARCH ANDDEVELOPMENT AVENUE
APPLIES TOSUBTECHNOLOGY
TECHNOLOGY SHIFT
REDUCESPRODUCTION
COST
INCREASESPERFORMANCE
Productionautomation
All No Yes. Higherdegree of
automationleads to lower
production costs
No
Hybrid systems All No No Yes. Use existingtechnology
more efficiently
Carbon electrodes All No No Yes
Copper stretch metal All No No Yes
International Renewable Energy Agency, based on Arani et al., 2017; Amiryar and Pullen, 2017; Sensible, 2016; ISEA, 2012; Daoud et al., 2012.
16 For instance, projects are being developed in Africa that combine Li-ion batteries with lead acid batteries in areas with unreliable power supply. The Li-ion batteries are used in
daily cycling to provide continuous power quality during brownouts or short blackouts, while the lower-cost lead acid batteries provide longer duration supply in case of lengthy
blackouts. There are also synergies that can be exploited in charge and discharge cycles of both batteries to improve efficiency and extend lifetimes.

86 ELECTRICITY STORAGE AND RENEWABLES: COSTS AND MARKETS TO 2030
While automotive starter batteries are commodities that are produced at low cost around the world, production volumes of stationary lead-acid batteries have traditionally been significantly lower. This has led to comparably high retail prices. Introducing mass production to stationary lead-acid batteries holds the potential to significantly reduce cell and module prices in the future. Moreover, further optimisation of cell design and additives promise to increase battery performance and its lifetime, while simultaneously cutting production costs.
With new storage technologies entering the market, stationary lead-acid batteries, nevertheless, face tough competition. Li-ion batteries, in particular, have steadily gained market shares, replacing traditional lead-acid batteries in many applications due to their improved lifetimes, higher efficiency and higher energy density. Advancing stationary lead-acid batteries to long-term competitiveness would require far-reaching investment. It is unclear whether or not existing players in the lead-acid battery market are prepared to take the risk
entailed with these investments given the rapid progress in Li-ion, redox flow and high temperature batteries.
Lead-acid BES systems have relatively low self-discharge rates that range from 0.09% to 0.4% a day, which are somewhat higher than for Li-ion batteries, and an energy density of between 50 Wh/L and 100 Wh/L. There is little expectation that self-discharge rates or energy densities will change significantly to 2030. Current lead-acid BES systems have calendar lifetimes of between three to fifteen years, while cycle life ranges between 250 and 2500 equivalent full-cycles. By 2030, cycle life is expected to double to between 540 and 5375 equivalent full cycles. Expected improvements in manufacturing processes could enable the technology to reach costs that may be still be competitive in stationary applications. The energy installation cost of lead-acid BES systems is expected to decline from between USD 105 and USD 475/kWh in 2016 to between USD 50 and 240/kWh by 2030 (Figure 36).
FLOW BATTERIES
Work on flow batteries dates back to the development of a zinc/chlorine hydrate battery, although the focus is now on more promising chemistries. Flow batteries can also be described as regenerative fuel cells and exist in a variety of forms and designs (Figure 37). They differ from conventional rechargeable batteries in that the electroactive materials are not stored within the electrode; rather, they are dissolved in electrolyte solutions. The electrolytes are stored in tanks
(one at the anode side, the anolyte tank; one at the cathode side, the catholyte tank). These two tanks are separated from the regenerative cell stack. The electrolytes are pumped from the tanks into the cell stacks (i.e. reaction unit) where reversible electrochemical reactions occur during charging and discharging of the system. In “pure flow” (i.e. “true flow”) systems, electroactive materials are stored externally from the power conversion unit (i.e. cell stack) and only flow into it during operation.
Figure 36: Properties of lead-acid battery energy storage systems 2016 and 2030
Depth of discharge (%) Round-trip efficiency (%)
0 10 20 30 40 50 60 0 10 20 30 40 50 60 70 80 90
VRLA 20162030
Flooded LA 20162030
Energy density (Wh/L) Energy installa�on cost (USD/kWh) Cycle life (equivalent full-cycles) Calendar life (years)
0 20 40 60 80 100 0 100 200 300 400 0 1000 2000 3000 4000 5000 0 5 10 15 20
Flooded LA 20162030
VRLA 20162030
Source: International Renewable Energy Agency.

87ELECTRICITY STORAGE AND RENEWABLES: COSTS AND MARKETS TO 2030
Flow battery systems, with electroactive materials dissolved in liquid-state electrolytes, are referred to as redox flow batteries, although other pure flow designs exist that feature one of the active materials dissolved in a liquid-state electrolyte, while the other material is in a gaseous state (e.g. hydrogen/bromine cells). The redox designation for a popular subset of the pure flow BES system results from the chemical terms, reduction (i.e. gain of electrons) and oxidation (i.e. loss of electrons) used to describe the electrochemical reaction that is typical of all battery systems. Thus although it can be considered a generic term redox is now specifically identified to systems where the reactions are only taking place in ionic species in liquid solutions. One of the most mature redox flow batteries is the vanadium-redox BES system (Li and Liu, 2017; IEC, 2011; Nguyen and Savinell, 2010; Linden and Reddy, 2002).
Hybrid flow systems also exist and describe systems that include one of the active materials inside the cell, while the other material is a liquid that flows from external tanks into the reaction cell. In the hybrid flow battery, at least one redox couple species is not fully soluble and can be either a metal or a gas. The zinc-bromine hybrid flow battery is the most widely known of this kind (Skyllas-Kazacos et al., 2011; Nguyen and Savinell, 2010).
Flow batteries have a number of distinct advantages, including that they:
• Can operate at close to ambient temperatures.
• Can independently scale their energy and power characteristics. The power is defined by the cell stack
design (i.e. electrode surface), while energy can be scaled by increasing the electrolyte volume stored in the tanks.
• Offer cycle lifetimes in excess of 10 000 full cycles.
• Can use relatively inexpensive and abundantly available raw materials.
• Achieve very deep discharge rates without greatly impacting on its total cycle life; and
• Have good safety characteristics, since the flow of electrolytes remove the heat from the cell so that thermal run-away is prevented. Furthermore, operation of the battery can be stopped simply by shutting down the pumps.
The disadvantages of the flow battery include its relatively low efficiency (e.g. compared to the Li-ion battery) and its complex system architecture, potentially leading to a high cost for repair and maintenance if problems develop. There are a lot of moving elements compared to traditional batteries, with the circulation of the electrolyte solution requiring pumping, sensors, and flow management mechanisms. At the same time, system designs need to take into account the risk of leaking of the acidic fluids requiring properly designed control measures in place. These issues also may reduce the applicability of the battery in certain stationary applications (UET, 2017; Whittingham, 2012; ISEA, 2012; Nguyen and Savinell, 2010; Linden and Reddy, 2002).
Figure 37: Categories of flow battery systems and focus on technologies
Flow battery family
Zinc - bromine
Vanadium - redox
e.g. hydrogen - bromine
Redox �ow (all activematerials in liquid state
solutions )
Other pure �ow (activematerials in gas and liquid
spaces)
Pure �ow (all activematerials stored
separetly from cell)
Hybrid �ow batteries (onemore active materials
stored within cell)
Source: International Renewable Energy Agency, based on (Li and Liu, 2017; IEC, 2011; Nguyen and Savinell, 2010; Linden and Reddy, 2002).Note: The technologies in the grey boxes are covered in this report

88 ELECTRICITY STORAGE AND RENEWABLES: COSTS AND MARKETS TO 2030
Table 19: Advantages and disadvantages of flow battery energy storage systems
ADVANTAGES DISADVANTAGES
External electrolyte storing enables
independent power and energy adjustment to
specific applications (wide range of E/P ratios
are possible)
Relatively high conversion efficiency achieved
High cycle life and durability, as well as sustained
performance over lifetime, aided by absence of
morphological changes in electrodes
Chemical handling with potential leakage of
acidic solutions
Need for sensors, pumping and flow
management mechanisms may increase
maintenance costs
High cost of some active materials or key
system elements, such as membrane or
electrolyte storage vessels
Source: International Renewable Energy Agency, based on (Li and Liu, 2017; Sensible, 2016; ISEA, 2012; Skyllas-Kazacos et al., 2011; Linden and Reddy, 2002.
Vanadium redox flow batteries
The vanadium redox flow battery (VRFB) storage mechanism involves redox reactions in the cell that are fed by active ionic vanadium materials from the tanks, resulting in electron transference in the circuit. The VRFB (or ‘‘all-vanadium”) features the V2+/V3+ and V5+/V4+ redox couples in a mild sulfuric acid solution at the electrolyte tanks. As with other
redox flow storage systems, the reactions from this species reverse during the charge and discharge processes. The ion-selective membrane within the cell separates the electrolytes on each side of the cell to prevent ion cross-contamination. The design stops reactant ion species on either side of the cell, while ensuring hydrogen ions (H+) can cross the membrane to maintain electric neutrality in the cell (Figure 38).
Figure 38: Operation mechanism of a vanadium redox flow battery system
GeneratorCharge
AC / DC
Cell
DischargeLoad
V5+ / V4+
ElectrolyteTank
Pump Electrode Pump
V2+ / V3+
ElectrolyteTank
V4+
V3+ +e-
Membrane
V5+ +e-
V2+
e- e-
V3+
V5+
V4+
V2+
H+
Source: International Renewable Energy Agency, based on Linden and Reddy, 2002.
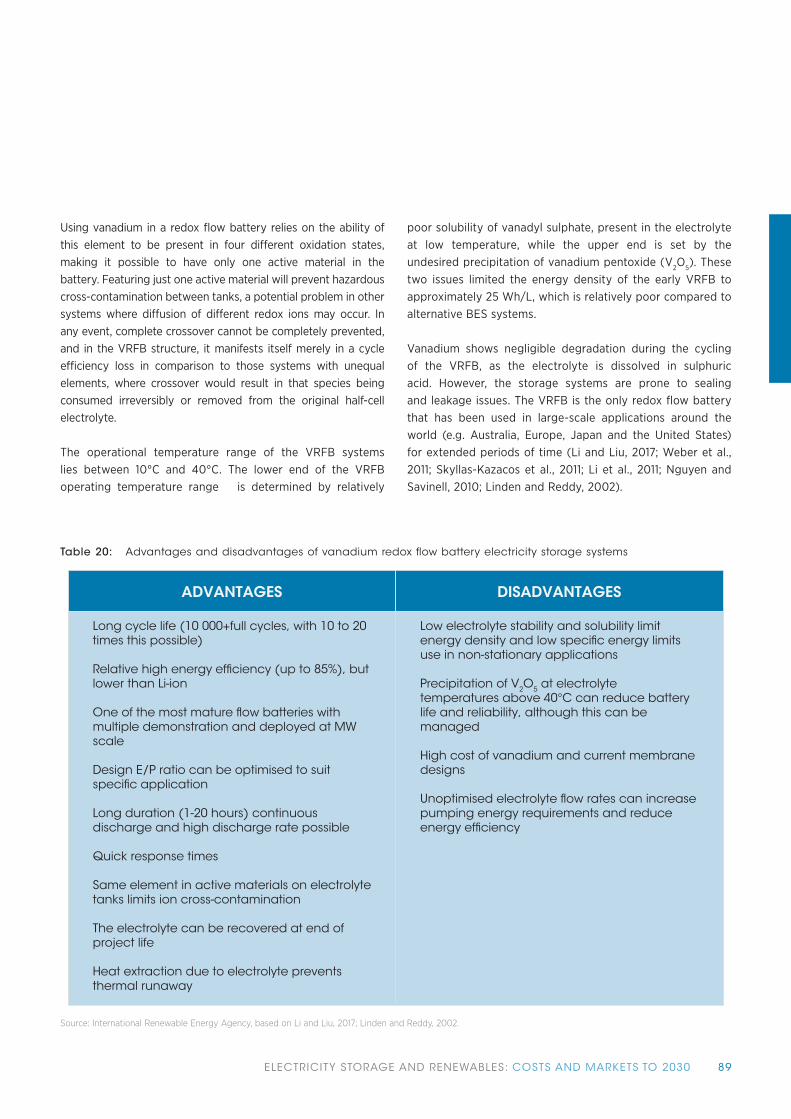
89ELECTRICITY STORAGE AND RENEWABLES: COSTS AND MARKETS TO 2030
Table 20: Advantages and disadvantages of vanadium redox flow battery electricity storage systems
ADVANTAGES DISADVANTAGES
Long cycle life (10 000+full cycles, with 10 to 20 times this possible)
Relative high energy efficiency (up to 85%), but lower than Li-ion
One of the most mature flow batteries with multiple demonstration and deployed at MW scale
Design E/P ratio can be optimised to suit specific application
Long duration (1-20 hours) continuous discharge and high discharge rate possible
Quick response times
Same element in active materials on electrolyte tanks limits ion cross-contamination
The electrolyte can be recovered at end of project life
Heat extraction due to electrolyte prevents thermal runaway
Low electrolyte stability and solubility limit energy density and low specific energy limits use in non-stationary applications
Precipitation of V2O5 at electrolyte temperatures above 40°C can reduce battery life and reliability, although this can be managed
High cost of vanadium and current membrane designs
Unoptimised electrolyte flow rates can increase pumping energy requirements and reduce energy efficiency
Source: International Renewable Energy Agency, based on Li and Liu, 2017; Linden and Reddy, 2002.
Using vanadium in a redox flow battery relies on the ability of this element to be present in four different oxidation states, making it possible to have only one active material in the battery. Featuring just one active material will prevent hazardous cross-contamination between tanks, a potential problem in other systems where diffusion of different redox ions may occur. In any event, complete crossover cannot be completely prevented, and in the VRFB structure, it manifests itself merely in a cycle efficiency loss in comparison to those systems with unequal elements, where crossover would result in that species being consumed irreversibly or removed from the original half-cell electrolyte.
The operational temperature range of the VRFB systems lies between 10°C and 40°C. The lower end of the VRFB operating temperature range is determined by relatively
poor solubility of vanadyl sulphate, present in the electrolyte at low temperature, while the upper end is set by the undesired precipitation of vanadium pentoxide (V2O5). These two issues limited the energy density of the early VRFB to approximately 25 Wh/L, which is relatively poor compared to alternative BES systems.
Vanadium shows negligible degradation during the cycling of the VRFB, as the electrolyte is dissolved in sulphuric acid. However, the storage systems are prone to sealing and leakage issues. The VRFB is the only redox flow battery that has been used in large-scale applications around the world (e.g. Australia, Europe, Japan and the United States) for extended periods of time (Li and Liu, 2017; Weber et al., 2011; Skyllas-Kazacos et al., 2011; Li et al., 2011; Nguyen and Savinell, 2010; Linden and Reddy, 2002).

90 ELECTRICITY STORAGE AND RENEWABLES: COSTS AND MARKETS TO 2030
Zinc-bromine flow batteries
The zinc-bromine flow battery (ZBFB) is probably the best-known of the hybrid flow battery types. Hybrid flow systems were conceptualised in the early twentieth century and were first put to practical application in the early 1970s by Exxon and Gould (Skyllas-Kazacos et al., 2011). A ZBFB cell consists of two compartments separated typically by a microporous membrane. Electrodes at each side of the cell (one at the zinc side; one at the bromine side) are made of carbon-plastic composites, given that metal electrodes would suffer
corrosion in the presence of a bromine-rich environment. Two external tanks pump the aqueous electrolyte towards the cell stacks during charging and discharging (i.e. in a similar configuration to that of the VRFB). In the ZBFB, however, one of the active materials (zinc) is not fully soluble in the electrolyte (i.e. an acid aqueous solution of zinc bromide) and, during charging, it is deposited (i.e. plated) as a solid metallic layer at the negative (i.e. zinc-side) electrode, while bromide ions (Br-) are oxidised to bromine (Br2) at the positive cathode (i.e. bromine-side) electrode. The reverse occurs during the discharge process of the battery (Figure 39).
Simply put, the energy storage mechanism of the ZBFB relies on the reversible electrochemical reactions of the Zn2+/Zn0 and Br-/Br2 pairs present in the highly concentrated ZnBr2 electrolyte and on the ionic and current transfer that result from the electrochemical reactions of the pairs at the cell electrodes. The actual underlying chemistry of the mechanism may be more complex than this simplification. For example, in the ZnBr2 aqueous solution, bromine forms so-called polybromide ions. Since elemental bromine is corrosive and toxic, other chemical agents are added to the electrolyte to bind (i.e. sequestrate) the bromine and prevent the solution from escaping as vapour and interacting with the environment in its highly reactive elemental form. The result of this sequestration is a bromine complex (i.e. polybromide complex). The formation of this complex reduces the amount of bromine present (i.e. circulating) in the cell, which reduces its self-discharge. A bromine complex is an oil that is heavier
than water and thus sinks to the bottom of the tank by gravity. Catholyte tanks include a bromine complex storage compartment and, during the charging process, the bromine complex remains in location at the bottom of the tank. During discharge, the valve at the bottom of the tank is freed, the complex is re-circulated and the bromine is made available once more in the cell.
In addition to the complex forming agents, the electrolyte of a ZBFB battery often includes other electrochemically active species to improve its operational efficiency and ionic activity. These include potassium, sodium chloride, or ammonium-based chlorides and bromides (Li and Liu, 2017; Rajarathnam and Vassallo, 2016; Skyllas-Kazacos et al., 2011; Linden and Reddy, 2002).
Figure 39: Schematic of a zinc-bromine flow battery system
Source: International Renewable Energy Agency, based on Schneider et al., 2016.

91ELECTRICITY STORAGE AND RENEWABLES: COSTS AND MARKETS TO 2030
Table 21: Advantages and disadvantages of zinc-bromine battery electricity storage systems
ADVANTAGES DISADVANTAGES
Higher cell voltage than vanadium redox �ow battery (~1.8 volts compared to 1.4 volts)
Very good energy density, with speci�c energy characteristics for a �ow battery
Deep discharge capabilities
Abundant low-cost reactants, with the exception of bromine complexing agents which can be expensive
Energy and power ratings not fully independently scalable
Material corrosion, zinc dendrite formation and shunt currents can be an issue
Auxiliary systems are required for circulation and temperature control
The need to endure highly oxidative nature of bromine increases cost of electrodes, �uid handling equipment and membrane
High self-discharge rates (8-33% per day) and low energy ef�ciency
Cycle lifetime often lower than vanadium redox �ow battery
Toxicity and corrosion properties of bromine
In large systems, increased size of cooling mechanism, enhanced electrolyte loss containment, impact and leak detectors and controls may increase battery weight and reduce speci�c energy
Source: International Renewable Energy Agency, based on Li and Liu, 2017; Rajarathnam and Vassallo, 2016; Luo et al., 2015; Skyllas-Kazacos et al., 2011; Ponce de León et al., 2006; Linden and Reddy, 2002.
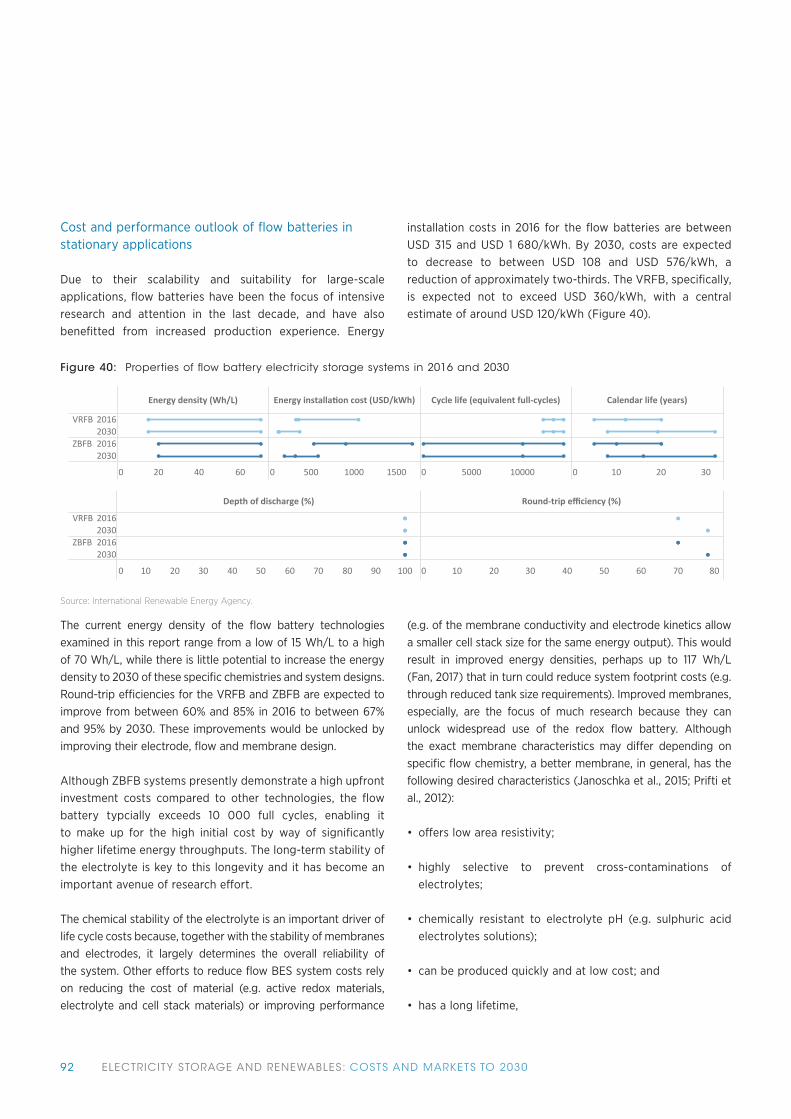
92 ELECTRICITY STORAGE AND RENEWABLES: COSTS AND MARKETS TO 2030
Cost and performance outlook of flow batteries in stationary applications
Due to their scalability and suitability for large-scale applications, flow batteries have been the focus of intensive research and attention in the last decade, and have also benefitted from increased production experience. Energy
installation costs in 2016 for the flow batteries are between USD 315 and USD 1 680/kWh. By 2030, costs are expected to decrease to between USD 108 and USD 576/kWh, a reduction of approximately two-thirds. The VRFB, specifically, is expected not to exceed USD 360/kWh, with a central estimate of around USD 120/kWh (Figure 40).
The current energy density of the flow battery technologies examined in this report range from a low of 15 Wh/L to a high of 70 Wh/L, while there is little potential to increase the energy density to 2030 of these specific chemistries and system designs. Round-trip efficiencies for the VRFB and ZBFB are expected to improve from between 60% and 85% in 2016 to between 67% and 95% by 2030. These improvements would be unlocked by improving their electrode, flow and membrane design.
Although ZBFB systems presently demonstrate a high upfront investment costs compared to other technologies, the flow battery typcially exceeds 10 000 full cycles, enabling it to make up for the high initial cost by way of significantly higher lifetime energy throughputs. The long-term stability of the electrolyte is key to this longevity and it has become an important avenue of research effort.
The chemical stability of the electrolyte is an important driver of life cycle costs because, together with the stability of membranes and electrodes, it largely determines the overall reliability of the system. Other efforts to reduce flow BES system costs rely on reducing the cost of material (e.g. active redox materials, electrolyte and cell stack materials) or improving performance
(e.g. of the membrane conductivity and electrode kinetics allow a smaller cell stack size for the same energy output). This would result in improved energy densities, perhaps up to 117 Wh/L (Fan, 2017) that in turn could reduce system footprint costs (e.g. through reduced tank size requirements). Improved membranes, especially, are the focus of much research because they can unlock widespread use of the redox flow battery. Although the exact membrane characteristics may differ depending on specific flow chemistry, a better membrane, in general, has the following desired characteristics (Janoschka et al., 2015; Prifti et al., 2012):
• offers low area resistivity;
• highly selective to prevent cross-contaminations of electrolytes;
• chemically resistant to electrolyte pH (e.g. sulphuric acid electrolytes solutions);
• can be produced quickly and at low cost; and
• has a long lifetime,
Figure 40: Properties of flow battery electricity storage systems in 2016 and 2030
Energy density (Wh/L) Energy installa on cost (USD/kWh) Cycle life (equivalent full-cycles) Calendar life (years)
0 20 40 60 0 500 1000 1500 0 5000 10000 0 10 20 30
VRFB 20162030
ZBFB 20162030
Depth of discharge (%) Round-trip efficiency (%)
0 10 20 30 40 50 60 70 80 90 100 0 10 20 30 40 50 60 70 80
VRFB 20162030
ZBFB 20162030
Source: International Renewable Energy Agency.

93ELECTRICITY STORAGE AND RENEWABLES: COSTS AND MARKETS TO 2030
While the existing Nafion membrane material for redox flow batteries already meets some of these characteristics, its high cost and high level of water transfer limit its suitability for widespread economic application. New materials with lower costs are starting to become available and are being
implemented by the majority of VRFB developers. New alternatives continue to be explored. A summary of further improvements and cost reduction opportunities for flow BES systems is shown in Table 22.
Depending on the electrolyte and electroactive redox materials selected, there are multiple redox flow BES system chemistry configurations (Figure 41). The vanadium redox flow and the zinc-bromine hybrid flow battery technologies are ‘aqueous’ systems, whereby the main solvent for the electrolyte solutions is water. The principal electrochemically active materials in both are inorganic chemicals. Because of good safety characteristics and high power densities, aqueous systems with inorganic redox materials are often considered for stationary applications. To date, most flow systems
deployed at scale belong to this category. The exploration of different chemistries is being pursued in order to reduce overall cycle costs, and many different combinations have been explored. For example, salt-water electrolyte BES systems have been proposed that have the potential for very low cost (Engerati, 2017).
Table 22: Research and development avenues for flow batteries
RESEARCH ANDDEVELOPMENT AVENUE
APPLIES TOSUBTECHNOLOGY
TECHNOLOGY SHIFT
REDUCESPRODUCTION
COST
INCREASESPERFORMANCE
Improved membranes:Lower resistance
All flow batteries (except ZnBr)
No Yes Yes.Higher efficiency
Improved membranes:Reduced
cross-contamination
All other flowbatteries (i.e.
excludingVRFB and ZnBr)
No No Yes.Less maintenance
Improved membranes:Reduced leakage
All flow batteries (excluding ZnBr)
No No Yes.Less maintenance
Integrated stacks All flow batteries (excluding ZnBr)
No Yes. Higherdegree of
automation
Yes.Reduced leakage
Salt water electrolyte New technology Yes Yes. Potentialfor very low
energy costs
No. Electricalperformance
not betterthan status quo
Source: International Renewable Energy Agency.

94 ELECTRICITY STORAGE AND RENEWABLES: COSTS AND MARKETS TO 2030
Figure 41: Classification of redox flow battery energy storage systems by their chemistry type
Redox �ow chemistries
VRFB, ZnBR, etc.
Quinone - based
Inorganic redoxmaterials
Organic redoxmaterials
Organometalic(metal - ligand)
All - organic
Organometalic
Organic redoxmaterials
Aqueous electrolyte
Non-aqueous electrolyte
Source: International Renewable Energy Agency, based on Li and Liu, 2017.
500
1000
1500
2016
USD
/kW
h
fluid regula�onassemblingcontrol engineeringpower electronicselectrolyte tankselectrolytestack
0
Figure 42: Cost breakdown of vanadium redox flow battery systems
Source: International Renewable Energy Agency, based on Noack et al., 2016.

95ELECTRICITY STORAGE AND RENEWABLES: COSTS AND MARKETS TO 2030
Studies have been carried out regarding aqueous systems with organic redox materials, since they offer improved solubility and stability in the redox process and potentially lower costs given they are generated from biological processes (Yang et al., 2014; Huskinson et al., 2014).
Non-aqueous systems are also being explored, as they can provide higher energy densities than their aqueous counterparts, given that their cell voltage is not constrained by water electrolysis. The challenge is to find viable active materials for non-aqueous BES systems, and both organometallic compounds (e.g. metal ligand complexes as well as organic redox molecules) have been explored. Due to the difficulty in synthetising metal ligands and ensuring low solubility and suboptimal chemical stability, efforts have shifted to organic redox molecules for an “all organic” redox flow BES systems. These have the advantage of wider structural diversity and increased molecule availability from abundant natural resources (Li and Liu, 2017; Wei et al., 2015).
Figure 42 highlights a typical cost structure of a 10 kW/120 kWh VRFB, where costs are split into three roughly even categories of stack, electrolyte costs and peripherals. Cost distributions on a per usable energy basis can, however, deviate from this, depending on system configuration, notably the energy/power ratio and other design parameters and considerations such as the cell area (Minke et al., 2017; Noack
et al., 2016; Moore et al., 2015; Viswanathan et al., 2014). The actual least-cost pathway for flow systems remains a matter of considerable active debate. Pathways to achieving a VRFB cost of USD 120/kWh (excluding the cost of installation) have been explored and demonstrate as feasible, assuming a production volume of approximately 10 GWh per annum (Darling et al., 2014). Although cost reduction estimates to reach this long-term goal depend inherently on uncertain market developments, most reductions would derive from items affected by a competitive environment, with the benefits of a larger-scale market being very important. There are also positive feedbacks in this process that would be gained by the greater operational experience associated with growth in the market (Figure 43).
HIGH TEMPERATURE BATTERIES
High temperature batteries utilise liquid active materials and a solid ceramic electrolyte made of beta-aluminum (β”-Al2O3 sodium-ion-conducting membrane). They are called high temperature batteries, because high temperatures are required to keep the active materials in a liquid state. The beta-aluminum solid electrolyte (or BASE) also serves as the separator between the battery’s electrodes. Typically, the anode material in this structure is molten sodium (Na) and, thus, the battery in this family of storage systems is known as the “sodium beta” or “sodium beta alumina” battery. It relies on sodium-ion transport across the membrane to store and release energy. In the case of the sodium sulphur (NaS) battery, the cathode for the most common configurations is molten sulphur (Figure 44).
Energy
Power
Balance of Plant
Additional contribution to price
Pric
e fo
r use
ab
le e
ne
rgy
(USD
/kW
h)
0
100
2014
Energ
y
Power
BOP
ADD
Futu
re St
ate
200
300
400
500
VRFB
Figure 43: Potential pathway to reach cost effective vanadium redox flow battery storage
Source: International Renewable Energy Agency, based on Darling et al., 2014.

96 ELECTRICITY STORAGE AND RENEWABLES: COSTS AND MARKETS TO 2030
Figure 44: Operating principle of a sodium sulphur (NaS) battery
Electron Sodium Sodium ion Sulphur Sodium polysul�de
Sodium (liquid)
Neg
ativ
e el
ectr
ode Positive electrode
Beta alumina (solid) Sulphur (liquid)
DischargeCharge
Source: ISEA, 2012.
The cathode material also consists of solid transition metal halides that incorporate a secondary liquid electrolyte17, as is the case in the sodium nickel chloride (NaNiCl2) battery technology (Lu, Lemmon, et al., 2010; Lu, Xia, et al., 2010). These two are the most relevant commercially available technologies. The NaS batteries typically operate between 300°C and 350°C, while sodium nickel chloride batteries operate between 250°C and 350°C. High temperature operation allows them to maintain the active salt materials liquid and ensures sufficient conductivity of the electrolyte.
Sodium sulphur (NaS)
The NaS, or Na/S, batteries have been extensively used for grid services in Japan (e.g. load levelling at wind farms). More than 300 MW of NaS storage power is installed in more than 170 projects throughout the country. The Tokyo Electric Power Company, for instance, has been operating a 6 MW/48 megawatt hour (MWh) stationary storage system for load levelling in Tokyo since the 1990s (Kurashima and Kodama, 1999). While the majority of NaS projects initially took place in Japan, this has shifted and operational experience has ceased being exclusive to that country.
Advantages of NaS BES systems include relatively high energy densities compared to the redox flow and lead-acid technologies, and are around the low end of the Li-ion energy density range. The energy density of NaS systems is now between 140 Wh/L and 300 Wh/L, while estimates for the power density typically reach 140 W/L. These are conducive to relatively compact systems, including those at a large capacity rating of up around 250 MWh, suitable for daily cycling with the added benefit of being able to discharge for long durations and high pulse power (Díaz-González et al., 2012; IEC, 2011; Sarasua et al., 2010; Kawakami et al., 2010).
NaS cells typically have very low self-discharge rates with a range from 0.05% up to 1% per day depending on the technology, location and application. A reasonable central value for self-discharge rates would be at the lower end of that range. NaS BES systems nowadays typically reach 4 5000 cycles, although capabilities of up to 10 000 full life cycles have been reported. They also have the advantage of using non-toxic materials and have a high recyclability rate of approximately 99% (Díaz-González et al., 2012). Currently, total energy installation costs for NaS BES systems range between USD 263 and 735/kWh. Data, however, suggest that typical systems are able to be installed for less than USD 400/kWh (Figure 45).
17 The addition of the liquid salt, NaAlCl4, aids the otherwise insufficient sodium-ion (Na+) conduction from the solid electrolyte ceramic surface and the reaction zone inside the
positive electrode bulk during cell operation (Sakaebe, 2014).

97ELECTRICITY STORAGE AND RENEWABLES: COSTS AND MARKETS TO 2030
Figure 45: Properties of high temperature battery electricity storage systems, 2016
Energy density (Wh/L) Energy installa on cost (USD/kWh) Cycle life (equivalent full-cycles) Calendar life (years)
0 100 200 300 0 200 400 600 0 2000 4000 6000 8000 0 5 10 15 20 25
NaSNaNiCl
Depth of discharge (%) Round-trip efficiency (%)
0 10 20 30 40 50 60 70 80 90 100 0 10 20 30 40 50 60 70 80
NaSNaNiCl
Source: International Renewable Energy Agency.
While NaS batteries offer the potential for high cycle lifetimes at comparably low costs, some challenges remain regarding the ceramic electrolyte sealing and the safety system. The main disadvantage of the NaS system is its relatively high annual operating cost of approximately USD 40 to USD 70/kW/year. Given the high temperature operation, the battery requires a thermal enclosure and electrical heater within it that can consume around 3% of the rated power when at idle. The heater serves either to warm up the cells on operational start or to offset heat loss during periods when the battery is at the correct operating temperature, but the system is at idle. During regular operation, however, there is normally no need to transfer additional heat into the system since temperature is maintained due to the chemical reaction and the ohmic heating effect in the cells (Luo et al., 2015; Doughty, Butler and Boyes, 2010).
Due to its reasonable energy density and low maintenance, it would appear reasonable to utilise NaS batteries, not only for stationary but also for mobile applications. Reservations still exist, however, since in the event of a crash, the ceramic electrolyte could be damaged mechanically and uncontained reactions between molten sodium and molten sulphur could occur. This could potentially endanger the accident site. As a result, NaS batteries have so far only been commercialised in stationary applications.
Sodium nickel chloride
Using a similar operating principle to the one in sodium-sulphur storage technology, the sodium nickel chloride (NaNiCl2) batteries (often referred to as ZEBRA18, NaNiCl or Na/NiCl2) features good energy density and low
maintenance. The technology uses BASE as the primary ceramic electrolyte, but as in the case of the NaS battery, a secondary electrolyte (NaAlCL4) is used to aid sodium-ion transfer. The melting point of this secondary electrolyte sets the minimum operating temperature of ZEBRA cells at 157°C, resulting in intrinsically safer reactions in the cell meaning that the fire risk negligible. In contrast to the NaS battery, the active materials of NaNiCl2 are less corrosive, making the cell suitable for mobile applications. While the technology has been tested in such applications, research is now focussing on their use in stationary applications (Benato et al., 2015; Lantelme and Groult, 2013).
The ZEBRA systems also feature good pulse power capability, low self-discharge rates (not exceeding 5% per day and good overcharge and discharge capabilities. It also has a reasonable cycle lifetime that ranges from 1 000 to 7 500 equivalent full cycles and a a central round-trip efficiency estimate of 84% in 2016 (Figure 45).
Cost and performance outlook of high temperature batteries in stationary applications
Corrosion issues are a major aging mechanism of high temperature cells. It can especially affect the larger cells that are preferred for stationary storage applications. To achieve lower cost of service from these batteries, it is therefore essential to continue developing robust materials, coatings and joints to address corrosion so as to increase the lifetime of the batteries.
Another avenue of research includes the lowering of the high operating temperatures necessary to achieve satisfactory
18 The ZEBRA battery was developed under the code-named project, ZEBRA, for Zeolite Battery Research in Africa.

98 ELECTRICITY STORAGE AND RENEWABLES: COSTS AND MARKETS TO 2030
electrochemical activity in sodium beta BES systems. Efforts centre on improving ion transfer through the BASE ceramic electrolyte. Sometimes, due to moisture on the BASE surface, a layer of sodium oxide forms, preventing the transport of ions from the sodium anode through the BASE ceramic electrolyte. Coating the BASE or altering the sodium anode by adding lead or bismuth has proved effective in lowering temperatures, but it starts to fail below 200°C. Other approaches, such as using planar sodium metal halide batteries (in lieu of the traditional tubular design), have shown promising results in achieving even lower cell operating temperatures of 190°C. Other experiments with novel sodium materials as the cell anode (e.g. sodium-casium alloys) suggest that cell operation at even lower temperatures than this is feasible, with experimental cells showing good performance results at a temperature as low as 95°C. (Li et al., 2016; Lu et al., 2014).
Replacing the BASE ceramic electrolyte with another material to allow for operating temperature to be so low as to enable an all-solid state cell operation is the focus of
ongoing research. In the last few years, various “sodium superionic conductors” with high conductivity potential have been identified and studied, perhaps opening the way for safer and more energy-dense all-solid-state sodium BES systems. For instance, studies of a solid electrolyte, tetrathiophosphate (Na3PS4), have revealed positive results that could result in commercial all-solid-state sodium-ion batteries in the future (Chu et al., 2016; Hayashi et al., 2012).
High temperature batteries offer the potential to supply electricity storage at a reasonable price. The NaS battery, in particular, has been popular due to its low-cost active materials, with installed costs of between USD 263 and USD 735/kWh in 2016 and with cost reduction potential of up to 75% possible by 2030. NaS BES system energy installation costs by 2030 could decrease to between USD 120 and 330/kWh. In 2016, the energy installation cost for sodium nickel chloride batteries ranged between USD 315 and USD 490/kWh, potentially decreasing to between USD 130 and 200/kWh in 2030 (Figure 46).
If the industry, however, is unable to lower operating temperatures and thus the related balance of system cost, some of these reductions may not take place. Currently, containment and thermal management systems significantly add to the overall cost. This is evident in the case of NaS batteries, where expensive chromium- and molybdenum-lined steels are needed for containment due to the fact that at high temperatures sodium and polysulphide compounds are highly corrosive.
One potential constraint on the development of the high temperature battery market is the lack of a wide range of technology providers. Currently, NaNiCl2 batteries are provided only by FZSoNick S.A. (formerly, FIAMM) in Switzerland, while almost all NaS batteries on the market are manufactured by NGK Insulators Ltd. of Japan. This dependency on a small number of manufacturers may impede rapid growth. Having new entrants may also help to spur innovation and creativity as manufacturers compete to differentiate their products.
Figure 46: Properties of high temperature battery electricity storage systems, 2016 and 2030
Energy density (Wh/L) Energy installa�on cost (USD/kWh) Cycle life (equivalent full-cycles) Calendar life (years)
100 200 300 200 400 600 5 000 10 000 15 000 10 20 30
NaS 20162030
NaNiCl 20162030
Depth of discharge (%) Round-trip efficiency (%)
10 20 30 40 50 60 70 80 90 100 10 20 30 40 50 60 70 80 90
NaS 20162030
NaNiCl 20162030
0 0 0 0
0 0
Source: International Renewable Energy Agency.

99ELECTRICITY STORAGE AND RENEWABLES: COSTS AND MARKETS TO 2030
Figure 47: Energy and power density ranges of selected battery storage technologies, 2016
Year Type Technology Energy density (Wh/L) Power density (W/L)
100 200 300 400 500 600 700 2000 4000 6000 8000 10000
2016 Flow VRFBZBFB
HighTemperature
NaSNaNiCl
Lead-Acid Flooded LAVRLA
Li-Ion LFPNCALTONMC/LMO
0 0
Source: International Renewable Energy Agency analysis
COST AND PERFORMANCE OVERVIEW OF BATTERY ELECTRICITY STORAGE
This section provides a comparison of the key performance characteristics of BES systems and their specific installed costs per unit of electricity in stationary applications. Unlike in the individual technology sections where both the range and central values were provided, this section focuses on the central, reference values in order to provide a simplified, but more easily digestible comparison. The exception to this is for energy and power density, as there is such a wide range of possible permutations for individual cell chemistries that providing two central estimates
can be misleading. Current energy densities for Li-ion cells are the highest among the battery technologies examined in this study. Estimates for 2016 indicate that they normally exceed 200 Wh/L, and are able to reach between 620 Wh/L and 735 Wh/L in the best of cases (Figure 47). The power density of Li-ion batteries can vary significantly, as there is the opportunity to design the cells for high discharge rates, where power is the main requirement, or for low discharge rates where energy is needed over a longer time period. As a result, power densities for Li-ion batteries can range from as low as 100 W/L up to 10 000 W/L.
Apart from their cost decline in recent years, the ability of Li-ion technologies to provide high power or energy services in limited space or weight settings is one of the principal reasons behind their wide implementation in portable applications and their use in the of the electromobility market. Li-ion technologies can also provide services at higher efficiencies than other battery technologies. While high energy density values are relevant in stationary applications, other characteristics, such as high safety and long lifetimes, can be more relevant in some applications.
When examining cycle life (in equivalent full cycle terms) and installed costs, lead-acid batteries stand out as a low installed cost option, but with the lowest cycle life (Figure 48).
High temperature batteries represent a middle ground with competitive central installed cost values that are higher than lead-acid, but lower than Li-ion and flow batteries. While at the same time, they perform favourably in terms of cycle life, comfortably eclipsing all but LTO Li-ion batteries, while not being able to reach the very high values seen for flow batteries. NCA, NMC/LMO and LFP Li-ion chemistries all have relatively competitive installed costs, but are handicapped by relatively poor cycle lifes, except in comparison to lead-acid. The exception is LTO batteries, which have a central estimate for cycle life that rivals flow batteries and are also capable of fast-charging and low temperature operation without significant performance loss, but are handicapped by the highest central cost estimate of all the battery technologies.

100 ELECTRICITY STORAGE AND RENEWABLES: COSTS AND MARKETS TO 2030
Figure 48: Reference cycle life and energy installation cost of selected battery storage technologies, 2016
Year Type Technology Cycle life (equivalent full-cycles) Energy installation cost (USD/kWh)
0 2000 4000 6000 8000 10000 12000 0 200 400 600 800 1000
2016 Lead-Acid Flooded LA
VRLA
High Temperature
NaNiCl
NaS
Li-Ion NCA
NMC/LMO
LFP
LTO
Flow ZBFB
VRFB
Source: International Renewable Energy Agency.
Figure 48 also presents the energy installation costs in 2016. Lead-acid batteries have the lowest energy installation costs of between USD 147 and USD 263/kWh. High temperature batteries, NCA, NMC/LMO and VRFB batteries all had energy installation costs of between USD 350 and USD 420/kWh. In 2016, the central energy installation cost estimates for LFP batteries were USD 578/kWh, for ZBFB they were USD 900/kWh and for LTO batteries they were USD 1 050/kWh.
The cost outlook for BES systems is promising. The central estimate for the energy installation costs is expected to decrease from between USD 150 and 1050/kWh in 2016 to between USD 75 and USD 480/kWh by 2030. This would represent a decline of between 50% and 66% depending on the technology. By 2030, the only battery technologies that are expected to have energy installation costs that exceed USD 300/kWh are LTO and ZBFB (Figure 49).
0
500
1000
-80%
-60%
-40%
-20%
0%
-50% -50%-56% -60%
-66% -66%
2016 2030 2016 2030 2016 2030 2016 2030 2016 2030 2016 2030 2016 2030 2016 2030 2016 2030 2016 2030
-59% -60% -61%-54%
Ene
rgy
inst
alla
tion
co
st (
USD
/kW
h)
Lead-AcidFlooded LA VRLA
High TemperatureNaS NaNiCl
FlowVRFB ZBFB
Li-IonNCA NMC/LMO LFP LTO
Source: International Renewable Energy Agency.
Figure 49: Energy installation costs central estimate for battery technologies, 2016 and 2030

101ELECTRICITY STORAGE AND RENEWABLES: COSTS AND MARKETS TO 2030
In addition to energy installation cost reductions, performance is also improving. Figure 50 highlights the improvements in cycle life and the cost reductions to 2030. Thus, although LTO and ZBFB are expected to still have the highest capital costs by 2030, they will also have some of the longest cycle lives. Although NaS batteries are expected to have reference values of close to 7 500 cycles by 2030, this will still be lower than ZBFBs 10 000, VRFBs 13 000 and LTOs 19 100 cycles.
Although the precise economic viability of each project depends on its use and application, as well as context, the combined effect of capital cost reductions and increased cycle lifetimes is most certain to boost further deployment and support the ability of BES systems to provide cost-effective services to the electricity system. The cost decline
of LTO systems will accompany a cycle lifetime increase of approximately 90% over today’s values and they even have the potential for cycle lifetimes greater than this central value of 19 100 equivalent full cycles by 2030. Other Li-ion technologies evaluated in this report will also see longer cycle lifetimes and cost reductions, positioning them as competitive solutions for applications that don’t require very high lifetime cycling rates. NCA systems, however, are not expected to exceed 2 000 equivalent full cycles by 2030, although costs will fall by more than half. Lead-acid systems, conversely, show a considerably lower capital cost of approximately USD 70/kWh to USD 130/kWh, albeit with much lower (3 225) equivalent full cycles (despite a doubling of this parameter from 2016 levels).
Mechanical-based storage systems, such as PHS or CAES reach cycle lifetimes that are close to 50 times higher than those of BES systems, with the exception of flow and LTO batteries, while their energy installation costs are lower than the most inexpensive BES system. Their main constraints, long project lead times, large scale projects with high development risks and costs and geographical restrictions mean that their
deployment possibilities are much more restricted than for BES systems. The more modular BES systems which have no significant geographical restrictions, which will see cycle lifetimes rise to exceed their calendar life in many cases, as energy installation costs fall and efficiencies improve, will increasingly be competitive.
Cycle life (equivalent full cycles)
Ener
gy in
stal
latio
n co
st (U
SD /
kWh)
200
600
800
1 000
1 200
0
400
2 000 4 000 6 000 10 000 12 000 14 000 16 000 18 000 20 000 22 0000 8 000
LTO, 2016
VRFB, 2016
ZBFB, 2016
LFP, 2016
LFP, 2030
NMC/LMO, 2016NaS, 2016NCA, 2016
NaNiCl, 2030VRLA, 2030Flooded LA, 2030
ZBFB, 2030
LTO, 2030
VRFB, 2030NaS, 2030
Source: International Renewable Energy Agency.
Figure 50: Energy installation costs and cycle lifetimes of battery storage technologies, 2016 and 2030

102 ELECTRICITY STORAGE AND RENEWABLES: COSTS AND MARKETS TO 2030
Another way to look at the evolution of the costs and performance of BES systems is to look at energy installation costs compared to roundtrip efficiencies (DC/DC). Li-ion systems, for instance, are expected to increase their central
efficiency estimate from between 92% and 96% in 2016 to between 94% and 98% by 2030, the highest efficiency among the technologies touched on in this report (Figure 51).
78 80 82 84 86 88 90 92 94 96 98 100
Round-trip efficiency (%)
200
400
600
800
1000
1200
Ener
gy in
stal
la�o
n co
st (U
SD /
kWh)
LTO, 2016
LTO, 2030
VRFB, 2016
VRFB, 2030
ZBFB, 2016
ZBFB, 2030
LFP, 2016
LFP, 2030
NMC/LMO, 2016NaS, 2016 NCA, 2016
NaNiCl, 2016
VRLA, 2016
Flooded LA, 2016NMC/LMO, 2030
NaNiCl, 2030 NCA, 2030Flooded LA, 20300
6866 70 72 74 76
Source: International Renewable Energy Agency.
Figure 51: Energy installation costs and roundtrip efficiencies of battery storage technologies, 2016 and 2030

103ELECTRICITY STORAGE AND RENEWABLES: COSTS AND MARKETS TO 2030
Global Electricity Storage Market Outlook to 2030
19 In this analysis, estimates quoted for electricity storage capacity in GWh’s for EVs, electric buses, two-three wheelers and light commercial vehicles are 75% of the total stock, taking
into account a range of factors that imply that the full stock of storage in these vehicles is unlikely to be available for the grid, even for brief periods
As the energy sector enters the next phase of energy transition, increasing focus on decarbonising end-use sectors and integrating ever high shares of VRE into the electricity system will drive direct demand for BES and provide new economic opportunities. The recent cost reductions for EVs as a result of battery pack cost decreases and the pressing need to reduce local and pollutant greenhouse gas emissions will boost support and growth in EV passenger car development, including two/three wheelers. This dramatic scale up of battery demand also will reduce the cost for battery modules and contribute to rapid cost reductions in the installation of stationary BES systems. In the long term, beyond 2030 (although outside the outlook of this report) very high shares of VRE will create the need for significantly longer duration energy storage to manage periods of low solar and wind resource and smooth these fluctuations in supply. However, energy storage will also be competing with other options to manage these resource fluctuations, including dispatchable renewables (e.g., bioenergy, biogas, reservoir hydro, CSP and other options, such as power-to-gas or power-to-hydrogen), making the least-cost solution highly uncertain, given BES technology developments between 2030 and 2050 must be considered highly speculative.
Given the outlook period of 2030 in this report, developments in the energy sector to 2030 will be heavily influenced by
the pathway post-2030 and this has important implications for the evolution of the energy storage market, especially in terms of BES. With EV sales on the rise and battery packs in the 20-85 kWh range, the sheer volume and size of individual EV battery packs will probably greatly exceed the demand for BES in stationary applications until 2030, and perhaps beyond19. BES systems in stationary applications will however grow very rapidly, albeit starting from a lower base than the mobility sector.
Total electricity storage capacity in energy terms may grow from an estimated 4.67 terawatt hours (TWh) in 2017 to between 6.62 TWh and 7.82 TWh in the REmap Reference case in 2030, which is 42-68% higher than in 2017. In the REmap Doubling case, where the share of renewable energy in the global energy system is doubled from 2014 levels, electricity storage capacity could increase to between 11.89 TWh and 15.27 TWh in 2030 or 155-227% higher than in 2030 (Figure 52).

104 ELECTRICITY STORAGE AND RENEWABLES: COSTS AND MARKETS TO 2030
2017 2030
Reference Reference Doubling
TWh
4.67
11.89
15.27
2017Reference
2030Reference Doubling
Low
2017Reference
2030Reference
High
Technology
2/3 wheelers - electric
Buses - electric
CAES/flywheels/other thermal
Commercial LDVs - electric
Rooftop PV
Rooftop PV retrofit
Utility-scale batteries
CSP
Passenger EVs
PHS
0
2
4
6
8
10
12
14
16
6.62
7.82
02
4
6
8
10
12
14
16
18
TWh
Doubling
02
4
6
8
10
12
14
16
18
TWh
97%88%
16%
22%
51%
97%83%
23%
21%
45%
Sources: U.S. DOE, 2017; Sunwiz, 2017; ISEA/RWTH Aachen, 2017; GTM Research, 2017; IRENA, 2016e; Eurelectric, 2011. Note: high and low values are included to take into account the uncertainty around the magnitude of individual storage solution sizes (e.g. 5 and 9 hours of storage is assumed in the high and low cases for CSP in 2030).
Figure 52: Electricity storage energy capacity growth by source, 2017-2030
Although PHS capacity is expected to grow grow by 1 560-2 340 GWh above 2017 levels in the REmap Doubling case, the more rapid growth of other sources of electricity storage will significantly erode the share of PHS. Pumped hydro’s share of storage energy will fall from an estimated 96% in 2017 to 83-88% in 2030 in the Reference case and to between 45% and 51% by 2030 in the REmap Doubling case. This is primarily due to the large numbers of EVs that are deployed in the Reference case and, even more so, in the REmap Doubling case, as well as the significantly increased CSP deployment in the REmap Doubling case.
CSP has seen impressive cost reductions in recent years Figure 53 and is poised for growth. The ability to incorporate low-cost thermal energy storage will enable CSP to provide dispatchable generation and perform a variety of roles from baseload through to systems design to provide high capacities during peak demand hours. In the IRENA Reference case, 45 GW of CSP are installed by 2030 and could provide 225-405 GWh of electricity storage at that time, assuming a minimum average of five hours’ storage
and an upper value of nine hours. In the REmap Doubling case, 385 GW of CSP is required. If this were to be built CSP could become a major source of electricity storage, with 1925-3465 GWh in place by 2030.
Despite the more modest storage requirements of two- and three-wheelers (i.e. an estimated average of 0.7 kWh each), the sheer volume of these forms of transport suggest that they represent the second largest source of deployed electricity storage at present, with around 105 GWh of potential storage capacity connected to the grid at any one point in time, 65% of the estimated total of non-PHS electricity storage capacity in 2017. As deployment of all forms of electricity storage grows, the share of two- and three-wheelers of the non-PHS electricity storage total falls to between 23% and 26% in the Reference case and to 6-7% in the REmap Doubling case; this is in spite of their storage capacity increasing from 100-200% in the Reference case by 2030 (i.e. from an estimated 200 million to 500 million) and by 305-395% in the REmap Doubling case (i.e. growing to 900 million).

105ELECTRICITY STORAGE AND RENEWABLES: COSTS AND MARKETS TO 2030
2011 2012 2013 2014 2015 2016 20170.00
0.10
0.20
0.30
0.40
0.50
2016
USD
/kW
h
South Africa
South Africa
South Africa
South Africa
Australia
Morocco
France
France
France
Chile
Fossil fuel costrangeHinkley Point C
Solar thermal
Source: IRENA, 2017a. Note: Data is for the year of announcement. The year of commissioning is typically three to five years following this date.
Figure 53: Concentrating solar power tender and auction results by year of announcement, 2011-2017
In the Reference case, 59 million passenger EVs are estimated to be on the road by 2030 and in the REmap Doubling case, this number should increase to 159 million vehicles. For electric buses, on-road numbers reach 0.5 million in 2030 in the Reference case and 11 million in the REmap Doubling case; for electric commercial LDVs, the numbers are 0.3 million and 5 million, respectively. Combined, these forms of transport vehicle will see their energy storage grow from an estimated 22 GWh to 918-1 377 GWh in 2030 in the Reference case and to 3 290-4 021 GWh in the REmap Doubling case. This represents an increase of between 40 and 61 times the current estimated storage of 22 GWh in the Reference case and 147 to 180 times in the REmap Doubling case, resulting in their share of total storage increasing to 13-16% and 26-28%, respectively.
The outlook for BES systems in stationary applications to 2030 at the utility scale and behind the meter shows rapid growth, although not at the same scale as EVs. Total storage capacity could increase from a currently estimated 11 GWh to between 100 GWh and 167 GWh in 2030 in the Remap
Reference case and to as much as 181 GWh and 421 GWh in the Doubling case.
Focusing on the BES market in stationary applications to 2030 highlights the fact that there is significant potential for growth in applications behind the meter, notably in small-scale systems associated with PV systems so as to increase self-consumption or, potentially in the future, to respond to incentives from grid operators or distribution companies to manage grid feed-in. Currently, where the right regulatory structure is in place (e.g., Germany) or in areas with high electricity prices, excellent solar resources and relatively low grid feed-in remuneration (e.g. Australia), significant battery storage associated with new PV installations is beginning to emerge. In Germany in recent years, as much as 40% of total annual small-scale solar PV installations have had battery storage, while the Australian market for storage is beginning to show signs of a takeoff (Sunwiz, 2017).
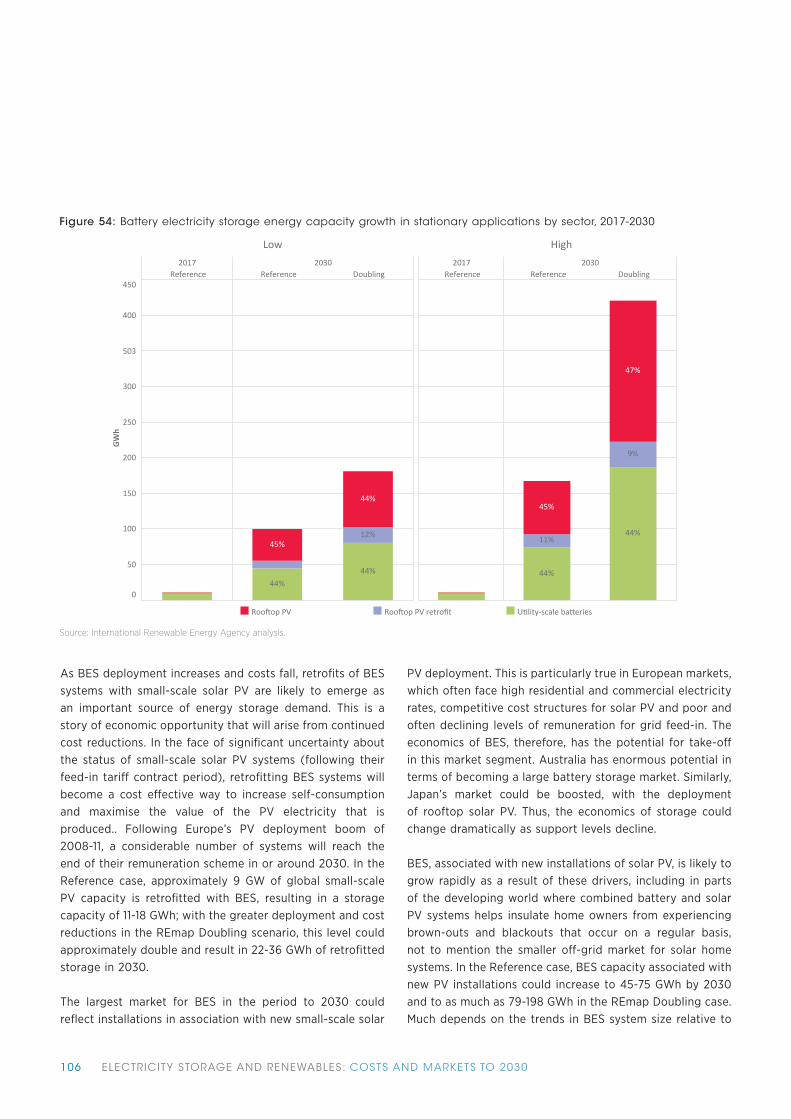
106 ELECTRICITY STORAGE AND RENEWABLES: COSTS AND MARKETS TO 2030
2017Reference
2030Reference Doubling
100
150
200
250
300
503
400
450
GW
h
45%
44%
44%
12%
44%
Low2017
Reference2030
Reference Doubling
45%
11%
44%
47%
44%
9%
High
0
50
Rooftop PV Rooftop PV retrofit Utility-scale batteries
Source: International Renewable Energy Agency analysis.
Figure 54: Battery electricity storage energy capacity growth in stationary applications by sector, 2017-2030
As BES deployment increases and costs fall, retrofits of BES systems with small-scale solar PV are likely to emerge as an important source of energy storage demand. This is a story of economic opportunity that will arise from continued cost reductions. In the face of significant uncertainty about the status of small-scale solar PV systems (following their feed-in tariff contract period), retrofitting BES systems will become a cost effective way to increase self-consumption and maximise the value of the PV electricity that is produced.. Following Europe’s PV deployment boom of 2008-11, a considerable number of systems will reach the end of their remuneration scheme in or around 2030. In the Reference case, approximately 9 GW of global small-scale PV capacity is retrofitted with BES, resulting in a storage capacity of 11-18 GWh; with the greater deployment and cost reductions in the REmap Doubling scenario, this level could approximately double and result in 22-36 GWh of retrofitted storage in 2030.
The largest market for BES in the period to 2030 could reflect installations in association with new small-scale solar
PV deployment. This is particularly true in European markets, which often face high residential and commercial electricity rates, competitive cost structures for solar PV and poor and often declining levels of remuneration for grid feed-in. The economics of BES, therefore, has the potential for take-off in this market segment. Australia has enormous potential in terms of becoming a large battery storage market. Similarly, Japan’s market could be boosted, with the deployment of rooftop solar PV. Thus, the economics of storage could change dramatically as support levels decline.
BES, associated with new installations of solar PV, is likely to grow rapidly as a result of these drivers, including in parts of the developing world where combined battery and solar PV systems helps insulate home owners from experiencing brown-outs and blackouts that occur on a regular basis, not to mention the smaller off-grid market for solar home systems. In the Reference case, BES capacity associated with new PV installations could increase to 45-75 GWh by 2030 and to as much as 79-198 GWh in the REmap Doubling case. Much depends on the trends in BES system size relative to

107ELECTRICITY STORAGE AND RENEWABLES: COSTS AND MARKETS TO 2030
Country
Energy imbalance
Operating reserve
Balancing mechanism startup
Standing reserve
Constraints - England,Wales, Cheviot & Scotland
Footroom
Fast Reserve
Response
Reactive
Black Start
Minor components
Other
Black Start - other allowances
Supplemental & demand-side balancing reserve
Total alancing system costs
Estimated balancing service charge (£/MWh)
Total 2016/2017(£ millions)-54.3
189.7
6.7
63.2
262.2
24.5
93.6
147.4
79.2
90.1
21.5
25.0
53.9
117.4
1120.0
2.43
Total 2017/2018 estimate(£ millions)-8.5
85.3
3
64
276.8
7.9
119.6
179.2
77.9
44.9
20.5
871.0
1.71
Source: National Grid, 2017.
Table 23: Balancing market value in the United Kingdom by service, 2016/17 and 2017/18
installed solar PV capacity. The high and low ranges in this analysis assume this may vary between 1.2 kWh/kW and as much as 2 kWh/kW.
The utility-scale market for BES will also grow strongly, from an estimated 10 GWh in mid-2017 to between 45 GWh and 74 GWh in the Remap Reference case and 81 GWh and 187 GWh in the REmap Doubling case. With increased attention directed at the next phase of energy transition, a number of countries are in the process of identifying the necessary market reforms required to support higher shares of VRE. This includes the development of markets for ancillary services to the electricity grid and the introduction of more granular markets to reward individual services more directly (e.g. primary and secondary frequency reserves, firm capacity, among others). These markets are often growing in importance and value, although they still may represent relatively small overall costs within the electricity system.
For instance, in the United Kingdom, the market for balancing services represents an estimated market of GBP 1 120 million in 2016/17 and GBP 871 million for 2017/18 (Table 23) compared to the value of the wholesale market as a whole of GBP 577 billion in 2016/17. In the United States, the PJM regional transmission organisation (that coordinates the movement of wholesale electricity in all or parts of Delaware, Illinois, Indiana, Kentucky, Maryland, Michigan, New Jersey, North Carolina, Ohio, Pennsylvania, Tennessee, Virginia, West Virginia and the District of Columbia) saw output from BES systems increase by over 100% in 2016 providing 16 GWh of storage services in that year, with future growth expected (Monitoring Analytics, 2017).
With falling BES costs, there are increasing economic opportunities for storage technologies. For instance, in the United Kingdom’s 2016 “T-4” capacity auction, 225 MW of storage capacity was awarded contracts for 2020/21 delivery (National Grid, 2016). In addition, efforts to directly contract for energy storage are under way in markets from California, Massuchusetts (United States) to South Australia.
It is essential to note that storage now competes with other sources of flexibility to meet the needs of the electricity system of the future within efforts to decarbonise the electricity sector as a whole. Thus, although these markets are growing in importance, storage is competing against other existing flexibility options that often have a cost advantage. This means that in these very price sensitive

108 ELECTRICITY STORAGE AND RENEWABLES: COSTS AND MARKETS TO 2030
markets BES market growth will be heavily influenced by the rate of future cost reductions.
In terms of the services provided by BES systems, the economics of behind-the-meter storage opportunities —notably for new PV installations — is likely to be the largest driver of battery storage growth. This will predominantly provide an electricity time-shift service to increase self-consumption in an era of lower feed-in remuneration to
the grid, given the arbitrage opportunity between higher electricity tariffs than feed-in remuneration. When combined with the utility-scale applications for the time-shift of electricity, this means that by 2030 in the Remap Reference case, 45-75 GWh of BES is deployed in electricity time-shifting operations (60-62% of the total), while in the REmap Doubling case, these values are 115-269 GWh (62-64%).
In the REmap Reference case, the next largest main-use case is frequency regulation, where the rapid response time of batteries make them an ideal solution, particularly for primary/fast response. In the Reference case in 2030, 15-23 GWh of storage main-use case is frequency response. In the Doubling case, the next largest main-use case after electricity time-shifting is for renewable capacity firming, with 24-57 GWh of storage capacity.
The remaining use cases for storage are estimated to contribute 24-41 GWh in 2030 in the Reference case, with 11-20 GWH whose main-use case would be renewable capacity firming; electricity supply reserve capacity at 5-8 GWh; and the remainder — including transmission, distribution and other services — accounting for 8-13 GWh. In the REmap Doubling case, frequency regulation is the main-use case for 20-42 GWh of storage, electricity supply reserve capacity for 9-21 GWh and transmission, distribution and other services for 14-32 GWh.
2017 2030
2030 2030 2030 2030
GW
h
GW
h
200
250
300
350
400
450
0
50
100
150
LowHigh
167
100
421
181
Refe
ren
ce
REm
ap
Do
ub
ling
Refe
ren
ce
REm
ap
Do
ub
ling
0
50
100
150
200
250
300
350
400
450
ReferenceLow High
REmap DoublingLow High
DistributionElectricity supply capacityFrequency regulationOtherRenewable capacity firming
TransmissionElectricity time shiftPV retrofit - Electricity time shiftPV new - Electricity time shift
Source: International Renewable Energy Agency analysis.
Figure 55: Battery electricity storage energy capacity growth in stationary applications by main-use case, 2017-2030

109ELECTRICITY STORAGE AND RENEWABLES: COSTS AND MARKETS TO 2030

110 ELECTRICITY STORAGE AND RENEWABLES: COSTS AND MARKETS TO 2030
REFERENCESAgora (2014) Electricity Storage in the German Energy Transition. Analysis of the storage required in the power market, ancillary services market
and the distribution grid, Berlin, Agora Energiewende [Online]. Available at https://www.agora-energiewende.de/fileadmin/Projekte/2013/
speicher-in-der-energiewende/Agora_Speicherstudie_EN_web.pdf.
Akinyele, D. O. and Rayudu, R. K. (2014) ‘Review of energy storage technologies for sustainable power networks’, Sustainable Energy
Technologies and Assessments, vol. 8, pp. 74–91 [Online]. DOI: 10.1016/j.seta.2014.07.004.
ALACAES (2016) Pilot Plant [Online]. Available at https://alacaes.com/technology/pilot-plant/ (Accessed 9 September 2017).
Albright, G. and Al-Hallaj, S. (2012) Making lithium-ion safe through thermal management, Chicago, USA, AllCell Technologies [Online].
Available at http://www.battcon.com/PapersFinal2012/Greg%20Albright%20-%20Making%20Lithium-ion%20safe%20through%20thermal%20
management.pdf.
Amiryar, M. and Pullen, K. (2017) ‘A Review of Flywheel Energy Storage System Technologies and Their Applications’, Applied Sciences, vol. 7,
no. 3, p. 286 [Online]. DOI: 10.3390/app7030286.
ANL (2013) Modeling Ternary Pumped Storage Units, Oak Ridge, Tennessee, USA, Argonne National Laboratory [Online]. Available at http://
ceeesa.es.anl.gov/projects/psh/ANL_DIS-13_07_Modeling_Ternary_Units.pdf.
Arani, A. A. K., Karami, H., Gharehpetian, G. B. and Hejazi, M. S. A. (2017) ‘Review of Flywheel Energy Storage Systems structures and applications
in power systems and microgrids’, Renewable and Sustainable Energy Reviews, vol. 69, pp. 9–18 [Online]. DOI: 10.1016/j.rser.2016.11.166.
Barbour, E., Mignard, D., Ding, Y. and Li, Y. (2015) ‘Adiabatic Compressed Air Energy Storage with packed bed thermal energy storage’, Applied
Energy, vol. 155, pp. 804–815 [Online]. DOI: 10.1016/j.apenergy.2015.06.019.
Benato, R., Cosciani, N., Crugnola, G., Dambone Sessa, S., Lodi, G., Parmeggiani, C. and Todeschini, M. (2015) ‘Sodium nickel chloride battery
technology for large-scale stationary storage in the high voltage network’, Journal of Power Sources, vol. 293, pp. 127–136 [Online]. DOI:
10.1016/j.jpowsour.2015.05.037.
Benchmark Mineral Intelligence, (2017) ‘Battery raw material pricing in a lithium ion era’,.
Blomgren, G. E. (2017) ‘The Development and Future of Lithium Ion Batteries’, Journal of The Electrochemical Society, vol. 164, no. 1, pp.
A5019–A5025 [Online]. DOI: 10.1149/2.0251701jes.
Bloomberg (2017) ‘Move Over Tesla, Europe’s Building Its Own Battery Gigafactories’, Bloomberg.com, 22nd May [Online]. Available at https://
www.bloomberg.com/news/articles/2017-05-22/move-over-tesla-europe-s-building-its-own-battery-gigafactories (Accessed 9 September 2017).
BNEF (2016) Electric vehicles to be 35% of global new car sales by 2040 [Online]. Available at https://about.bnef.com/blog/electric-vehicles-
to-be-35-of-global-new-car-sales-by-2040/ (Accessed 11 September 2017).
BNEF (2017) Lithium-ion Battery Costs: Squeezed Margins and New Business Models [Online]. Available at https://about.bnef.com/blog/
lithium-ion-battery-costs-squeezed-margins-new-business-models/ (Accessed 29 September 2017).

111ELECTRICITY STORAGE AND RENEWABLES: COSTS AND MARKETS TO 2030
Bocklisch, T. (2016) ‘Hybrid energy storage approach for renewable energy applications’, Journal of Energy Storage, vol. 8, pp. 311–319 [Online].
DOI: 10.1016/j.est.2016.01.004.
BOS AG (2015) Hybrid Battery - Products [Online]. Available at http://www.bos-ag.com/component/k2/content/products (Accessed 4
September 2017).
Bruce, P. G., Scrosati, B. and Tarascon, J.-M. (2008) ‘Nanomaterials for Rechargeable Lithium Batteries’, Angewandte Chemie International
Edition, vol. 47, no. 16, pp. 2930–2946 [Online]. DOI: 10.1002/anie.200702505.
Bullough, C., Gatzen, C., Jakiel, C., Koller, M., Nowi, A. and Zunft, S. (2004) ‘Advanced Adiabatic Compressed Air Energy Storage for the
Integration of Wind Energy’, Proceedings of the European Wind Energy Conference, EWEC 2004, 22-25 November 2004, London UK. [Online].
Available at http://www.ewi.uni-koeln.de/fileadmin/user_upload/Publikationen/Zeitschriften/2004/04_11_23_EWEC_Paper_Final.pdf.
Caralis, G., Rados, K. and Zervos, A. (2010) ‘On the market of wind with hydro-pumped storage systems in autonomous Greek islands’,
Renewable and Sustainable Energy Reviews, vol. 14, no. 8, pp. 2221–2226 [Online]. DOI: 10.1016/j.rser.2010.02.008.
Casimir, A., Zhang, H., Ogoke, O., Amine, J. C., Lu, J. and Wu, G. (2016) ‘Silicon-based anodes for lithium-ion batteries: Effectiveness of
materials synthesis and electrode preparation’, Nano Energy, vol. 27, pp. 359–376 [Online]. DOI: 10.1016/j.nanoen.2016.07.023.
Chen, C. H., Liu, J., Stoll, M. E., Henriksen, G., Vissers, D. R. and Amine, K. (2004) ‘Aluminum-doped lithium nickel cobalt oxide electrodes for
high-power lithium-ion batteries’, Journal of Power Sources, vol. 128, no. 2, pp. 278–285 [Online]. DOI: 10.1016/j.jpowsour.2003.10.009.
Chen, H., Cong, T. N., Yang, W., Tan, C., Li, Y. and Ding, Y. (2009) ‘Progress in electrical energy storage system: A critical review’, Progress in
Natural Science, vol. 19, no. 3, pp. 291–312 [Online]. DOI: 10.1016/j.pnsc.2008.07.014.
Chen, Z., Belharouak, I., Sun, Y.-K. and Amine, K. (2013) ‘Titanium-Based Anode Materials for Safe Lithium-Ion Batteries’, Advanced Functional
Materials, vol. 23, no. 8, pp. 959–969 [Online]. DOI: 10.1002/adfm.201200698.
Choi, S. S. and Lim, H. S. (2002) ‘Factors that affect cycle-life and possible degradation mechanisms of a Li-ion cell based on LiCoO2’, Journal
of Power Sources, vol. 111, no. 1, pp. 130–136 [Online]. DOI: 10.1016/S0378-7753(02)00305-1.
Chu, I.-H., Kompella, C. S., Nguyen, H., Zhu, Z., Hy, S., Deng, Z., Meng, Y. S. and Ong, S. P. (2016) ‘Room-Temperature All-solid-state
Rechargeable Sodium-ion Batteries with a Cl-doped Na3PS4 Superionic Conductor’, Scientific Reports, vol. 6, no. 1 [Online]. DOI: 10.1038/
srep33733 (Accessed 14 August 2017).
Chung, S.-Y., Bloking, J. T. and Chiang, Y.-M. (2002) ‘Electronically conductive phospho-olivines as lithium storage electrodes’, Nature Materials,
vol. 1, no. 2, pp. 123–128 [Online]. DOI: 10.1038/nmat732.
Ciocan, G. D., Teller, O. and CZERWINSKI, F. (2012) ‘Variable Speed Pump-Turbines Technology’, UPB Scientific Bulletin. Series D: Mecheanical
Engineering, vol. 74, no. 1 [Online]. Available at https://www.scientificbulletin.upb.ro/rev_docs_arhiva/full67d_700564.pdf.
Dahn, J., Fuller, E., Obrovac, M. and Vonsacken, U. (1994) ‘Thermal stability of LixCoO2, LixNiO2 and λ-MnO2 and consequences for the safety
of Li-ion cells’, Solid State Ionics, vol. 69, no. 3–4, pp. 265–270 [Online]. DOI: 10.1016/0167-2738(94)90415-4.
Dallinger, D., Krampe, D. and Wietschel, M. (2011) ‘Vehicle-to-Grid Regulation Reserves Based on a Dynamic Simulation of Mobility Behavior’,
IEEE Transactions on Smart Grid, vol. 2, no. 2, pp. 302–313 [Online]. DOI: 10.1109/TSG.2011.2131692.

112 ELECTRICITY STORAGE AND RENEWABLES: COSTS AND MARKETS TO 2030
Daoud, M. I., Abdel-Khalik, A. S., Massoud, A., Ahmed, S. and Abbasy, N. H. (2012) ‘On the development of flywheel storage systems for power
system applications: A survey’, IEEE, pp. 2119–2125 [Online]. DOI: 10.1109/ICElMach.2012.6350175 (Accessed 23 August 2017).
Darling, R. M., Gallagher, K. G., Kowalski, J. A., Ha, S. and Brushett, F. R. (2014) ‘Pathways to low-cost electrochemical energy storage: a
comparison of aqueous and nonaqueous flow batteries’, Energy Environ. Sci., vol. 7, no. 11, pp. 3459–3477 [Online]. DOI: 10.1039/C4EE02158D.
Díaz-González, F., Sumper, A., Gomis-Bellmunt, O. and Villafáfila-Robles, R. (2012) ‘A review of energy storage technologies for wind power
applications’, Renewable and Sustainable Energy Reviews, vol. 16, no. 4, pp. 2154–2171 [Online]. DOI: 10.1016/j.rser.2012.01.029.
Dick, C. and van Hoek, H. (2010) ‘StreetScooter -ein modulares e-Fahrzeugkonzept’, Erlangen [Online]. Available at https://www.drive-e.org/
wp-content/uploads/vortraege_2010/9_Mi_Dick_BMBF-E-DriveFerienschule_2FolienproSeite.pdf (Accessed 1 October 2017).
DOE/EPRI (2015) Electricity Storage Handbook in Collaboration with NRECA, Albuquerque, USA [Online]. Available at http://www.sandia.gov/
ess/publications/SAND2015-1002.pdf.
Doughty, D. H., Butler, P. C. and Boyes, J. D. (2010) ‘Batteries for Large-scale Stationary Electrical Energy Storage Secondary Batteries Sodium-
beta High Temperature Batteries’,.
Downie, L. E., Hyatt, S. R. and Dahn, J. R. (2016) ‘The Impact of Electrolyte Composition on Parasitic Reactions in Lithium Ion Cells Charged
to 4.7 V Determined Using Isothermal Microcalorimetry’, Journal of The Electrochemical Society, vol. 163, no. 2, pp. A35–A42 [Online]. DOI:
10.1149/2.0081602jes.
Dursun, B. and Alboyaci, B. (2010) ‘The contribution of wind-hydro pumped storage systems in meeting Turkey’s electric energy demand’,
Renewable and Sustainable Energy Reviews, vol. 14, no. 7, pp. 1979–1988 [Online]. DOI: 10.1016/j.rser.2010.03.030.
EASE/EERA (2015) European Energy Storage Technology Development Roadmap towards 2030. Technical Annex, Brussels, European
Association for Storage of Energy (EASE), European Energy Research Alliance (EERA). [Online]. Available at http://ease-storage.eu/wp-
content/uploads/2015/10/EASE-EERA-recommendations-Annex-LR.pdf (Accessed 28 August 2017).
EASE/EERA (2017) European Energy Storage Technology Development Roadmap towards 2030 - Update, Brussels, European Association
for Storage of Energy (EASE), European Energy Research Alliance (EERA). [Online]. Available at https://www.eera-set.eu/wp-content/
uploads/2017.01.16_Update-of-the-EASE-EERA-ES-Technology-Development-Roadmap_for-public-consultation.pdf (Accessed 27 September
2017).
EERA (2016) Underground Pumped hydro storage, Brussels, European Energy Research Alliance [Online]. Available at https://eera-es.eu/wp-
content/uploads/2016/03/EERA_Factsheet_Underground-Pumped-Hydro-Energy-Storage_not-final.pdf.
ELIBAMA (2014) European Li-ion Battery advnaced manufacturing for electric vehicles. Chapter V. Batteries end of life managment., European
Li-ion Battery advnaced manufacturing for electric vehicles [Online]. Available at https://elibama.files.wordpress.com/2014/10/v-batteries-
end-of-life-management1.pdf.
Energy Storage News (2016) Flywheel-battery hybrid system installed in Ireland [Online]. Available at https://www.energy-storage.news/
news/flywheel-battery-hybrid-system-installed-in-ireland (Accessed 4 September 2017).
Enerkeep (2016) Weltweite Produktionskapazität für Lithiumbatterien explodiert [Online]. Available at https://enerkeep.com/blog/weltweite-
lithium-produktion-2020 (Accessed 12 August 2017).

113ELECTRICITY STORAGE AND RENEWABLES: COSTS AND MARKETS TO 2030
Engerati (2017) German redox flow battery - a game changer for energy storage? | Engerati - Energy Management [Online]. Available at
https://www.engerati.com/article/german-redox-flow-battery-game-changer-energy-storage (Accessed 30 September 2017).
EPRI (2002) Handbook of Energy Storage for Transmission or Distribution Applications, Palo Alto CA, USA, Electric Power Research Institute
[Online]. Available at http://www.w2agz.com/Library/EPRI%20Sources%20&%20Reports/(2002)%20Handbook%20of%20Energy%20
Storage%20for%20Transmission%20or%20Distribution%20Applications,%20EPRI%201007189.pdf.
ESA (2017) Surface Reservoir Pumped Hydroelectric Storage [Online]. Available at http://energystorage.org/energy-storage/technologies/
surface-reservoir-pumped-hydroelectric-storage (Accessed 31 August 2017).
Eurelectric (2011) Hydro in Europe: Powering Renewables. Full Report, Union of the Electricity Industry–EURELECTRIC [Online]. Available at
http://www.eurelectric.org/media/26690/hydro_report_final-2011-160-0011-01-e.pdf.
Eurelectric (2015) Smart charging: steering the charge, driving the change, Eurelectric [Online]. Available at http://www.eurelectric.org/
media/169888/20032015_paper_on_smart_charging_of_electric_vehicles_finalpsf-2015-2301-0001-01-e.pdf (Accessed 26 September 2017).
Exide (2016) Classic OCSM [Online]. Available at http://www.elektrotec-berlin.de/download/eng/Classic_OCSM_p_e.pdf (Accessed 4
September 2017).
Feldman, D., Margolis, R., Denholm, P. and Stekli, J. (2016) Exploring the Potential Competitiveness of Utility-Scale Photovoltaics plus Batteries
with Concentrating Solar Power, 2015–2030, [Online]. DOI: 10.2172/1321487 (Accessed 9 September 2017).
Ferg, E. (1994) ‘Spinel Anodes for Lithium-Ion Batteries’, Journal of The Electrochemical Society, vol. 141, no. 11, p. L147 [Online]. DOI:
10.1149/1.2059324.
Fraunhofer ISI (2015) Gesamt-Roadmap Lithium-Ionen-Batterien 2030, Karlsruhe, Germany, Das Fraunhofer-Institut für System- und
Innovationsforschung [Online]. Available at http://www.isi.fraunhofer.de/isi-wAssets/docs/t/de/publikationen/GRM-LIB.pdf.
Friedrischková, K., Vala, D. and Horák, B. (2015) ‘Testing of the traction batteries in electric vehicles and their further use’, IFAC-PapersOnLine,
vol. 48, no. 4, pp. 272–277 [Online]. DOI: 10.1016/j.ifacol.2015.07.046.
Furukawa (2015) World’s Largest Superconducting Flywheel Power Storage System Test Machine Completed and Test Operation Started
[Online]. Available at https://www.furukawa.co.jp/en/release/2015/kenkai_150415.html (Accessed 31 August 2017).
Gruber, P. W., Medina, P. A., Keoleian, G. A., Kesler, S. E., Everson, M. P. and Wallington, T. J. (2011) ‘Global Lithium Availability: A Constraint for
Electric Vehicles?’, Journal of Industrial Ecology, vol. 15, no. 5, pp. 760–775 [Online]. DOI: 10.1111/j.1530-9290.2011.00359.x.
Grumet, T. (2016) This Unique Combo Of Wind And Hydro Power Could Revolutionize Renewable Energy [Online]. Available at http://www.
ge.com/reports/unique-combo-wind-hydro-power-revolutionize-renewable-energy/ (Accessed 31 August 2017).
GTM Research (2017) GTM: US energy storage installations grew 100% in 2016 [Online]. Available at https://www.energy-storage.news/news/
gtm-us-energy-storage-installations-grew-100-in-2016 (Accessed 11 September 2017).
Gulagi, A., Aghahosseini, A., Bogdanov, D. and Breyer, C. (2016) Comparison of the Potential Role of Adiabatic Compressed Air Energy Storage
(A-CAES) for a Fully Sustainable Energy System in a Region of Significant and Low Seasonal Variations.

114 ELECTRICITY STORAGE AND RENEWABLES: COSTS AND MARKETS TO 2030
Handelsblatt (2015) Bosch-Akquise Seeo: Der Saft für digitale Höchstleistungen [Online]. Available at http://www.handelsblatt.com/technik/
zukunftderenergie/bosch-akquise-seeo-der-saft-fuer-digitale-hoechstleistungen/12395928.html (Accessed 2 September 2017).
Hayashi, A., Noi, K., Sakuda, A. and Tatsumisago, M. (2012) ‘Superionic glass-ceramic electrolytes for room-temperature rechargeable sodium
batteries’, Nature Communications, vol. 3, p. 856 [Online]. DOI: 10.1038/ncomms1843.
Heindl, E. (2014a) ‘Hydraulic Hydro Storage System for Self-sufficient Cities’, Energy Procedia, vol. 46, pp. 98–103 [Online]. DOI: 10.1016/j.
egypro.2014.01.162.
Heindl, E. (2014b) Hydraulic Hydro Storage and its Water Usage, vol. 104.
Heindl Energy (2017) Gravity_Storage. A new solution for large scale energy storage. [Online]. Available at http://www.heindl-energy.com/
fileadmin/user_upload/Gravity_Storage_overview_2016-us.pdf (Accessed 31 August 2017).
Hiratsuka, A., Arai, T. and Yoshimura, T. (1993) ‘Seawater pumped-storage power plant in Okinawa island, Japan’, Engineering Geology, vol. 35,
no. 3–4, pp. 237–246 [Online]. DOI: 10.1016/0013-7952(93)90012-2.
Hoogvliet, T. W., Litjens, G. B. M. A. and van Sark, W. G. J. H. M. (2017) ‘Provision of regulating- and reserve power by electric vehicle owners
in the Dutch market’, Applied Energy, vol. 190, pp. 1008–1019 [Online]. DOI: 10.1016/j.apenergy.2017.01.006.
Huskinson, B., Marshak, M. P., Suh, C., Er, S., Gerhardt, M. R., Galvin, C. J., Chen, X., Aspuru-Guzik, A., Gordon, R. G. and Aziz, M. J. (2014) ‘A metal-free
organic–inorganic aqueous flow battery’, Nature, vol. 505, no. 7482, pp. 195–198 [Online]. DOI: 10.1038/nature12909.
IEA and World Bank (2017) Sustainable Energy for All 2017—Progress toward Sustainable Energy, Washington, D.C., International Energy
Agency (IEA) and the World Bank.
IEC (2011) Electrical Energy Storage. White paper, International Electrotechnical Commission (IEC) [Online]. Available at http://www.iec.ch/
whitepaper/pdf/iecWP-energystorage-LR-en.pdf (Accessed 14 August 2017).
IHA (2017a) ‘Briefing. 2017 Key Trends in Hydropower’, International Hydropower Association [Online]. Available at https://www.hydropower.
org/sites/default/files/publications-docs/2017%20Key%20Trends%20in%20Hydropower_0.pdf (Accessed 30 August 2017).
IHA (2017b) 2017 Hydropower Status Report, London, International Hydropower Association.
IRENA (2012) ‘Renewable Energy Technologies: Costs Analysis Series, Hydropower’, vol. 1 Power Sector, no. 3/5 [Online]. Available at https://www.
irena.org/documentdownloads/publications/re_technologies_cost_analysis-hydropower.pdf (Accessed 26 July 2017).
IRENA (2015a) Renewables and Electricity Storage. A technology roadmap for REmap 2030, International Renewable Energy Agency [Online].
Available at http://www.irena.org/DocumentDownloads/Publications/IRENA_REmap_Electricity_Storage_2015.pdf (Accessed 4 August 2017).
IRENA (2015b) Battery Storage for Renewables: Market Status and Technology Outlook, Bonn, International Renewable Energy Agency [Online].
Available at http://www.irena.org/documentdownloads/publications/irena_battery_storage_report_2015.pdf.
IRENA (2016a) The Power to Change: Solar and Wind Cost Reduction Potential to 2025, Bonn, International Renewable Energy Agency [Online].
Available at http://www.irena.org/DocumentDownloads/Publications/IRENA_Power_to_Change_2016.pdf.

115ELECTRICITY STORAGE AND RENEWABLES: COSTS AND MARKETS TO 2030
IRENA (2016b) Solar PV in Africa: Costs and Markets, Bonn, International Renewable Energy Agency [Online]. Available at https://www.irena.
org/DocumentDownloads/Publications/IRENA_Solar_PV_Costs_Africa_2016.pdf.
IRENA (2016c) Off-grid renewable energy in Africa, Abu Dhabi, International Renewable Energy Agency.
IRENA (2016d) Innovation Outlook: Renewable Mini-grids, International Renewable Energy Agency [Online]. Available at http://www.irena.org/
DocumentDownloads/Publications/IRENA_Innovation_Outlook_Minigrids_2016.pdf.
IRENA (2016e) REmap: Roadmap for a Renewable Energy Future, 2016 Edition, Abu Dhabi, International Renewable Energy Agency [Online].
Available at http://www.irena.org/DocumentDownloads/Publications/IRENA_REmap_2016_edition_report.pdf (Accessed 4 August 2017).
IRENA (2017a) Renewable Power Generation Costs in 2016 (forthcoming), Bonn, International Renewable Energy Agency.
IRENA (2017b) Chapter [3] of Perspectives for the energy transition – investment needs for a low-carbon energy system., International
Renewable Energy Agency [Online]. Available at http://www.irena.org/DocumentDownloads/Publications/Perspectives_for_the_Energy_
Transition_2017.pdf (Accessed 4 August 2017).
IRENA and IEA-ETSAP (2013) Thermal Energy Storage. Technology Brief, International Renewable Energy Agency and International Energy
Agency Energy Technology Systems Analysis [Online]. Available at https://www.irena.org/DocumentDownloads/Publications/IRENA-
ETSAP%20Tech%20Brief%20E17%20Thermal%20Energy%20Storage.pdf (Accessed 27 September 2017).
ISEA (2012) Technology Overview on Electricity Storage. Overview on the potential and on the deployment perspectives of electricity storage
technologies. On behalf of Smart Energy for Europe Platform GmbH (SEFEP)., Institute for Power Electronics and Electrical Drives (ISEA),
RWTH Aachen University Chair for Electrochemical Energy Storage Systems. [Online]. Available at http://www.sefep.eu/activities/projects-
studies/120628_Technology_Overview_Electricity_Storage_SEFEP_ISEA.pdf.
ISEA/RWTH Aachen (2017) Wissenschaftliches Mess- und Evaluierungsprogramm Solarstromspeicher 2.0, Aachen [Online]. Available at http://
www.speichermonitoring.de/fileadmin/user_upload/Speichermonitoring_Jahresbericht_2017_ISEA_RWTH_Aachen.pdf.
Janoschka, T., Martin, N., Martin, U., Friebe, C., Morgenstern, S., Hiller, H., Hager, M. D. and Schubert, U. S. (2015) ‘An aqueous, polymer-based
redox-flow battery using non-corrosive, safe, and low-cost materials’, Nature, vol. 527, no. 7576, pp. 78–81 [Online]. DOI: 10.1038/nature15746.
Ji, Y., Zhang, Y. and Wang, C.-Y. (2013) ‘Li-Ion Cell Operation at Low Temperatures’, Journal of the Electrochemical Society, vol. 160, no. 4, pp.
A636–A649 [Online]. DOI: 10.1149/2.047304jes.
Jiang, J., Chen, J. and Dahn, J. R. (2004) ‘Comparison of the Reactions Between Li[sub 7/3]Ti[sub 5/3]O[sub 4] or LiC[sub 6] and Nonaqueous
Solvents or Electrolytes Using Accelerating Rate Calorimetry’, Journal of The Electrochemical Society, vol. 151, no. 12, p. A2082 [Online]. DOI:
10.1149/1.1817698.
JRC (2016) Lithium ion battery value chain and related opportunities for Europe, Joint Research Centre (European Commission). Publications
Office of the European Union [Online]. Available at https://ec.europa.eu/jrc/en/publication/eur-scientific-and-technical-research-reports/
lithium-ion-battery-value-chain-and-related-opportunities-europe.
Kairies, K., Haberschusz, D., van Ouwerkerk, J., Strebel, J., Wessels, O., Magnor, D., Badeda, J. and Sauer, D. U. (2016) Wissenschaftliches Mess-
und Evaluierungsprogramm Solarstromspeicher, Aachen [Online]. Available at http://www.speichermonitoring.de/fileadmin/user_upload/
Speichermonitoring_Jahresbericht_2016_Kairies_web.pdf.

116 ELECTRICITY STORAGE AND RENEWABLES: COSTS AND MARKETS TO 2030
Kawakami, N., Iijima, Y., Fukuhara, M., Bando, M., Sakanaka, Y., Ogawa, K. and Matsuda, T. (2010) ‘Development and field experiences of
stabilization system using 34MW NAS batteries for a 51MW wind farm’, IEEE, pp. 2371–2376 [Online]. DOI: 10.1109/ISIE.2010.5637487 (Accessed
14 August 2017).
Khan, M., Swierczynski, M. and Kær, S. (2017) ‘Towards an Ultimate Battery Thermal Management System: A Review’, Batteries, vol. 3, no. 1, p.
9 [Online]. DOI: 10.3390/batteries3010009.
Kim, E.-Y., Lee, B.-R., Yun, G., Oh, E.-S. and Lee, H. (2015) ‘Effects of binder content on manganese dissolution and electrochemical performances
of spinel lithium manganese oxide cathodes for lithium ion batteries’, Current Applied Physics, vol. 15, no. 4, pp. 429–434 [Online]. DOI:
10.1016/j.cap.2015.01.029.
Kim, J. G., Son, B., Mukherjee, S., Schuppert, N., Bates, A., Kwon, O., Choi, M. J., Chung, H. Y. and Park, S. (2015) ‘A review of lithium and non-
lithium based solid state batteries’, Journal of Power Sources, vol. 282, pp. 299–322 [Online]. DOI: 10.1016/j.jpowsour.2015.02.054.
Kittner, N., Lill, F. and Kammen, D. M. (2017) ‘Energy storage deployment and innovation for the clean energy transition’, Nature Energy, vol. 2,
p. 17125 [Online]. DOI: 10.1038/nenergy.2017.125.
Kosova, N. V. and Podgornova, O. A. (2015) ‘Supervalent doping of LiFePO4 for enhanced electrochemical performance’, Chimica Techno Acta,
vol. 2, no. 4, pp. 326–342 [Online]. DOI: 10.15826/chimtech.2015.2.4.030.
Kotiuga, W., Hadjian, S., King, M., Al-Hadhrami, L., Arif, M., Khaled, Y. and Al-Soufi, K. (2013) Pre-Feasibility Study of a 1000 MW Pumped
Storage Plant in Saudi Arabia,.
Krause, L. J., Jensen, L. D. and Chevrier, V. L. (2017) ‘Measurement of Li-Ion Battery Electrolyte Stability by Electrochemical Calorimetry’,
Journal of The Electrochemical Society, vol. 164, no. 4, pp. A889–A896 [Online]. DOI: 10.1149/2.1651704jes.
Kurashima, Y. and Kodama, E. (1999) ‘Development of a compact sodium sulphur battery’, Power Engineering Journal, vol. 13, no. 3, pp. 136–141
[Online]. DOI: 10.1049/pe:19990306.
Lantelme, F. and Groult, H. (eds.) (2013) Molten salts chemistry: from lab to applications, First edition. Amsterdam, Elsevier.
Lawson, B. (2017) Battery Life and How To Improve It [Online]. Available at http://www.mpoweruk.com/life.htm (Accessed 12 August 2017).
Lee, S., Kim, E.-Y., Lee, H. and Oh, E.-S. (2014) ‘Effects of polymeric binders on electrochemical performances of spinel lithium manganese
oxide cathodes in lithium ion batteries’, Journal of Power Sources, vol. 269, pp. 418–423 [Online]. DOI: 10.1016/j.jpowsour.2014.06.167.
Leng, F., Tan, C. M. and Pecht, M. (2015) ‘Effect of Temperature on the Aging rate of Li Ion Battery Operating above Room Temperature’,
Scientific Reports, vol. 5, no. 1 [Online]. DOI: 10.1038/srep12967 (Accessed 12 August 2017).
Li, B. and Liu, J. (2017) ‘Progress and directions in low-cost redox flow batteries for large-scale energy storage’, National Science Review, p.
nww098 [Online]. DOI: 10.1093/nsr/nww098.
Li, G., Lu, X., Kim, J. Y., Meinhardt, K. D., Chang, H. J., Canfield, N. L. and Sprenkle, V. L. (2016) ‘Advanced intermediate temperature sodium–
nickel chloride batteries with ultra-high energy density’, Nature Communications, vol. 7, p. 10683 [Online]. DOI: 10.1038/ncomms10683.

117ELECTRICITY STORAGE AND RENEWABLES: COSTS AND MARKETS TO 2030
Li, L., Kim, S., Wang, W., Vijayakumar, M., Nie, Z., Chen, B., Zhang, J., Xia, G., Hu, J., Graff, G., Liu, J. and Yang, Z. (2011) ‘A Stable Vanadium
Redox-Flow Battery with High Energy Density for Large-Scale Energy Storage’, Advanced Energy Materials, vol. 1, no. 3, pp. 394–400 [Online].
DOI: 10.1002/aenm.201100008.
Linden, D. and Reddy, T. B. (2002) Handbook of Batteries. 3rd, McGraw-Hill.
Lowe, M., Tokuoka, S., Trigg, T. and Gereffi, G. (2010) ‘Lithium-ion batteries for electric vehicles’, Duke University Center on Globalization,
Governance and Competitiveness, Tech. Rep. [Online]. Available at http://millenniumindicators.un.org/unsd/trade/s_geneva2011/refdocs/RDs/
Lithium-Ion%20Batteries%20(Gereffi%20-%20May%202010).pdf (Accessed 30 September 2017).
Lu, X., Lemmon, J. P., Sprenkle, V. and Yang, Z. (2010) ‘Sodium-beta alumina batteries: Status and challenges’, JOM, vol. 62, no. 9, pp. 31–36
[Online]. DOI: 10.1007/s11837-010-0132-5.
Lu, X., Li, G., Kim, J. Y., Mei, D., Lemmon, J. P., Sprenkle, V. L. and Liu, J. (2014) ‘Liquid-metal electrode to enable ultra-low temperature
sodium–beta alumina batteries for renewable energy storage’, Nature Communications, vol. 5 [Online]. DOI: 10.1038/ncomms5578 (Accessed
14 August 2017).
Lu, X., Xia, G., Lemmon, J. P. and Yang, Z. (2010) ‘Advanced materials for sodium-beta alumina batteries: Status, challenges and perspectives’,
Journal of Power Sources, vol. 195, no. 9, pp. 2431–2442 [Online]. DOI: 10.1016/j.jpowsour.2009.11.120.
Luo, X., Wang, J., Dooner, M. and Clarke, J. (2015) ‘Overview of current development in electrical energy storage technologies and the
application potential in power system operation’, Applied Energy, vol. 137, pp. 511–536 [Online]. DOI: 10.1016/j.apenergy.2014.09.081.
Luvishis, A. (2009) Hybrid rail vehicles, Place of publication not identified, publisher not identified.
M5BAT (n.d.) M5BAT: a unique hybrid battery storage system [Online]. Available at http://m5bat.de/en-gb/ (Accessed 4 September 2017).
Mahmoud, H. T. and Xu, L. (2011) A combined Li-ion & lead-acid battery system for start-stop application: potential & realization, Göteborg,
Sweden, Department of Energy and Environment, Division of Electric Power Engineering / Department of Materials and Manufacturing
Technology / Department of Applied Physics Chalmers University of Technology [Online]. Available at http://publications.lib.chalmers.se/
records/fulltext/144615.pdf.
McLean, E. and Kearney, D. (2014) ‘An Evaluation of Seawater Pumped Hydro Storage for Regulating the Export of Renewable Energy to the
National Grid’, Energy Procedia, vol. 46, pp. 152–160 [Online]. DOI: 10.1016/j.egypro.2014.01.168.
Minke, C., Kunz, U. and Turek, T. (2017) ‘Techno-economic assessment of novel vanadium redox flow batteries with large-area cells’, Journal of
Power Sources, vol. 361, pp. 105–114 [Online]. DOI: 10.1016/j.jpowsour.2017.06.066.
Mizushima, K., Jones, P. C., Wiseman, P. J. and Goodenough, J. B. (1980) ‘LixCoO2 (0<x<-1): A new cathode material for batteries of high energy
density’, Materials Research Bulletin, vol. 15, no. 6, pp. 783–789 [Online]. DOI: 10.1016/0025-5408(80)90012-4.
Moore, M., Counce, R., Watson, J. and Zwodzinski, T. (2015) ‘A Comparison of the Capital Costs of a Vanadium Redox-Flow Battery and a
Regenerative Hydrogen-Vanadium Fuel Cell’, Journal of Advanced Chemical Engineering [Online]. DOI: 10.4172/2090-4568.1000140 (Accessed
22 August 2017).

118 ELECTRICITY STORAGE AND RENEWABLES: COSTS AND MARKETS TO 2030
Müller, M., Viernstein, L., Truong, C. N., Eiting, A., Hesse, H. C., Witzmann, R. and Jossen, A. (2017) ‘Evaluation of grid-level adaptability
for stationary battery energy storage system applications in Europe’, Journal of Energy Storage, vol. 9, pp. 1–11 [Online]. DOI: 10.1016/j.
est.2016.11.005.
Nagaya, S., Kashima, N., Minami, M., Kawashima, H. and Unisuga, S. (2001) ‘Study on high temperature superconducting magnetic bearing
for 10 kWh flywheel energy storage system’, IEEE Transactions on Appiled Superconductivity, vol. 11, no. 1, pp. 1649–1652 [Online]. DOI:
10.1109/77.920097.
National Grid (2016) Final Auction Results: T-4 Capacity Market Auction for 2020/21, National Grid UK Plc.
National Grid (2017) Monthly Balancing Services Summary 2016/17, National Grid UK Plc [Online]. Available at http://www2.nationalgrid.com/
WorkArea/DownloadAsset.aspx?id=8589939258.
Navigant Research (2016) Five Trends for Energy Storage in 2016 and Beyond [Online]. Available at https://www.navigantresearch.com/
research/five-trends-for-energy-storage-in-2016-and-beyond (Accessed 11 September 2017).
NEDO (2016) Case Study: Smart Community demonstration in Malaga. NEDO Smart Community Case Study, New Energy and Industrial
Technology Development Organization (NEDO) [Online]. Available at http://www.nedo.go.jp/content/100789468.pdf (Accessed 26 September
2017).
NEDO (2017) Japan - U.S. Collaborative Smart Grid Demonstration Project in Maui Island of Hawaii State: A case study. NEDO Smart
Community Case Study, New Energy and Industrial Technology Development Organization (NEDO) [Online]. Available at http://www.nedo.
go.jp/content/100864936.pdf.
Newman, R. H. (1994) ‘Advantages and disadvantages of valve-regulated, lead/acid batteries’, Journal of Power Sources, vol. 52, no. 1, pp.
149–153 [Online]. DOI: 10.1016/0378-7753(94)01940-1.
Nguyen, T. and Savinell, R. F. (2010) ‘Flow Batteries’, Electrochem. Soc. Interface, vol. 19, no. 3.
Nitta, N., Wu, F., Lee, J. T. and Yushin, G. (2015) ‘Li-ion battery materials: present and future’, Materials Today, vol. 18, no. 5, pp. 252–264
[Online]. DOI: 10.1016/j.mattod.2014.10.040.
Noack, J., Wietschel, L., Roznyatovskaya, N., Pinkwart, K. and Tübke, J. (2016) ‘Techno-Economic Modeling and Analysis of Redox Flow Battery
Systems’, Energies, vol. 9, no. 8, p. 627 [Online]. DOI: 10.3390/en9080627.
NREL and Black & Veatch (2012) Cost Report. Cost and performance data for power generation technologies., National Renewable Energy
Laboratory and Black & Veatch [Online]. Available at https://www.bv.com/docs/reports-studies/nrel-cost-report.pdf.
Nuvve (2017) ‘Nuvve Operate World’s First Fully Commercial Vehicle-to-Grid Hub in Denmark « NUVVE Corp’, [Online]. Available at http://
nuvve.com/portfolio/nissan-enel-and-nuvve-operate-worlds-first-fully-commercial-vehicle-to-grid-hub-in-denmark/ (Accessed 26 September
2017).
Nykvist, B. and Nilsson, M. (2015) ‘Rapidly falling costs of battery packs for electric vehicles’, Nature Climate Change, vol. 5, no. 4, pp. 329–332
[Online]. DOI: 10.1038/nclimate2564.

119ELECTRICITY STORAGE AND RENEWABLES: COSTS AND MARKETS TO 2030
OECD/IEA (2017) Global EV Outlook 2017. Two million and counting, International Energy Agency [Online]. Available at https://www.iea.org/
publications/freepublications/publication/GlobalEVOutlook2017.pdf (Accessed 1 October 2017).
Oshima, K., Kawai, J., Otsuka, S., Wada, T. and Imano, H. (1999) ‘Development of Pump-Turbine for Seawater Pumped Storage Power Plant’,
American Society of Civil Engineers, pp. 1–6 [Online]. DOI: 10.1061/40440(1999)67 (Accessed 31 August 2017).
Ozawa, K. (1994) ‘Lithium-ion rechargeable batteries with LiCoO2 and carbon electrodes: the LiCoO2/C system’, Solid State Ionics, vol. 69, no.
3–4, pp. 212–221 [Online]. DOI: 10.1016/0167-2738(94)90411-1.
Pacheco, J. E., Showalter, S. K. and Kolb, W. J. (2002) ‘Development of a Molten-Salt Thermocline Thermal Storage System for Parabolic Trough
Plants’, Journal of Solar Energy Engineering, vol. 124, no. 2, p. 153 [Online]. DOI: 10.1115/1.1464123.
Pena-Alzola, R., Sebastian, R., Quesada, J. and Colmenar, A. (2011) ‘Review of flywheel based energy storage systems’, IEEE, pp. 1–6 [Online].
DOI: 10.1109/PowerEng.2011.6036455 (Accessed 25 August 2017).
Peters, L. and Friedrich, B. (2017) Proven Methods for Recovery of Lithium from Spent Batteries, Unpublished [Online]. DOI: 10.13140/
RG.2.2.28717.18408 (Accessed 25 September 2017).
Petibon, R., Xia, J., Ma, L., Bauer, M. K. G., Nelson, K. J. and Dahn, J. R. (2016) ‘Electrolyte System for High Voltage Li-Ion Cells’, Journal of The
Electrochemical Society, vol. 163, no. 13, pp. A2571–A2578 [Online]. DOI: 10.1149/2.0321613jes.
PG&E (2017) ‘PG&E, BMW Pilot Successfully Demonstrates Electric Vehicles as an Effective Grid Resource | PG&E Currents’, [Online]. Available
at http://www.pgecurrents.com/2017/06/08/pge-bmw-pilot-successfully-demonstrates-electric-vehicles-as-an-effective-grid-resource/
(Accessed 26 September 2017).
Piller (2011) Batteries and Flywheels and their application in UPS systems, Osterode, Germany [Online]. Available at http://www.piller.com/
en-GB/documents/2133/batteries-and-flywheels-en.pdf (Accessed 4 September 2017).
Pillot, C. (2015) ‘The rechargeable battery market and main trends 2014–2025’, 31st International Battery Seminar & Exhibit [Online]. Available
at http://cii-resource.com/cet/FBC-TUT8/Presentations/Pillot_Christophe.pdf (Accessed 30 September 2017).
Pinson, M. B. and Bazant, M. Z. (2012) ‘Theory of SEI Formation in Rechargeable Batteries: Capacity Fade, Accelerated Aging and Lifetime
Prediction’, Journal of the Electrochemical Society, vol. 160, no. 2, pp. A243–A250 [Online]. DOI: 10.1149/2.044302jes.
Ponce de León, C., Frías-Ferrer, A., González-García, J., Szánto, D. A. and Walsh, F. C. (2006) ‘Redox flow cells for energy conversion’, Journal
of Power Sources, vol. 160, no. 1, pp. 716–732 [Online]. DOI: 10.1016/j.jpowsour.2006.02.095.
Prifti, H., Parasuraman, A., Winardi, S., Lim, T. M. and Skyllas-Kazacos, M. (2012) ‘Membranes for Redox Flow Battery Applications’, Membranes,
vol. 2, no. 4, pp. 275–306 [Online]. DOI: 10.3390/membranes2020275.
pv magazine (2017a) ‘Konsortium plant Gigawatt-Fabrik für Lithium-Ionen-Zellen in Deutschland’, pv magazine Deutschland [Online]. Available
at https://www.pv-magazine.de/2017/05/22/konsortium-plant-gigawatt-fabrik-fuer-lithium-ionen-zellen-in-deutschland/ (Accessed 12 August
2017).
pv magazine (2017b) Germany to host two more battery factories [Online]. Available at https://www.pv-magazine.com/2017/05/23/germany-
to-host-two-more-battery-factories/ (Accessed 9 September 2017).

120 ELECTRICITY STORAGE AND RENEWABLES: COSTS AND MARKETS TO 2030
Qianzhi, S., Yan, Z., Shipengand, D. and Yuanzhuo, D. (2014) ‘Application of A Novel Flywheel and Lead-acid Battery Storage Method in Wind
Power Generation System’, pp. 27–35 [Online]. DOI: 10.14257/astl.2014.73.06 (Accessed 4 September 2017).
Qnovo (2016) 82. THE COST COMPONENTS OF A LITHIUM ION BATTERY [Online]. Available at https://qnovo.com/82-the-cost-components-
of-a-battery/ (Accessed 30 September 2017).
Rajarathnam, G. P. and Vassallo, A. M. (2016) ‘Description of the Zn/Br RFB System’, in The Zinc/Bromine Flow Battery, Singapore, Springer
Singapore, pp. 11–28 [Online]. DOI: 10.1007/978-981-287-646-1_2 (Accessed 17 August 2017).
Ramoni, M. O. and Zhang, H.-C. (2013) ‘End-of-life (EOL) issues and options for electric vehicle batteries’, Clean Technologies and Environmental
Policy, vol. 15, no. 6, pp. 881–891 [Online]. DOI: 10.1007/s10098-013-0588-4.
Rehman, S., Al-Hadhrami, L. M. and Alam, M. M. (2015) ‘Pumped hydro energy storage system: A technological review’, Renewable and
Sustainable Energy Reviews, vol. 44, pp. 586–598 [Online]. DOI: 10.1016/j.rser.2014.12.040.
Roland Berger (2012) ‘Technology & Market Drivers for Stationary and Automotive Battery Systems’, Nice, France [Online]. Available at http://
www.rechargebatteries.org/wp-content/uploads/2013/04/Batteries-2012-Roland-Berger-Report1.pdf (Accessed 1 September 2017).
Rossen, E., Jones, C. and Dahn, J. (1992) ‘Structure and electrochemistry of LixMnyNi1−yO2’, Solid State Ionics, vol. 57, no. 3–4, pp. 311–318
[Online]. DOI: 10.1016/0167-2738(92)90164-K.
Rummich, E. (2009) Energiespeicher: Grundlagen, Komponenten, Systeme und Anwendungen; mit 22 Tabellen, Renningen, expert-Verl.
RWE (2010) Adele – Adiabatic Compressed-air Energy Storage For Electricity Supply, RWE Power AG [Online]. Available at https://www.rwe.
com/web/cms/mediablob/en/391748/data/364260/1/rwe-power-ag/innovations/Brochure-ADELE.pdf (Accessed 31 August 2017).
Sakaebe, H. (2014) ‘ZEBRA Batteries’, in Kreysa, G., Ota, K., and Savinell, R. F. (eds), Encyclopedia of Applied Electrochemistry, New York, NY,
Springer New York, pp. 2165–2169 [Online]. DOI: 10.1007/978-1-4419-6996-5_437.
Sakti, A., Michalek, J. J., Fuchs, E. R. H. and Whitacre, J. F. (2015) ‘A techno-economic analysis and optimization of Li-ion batteries for light-duty
passenger vehicle electrification’, Journal of Power Sources, vol. 273, pp. 966–980 [Online]. DOI: 10.1016/j.jpowsour.2014.09.078.
Sarasua, A. E., Molina, M. G., Pontoriero, D. E. and Mercado, P. E. (2010) ‘Modelling of NAS energy storage system for power system applications’,
IEEE, pp. 555–560 [Online]. DOI: 10.1109/TDC-LA.2010.5762937 (Accessed 14 August 2017).
Saulnier, M., Auclair, A., Liang, G. and Schougaard, S. B. (2016) ‘Manganese dissolution in lithium-ion positive electrode materials’, Solid State
Ionics, vol. 294, pp. 1–5 [Online]. DOI: 10.1016/j.ssi.2016.06.007.
Schmidt, M. (2017) ‘„Rohstoffrisikobewertung Lithium“’, Berlin [Online]. Available at https://www.deutsche-rohstoffagentur.de/DERA/DE/
Downloads/vortrag-lithium-schmidt.pdf?__blob=publicationFile&v=2 (Accessed 27 September 2017).
Schmidt, O., Hawkes, A., Gambhir, A. and Staffell, I. (2017) ‘The future cost of electrical energy storage based on experience rates’, Nature
Energy, vol. 2, p. 17110 [Online]. DOI: 10.1038/nenergy.2017.110.

121ELECTRICITY STORAGE AND RENEWABLES: COSTS AND MARKETS TO 2030
Schneider, M., Rajarathnam, G. P., Easton, M. E., Masters, A. F., Maschmeyer, T. and Vassallo, A. M. (2016) ‘The influence of novel bromine
sequestration agents on zinc/bromine flow battery performance’, RSC Adv., vol. 6, no. 112, pp. 110548–110556 [Online]. DOI: 10.1039/
C6RA23446A.
Schuller, A. and Rieger, F. (2013) ‘Assessing the Economic Potential of Electric Vehicles to Provide Ancillary Services: The Case of Germany’,
Zeitschrift für Energiewirtschaft, vol. 37, no. 3, pp. 177–194 [Online]. DOI: 10.1007/s12398-013-0112-x.
Scrosati, B. and Garche, J. (2010) ‘Lithium batteries: Status, prospects and future’, Journal of Power Sources, vol. 195, no. 9, pp. 2419–2430
[Online]. DOI: 10.1016/j.jpowsour.2009.11.048.
Seba, T. (2016) ‘Swedbank Nordic Energy Summit, Oslo, March 17, 2016, Keynote: “Clean Disruption: Why Energy and Transportation will
be Obsolete by 2030”.’, Tony Seba [Online]. Available at https://tonyseba.com/swedbank-nordic-energy-summit-oslo-march-17-2016-keynote-
clean-disruption-energy-transportation-will-obsolete-2030/ (Accessed 11 September 2017).
Sensible (2016) Overview of storage technologies, European Union’s Horizon 2020 research and innovation programme [Online]. Available at
http://www.h2020-project-sensible.eu/documents/overview-of-storage-technologies.pdf.
Shabani, B. and Biju, M. (2015) ‘Theoretical Modelling Methods for Thermal Management of Batteries’, Energies, vol. 8, no. 9, pp. 10153–10177
[Online]. DOI: 10.3390/en80910153.
Shibata, T. (2017) ‘Demonstration of a 60MWh vanadium flow battery system for grid control in Japan. Sumitomo Electric Industries’,
Manchester, England.
Skyllas-Kazacos, M., Chakrabarti, M. H., Hajimolana, S. A., Mjalli, F. S. and Saleem, M. (2011) ‘Progress in Flow Battery Research and Development’,
Journal of The Electrochemical Society, vol. 158, no. 8, p. R55 [Online]. DOI: 10.1149/1.3599565.
Soto, F. A., Ma, Y., Martinez de la Hoz, J. M., Seminario, J. M. and Balbuena, P. B. (2015) ‘Formation and Growth Mechanisms of Solid-
Electrolyte Interphase Layers in Rechargeable Batteries’, Chemistry of Materials, vol. 27, no. 23, pp. 7990–8000 [Online]. DOI: 10.1021/acs.
chemmater.5b03358.
Speirs, J., Contestabile, M., Houari, Y. and Gross, R. (2014) ‘The future of lithium availability for electric vehicle batteries’, Renewable and
Sustainable Energy Reviews, vol. 35, pp. 183–193 [Online]. DOI: 10.1016/j.rser.2014.04.018.
Stan, A.-I., Swierczynski, M., Stroe, D.-I., Teodorescu, R. and Andreasen, S. J. (2014) ‘Lithium ion battery chemistries from renewable energy
storage to automotive and back-up power applications — An overview’, IEEE, pp. 713–720 [Online]. DOI: 10.1109/OPTIM.2014.6850936
(Accessed 10 August 2017).
Su, W., Xu, K., Zhong, G., Wei, Z., Wang, C. and Meng, Y. (2017) ‘Enhanced Electrochemical Performance of LiFePO4 as Cathode for Lithium
Ion Battery by Codoping with Titanium and Nitrogen’, International Journal of Electrochemical Science, pp. 6930–6939 [Online]. DOI:
10.20964/2017.08.13.
Sunwiz (2017) 2017 Battery Market Report, [Online]. Available at http://www.sunwiz.com.au/index.php/battery-market-report-2017.html.
Tesla (2016) Tesla Gigafactory | Tesla [Online]. Available at https://www.tesla.com/gigafactory?redirect=no (Accessed 11 September 2017).

122 ELECTRICITY STORAGE AND RENEWABLES: COSTS AND MARKETS TO 2030
Teslamag (2016) ‘Gigafactory 2 soll in Europa errichtet werden, Auswahl des Standorts erfolgt nächstes Jahr › TeslaMag.de’, [Online]. Available
at http://teslamag.de/news/gigafactory2-europa-auswahl-standorts-jahr-10434 (Accessed 11 September 2017).
Thackeray, M. M. (2004) ‘Spinel Electrodes for Lithium Batteries’, Journal of the American Ceramic Society, vol. 82, no. 12, pp. 3347–3354
[Online]. DOI: 10.1111/j.1151-2916.1999.tb02250.x.
Thackeray, M. M., de Picciotto, L. A., de Kock, A., Johnson, P. J., Nicholas, V. A. and Adendorff, K. T. (1987) ‘Spinel electrodes for lithium
batteries — A review’, Journal of Power Sources, vol. 21, no. 1, pp. 1–8 [Online]. DOI: 10.1016/0378-7753(87)80071-X.
Thien, T. (2015) Planning of Grid-Scale Battery Energy Storage Systems – Lessons Learned from a 5 MW Hybrid Battery Storage Project in
Germany,.
Tokash, W. and Dehamna, A. (2016) Market Data: Advanced Batteries for Utility-Scale Energy Storage. Lithium Ion, Sodium-Metal Halide,
Sodium Sulfur, Flow, and Advanced Lead-Acid Batteries: Global Market Analysis and Forecasts. Excel Databook, Boulder, CO, USA, Navigant
Research.
Tuohy, A. and O’Malley, M. (2011) ‘Pumped storage in systems with very high wind penetration’, Energy Policy, vol. 39, no. 4, pp. 1965–1974
[Online]. DOI: 10.1016/j.enpol.2011.01.026.
UET (2017) Technology - UniEnergy Technologies [Online]. Available at http://www.uetechnologies.com/technology (Accessed 18 August 2017).
Ulaganathan, M., Aravindan, V., Yan, Q., Madhavi, S., Skyllas-Kazacos, M. and Lim, T. M. (2016) ‘Recent Advancements in All-Vanadium Redox
Flow Batteries’, Advanced Materials Interfaces, vol. 3, no. 1, p. 1500309 [Online]. DOI: 10.1002/admi.201500309.
U.S. DOE (2017) DOE Global Energy Storage Database. United States Department of Energy. Office of Electricity & Energy Reliability [Online].
Available at http://www.energystorageexchange.org/projects (Accessed 4 August 2017).
USGS (2017) Lithium . Mineral Commodity Summaries. -2017., United States Geological Survey [Online]. Available at https://minerals.usgs.gov/
minerals/pubs/commodity/lithium/mcs-2017-lithi.pdf (Accessed 25 September 2017).
Utility Dive (2016) Flow battery developer to build world’s largest battery storage system [Online]. Available at http://www.utilitydive.com/
news/flow-battery-developer-to-build-worlds-largest-battery-storage-system/420164/ (Accessed 30 September 2017).
Viswanathan, V., Crawford, A., Stephenson, D., Kim, S., Wang, W., Li, B., Coffey, G., Thomsen, E., Graff, G., Balducci, P., Kintner-Meyer, M. and
Sprenkle, V. (2014) ‘Cost and performance model for redox flow batteries’, Journal of Power Sources, vol. 247, pp. 1040–1051 [Online]. DOI:
10.1016/j.jpowsour.2012.12.023.
Wang, C.-Y., Zhang, G., Ge, S., Xu, T., Ji, Y., Yang, X.-G. and Leng, Y. (2016) ‘Lithium-ion battery structure that self-heats at low temperatures’,
Nature, vol. 529, no. 7587, pp. 515–518 [Online]. DOI: 10.1038/nature16502.
Wang, J. and Sun, X. (2012) ‘Understanding and recent development of carbon coating on LiFePO 4 cathode materials for lithium-ion batteries’,
Energy Environ. Sci., vol. 5, no. 1, pp. 5163–5185 [Online]. DOI: 10.1039/C1EE01263K.
Wang, J., Yang, J., Tang, Y., Li, R., Liang, G., Sham, T.-K. and Sun, X. (2013) ‘Surface aging at olivine LiFePO 4 : a direct visual observation of iron
dissolution and the protection role of nano-carbon coating’, J. Mater. Chem. A, vol. 1, no. 5, pp. 1579–1586 [Online]. DOI: 10.1039/C2TA00521B.

123ELECTRICITY STORAGE AND RENEWABLES: COSTS AND MARKETS TO 2030
Wang, Jidai, Lu, K., Ma, L., Wang, Jihong, Dooner, M., Miao, S., Li, J. and Wang, D. (2017) ‘Overview of Compressed Air Energy Storage and
Technology Development’, Energies, vol. 10, no. 7, p. 991 [Online]. DOI: 10.3390/en10070991.
Weber, A. Z., Mench, M. M., Meyers, J. P., Ross, P. N., Gostick, J. T. and Liu, Q. (2011) ‘Redox flow batteries: a review’, Journal of Applied
Electrochemistry, vol. 41, no. 10, pp. 1137–1164 [Online]. DOI: 10.1007/s10800-011-0348-2.
Wei, X., Cosimbescu, L., Xu, W., Hu, J. Z., Vijayakumar, M., Feng, J., Hu, M. Y., Deng, X., Xiao, J., Liu, J., Sprenkle, V. and Wang, W. (2015)
‘Towards High-Performance Nonaqueous Redox Flow Electrolyte Via Ionic Modification of Active Species’, Advanced Energy Materials, vol. 5,
no. 1, p. 1400678 [Online]. DOI: 10.1002/aenm.201400678.
Whittingham, M. S. (2012) ‘History, Evolution, and Future Status of Energy Storage’, Proceedings of the IEEE, vol. 100, no. Special Centennial
Issue, pp. 1518–1534 [Online]. DOI: 10.1109/JPROC.2012.2190170.
Xu, T., Wang, W., Gordin, M. L., Wang, D. and Choi, D. (2010) ‘Lithium-ion batteries for stationary energy storage’, JOM, vol. 62, no. 9, pp. 24–30
[Online]. DOI: 10.1007/s11837-010-0131-6.
Yabuuchi, N. and Ohzuku, T. (2003) ‘Novel lithium insertion material of LiCo1/3Ni1/3Mn1/3O2 for advanced lithium-ion batteries’, Journal of
Power Sources, vol. 119–121, pp. 171–174 [Online]. DOI: 10.1016/S0378-7753(03)00173-3.
Yang, B., Hoober-Burkhardt, L., Wang, F., Surya Prakash, G. K. and Narayanan, S. R. (2014) ‘An Inexpensive Aqueous Flow Battery for Large-
Scale Electrical Energy Storage Based on Water-Soluble Organic Redox Couples’, Journal of the Electrochemical Society, vol. 161, no. 9, pp.
A1371–A1380 [Online]. DOI: 10.1149/2.1001409jes.
Zhang, X., Li, Y., Skyllas-Kazacos, M. and Bao, J. (2016) ‘Optimal Sizing of Vanadium Redox Flow Battery Systems for Residential Applications
Based on Battery Electrochemical Characteristics’, Energies, vol. 9, no. 10, p. 857 [Online]. DOI: 10.3390/en9100857.

124 ELECTRICITY STORAGE AND RENEWABLES: COSTS AND MARKETS TO 2030
Annex 1: Characteristics of stationary electricity storage systems from 2016 to 2030
This annex contains the technology data presented in this report. This data was compiled from over 150 data sources, was supplemented by expert interviews and analysis by IRENA of the latest battery developments. As a result, this data is a blend of different analytical approaches, including data from: installed projects, regulatory databases, installer
surveys, individual projects, bottom-up engineering analyses and learning curve studies. Given the rapidly changing market place for electricity storage and the difficulty in always obtaining up-to-date data for each technology, the results should be treated with caution.
Energy installation cost (USD/kWh) Power density (W/L) Round-trip efficiency (%) Self-discharge (% per day)
Type Technology Year worst reference best worst best reference worst reference best
Flow
VRFB 2016 1050 347 315 1 2 70.00 1.00 0.15 0.00
2030 360 119 108 1 2 78.00 1.00 0.15 0.00
ZBFB2016 1680 900 525 1 25 70.00 33.60 15.00 8.00
2030 576 309 180 1 25 78.00 33.60 15.00 8.00
High Temperature
NaNiCl2016 488 399 315 150 270 84.00 15.00 5.00 0.05
2030 197 161 127 150 270 87.00 15.00 5.00 0.05
NaS2016 735 368 263 120 160 80.00 1.00 0.05 0.05
2030 324 162 116 120 160 85.00 1.00 0.05 0.05
Lead-Acid
Flooded LA2016 473 147 105 10 700 82.00 0.40 0.25 0.09
2030 237 74 53 10 700 85.00 0.40 0.25 0.09
VRLA2016 473 263 105 10 700 80.00 0.40 0.25 0.09
2030 237 132 53 10 700 83.00 0.40 0.25 0.09
Li-Ion
LFP2016 840 578 200 100 10000 92.00 0.36 0.10 0.09
2030 326 224 77 100 10000 94.00 0.36 0.10 0.09
LTO2016 1260 1050 473 100 10000 96.00 0.36 0.05 0.09
2030 574 478 215 100 10000 98.00 0.36 0.05 0.09
NCA2016 840 352 200 100 10000 95.00 0.36 0.20 0.09
2030 347 145 82 100 10000 97.00 0.36 0.20 0.09
NMC/LMO2016 840 420 200 100 10000 95.00 0.36 0.10 0.09
2030 335 167 79 100 10000 97.00 0.36 0.10 0.09
Mechanical
CAES2016 84 53 2 0 1 60.00 1.00 0.50 0.00
2030 71 44 2 0 1 68.00 1.00 0.50 0.00
Flywheel2016 6000 3000 1500 5000 10000 84.00 100.00 60.00 20.00
2030 3917 1959 979 5000 10000 87.00 42.61 39.17 8.52
PHS2016 100 21 5 0 0 80.00 0.02 0.01 0.00
2030 100 21 5 0 0 80.00 0.02 0.01 0.00
Calendar life (years) Cycle life (equivalent full-cycles) Depth of discharge (%) Energy density (Wh/L)
Type Technology Year worst reference best worst reference best worst reference best worst best
Flow
VRFB 2016 5 12 20 12000 13000 14000 100 100 100 15 70
2030 8 19 32 12000 13000 14000 100 100 100 15 70
ZBFB2016 5 10 20 300 10000 14000 100 100 100 20 70
2030 8 16 32 300 10000 14000 100 100 100 20 70
High Temperature
NaNiCl2016 8 15 22 1000 3000 7500 100 100 100 150 280
2030 12 23 33 1513 4538 11344 100 100 100 150 280
NaS2016 10 17 25 1000 5000 10000 100 100 100 140 300
2030 14 24 36 1500 7500 15000 100 100 100 140 300
Lead-Acid
Flooded LA2016 3 9 15 250 1500 2500 60 50 50 50 100
2030 4 13 21 538 3225 5375 60 50 50 50 100
VRLA2016 3 9 15 250 1500 2500 60 50 50 50 100
2030 4 13 21 538 3225 5375 60 50 50 50 100
Li-Ion
LFP2016 5 12 20 1000 2500 10000 84 90 100 200 620
2030 8 18 31 1910 4774 19097 84 90 100 200 620
LTO2016 10 15 20 5000 10000 20000 84 95 100 200 620
2030 15 23 31 9549 19097 38194 84 95 100 200 620
NCA2016 5 12 20 500 1000 2000 84 90 100 200 620
2030 8 18 31 955 1910 3819 84 90 100 200 620
NMC/LMO2016 5 12 20 500 2000 4000 84 90 100 200 735
2030 8 18 31 955 3819 7639 84 90 100 200 735
Mechanical
CAES2016 20 50 100 10000 50000 100000 35 40 50 2 6
2030 20 50 100 10000 50000 100000 35 40 50 2 6
Flywheel2016 15 20 25 100000 200000 1000000 75 85 90 20 200
2030 23 30 38 151259 302518 1512590 75 85 90 20 200
PHS2016 30 60 100 12000 50000 100000 80 90 100 0 2
2030 30 60 100 12000 50000 100000 80 90 100 0 2

125ELECTRICITY STORAGE AND RENEWABLES: COSTS AND MARKETS TO 2030
Energy installation cost (USD/kWh) Power density (W/L) Round-trip efficiency (%) Self-discharge (% per day)
Type Technology Year worst reference best worst best reference worst reference best
Flow
VRFB 2016 1050 347 315 1 2 70.00 1.00 0.15 0.00
2030 360 119 108 1 2 78.00 1.00 0.15 0.00
ZBFB2016 1680 900 525 1 25 70.00 33.60 15.00 8.00
2030 576 309 180 1 25 78.00 33.60 15.00 8.00
High Temperature
NaNiCl2016 488 399 315 150 270 84.00 15.00 5.00 0.05
2030 197 161 127 150 270 87.00 15.00 5.00 0.05
NaS2016 735 368 263 120 160 80.00 1.00 0.05 0.05
2030 324 162 116 120 160 85.00 1.00 0.05 0.05
Lead-Acid
Flooded LA2016 473 147 105 10 700 82.00 0.40 0.25 0.09
2030 237 74 53 10 700 85.00 0.40 0.25 0.09
VRLA2016 473 263 105 10 700 80.00 0.40 0.25 0.09
2030 237 132 53 10 700 83.00 0.40 0.25 0.09
Li-Ion
LFP2016 840 578 200 100 10000 92.00 0.36 0.10 0.09
2030 326 224 77 100 10000 94.00 0.36 0.10 0.09
LTO2016 1260 1050 473 100 10000 96.00 0.36 0.05 0.09
2030 574 478 215 100 10000 98.00 0.36 0.05 0.09
NCA2016 840 352 200 100 10000 95.00 0.36 0.20 0.09
2030 347 145 82 100 10000 97.00 0.36 0.20 0.09
NMC/LMO2016 840 420 200 100 10000 95.00 0.36 0.10 0.09
2030 335 167 79 100 10000 97.00 0.36 0.10 0.09
Mechanical
CAES2016 84 53 2 0 1 60.00 1.00 0.50 0.00
2030 71 44 2 0 1 68.00 1.00 0.50 0.00
Flywheel2016 6000 3000 1500 5000 10000 84.00 100.00 60.00 20.00
2030 3917 1959 979 5000 10000 87.00 42.61 39.17 8.52
PHS2016 100 21 5 0 0 80.00 0.02 0.01 0.00
2030 100 21 5 0 0 80.00 0.02 0.01 0.00
Calendar life (years) Cycle life (equivalent full-cycles) Depth of discharge (%) Energy density (Wh/L)
Type Technology Year worst reference best worst reference best worst reference best worst best
Flow
VRFB 2016 5 12 20 12000 13000 14000 100 100 100 15 70
2030 8 19 32 12000 13000 14000 100 100 100 15 70
ZBFB2016 5 10 20 300 10000 14000 100 100 100 20 70
2030 8 16 32 300 10000 14000 100 100 100 20 70
High Temperature
NaNiCl2016 8 15 22 1000 3000 7500 100 100 100 150 280
2030 12 23 33 1513 4538 11344 100 100 100 150 280
NaS2016 10 17 25 1000 5000 10000 100 100 100 140 300
2030 14 24 36 1500 7500 15000 100 100 100 140 300
Lead-Acid
Flooded LA2016 3 9 15 250 1500 2500 60 50 50 50 100
2030 4 13 21 538 3225 5375 60 50 50 50 100
VRLA2016 3 9 15 250 1500 2500 60 50 50 50 100
2030 4 13 21 538 3225 5375 60 50 50 50 100
Li-Ion
LFP2016 5 12 20 1000 2500 10000 84 90 100 200 620
2030 8 18 31 1910 4774 19097 84 90 100 200 620
LTO2016 10 15 20 5000 10000 20000 84 95 100 200 620
2030 15 23 31 9549 19097 38194 84 95 100 200 620
NCA2016 5 12 20 500 1000 2000 84 90 100 200 620
2030 8 18 31 955 1910 3819 84 90 100 200 620
NMC/LMO2016 5 12 20 500 2000 4000 84 90 100 200 735
2030 8 18 31 955 3819 7639 84 90 100 200 735
Mechanical
CAES2016 20 50 100 10000 50000 100000 35 40 50 2 6
2030 20 50 100 10000 50000 100000 35 40 50 2 6
Flywheel2016 15 20 25 100000 200000 1000000 75 85 90 20 200
2030 23 30 38 151259 302518 1512590 75 85 90 20 200
PHS2016 30 60 100 12000 50000 100000 80 90 100 0 2
2030 30 60 100 12000 50000 100000 80 90 100 0 2

126 ELECTRICITY STORAGE AND RENEWABLES: COSTS AND MARKETS TO 2030
Annex 2: Cost of service tool methodology
The electricity storage "Cost of Service Tool" that accompanies this report is available for download from the IRENA publications page of this report (www.irena.org/publications). The excel sheet contains basic instructions on how to use the tool. This annex describes the methodology used by the tool.
Calculation of the investment-related annuities
Energy storage unitThe investment cost of the energy storage unit is calculated using the given energy- and power installation cost
of the energy storage unit, as well as the required power and E/P-ratio of the application:
• CESU: Investment cost of the energy storage unit [USD]• PApplication: Power demand of the given application [kW]• CEIC,ESU: Energy installation cost of the selected energy storage unit [USD/kWh]• E/Pratio: Relationship between power- and energy capacity in the given Application [kWh/kW]• CPIC,ESU: Power installation cost of the selected energy storage unit [USD/kW]
Note: For electrochemical storage systems, the power installation cost is set to zero, as their capacity and power cannot be separated. Only vanadium redox flow batteries, whose energy and power capacities can be designed independently, are implemented separately.
The resulting annuities of the electricity storage system are calculated as follows:• lESU: lifetime of the energy storage unit• i: interest rate
Note: Depending on the application, the lifetime of the energy storage unit is defined by its calendric or cyclic lifetime (the smaller value defines the lifetime).
Power conversion unitThe investment cost of the power conversion unit is calculated, using the given power installation cost and installed power:
𝐶𝐶𝐶𝐶𝐸𝐸𝐸𝐸𝐸𝐸𝐸𝐸𝐸𝐸𝐸𝐸 = 𝑃𝑃𝑃𝑃𝐴𝐴𝐴𝐴𝐴𝐴𝐴𝐴𝐴𝐴𝐴𝐴𝐴𝐴𝐴𝐴𝐴𝐴𝐴𝐴𝐴𝐴𝐴𝐴𝐴𝐴𝐴𝐴𝐴𝐴𝐴𝐴𝐴𝐴𝐴𝐴𝐴𝐴𝐴𝐴𝐴𝐴𝐴𝐴 ∗ �𝐶𝐶𝐶𝐶𝐸𝐸𝐸𝐸𝐸𝐸𝐸𝐸𝐸𝐸𝐸𝐸,𝐸𝐸𝐸𝐸𝐸𝐸𝐸𝐸𝐸𝐸𝐸𝐸 ∗ 𝐸𝐸𝐸𝐸 𝑃𝑃𝑃𝑃� 𝑟𝑟𝑟𝑟𝐴𝐴𝐴𝐴𝐴𝐴𝐴𝐴𝐴𝐴𝐴𝐴𝐴𝐴𝐴𝐴+ 𝐶𝐶𝐶𝐶𝑃𝑃𝑃𝑃𝐸𝐸𝐸𝐸𝐸𝐸𝐸𝐸,𝐸𝐸𝐸𝐸𝐸𝐸𝐸𝐸𝐸𝐸𝐸𝐸�,
𝐴𝐴𝐴𝐴𝐸𝐸𝐸𝐸𝐸𝐸𝐸𝐸𝐸𝐸𝐸𝐸 = 𝐶𝐶𝐶𝐶𝐸𝐸𝐸𝐸𝐸𝐸𝐸𝐸𝐸𝐸𝐸𝐸 ∗(1+𝑖𝑖𝑖𝑖)𝑙𝑙𝑙𝑙𝐸𝐸𝐸𝐸𝐸𝐸𝐸𝐸𝐸𝐸𝐸𝐸−1
𝑙𝑙𝑙𝑙𝐸𝐸𝐸𝐸𝐸𝐸𝐸𝐸𝐸𝐸𝐸𝐸,
𝐶𝐶𝐶𝐶𝑃𝑃𝑃𝑃𝑃𝑃𝑃𝑃𝑃𝑃𝑃𝑃 = 𝑃𝑃𝑃𝑃𝐴𝐴𝐴𝐴𝐴𝐴𝐴𝐴𝐴𝐴𝐴𝐴𝐴𝐴𝐴𝐴𝐴𝐴𝐴𝐴𝐴𝐴𝐴𝐴𝐴𝐴𝐴𝐴𝐴𝐴𝐴𝐴𝐴𝐴𝐴𝐴𝐴𝐴𝐴𝐴𝐴𝐴𝐴𝐴 ∗ 𝐶𝐶𝐶𝐶𝑃𝑃𝑃𝑃𝑃𝑃𝑃𝑃𝑃𝑃𝑃𝑃,𝑃𝑃𝑃𝑃𝑃𝑃𝑃𝑃𝑃𝑃𝑃𝑃,

127ELECTRICITY STORAGE AND RENEWABLES: COSTS AND MARKETS TO 2030
• CPCU: Investment cost of the power conversion unit [USD]• PApplication: Power demand of the given application [kW]• CPIC,PCU: Power installation cost of the selected power storage unit [USD/kW]
The resulting annuities of the power conversion unit are calculated as follows:
Note: Nomenclature as above. If no power conversion unit is needed (e.g. in a DC-connected nano-grid, “no inverter” can be selected for a cost-neutral calculation.
Other investment costsAdditional investment costs can arise for purchasing and/or clearing of a suitable site, as well as system installation costs.
Note: Nomenclature as above.
Sum of the investment related annuitiesThe sum of the investment-related annuities is given by:
Note: Nomenclature as above.
Calculation of the operational costs
Efficiency lossesThe efficiency losses of the storage system are calculated as follows:
𝐴𝐴𝐴𝐴𝑆𝑆𝑆𝑆𝑆𝑆𝑆𝑆𝑆𝑆𝑆𝑆𝑆𝑆𝑆𝑆𝑆𝑆𝑆𝑆𝑆𝑆𝑆𝑆𝑆𝑆𝑆𝑆 𝑆𝑆𝑆𝑆𝑆𝑆𝑆𝑆𝑆𝑆𝑆𝑆𝑆𝑆𝑆𝑆𝑆𝑆𝑆𝑆𝑆𝑆𝑆𝑆 = 𝐶𝐶𝐶𝐶𝑆𝑆𝑆𝑆𝑆𝑆𝑆𝑆𝑆𝑆𝑆𝑆𝑆𝑆𝑆𝑆𝑆𝑆𝑆𝑆𝑆𝑆𝑆𝑆𝑆𝑆𝑆𝑆 𝑆𝑆𝑆𝑆𝑆𝑆𝑆𝑆𝑆𝑆𝑆𝑆𝑆𝑆𝑆𝑆𝑆𝑆𝑆𝑆𝑆𝑆𝑆𝑆 ∗(1 + 𝑖𝑖𝑖𝑖)𝑙𝑙𝑙𝑙𝐸𝐸𝐸𝐸𝐸𝐸𝐸𝐸𝐸𝐸𝐸𝐸 − 1
𝑙𝑙𝑙𝑙𝐸𝐸𝐸𝐸𝑆𝑆𝑆𝑆𝐸𝐸𝐸𝐸
𝐴𝐴𝐴𝐴𝑂𝑂𝑂𝑂𝑂𝑂𝑂𝑂ℎ𝑒𝑒𝑒𝑒𝑒𝑒𝑒𝑒 = 𝐶𝐶𝐶𝐶𝑂𝑂𝑂𝑂𝑂𝑂𝑂𝑂ℎ𝑒𝑒𝑒𝑒𝑒𝑒𝑒𝑒,𝐼𝐼𝐼𝐼𝐼𝐼𝐼𝐼𝐼𝐼𝐼𝐼𝑒𝑒𝑒𝑒𝐼𝐼𝐼𝐼𝑂𝑂𝑂𝑂 ∗(1 + 𝑖𝑖𝑖𝑖)𝑙𝑙𝑙𝑙𝐸𝐸𝐸𝐸𝐸𝐸𝐸𝐸𝐸𝐸𝐸𝐸 − 1
𝑙𝑙𝑙𝑙𝐸𝐸𝐸𝐸𝐸𝐸𝐸𝐸𝐸𝐸𝐸𝐸
𝐴𝐴𝐴𝐴𝑆𝑆𝑆𝑆𝑆𝑆𝑆𝑆𝑆𝑆𝑆𝑆𝑆𝑆𝑆𝑆𝑆𝑆𝑆𝑆𝑆𝑆𝑆𝑆𝑆𝑆𝑆𝑆 𝑆𝑆𝑆𝑆𝑆𝑆𝑆𝑆𝑆𝑆𝑆𝑆𝑆𝑆𝑆𝑆𝑆𝑆𝑆𝑆𝑆𝑆𝑆𝑆 = 𝐴𝐴𝐴𝐴𝐸𝐸𝐸𝐸𝑆𝑆𝑆𝑆𝐸𝐸𝐸𝐸 + 𝐴𝐴𝐴𝐴𝑃𝑃𝑃𝑃𝑃𝑃𝑃𝑃𝐸𝐸𝐸𝐸 + 𝐴𝐴𝐴𝐴𝑂𝑂𝑂𝑂𝑆𝑆𝑆𝑆ℎ𝑆𝑆𝑆𝑆𝑆𝑆𝑆𝑆
𝑂𝑂𝑂𝑂𝐸𝐸𝐸𝐸𝐸𝐸𝐸𝐸 = 𝑃𝑃𝑃𝑃𝐴𝐴𝐴𝐴𝐴𝐴𝐴𝐴𝐴𝐴𝐴𝐴𝐴𝐴𝐴𝐴𝐴𝐴𝐴𝐴𝐴𝐴𝐴𝐴𝐴𝐴𝐴𝐴𝐴𝐴𝐴𝐴𝐴𝐴𝐴𝐴𝐴𝐴𝐴𝐴𝐴𝐴𝐴𝐴 ∗ 𝐸𝐸𝐸𝐸 𝑃𝑃𝑃𝑃� 𝑟𝑟𝑟𝑟𝐴𝐴𝐴𝐴𝐴𝐴𝐴𝐴𝐴𝐴𝐴𝐴𝐴𝐴𝐴𝐴∗ 𝐶𝐶𝐶𝐶𝐶𝐶𝐶𝐶𝐶𝐶𝐶𝐶𝐶𝐶𝐶𝐶𝐶𝐶𝐶𝐶𝐶𝐶𝐶𝐶 𝑝𝑝𝑝𝑝𝐶𝐶𝐶𝐶𝑝𝑝𝑝𝑝 𝑑𝑑𝑑𝑑𝑑𝑑𝑑𝑑𝐶𝐶𝐶𝐶 ∗ 365 ∗ 𝐶𝐶𝐶𝐶𝐸𝐸𝐸𝐸𝐴𝐴𝐴𝐴𝐸𝐸𝐸𝐸𝐴𝐴𝐴𝐴𝐴𝐴𝐴𝐴𝑟𝑟𝑟𝑟𝐴𝐴𝐴𝐴𝐴𝐴𝐴𝐴𝐴𝐴𝐴𝐴𝐴𝐴𝐴𝐴𝐸𝐸𝐸𝐸 ∗ (𝐸𝐸𝐸𝐸𝐸𝐸𝐸𝐸𝐸𝐸𝐸𝐸𝐸𝐸𝐸𝐸 ∗ 𝐸𝐸𝐸𝐸𝑃𝑃𝑃𝑃𝑃𝑃𝑃𝑃𝐸𝐸𝐸𝐸),

128 ELECTRICITY STORAGE AND RENEWABLES: COSTS AND MARKETS TO 2030
• OEL: Operational cost due to efficiency losses [USD/a]• PApplication: Power demand of the given application [kW]• E/Pratio: Relationship between power and energy capacities in the given Application [kWh/kW]• Cycles per day: Average equivalent full cycles of the energy storage unit in the given application• CElectricity: Electricity price in the given application [USD/kWh]• EESU: Efficiency of the selected energy storage unit [%]• EPCU: Efficiency of the selected power conversion unit [%]
Self-dischargeThe self-discharge losses of the storage system are calculated as follows:
• OSD: Operational cost due to self-discharge losses [USD/a]• PApplication: Power demand of the given application [kW]• E/Pratio: Relationship between power and energy capacities in the given Application [kWh/kW]• Self discharge rate: Self-discharge rate of the selected energy storage unit [%/d]• CElectricity: Electricity price in the given application [USD/kWh]
Maintenance costsDepending on the given conditions, maintenance costs can be a major cost factor (e.g. when there is high humidity or salt spray) Maintenance costs for the energy storage unit and the power conversion unit are considered as follows:
• OM: Maintenance cost of the storage system [USD/a]• CESU: Investment cost of the energy storage unit [USD]• MESU: Maintenance requirement of the energy storage unit [%]• CPCU: Investment cost of the power conversion unit [USD]• MPCU: Maintenance requirement of the power conversion unit [%]
Other operational costsIf additional operational costs O_other arise (i.e. for rental or other services), they can be considered in the calculation.
𝑂𝑂𝑂𝑂𝑆𝑆𝑆𝑆𝑆𝑆𝑆𝑆 = 𝑃𝑃𝑃𝑃𝐴𝐴𝐴𝐴𝐴𝐴𝐴𝐴𝐴𝐴𝐴𝐴𝐴𝐴𝐴𝐴𝐴𝐴𝐴𝐴𝐴𝐴𝐴𝐴𝐴𝐴𝐴𝐴𝐴𝐴𝐴𝐴𝐴𝐴𝐴𝐴𝐴𝐴𝐴𝐴𝐴𝐴𝐴𝐴 ∗ 𝐸𝐸𝐸𝐸 𝑃𝑃𝑃𝑃� 𝑟𝑟𝑟𝑟𝐴𝐴𝐴𝐴𝐴𝐴𝐴𝐴𝐴𝐴𝐴𝐴𝐴𝐴𝐴𝐴∗ 𝑆𝑆𝑆𝑆𝑆𝑆𝑆𝑆𝑆𝑆𝑆𝑆𝑆𝑆𝑆𝑆 𝑑𝑑𝑑𝑑𝑑𝑑𝑑𝑑𝑑𝑑𝑑𝑑𝑑𝑑𝑑𝑑ℎ𝑎𝑎𝑎𝑎𝑎𝑎𝑎𝑎𝑎𝑎𝑎𝑎𝑆𝑆𝑆𝑆 𝑎𝑎𝑎𝑎𝑎𝑎𝑎𝑎𝑟𝑟𝑟𝑟𝑆𝑆𝑆𝑆 ∗ 365 ∗ 𝐶𝐶𝐶𝐶𝐸𝐸𝐸𝐸𝐴𝐴𝐴𝐴𝐸𝐸𝐸𝐸𝐴𝐴𝐴𝐴𝐴𝐴𝐴𝐴𝑟𝑟𝑟𝑟𝐴𝐴𝐴𝐴𝐴𝐴𝐴𝐴𝐴𝐴𝐴𝐴𝐴𝐴𝐴𝐴𝐸𝐸𝐸𝐸,
𝑂𝑂𝑂𝑂𝑀𝑀𝑀𝑀 = 𝐶𝐶𝐶𝐶𝐸𝐸𝐸𝐸𝐸𝐸𝐸𝐸𝐸𝐸𝐸𝐸 ∗ 𝑀𝑀𝑀𝑀𝐸𝐸𝐸𝐸𝐸𝐸𝐸𝐸𝐸𝐸𝐸𝐸 + 𝐶𝐶𝐶𝐶𝑃𝑃𝑃𝑃𝑃𝑃𝑃𝑃𝐸𝐸𝐸𝐸 ∗ 𝑀𝑀𝑀𝑀𝑃𝑃𝑃𝑃𝑃𝑃𝑃𝑃𝐸𝐸𝐸𝐸,

129ELECTRICITY STORAGE AND RENEWABLES: COSTS AND MARKETS TO 2030
Sum of the operational costsThe sum of the operational costs is calculated as follows:
Note: Nomenclature as above.
Calculation of the cost of service Depending on the type of application, the cost of service of the storage system is calculated by reference to its installed power or to its total energy throughput:
Energy applicationsThe majority of storage systems are mainly used and sized based on the need to provide energy services in applications, while the exact amount of power is generally less important, (this is especially true in some applications, such as home storage systems, island grids, time-of-use management). The cost of energy storage provision is calculated as follows:
• COSEnergy: Cost of Service [USD/kWh]• AStorage System: Sum of the investment-related annuities [USD/a]• OStorage System: Sum of the operational costs [USD/a]• PApplication: Power demand of the given application [kW]• E/Pratio: Relationship between power and energy capacities in the given Application [kWh/kW]• Cycles per day: Average equivalent full cycles of the energy storage unit in the given application
Power applicationsWith less importance given to the exact amount of energy (e.g. frequency regulation) power applications for storage systems have their cost of service calculated as follows:
COSPower: Cost of Service [USD/kWh]AStorage System: Sum of the investment-related annuities [USD/a]OStorage System: Sum of the operational costs [USD/a]PApplication: Power demand of the given application [kW]
𝑂𝑂𝑂𝑂𝑆𝑆𝑆𝑆𝑆𝑆𝑆𝑆𝑆𝑆𝑆𝑆𝑆𝑆𝑆𝑆𝑆𝑆𝑆𝑆𝑆𝑆𝑆𝑆𝑆𝑆𝑆𝑆 𝑆𝑆𝑆𝑆𝑆𝑆𝑆𝑆𝑆𝑆𝑆𝑆𝑆𝑆𝑆𝑆𝑆𝑆𝑆𝑆𝑆𝑆𝑆𝑆 = 𝑂𝑂𝑂𝑂𝐸𝐸𝐸𝐸𝐸𝐸𝐸𝐸 + 𝑂𝑂𝑂𝑂𝑆𝑆𝑆𝑆𝑆𝑆𝑆𝑆 + 𝑂𝑂𝑂𝑂𝑀𝑀𝑀𝑀 + 𝑂𝑂𝑂𝑂𝑂𝑂𝑂𝑂𝑆𝑆𝑆𝑆ℎ𝑆𝑆𝑆𝑆𝑆𝑆𝑆𝑆
𝐶𝐶𝐶𝐶𝐶𝐶𝐶𝐶𝐶𝐶𝐶𝐶𝐸𝐸𝐸𝐸𝐸𝐸𝐸𝐸𝐸𝐸𝐸𝐸𝐸𝐸𝐸𝐸𝐸𝐸𝐸𝐸𝐸𝐸𝐸𝐸 =𝐴𝐴𝐴𝐴𝑆𝑆𝑆𝑆𝑆𝑆𝑆𝑆𝑆𝑆𝑆𝑆𝐸𝐸𝐸𝐸𝑆𝑆𝑆𝑆𝐸𝐸𝐸𝐸𝐸𝐸𝐸𝐸 𝑆𝑆𝑆𝑆𝐸𝐸𝐸𝐸𝑆𝑆𝑆𝑆𝑆𝑆𝑆𝑆𝐸𝐸𝐸𝐸𝑆𝑆𝑆𝑆 + 𝐶𝐶𝐶𝐶𝑆𝑆𝑆𝑆𝑆𝑆𝑆𝑆𝑆𝑆𝑆𝑆𝐸𝐸𝐸𝐸𝑆𝑆𝑆𝑆𝐸𝐸𝐸𝐸𝐸𝐸𝐸𝐸 𝑆𝑆𝑆𝑆𝐸𝐸𝐸𝐸𝑆𝑆𝑆𝑆𝑆𝑆𝑆𝑆𝐸𝐸𝐸𝐸𝑆𝑆𝑆𝑆
𝑃𝑃𝑃𝑃𝐴𝐴𝐴𝐴𝐴𝐴𝐴𝐴𝐴𝐴𝐴𝐴𝐴𝐴𝐴𝐴𝐴𝐴𝐴𝐴𝐴𝐴𝐴𝐴𝐴𝐴𝐴𝐴𝐴𝐴𝐴𝐴𝐴𝐴𝐴𝐴𝐴𝐴𝐴𝐴𝐴𝐴𝐴𝐴 ∗ 𝐸𝐸𝐸𝐸 𝑃𝑃𝑃𝑃� 𝑟𝑟𝑟𝑟𝐴𝐴𝐴𝐴𝐴𝐴𝐴𝐴𝐴𝐴𝐴𝐴𝐴𝐴𝐴𝐴∗ 𝐶𝐶𝐶𝐶𝐶𝐶𝐶𝐶𝐴𝐴𝐴𝐴𝐴𝐴𝐴𝐴𝐶𝐶𝐶𝐶𝐶𝐶𝐶𝐶 𝐴𝐴𝐴𝐴𝐶𝐶𝐶𝐶𝑟𝑟𝑟𝑟 𝑑𝑑𝑑𝑑𝐴𝐴𝐴𝐴𝐶𝐶𝐶𝐶 ∗ 365
𝐶𝐶𝐶𝐶𝐶𝐶𝐶𝐶𝐶𝐶𝐶𝐶𝑃𝑃𝑃𝑃𝑃𝑃𝑃𝑃𝑃𝑃𝑃𝑃𝑃𝑃𝑃𝑃𝑃𝑃𝑃𝑃 =𝐴𝐴𝐴𝐴𝑆𝑆𝑆𝑆𝑆𝑆𝑆𝑆𝑃𝑃𝑃𝑃𝑃𝑃𝑃𝑃𝑆𝑆𝑆𝑆𝑆𝑆𝑆𝑆𝑃𝑃𝑃𝑃 𝑆𝑆𝑆𝑆𝑆𝑆𝑆𝑆𝑆𝑆𝑆𝑆𝑆𝑆𝑆𝑆𝑃𝑃𝑃𝑃𝑆𝑆𝑆𝑆 + 𝐶𝐶𝐶𝐶𝑆𝑆𝑆𝑆𝑆𝑆𝑆𝑆𝑃𝑃𝑃𝑃𝑃𝑃𝑃𝑃𝑆𝑆𝑆𝑆𝑆𝑆𝑆𝑆𝑃𝑃𝑃𝑃 𝑆𝑆𝑆𝑆𝑆𝑆𝑆𝑆𝑆𝑆𝑆𝑆𝑆𝑆𝑆𝑆𝑃𝑃𝑃𝑃𝑆𝑆𝑆𝑆
𝑃𝑃𝑃𝑃𝐴𝐴𝐴𝐴𝐴𝐴𝐴𝐴𝐴𝐴𝐴𝐴𝐴𝐴𝐴𝐴𝐴𝐴𝐴𝐴𝐴𝐴𝐴𝐴𝐴𝐴𝐴𝐴𝐴𝐴𝐴𝐴𝐴𝐴𝐴𝐴𝐴𝐴𝐴𝐴𝐴𝐴𝐴𝐴

130 ELECTRICITY STORAGE AND RENEWABLES: COSTS AND MARKETS TO 2030

131ELECTRICITY STORAGE AND RENEWABLES: COSTS AND MARKETS TO 2030

132 ELECTRICITY STORAGE AND RENEWABLES: COSTS AND MARKETS TO 2030
www.i rena.orgCopyright © IRENA