electricity production from carbon monoxide and
TRANSCRIPT
ELECTRICITY PRODUCTION FROM CARBON MONOXIDE
AND SYNTHESIS GAS IN A MICROBIAL FUEL CELL
Abid Hussain
Department of Bioresource Engineering
Faculty of Agricultural and Environmental Sciences
Macdonald Campus of McGill University
Ste-Anne-De-Bellevue, Quebec, Canada
March 2013
A Thesis Submitted to McGill University in partial fulfillment of the requirements for the
degree of Doctor of Philosophy
© Abid Hussain 2013
i
ABSTRACT
Synthesis gas (syngas), which primarily consists of carbon monoxide (CO) and hydrogen
(H2), is a versatile energy carrier that can be converted to gaseous and liquid fuels or can be
used for electricity production. While the ability of CO and syngas to serve as sole electron
donors for electricity production in a microbial fuel cell (MFC) was recently demonstrated,
this study has focused on MFC design improvements for performance enhancement on
CO/syngas and elucidation of microbial communities, and biotransformation pathways
involved in electricity production from CO/syngas in an MFC.
One of the primary challenges for an efficient bioconversion of CO and syngas is the low
solubility of these gaseous substrates in the aqueous phase. The first study of this thesis
demonstrated the applicability of silicone membrane systems for improved CO transfer into
the anodic liquid of MFCs. The incorporation of flat silicone membrane and thin wall silicone
tubing into the anodic chamber of CO-fed MFCs led to improved CO transformation
efficiency and correspondingly improved MFC performance. A CO transformation efficiency
of 77 % and maximum power output of 18 mW -1
RL (normalized to anodic compartment
volume) was achieved for silicone membrane installed MFC. A comparably higher CO
transformation efficiency of 98 % was obtained for silicone tubing installed MFC, but the
high dissolved CO concentrations in the anodic liquid partially inhibited the microbial activity,
thereby lowering the maximum power output to 13 mW -1
RL .
Efficient gas transfer also allowed for focusing on the process microbiology. The
microbial communities and biotransformation pathways prevalent in two mesophilic CO-fed
MFCs were elucidated in the second study. The identification of the microorganisms
ii
belonging to the genera Geobacter, Desulfovibrio, and Clostridium, along with the detection
of acetate as the primary metabolic product in both MFCs; affirmed our hypothesis that
electricity production from CO/syngas in a mesophilic MFC is primarily accomplished by a
two-step process, where CO/syngas is first converted to acetate by homo-acetogenic and
carboxdotrophic microorganisms, and the acetate is then utilized by CO-tolerant acetate
oxidizing electricigenic microorganisms.
Considering that syngas is primarily a hot gas, the bioconversion of CO/syngas to
electricity in an MFC was also tested at thermophilic temperature of 50 °C. Silicone tubing
was used for syngas delivery and the anodic design was improved to increase the microbial
density. An improved volumetric power output of 33-35 mW -1
RL and syngas conversion
efficiency of 87-98 % was achieved. Also an improved Coulombic efficiency (CE) of 26 %
was obtained. The analysis of the anodic microbial communities and metabolic products,
along with single substrate tests where MFC was operated solely on CO or H2, revealed that
similar to mesophilic MFCs electricity generation from syngas at thermophilic temperatures
also occurred through syngas conversion to acetate followed by its oxidation by CO-tolerant
electricigenic microorganisms.
In the final study of this thesis, the applicability of a multi-electrode design containing
three anodes and two cathodes to achieve high volumetric power output and CE on syngas
was evaluated at several operating temperatures ranging from 37 °C to 50 °C. Also, the
impact of different anode-cathode arrangements on power output was examined. The multi-
electrode configuration considerably enhanced the system performance and provided a
compact system design which could have major economic and operational implications for
large scale syngas-fed MFC systems. A maximum power density of 33 mW -1
RL and CE of
iii
43 % was achieved at an operating temperature of 37 °C. The MFC performance at elevated
temperatures was restricted by low thermophilic microbial activity. Consequently, a much
lower power density of 10 mW -1
RL and a CE of 15 % were obtained at 50 °C. The MFC
power density was greatly impacted by the anode-cathode arrangement and the highest
power density was achieved in a three anode-two cathode (3A-2C) arrangement.
The findings presented in this thesis could be utilized for further improvements in the
reactor design and biological system of CO/syngas-fed MFCs for making such contraptions
suitable for commercial applications. An MFC based process could also be used to combine
electricity production with hydrogen extraction from syngas or in a combination with syngas
transformation to valuable fermentation products.
iv
RÉSUMÉ
Composé principalement de monoxyde de carbone (CO) et d’hydrogène (H2), le gaz de
synthèse est un vecteur énergétique polyvalent, qui peut être converti en un combustible
liquide ou gazeux ou peut servir à la production d’électricité. La capacité du CO ou de gaz de
synthèse à servir comme unique donneur d'électrons dans la production d’électricité dans une
pile à combustible microbienne (PCM) ayant été récemment démontrée, la présente étude visa
l’obtention d’un gain d’éfficacité de production, avec soit du CO ou du gaz de synthèse
comme combustible, grâce à un aménagement amélioré de la PCM. L’étude visa aussi à
élucider les communautés microbiennes et voies de biotransformation liées à la production
d’électricité à partir de CO ou de gaz de synthèse dans une PCM.
Un des principaux défis à une hausse d’efficacité de bioconversion de CO ou de gaz de
synthèse est la faible solubilité en phase aqueuse de ces substrats gazeux. Le premier volet de
ce travail démontra l’applicabilité de systèmes à membrane de silicone pour réaliser un
transfert accru de CO vers l’anode liquide du PCM. L’intégration d’une membrane plane en
silicone ou de tube en silicone à parois minces dans la chambre anodique d’une PCM
alimentée en CO, a permis d’atteindre une éfficacité de transformation de CO accrue, et par
conséquente une performance améliorée de la PCM. Une efficacité de transformation de CO
de 77% et une puissance maximale de 18 mW -1
RL (normalisée selon le volume de la chambre
anodique) furent obtenues pour une PCM équipée d’une membrane en silicone. Une efficacité
de transformation de CO comparativement plus élevée (98%) fut obtenue pour une PCM
équipée de tube en silicone à parois minces, mais la concentration éleve de CO dissoute dans
le liquide anodique enraya en partie l’activité microbienne, baissant ainsi la puissance
maximale à 13 mW -1
RL .

v
Un transfer gazeux efficace permetta de mettre l’accent sur le processus microbiologique.
En un second volet, les communautés microbiennes et voies de biotransformation prévalentes
dans deux PCM mésophiliques alimentées en CO furent élucidés. L’identification de
microorganismes appartenants aux genres Geobacter, Desulfovibrio, et Clostridium, ainsi que
la détection d’acétate comme principal produit métabolique dans les deux PCM, confirma
notre hypothèse que la production d’électricité à partir de CO ou de gaz de synthèse dans une
PCM mésophilique s’opère principalement en deux étapes: (i) le CO ou gaz de synthèse est
premièrement converti en acétate par des carboxydobactéries et bactéries homoacétogéniques,
puis (ii) l’acétate est oxydé par des microorganismes électrigènes tolérants au CO.
Le gaz de synthèse étant principalement un gaz chaud, la bioconversion de CO ou de gaz
de synthèse dans une PCM fut évalue sous des condition thermophiles à 50 °C. Le tube de
silicone servant à livrer le gaz de synthèse et l’aménagement de l’anode furent améliorés afin
d’augmenter la densité microbienne. Une puissance volumétrique accrue (33-35 mW -1
RL ) et
une éfficacité de conversion de gaz de synthèse de 87-98% furent atteintes. De plus une
efficacité coulombienne (EC) de 26% fut atteinte. Une analyse des communautés
microbiennes anodiques et de leur métabolites, ainsi que des essais à substrat unique, où les
PCM fonctionnèrent avec du CO ou du H2 seulement, démontrèrent que, semblable à la
production d’électricité par des PCM mésophiles, la production d’électricité à partir de gaz de
synthèse à des températures thermophiles opéra par conversion du gaz de synthèse en acétate,
suivi de son oxydation par des microorganismes électrigènes tolérants au CO.
Dans le dernier volet de cette étude, la faisabilité d’une configuration à multiples
électrodes (3 anodes, 2 cathodes) visant à permettre des PCMs consommant du gaz de
synthèse à obtenir une puissance volumétrique et une EC accrue, fut évaluée à des

vi
températures de 37 °C à 50 °C. L’influence de la position dans laquelle les anodes et cathodes
furent disposées sur la puissance générée fut évalue. Une configuration multi-électrode
augmenta considérablement la performance du système et donna lieu à un système compact
pouvant avoir d’importantes implications opérationnelles et économiques pour des systèmes
PCM à grande échelle consommant du gaz de synthèse. Une densité de puissance maximale
de 33 m-1 -1
RL et une CE de 43 % furent atteintes à une température de fonctionnement de
37 °C. La performance de la PCM à de plus hautes températures fut limitée par la faible
activité des microbes thermophiles. Consequemment, une densité de puissance beaucoup plus
faible de 10 mW -1
RL et une CE de 15% furent obtenues à 50 °C. La densité de puissance
d’une PCM fut largement influencée par la disposition et le nombre des anodes de cathodes.
Un arrangement trois anodes-deux cathodes (3A-2C) offrant la plus grande puissance.
Les présents constats pourraient servir à l’amélioration de l’aménagement de tels
reacteurs et du système biologique de PCMs ayant du CO ou du gaz de synthèse comme
combustible. Un procédé opérant avec une PCM pourrait aussi servir à combiner la
production d’électricité avec l’extraction d’hydrogène du gaz de synthèse, ou en combinaison
avec une transformation du gaz de synthèse en produits de fermentation ayant une valeur
ajoutée.
vii
ACKNOWLEDGEMENTS
My deepest gratitude to all those who provided the wherewithal and invaluable
support, guidance and assistance required for the culmination of this work in a befitting
manner and to my satisfaction.
My sincere thanks to Dr. Vijaya Raghavan for his endless support and guidance in
academic and personal affairs alike. Your achievements are truly awe inspiring and have
always motivated me to stretch beyond my comfort zone and explore new horizons with
vigour and zeal. It was a matter of great privilege and pride to have worked under such a
learned guru. I shall remain indebted to you for giving me this opportunity and above all
believing in me!
I am indebted to Dr. Boris Tartakovsky for his invaluable guidance, support and
patience. Your scrupulous planning, organizational skills, strive for perfection and positive
criticism were not only instrumental for the satisfactory completion of this project but also in
shaping my work ethics and professional career. It goes without saying that this project would
not have been possible without you.
I earnestly thank Punita Mehta, Guido Santoyo, Guillaume Bruant, Michelle Manuel
and other staff at the Biotechnology Research Institute for their technical assistance and
guidance in every part of this work.
My special thanks to Tingting, Meenakshi, Raja, Ashutosh, Gopu, Satya, Kumaran,
Kumar, Venki, Rakesh, Rahul, Mathiu, Archi and all other friends for motivation and moral
support.

viii
I acknowledge the help and support provided by Ms. Susan Gregus, Ms. Abida
Subhan and Ms. Patricia Singleton in processing all the paper work in a timely and efficient
manner.
I am grateful to my parents, Brig. Asif Hussain and Zareen Alam and my sister Shirin,
for their never-ending support, love and care, and motivational presence despite being
11295.2 km away.
The financial support of Natural Sciences and Engineering Research Council of
Canada (NSERC), Natural Resources Canada and the National Research Council of Canada
(NRC) is gratefully acknowledged.

ix
CONTRIBUTIONS OF THE AUTHORS
Abid Hussain is the principle author of this work which was supervised by Dr. Boris
Tartakovsky from the Biotechnology Research Institute (BRI), National Research Council of
Canada, Montréal, Québec, and Dr. Vijaya Raghavan from the Department of Bioresource
Engineering, McGill University, Ste-Anne-de-Bellevue, Québec, Canada. The entire
experimental work was performed at the Environmental Bioengineering facility at BRI. Ms.
Punita Mehta and Dr. Guillaume Bruant from BRI were personally involved in giving valid
suggestions in every stage of this study and provided technical assistance for microbiological
studies. Dr. Serge Guiot from BRI provided expert guidance and made immense contribution
in reviewing and improving the writing of the manuscripts mentioned below.
The authors of the first manuscript in this thesis entitled “Electricity production from
carbon monoxide and synthesis gas in a microbial fuel cell” and published in Journal of
Applied Microbiology and Biotechnology (2011), are Abid Hussain, Punita Mehta, Vijaya
Raghavan, Serge Guiot and Boris Tartakovsky. The authors of the second manuscript entitled
“Use of silicone membranes to enhance gas transfer during microbial fuel cell operation on
carbon monoxide” and published in Journal of Bioresource Technology (2011), are Abid
Hussain, Boris Tartakovsky, Serge Guiot and Vijaya Raghavan. The contributors of the third
manuscript entitled “Population analysis of mesophilic microbial fuel cells fed with carbon
monoxide” and submitted in Journal of Applied Biochemistry and Biotechnology (2013) are
Abid Hussain, Punita Mehta, Guillaume Bruant, Vijaya Raghavan, Boris Tartakovsky and
Serge Guiot. The authors of the fourth manuscript in this thesis entitled “The performance of
a thermophilic microbial fuel cell fed with synthesis gas” and published in Journal of Enzyme
and Microbial Technology (2012), are Abid Hussain, Punita Mehta, Vijaya Raghavan, Serge

x
Guiot and Boris Tartakovsky. The contributors of the fifth manuscript entitled “Electricity
production from synthesis gas in a multi-electrode microbial fuel cell” and accepted for
publication in Journal of Chemical Technology and Biotechnology (2013), are Abid Hussain,
Vijaya Raghavan, Serge Guiot and Boris Tartakovsky.

xi
TABLE OF CONTENTS
ABSTRACT ................................................................................................................................... i
RÉSUMÉ......................................................................................................................................iv
ACKNOWLEDGEMENTS........................................................................................................vii
CONTRIBUTIONS OF THE AUTHORS...................................................................................ix
LIST OF TABLES......................................................................................................................xv
LIST OF FIGURES....................................................................................................................xvi
CHAPTER 1 General Introduction ............................................................................................... 1
1.1 Motivation ........................................................................................................................... 1
1.2 Problem Statement .............................................................................................................. 3
1.3 Objective ............................................................................................................................. 4
1.3.1 Specific Objectives ....................................................................................................... 4
CHAPTER 2 Review of Literature .............................................................................................. 5
2.1 Microbial Fuel Cells (MFC) ................................................................................................ 5
2.2 Calculations and procedures of reporting data .................................................................... 8
2.3 Electricity production from CO and syngas in an MFC ................................................... 11
2.4 Microbial community of a CO and syngas-fed MFC ........................................................ 15
2.4.1 Syngas conversion to electricity by acetogenic and electricigenic microorganisms .. 15
2.4.2 Syngas conversion to electricity by hydrogenogenic and electricigenic
microorganisms....................................................................................................................21
2.4.3 Direct Conversion of CO to electricity by axenic cultures of Fe(III) and sulfate
reducing thermophiles ......................................................................................................... 23
2.5 Design considerations for electricity generation from CO/syngas in an MFC ................. 25
2.5.1 Membrane systems for improved mass transfer efficiency ........................................ 25
2.5.2 Non-noble catalysts for improved cathode stability ................................................. 30
2.6 Perspectives ....................................................................................................................... 31
2.7 References ......................................................................................................................... 32

xii
CHAPTER 3 Use of silicone membranes to enhance gas transfer during microbial fuel cell
operation on carbon monoxide.................................................................................................... 40
3.1 Abstract ............................................................................................................................. 40
3.2 Introduction ....................................................................................................................... 41
3.3 Materials and Methods ...................................................................................................... 43
3.3.1 Membrane systems for CO transfer ............................................................................ 43
3.3.2 Volumetric mass transfer coefficient estimation ........................................................ 44
3.3.3 Medium composition, inoculum and analytical methods ........................................... 45
3.3.4 MFC design, Operation and Characterization ............................................................ 46
3.4 Results and Discussion ...................................................................................................... 51
3.4.1 Estimation of KLa ....................................................................................................... 51
3.4.2 MFC tests .................................................................................................................... 52
3.5 Conclusion ......................................................................................................................... 65
3.6 References ......................................................................................................................... 66
CHAPTER 4 Population analysis of mesophilic microbial fuel cells fed with carbon
monoxide..................................................................................................................................... 70
4.1 Abstract ............................................................................................................................. 70
4.2 Introduction ....................................................................................................................... 71
4.3 Materials and Methods ...................................................................................................... 72
4.3.1 MFC design and operation ......................................................................................... 72
4.3.2 Analytical methods ..................................................................................................... 73
4.3.3 Media and growth conditions for Geobacter sulfurreducens ..................................... 73
4.3.4 Bottle tests with G. sulfurreducens ............................................................................. 74
4.3.5 DNA extraction and PCR amplification of 16S rDNA sequences ............................. 75
4.3.6 DGGE and 16S rDNA sequencing ............................................................................. 76
4.4 Results and Discussion ...................................................................................................... 77
4.4.1 Microbial community analysis ................................................................................... 77
4.4.2 Pathways for electricity generation in a CO-fed MFC ............................................... 85
4.5 Conclusion ......................................................................................................................... 88
4.6 References ......................................................................................................................... 89
xiii
CHAPTER 5 The performance of a thermophilic microbial fuel cell fed with synthesis gas ... 95
5.1 Abstract ............................................................................................................................. 95
5.2 Introduction ....................................................................................................................... 96
5.3 Materials and Methods ...................................................................................................... 97
5.3.1 Medium composition and analytical methods ............................................................ 97
5.3.2 Inoculum ..................................................................................................................... 98
5.3.3 MFC design, operation, and characterization ............................................................. 98
5.3.4 KLa measurements and CO conversion tests ............................................................ 101
5.3.5 DNA extraction, PCR amplification of 16S rDNA, Denaturing gradient gel
electrophoresis (DGGE) and 16S sequencing ................................................................... 102
5.4 Results and Discussion .................................................................................................... 104
5.4.1 CO KLa estimation .................................................................................................... 104
5.4.2 MFC operation on syngas ......................................................................................... 106
5.4.3 H2 and CO tests ......................................................................................................... 112
5.4.4 Microbial community analysis and pathways for electricity generation .................. 114
5.5 Conclusion ....................................................................................................................... 120
5.6 References ....................................................................................................................... 121
CHAPTER 6 Electricity production from synthesis gas in a multi-electrode microbial fuel
cell ............................................................................................................................................ 127
6.1 Abstract ........................................................................................................................... 127
6.2 Introduction ..................................................................................................................... 128
6.3 Materials and methods .................................................................................................... 129
6.3.1 Medium composition and analytical methods .......................................................... 129
6.3.2 MFC design, operation, and characterization ........................................................... 130
6.3.3 Protein quantification ............................................................................................... 136
6.4 Results and discussion ..................................................................................................... 136
6.4.1 Impact of electrode arrangements on power output of meMFC#1 ........................... 136
6.4.2 Impact of temperature and electrode arrangements on meMFC#2 operation on
syngas.................................................................................................................................139
6.5 Conclusion ....................................................................................................................... 156
6.6 References ....................................................................................................................... 157
xiv
CHAPTER 7 General Summary, Novelty and Recommendations for future Research .......... 160
7.1 Novelty and contribution to knowledge .......................................................................... 163
7.2 Recommendations for further research ........................................................................... 165
7.3 List of References............................................................................................................ 169
APPENDIX A.........................................................................................................................................184
xv
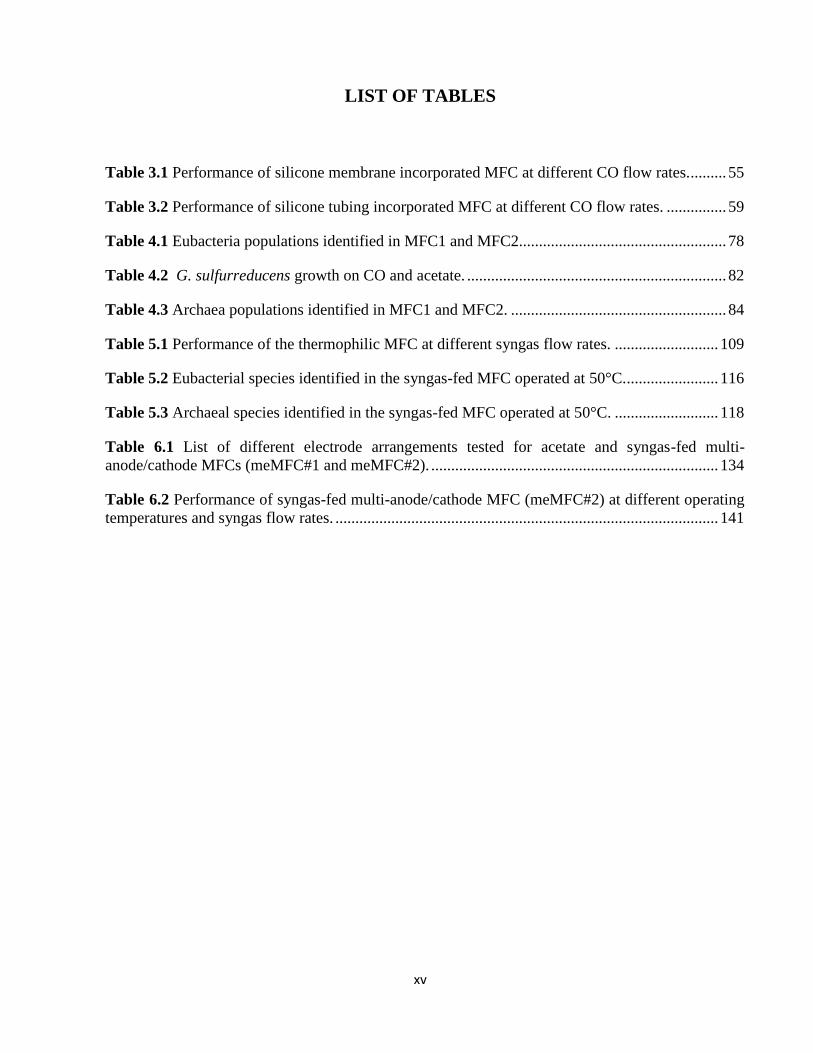
LIST OF TABLES
Table 3.1 Performance of silicone membrane incorporated MFC at different CO flow rates.......... 55
Table 3.2 Performance of silicone tubing incorporated MFC at different CO flow rates. ............... 59
Table 4.1 Eubacteria populations identified in MFC1 and MFC2.................................................... 78
Table 4.2 G. sulfurreducens growth on CO and acetate. ................................................................. 82
Table 4.3 Archaea populations identified in MFC1 and MFC2. ...................................................... 84
Table 5.1 Performance of the thermophilic MFC at different syngas flow rates. .......................... 109
Table 5.2 Eubacterial species identified in the syngas-fed MFC operated at 50°C. ....................... 116
Table 5.3 Archaeal species identified in the syngas-fed MFC operated at 50°C. .......................... 118
Table 6.1 List of different electrode arrangements tested for acetate and syngas-fed multi-
anode/cathode MFCs (meMFC#1 and meMFC#2). ........................................................................ 134
Table 6.2 Performance of syngas-fed multi-anode/cathode MFC (meMFC#2) at different operating
temperatures and syngas flow rates. ................................................................................................ 141

xvi
LIST OF FIGURES
Figure 2.1 Schematic of a typical single chamber MFC. ........................................................ 5
Figure 2.2 Example of polarization (A) and power curve (B) of a microbial fuel cell, where
power and current density were obtained by normalizing to the total reactor volume (L). ... 10
Figure 2.3 Schematic of the two-stage process utilized in the study of Kim and Chang
(2009), for electricity production from carbon monoxide...................................................... 11
Figure 2.4 Schematic of the experimental utilized in the study of Mehta et al. (2010), for
electricity generation from carbon monoxide/syngas. ........................................................... 12
Figure 2.5 Proposed pathways of electricity production from CO and syngas in an MFC.
Notations: 1 – CO conversion to acetate by acetogenic carboxidotrophs, 2 – CO conversion
to H2 by hydrogenogenic carboxidotrophs, 3 – H2 conversion to acetate by homoacetogens;
4, 5 – acetate and H2 consumption by electricigenic microorganisms, 6 – CO consumption
by electricigenic carboxidotrophs (hypothesized).................................................................. 14
Figure 2.6 Proposed design of an MFC with (A) a flat membrane system and (B)
microporous tubes embedded in the anode. ........................................................................... 28
Figure 2.7 Proposed design of a syngas-fed multi-anode/cathode MFC .............................. 29
Figure 3.1 (A) Experimental set-up for the determination of volumetric mass transfer co-
efficient (𝐊𝐋𝐚) for silicone tubing and (B) Diagram of the experimental setup of silicone
tubing incorporated MFC, where BC represents the bubble counters. .................................. 48
Figure 3.2 (A) Experimental set-up for the determination of volumetric mass transfer
coefficient (𝐊𝐋𝐚) for silicone membrane and (B) Diagram of the experimental setup of
silicone membrane incorporated MFC, where BC represents the bubble counters. .............. 49
Figure 3.3 Average volumetric power output for silicone membrane incorporated MFC at
different CO flow rates. The error bars represent the calculated standard deviation for the
data points. ............................................................................................................................. 55
Figure 3.4 Polarization (A) and power (B) curves obtained for silicone membrane
incorporated MFC, where sparger represents the values obtained for the sparger installed
MFC maximized at the flow rate of 4.8 L -1
RL d-1. .................................................................. 56
Figure 3.5 Average volumetric power output for silicone tubing incorporated MFCs at
different CO flow rates. The error bars represent the calculated standard deviation for the
data points. ............................................................................................................................. 59
xvii
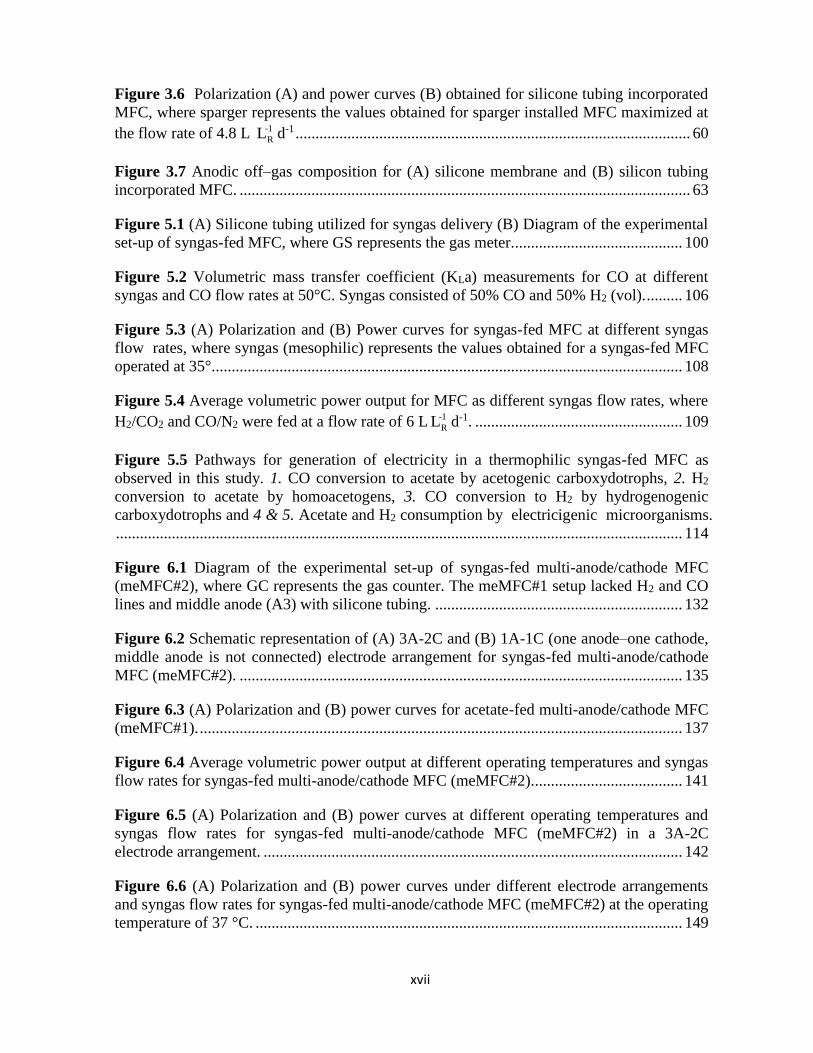
Figure 3.6 Polarization (A) and power curves (B) obtained for silicone tubing incorporated
MFC, where sparger represents the values obtained for sparger installed MFC maximized at
the flow rate of 4.8 L -1
RL d-1 ................................................................................................... 60
Figure 3.7 Anodic off–gas composition for (A) silicone membrane and (B) silicon tubing
incorporated MFC. ................................................................................................................. 63
Figure 5.1 (A) Silicone tubing utilized for syngas delivery (B) Diagram of the experimental
set-up of syngas-fed MFC, where GS represents the gas meter........................................... 100
Figure 5.2 Volumetric mass transfer coefficient (KLa) measurements for CO at different
syngas and CO flow rates at 50°C. Syngas consisted of 50% CO and 50% H2 (vol). ......... 106
Figure 5.3 (A) Polarization and (B) Power curves for syngas-fed MFC at different syngas
flow rates, where syngas (mesophilic) represents the values obtained for a syngas-fed MFC
operated at 35°. ..................................................................................................................... 108
Figure 5.4 Average volumetric power output for MFC as different syngas flow rates, where
H2/CO2 and CO/N2 were fed at a flow rate of 6 L -1
RL d-1. .................................................... 109
Figure 5.5 Pathways for generation of electricity in a thermophilic syngas-fed MFC as
observed in this study. 1. CO conversion to acetate by acetogenic carboxydotrophs, 2. H2
conversion to acetate by homoacetogens, 3. CO conversion to H2 by hydrogenogenic
carboxydotrophs and 4 & 5. Acetate and H2 consumption by electricigenic microorganisms.
.............................................................................................................................................. 114
Figure 6.1 Diagram of the experimental set-up of syngas-fed multi-anode/cathode MFC
(meMFC#2), where GC represents the gas counter. The meMFC#1 setup lacked H2 and CO
lines and middle anode (A3) with silicone tubing. .............................................................. 132
Figure 6.2 Schematic representation of (A) 3A-2C and (B) 1A-1C (one anode–one cathode,
middle anode is not connected) electrode arrangement for syngas-fed multi-anode/cathode
MFC (meMFC#2). ............................................................................................................... 135
Figure 6.3 (A) Polarization and (B) power curves for acetate-fed multi-anode/cathode MFC
(meMFC#1). ......................................................................................................................... 137
Figure 6.4 Average volumetric power output at different operating temperatures and syngas
flow rates for syngas-fed multi-anode/cathode MFC (meMFC#2). ..................................... 141
Figure 6.5 (A) Polarization and (B) power curves at different operating temperatures and
syngas flow rates for syngas-fed multi-anode/cathode MFC (meMFC#2) in a 3A-2C
electrode arrangement. ......................................................................................................... 142
Figure 6.6 (A) Polarization and (B) power curves under different electrode arrangements
and syngas flow rates for syngas-fed multi-anode/cathode MFC (meMFC#2) at the operating
temperature of 37 °C. ........................................................................................................... 149
xviii
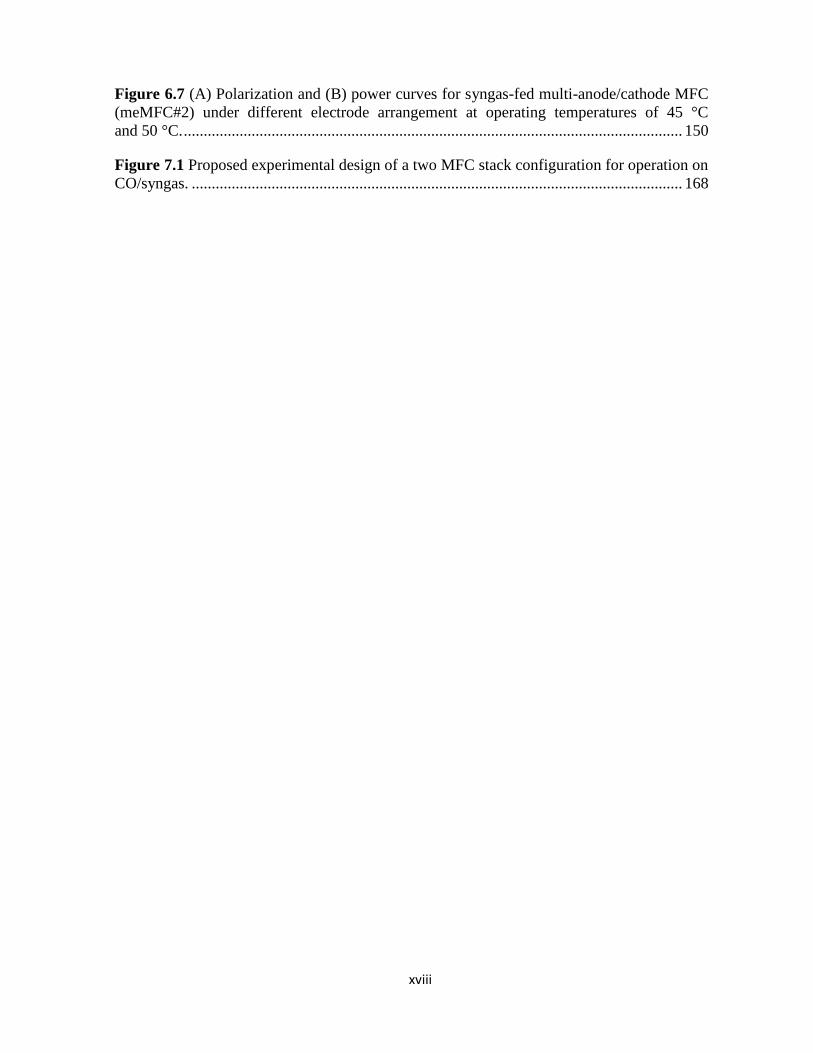
Figure 6.7 (A) Polarization and (B) power curves for syngas-fed multi-anode/cathode MFC
(meMFC#2) under different electrode arrangement at operating temperatures of 45 °C
and 50 °C. ............................................................................................................................. 150
Figure 7.1 Proposed experimental design of a two MFC stack configuration for operation on
CO/syngas. ........................................................................................................................... 168
1
CHAPTER 1
General Introduction
1.1 Motivation
A steady increase in energy consumption in developed countries and a surge in
energy demands in the fast growing developing economies might lead to a shortage of fossil
fuels in a foreseeable future. This anticipated shortage, along with the confluence of
concerns about atmospheric pollution and climate change are acting as a major impetus for
research into alternative renewable energy technologies. A number of studies have
suggested biomass to be one of the most promising sources of renewable energy (Kim &
Chang, 2009; Song, 2002). Microbial digestion, fermentation and gasification are well
known processes, among many, for biomass conversion to biofuels and bioproducts. Wet
biomass with up to 25-35% of solids such as urban organic waste and high moisture
agricultural wastes (vegetables, sugar cane, sugar beet, etc) are best suited for microbial
degradation, while gasification is most appropriate for dry biomass such as woody wastes
and low moisture agricultural wastes (Demirbas, 2001; Demirbas, 2007).
The gasification of biomass at high temperatures leads to the generation of synthesis
gas (syngas). Carbon monoxide and hydrogen account for 60-80% of the syngas
composition, with CH4, CO2, SO2, H2S and NH3 present in smaller amounts (Munasinghe &
Khanal, 2010; Sipma et al., 2006). Although most of the syngas today is produced from non-
renewable sources, such as natural gas and coal, syngas production from biomass or poorly
2
degradable organic matter makes syngas generation an environmentally friendly option for
energy production (Faaij et al., 1997; Henstra et al., 2007). Syngas represents a versatile
energy carrier which can be used as a chemical feedstock to produce liquid and gaseous
fuels such as ethanol, methane, etc. or can be directly utilized for power production through
combustion. However, the low conversion efficiency of the internal combustion engines and
the generation of soot and sulfur compounds, in addition to other noxious emissions present
the major drawbacks of the process.
There are many studies focusing on utilization of CO or syngas for electricity generation
in fuel cells (Baschuk & Li, 2001; Ormerod, 2003; Song, 2002; Steele & Heinzel, 2001).
Unlike combustion that converts chemicals to reaction products (e.g., H2O and CO2) and
heat, fuel cells directly produce electrical energy by electrochemical oxidation of the fuel.
Such a chemical process of electricity generation confers fuel cells with the intrinsic
advantage of high electrical efficiency and low environmental impact. CO/syngas can be
potentially used in polymer electrolyte membrane fuel cells (PEMFC) and solid oxide fuel
cells (SOFC). However, efficient utilization of CO/syngas is hindered due to the sensitivity
of metal catalysts used in such devices to CO and/or trace impurities in the syngas stream
such as sulfur. Platinum (Pt) or platinum based alloys used in PEMFC are extremely
sensitive to CO and sulfur compounds with more than 10 ppm of CO and 0.1 ppm of sulfur
compounds resulting in irreversible poisoning and inhibition of the catalyst (Kim & Chang,
2009; Ormerod, 2003). Similarly, SOFCs which generally employ nickel as the anode are
easily poisoned by the presence of more than 10 ppm of sulfur compounds. The sulfur
compounds are able to bind to the anode, thereby decreasing the reaction sites available
3
(Song, 2002). The removal of such trace impurities requires complex and expensive feed
processing which disproportionately increases the overall operating cost.
Recently, Kim and Chang (2009) proposed an alternative method of syngas conversion to
electricity by a bioelectrochemical process, where a CO fermenter was connected to a
microbial fuel cell (MFC). Subsequently, we, for the first time, demonstrated electricity
generation in an MFC directly fed with CO or a mixture of CO and H2 (Mehta et al., 2010).
In an MFC, microorganisms are employed as a catalyst for electricity generation, which
allows this contraption to be successfully operated on a wide range of substrates and varied
operating conditions with high efficiency. (Choi, 2004; Demirbas, 2007; Jong et al., 2006;
Logan, 2008; Mathis et al., 2008). Moreover, the utilization of microbial catalysts promises
higher durability as the catalyst is self-regenerating. These inherent merits along with
intrinsic resistance of the microbial catalysts to poisoning by fuel impurities such as sulfur,
give MFCs an edge over other conventional processes, and suggest that MFCs could offer a
robust and an efficient technology for CO/syngas conversion to electricity.
1.2 Problem Statement
We recently reported electricity production in an MFC directly fed CO/syngas (Mehta
et al., 2010). Though the study clearly demonstrated that microbial population of an MFC
are capable of utilizing CO/syngas as an electron donor for electricity production, the
performance of the system in terms of volumetric power output, Coulombic efficiency and
CO/syngas transformation efficiency was low. Efficient MFC operation on CO/syngas poses
a number of engineering and microbiological challenges pertaining to poor solubility of the
gaseous substrates in the liquid phase, understanding of the biochemical pathways involved
4
in electricity production, and selection of electrode materials and microbial catalysts
resistant to poisoning by CO and sulfur compounds.
1.3 Objective
The primary objective of this PhD research was to enhance the overall performance of a
CO/syngas-fed MFC in terms of its volumetric power output, Coulombic efficiency and gas
conversion efficiency by improving the reactor design and operating conditions, and
elucidate the microbial ecology and biochemical pathways involved in electricity production.
1.3.1 Specific Objectives
1) Demonstrate that the volumetric power output of a CO/syngas-fed MFC can be
enhanced by improving CO/syngas gas to liquid transfer.
2) Analyse the microbial communities and comprehend the biochemical pathways
involved in electricity production in a CO or syngas-fed MFC operated under
mesophilic conditions.
3) Demonstrate electricity production and consequently CO/syngas dependant
bioelectrochemical activity under thermophilic conditions.
4) Analyse the microbial communities and comprehend the biochemical pathways
involved in electricity production in a CO/syngas-fed MFC operated under thermophilic
conditions.
5) Develop a multi-anode/cathode MFC configuration to enhance the power output and
Coulombic efficiency on syngas, and systematically investigate the impact of different
electrode arrangements and operating temperatures on the system’s performance.
5
CHAPTER 2
Review of Literature
2.1 Microbial Fuel Cells (MFC)
MFC represents a novel technological solution for electricity production from biomass.
The technology exploits the ability of certain microorganisms such as Geobacter
sulfurreducens, Rhodoferax ferrireducens, Shewanella putrefaciens, etc., that are capable of
extra-cellular electron transfer to an insoluble electron acceptor such as an electrode. Such
microorganisms are commonly referred to as anodophilic, exoelectrogens or electricigens
and the process is referred to as electrogenesis or electricigenesis (Logan, 2008).
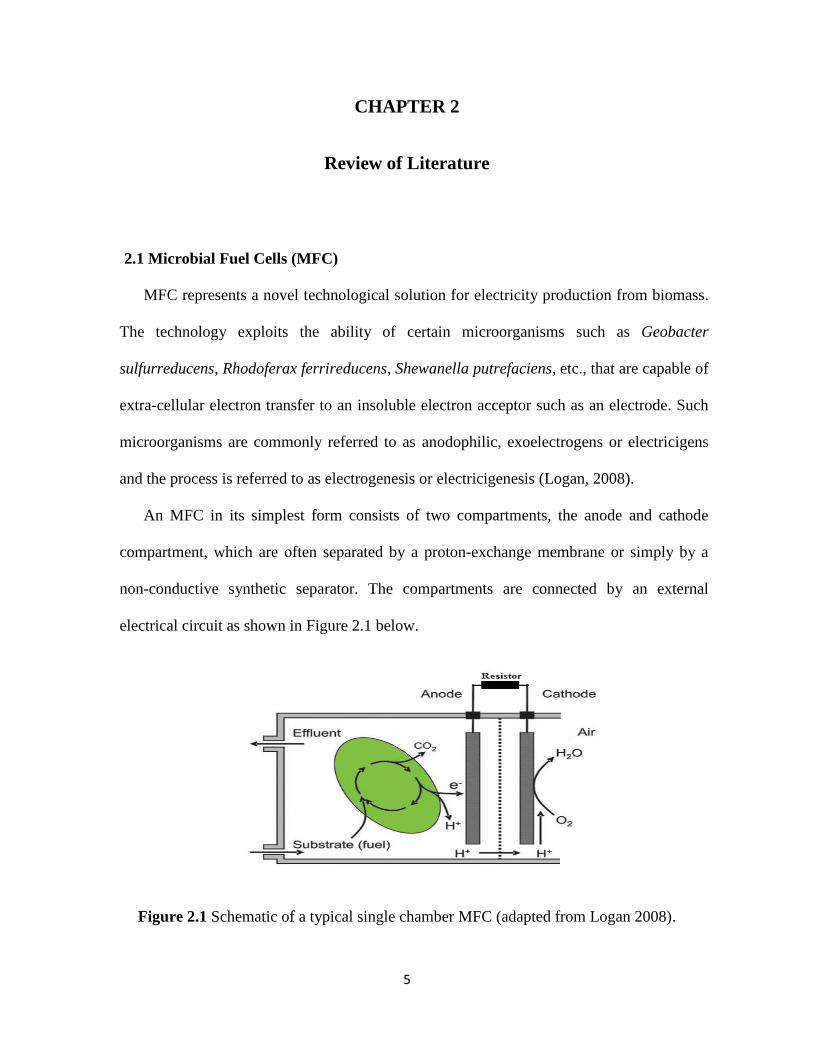
An MFC in its simplest form consists of two compartments, the anode and cathode
compartment, which are often separated by a proton-exchange membrane or simply by a
non-conductive synthetic separator. The compartments are connected by an external
electrical circuit as shown in Figure 2.1 below.
Figure 2.1 Schematic of a typical single chamber MFC (adapted from Logan 2008).
6
The anodic chamber houses the electricigenic microorganisms which are laid upon a
convoluted, conductive and non-corrosive anode such as graphite brush, carbon felt, etc.,
forming a biofilm. This biofilm first catalyzes the oxidation of the fed fuel (electron donor),
liberating electrons and protons and then transfer the electrons to the anode (Rinaldi et al.,
2008). As an example, the oxidation of glucose in the anodic chamber is presented in
equation 2.1 below:
C6H12O6 + 6H2O → 6CO2+ 24H+ + 24e- ....................................................................... (2.1)
While the electrons travel through an electrical load (device to be powered or a resistor in
lab scale studies) and generate electricity until reaching the cathode, the corresponding
protons migrate through the separator to the cathodic compartment to maintain the electrical
neutrality. At the cathode, the protons combine with the electrons and an electron acceptor
(catholyte) such as oxygen, to form H2O through a reduction reaction as shown in equation
2.2 below:
6O2 + 24H+ + 24e- → 12H2O......................................................................................... (2.2)
MFCs have been successfully operated on a wide range of substrates such as acetate, H2,
glucose, galactose, butyrate, starch, marine sediments, swine wastewater etc. (Pant et al.,
2010). In principle, any bio-degradable material could be utilized as a fuel for electricity
generation in an MFC. An ideal MFC can produce current while sustaining a steady
voltage as long as a steady supply of substrate in maintained. The theoretical ideal voltage,
Eideal (V) attainable in an MFC can be thermodynamically predicted by the Nernst equation:
𝐸𝑖𝑑𝑒𝑎𝑙 = 𝐸0 − 𝑅𝑇
𝑛𝐹ln(∏) ........................................................................................... (2.3)
7
Where, E0 is the standard cell potential (V), R is the universal gas constant
(8.314 J mol-1K-1), T is the temperature (K), n is the number of electrons transferred in the
reaction (dimensionless), F is the Faraday’s constant (96,485 C mol-1) and ∏ is the
chemical activity of the products divided by those of the reactants (dimensionless).
In practice the actual voltage attainable in an MFC is less than the predicted voltage due to
various irreversible losses or overpotentials. Activation, ohmic and mass transport losses
are the three major irreversible losses that affect MFC performance (Rismani-Yazdi et al.,
2008). Briefly, activation losses are due to the activation energy that must be overcome by
the reacting species at each electrode and largely depends on the electrochemical properties
of the deployed electrodes, current density of the anode, operating temperature and
presence of electrochemical mediators. Hence, such voltage losses could be minimized by
improving the electrode configuration and surface area, increasing the operating
temperature and by utilizing microorganisms with high bio-electrochemical activity or
enriching the electrode chambers with electro-mediating compounds (Rinaldi et al., 2008).
Ohmic losses can be broadly ascribed to the electronic flow through the electrodes, the
current collectors and the contact, and also to the resistance to the flow of ions through the
electrolyte. Such losses could be reduced by improving the reactor design to reduce the
distance between the electrodes, utilization of proton exchange membranes (if used) with
low resistance and by increasing the electrolyte conductivity. Concentration losses
represent the voltage losses due to the depletion of the reactants in the electrolyte near the
electrodes and the accumulation of the reaction products. Improvement in the reactor
configuration and operating parameters to reduce the concentration gradient minimizes
such losses. The actual cell voltage, Ecell (V) of an MFC can thus be determined by
8
subtracting the voltage losses in anodic and cathodic compartment and can be described by
the following equation (Rinaldi et al., 2008):
𝐸𝑐𝑒𝑙𝑙 = [𝐸𝑐𝑎𝑡ℎ𝑜𝑑𝑒- |η𝑎𝑐𝑡,𝑐 + η𝑐𝑜𝑛𝑐,𝑐|] - [𝐸𝑎𝑛𝑜𝑑𝑒- |η𝑎𝑐𝑡,𝑎+ η𝑐𝑜𝑛𝑐,𝑎|] -η𝑜ℎ𝑚 .................... (2.4)
Where, Ecathode and Eanode represent the cathode and anode potentials (V), η𝑎𝑐𝑡,𝑐 and η𝑎𝑐𝑡,𝑎
represent the activation losses in the cathodic and anodic chamber, η𝑐𝑜𝑛𝑐,𝑐 and η𝑐𝑜𝑛𝑐,𝑎
represent the concentration losses in the cathodic and anodic chamber, and η𝑜ℎ𝑚 represents
the ohmic losses.
2.2 Calculations and procedures of reporting data
Power output and Coulombic efficiency
The overall performance of an MFC can be evaluated in many ways, but power output
and Coulombic efficiency are the two parameters most commonly used in
evaluating/reporting the efficiency of an MFC. Power output of a lab-scale MFC is
calculated by measuring the voltage, Ecell across the load (Rext) and current as:
P = I. Ecell ..................................................................................................................... (2.5)
Based on Ohms law, we can alternatively express power output as:
P = 𝐸𝑐𝑒𝑙𝑙
2
𝑅𝑒𝑥𝑡 ....................................................................................................................... (2.6)
Power produced by an MFC is generally normalized to some characteristic reactor
parameter to make it possible to compare the performance of different reactors. The choice
of the parameter used for normalization usually depends on the targeted
application/novelty of the system, as not all systems are optimized for power production
(Logan, 2008). However, the electrode surface area (eq 2.7) and the total reactor volume

9
(eq 2.8) are the two most commonly utilized parameters for estimating the power density
(W/m2 or W/m3).
P = 𝐸𝑐𝑒𝑙𝑙
2
𝐴𝑒𝑙𝑒𝑐𝑡𝑅𝑒𝑥𝑡 ............................................................................................... (2.7)
where, Aelect is the anodic or cathodic surface area (m2)
P = 𝐸𝑐𝑒𝑙𝑙
2
𝑉.𝑅𝑒𝑥𝑡 ................................................................................................. (2.8)
Where, V is the total reactor volume (m3 or L)
Coulombic efficiency (CE) is defined as the ratio of total coulombs transferred to the
anode from the fed substrate, to the theoretical maximum number of coulombs recoverable
from the added substrate. In other words, CE presents the total number of electrons
recovered as current versus the total recoverable electrons in the substrate (Logan, 2008).
For a continuous fed system, CE can be estimated based on the average current generated
under steady state conditions as shown below:
CE = 𝐼.∆𝑡.𝑀𝑠𝑢𝑏
𝐹.𝑛 (𝑀𝑠𝑢𝑏,𝑖𝑛− 𝑀𝑠𝑢𝑏,𝑜𝑢𝑡)100% ……………………………………………………….. (2.9)
Where, I is the average measured current (A), ∆𝑡 is the time interval during which the
current was measured (s), Msub is the molar mass of the fed substrate (g/mol), F is the
faraday constant (C/mol-e-), n is the number of electrons exchanged per mol of substrate
(mol-e-/mol), 𝑀𝑠𝑢𝑏,𝑖𝑛 is the amount of substrate (g) fed to the MFC during ∆𝑡, and 𝑀𝑠𝑢𝑏,𝑜𝑢𝑡
is the amount of substrate recovered (g) in the MFC effluent or off-gas during ∆𝑡.
Polarization and power density curves
Polarization and power density curves present a powerful tool for the analysis and
characterization of fuel cells. A polarization curve represents the voltage as a function of
10
0
100
200
300
400
500
600
700
0 100 200 300 400
Volt
age
(mV
)
Current (mA/L)
(A)
0
10
20
30
40
50
60
70
80
90
0 100 200 300 400
Pow
er (
mW
/L)
Current (mA/L)
current and is obtained by inducing a periodic decrease of the external load (Rext) and
recording the corresponding voltage. The current is then calculated using ohms law. By
plotting voltage versus current or current density (normalizing by electrode surface area or
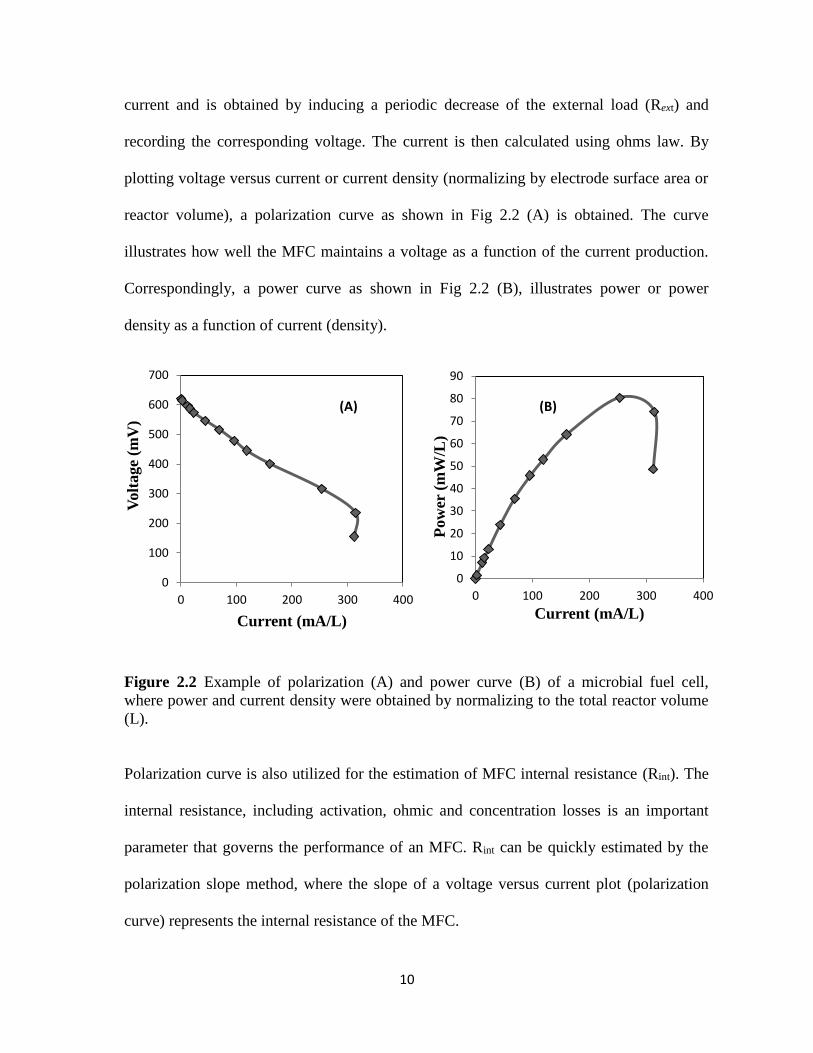
reactor volume), a polarization curve as shown in Fig 2.2 (A) is obtained. The curve
illustrates how well the MFC maintains a voltage as a function of the current production.
Correspondingly, a power curve as shown in Fig 2.2 (B), illustrates power or power
density as a function of current (density).
Figure 2.2 Example of polarization (A) and power curve (B) of a microbial fuel cell,
where power and current density were obtained by normalizing to the total reactor volume
(L).
Polarization curve is also utilized for the estimation of MFC internal resistance (Rint). The
internal resistance, including activation, ohmic and concentration losses is an important
parameter that governs the performance of an MFC. Rint can be quickly estimated by the
polarization slope method, where the slope of a voltage versus current plot (polarization
curve) represents the internal resistance of the MFC.
(B)
11
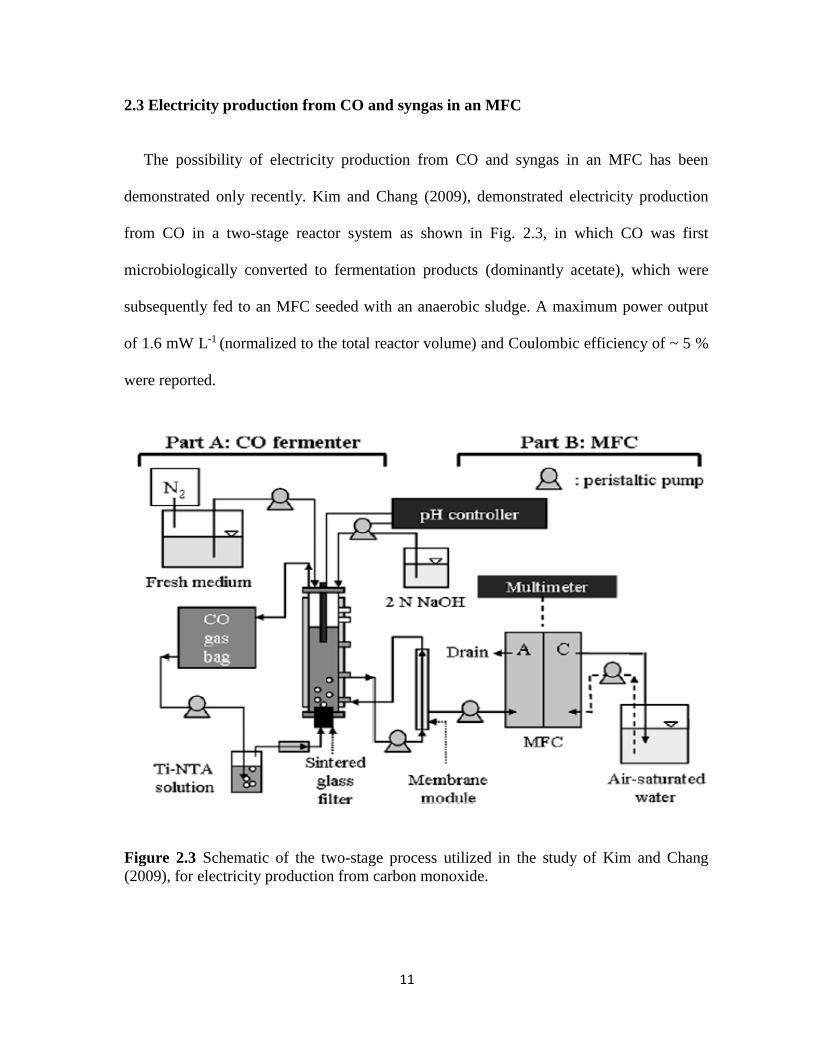
2.3 Electricity production from CO and syngas in an MFC
The possibility of electricity production from CO and syngas in an MFC has been
demonstrated only recently. Kim and Chang (2009), demonstrated electricity production
from CO in a two-stage reactor system as shown in Fig. 2.3, in which CO was first
microbiologically converted to fermentation products (dominantly acetate), which were
subsequently fed to an MFC seeded with an anaerobic sludge. A maximum power output
of 1.6 mW L-1 (normalized to the total reactor volume) and Coulombic efficiency of ~ 5 %
were reported.
Figure 2.3 Schematic of the two-stage process utilized in the study of Kim and Chang
(2009), for electricity production from carbon monoxide.

12
Instead of a two-stage process, we demonstrated electricity generation in an MFC directly
fed with CO/syngas (Mehta et al., 2010). The maximum volumetric power output and
Coulombic efficiency (CE) of the system were 6.4 mWL-1 and 8.7 %, respectively. Though
the overall performance of the MFC directly fed with CO/syngas was only marginally
better than the two-stage process utilized in the study of Kim and Chang (2009), it clearly
demonstrated that the microbial communities of an MFC could utilize CO/syngas as an
electron donor for electricity generation. The low performance of the MFC on CO/syngas
was attributed to the inefficient system design and gas delivery. The utilization of a sparger
system for gas delivery (Fig. 2.4) not only required the doubling of the reactor volume
which invariably resulted in low power density, but also the inefficient gas-liquid mass
transfer required much higher CO/syngas feed in rates to reach the desired dissolved CO
levels; resulting in considerable gas losses and low CO transformation efficiency. This
suggested that the performance of an MFC on CO/syngas could be enhanced by adoption
of an efficient gas-liquid mass transfer mechanism and reactor design optimization.
Figure 2.4 Schematic of the experimental set-up utilized in the study of Mehta et al.
(2010), for electricity generation from carbon monoxide/syngas.
13
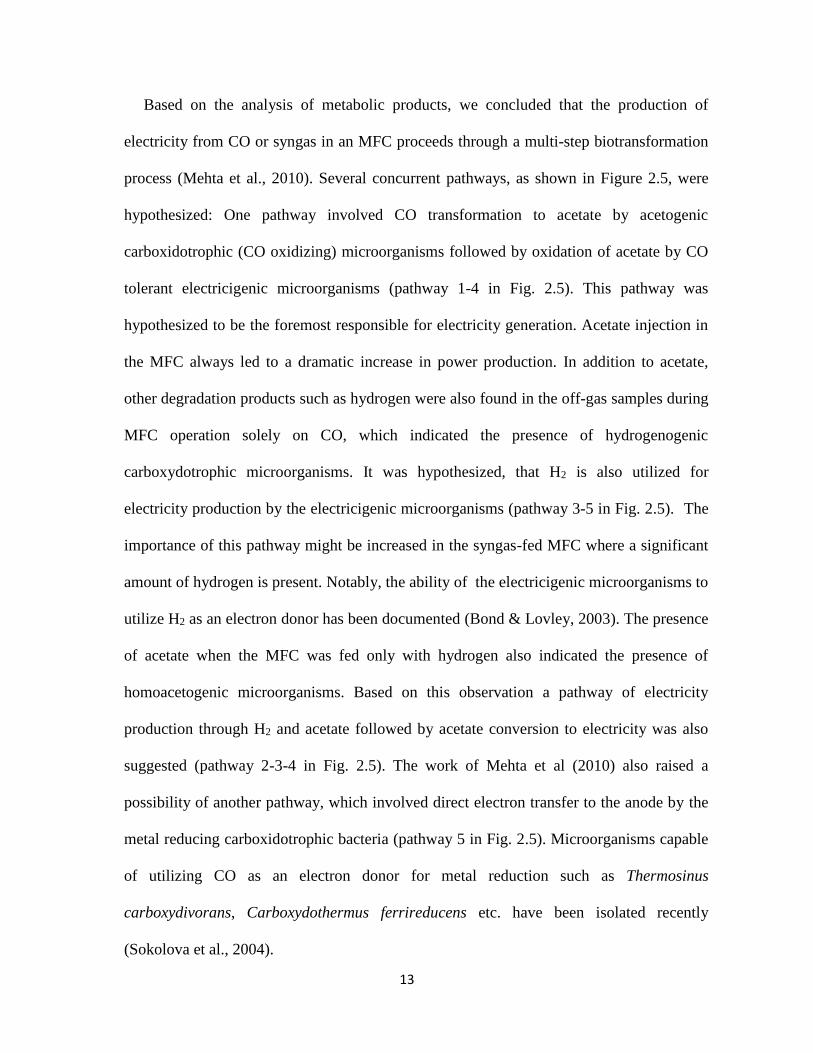
Based on the analysis of metabolic products, we concluded that the production of
electricity from CO or syngas in an MFC proceeds through a multi-step biotransformation
process (Mehta et al., 2010). Several concurrent pathways, as shown in Figure 2.5, were
hypothesized: One pathway involved CO transformation to acetate by acetogenic
carboxidotrophic (CO oxidizing) microorganisms followed by oxidation of acetate by CO
tolerant electricigenic microorganisms (pathway 1-4 in Fig. 2.5). This pathway was
hypothesized to be the foremost responsible for electricity generation. Acetate injection in
the MFC always led to a dramatic increase in power production. In addition to acetate,
other degradation products such as hydrogen were also found in the off-gas samples during
MFC operation solely on CO, which indicated the presence of hydrogenogenic
carboxydotrophic microorganisms. It was hypothesized, that H2 is also utilized for
electricity production by the electricigenic microorganisms (pathway 3-5 in Fig. 2.5). The
importance of this pathway might be increased in the syngas-fed MFC where a significant
amount of hydrogen is present. Notably, the ability of the electricigenic microorganisms to
utilize H2 as an electron donor has been documented (Bond & Lovley, 2003). The presence
of acetate when the MFC was fed only with hydrogen also indicated the presence of
homoacetogenic microorganisms. Based on this observation a pathway of electricity
production through H2 and acetate followed by acetate conversion to electricity was also
suggested (pathway 2-3-4 in Fig. 2.5). The work of Mehta et al (2010) also raised a
possibility of another pathway, which involved direct electron transfer to the anode by the
metal reducing carboxidotrophic bacteria (pathway 5 in Fig. 2.5). Microorganisms capable
of utilizing CO as an electron donor for metal reduction such as Thermosinus
carboxydivorans, Carboxydothermus ferrireducens etc. have been isolated recently
(Sokolova et al., 2004).

14
Figure 2.5 Proposed pathways of electricity production from CO and syngas in an MFC
(Mehta et al., 2010). Notations: 1 – CO conversion to acetate by acetogenic
carboxidotrophs, 2 – CO conversion to H2 by hydrogenogenic carboxidotrophs, 3 – H2
conversion to acetate by homoacetogens; 4, 5 – acetate and H2 consumption by
electricigenic microorganisms, 6 – CO consumption by electricigenic carboxidotrophs
(hypothesized).
Based on the experimental observations from the studies of Kim and Chang (2009) and
Mehta et al. (2010), it is evident that the electricity production from syngas in an MFC
poses a number of engineering and microbiological challenges pertaining to gas transfer
limitations, selection and enrichment of microorganisms capable of efficient syngas
transformation to electricity, and selection of cathodic catalysts resistant to poisoning by
CO and sulfur compounds. The subsequent sections of this chapter review the microbial
communities and reactor designs suitable for MFC operation on CO/syngas.
H2
2 CH3COOH
Anode
3
1 4
5
CO 6

15
2.4 Microbial community of a CO and syngas-fed MFC
This section discusses microbial communities that could be realized in an MFC for
efficient CO/syngas transformation to electricity based on the biochemical pathways
discussed in the previous section and as illustrated in Figure 2.5.
2.4.1 Syngas conversion to electricity by acetogenic and electricigenic microorganisms
(CO/H2 Acetate e-)
Mesophilic acetogenesis and electricigenesis
Acetogens have the ability of utilizing wide range of substrates for metabolic needs
(Drake & Daniel, 2004). Clostridium carboxidivorans (ATCC BAA 624), Clostridium
autoethananogenum (DSM 10061), Peptostreptococcus productus (ATCC 35244),
Eubacterium limosum (ATCC 10825) and Acetobacterium woodii (DSM 1030) are some
of the mesophilic bacterial acetogens capable of using CO as their sole source of energy
while forming acetate and CO2 (Genthner & Bryant, 1987; Henstra et al., 2007; Lorowitz
& Bryant, 1984). This biotransformation can be presented by the following stoichiometric
equation:
4CO + 2H2O → CH3COOH + 2CO2 .......................................................................... (2.10)
P. productus isolated from an anaerobic sewage digester was the first acetogenic
anaerobic coccus observed to utilize CO as an energy source. The doubling time with 90%
CO was 1.15 h at an optimum temperature of 30 °C (Lorowitz & Bryant, 1984). Similarly,
Eubacterium limosum can utilize CO to form acetate and CO2. The generation time of E.
limosum on CO, within the temperature range of 38-39 °C, was reported to be 7 h. A.
16
woodii grew on CO at 30 °C without requiring any adaptation period with a generation
time of 13 h.
Acetate is also formed by certain bacteria by acetogenic hydrogenation where H2 and
CO2 are converted to acetate according to the following stoichiometric equation (step 3 in
Fig. 2.5):
4H2 + 2CO2 → CH3COOH + 2H2O............................................................................ (2.11)
This ability under mesophilic conditions has been demonstrated by Clostridium aceticum
(DSM 1496), Acetobacterium wieringae (DSM 1911), Ruminococcus hydrogenotrophicus
(DSM 10507), etc. (Bernalier et al., 1996; Braun et al., 1981). C. aceticum is an obligate
anaerobe, which grows chemolithotrophically on H2 and CO2 forming acetate. The
optimum temperature and pH for its growth was reported to be 30 C and 8.3, respectively,
with a doubling time of 25 h (Braun et al., 1981). Similarly, A. wieringae coupled H2 and
CO2 for acetate formation. The doubling time was less than 10 h at the optimal growth
temperature and pH of 30 °C and 7.6 respectively (Braun & Gottschalk, 1982). R.
hydrogenotrophicus is a strict anaerobe that grew autotrophically on H2 and CO2 forming
acetate (Bernalier et al., 1996).
For electricity generation under mesophilic conditions, the above mentioned bacteria
could be used in co-culture with electricigenic microorganisms capable of using acetate as
an electron donor such as Geobacter sulfurreducens (ATCC 51573) (Bond & Lovley,
2003), leading to a syntrophic relationship with the acetogens. The following
stoichiometric equation can be used to describe the corresponding acetate transformation
reaction (Logan, 2008):
17
CH3COOH + 2H2O → 2CO2 + 8e- + 8H+............................................................... (2.12)
Equations (2.10-2.12) imply a yield of 2 e-/mol either on CO or on H2 for a syngas-fed
MFC. A detailed review of electricigenic microorganisms can be found elsewhere (Logan,
2009; Logan & Regan, 2006; Lovley, 2008). Interestingly, genome sequencing of G.
sulfurreducens, often found in mixed microbial populations of MFCs, revealed the
presence of carbon monoxide dehydrogenase, which is known to catalyze the reaction of
CO conversion to CO2 and H2 (Methe et al., 2003). Although growth of G. sulfurreducens
on CO has not been reported, it can be suggested that this strain can be at least tolerant to
the presence of CO, thus growing in a co-culture with carboxydotrophic strains producing
acetate.
Thermophilic acetogenesis and electricigenesis
The growth of acetogens on CO and electricity generation through the acetate pathway
can also be anticipated under thermophilic conditions. Many acetogens capable of growth
on CO under thermophilic conditions have been reported. Savage et al. (1987) reported the
ability of CO-dependent chemolithotrophic acetogenesis and growth by Moorella
thermoautotrophicum (ATCC 33924) (earlier Clostridium thermoautotrophicum), with
supplemental CO2 required for efficient growth on CO. The CO/CO2 ratio of 2:4 yielded
optimal doubling times at a temperature of 58 °C. This microorganism has the ability to
grow autotrophically and heterotrophically using various electron donors and acceptors
(Savage et al., 1987; Sokolova et al., 2009). Clostridium thermoaceticum (ATC35608),
also demonstrated CO dependent growth and acetogenesis under chemolithotrophic
conditions with a doubling time of 10 h at a temperature of 55 °C (Daniel et al., 1990). The
recently isolated thermophilic bacterium Moorella perchloratireducens (ATCC BAA
18
1531), which is closely related to the above mentioned bacterial species, resorted to
acetogenesis in the absence of perchlorate (Balk et al., 2008).
Acetogenic hydrogenation (Eq. 2.11) has also been observed in thermophiles. C.
thermoaceticum, capable of growth on CO, grew chemolithotrophically on H2 and CO2
forming acetate. The doubling time was 18 h at a temperature of 55 °C (Kerby & Zeikus,
1983). A similar growth physiology was also observed in Acetogenium kivui (ATCC
33488) (Daniel et al., 1990). This thermophilic anaerobic bacterium formed acetate by
chemolithotrophic growth on H2 and CO2 with a doubling time of 2 h, at a temperature of
66 °C and pH of 6.8.
For generation of electricity in an MFC the above mentioned thermophilic bacterial
species have to be co-cultured with thermophilic electricigenic microorganisms capable of
using acetate as an electron donor. Although the microorganisms studied for generation of
electricity in an MFC are predominantly mesophilic (e.g. G. sulfurreducens or G.
metallireducens), successful MFC operation under thermophilic conditions has been
demonstrated. Choi (2004), used thermophilic bacteria Bacillus licheniformis and Bacillus
thermoglucosidasius (with a redox mediator) for electricity generation. The best efficiency
was achieved within the temperature range of 50–60 °C. Mediatorless MFC operation
under thermophilic conditions was reported by Jong et al., (2006). The MFC was
inoculated with anaerobic digester effluent and fed with sodium acetate. The maximum
power density was achieved during MFC operation at 55 °C. Based on the 16S rRNA
analysis, only 13 different patterns of anodic bacterial populations were observed, of which
5 patterns showed the highest homology to an uncultured clone E4, which was initially
identified as a member of a thermophilic microbial community in a lab scale methanol-fed
19
anaerobic digester. Seven patterns were related to genus Coprothermobacter and one
pattern was related to Thermodesulfovibrio spp.
In the study by Mathis et al. (2008), thermophilic bacteria selected from sediment MFC
were used to colonize the anode of an acetate and cellulose-fed MFCs. Cloning and
sequencing of the biofilm formed at the anode of the acetate fed MFC showed the presence
of Deferribacters and Fermicutes. Interestingly, 48 clones (out of 64) of Fermicutes had
RFLP patterns and sequences (99%) most similar to that of Thermincola carboxydophila, a
hydrogenogenic CO oxidizing thermophilic microorganism (Mathis et al., 2008).
Firmicutes spp. were also identified during thermophilic MFC operation by Wringhton et
al. (2008). This study provided a detailed analysis of microbial community dynamics in an
acetate fed MFC inoculated with sludge collected from a thermophilic anaerobic digester.
The dominant members of the electricity producing community were identified using clone
library analysis. The results showed the dominance of Firmicutes spp. (80 % of the clone
library sequences). Within Firmicutes, sequences belonging to Thermicanus,
Alicyclobacillus and Thermincola were identified representing 27%, 25% and 22 % of the
total clones, respectively. The study was well complemented by the demonstration of
electricity production in an MFC inoculated with a pure strain of Thermincola sp. Strain JR,
representing direct anode reduction by a member of Fermicutes phylum (Wrighton et al.,
2008).
As electricity generation has never been an evolutionary pressure per se, but rather
the capacity for electron transfer to natural extracellular electron acceptors, it is likely that
the ability of the microorganism to produce electricity is closely correlated to their capacity
to transfer electrons onto extracellular acceptors, such as Fe(III) and Mn(IV) oxides and
20
humic substances (Logan, 2009; Lovley, 2006; Lovley et al., 2004). Hence, the prospect
for electricigenic microorganisms could include any microorganism capable of
extracellular electron transfer, even if their capacity for electricity generation has not yet
been experimentally evidenced (Lovley et al., 2004). To this respect, hyper-thermophiles
Ferroglobus placidus (DSM 10642) and Geoglobus ahangari (ATCC BAA 425) were
reported to grow at 85 C by coupling acetate oxidation to Fe(III) reduction (Tor et al.,
2001). Also, Deferribacter thermophilus (DSM 14813) isolated from a petroleum reservoir
(UK) was able to grow by the reduction of Fe(III) and Mn(IV) and nitrate in the presence
of acetate, yeast extract, peptone, and other carbon sources in the temperature range of
50–65 °C (Greene et al., 1997). Kashefi et al. (2003) reported the isolation of a bacterial
strain belonging to the Geobacteraceae family exhibiting thermophilic growth. The
bacterium, Geothermobacter ehrlichii (DSM 15274) isolated from a hydrothermal vent
coupled acetate oxidation to Fe(III) reduction, with an optimum growth temperature of
55 °C. This strain is the first member in the Geobacteraceae family reported to be capable
of thermophilic growth. Fe(III) reduction coupled to acetate oxidation has also been
demonstrated by the bacterium Thermincola ferriacetica (DSM 14005) (Zavarzina et al.,
2007). Overall, a broad range of thermophilic electricigenic microorganisms might be
capable of forming a syntrophic consortium with thermophilic carboxidotrophic
microorganisms for efficient operation of a syngas-fed MFC.
21
2.4.2 Syngas conversion to electricity by hydrogenogenic and electricigenic
microorganisms (CO H2 e-)
Biological water gas shift reaction and electricigenesis at mesophilic temperatures
This pathway leads to CO conversion to H2 through the biological water gas shift
reaction (BWGSR) followed by H2 utilization as an electron donor by electricigenic
bacteria. Indeed, the ability of CO dependent H2 production by mesophilic bacteria such as
Rubrivivax gelatinosus (Maness et al., 2005), Rhodospirilum rubrum (Singer et al., 2006),
Rhodopseudomonas palustris P4, and Citrobacter sp Y19 (Henstra et al., 2007) has been
reported. R. gelatinosus uses CO as the sole carbon source (with a doubling time of 2
days), leading to the generation of H2 according to the following stoichiometric equation,
which describes the water-gas shift reaction (Maness et al., 2005) :
CO + H2O H2+ CO2 ................................................................................................................................. (2.13)
Similarly, the exposure of R. rubrum to CO leads to H2 production according to Eq.
(2.13) due to the stimulation of a CO oxidizing – H2 evolving enzymatic system (Singer et
al., 2006). In a syngas-fed MFC this pathway is expected to maximize the Coulombic
efficiency of syngas transformation, as compared to H2 utilization through acetate
formation. To conclude, a mixed culture of electricigenic and mesophilic carboxydotrophic
hydrogenogenic bacteria would allow for CO conversion to H2 and the subsequent use of
the H2 produced from CO and H2 present in syngas for electricity generation.
Biological water gas shift reaction and electricigenesis at thermophilic temperatures
The sequence of bioreactions described above is also expected to proceed under the
thermophilic conditions since thermophilic oxidation of CO leading to H2 evolution is a
widespread trait found among several recently isolated carboxydotrophic microorganisms.
22
Carboxydotrophic microorganisms such as Thermolithobacter carboxydivorans (DSM
7242), Carboxydothermus hydrogenoformans (DSM 6008), T. carboxydophila (DSM
17129), Carboxydocella thermoautotrophica (DSM 12326), Themolithobacter
carboxydivorans, and Carboxydibrachium pacificum (ATCC BAA 271) produce H2 from
CO oxidation under thermophilic growth conditions (Sokolova et al., 2007; Sokolova et al.,
2009; Sokolova et al., 2005; Sokolova et al., 2002). A number of carboxydotrophic
microorganisms capable of hydrogenogenic activity have been isolated from marine
hydrothermal vents (Henstra et al., 2007; Sokolova et al., 2009). C. pacificum, isolated
from a submarine hot vent grew chemolithotrophically on CO producing equimolar
quantities of H2 and CO2. Its growth was observed between 50 and 80 °C with an optimum
temperature of 70 °C (Sokolova et al., 2002). Likewise, C. thermautotrophica, a
thermophilic CO utilizing bacterium isolated from a terrestrial hot vent on the Kamchatka
Peninsula (Russia) produced H2 and CO2 with a generation time of 1.1 h at a temperature
of 58 C and pH 7. Carboxydocella sporoproducens (DSM 16521), also isolated from hot
springs of karymshoe Lake, Kamchatka Peninsula (Russia) grows chemolithotrophically
on CO (doubling time of 1 h) producing equimolar quantities of CO2 and H2. The
temperature and optimum pH were observed to be 60 °C and 6.8, respectively (Slepova et
al., 2006). Sokolova et al. (2005) reported the isolation of the alkali-tolerant
carboxydotrophic hydrogenic bacterium, T. carboxydophila, from a hot spring of the
Baikal Lake region, Russia. CO was found to be the sole source of energy for this
bacterium. For lithotrophic growth of T. carboxydiphila, acetate or yeast extract were
required, but these substrates did not support growth in the absence of CO. Neither acetate
nor methanol formation was detected during its growth on CO.
23
Similar to the mesophilic co-culture, a co-culture of thermophilic hydrogenogenic
carboxydotrophic microorganisms with H2 utilizing thermophilic electricigenic
microorganisms such as D. thermophilus or Pyrobaculum islandicum (DSM 4184) could
be used for electricity generation in a syngas-fed MFC. D. thermophilus was able to grow
by the reduction of Fe(III), Mn(IV) and nitrate in the presence of H2. Similarly, P.
islandicum is able to reduce Fe(III) and Mn(IV) with H2 as an electron donor (Kashefi &
Lovley, 2000). Thermolithobacter ferrireducens (ATCC 700985) reduces Fe(III),
anthraquinone-2,6-disulfonate(AQDS), thiosulfate and fumarate with H2 serving as the
electron donor in a temperature range of 50–75 °C (Sokolova et al., 2007).
2.4.3 Direct Conversion of CO to electricity by axenic cultures of Fe(III) and sulfate
reducing thermophiles
While direct conversion of H2 to electricity has been experimentally demonstrated
(Bond & Lovley, 2003), electricigenic bacteria growth on CO has not yet been
demonstrated. Nevertheless, Sokolova et al. (2004) reported the isolation of a new
anaerobic facultative carboxydotrophic bacterium from a hot spring at Norris basin
(Yellowstone National Park, US). The bacterium, Thermosinus carboxydivorans (DSM
14886), grew at temperatures between 40 and 68 °C (with an optimum at 60 °C) at
neutrophilic conditions. The bacterium could utilize CO as its sole energy source with a
doubling time of 1.15 h leading to the formation of H2 and CO2 in equimolar quantitites.
Fe(III) was also reduced during its growth on sucrose and lactose. The species was the first
metal reducing carboxydotrophic bacterium to be reported (Sokolova et al., 2004).
Similarly, Carboxydothermus ferrireducens (DSM 11255) also isolated from Yellowstone
National Park (Henstra & Stams, 2004; Sokolova et al., 2009), has the ability to use CO as
24
an electron donor for AQDS and fumarate reduction. Fumarate, AQDS, ferric iron and
thiosulfate could serve as electron acceptors during its growth on glycerol and H2.
Hydrogen or acetate production was not observed during its growth on CO. In contrast,
Carboxydothermus siderophilus (DSM 21278) isolated from hot spring of Geyser Valley
(Kamchatka Peninsula, Russia), produced H2 and CO2 along with Fe(III) and AQDS
reduction during its growth on CO (Slepova et al., 2009). However, the doubling time for
C. siderophilus (9.3 h) on CO was much longer than that of T. carboxydivorans (1.15 h).
Balk et al. (2008) reported the isolation of Moorella perchloratireducens, the thermophilic
gram positive bacterium with the ability to use perchlorate as a terminal electron acceptor.
This strain was able to use CO, methanol, pyruvate, glucose, fructose, mannose, xylose,
pectin and cellobiose for its growth.
T. ferriacetica (DSM 14005), isolated from ferric deposits of a terrestrial hydrothermal
spring (Kunashir Island, Russia), is a thermophilic facultative chemolithoautotrophic
anaerobic bacterium. It was able to utilize H2 and acetate as energy sources, with Fe(III)
serving as the electron acceptor. Also, it was able to grow in an atmosphere of 100% CO
(as the sole energy source), leading to the formation of H2 and CO2. However, it required
0.2 g/L of acetate as its carbon source during its growth on CO (Zavarzina et al., 2007). C.
hydrogenoformans, a close relative of T. ferrireducens, oxidized CO and H2 using AQDS
as an electron acceptor. CO2 and H2 were formed during its growth on CO.
It should be noted that most of the metal-reducing carboxydotrophic organisms are
thermophiles. High temperatures may be more favorable as less cooling of syngas would
be required (Henstra et al., 2007). Although MFC operation at thermophilic temperatures is
expected to have a detrimental effect on the CO solubility in the anodic liquid, this is
25
counteracted by the increase in the mass transfer rate with increasing temperature (Drew,
1981). Elevated temperatures would also lead to reduced O2 solubility, which is beneficial
considering the sensitivity of carboxydotrophs to O2 (Davidova et al., 1994).
2.5 Design considerations for electricity generation from CO/syngas in an MFC
Apart from the biological system, the efficient generation of electricity in a CO/syngas-
fed MFC would also require the optimization of the MFC design to counter the two major
challenges posed by a gaseous substrate such as syngas: gas to liquid mass transfer
limitations, and the poisoning of the cathode by CO and other toxic gases.
2.5.1 Membrane systems for improved mass transfer efficiency
For sparingly soluble gases such as CO and H2, the primary resistance to gas transport is
in the liquid film at the gas-liquid interface. Although the conventional continuous stirred
tank reactors could be used, the high impeller speeds require a high power input (Henstra
et al., 2007; Hickey et al., 2008) and leads to biofilm shearing, causing a decrease in the
growth of shear-sensitive microorganisms (Munasinghe & Khanal, 2010).
Bubble-free gas transfer to liquid can be accomplished by the selection of a membrane
system with a high selectivity for the gaseous substrate. The membrane systems offer an
efficient and a relatively inexpensive method for gas–liquid mass transfer (Scott and
Hughes 1996). A wide range of micro-porous and non-porous membranes are
commercially available and can be selected based on the substrate and process conditions.
Depending upon the gas and process operational characteristics, a dense polymer or a
micro-porous membrane could be employed. In a dense polymer membrane, the gas is
absorbed in the polymer at the high pressure end and is carried to the liquid (lower pressure
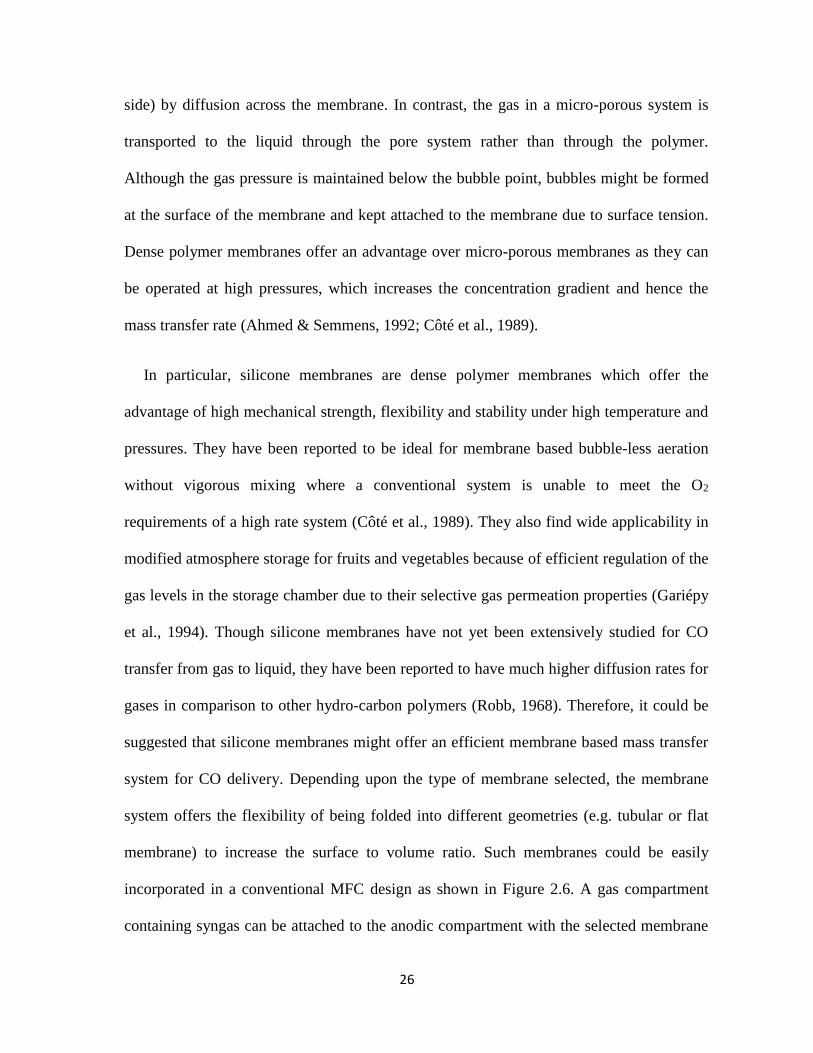
26
side) by diffusion across the membrane. In contrast, the gas in a micro-porous system is
transported to the liquid through the pore system rather than through the polymer.
Although the gas pressure is maintained below the bubble point, bubbles might be formed
at the surface of the membrane and kept attached to the membrane due to surface tension.
Dense polymer membranes offer an advantage over micro-porous membranes as they can
be operated at high pressures, which increases the concentration gradient and hence the
mass transfer rate (Ahmed & Semmens, 1992; Côté et al., 1989).
In particular, silicone membranes are dense polymer membranes which offer the
advantage of high mechanical strength, flexibility and stability under high temperature and
pressures. They have been reported to be ideal for membrane based bubble-less aeration
without vigorous mixing where a conventional system is unable to meet the O2
requirements of a high rate system (Côté et al., 1989). They also find wide applicability in
modified atmosphere storage for fruits and vegetables because of efficient regulation of the
gas levels in the storage chamber due to their selective gas permeation properties (Gariépy
et al., 1994). Though silicone membranes have not yet been extensively studied for CO
transfer from gas to liquid, they have been reported to have much higher diffusion rates for
gases in comparison to other hydro-carbon polymers (Robb, 1968). Therefore, it could be
suggested that silicone membranes might offer an efficient membrane based mass transfer
system for CO delivery. Depending upon the type of membrane selected, the membrane
system offers the flexibility of being folded into different geometries (e.g. tubular or flat
membrane) to increase the surface to volume ratio. Such membranes could be easily
incorporated in a conventional MFC design as shown in Figure 2.6. A gas compartment
containing syngas can be attached to the anodic compartment with the selected membrane
27
system acting as a wall between the anodic liquid and gas phase. The replacement of the
sparger system utilized in the study of Mehta et al. (2010) with a membrane system would
offer the added vantage of a more compact design. Indeed, the sparger used in the
experiments carried out by Mehta et al. (2010) required a 50% increase of the anodic
compartment. Thus, a membrane-based MFC is expected to have a higher volumetric
efficiency. The details of different membrane systems made up of polyvinyl fluoride,
polyethylene, polyvinyl chloride and other polymeric materials can be found elsewhere
(Hickey et al., 2008; Scott & Hughes, 1996).
Apart from the membrane systems discussed above, other promising alternatives to
conventional stirred tank reactors for increased gas-liquid mass transfer include monolith
packing and columnar reactors. Monolith packing consists of a number of narrow, straight
and parallel flow channels with a large open frontal area which allows for a low flow
resistance, leading to low pressure drops and low energy losses. High volumetric mass
transfer rates of ~ 1 s-1 and a reduction in power needed of up to 50 – 80% as compared to
conventional reactors makes monolith reactors an economically viable option (Hickey et
al., 2008; Munasinghe & Khanal, 2010). Similarly, columnar reactors such as bubble
column, trickle bed and airlift reactors offer the advantage of a high gas – liquid mass
transfer rate with low operational and maintenance costs. KLa values within the range of
18–860 h-1 have been reported for such reactors and can be found well summarized
elsewhere (Bredwell et al., 1999; Charpentier, 1981; Munasinghe & Khanal, 2010).
Various reactor design improvements such as the low frequency vibration of liquid phase
in a bubble column reactor, the addition of static mixers, baffles, perforated plates, jet loop
and forced circulation loop in internal and external loop airlift reactors promises further
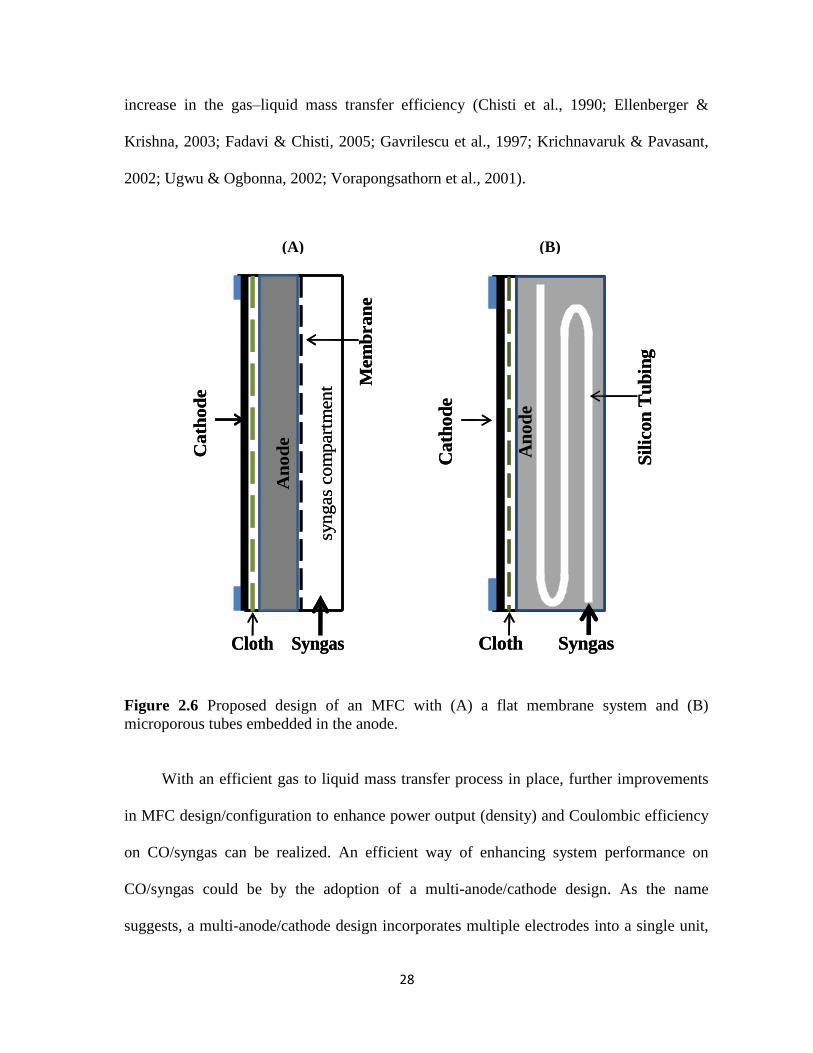
28
increase in the gas–liquid mass transfer efficiency (Chisti et al., 1990; Ellenberger &
Krishna, 2003; Fadavi & Chisti, 2005; Gavrilescu et al., 1997; Krichnavaruk & Pavasant,
2002; Ugwu & Ogbonna, 2002; Vorapongsathorn et al., 2001).
Figure 2.6 Proposed design of an MFC with (A) a flat membrane system and (B)
microporous tubes embedded in the anode.
With an efficient gas to liquid mass transfer process in place, further improvements
in MFC design/configuration to enhance power output (density) and Coulombic efficiency
on CO/syngas can be realized. An efficient way of enhancing system performance on
CO/syngas could be by the adoption of a multi-anode/cathode design. As the name
suggests, a multi-anode/cathode design incorporates multiple electrodes into a single unit,
Cath
od
e
Mem
bran
e
An
od
e
Cloth Syngas
syngas
com
part
ment
Cath
od
e
Mem
bran
e
An
od
e
Cloth Syngas
syngas
com
part
ment
Cath
od
e
Sil
icon
Tu
bin
g
An
od
e
Cloth Syngas
Cath
od
e
Sil
icon
Tu
bin
g
An
od
e
Cloth Syngas
(A) (B)

29
allowing for increased anodic and cathodic specific area (electrode area/reactor volume).
On CO/syngas, increased anodic specific area may allow for increased density of
carboxydotrophic and homo-acetogenic microorganisms and correspondingly high
CO/syngas transformation efficiency, which when matched with increased electricigenic
and cathodic activity may result in high volumetric power output and Coulombic efficiency.
Considerable improvement in power outputs and Coulombic efficiency on waste water and
other liquid substrates with the adoption of a multi-anode/cathode MFC configuration has
been reported recently (Jiang et al., 2011; Jiang et al., 2010). The design for a CO/syngas-
fed multi-anode/cathode MFC is provided is Figure 2.7.
Figure 2.7 Proposed design of a syngas-fed multi-anode/cathode MFC
30
2.5.2 Non-noble catalysts for improved cathode stability
The development of an efficient MFC system for the generation of electricity from
CO/syngas requires a CO-tolerant cathode. The most extensively used cathode material in
a conventional MFC consists of a carbon paper with a Pt/C catalyst (Logan, 2008). Even
though the Pt-based cathode demonstrates high electrochemical activity, the use of Pt is
undesirable due to high costs and easy inhibition by CO (Herrmann et al., 2009; Logan,
2008). Even at small concentrations, CO can fully cover the Pt surface, thereby reducing
the reaction site. CO is easily able to absorb to Pt due to the negative free energy of
adsorption (Baschuk & Li, 2001). This phenomenon also poses a challenge for other
conventional fuel cells such as direct methanol fuel cells and proton exchange membrane
fuel cells (PEMFC), where even trace amounts of CO present as fuel impurity can
seriously dampen the cells performance due to the relatively high loading of Pt at the
anode and cathode (Baschuk & Li, 2001; Ormerod, 2003; Song, 2002; Steele & Heinzel,
2001).
Jasinski (1964) was the first to report that transition metal porphyrines and
phthalocyanines demonstrated electrochemical activity towards oxygen reduction reaction
and therefore can be used as cathode catalyst in fuel cells. Studies testing less expensive
porphyrines and phthalocyanines as cathode catalyst in MFC such as Fe(II) phthalocyanine
(FePc), and Fe(III) tetramethoxyphenyl porphyrin (FeTMPP), and Co
tetramethoxyphenylporphyrin (CoTMPP) showed that these non-noble metal cathode
catalysts can generate power equal to that obtained for Pt based carbon cathodes (Birry et
al., 2010; HaoYu et al., 2009; Harnisch et al., 2009; Zhao et al., 2005). The use of
CoTMPP as a cathode catalyst was also demonstrated by Cheng et al. (2005) where the

31
performance of a CoTMPP air cathode was tested in a single chamber MFC. A maximum
power density of 369 ± 8 mW/m2 was obtained using CoTMPP/C catalyst, which was only
12% lower than that obtained with a Pt/C catalyst (Cheng et al., 2005). When Fe loading
was optimized for FePc-based cathodes, a similar power output was obtained in MFCs
operated with FePc cathodes containing 0.01-016 mg Fe/cm2 and 0.5 mg Pt/cm2 (Birry et al.
2010).
In the study conducted by Mehta et al. (2010), a CoTMPP cathode was used for
generation of electricity from CO with a cobalt (Co) load of 0.5 mg cm-2. This was the first
time that a CoTMPP cathode was used in an MFC operated on CO. In another study, we
also tested pyrolised CoTMPP, FeTMPP and CoTMPP/FeTMPP cathode catalysts on
acetate and CO (Neburchilov et al., 2011). An MFC operation on CO showed the best
performance with the CoTMPP/FeTMPP/C cathode catalyst. Considering the high cost of
Pt based cathodes and plausible decrease in activity with time, the use of
CoTMPP/FeTMPP/C or FePc cathodes is a step forward in increasing the efficiency of CO
operated MFCs.
2.6 Perspectives
Increasing energy demands, dwindling fossil fuel reserves, and environmental and
health concerns have forced us to look for clean and sustainable sources of energy. If
produced from biomass, syngas represents a renewable source of energy. An MFC
represents a novel technological solution for direct electricity production from syngas.
Significant improvements in design and operation have increased the power density and
applicability of MFC systems. Power densities of up to 1 kW/m3 under optimal operating
conditions have been achieved (Logan, 2010). The conversion of CO/syngas to electricity

32
in an MFC, though at a very early experimental stage, could offer some major advantages
such as high conversion efficiency, operation at temperatures in a range of 30-70C, low
maintenance requirements and operating costs, and most importantly resistance to CO
poisoning. With the performance of a CO/syngas-fed MFC with a mixed culture as
demonstrated recently, a detailed study of CO/syngas-operated MFC is of interest. This
study should include the improvement of the system design to enhance the CO/syngas gas
to liquid mass transfer, and possibly the development of stackable multi-anode/cathode
MFC configuration capable of efficient operation on gaseous substrates such as CO and H2.
Given, that electricity generation in an MFC is governed by biological activity;
characterization of the microbial communities and CO/syngas transformation pathways in
a mixed culture under mesophilic and thermophilic conditions is of equal importance.
2.7 References
Ahmed, T., Semmens, M.J. 1992. Use of sealed end hollow fibers for bubbleless
membrane aeration: experimental studies. J Membr Sci, 69, 1-10.
Balk, M., van Gelder, T., Weelink, S.A., Stams, A.J.M. 2008. (Per)chlorate Reduction by
the Thermophilic Bacterium Moorella perchloratireducens sp. nov., Isolated from
Underground Gas Storage. Appl Environ Microbiol, 74, 403-409.
Baschuk, J.J., Li, X. 2001. Carbon monoxide poisoning of proton exchange membrane fuel
cells. Int J Energ Res, 25, 695-713.
Bernalier, A., Willems, A., Leclerc, M., Rochet, V., Collins, M.D. 1996. Ruminococcus
hydrogenotrophicus sp. nov., a new H2/CO2-utilizing acetogenic bacterium isolated
from human feces. Arch Microbiol, 166, 176-183.
Birry, L., Mehta, P., Jaouen, F., Dodelet, J.P., Guiot, S.R., Tartakovsky, B. 2010.
Application of iron-based cathode catalysts in a microbial fuel cell. Electrochim Acta,
56, 1505-1511.
Bond, D.R., Lovley, D.R. 2003. Electricity Production by Geobacter sulfurreducens
Attached to Electrodes. Appl Environ Microbiol, 69, 1548-1555.
33
Braun, M., Gottschalk, G. 1982. Acetobacterium Wieringae sp. nov., a new species
producing acetic acid from molecular hydrogen and carbon dioxide Zentralbl Bakteriol
Microbiol Hyg C3, 368-376.
Braun, M., Mayer, F., Gottschalk, G. 1981. Clostridium aceticum (Wieringa), a
microorganism producing acetic acid from molecular hydrogen and carbon dioxide.
Arch Microbiol, 128, 288-293.
Bredwell, M.D., Srivastava, P., Worden, R.M. 1999. Reactor Design Issues for Synthesis-
Gas Fermentations. Biotechnol Prog, 15, 834-844.
Charpentier, J.C. 1981. Advances in Chemical Engineering. Elsevier, NY, USA.
Cheng, S., Liu, H., Logan, B.E. 2005. Power Densities Using Different Cathode Catalysts
(Pt and CoTMPP) and Polymer Binders (Nafion and PTFE) in Single Chamber
Microbial Fuel Cells. Environ Sci Technol, 40, 364-369.
Chisti, Y., Kasper, M., Moo-Young, M. 1990. Mass transfer in external-loop airlift
bioreactors using static mixers. Can J Chem Eng, 68, 45-50.
Choi, Y. 2004. Construction of microbial fuel cells using thermophilic microorganisms,
Bacillus licheniformis and Bacillus thermoglucosidasius. Bull Korean Chem Soc, 25,
813-818.
Côté, P., Bersillon, J.-L., Huyard, A. 1989. Bubble-free aeration using membranes: mass
transfer analysis. J Membr Sci, 47, 91-106.
Daniel, S.L., Hsu, T., Dean, S.I., Drake, H.L. 1990. Characterization of the H2 and CO-
dependent chemolithotrophic potentials of the acetogens Clostridium thermoaceticum
and Acetogenium kivui. J Bacteriol, 172, 4464-4471.
Davidova, M., Tarasova, N., Mukhitova, F., Karpilova, I. 1994. Carbon monoxide in
metabolism of anaerobic bacteria. Can J Microbiol, 40, (417-425).
Demirbas, A. 2001. Biomass resource facilities and biomass conversion processing for
fuels and chemicals. Energ Convers Manag, 42, 1357-1378.
Demirbas, A. 2007. Progress and recent trends in biofuels. Progr Energ Combust Sci, 33,
1-18.
Drake, H.L., Daniel, S.L. 2004. Physiology of the thermophilic acetogen Moorella
thermoacetica. Res Microbiol, 155, 869-883.
Drew, T.B. 1981. Adances in Chemical Engineering. Elsevier, NY,USA.
Ellenberger, J., Krishna, R. 2003. Shaken, not stirred, bubble column reactors:
Enhancement of mass transfer by vibration excitement. Chem Eng Sci, 58, 705-710.

34
Faaij, A., van Ree, R., Waldheim, L., Olsson, E., Oudhuis, A., van Wijk, A., Daey-Ouwens,
C., Turkenburg, W. 1997. Gasification of biomass wastes and residues for electricity
production. Biomass Bioenerg, 12, 387-407.
Fadavi, A., Chisti, Y. 2005. Gas-liquid mass transfer in a novel forced circulation loop
reactor. Chem Eng J, 112, 73-80.
Gariépy, Y., Raghavan, G.S.V., Munroe, J.A. 1994. Long-term storage of leek stalks under
regular and controlled atmospheres. Int J Refrig, 17, 140-144.
Gavrilescu, M., Roman, R.V., Tudose, R.Z. 1997. Hydrodynamics in external-loop airlift
bioreactors with static mixers. Bioproc Biosystems Eng, 16, 93-99.
Genthner, B.R.S., Bryant, M.P. 1987. Additional characteristics of one-carbon-compound
utilization by Eubacterium limosum and Acetobacterium woodii. Appl Environ
Microbiol, 53, 471-476.
Greene, A.C., Patel, B.K.C., Sheehy, A.J. 1997. Deferribacter thermophilus gen. nov., sp.
nov., a Novel Thermophilic Manganese- and Iron-Reducing Bacterium Isolated from a
Petroleum Reservoir. Int J Syst Bacteriol, 47, 505-509.
HaoYu, E., Cheng, S., Logan, B., Scott, K. 2009. Electrochemical reduction of oxygen
with iron phthalocyanine in neutral media. . J Appl Electrochem, 39, 705-711.
Harnisch, F., Wirth, S., Schröder, U. 2009. Effects of substrate and metabolite crossover on
the cathodic oxygen reduction reaction in microbial fuel cells: Platinum vs. iron(II)
phthalocyanine based electrodes. Electrochem Communications, 11, 2253-2256.
Henstra, A., Sipma, J., Rinzema, A., Stams, J. 2007. Microbiology of synthesis gas
fermentation for biofuel production. Current Opinion Biotechnol, 18, 200-206.
Henstra, A.M., Stams, A.J.M. 2004. Novel Physiological Features of Carboxydothermus
hydrogenoformans and Thermoterrabacterium ferrireducens. Appl Environ Microbiol,
70, 7236-7240.
Herrmann, I., Kramm, U.I., Fiechter, S., Bogdanoff, P. 2009. Oxalate supported pyrolysis
of CoTMPP as electrocatalysts for the oxygen reduction reaction. Electrochimica Acta,
54, 4275-4287.
Hickey, R., Datta, R., Tsai, s.-P., Basu, R. 2008. Memrane supported bioreactor for
conversion of syngas components to liquid products, (Ed.) U.S.P. Publication, Vol. US
200/0305539 A1. US, pp. 1-5.
Ishii, S.i., Watanabe, K., Yabuki, S., Logan, B.E., Sekiguchi, Y. 2008. Comparison of
Electrode Reduction Activities of Geobacter sulfurreducens and an Enriched

35
Consortium in an Air-Cathode Microbial Fuel Cell. Appl Environ Microbiol, 74, 7348-
7355.
Jiang, D., Curtis, M., Troop, E., Scheible, K., McGrath, J., Hu, B., Suib, S., Raymond, D.,
Li, B. 2011. A pilot-scale study on utilizing multi-anode/cathode microbial fuel cells
(MAC MFCs) to enhance the power production in wastewater treatment. Int
J.Hydrogen Energ, 36, 876-884.
Jiang, D., Li, X., Raymond, D., Mooradain, J., Li, B. 2010. Power recovery with multi-
anode/cathode microbial fuel cells suitable for future large-scale applications. Int J
Hydrogen Energ, 35, 8683-8689.
Jong, B.C., Kim, B.H., Chang, I.S., Liew, P.W.Y., Choo, Y.F., Kang, G.S. 2006.
Enrichment, Performance, and Microbial Diversity of a Thermophilic Mediatorless
Microbial Fuel Cell. Environ Sci Technol, 40, 6449-6454.
Kashefi, K., Lovley, D.R. 2000. Reduction of Fe(III), Mn(IV), and Toxic Metals at 100 C
by Pyrobaculum islandicum. Appl Environ Microbiol, 66, 1050-1056.
Kerby, R., Zeikus, J.G. 1983. Growth ofClostridium thermoaceticum on H2/CO2 or CO as
energy source. Curr Microbiol, 8, 27-30.
Kim, D., Chang, I. 2009. Electricity generation from synthesis gas by microbial processes:
CO fermentation and microbial fuel cell technology. Bioresour Technol, 100, 4527-
4530.
Krichnavaruk, S., Pavasant, P. 2002. Analysis of gas-liquid mass transfer in an airlift
contactor with perforated plates. Chem Eng J, 89, 203-211.
Logan, B. 2008. Microbial Fuel Cells. John Wiley & Sons Inc., Hoboken, NJ, USA.
Logan, B. 2010. Scaling up microbial fuel cells and other bioelectrochemical systems. Appl
Microbiol Biotechnol, 85, 1665-1671.
Logan, B.E. 2009. Exoelectrogenic bacteria that power microbial fuel cells. Nat Rev Micro,
7, 375-381.
Logan, B.E., Regan, J.M. 2006. Electricity-producing bacterial communities in microbial
fuel cells. Trends in Microbiology, 14, 512-518.
Lorowitz, W.H., Bryant, M.P. 1984. Peptostreptococcus productus strain that grows
rapidly with CO as the energy source. Appl Environ Microbiol, 47, 961-964.
Lovley, D.R. 2006. Bug juice: harvesting electricity with microorganisms. Nat Rev Micro,
4, 497-508.
36
Lovley, D.R. 2008. The microbe electric: conversion of organic matter to electricity.
Current Opinion Biotechnol., 19, 564–571.
Lovley, D.R., Holmes, D.E., Nevin, K.P. 2004. Dissimilatory Fe(III) and Mn(IV)
Reduction. Adv Microb Physiol, 49, 219-286.
Maness, P.C., Huang, J., Smolinski, S., Tek, V., Vanzin, G. 2005. Energy Generation from
the CO Oxidation-Hydrogen Production Pathway in Rubrivivax gelatinosus. Appl.
Environ. Microbiol., 71, 2870-2874.
Mathis, B., Marshall, C., Milliken, C., Makkar, R., Creager, S., May, H. 2008. Electricity
generation by thermophilic microorganisms from marine sediment. Appl Microbiol
Biotechnol, 78, 147-155.
Mehta, P., Hussain, A., Raghavan, V., Neburchilov, V., Wang, H., Tartakovsky, B., Guiot,
S. 2010. Electricity generation from a carbon monoxide in a single chamber microbial
fuel cell. Enzyme Microb Technol, 46, 450-455.
Methe, B.A., Nelson, K.E., Eisen, J.A., Paulsen, I.T., Nelson, W., Heidelberg, J.F., Wu, D.,
Wu, M., Ward, N., Beanan, M.J., Dodson, R.J., Madupu, R., Brinkac, L.M., Daugherty,
S.C., DeBoy, R.T., Durkin, A.S., Gwinn, M., Kolonay, J.F., Sullivan, S.A., Haft, D.H.,
Selengut, J., Davidsen, T.M., Zafar, N., White, O., Tran, B., Romero, C., Forberger,
H.A., Weidman, J., Khouri, H., Feldblyum, T.V., Utterback, T.R., Van Aken, S.E.,
Lovley, D.R., Fraser, C.M. 2003. Genome of Geobacter sulfurreducens: Metal
Reduction in Subsurface Environments. Science, 302, 1967-1969.
Munasinghe, P.C., Khanal, S.K. 2010. Biomass-derived syngas fermentation into biofuels:
Opportunities and challenges. Bioresour Technol, 101, 5013-5022.
Neburchilov, V., Mehta, P., Hussain, A., Raghavan, V., Wang, H., Guiot, S., Tartakovsky,
B. 2011. Microbial Fuel Cell Operation On Carbon Monoxide: Cathode Catalyst
Selection. Int J Hydrogen Energ, 36, 11929-11935.
Ormerod, M.R. 2003. Solid oxide fuel cells. Chem Soc Rev, 32, 17-28.
Pant, D., Van Bogaert, G., Diels, L., Vanbroekhoven, K. 2010. A review of the substrates
used in microbial fuel cells (MFCs) for sustainable energy production. Bioresour
Technol, 101, 1533-1543.
Rinaldi, A., Mecheri, B., Garavaglia, V., Licoccia, S., Di Nardo, P., Traversa, E. 2008.
Engineering materials and biology to boost performance of microbial fuel cells: a
critical review. Energy Environment Sci, 1, 417-429.
Rismani-Yazdi, H., Carver, S.M., Christy, A.D., Tuovinen, O.H. 2008. Cathodic
limitations in microbial fuel cells: An overview. J Power Sourc, 180, 683-694.
37
Robb, W.L. 1968. Thin silicon membranes-their permeation properties and some
applications. Annals of the New York Academy of Sciences, 146, 119-137.
Savage, M.D., Wu, Z.G., Daniel, S.L., Lundie, L.L., Jr, Drake, H.L. 1987. Carbon
monoxide-dependent chemolithotrophic growth of Clostridium thermoautotrophicum.
Appl Environ Microbiol, 53, 1902-1906.
Scott, K., Hughes, R. 1996. Industrial Membrane Separation Technology. Blackie
Academic & Professional, Glasgow, UK.
Singer, S.W., Hirst, M.B., Ludden, P.W. 2006. CO-dependent H2 evolution by
Rhodospirillum rubrum: Role of CODH:CooF complex. Biochimica et Biophysica Acta
(BBA) - Bioenergetics, 1757, 1582-1591.
Sipma, J., Henstra, A.M., Parshina, S.N., Lens, P.N.L., Lettinga, G., Stams, A.J.M. 2006.
Microbial CO Conversions with Applications in Synthesis Gas Purification and Bio-
Desulfurization. Crit Rev Biotechnol, 26, 41 - 65.
Slepova, T.V., Sokolova, T.G., Kolganova, T.V., Tourova, T.P., Bonch-Osmolovskaya,
E.A. 2009. Carboxydothermus siderophilus sp. nov., a thermophilic, hydrogenogenic,
carboxydotrophic, dissimilatory Fe(III)-reducing bacterium from a Kamchatka hot
spring. Int J Syst Evol Microbiol, 59, 213-217.
Slepova, T.V., Sokolova, T.G., Lysenko, A.M., Tourova, T.P., Kolganova, T.V.,
Kamzolkina, O.V., Karpov, G.A., Bonch-Osmolovskaya, E.A. 2006. Carboxydocella
sporoproducens sp. nov., a novel anaerobic CO-utilizing/H2-producing thermophilic
bacterium from a Kamchatka hot spring. Int J Syst Evol Microbiol, 56, 797-800.
Sokolova, T., Hanel, J., Onyenwoke, R.U., Reysenbach, A.L., Banta, A., Geyer, R.,
Gonzalez, J.M., Whitman, W.B., Weigel. 2007. Novel chemolithotrophic, thermophilic,
anaerobic bacteria Thermolithobacter ferrireducens gen. nov., sp. nov. and
Thermolithobacter carboxydivorans sp. nov. Extremophiles, 11, 145-157.
Sokolova, T.G., Gonzalez, J.M., Kostrikina, N.A., Chernyh, N.A., Slepova, T.V., Bonch-
Osmolovskaya, E.A., Robb, F.T. 2004. Thermosinus carboxydivorans gen. nov., sp.
nov., a new anaerobic, thermophilic, carbon-monoxide-oxidizing, hydrogenogenic
bacterium from a hot pool of Yellowstone National Park. Int J Syst Evol Microbiol, 54,
2353-2359.
Sokolova, T.G., Henstra, A.-M., Sipma, J., Parshina, S.N., Stams, A.J.M., Lebedinsky,
A.V. 2009. Diversity and ecophysiological features of thermophilic carboxydotrophic
anaerobes. FEMS Microbiol Ecol, 68, 131-141.
Sokolova, T.G., Kostrikina, N.A., Chernyh, N.A., Kolganova, T.V., Tourova, T.P., Bonch-
Osmolovskaya, E.A. 2005. Thermincola carboxydiphila gen. nov., sp. nov., a novel
anaerobic, carboxydotrophic, hydrogenogenic bacterium from a hot spring of the Lake
Baikal area. Int J Syst Evol Microbiol, 55, 2069-2073.
38
Sokolova, T.G., Kostrikina, N.A., Chernyh, N.A., Tourova, T.P., Kolganova, T.V., Bonch-
Osmolovskaya, E.A. 2002. Carboxydocella thermautotrophica gen. nov., sp. nov., a
novel anaerobic, CO-utilizing thermophile from a Kamchatkan hot spring. Int J Syst
Evol Microbiol, 52, 1961-1967.
Song, C. 2002. Fuel processing for low-temperature and high-temperature fuel cells:
Challenges, and opportunities for sustainable development in the 21st century. Catal
today, 77, 17-49.
Steele, B.C.H., Heinzel, A. 2001. Materials for fuel-cell technologies. Nature, 414, 345-
352.
Tor, J.M., Kashefi, K., Lovley, D.R. 2001. Acetate Oxidation Coupled to Fe(III) Reduction
in Hyperthermophilic Microorganisms. Appl Environ Microbiol, 67, 1363-1365.
Ugwu, C.U., Ogbonna, J.C. 2002. Improvement of mass transfer characteristics and
productivities of inclined tubular photobioreactors by installation of internal static
mixers. Appl Microbiol Biotechnol, 58, 600-607.
Vorapongsathorn, T., Wongsuchoto, P., Pavasant, P. 2001. Performance of airlift
contactors with baffles. Chem Eng J, 84, 551-556.
Wrighton, K.C., Agbo, P., Warnecke, F., Weber, K.A., Brodie, E.L., DeSantis, T.Z.,
Hugenholtz, P., Andersen, G.L., Coates, J.D. 2008. A novel ecological role of the
Firmicutes identified in thermophilic microbial fuel cells. ISME J, 2, 1146-1156.
Zavarzina, D., Sokolova, T., Tourova, T., Chernyh, N., Kostrikina, N., Bonch-
Osmolovskaya, E. 2007. Thermincola ferriacetica sp. nov., a new anaerobic,
thermophilic, facultatively chemolithoautotrophic bacterium capable of dissimilatory
Fe(III) reduction. Extremophiles, 11, 1-7.
Zhao, F., Harnisch, F., Schröder, U., Scholz, F., Bogdanoff, P., Herrmann, I. 2005.
Application of pyrolysed iron(II) phthalocyanine and CoTMPP based oxygen reduction
catalysts as cathode materials in microbial fuel cells. Electrochem Commun, 7, 1405-
1410.

39
Connecting text
Following the review of literature, it is evident that one of the major engineering
challenges in efficient utilization and conversion of CO/syngas to electricity in an MFC is
the mass transfer limitations of these sparingly soluble gases in the liquid phase. To
counter this challenge, the following study evaluated the applicability of two different
configurations of dense polymer silicone membrane systems for efficient CO transfer into
the anodic liquid of an MFC. It was hypothesized that the flat silicone membrane system
and the thin wall silicone tubing could efficiently enhance CO gas to liquid mass transfer
with reduced reactor volumes, thereby allowing for increased CO transformation
efficiency and improved volumetric power outputs.
This study was published in Journal of Bioresource Technology (2011), 102; 10898-
10906.
40
CHAPTER 3
Use of silicone membranes to enhance gas transfer during microbial fuel
cell operation on carbon monoxide
3.1 Abstract
Electricity generation in a microbial fuel cell (MFC) using carbon monoxide (CO) or
synthesis gas (syngas) as an electron donor has been demonstrated recently. A major
challenge associated with CO or syngas utilization is the mass transfer limitation of these
sparingly soluble gases in the aqueous phase. This study evaluated the applicability of a
dense polymer silicone membrane and thin wall silicone tubing for improved CO transfer
in MFCs. Replacing the sparger used in our previous study with the membrane systems for
CO delivery resulted in improved CO transformation efficiency and MFC performance. A
power output and CO transformation efficiency of up to 18 mW -1
RL (normalized to anode
compartment volume) and 98 %, respectively, was obtained. The use of membrane systems
offers the advantage of improved mass transfer with reduced reactor volume, thus
increasing the volumetric power output of MFCs operating on a gaseous substrate such as
CO.
Key words: microbial fuel cell; carbon monoxide; silicone membrane; gas transfer
41
3.2 Introduction
Biomass represents a promising source of renewable energy (Song, 2002). The
gasification of biomass at high temperatures leads to the production of synthesis gas
(syngas), which mainly consists of carbon monoxide (CO) and hydrogen (H2). Syngas can
be converted to liquid (ethanol, methanol, butanol, etc.) or gaseous (H2, methane) fuels by
catalytic or microbial conversion (Henstra et al., 2007; Munasinghe & Khanal, 2010;
Sipma et al., 2006). Syngas produced by partial oxidation using air, has a varying
composition and a low heating value. It is often utilized for electricity generation by
internal combustion (Bridgwater, 2006), with intrinsically low conversion efficiency.
Direct conversion of syngas to electricity in a fuel cell offers a cleaner and a more efficient
process for electricity generation. However, fuel cells are sensitive to the changes in the
syngas composition (Kim & Chang, 2009; Song, 2002) and fuel impurities such as sulfur
compounds, with > 1 ppm sulfur leading to irreversible poisoning of the anode.
As an alternative, syngas could be converted to electricity in a microbial fuel cell (MFC)
(Kim & Chang, 2009; Mehta et al., 2010). This process relies on the ability of an anaerobic
consortium of electricigenic and carboxydotrophic microorganisms to produce electricity
from CO and H2. Such an MFC-based process might offer several advantages such as a
high transformation efficiency, a broad range of operating conditions, high bio-catalytic
activity and considerable resistance to poisoning by fuel impurities (Kim & Chang, 2009;
Mehta et al., 2010).
Kim and Chang (2009) demonstrated electricity generation from CO in a two-stage
reactor system, in which CO was first microbiologically converted to fermentation

42
products and the products were then fed to the second reactor (MFC). Instead of a two-
stage process, we demonstrated electricity generation in a single chamber MFC directly fed
with CO (Mehta et al., 2010). The maximum volumetric power output and CO
transformation efficiency of the system was 6.4 mW -1
RL and 53 %, respectively, and
although comparable with current literature, this was relatively low. Based on experimental
observations, Mehta et al. (2010), suggested that the performance of a CO-fed MFC could
be increased by adopting an efficient method for gas to liquid transfer, while optimizing
the anodic chamber and avoiding CO related inhibition of electricigenic microorganisms.
For sparingly soluble gases such as CO, the primary resistance to transport is in the
liquid side of the film at the gas-liquid interface (Bredwell et al., 1999; Riggs & Heindel,
2006). Membrane systems offer an efficient and relatively inexpensive method for gas-
liquid mass transfer with reduced reactor volumes (Munasinghe & Khanal, 2010; Scott &
Hughes, 1996). Thin synthetic polymer membranes have been studied considerably for
their mass transfer properties (Robb, 1968). Hence, either a dense polymer or a micro-
porous membrane could be employed in an MFC depending on the characteristics of the
gas and operating conditions of the process. In a dense polymer membrane, the gas is
absorbed into the polymer at high pressure and is carried into the liquid (lower pressure
side) by diffusion across the membrane (Yasuda & Lamaze, 1972). In contrast, the gas in a
micro-porous system is transported into the liquid through the pore system rather than
through the polymer (Côté et al., 1989). Dense polymer membranes, such as silicone
membranes, offer an advantage over micro-porous membranes as they can be operated
under high pressure conditions, which increase the concentration gradient and hence, the
mass transfer rate (Côté et al., 1989). Silicone membranes have been reported to be ideal

43
for membrane based bubble-less aeration without vigorous mixing where a conventional
system is unable to meet the O2 requirements of a higher rate system (Ahmed & Semmens,
1992; Côté et al., 1989). They also find wide applicability in modified atmosphere storage
for fruits and vegetables because of efficient regulation of the gas levels in the storage
chamber due to their selective gas permeation properties (Gariépy et al., 1994). Though
silicone membranes have not yet been extensively studied for CO transfer from gas to
liquid, they have been reported to have much higher diffusion rates for gases in
comparison to other hydrocarbon polymers (Robb, 1968). Therefore, it was hypothesized
that silicone membranes could offer an efficient membrane based mass transfer system for
CO.
The current study compares the flat silicone membrane and silicone tubing for CO
transfer to the anodic liquid and demonstrates MFC operation on CO and syngas at an
improved volumetric power output.
3.3 Materials and Methods
3.3.1 Membrane systems for CO transfer
The flat silicone membrane (SSP LLC, NY, USA) used in this study consisted of a fine
nylon fabric (52-54 g/m2) calendered with a thin uniform layer of silicone rubber (~90 µm).
The fabric enhanced the mechanical properties of the membrane, while the silicone rubber
was responsible for its gas permeation properties. A silicone tubing (VWR International
LLC, Radnor, PA, USA) with a wall thickness of 9 µm and an external diameter of 0.076
mm was used. The total surface area for the silicone membrane and the tubing used in the
tests was kept constant at 50 cm2.

44
3.3.2 Volumetric mass transfer coefficient (𝐊𝐋𝐚) estimation
The experimental set-up for determination of KLa consisted of a 50 mL test chamber
custom made (Wolltech, Montreal, Canada) from Makrolon (polycarbonate) plates filled
with tap water (Figs. 3.1A and 3.2A). Silicone tubing wound around a support was placed
directly inside the test chamber as shown in Fig. 3.1A. For the silicone membrane an extra
plate serving as the CO compartment was attached to the test chamber with the membrane
acting as a wall between the two compartments as shown is Fig. 3.2A. The inlet of the CO
compartment or the silicone tubing was connected to a CO bag, while the outlet was
connected to a manometer. Both, the CO compartment and the tubing were maintained at a
constant pressure throughout the experiment.
KLa values for CO were determined using the method described by Munasinghe and
Khanal (2010b), introducing a step change in dissolved CO concentration and then
evaluating the concentration as a function of time. For this condition, the desired CO flow
rate was set using a peristaltic pump connected to a timer prior to the start of the
experiment. A gas tight syringe was used to collect water samples from a sampling port in
the liquid recirculation line at regular intervals until the dissolved CO concentration
reached a steady state. The dissolved CO concentration was determined as described by
Lide and Frederikse (1995). The sampled liquid was transferred into a hermetically sealed
vial and placed in a 90 °C water bath for 10 min in order to achieve equilibrium between
the liquid and the gas phase. The gas in the headspace of the vial was then analyzed as
described below.
45
The KLa value was estimated based upon the mass balance equation dC/dt = KLa (Cct -
Ct) (Munasinghe & Khanal, 2010b), where Ct is the dissolved CO concentration at time t
and Cct is the CO concentration in equilibrium between the gas-liquid phase. Assuming
that 𝐶𝐶𝑡 is constant at all times, there is no chemical reaction, and initially (at t = 0) there is
no gas present in the test chamber, the solution of the mass balance equation yields:
𝐥𝐧 (𝑪𝒄𝒕−𝑪𝒐
𝑪𝒄𝒕−𝒄𝒕) = (𝐊𝐋𝐚) t ………................................................................................... (3.1)
Where: Co is the initial dissolved CO concentration.
Equation 3.1 corresponds to a linear relationship, in which the slope of the line is the
volumetric mass transfer coefficient, KLa (Munasinghe & Khanal, 2010b; Riggs & Heindel,
2006).
3.3.3 Medium composition, inoculum and analytical methods
The composition of the stock solution of nutrients in g/L was: 1.87 NH4Cl, 14.81 KCl,
6.40 K2HPO4, 4.07 KH2PO4 and 0.415 yeast extract. The trace metal stock solution was
prepared according to Tartakovsky et al., (2008), and contained (in g/L): 2 FeCl24H2O,
0.05 H3BO3, 50 ZnCl2, 0.03 CuCl2, 0.5 MnCl24H2O, 0.5 (NH4)6Mo7O244H2O, 0.5 AlCl3,
0.5 CoCl26H2O, 0.5 NiCl2, 0.5 EDTA, and concentrated HCl (1 mL). The chemicals used
were all of analytical grade. The stock solutions were sterilized and maintained at 4 °C
until used. The MFC influent solution was prepared by adding 35 mL of the nutrient
solution and 1 mL of the trace metal solution to 1 L of de-ionized water. This solution had
a conductivity of 12 mS cm-1. The MFC’s were inoculated with 10 mL of anaerobic sludge
46
obtained from a food processing plant (Lassonde Inc., Rougemont, QC, Canada). The
sludge was stored at 4 °C, and the pH of the sludge was 6.8-7.0.
Acetate and other volatile fatty acids (VFAs) were analyzed in an Agilent 6890 gas
chromatograph (Wilmington, DE, USA) equipped with a flame ionization detector. The
method details are provided in Tartakovsky et al. (2008). The pH and conductivity of the
effluent were measured periodically. The volume of inflow and outflow gas was measured
using bubble counters connected to glass U-tubes and interfaced with a data acquisition
system.
The gas composition (H2, CO, CH4, O2, N2, and CO2) was measured using an Agilent
6890 gas chromatograph (Wilmington, DE, USA) coupled to a thermal conductivity
detector. Three hundred microliter of headspace sample was injected into a 4.5 m x 2 mm
I.D. carboxen 1000 packed column from Sigma-Aldrich (St. Louis, MO, USA). The
column was heated at 60 °C for 7 min, then raised to 225 °C at a rate of 60 °C per minute
and maintained for 6 min. Argon was used as carrier gas. The injector and detector were
maintained at 125 °C and 150 °C respectively.
3.3.4 MFC design, Operation and Characterization
MFC tests were conducted in an experimental set-up similar to that employed for KLa
measurements. The 50 mL anodic compartment contained the 5 mm thick graphite felt
anode measuring 10 cm x 5 cm (Speer Canada, Kitchener, ON, Canada). A cathode was
attached to one of the sides of the anodic compartment (Figs. 3.1B and 3.2B). All MFC
tests were carried out using a carbon paper cathode containing 0.5 mg cm-2 Pt as the
catalyst, (GDE LT 120EW, E-TEK Division, PEMEAS Fuel Cell Technologies, Somerset,
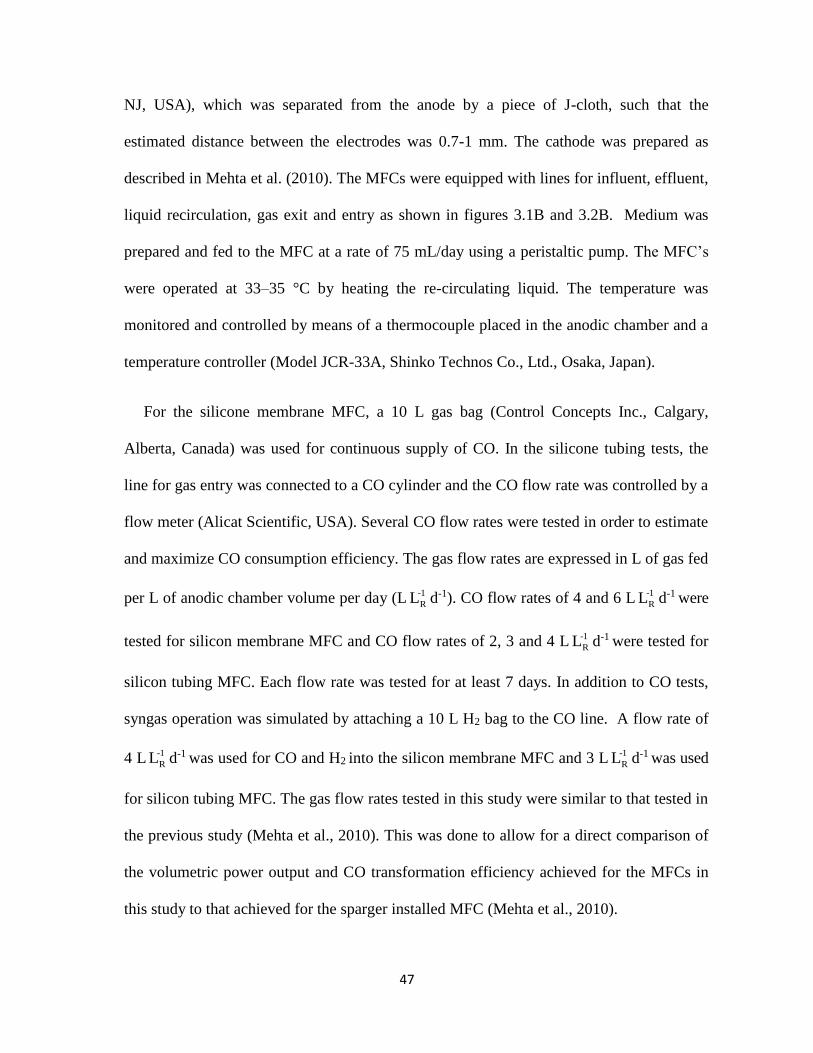
47
NJ, USA), which was separated from the anode by a piece of J-cloth, such that the
estimated distance between the electrodes was 0.7-1 mm. The cathode was prepared as
described in Mehta et al. (2010). The MFCs were equipped with lines for influent, effluent,
liquid recirculation, gas exit and entry as shown in figures 3.1B and 3.2B. Medium was
prepared and fed to the MFC at a rate of 75 mL/day using a peristaltic pump. The MFC’s
were operated at 33–35 °C by heating the re-circulating liquid. The temperature was
monitored and controlled by means of a thermocouple placed in the anodic chamber and a
temperature controller (Model JCR-33A, Shinko Technos Co., Ltd., Osaka, Japan).
For the silicone membrane MFC, a 10 L gas bag (Control Concepts Inc., Calgary,
Alberta, Canada) was used for continuous supply of CO. In the silicone tubing tests, the
line for gas entry was connected to a CO cylinder and the CO flow rate was controlled by a
flow meter (Alicat Scientific, USA). Several CO flow rates were tested in order to estimate
and maximize CO consumption efficiency. The gas flow rates are expressed in L of gas fed
per L of anodic chamber volume per day (L -1
RL d-1). CO flow rates of 4 and 6 L -1
RL d-1 were
tested for silicon membrane MFC and CO flow rates of 2, 3 and 4 L -1
RL d-1 were tested for
silicon tubing MFC. Each flow rate was tested for at least 7 days. In addition to CO tests,
syngas operation was simulated by attaching a 10 L H2 bag to the CO line. A flow rate of
4 L -1
RL d-1 was used for CO and H2 into the silicon membrane MFC and 3 L -1
RL d-1 was used
for silicon tubing MFC. The gas flow rates tested in this study were similar to that tested in
the previous study (Mehta et al., 2010). This was done to allow for a direct comparison of
the volumetric power output and CO transformation efficiency achieved for the MFCs in
this study to that achieved for the sparger installed MFC (Mehta et al., 2010).

48
Figure 3.1 (A) Experimental set-up for the determination of volumetric mass transfer co-efficient (𝐊𝐋𝐚) for silicone tubing and (B)
Diagram of the experimental setup of silicone tubing incorporated MFC, where BC represents the bubble counters.
Liquid Compartment
Silicone Tube
(A) (B)
49
Figure 3.2 (A) Experimental set-up for the determination of volumetric mass transfer coefficient (𝐊𝐋𝐚) for silicone membrane and (B)
Diagram of the experimental setup of silicone membrane incorporated MFC, where BC represents the bubble counters.
(A) (B)
50
MFC voltage was measured on-line at 20 min intervals using a data acquisition system
(Labjack U12, Labjack Corp., Lakewood, CO, USA). Polarization tests were carried out at
the end of each test using the following method. First, the open circuit voltage (OCV) was
measured by disconnecting external resistance for 30 min. The external resistance was re-
connected and progressively decreased in 8-11 steps with an interval of 10 minutes
between each step to allow for voltage stabilization. The 10 min intervals provided a
steady state voltage, while avoiding significant changes in the carbon source concentration
in the anodic liquid. Output voltage measurements were conducted at the end of each
interval. The measurements were started at 5000 Ω and terminated at 15 Ω. These
measurements were used to generate polarization (voltage vs. current density) and power
(output power vs. current density) graphs (Logan, 2008; Mehta et al., 2010). The linear
part of the polarization curve produced was used to estimate the total internal resistance
(Logan, 2008). The open circuit potentials for anode and cathode were measured using a
standard Ag/Agcl electrode (0.222 V vs NHE).
The Coulombic efficiency (CE) of the MFC was estimated as (Mehta et al., 2010):
CE = I ∙ ∆t ∙ MCO
F ∙ n ∙ (MCO,in − MCO,out ) 100 %................................................... (3.2)
Where, I is the average measured current (A), t is the time interval during which current
was measured (s), MCO is the molar mass of CO (g/mol), F is the Faraday constant (C/mol-
e-), n is the number of electrons transferred (mol-e-/mol), MCO,in is the amount of CO
supplied (g) to the MFC during t, and MCO,out is the amount of CO (g) recovered in the
off-gas line during t.
51
The absence of power generation from the nutrients present in the influent stream (i.e.
yeast extract) has been demonstrated earlier (Mehta et al., 2010). A low voltage output of
3- 4 mV (Rext = 500 Ω, Pout < 0.02 x 10⁻³ mW) was observed when the MFC was fed only
with the solution of nutrients and microelements in the absence of CO-feeding for 1 week
(Mehta et al., 2010). In this study, at start-up the MFCs were operated under a constant
external resistance and comparatively low CO flow rate. Once a steady power output was
observed, the CO flow rate was stepped up and the external resistance was optimized using
the Perturbation and Observation MPPT algorithm (Woodward et al., 2009). The external
optimized resistance using the online algorithm was always found to be within the range of
20 Ω to that of the internal resistance obtained from the polarization curves. The effluent
and anodic off-gas compositions were analyzed periodically. In order to estimate the
dissolved CO concentration levels corresponding to optimum performance, the dissolved
CO concentration in the anodic liquid was measured regularly. At each tested flow rate,
polarization tests were performed to estimate the MFC internal resistance and maximum
power output (𝑃𝑚𝑎𝑥𝑝𝑡
). Also, the average (𝑃𝑎𝑣 ) and maximum operational power output
(𝑃𝑚𝑎𝑥𝑜𝑝
) observed during the course of MFC operation at a particular CO flow rate is also
reported. Notably, 𝑃𝑎𝑣 takes into account the fluctuations in power output.
3.4 Results and Discussion
3.4.1 Estimation of KLa
The KLa values for CO were calculated using the analytical solution of the dissolved
CO material balance (Eq. 3.1). The silicone membrane and tubing were operated in a dead-
end mode. This mode of operation allowed for an elevated gas pressure in the system due
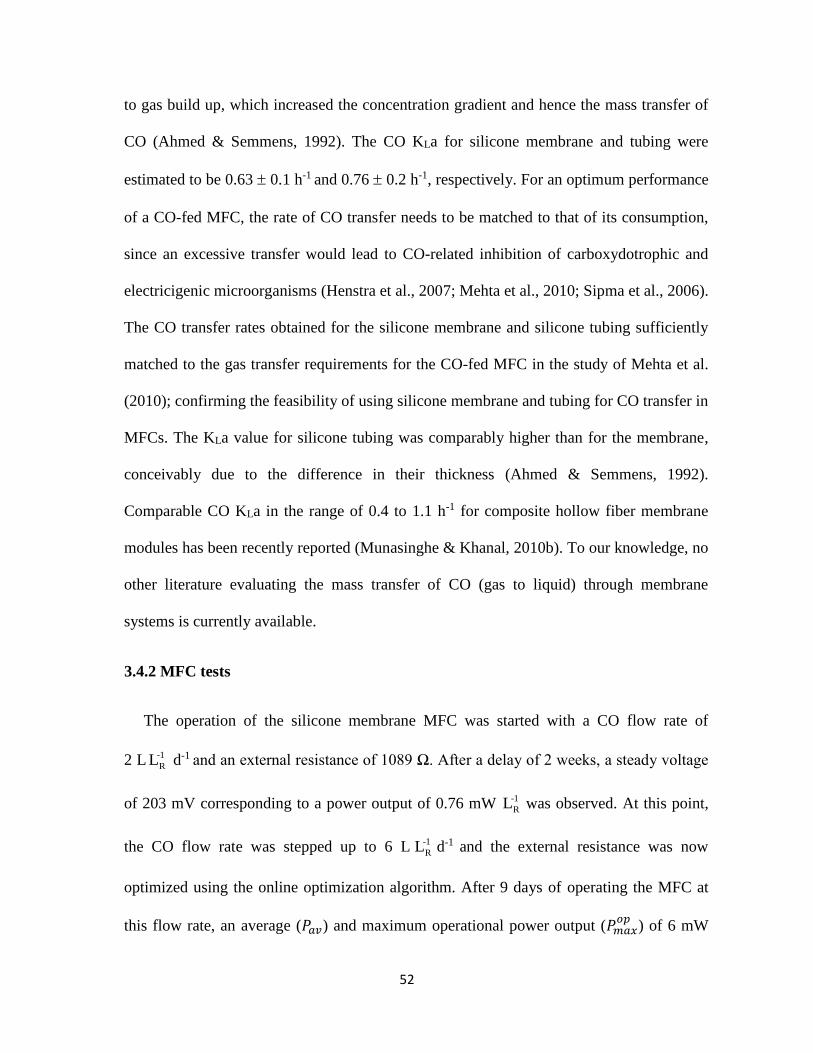
52
to gas build up, which increased the concentration gradient and hence the mass transfer of
CO (Ahmed & Semmens, 1992). The CO KLa for silicone membrane and tubing were
estimated to be 0.63 0.1 h-1 and 0.76 0.2 h-1, respectively. For an optimum performance
of a CO-fed MFC, the rate of CO transfer needs to be matched to that of its consumption,
since an excessive transfer would lead to CO-related inhibition of carboxydotrophic and
electricigenic microorganisms (Henstra et al., 2007; Mehta et al., 2010; Sipma et al., 2006).
The CO transfer rates obtained for the silicone membrane and silicone tubing sufficiently
matched to the gas transfer requirements for the CO-fed MFC in the study of Mehta et al.
(2010); confirming the feasibility of using silicone membrane and tubing for CO transfer in
MFCs. The KLa value for silicone tubing was comparably higher than for the membrane,
conceivably due to the difference in their thickness (Ahmed & Semmens, 1992).
Comparable CO KLa in the range of 0.4 to 1.1 h-1 for composite hollow fiber membrane
modules has been recently reported (Munasinghe & Khanal, 2010b). To our knowledge, no
other literature evaluating the mass transfer of CO (gas to liquid) through membrane
systems is currently available.
3.4.2 MFC tests
The operation of the silicone membrane MFC was started with a CO flow rate of
2 L -1
RL d-1 and an external resistance of 1089 Ω. After a delay of 2 weeks, a steady voltage
of 203 mV corresponding to a power output of 0.76 mW -1
RL was observed. At this point,
the CO flow rate was stepped up to 6 L -1
RL d-1 and the external resistance was now
optimized using the online optimization algorithm. After 9 days of operating the MFC at
this flow rate, an average (𝑃𝑎𝑣) and maximum operational power output (𝑃𝑚𝑎𝑥𝑜𝑝
) of 6 mW

53
-1
RL (Fig. 3.3) and 11.2 mW -1
RL (Table 3.1), respectively were observed. A maximum
power output (𝑃𝑚𝑎𝑥𝑝𝑡
) of 10.1 mW -1
RL with an internal resistance of 175 Ω (Table 3.1) was
estimated based on the polarization curves (Fig. 3.4). An open circuit voltage (OCV) value
of 576 mV was observed with the cathode and anode OCP values lying in the range of 200
and 210 mV and between 350 and 385 mV, respectively. Flow rates higher than 6 L -1
RL d-1
were not tested as it was found to impede the MFC output in our earlier study (Mehta et al.,
2010). As mentioned earlier, for the optimum performance of a CO-fed MFC, the rate of
gas transfer must match the rate of its consumption. The relatively high levels of dissolved
CO concentration at higher CO flow rates leads to the inhibition of carboxydotrophic and
electricigenic microorganisms, thereby impeding the performance of the MFC (Henstra et
al., 2007; Mehta et al., 2010). Decreasing the CO flow rate to 4 L -1
RL d-1 increased 𝑃𝑎𝑣 and
𝑃𝑚𝑎𝑥𝑜𝑝
to 8.4 mW -1
RL (Fig. 3.3) and 19.3 mW -1
RL (Table 3.1), respectively. Also, the CO
transformation efficiency of the system increased to 74.2 % (Table 3.1). The
𝑃𝑚𝑎𝑥𝑝𝑡 increased to 18 mW -1
RL (Fig. 3.4) and the internal resistance decreased to 80 Ω
(Table 3.1). This increase in performance was plausibly due to a drop in dissolved CO
concentration levels as given in Table 3.1.
As the maximum power output for silicone membrane MFC was observed at a CO flow
rate of 4 L -1
RL d-1, the syngas test was performed by feeding both CO and H2 at flow rate of
4 L -1
RL d-1. After an initial drop of power output to 2 mW -1
RL , the power output
progressively increased to 10 mW -1
RL within 4 days of starting of the syngas test. The
anodic chamber had to be opened at this point due to technical problems, which resulted in
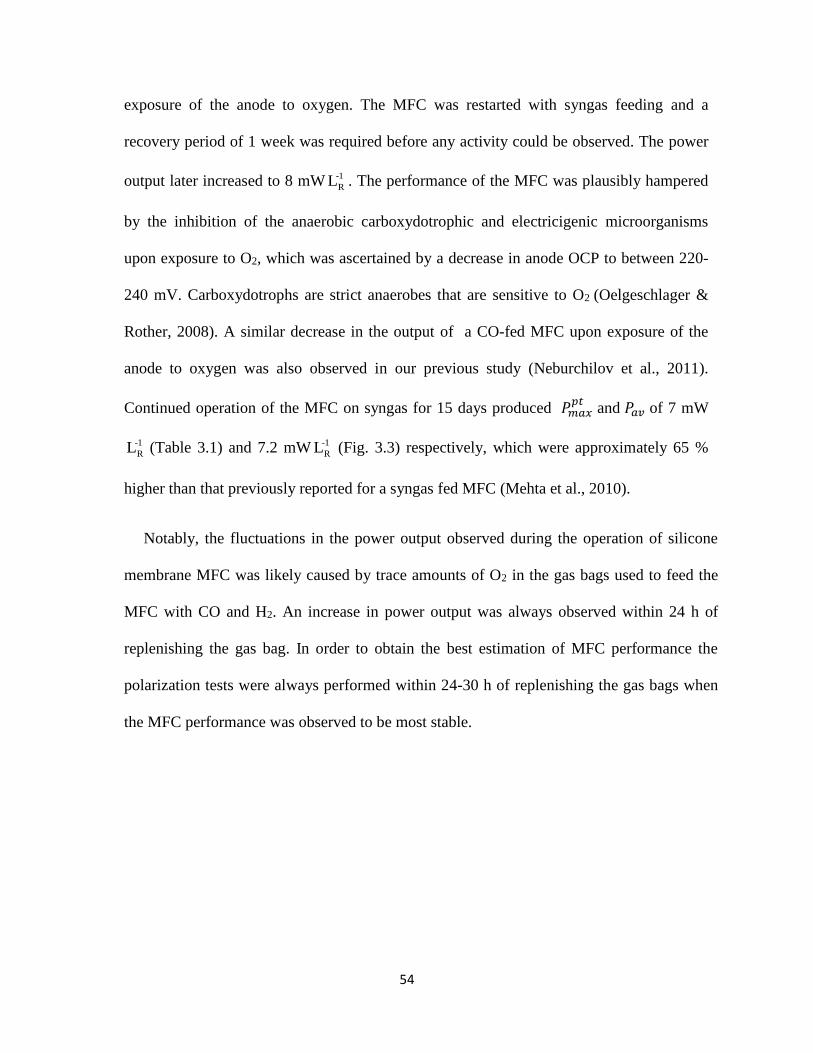
54
exposure of the anode to oxygen. The MFC was restarted with syngas feeding and a
recovery period of 1 week was required before any activity could be observed. The power
output later increased to 8 mW -1
RL . The performance of the MFC was plausibly hampered
by the inhibition of the anaerobic carboxydotrophic and electricigenic microorganisms
upon exposure to O2, which was ascertained by a decrease in anode OCP to between 220-
240 mV. Carboxydotrophs are strict anaerobes that are sensitive to O2 (Oelgeschlager &
Rother, 2008). A similar decrease in the output of a CO-fed MFC upon exposure of the
anode to oxygen was also observed in our previous study (Neburchilov et al., 2011).
Continued operation of the MFC on syngas for 15 days produced 𝑃𝑚𝑎𝑥𝑝𝑡
and 𝑃𝑎𝑣 of 7 mW
-1
RL (Table 3.1) and 7.2 mW -1
RL (Fig. 3.3) respectively, which were approximately 65 %
higher than that previously reported for a syngas fed MFC (Mehta et al., 2010).
Notably, the fluctuations in the power output observed during the operation of silicone
membrane MFC was likely caused by trace amounts of O2 in the gas bags used to feed the
MFC with CO and H2. An increase in power output was always observed within 24 h of
replenishing the gas bag. In order to obtain the best estimation of MFC performance the
polarization tests were always performed within 24-30 h of replenishing the gas bags when
the MFC performance was observed to be most stable.
55
Table 3.1 Performance of silicone membrane incorporated MFC at different CO flow rates.
Test L (LR)-1d-1 Power output (mW/LR)
Power output (mW/LR)
Rint CO transformation Effluent acetate H2 CH4 CO CE CO conc.
max
opP max
ptP (Ω) (%)
(%) (%) (%) (%) (mg/L) (mg/L)
1 6 11.2 10.1 175 67.8±2 46.2 4.8 15.3 62.5 7.0 9.2
2 4 19.3 18 85 74.2±3.1 18.4 3.1 11.1 55.1 10.7 7.2
3* 4* 8 7 170 57.2±4.4 34.7 22 11.5 44.5 6.8 7.1
*Syngas test (CO and H2 fed simultaneously at the indicated flow rate)
Figure 3.3 Average volumetric power output for silicone membrane incorporated MFC at different CO flow rates. The error bars
represent the calculated standard deviation for the data points.
0
2
4
6
8
10
12
14
6 4 4 CO + 4 H2
Pow
er (
mW
/LR)
CO Flow Rate (L (LR)-1d-1)

56
0
100
200
300
400
500
600
700
0 20 40 60 80 100 120 140 160 180
Volt
age
(mV
)
Current (mA/LR)
6L/LR/day
4L/LR/day
Syngas
Sparger-4.8 L/LR/day
(A)
Figure 3.4 Polarization (A) and power (B) curves obtained for flat silicone membrane
incorporated MFC, where sparger represents the values obtained for the sparger installed
MFC maximized at the flow rate of 4.8 L -1
RL d-1 (Mehta et al., 2010).
0
5
10
15
20
25
0 20 40 60 80 100 120 140 160 180
Pow
er (
mW
/LR)
Current (mA/LR)
6L/LR/day
4L/LR/day
Syngas
Sparger- 4.8
L/LR/Day
(B)

57
In general, the performance of a silicone membrane MFC was comparatively better than
that observed for the sparger equipped MFC in the previous study (Mehta et al., 2010). The
maximum volumetric power outputs, 𝑃𝑎𝑣 and 𝑃𝑚𝑎𝑥𝑝𝑡
at the CO flow rate of 4 L -1
RL d-1 were
approximately 35 % and 180% higher than that previously reported (Kim & Chang, 2009;
Mehta et al., 2010). Also, the CO transformation efficiency increased by 20 %. The CE
obtained during CO feeding was comparable to that reported for the sparger equipped
MFC (Mehta et al., 2010).
For studying the performance of the silicone tubing MFC, a silicone tube wound around
a support (stainless steel mesh) was placed next to the anode. Also, in order to avoid the
problem of fluctuation in power output due to O2 diffusion in the gas bags, the CO line was
connected directly to a CO cylinder. The tests were performed with the same anode as that
used in the silicone membrane tests, thus the variations in power output resulting from
differences in the microbial populations were avoided.
The CO transformation efficiency in the silicon tubing MFC was comparatively higher
than that observed for the silicone membrane MFC, with the maximum power outputs,
𝑃𝑚𝑎𝑥𝑜𝑝
and 𝑃𝑚𝑎𝑥𝑝𝑡 observed at a CO flow rate of 3 L -1
RL d-1 (Table 3.2). The𝑃𝑎𝑣 and 𝑃𝑚𝑎𝑥𝑝𝑡
and
were 10 mW -1
RL (Fig. 3.5) and 13 mW -1
RL (Fig. 3.6) respectively, which were
approximately 103 and 60 % higher than that observed in previous study (Mehta et al.,
2010). Also, a CO transformation efficiency of 92 % was achieved (Table 3.2) Though the
maximum CO transformation efficiency of 98.5 % (Table 3.2) was observed at a flow rate
of 2 L -1
RL d-1, the power output (Fig. 3.6) was comparatively lower as the process was
plausibly limited by low acetate concentrations. The electricity generation in a CO-fed
58
MFC predominantly takes place by the conversion of CO to acetate by the acetogenic
carboxydotrophic microorganisms followed by the oxidation of acetate by CO tolerant
electricigenic microorganisms. Low acetate levels at low CO flow rates limit electricity
generation in a CO-fed MFC (Mehta et al., 2010).
Silicon tubing MFC operation on syngas was tested by feeding CO and H2 at flow rate
of 3 L -1
RL d-1. A 𝑃𝑚𝑎𝑥𝑝𝑡
of 8.1 mW -1
RL (Fig. 3.6) and a 𝑃𝑎𝑣of 6.7 mW -1
RL (Fig. 3.5) were
observed, which were approximately 92% and 60% higher than that previously reported
(Mehta et al., 2010). Fluctuations in power output of silicon tubing MFC were less intense
than those observed for silicone membrane MFC. However, the O2 levels in the anodic
chamber of silicone tubing MFC increased with the installation of the H2 bag, impeding the
carboxydotrophic activity, which can be inferred from the low CO transformation
efficiency (41.5 %) and a decrease in anode OCP (250-270 mV) observed during the
syngas test.
Overall, the volumetric power output of silicone tubing MFC was comparable to that
obtained for silicone membrane MFC, but the CO transformation efficiency for silicone
tubing MFC was considerably higher due to better CO gas to liquid transfer capability of
silicone tubing as reflected by the higher CO KLa value for the tubing than for the silicone
membrane. Consequently, the optimum level of dissolved CO was achieved at a lower CO
flow rate. The power output was maximized at dissolved CO levels of 7.8 to 8 mg/L (Table
3.2).

59
Table 3.2 Performance of silicone tubing incorporated MFC at different CO flow rates.
Test L (LR)-1d-1 Power output Power output Rint CO transformation Effluent acetate H2 CH4 CO CE CO conc.
mW/LR mW/LR
(%)
max
opP max
ptP (Ω) (mg/L)
(%) (%) (%) (%) (mg/L)
1 4 12.2 11.7 150 88±2.3 74 4.7 9.4 39.3 9.3 9.1
2 3 14 13 75 92±1 58 2.1 9.3 33.2 16.3 7.8
3 2 4 3.1 200 98.4±1 6.1 5.3 15 12.5 7.0 3.1
4* 3* 6.3 8.1 130 41.4±2.6 51.4 26 3.3 48.4 8.8 8.4
*Syngas test (CO and H2 fed simultaneously at the indicated flow rate)
Figure 3.5 Average volumetric power output for silicone tubing incorporated MFCs at different CO flow rates. The error bars
represent the calculated standard deviation for the data points.
0
2
4
6
8
10
12
14
4 3 2 3 CO + 3 H2
Po
wer
(m
W/L
R)
CO Flow Rate (L (LR)-1d-1)
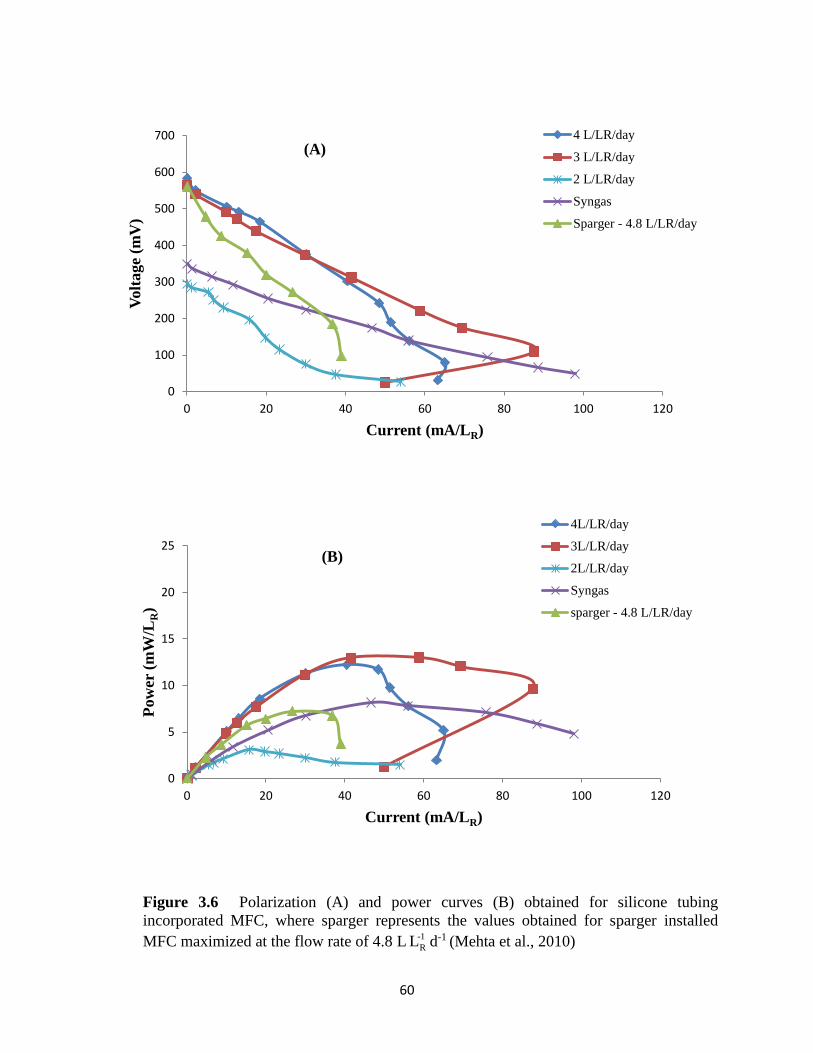
60
Figure 3.6 Polarization (A) and power curves (B) obtained for silicone tubing
incorporated MFC, where sparger represents the values obtained for sparger installed
MFC maximized at the flow rate of 4.8 L -1
RL d-1 (Mehta et al., 2010)
0
100
200
300
400
500
600
700
0 20 40 60 80 100 120
Volt
age
(mV
)
Current (mA/LR)
4 L/LR/day
3 L/LR/day
2 L/LR/day
Syngas
Sparger - 4.8 L/LR/day
(A)
0
5
10
15
20
25
0 20 40 60 80 100 120
Pow
er (
mW
/LR)
Current (mA/LR)
4L/LR/day
3L/LR/day
2L/LR/day
Syngas
sparger - 4.8 L/LR/day
(B)

61
The maximum current density achieved for silicone membrane and silicone tubing
MFCs were in a range of 1.0-1.4 A m-2 and 0.7-0.9 A m-2, respectively. Acetate-fed MFCs
have been reported to have a similar current density of 1.1-2.0 A m-2 and a power output of
10-100mW -1
RL (Logan et al., 2006; Lovley, 2008; Martin et al., 2010; Neburchilov et al.,
2011; Pinto et al., 2010). Such current densities could be considered low for a hydrogen fuel
cell, however they are sufficient to consider an MFC as a feasible technology for electricity
production from organic waste (Logan, 2010). In our study, the anode occupied 25 mL of
the anodic chamber. By recalculating the volumetric power output per anode volume, a
power output of 36 mW/Lanode for silicone membrane (at 4 L -1
RL d-1) and 26 mW/Lanode for
silicone tubing (at 3L -1
RL d-1) was obtained, which implies that further design
improvements/optimization of cathode and the anodic chamber can result in a higher power
ouput for a CO-fed MFC.
The results of VFA and off gas analysis (Fig 3.7) for silicone membrane and silicone
tubing tests were in accordance with previous observations (Kim & Chang, 2009; Mehta et
al., 2010). The effluent measurements demonstrated the predominance of acetate as the
major metabolite with propionate, methanol and ethanol being present only in trace amounts.
The concentration of acetate increased as CO flow rate increased (Table 3.1 and 3.2).
Degradation products such as H2 and CH4 were detected in the anode off-gas. Based on the
analysis of metabolic products, Mehta et al.,(2010) hypothesized that the production of
electricity in CO-fed MFC proceeds through multi-step concurrent pathways. The
conversion of CO to acetate followed by the oxidation of acetate by CO tolerant
electricigenic microorganisms was hypothesized to be the most prominent pathway. The
62
following stoichiometric equations describe this pathway (Hussain et al., 2011; Mehta et al.,
2010):
4CO + 2H2O → CH3COOH + 2CO2............................................................................. (3.3)
CH3COOH + 2H2O → 2CO2 + 8e- + 8 H+................................................................... (3.4)
The presence of H2 in the off-gas when the MFC was operated on CO was indicative of
hydrogenogenic activity. It was hypothesized that H2 was used as an electron donor for
electricity generation by the electricigenic microorganisms. Electricity generation in an
MFC fed with H2 has previously been demonstrated (Bond & Lovley, 2003). This particular
pathway can be expected to have profound relevance for MFC operation on syngas (Mehta
et al., 2010).
The CE of our system was invariably low, conceivably due to the concomitant
production of CH4 and other degradation products (Mehta et al., 2010; Sipma et al., 2003).
In the study of Sipma et al. (2003), CO conversion in some cases led to the production of
acetate and CO2 and to CH4 and CO2 in others. More importantly it was noticed that acetate
seemed to serve as the main intermediate for CH4 production, implying that much higher CE
for a CO-fed MFC can be achieved if the formation of CH4, H2 and other degradation
products can be kept to a minimum. Mehta et al., (2010) reported a CE of 33 % for a CO-fed
MFC when the calculations were modified to take into account the consumption of fed CO
for the production of CH4, H2 and acetate that was not used for electricity production. This
CE is only marginally lower that reported for acetate MFCs with comparable designs (Logan,
2008).

63
Figure 3.7 Anodic off–gas composition for (A) silicone membrane and (B) silicon tubing
incorporated MFC.
0%
10%
20%
30%
40%
50%
60%
70%
80%
90%
100%
6L/LR/day 4L/LR/day Syngas
Ga
s C
om
po
stio
n (
%)
CO Flow Rate (L/LR/day)
CH4
O2
N2
CO2
H2
CO
0%
10%
20%
30%
40%
50%
60%
70%
80%
90%
100%
4L/LR/day 3L/LR/day 2L/LR/day Syngas
Gas
Com
posi
tion
(%
)
CO Flow rate (L/LR/day)
CH4
O2
N2
CO2
H2
CO
(B)
(A)
64
Overall, the operation of a silicone membrane and silicone tubing MFCs clearly
demonstrated that the performance of a CO-fed MFC can be substantially increased by
adopting efficient mass transfer techniques. In our earlier study (Mehta et al., 2010), a
sparger was used for gas to liquid transfer of CO. The installation of the sparger required not
only the doubling of the anode compartment volume (100 mL) but also much higher CO
flow rates to achieve the desired dissolved CO levels due to mass transfer limitations;
resulting in considerable gas losses and a low CO transformation efficiency. In this study,
with the installation of a silicone membrane or tubing, an efficient gas to liquid transfer was
achieved with a reduced anodic volume (50 mL), which considerably increased the
volumetric power output along with a significant increase in CO transformation efficiency.
Interestingly, we observed biofilm formation on the surface of silicone membrane
(facing the liquid) and also on the tubing. Biofilm formation on membrane surfaces has been
widely reported. In the patent held by Hickey et al., (2008) a membrane bioreactor was
employed for the conversion of CO or syngas to ethanol and other liquid products. The
membrane concurrently served as support for biofilm growth. Biofilm formation on the
surface of silicone membranes in membrane bioreactors for waste gas and water treatment
has been reported (Kumar et al., 2008; Reij et al., 1998). This phenomenon of biofilm
formation on silicone membrane surfaces is quite pertinent to CO-fed MFCs, where a
biofilm formation on membrane surface may increase the density of acetogenic
carboxydotrophic microorganisms in the anodic chamber and thereby increasing the acetate
concentration and CO transformation efficiency.

65
CO and syngas-fed MFCs offer a promising technology that has a number of
advantages over polymer electrolyte membrane fuel cells (PEMFC) or solid oxide fuel cells
(SOFC), as MFCs do not require noble catalysts at the anode nor are they very sensitive to
fuel impurities as it has been previously reported in the case of PEMFC and SOFC (Kim &
Chang, 2009; Song, 2002). The MFC based process can be used to combine electricity
production with hydrogen extraction from syngas or in combination with syngas
biotransformation to valuable energy carriers, such as butanol (Pengmei et al., 2007).
3.5 Conclusion
This study demonstrated the feasibility of using dense polymer membranes such as
silicone membranes and thin wall silicone tubing for efficient mass transfer of CO into a
MFC. Thin silicone membranes and tubing can be easily incorporated into an MFC without
requiring extensive changes in its design. A 𝑃𝑚𝑎𝑥𝑝𝑡
of 13 mW -1
RL and 18 mW -1
RL was
achieved in silicone tubing and membrane installed MFC respectively, which was
approximately 103 % and 180 % higher than that previously reported. Also, much higher
CO transformation efficiencies in the range of 75 to 99 % were obtained. Future studies
might focus on testing other gas diffusion membranes with a high affinity for CO. Improved
gas transfer demonstrated by the membrane-based systems, allows for focusing on the
process microbiology, which could lead to the isolation of novel anodophilic
carboxidotrophic microorganisms.
66
3.6 References
Ahmed, T., Semmens, M.J. 1992. Use of sealed end hollow fibers for bubbleless membrane
aeration: experimental studies. J Membr Sci, 69, 1-10.
Bond, D.R., Lovley, D.R. 2003. Electricity Production by Geobacter sulfurreducens
Attached to Electrodes. Appl Environ Microbiol, 69, 1548-1555.
Bredwell, M.D., Srivastava, P., Worden, R.M. 1999. Reactor Design Issues for Synthesis-
Gas Fermentations. Biotechnol Prog, 15, 834-844.
Bridgwater, T. 2006. Biomass for energy. J. Sci. Food Agriculture, 86, 1755-1768.
Côté, P., Bersillon, J.-L., Huyard, A. 1989. Bubble-free aeration using membranes: mass
transfer analysis. J Membr Sci, 47, 91-106.
Gariépy, Y., Raghavan, G.S.V., Munroe, J.A. 1994. Long-term storage of leek stalks under
regular and controlled atmospheres. Int J Refrig, 17, 140-144.
Henstra, A., Sipma, J., Rinzema, A., Stams, J. 2007. Microbiology of synthesis gas
fermentation for biofuel production. Current Opinion Biotechnol, 18, 200-206.
Hickey, R., Datta, R., Tsai, s.-P., Basu, R. 2008. Memrane supported bioreactor for
conversion of syngas components to liquid products, (Ed.) U.S.P. Publication, Vol. US
200/0305539 A1. US, pp. 1-5.
Hussain, A., Guiot, S., Mehta, P., Raghavan, V., Tartakovsky, B. 2011. Electricity
generation from carbon monoxide and syngas in a microbial fuel cell. Appl Microbiol
Biotechnol, 90, 827-836.
Kim, D., Chang, I. 2009. Electricity generation from synthesis gas by microbial processes:
CO fermentation and microbial fuel cell technology. Bioresour Technol, 100, 4527-
4530.
Kumar, A., Dewulf, J., Van Langenhove, H. 2008. Membrane-based biological waste gas
treatment. Chem Eng J, 136, 82-91.
Lide, D., Frederickse, H. 1995. Handbook of Chemistry and Physics. 76 ed. CRC Press Inc.,
Boca Raton, FL.
Logan, B. 2010. Scaling up microbial fuel cells and other bioelectrochemical systems. Appl
Microbiol Biotechnol, 85, 1665-1671.
Logan, B.E. 2008. Microbial Fuel Cells. John Wiley & Sons Inc, Hoboken, NJ.
67
Logan, B.E., Hamelers, B., Rozendal, R., Schröder, U., Keller, J., Freguia, S., Aelterman, P.,
Verstraete, W., Rabaey, K. 2006. Microbial Fuel Cells: Methodology and Technology†.
Environ. Sci. Technol., 40, 5181-5192.
Lovley, D.R. 2008. The microbe electric: conversion of organic matter to electricity. Curr
Opinion Biotechnol, 19, 564-571.
Martin, E., Savadogo, O., Guiot, S.R., Tartakovsky, B. 2010. The influence of operational
conditions on the performance of a microbial fuel cell seeded with mesophilic anaerobic
sludge. Biochem Eng J, 51, 132-139.
Mehta, P., Hussain, A., Raghavan, V., Neburchilov, V., Wang, H., Tartakovsky, B., Guiot, S.
2010. Electricity generation from a carbon monoxide in a single chamber microbial fuel
cell. Enzyme Microb Technol, 46, 450-455.
Munasinghe, P.C., Khanal, S.K. 2010a. Biomass-derived syngas fermentation into biofuels:
Opportunities and challenges. Bioresour Technol, 101, 5013-5022.
Munasinghe, P.C., Khanal, S.K. 2010b. Syngas fermentation to biofuel: Evaluation of
carbon monoxide mass transfer coefficient (kLa) in different reactor configurations.
Biotechnol Prog, 26, 1616-1621.
Neburchilov, V., Mehta, P., Hussain, A., Raghavan, V., Wang, H., Guiot, S., Tartakovsky, B.
2011. Microbial Fuel Cell Operation On Carbon Monoxide: Cathode Catalyst Selection.
Int J Hydrogen Energ, 36, 11929-11935.
Oelgeschlager, E., Rother, M. 2008. Carbon monoxide - dependant energy metabolism in
anaerobic bacteria and archaea. Arch Microbiol, 190, 257-269.
Pengmei, L., Yuan, Z., Wu, C., Ma, L., Chen, Y., Tsubaki, N. 2007. Bio-syngas production
from biomass catalytic gasification. Energy Convers Managem, 48, 1132-1139.
Pinto, R.P., Srinivasan, B., Manuel, M.F., Tartakovsky, B. 2010. A two-population bio-
electrochemical model of a microbial fuel cell. Bioresource Technol, 101, 5256-5265.
Reij, M.W., Keurentjes, J.T.F., Hartmans, S. 1998. Membrane bioreactors for waste gas
treatment. J Biotechnol, 59, 155-167.
Riggs, S.S., Heindel, T.J. 2006. Measuring Carbon Monoxide Gas - Liquid Mass Transfer in
a Stirred Tank Reactor for Syngas Fermentation. Biotechnol Prog, 22, 903-906.
Robb, W.L. 1968. Thin silicon membranes-their permeation properties and some
applications. Annals of the New York Academy of Sciences, 146, 119-137.
68
Scott, K., Hughes, R. 1996. Industrial Membrane Separation Technology. Blackie Academic
& Professional, Glasgow, UK.
Sipma, J., Henstra, A.M., Parshina, S.N., Lens, P.N.L., Lettinga, G., Stams, A.J.M. 2006.
Microbial CO Conversions with Applications in Synthesis Gas Purification and Bio-
Desulfurization. Crit Rev Biotechnol, 26, 41 - 65.
Sipma, J., Lens, P.N.L., Stams, A.J.M., Lettinga, G. 2003. Carbon monoxide conversion by
anaerobic bioreactor sludges. FEMS Microbiol Ecol, 44, 271-277.
Song, C. 2002. Fuel processing for low-temperature and high-temperature fuel cells:
Challenges, and opportunities for sustainable development in the 21st century. Catal
today, 77, 17-49.
Tartakovsky, B., Manuel, M.F., Neburchilov, V., Wang, H., Guiot, S.R. 2008. Biocatalyzed
hydrogen production in a continuous flow microbial fuel cell with a gas phase cathode.
J. Power Sources, 182, 291-297.
Woodward, L., Tartakovsky, B., Perrier, M., Srinivasan, B. 2009. Maximizing power
production in a stack of microbial fuel cells using multiunit optimization method.
Biotechnol Prog, 25, 676-682.
Yasuda, H., Lamaze, C.E. 1972. Transfer of gas to dissolved oxygen in water via porous and
nonporous polymer membranes. J Appl Polym Sci, 16, 595-601.
69
Connecting text
The improved CO transformation efficiency and volumetric power output of
mesophilic CO-fed MFCs in Chapter 3 clearly established the applicability of silicone
membrane systems for efficient CO transfer into the anodic liquid of MFCs with reduced
reactor volumes.
With an efficient gas delivery system now in place, the following study focused on
elucidating the microbiology and biotransformation pathways driving electricity production
from CO/syngas in an MFC. Culture independent finger printing technique such as
denaturing gradient gel electrophoresis (DGGE) of polymerase chain reaction (PCR)
amplified 16S rDNA fragments was utilized for identification of anodic microbial
communities of two mesophilic CO-fed MFCs. The identified microbial communities along
with the analysis of the metabolic products were used for mapping the biotranformation
pathways driving electricity production from CO/syngas.

70
CHAPTER 4
Population analysis of mesophilic microbial fuel cells fed with carbon
monoxide
4.1 Abstract
Electricity generation in a microbial fuel cell (MFC) fed with carbon monoxide (CO)
and synthesis gas (syngas) has been recently demonstrated. However, the microbial ecology
of this system has not yet been described. In this work the diversity of the microbial
community present at the anode of CO-fed MFCs was studied by performing Denaturing
Gradient Gel Electrophoresis (DGGE) analyses. The identified microorganisms belonged to
the genera Geobacter, Desolfovibrio, Clostridium, Methanobacterium, Methanofollis and
Methanosaeta. The presence of G. sulfurreducens suggested its tolerance to CO, which was
confirmed by growing G. sulfurreducens with acetate under a 100% CO atmosphere. This
observation, along with the identification of acetogens, supports the hypothesis of the two-
step process in which CO is converted to acetate by the carboxidotrophic bacteria and
acetate is then oxidized by CO-tolerant electricigenic bacteria to produce electricity.
Keywords: MFC; Carbon monoxide; Geobacter sulfurreducens.
71
4.2 Introduction
Studies on CO and syngas-fed MFCs have so far concentrated on the optimization of
the system design (Hussain et al., 2011a; Neburchilov et al., 2011), which have increased the
CO transformation efficiency and volumetric power output to 98% and 18 mW LR-1,
respectively. Given that the electricity generation in an MFC is governed by the biological
activity (Lovley, 2006), understanding of the metabolic pathways and microorganisms
involved in driving electricity generation in a CO-fed MFC is critical for achieving high
power densities. Electricity generation from CO till now has been demonstrated in an MFC
seeded with a mixed microbial population of an anaerobic sludge (Hussain et al., 2011a).
Based on the analysis of the metabolic products, Mehta et al.(2010) hypothesized that the
production of electricity in a CO-fed MFC proceeds through multi-step concurrent pathways.
The conversion of CO to acetate, followed by the oxidation of acetate by CO-tolerant
electricigenic microorganisms was hypothesized to be the most prominent pathway. The
presence of H2 in the anodic off-gas when the MFC was fed solely with CO was indicative
of hydrogenogenic activity. It was hypothesized that H2 also served as an electron donor for
electricity generation by electricigenic microorganisms. Finally, the possibility of direct
electron transfer to the anode by metal-reducing carboxydotrophic microorganisms was also
discussed. The primary objective of the study presented below was to characterize the
microbial populations prevalent in the anodic chamber of the two previously described
mesophilic CO-fed MFCs (Hussain et al., 2011a; Mehta et al., 2010) by denaturing gradient
gel electrophoresis (DGGE) of PCR amplified 16S rDNA fragments. An acknowledged
shortcoming of this molecular technique is that some of the essential species may not be
72
detected on the DGGE patterns (Ercolini, 2004). Nevertheless, the DGGE of PCR amplified
16S rDNA fragments remains a widely used molecular technique for rapid assessment of the
microbial communities present in complex samples, such as MFC anodes (Logan, 2008).
4.3 Materials and Methods
4.3.1 MFC design and operation
The anode samples (graphite felt) were taken from the CO-fed MFC used in our
previous study of Mehta et al.(2010) (hereby, referred to as MFC1) and the CO-fed MFC
described in Chapter 3 (Hussain et al.,2011a; hereby referred to as MFC2). Both MFCs were
similar in design and operation, with the only difference being in the method of CO delivery.
In MFC1, a sparger was used for CO delivery in the anodic compartment, whereas in MFC2,
a silicone membrane system was employed for CO transfer. With the installation of silicone
membrane, an enhanced CO gas to liquid mass transfer was achieved with reduced anodic
volume, which considerably increased the volumetric power output along with a significant
increase in CO conversion efficiency. The MFCs were inoculated with 10 mL of anaerobic
mesophilic sludge (Lassonde Inc, Rougemont, QC, Canada) and operated for a period of
over 3 months at mesophilic temperatures (30-35 °C). Prior to use, the inoculum sludge was
stored at 4 °C and the pH of the sludge was between 6.8 to 7.0. A solution of trace metals
was prepared and fed to the MFCs at a rate of 75 mL d−1. The trace metal stock solution was
prepared as described by Tartakovsky et al. (2008).

73
4.3.2 Analytical methods
Volatile fatty acids (VFAs) and anodic off-gas composition were measured as described
in Tarkakovsky et al. (2008) and Guiot et al. (2011). Briefly, VFAs such as acetate,
propionate and butyrate, were analyzed using an Agilent 6890 gas chromatograph (Agilent
Technologies Inc, Santa Clara, CA, USA) equipped with a flame ionization detector. The
off-gas composition was measured using an HP 6890 gas chromatograph (Hewlett Packard,
Palo Alto, CA) equipped with a thermal conductivity detector and a 5 m x 2.1 mm
Carboxen-1000 column (Supelco, Bellafonte, PA) with argon as the carrier gas. Gas flow
was measured by bubble counters interfaced with a data acquisition system (Tartakovsky et
al., 2008). The pH and conductivity of the effluent were measured using a pH meter
(Accumet Excel XL 30, Fisher Scientific, Pittsburgh, PA, USA) and a conductivity meter
(Accumet Basic AB 15), respectively.
4.3.3 Media and growth conditions for Geobacter sulfurreducens
G. sulfurreducens strain PCA (DSMZ 12127) was obtained from DSMZ (German
collection of microorganisms and cell cultures, Braunschweig, Germany) and was grown on
minimal media as indicated by DSMZ (DSMZ medium 826). Growth media contained (per
liter): 1.5 g NH4Cl, 0.6 g Na2HPO4, 0.1 g KCl and 0.82 g Na-acetate. For media preparation,
all the ingredients, except the fumarate, vitamins and NaHCO3, were first dissolved together,
the solution was then boiled and cooled down to room temperature while gasing the medium
with 80% N2/20% CO2. NaHCO3 was then added and 27 mL of this medium were
transferred into 60 ml serum bottles under a N2/CO2 atmosphere. Serum bottles were
74
crimped and autoclaved. In parallel, a 16 % (w/v) Na2-fumarate solution, a 5X - vitamins
stock solution (DSMZ medium 141) and a 0.1 M HCl solution were prepared as per the
recipe provided by DSMZ, filter-sterilized and degassed at room temperature for 30 min and
then subjected to 4 cycles of purging and flushing with Ar to remove any remaining O2. A
2.5% cysteine sulphide solution was also prepared and then autoclaved. The indicated
amounts of each solution were added into the bottles prior to inoculation.
A 10% (vol/vol) inoculum was used, giving a final volume of 30 mL in the serum
bottles. 300 µl of a 2.5% Na2S solution was added in the end to remove traces of oxygen in
the headspace. The pH of the medium was adjusted to 6.8-7.0. The bottles were incubated at
30°C. Subsequent inoculation procedures were always performed as above, for each phase,
unless indicated.
4.3.4 Bottle tests with G. sulfurreducens
Bottle tests were carried out to study G. sulfurreducens’s growth on acetate and CO.
Fumarate was used as the electron acceptor in all tests, unless indicated. The tests were
performed under three different concentrations of CO: 20%, 50% and 100% of the
headspace. For control experiments, G. sulfurreducens was grown in a 100% N2 atmosphere,
in the presence of acetate, at a pH of 7.0. This culture was used as an inoculum for G.
sulfurredencens’s growth test on acetate + 20% CO. The culture from these bottles was
subsequently used as an inoculum to test growth on 50% CO + acetate + fumarate, 20% CO
+ fumarate and 20% CO only. The cultures grown in 50% CO + acetate + fumarate were
used as inoculum for 100% CO + acetate + fumarate tests. Gas samples were taken only at

75
the beginning and at the end of the tests to avoid contamination with oxygen during the tests.
For tests on 20% CO + fumarate and 20% CO only, modified minimal media lacking Na-
acetate was used. All the tests were performed in triplicates.
4.3.5 DNA extraction and PCR amplification of 16S rDNA sequences
Both MFCs (MFC1 & MFC2) were dismantled, and the anodes were removed from the
anodic compartment in a sterile fume hood. Pieces of carbon felt (1 cm x 1 cm x 5 cm) were
cut from the middle and bottom of each anode using a sterile surgical scissor and stored at -
20°C until use. Total genomic DNA was extracted from the anode samples using the
PowerSoilTM DNA isolation kit (MOBIO Laboratories, Carlsbad, USA) according to the
instructions of the manufacturer. The extracted DNA was then used as a template to amplify
the 16s rDNA region of the eubacterial and archaeal populations by PCR, using universal
primers GC-341f (5’-CCT ACG GGA GGC AGC AG-3’) and 758r (5’-CTA CCA GGG
TAT CTA ATCC-3’) for eubacteria and primers GC-931f (5’-AGG AAT TGG CGG GGG
AGCA- 3’) and 1392r (5’-ACG GGC GGT GTG TGC- 3’) for archaea (Tartakovsky et al.,
2001). The sequence of the GC clamp added to the forward primers was:
CGCCCGCCGCGCGCGGGGGGCGGGGCGGGGGCACGGGGGG.
PCR amplifications were performed in a PCR thermal cycler (Eppendorf Mastercycler
Pro. Missisauga, Canada), in a final volume of 30 µL containing 15 µl of TAQ green master
mix, 0.5 µM of each primer, 1 ng µL-1 of genomic DNA and sterile Millipure water.
Amplification conditions were as follows: an initial denaturation step of 5 min at 94 °C, then
20 cycles of denaturation (30 s at 94 °C), annealing (30 s at 55 °C), and elongation (30 s at

76
72 °C). A final elongation step was of 10 min at 72 °C. PCR products were verified by
electrophoresis on a 1.4% agarose gel followed by visualization with UV illumination after
Sybr Safe staining (Invitrogen, Carlsbad, CA, USA).
4.3.6 DGGE and 16S rDNA sequencing
DGGE of PCR products were performed with a DCode GeneTM System (Bio-Rad,
Hercules, CA, USA). PCR samples were concentrated and 400 ng were loaded onto a 40%
to 60% urea-formamide denaturant gradient gel (8% (wt/vol) polyacrylamide in TAE (40
mM Tris-acetate pH 7.4, 20 mM acetate, 1mM Na2EDTA). Electrophoresis was performed
in TAE buffer at a temperature of 60°C and at a constant voltage of 80 V for 16 hours. After
electrophoresis, the gel was stained for 30 min with Vistra Green (Molecular Dynamics, CA,
USA). Densitometric scanning of fluorescent DNA fragments was performed with the
Molecular FluorImager (Molecular Dynamics, Sunnyvale, CA, USA) and results were
analyzed using ImageQuaNT software (Molecular Dynamics). Bands of interest were
excised from the gel, and DNA was eluted in milli Q water and reamplified by PCR as
described above. PCR products were then purified using the QIAquick purification kit
(Qiagen, Valencia, CA, USA) and sequenced at the Université Laval (Québec, QC, Canada).
Sequences were compared to those in the GenBank database using the Basic Local
Alignment Search Tool (BLAST) at the National Center for Biotechnology Information
(NCBI) to determine the phylogenetic affiliations.

77
4.4 Results and Discussion
4.4.1 Microbial community analysis
Diverse microbial communities were found to be present at the anodes of both CO-fed
MFCs. The identified microorganisms belonged to the genera Geobacter, Desulfovibrio,
Clostridium, and Ruminococcus for eubacteria and to the genera Methanobacterium,
Methanofollis and Methanosaeta for archaea. In addition, a number of uncultured bacteria
and archaea were identified.
Eubacterial community
The eubacterial populations identified at the anodes primarily consisted of sulfur
reducing bacteria (Table 4.1), belonging to the family Geobacteraceae and
Desulfovibrioceae. Sulfur reducers are known to be nutritionally versatile and have already
been identified in MFCs fed with different substrates (Logan, 2008). G. sulfurreducens was
found to be present at the anodes of both MFCs. However, this microorganism had not been
detected when DGGE analyses were performed on the initial sludge used as inoculum for
both MFCs (data not shown). As relatively less abundant species could be missed on DGGE
patterns (Ercolini, 2004), this suggests that G. sulffurreducens was plausibly present at non-
detectable levels in the initial sludge and the MFC operating conditions have stimulated its
growth at the anode, thereby leading to its identification. The ability of this microorganism
to use H2 and acetate for electricity generation in an MFC has been previously demonstrated
(Bond & Lovley, 2003). However, the ability of this microorganism to grow in the presence
of CO or use CO as an electron donor has not been demonstrated yet.

78
Table 4.1 Eubacteria populations identified in MFC1 and MFC2.
Identified Microorganism Identity
(%)
Origin/ Growth Conditions Hypothesized Activity in
a CO-fed MFC
MFC Reference
Geobacter sulfurreducens 98 Acetate, H2/CO2 Electricigenesis 1,2 (Bond & Lovley,
2003)
Uncultured Geobacter sp. 98 Isolated from Municipal waste water plant Electricigenesis 1 *HM991634
Geobacter sp. Lac 319 98 Isolated from the microbial community enriched at the
Titanium based anode of a MFC
Electricigenesis 1 (Michaelidou et
al., 2011)
Uncultured bacterium 98 Isolated from the microbial community enriched at the
anode of waste water fed MFC
- 1 *GU903481
Uncultured bacterium 98 Isolated from the microbial community present at the
anode of an MFC fed with different electron donors
- 1 (Jung & Regan,
2007)
Uncultured bacterium 98 Isolated from an MFC fed with waste water - 1 (Lefebvre et al.,
2010)
Uncultured bacterium 98 Isolated from an upflow MFC anode - 1 *EF515438
Desulfovibrio gigas 99 H2/CO2 Electricigenesis 1,2 (Brandis &
Thauer, 1981)
Desulfovibrio paquesii 99 H2/CO2 Electricigenesis 1,2 (Houten et al.,
2009)
Clostridium sticklandii 99 CO, CO2 Acetogenesis 2 (Fonknechten et
al., 2010)
Ruminococcus
hydrogenotrophicus
97 H2/CO2 Homoacetogenesis 2 (Bernalier et al.,
1996)
*GenBank accession no.

79
Two metalloenzymes, the CO dehydrogenase (CODH), and the acetyl-CoA synthase
(ACS) are fundamental for growth on CO. CODH oxidizes CO to CO2 or alternatively
reduces CO2 to CO. These reactions when coupled to ACS, form a mechanism for
generating Acetyl-CoA for cell carbon synthesis (Ragsdale, 2004). The complete genome of
G. sulfurreducens has been sequenced and was found to contain CODH–related genes and a
Wood-Ljungdahl gene cluster (Methe et al., 2003). The presence of these genes indicated
that G. sulfurreducens might be able to use exogenous CO or at least might be tolerant to
CO.
This hypothesis was tested in bottle tests, in which a pure culture of G. sulfurreducens
strain PCA was grown under different concentrations of CO and acetate (Table 4.2). The
results showed that G. sulfurreducens could grow under 20%, 50% and even 100% CO in
the presence of acetate and hence, demonstrated its tolerance to CO. The bacterium could
not grow solely on CO, however, it could convert CO into CO2, which was evidenced by a
decrease in CO and an increase in CO2 concentrations (Table 4.2).
Desulfovibrio species such as D. gigas, and D. paquesii, were detected in both MFCs.
Alike G. sulfurreducens, D. gigas, and D. paquesii had not been detected when DGGE
analyses were performed on the initial sludge used as inoculums for both MFCs (data not
shown), again suggesting that the MFC operating conditions might have simulated their
growth at the anode. Desulfovibrio species, have already been identified in bioreactors fed
with syngas and have also been found to be present in the anodic microbial communities of
a MFC fed with CO saturated wastewater, suggesting CO tolerance by at least some
members of this species (Houten et al., 2006; Lee et al., 2003). The ability to utilize CO as
the sole source of electrons for sulfate and metal reduction by some of its members has also
80
been demonstrated (Parshina et al., 2010). Such species were hypothesized to be responsible
for CO conversion into CO2 and H2 in the study of Preez and Maree (Preez & Maree, 1994),
where producer gas was used as an energy source for biological sulfate and nitrate removal.
D. paquesii and D. gigas which were identified in our study are capable of using H2 as an
electron donor for sulfate reduction (Brandis & Thauer, 1981; Houten et al., 2009). D.
paquesii has already been isolated in a reactor fed with syngas and has been suggested to be
tolerant to CO (Brandis & Thauer, 1981; Houten et al., 2009). To our knowledge, the
tolerance of D. gigas to CO has not been tested. However, its identification in our reactor
suggests that it might be tolerant to CO. Further experiments, such as bottle tests with CO,
would be required to test the ability of D. gigas to oxidize CO.
Community analysis also led to the identification of the acetogens R.
hydrogenotrophicus and C. sticklandii. These acetogens had not been detected during the
DGGE analyses of the initial inoculum sludge. R. hydrogenotrophicus is known to form
acetate by acetogenic hydrogenation (Bernalier et al., 1996) where H2 and CO2 are
converted to acetate according to the equation:
4H2 + 2CO2 → CH3COOH + 2H2O............................................................................. (4.1)
Homoacetogens such as R. Hydrogenotrophicus have been widely isolated in syngas-
fed bioreactors, forming acetate from CO2 and H2, produced by the conversion of CO by the
Desulfovibrio species (Lens et al., 2002; Sipma et al., 2006). C. sticklandii, might also have
the capacity to form acetate from CO as several clostridia are capable of using CO as their
sole source of energy while forming acetate and CO2 (Sipma et al., 2006), according to the
equation:

81
4CO + 2H2O → CH3COOH + 2CO2........................................................................ (4.2)
This hypothesis is strengthened by the presence of gene clusters in the genome of C.
sticklandii, which encode the complete Wood-Ljungdahl pathway and the glycine synthase
reductase pathway, both of which lead to acetate formation (Fonknechten et al., 2010).
Although the presence of C. sticklandii at the anode of MFC2, suggests its tolerance to CO,
further experiments would be required to confirm its growth solely on CO. As acetate was
the major metabolite in both MFCs, one could conceive that there were more acetogens
present but we were not able to isolate them in the DNA extraction-PCR amplification
process.
An important fact to be noticed is that, Ruminococcus and Clostridium species were not
identified at the anode of MFC1 (Table 4.1). This difference in the anodic eubacterial
populations between MFC1 and MFC2 might be due to higher substrate availability in
MFC2. Due to the utilization of silicone membrane systems for gas delivery in MFC2, the
gas to liquid mass transfer was improved (Hussain et al., 2011a), which could have
stimulated the growth of these species. Conceivably, these species were present in MFC1,
but were plausibly not detected in DGGE analyses due their less abundance in the system.
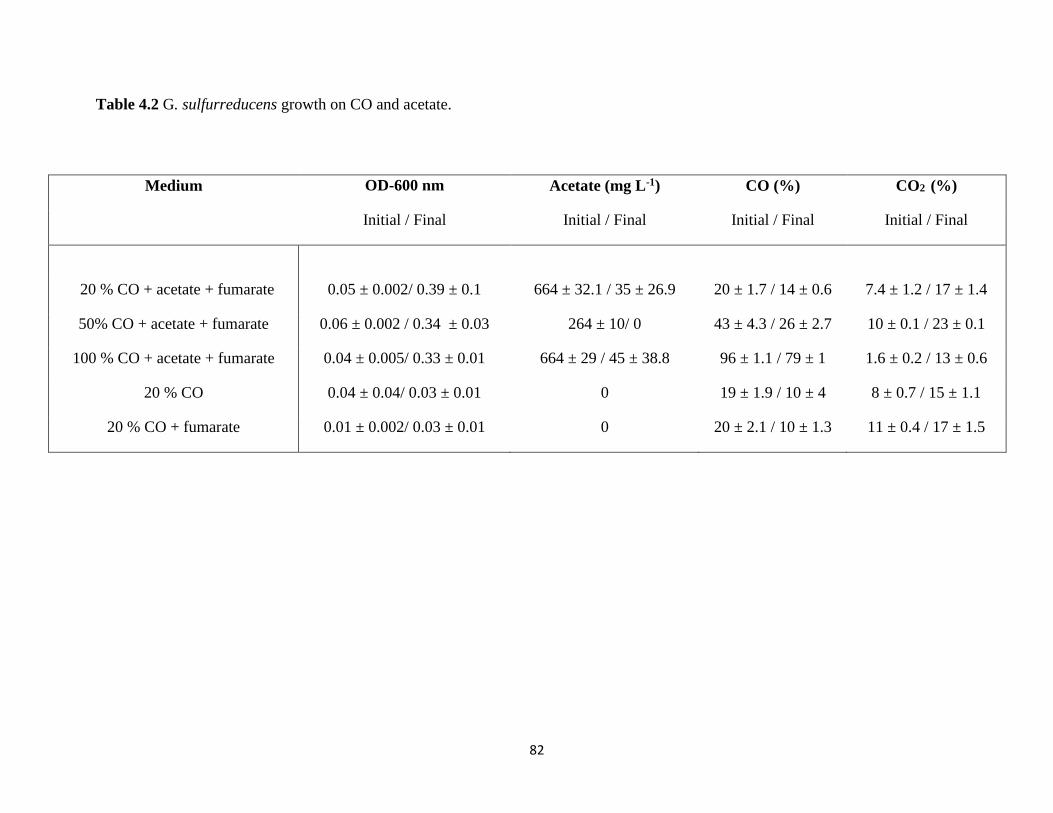
82
Table 4.2 G. sulfurreducens growth on CO and acetate.
Medium OD-600 nm Acetate (mg L-1) CO (%) CO2 (%)
Initial / Final Initial / Final Initial / Final Initial / Final
20 % CO + acetate + fumarate 0.05 ± 0.002/ 0.39 ± 0.1 664 ± 32.1 / 35 ± 26.9 20 ± 1.7 / 14 ± 0.6 7.4 ± 1.2 / 17 ± 1.4
50% CO + acetate + fumarate 0.06 ± 0.002 / 0.34 ± 0.03 264 ± 10/ 0 43 ± 4.3 / 26 ± 2.7 10 ± 0.1 / 23 ± 0.1
100 % CO + acetate + fumarate 0.04 ± 0.005/ 0.33 ± 0.01 664 ± 29 / 45 ± 38.8 96 ± 1.1 / 79 ± 1 1.6 ± 0.2 / 13 ± 0.6
20 % CO 0.04 ± 0.04/ 0.03 ± 0.01 0 19 ± 1.9 / 10 ± 4 8 ± 0.7 / 15 ± 1.1
20 % CO + fumarate 0.01 ± 0.002/ 0.03 ± 0.01 0 20 ± 2.1 / 10 ± 1.3 11 ± 0.4 / 17 ± 1.5
83
Archaeal community
The archaea identified in this study were all methanogens (Table 4.3) and primarily
possessed the hydrogenotrophic pathway, in which CO2 is sequentially reduced to CH4, with
H2 serving as the electron donor, according to the equation:
CO2 + 4H2 → CH4 + 2H2O.................................................................................. (4.3)
The H2 production from CO (water gas-shift reaction) in our CO-fed MFCs might have
stimulated the growth of these methanogens. Hydrogenotrophic methanogens have already
been reported to be the dominant methanogens in syngas-fed bioreactors, due to i) lower
threshold for H2 as compared with that of the acetogens and ii) the energy yield from the
conversion of CO2 and H2 to CH4, which is greater than the conversion of acetate to CH4
(Houten et al., 2006).
Methanobacterium species identified in this study (Methanobacterium sp. OM15, M.
formicicum, and M. beijingense) and Methanofollis liminatans are known to utilize H2 and
CO2 for methane formation (Houten et al., 2006; Imachi et al., 2011; Wu et al., 1993). To
our knowledge, the CO tolerance of these microorganisms in pure cultures has not been
studied yet. However, CO tolerance for some of them has been reported in a mixed culture.
M. formicicum, M. liminatans and Methanobacterium sp. OM15 were notably identified in a
syngas-fed reactor treating sulfate and metal-rich waste water (Houten et al., 2006),
suggesting their tolerance to CO. The CO tolerance of M. formicicum was also demonstrated
in a mixed culture with R. rubrum, where R. rubrum performed the water gas shift reaction
to form H2 and CO2, which was subsequently converted to CH4 by M. formicicum (Daniels
et al., 1977).

84
Table 4.3 Archaea populations identified in MFC1 and MFC2.
*GenBank accession no.
Identified Microorganism Idenitity (%) Origin/ Growth Conditions Hypothesized Activity in a CO-fed MFC MFC Reference
Uncultured Archaeon 99 Isolated from a bioreactor
treating Waste water
- 1,2 (Tsushima et al.,
2010)
Uncultured Archaeon 99 Isolated from a bioreactor
treating Waste water
- 1 (Tsushima et al.,
2010)
Methanobacterium sp. T01,C5/51 99 Rumen Methanogens - 1 *AB288275, AJ550159
Methanobacterium sp.OM15,MO-
MB1
99 H2/CO2 Hydrogenotrophic Methanogenesis 1 (Imachi et al.,
2011)
Methanosaeta concilii 99 Acetate Acetoclastic Methanogenesis 1,2 (Huser et al.,
1982)
Methanobacterium formicicum 99 H2/CO2, Formate Hydrogenotrophic Methanogenesis 1 (Wu et al., 1993)
Uncultured Archaeon 99 Isolated from an anaerobic
digester
- 1,2 *AB494254
Uncultured Archaeon 99 Isolated from a bioreactor
fed with Waste water
- 1,2 (Tsushima et al.,
2010)
Methanobacterium beijingense 99 H2/CO2,formate Hydrogenotrophic Methanogenesis 1 (Ma et al., 2005)
Uncultured Archaeon 98 Isolated from an anaerobic
digester
- 1 (Ueki et al.,
2009)
Uncultured Archaeon 99 Methanogenic digester - 1 (Kovacik et al.,
2010)
Uncultured Archaeon 99 Anaerobic digester treating
waste water
- 1 (Godon et al.,
1997)
Uncultured Archaeon 99 Waste water treatment plant - 1 *CU466582
Uncultured Archaeon 99 Isolated from landfill
leachate
- 1 (Huang et al.,
2003)
Methanofollis liminatans 98 H2/CO2,Formate Hydrogenotrophic Methanogenesis 2 (Zellner et al.,
1999)
Methanobacterium sp.MO-MB1 96 H2/CO2 Hydrogenotrophic Methanogenesis 2 (Imachi et al.,
2011)
Methanobacterium petrolearium 96 H2/CO2 Hydrogenotrophic Methanogenesis 2 (Mori and
Harayama, 2011)

85
In addition to hydrogenotrophic methanogens, the acetoclastic methanogen,
Methanothrix soehngenii (now called Methanosaeta concilii) (Huser et al., 1982; Wayne,
1994) was also identified. Acetoclastic methanogens in the presence of acetate generate
metabolic energy by interfacing the Wood-Ljungdahl pathway to the pathway of
methanogenesis. M. concilii uses acetate as a sole source of energy to form CH4 and CO2, as
per the equation:
CH3COOH → CH4 + CO2....................................................................................... (4.4)
Although they possess the enzyme CODH, such methanogens do not convert CO to
acetyl-CoA. It has been suggested that CO might be involved as a CODH/ACS-bound
intermediate in acetoclastic energy metabolism among methanogens such as M. concilii
(Oelgeschlager & Rother, 2008). The exogenous CO may form an unidentified bound
intermediate during the conversion of the carboxyl group of the acetate to CO2 (Daniels et al.,
1977). Therefore, it could be hypothesized that the exogenous CO in both our MFCs was
oxidized by M. concilii into CO2 to derive electrons for the reduction of methyl-S-CoM into
methane, as per the combined equation:
CO + H2O + CH3-S-CoM → CH4 + CO2 + HS-CoM........................................... (4.5)
4.4.2 Pathways for electricity generation in a CO-fed MFC
Following the microbial community analysis, pathways involved in electricity
generation in CO-fed MFCs can be better elucidated and understood. Acetate formation
from CO, followed by acetate oxidation to produce electricity by CO tolerant electricigenic
microorganisms has been previously suggested to be one of the prominent pathways for
electricity generation (Mehta et al., 2010). This pathway can now be conceptualized based
86
upon the identification of acetogens such as C. sticklandii, which might have the capacity to
form acetate from CO, followed by the demonstrated CO-tolerance of the electricigenic G.
sulfurreducens, whose ability to produce electricity in an acetate-fed MFC has been
previously reported (Bond & Lovley, 2003). The following stoichiometric equations
describe this pathway:
4CO + 2H2O → CH3COOH + 2CO2 ....................................................................... (4.6)
CH3COOH + 2H2O → 2CO2 + 8e- + 8H+............................................................... (4.7)
The presence of H2 in the off-gas also raised the possibility of electricity generation via
hydrogen as previously hypothesized (Mehta et al., 2010). H2 could have been formed from
CO by the members of the Desulfovibrio species by the following reaction, as previously
described (Sipma et al., 2006):
CO + H2O → H2 + CO2........................................................................................... (4.8)
The H2 produced could then be utilized by G. sulfurreducens for electricity generation,
as previously proposed (Hussain et al., 2011b). The ability of a microorganism to produce
electricity in an MFC could include any microorganism capable of extracellular electron
transfer, even if its capacity has not yet been experimentally evidenced (Logan, 2009). D.
gigas identified in this study, has been reported to reduce Tc(VII) utilizing H2 as the electron
donor (Lovley, 1993). Therefore, it could be suggested that the Desulfovibrio species
identified at the anode of MFC2 in this study, might be involved in electricigenesis using H2.
Substantial amounts of acetate were previously reported to be present in the effluent,
when the MFCs were fed with H2/CO2 (Hussain et al., 2011b; Mehta et al., 2010). This
87
observation can now be related to the presence of homoacetogens such as R.
hydrogenotrophicus, identified in this study. Their presence also demonstrates that
electricity generation in CO-fed MFCs primarily proceeds via acetate conversion to
electricity.
Significant amounts of CH4 were present in the off-gas samples of both MFCs, which
was previsously hypothesized to be responsible for the low Coulombic efficiency (CE) of
the systems (Hussain et al., 2011a; Mehta et al., 2010). The hypothesis can now be related to
the presence of a large number of hydrogenotrophic and acetogenic methanogens at the
anode, which must have competed with the eletricigenic bacteria in the MFCs for the
electron donor, resulting in a low CE. A similar observation was also made in the study of
Kim et al. (2005), where a 30 % increase in CE was observed when a methanogenic
inhibitor was utilized.
Overall this study presents the microbial diversity prevalent at the anodes of CO-fed
MFCs. The microbial community analysis provided a better understanding of the range of
reactions catalyzed by microorganisms in CO-fed MFCs and helped elucidate the pathways
involved in electricity generation. G. sulfurreducens, along with other sulfate reducers were
found to be present in both MFCs. Bottle tests demonstrated the ability of G. sulfurreducens
to grow in a 100% CO environment, in the presence of acetate. Based upon the current
literature and findings of this study, they might be the primary microorganisms responsible
for electricity generation in a CO-fed MFC. The results presented herein, may lead to the
development of CO-fed MFCs with engineered consortia. A CO-fed MFC seeded with pure
cultures of electricigenic microorganism such as G. sulfurreducens in a syntrophic

88
relationship with carboxydotrophic microorganism might be capable of achieving high
power densities, due to the elimination of alternative metabolisms such as methanogenesis,
which competes with the electricigenic microorganisms for the electron donor and use
electron acceptors which do not result in electricity generation, resulting in low coulombic
efficiency. Acetate-fed MFCs seeded with a pure culture of G. sulfurreducens were recently
reported to achieve power densities that were comparable to the MFCs inoculated with an
anaerobic sludge (Nevin et al., 2008).
4.5 Conclusion
Diverse microbial communities were found to be present at the anode of CO-fed MFCs.
The identified archaea populations primarily consisted of hydrogenotrophic methanogens,
while the eubacterial populations were dominated by the members belonging to
Geobacteraceae and Desulfovibrioceae. The study demonstrates the ability of G.
sulfurreducens to grow in a 100% CO environment, in the presence of acetate and discusses
the underlying role played by sulfur reducing bacteria in electricity generation from CO. The
microbial community analysis provided a better understanding of the range of reactions
catalyzed by microorganisms in CO-fed MFCs and helped elucidate the pathways involved
in electricity generation. The identification of large number of methanogens suggests that a
part of the anodic microbial community is sustained by alternative metabolism and
competes with the electricigenic microorganisms for the electron donor and use electron
acceptors which do not result in electricity generation, resulting in low Coulombic efficiency.

89
4.6 References
Bernalier, A., Willems, A., Leclerc, M., Rochet, V., Collins, M.D. 1996. Ruminococcus
hydrogenotrophicus sp. nov., a new H2/CO2-utilizing acetogenic bacterium isolated
from human feces. Arch Microbiol, 166, 176-183.
Bond, D.R., Lovley, D.R. 2003. Electricity Production by Geobacter sulfurreducens
Attached to Electrodes. Appl Environ Microbiol, 69, 1548-1555.
Brandis, A., Thauer, R.K. 1981. Growth of Desulfovibrio species on Hydrogen and Sulphate
as Sole Energy Source. J. Gen. Microbiol., 126, 249-252.
Daniels, L., Fuchs, G., Thauer, R.K., Zeikus, J.G. 1977. Carbon Monoxide Oxidation by
Methanogenic Bacteria. J. Bacteriol., 132, 118-126.
Ercolini, D. 2004. PCR-DGGE fingerprinting: novel strategies for detection of microbes in
food. J. Microbiol. Methods, 56, 297-314.
Fonknechten, N., Chaussonnerie, S., Tricot, S., Lajus, A., Andreesen, J., Perchat, N.,
Pelletier, E., Gouyvenoux, M., Barbe, V., Salanoubat, M., Le Paslier, D., Weissenbach,
J., Cohen, G., Kreimeyer, A. 2010. Clostridium sticklandii, a specialist in amino acid
degradation:revisiting its metabolism through its genome sequence. BMC Genomics, 11,
555.
Godon, J., Zumstein, E., Dabert, P., Habouzit, F., Moletta, R. 1997. Molecular microbial
diversity of an anaerobic digestor as determined by small-subunit rDNA sequence
analysis. Appl Environ Microbiol, 63, 2802-13.
Guiot, S., Cimpoia, R., Carayon, G. 2011. Potential of Wastewater-Treating Anaerobic
Granules for Biomethanation of Synthesis Gas. Environ. Sci. Technol., 45, 2006-2012.
Houten, B., Meulepas, R., Doesburg, W., Smidt, H., Muyzer, G., Stams, A. 2009.
Desulfovibrio paquesii sp. nov., a hydrogenotrophic sulfate-reducing bacterium isolated
from a synthesis-gas-fed bioreactor treating zinc- and sulfate-rich wastewater. Int. J.
Syst. Evol. Microbiol., 59, 229-233.
Huang, L.-N., Chen, Y.-Q., Zhou, H., Luo, S., Lan, C.-Y., Qu, L.-H. 2003. Characterization
of methanogenic Archaea in the leachate of a closed municipal solid waste landfill.
FEMS Microbiol Ecol, 46, 171-177.

90
Houten, B., Roest, K., Tzeneva, V., Dijkman, H., Smidt, H., Stams, A. 2006. Occurrence of
methanogenesis during start-up of a full-scale synthesis gas-fed reactor treating sulfate
and metal-rich wastewater. Water Res., 40, 553-560.
Huser, B.A., Wuhrmann, K., Zehnder, A.J.B. 1982. Methanothrix soehngenii gen. nov. sp.
nov., a new acetotrophic non-hydrogen-oxidizing methane bacterium. Arch. Microbiol.,
132, 1-9.
Hussain, A., Tartakovsky, B., Guiot, S.R., Raghavan, V. 2011a. Use of silicone membranes
to enhance gas transfer during microbial fuel cell operation on carbon monoxide.
Bioresour Technol, 102, 10898-10906.
Hussain, A., Guiot, S., Mehta, P., Raghavan, V., Tartakovsky, B. 2011b. Electricity
generation from carbon monoxide and syngas in a microbial fuel cell. Appl Microbiol
Biotechnol, 90, 827-836.
Imachi, H., Aoi, K., Tasumi, E., Saito, Y., Yamanaka, Y., Saito, Y., Yamaguchi, T., Tomaru,
H., Takeuchi, R., Morono, Y., Inagaki, F., Takai, K. 2011. Cultivation of methanogenic
community from subseafloor sediments using a continuous-flow bioreactor. ISME J, 1,
1-13.
Jung, S., Regan, J. 2007. Comparison of anode bacterial communities and performance in
microbial fuel cells with different electron donors. Appl. Microbiol. and Biotechnol., 77,
393-402.
Kim, D., Chang, I. 2009. Electricity generation from synthesis gas by microbial processes:
CO fermentation and microbial fuel cell technology. Bioresour Technol, 100, 4527-
4530.
Kim, J.R., Min, B., Logan, B.E. 2005. Evaluation of procedures to acclimate a microbial
fuel cell for electricity production. Appl. Microbiol. Biotechnol., 68, 23-30.
Klasson, K., Ackerson, C., Clausen, E., Gaddy, J. 1992. Biological conversion of synthesis
gas into fuels. Int. J. Hydrogen Energ., 17, 281-288.
Lee, J., Phung, N.T., Chang, I.S., Kim, B.H., Sung, H.C. 2003. Use of acetate for
enrichment of electrochemically active microorganisms and their 16S rDNA analyses.
FEMS Microbiol. Lett., 223, 185-191.
Lefebvre, O., Ha Nguyen, T.T., Al-Mamun, A., Chang, I.S., Ng, H.Y. 2010. T-RFLP reveals
high β-Proteobacteria diversity in microbial fuel cells enriched with domestic
wastewater. J. Appl. Microbiol., 109, 839-850.
91
Lens, P., Vallerol, M., Esposito, G., Zandvoort, M. 2002. Perspectives of sulfate reducing
bioreactors in environmental biotechnology. Rev. Environ. Sci. Biotechnol., 1, 311-325.
Logan, B. 2008. Microbial Fuel Cells. John Wiley & Sons Inc., Hoboken, NJ, USA.
Logan, B.E. 2009. Exoelectrogenic bacteria that power microbial fuel cells. Nat Rev Micro,
7, 375-381.
Lovley, D.R. 1993. Dissimilatory Metal Reduction. Annual Rev. Microbiol., 47, 263-290.
Lovley, D.R. 2006. Microbial fuel cells: novel microbial physiologies and engineering
approaches. Curr. Opin. Biotechnol., 17, 327-332.
Ma, K., Liu, X., Dong, X. 2005. Methanobacterium beijingense sp. nov., a novel
methanogen isolated from anaerobic digesters. Int J Syst Evol Microbiol, 55, 325-329.
Mehta, P., Hussain, A., Raghavan, V., Neburchilov, V., Wang, H., Tartakovsky, B., Guiot, S.
2010. Electricity generation from a carbon monoxide in a single chamber microbial fuel
cell. Enzyme Microb Technol, 46, 450-455.
Methe, B.A., Nelson, K.E., Eisen, J.A., Paulsen, I.T., Nelson, W., Heidelberg, J.F., Wu, D.,
Wu, M., Ward, N., Beanan, M.J., Dodson, R.J., Madupu, R., Brinkac, L.M., Daugherty,
S.C., DeBoy, R.T., Durkin, A.S., Gwinn, M., Kolonay, J.F., Sullivan, S.A., Haft, D.H.,
Selengut, J., Davidsen, T.M., Zafar, N., White, O., Tran, B., Romero, C., Forberger,
H.A., Weidman, J., Khouri, H., Feldblyum, T.V., Utterback, T.R., Van Aken, S.E.,
Lovley, D.R., Fraser, C.M. 2003. Genome of Geobacter sulfurreducens: Metal
Reduction in Subsurface Environments. Science, 302, 1967-1969.
Michaelidou, U., ter Heijne, A., Euverink, G.J.W., Hamelers, H.V.M., Stams, A.J.M.,
Geelhoed, J.S. 2011. Microbial Communities and Electrochemical Performance of
Titanium-Based Anodic Electrodes in a Microbial Fuel Cell. Appl. Environ. Microbiol.,
77, 1069-1075.
Neburchilov, V., Mehta, P., Hussain, A., Raghavan, V., Wang, H., Guiot, S., Tartakovsky, B.
2011. Microbial Fuel Cell Operation On Carbon Monoxide: Cathode Catalyst Selection.
Int J Hydrogen Energ, 36, 11929-11935.
Nevin, K.P., Richter, H., Covalla, S.F., Johnson, J.P., Woodard, T.L., Orloff, A.L., Jia, H.,
Zhang, M., Lovley, D.R. 2008. Power output and columbic efficiencies from biofilms
of Geobacter sulfurreducens comparable to mixed community microbial fuel cells.
Environ. Microbiol., 10, 2505-2514.
92
Oelgeschlager, E., Rother, M. 2008. Carbon monoxide - dependant energy metabolism in
anaerobic bacteria and archaea. Arch Microbiol, 190, 257-269.
Parshina, S.N., Sipma, J., Henstra, A.M., Stams, A.J.M. 2010. Carbon Monoxide as an
Electron Donor for the Biological Reduction of Sulphate. Int. J. Microbiol., 25, 1-9.
Preez, L., Maree, J. 1994. Pilot-scale biological sulphate and nitrate removal utilizing
producer gas as energy source. Water sci. technol., 30, 275-285.
Ragsdale, S.W. 2004. Life with Carbon Monoxide. Cri. Rev. Biochem. and Molecul. Biol.,
39, 165 - 195.
Sipma, J., Henstra, A.M., Parshina, S.N., Lens, P.N.L., Lettinga, G., Stams, A.J.M. 2006.
Microbial CO Conversions with Applications in Synthesis Gas Purification and Bio-
Desulfurization. Crit Rev Biotechnol, 26, 41 - 65.
Song, C. 2002. Fuel processing for low-temperature and high-temperature fuel cells:
Challenges, and opportunities for sustainable development in the 21st century. Catal
today, 77, 17-49.
Tartakovsky, B., Manuel, M.F., Beaumier, D., Greer, C., Guiot, S.R. 2001. Enhanced
selection of an anaerobic pentachlorophenol-gegrading consortium. Biotechnol. and
Bioeng., 73, 476-83.
Tartakovsky, B., Manuel, M.F., Neburchilov, V., Wang, H., Guiot, S.R. 2008. Biocatalyzed
hydrogen production in a continuous flow microbial fuel cell with a gas phase cathode.
J. Power Sources, 182, 291-297.
Tsushima, I., Yoochatchaval, W., Yoshida, H., Araki, N., Syutsubo, K. 2010. Microbial
community structure and population dynamics of granules developed in expanded
granular sludge bed (EGSB) reactors for the anaerobic treatment of low-strength
wastewater at low temperature. J Environ Sci Health, Part A, 45, 754-766.
Wayne, L. 1994. Actions of the judial commission of the international committee on
systematic bacteriology on requests for opinions published between January 1985 and
July 1993. Int. J. Sys. Bacteriol., 44, 177-178.
Wu, W.-M., Hickey, R.F., Jain, M.K., Zeikus, J.G. 1993. Energetics and regulations of
formate and hydrogen metabolism by Methanobacterium formicicum. Arch. Microbiol.,
159, 57-65.

93
Zellner, G., Boone, D.R., Keswani, J., Whitman, W.B., Woese, C.R., Hagelstein, A., Tindall,
B.J., Stackebrandt, E. 1999. Reclassification of Methanogenium tationis and
Methanogenium liminatans as Methanofollis tationis gen. nov., comb. nov. and
Methanofollis liminatans comb. nov. and description of a new strain of Methanofollis
liminatans. Int J Syst Bacteriol, 49, 247-255.
94
Connecting text
Chapter 3 demonstrated improved MFC performance under mesophilic conditions by
increasing the CO gas-liquid mass transfer. Subsequently in chapter 4 the microbial
communities and biotransformation pathways involved in electricity production from
CO/syngas in a mesophilic MFC were elucidated.
Considering that syngas is primarily a hot gas with temperatures of 40-55 °C at the exit
of the gasification process, the operation of CO/syngas-fed MFCs at thermophilic
temperatures is of interest. However, thermophilic operations of CO/syngas-fed MFCs poses
several challenges including reduced CO/syngas solubility in the anodic liquid, increased
anodic liquid evaporation and lack of known thermophilic CO-tolerant electricigenic
microorganisms.
The following study demonstrated electricity production in a thermophilic MFC fed
with syngas, and elucidated the microbial communities and biotransformation pathways
involved in electricity production at elevated temperatures. The study was published in
Journal of Enzyme and Microbial Technology (2012), 51; 163-170.

95
CHAPTER 5
The performance of a thermophilic microbial fuel cell fed with synthesis gas
5.1 Abstract
This study demonstrated electricity generation in a thermophilic microbial fuel cell
(MFC) operated on synthesis gas (syngas) as the sole electron donor. At 50 ºC, a volumetric
power output of 30-35 mW -1
RL and syngas conversion efficiency in the range of 87-98 %
was achieved. The observed pathway of syngas conversion to electricity primarily consisted
of a two-step process, where the carbon monoxide and hydrogen were first converted to
acetate, which was then consumed by the electricigenic bacteria to produce electricity. A
denaturing gradient gel electrophoresis (DGGE) analysis of the 16S rDNA revealed the
presence of Geobacter species, Acetobacter, methanogens and several uncultured bacteria
and archaea in the anodic chamber.
Keywords: MFC; synthesis gas; carbon monoxide; thermophilic conditions

96
5.2 Introduction
Electricity production from diluted organic matter in mesophilic and thermophilic
microbial fuel cells (MFC) has been extensively demonstrated (Logan, 2010; Logan &
Regan, 2006; Lovley, 2008). However, solid organic wastes (e.g. organic fraction of
municipal solid wastes, agricultural wastes such as straw, corn husks, etc.) might be pre-
treated and diluted to be used as an MFC fuel. To avoid excessive water and energy
consumption, such wastes are often transformed in a gasification process to synthesis gas
(syngas), which mainly consists of carbon monoxide (CO) and hydrogen (Munasinghe &
Khanal, 2010a; Perry et al., 1997). Recently, electricity generation from CO and syngas in a
mesophilic MFC has been demonstrated, thus further expanding the range of MFC
applications (Kim & Chang, 2009; Mehta et al., 2010).
CO and syngas-fed MFCs have been so far operated at mesophilic temperatures.
Considering that at the exit of the gasification process syngas temperatures could be in a
range of 45–55 ºC, the operation of the MFC at thermophilic temperatures might be
preferable as it eliminates the need for further syngas cooling and might lead to a higher
biocatalytic activity (Jong et al., 2006; Mathis et al., 2008). The thermophilic conditions
would also lead to reduced oxygen solubility, which is beneficial considering that even trace
amounts of unreacted O2 diffusing through the cathode can inhibit the anaerobic
carboxydotrophic microorganisms which are highly sensitive to the presence of O2
(Davidova et al., 1994). However, syngas conversion to electricity in an MFC involves a
combination of microbiological, electrochemical and transport phenomena, all of which are
affected by temperature, such that the overall outcome of its increase is uncertain.

97
This study presents the first attempt to operate a syngas-fed MFC at a moderately
thermophilic temperature of 50 °C. The analysis of the off-gas and effluent composition is
utilized to propose the pathways leading to electricity generation under thermophilic
conditions. To confirm the proposed pathways, the observed metabolites were compared to
the microbial communities identified in the anodic chamber by the DGGE of the polymerase
chain reaction (PCR) amplified 16S rDNA fragments.
5.3 Materials and Methods
5.3.1 Medium composition and analytical methods
The composition of the stock solution of nutrients was (in g L-1): 1.87 NH4Cl, 14.81
KCl, 6.40 K2HPO4, 4.07 KH2PO4 and 0.215 yeast extract. The trace metal stock solution
was prepared according to Tartakovsky et al. (2008), and contained (in g/L): 2 FeCl24H2O,
0.05 H3BO3, 50 ZnCl2, 0.03 CuCl2, 0.5 MnCl24H2O, 0.5 (NH4)6Mo7O244H2O, 0.5 AlCl3,
0.5 CoCl26H2O, 0.5 NiCl2, 0.5 EDTA, and concentrated HCl (1 mL). The chemicals used
were of analytical grade. The stock solutions were filter - sterilized with a 0.22 m filter
(Fisher Scientific, Ottawa, ON, Canada) and maintained at 4°C until use. The influent
solution was prepared by adding 35 mL of the nutrient solution and 1 mL of the trace metal
solution to 1 L of de-ionized water. This solution had a conductivity of 12 -14 mS cm-1.
Acetate and other volatile fatty acids (VFAs) were analyzed using an Agilent 6890 gas
chromatograph (Agilent Technologies Inc, Santa Clara, CA, USA) equipped with a flame
ionization detector. The off-gas flow rate was measured using the MilliGascounterTM (Ritter
Apparatus, Bochum, Germany). The gas composition was measured using an HP 6890 gas

98
chromatograph (Hewlett Packard, Palo Alto, CA) equipped with a thermal conductivity
detector and a 5 m x 2.1 mm Carboxen-1000 column (Supelco, Bellafonte, PA) with argon
as the carrier gas. Further details of the analytical methods are provided in Guiot et al.
(2011).
5.3.2 Inoculum
The thermophilic mixed culture capable of growth on CO was obtained from a
mesophilic anaerobic granular sludge treating agricultural wastes (Lassonde Inc.,
Rougemont, QC, Canada). The following enrichment procedure was used. A 1 L serum
bottle containing 200 mL of the mesophilic sludge and 300 mL of liquid medium (same as
the influent solution) was incubated for one week under 100% CO atmosphere in a rotary
shaker incubator at 100 rpm and 45 °C. The temperature was then raised to 50 °C. The CO
concentration in the headspace of the bottle and the VFA composition of the liquid were
analyzed weekly. The headspace was replenished with 100% CO every 2-3 days. The bottle
was maintained at 50 °C for one month and then used as the inoculum.
5.3.3 MFC design, operation, and characterization
The MFC experimental set-up was similar to that previously used for the demonstration
of electricity production from CO in a mesophilic MFC equipped with silicone tubing for
CO supply (Hussain et al., 2011). The 50 mL anodic compartment contained a 10 cm x 5 cm
carbon felt anode (SGL Canada, Kitchener, ON, Canada), with a volume of 25 mL. A
CO/FeTMPP cathode attached to the side of the anode compartment was separated from the
anode by a non-conductive 1mm synthetic cloth. The cathode was prepared as described in
99
Neburchilov et al. (2011). Syngas was supplied to the anodic liquid through silicone tubing
coiled around a second piece of carbon felt separated from the anode (Fig. 5.1A) and thereby,
excluded from the electrical circuit by the non-conductive synthetic cloth. The silicone
tubing (VWR International LLC, Radnor, PA, USA) had a wall thickness of 90 µm, an
external diameter of 1.76 mm, and a total surface area of 50 cm2. The inlet of the silicone
tubing was connected to the gas line, while the outlet was connected to a manometer. The
solution of nutrients and microelements was fed in at a rate of 10 mL d-1 using a peristaltic
pump. The schematic diagram of the experimental setup is shown in Figure 5.1B.
The anodic liquid was maintained at 50 °C by heating the liquid in the external
recirculation loop of the MFC. To simulate syngas feeding, CO and H2 (50:50 v/v) were
simultaneously fed at desired flow rates. During the start-up, the MFC was operated with a
constant external resistance of 500 Ω. Once a steady power output was observed, the
external resistance was optimized using the Perturbation and Observation MPPT algorithm,
which constantly adjusted the external resistance to maximize the MFC power output in real
time (Woodward et al., 2009).
Syngas flow rates of 4, 6, 8 and 10 L -1
RL d-1 (expressed as L of syngas fed per L of
anodic chamber volume per day) were tested. Each flow rate was tested for a period of at
least 5 days. In addition to MFC operation on syngas, several single electron donor tests
were carried out. In the hydrogen test, a H2/CO2 (80:20 v/v) mixture was fed at a rate of
6 L -1
RL d-1. The carbon monoxide test used a CO/N2 (50:50 v/v) gas mixture also fed at a
flow rate of 6 L -1
RL d-1. Each test was performed for 3 days.
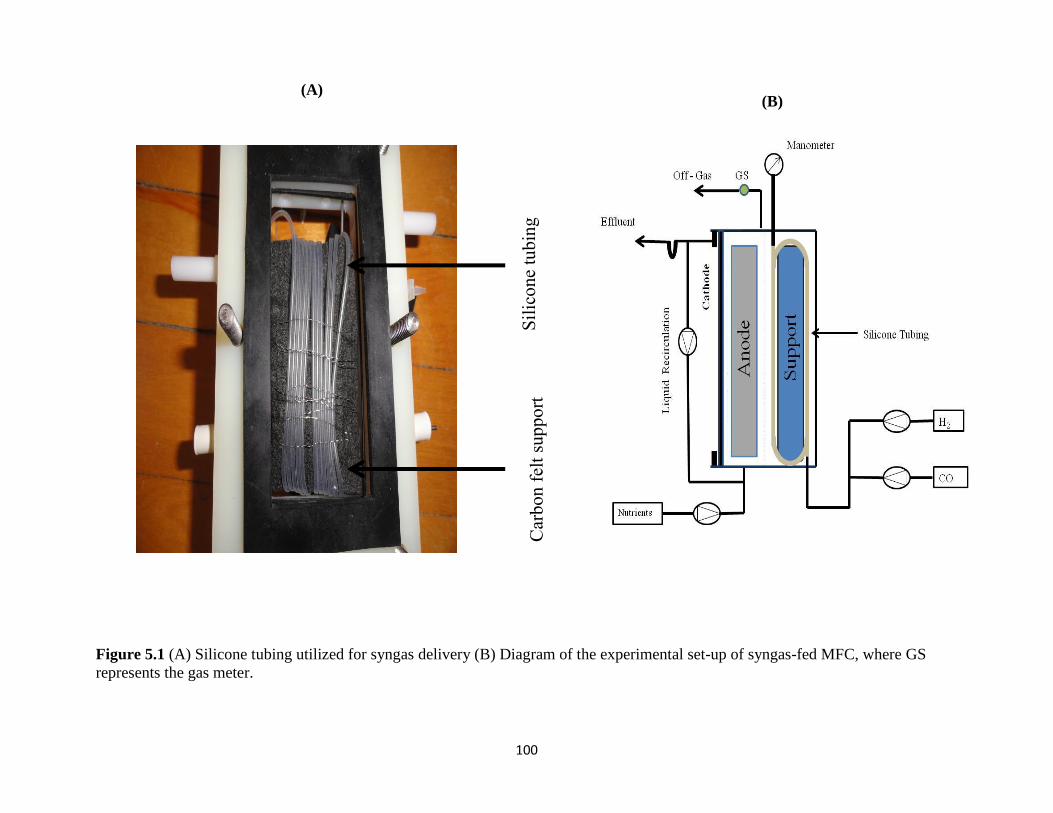
100
Figure 5.1 (A) Silicone tubing utilized for syngas delivery (B) Diagram of the experimental set-up of syngas-fed MFC, where GS
represents the gas meter.
Silicone tubing
Carbon felt support
(A) (B)
101
The MFC voltage was measured and recorded at 20 min intervals using Labjack U12
(Labjack Corp., Lakewood, CO, USA). Polarization tests were carried out at the end of each
test following the procedure described in (Logan, 2008; Mehta et al., 2010).
The Coulombic efficiency (CE) of the syngas-fed MFC was calculated as:
, , 2, 2,
2
100%CO in CO out H in H out
CO H
I tCE
M M M MFn
M M
..................................... (5.1)
Where, I is the average current (A), t is the time interval during which the current was
measured (s), MCO is the molar mass of CO (g/mol), MH2 is the molar mass of H2 (g/mol), F
is the Faraday constant (C/mol-e-), n is the number of electrons exchanged (mol-e-/mol),
MCO,in and MH2,in are the amounts of CO and H2, respectively, supplied to the MFC during t
(g), MCO,out and MH2,out are the amounts of CO and H2, respectively, recovered (g) in the off-
gas during t.
5.3.4 KLa measurements and CO conversion tests
To estimate the volumetric mass transfer coefficient (KLa) and to study the metabolic
products of CO consumption in the absence of electricigenic activity, a reactor similar in
design to the MFC was used. Modifications were required in order to avoid air diffusion
through the cathode surface. Accordingly, a reactor was built similar to the MFC with the
liquid compartment containing two pieces of carbon felt (10 cm x 5 cm x 0.5 cm) with the
silicone tubing coiled around one of the felts. The cathode was replaced with a solid nylon
wall. The reactor had an external recirculation loop to provide liquid mixing and heating and
was operated under the same conditions as the MFC.

102
KLa was estimated at 50 °C under abiotic conditions at several CO and syngas flow rates
using the method described by Munasinghe et al. (2010b), by introducing a step change in
the gas supply rate and then evaluating the liquid phase concentration as a function of time.
The dissolved CO concentration was determined as described in Lide and Frederikse (1995).
The KLa values were estimated based on the analytical solution of the mass balance equation:
0ln ctL
ct t
C CK a t
C C
......................................................................................... (5.2)
Where: Co is the initial dissolved CO concentration, Cct is the gas-liquid equilibrium
concentration and Ct is the dissolved CO concentration at time t. The slope of the line
defined by Eq (5.1) corresponds to the volumetric mass transfer coefficient, KLa
(Munasinghe & Khanal, 2010b; Riggs & Heindel, 2006).
The tests of CO bioconversion were performed in the same reactor after its inoculation
with 10 mL of the thermophilic enrichment culture. A period of 4 days was allowed to pass
before the start of the test for the stabilization of the effluent and off-gas composition. For
the metabolite study the reactor was fed with CO at a rate of 4 L -1
RL d-1.
5.3.5 DNA extraction, PCR amplification of 16S rDNA, Denaturing gradient gel
electrophoresis (DGGE) and 16S sequencing
After the completion of the MFC tests, total genomic DNA was extracted using the
PowerSoilTM DNA isolation kit (MOBIO Laboratories, Carlsbad, USA) as outlined in the
instructions provided by the manufacturer. The samples taken from the anode, the carbon felt
used to support the silicone tubing, and the anodic liquid samples were used for the analysis.
103
The extracted DNA was then used as a template to amplify the 16S rDNA region of the
eubacterial and archaeal populations by PCR. Universal eubacterial primers GC-341f (5’-CCT
ACG GGA GGC AGC AG-3’) and 758r (5’-CTA CCA GGG TAT CTA ATCC-3’) were
used for eubacteria and primers GC-931f (5’-AGG AAT TGG CGG GGG AGCA- 3’) and
1392r (5’-ACG GGC GGT GTG TGC- 3’) were used for archaea. The GC clamp added to the
forward primers had the following sequence:
CGCCCGCCGCGCGCGGGGGGCGGGGCGGGGGCACGGGGGG.
PCR amplifications were performed with a PCR thermal cycler (Eppendorf Mastercycler
Pro. Missisauga, Canada), in a final volume of 30 µL containing 15 µl of TAQ green master
mix, 1.5 µl of each primer (final concentration of 0.5 µM of each primer), 1 ng µL-1 of
genomic DNA and 9 µl of sterile Millipure water. Amplification conditions were as follows:
an initial denaturation step of 5 min at 94 °C, then 20 cycles of denaturation (30 s at 94°C),
annealing (30 s at 55 °C), and elongation (30 s at 72 °C). A final elongation step was 10 min
at 72 °C. PCR products were verified by electrophoresis on a 1.4% agarose gel followed by
visualization with UV illumination after Sybr Safe staining (Invitrogen, Carlsbad, CA, USA).
DGGE analysis of PCR products were performed with a DCode GeneTM System (Bio-
Rad, Hercules, CA, USA). PCR samples were concentrated and 400 ng were loaded onto a
40% to 60% urea-formamide denaturant gradient gel (8% (wt/vol) polyacrylamide in TAE
(40 mM Tris-acetate pH 7.4, 20 mM acetate, 1mM Na2EDTA). Electrophoresis was
performed in 1X TAE solution (40 mM Tris-acetate pH 7.4, 20 mM acetate, 1mM
Na2EDTA) at a temperature of 60°C and at a constant voltage of 80 V for 16 hours. After
electrophoresis, the gel was stained for 30 min with Vistra Green (Molecular Dynamics, CA,
104
USA). Densitometric scanning of fluorescent DNA fragments was performed with the
Molecular FluorImager (Molecular Dynamics, Sunnyvale, CA, USA) and results were
analyzed using ImageQuaNT software (Molecular Dynamics). Bands of interest were
excised, and DNA was eluted in milli Q water and reamplified by PCR as described above.
PCR products were then purified using the QIAquick purification kit (Qiagen, Valencia, CA,
USA) and sequenced at the Laval University (Quebec City, QC, Canada). The sequences
were compared to those in the GenBank database using the Basic Local Alignment Search
Tool (BLAST) at the National Center for Biotechnology Information (NCBI) to determine
the phylogenetic affiliations.
5.4 Results and Discussion
5.4.1 CO KLa estimation
When a bioreactor is operated on a gaseous substrate such as syngas, the gas transport to
liquid often represents the rate limiting step of the entire process. To estimate the syngas
transfer rate to the anodic liquid, KLa measurements were carried out under abiotic
conditions, i.e. in the absence of syngas consumption by the thermophilic microbial
consortium.
The KLa estimations were carried out by measuring the dissolved gas concentrations
and estimating the slope of the curve representing the analytical solution of the material
balance (Eq. 5.1). The silicone tubing was operated under a dead-end mode, which allowed
for an elevated gas pressure in the system, thus increasing the concentration gradient and
hence the mass transfer of the gas (Ahmed & Semmens, 1992). Initially, the test chamber
was fed with syngas containing 50 % CO and 50 % H2. While the dissolved CO

105
concentration could be measured, measurement of dissolved H2 was unsuccessful due to its
low solubility in water and the insufficient detection limit of the analytical method.
Therefore, only the CO KLa was estimated. Feeding the test chamber with a syngas flow of 6
L -1
RL d-1 resulted in a CO KLa of 0.72 h-1. By increasing the syngas flow rate to 10 L -1
RL d-1,
the KLa was increased to 0.87 h-1. Additionally, the KLa estimation test was repeated with
100% CO. A KLa of 0.86 h-1 was observed at a CO flow rate of 3 L -1
RL d-1. Stepping up the
CO flow rate to 6 L -1
RL d-1 increased the CO KLa to 1 h-1 (Fig. 5.2).
The lower CO KLa values estimated in the syngas test as compared to the CO test might
be attributed to the lower partial pressure of CO. Nevertheless, the CO KLa values observed
during the syngas test were still comparatively higher than a value of 0.63 h-1 obtained in our
previous study at a CO flow rate of 6 L -1
RL d-1 for the mesophilic MFC operated at 35 °C
(Hussain et al., 2011). The solubility of gases decreases as temperature increases, however
this phenomenon is counteracted by increased molecular diffusivity of the gas into the liquid
phase. In addition, the liquid viscosity and surface tension decrease with increased
temperature, resulting in the reduction of the thickness of the stagnant liquid layer at the gas-
liquid interface and thereby improving the gas transport (Ferreira et al., 2010). Overall, the
estimations showed that KLa was marginally improved at 50 °C, thus confirming that a
sufficient amount of carbon monoxide can be transferred for the carboxidotrophic
metabolism. While the dissolved H2 measurements were unsuccessful, we hypothesized that
the H2 transfer rate should be also similar to that under the mesophilic conditions. Also, H2
production from CO through the water-gas shift reaction was observed in the mesophilic
MFC (Hussain et al., 2011; Mehta et al., 2010). Assuming that a similar pathway existed at
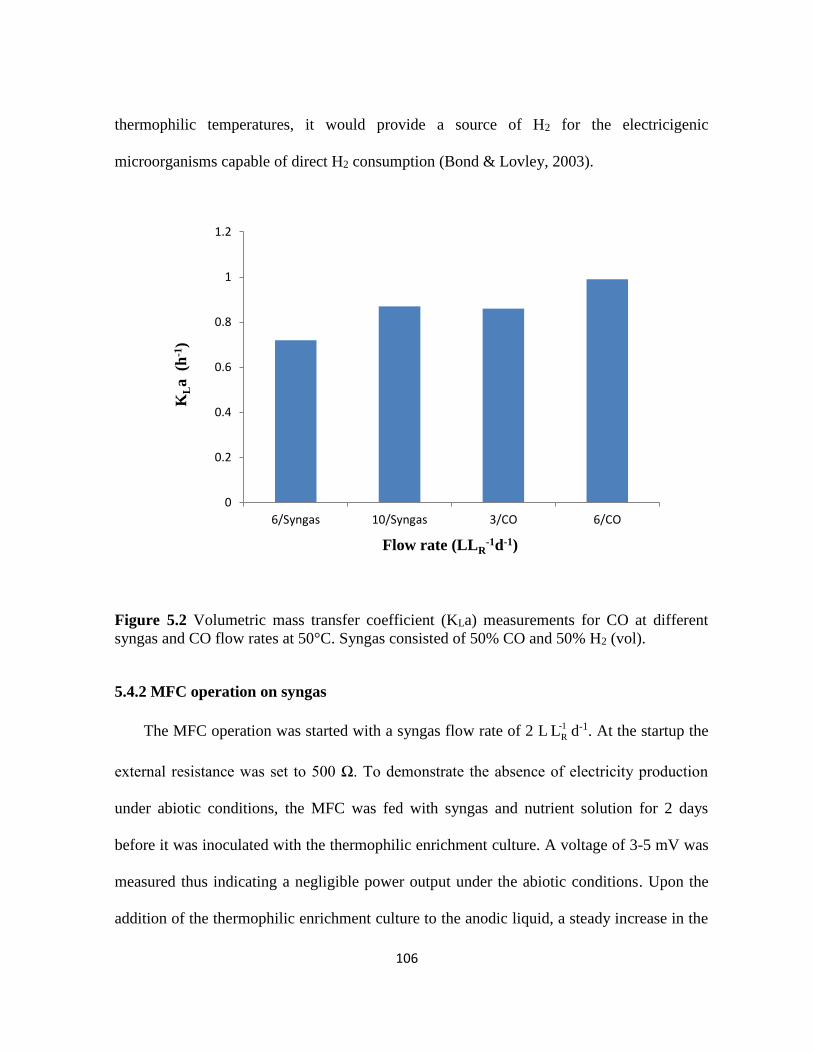
106
thermophilic temperatures, it would provide a source of H2 for the electricigenic
microorganisms capable of direct H2 consumption (Bond & Lovley, 2003).
Figure 5.2 Volumetric mass transfer coefficient (KLa) measurements for CO at different
syngas and CO flow rates at 50°C. Syngas consisted of 50% CO and 50% H2 (vol).
5.4.2 MFC operation on syngas
The MFC operation was started with a syngas flow rate of 2 L -1
RL d-1. At the startup the
external resistance was set to 500 Ω. To demonstrate the absence of electricity production
under abiotic conditions, the MFC was fed with syngas and nutrient solution for 2 days
before it was inoculated with the thermophilic enrichment culture. A voltage of 3-5 mV was
measured thus indicating a negligible power output under the abiotic conditions. Upon the
addition of the thermophilic enrichment culture to the anodic liquid, a steady increase in the
0
0.2
0.4
0.6
0.8
1
1.2
6/Syngas 10/Syngas 3/CO 6/CO
KLa (h
-1)
Flow rate (LLR-1d-1)
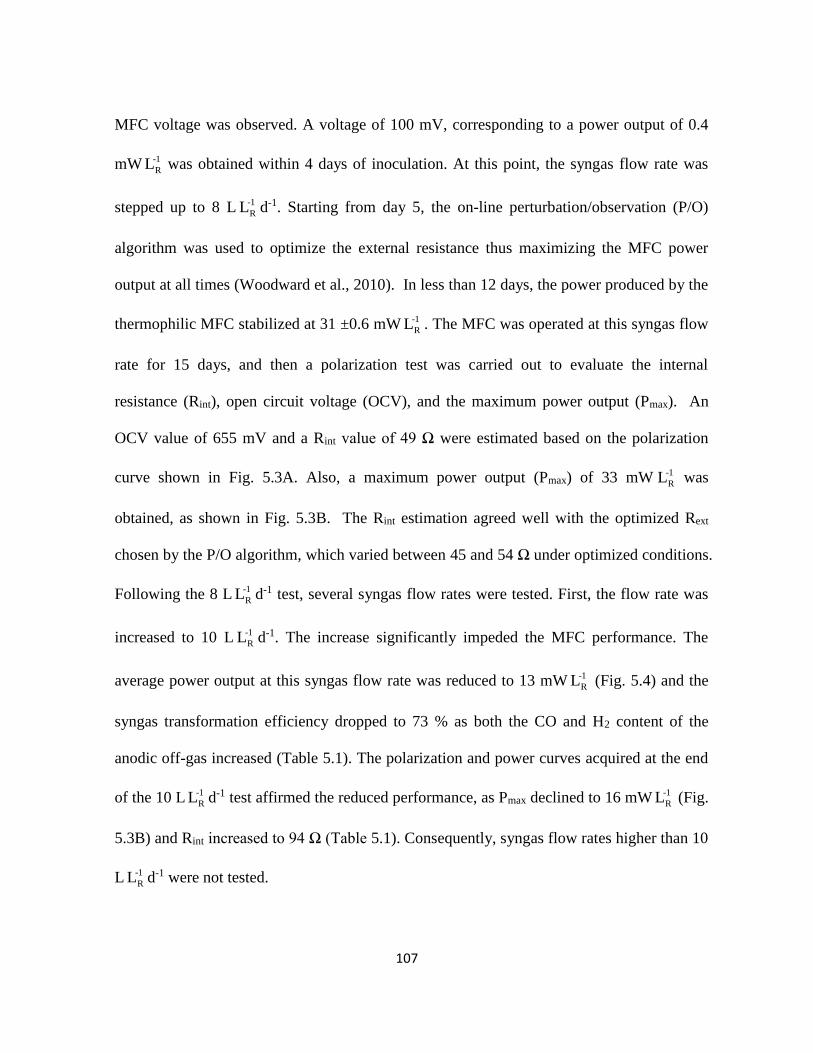
107
MFC voltage was observed. A voltage of 100 mV, corresponding to a power output of 0.4
mW -1
RL was obtained within 4 days of inoculation. At this point, the syngas flow rate was
stepped up to 8 L -1
RL d-1. Starting from day 5, the on-line perturbation/observation (P/O)
algorithm was used to optimize the external resistance thus maximizing the MFC power
output at all times (Woodward et al., 2010). In less than 12 days, the power produced by the
thermophilic MFC stabilized at 31 ±0.6 mW -1
RL . The MFC was operated at this syngas flow
rate for 15 days, and then a polarization test was carried out to evaluate the internal
resistance (Rint), open circuit voltage (OCV), and the maximum power output (Pmax). An
OCV value of 655 mV and a Rint value of 49 Ω were estimated based on the polarization
curve shown in Fig. 5.3A. Also, a maximum power output (Pmax) of 33 mW -1
RL was
obtained, as shown in Fig. 5.3B. The Rint estimation agreed well with the optimized Rext
chosen by the P/O algorithm, which varied between 45 and 54 Ω under optimized conditions.
Following the 8 L -1
RL d-1 test, several syngas flow rates were tested. First, the flow rate was
increased to 10 L -1
RL d-1. The increase significantly impeded the MFC performance. The
average power output at this syngas flow rate was reduced to 13 mW -1
RL (Fig. 5.4) and the
syngas transformation efficiency dropped to 73 % as both the CO and H2 content of the
anodic off-gas increased (Table 5.1). The polarization and power curves acquired at the end
of the 10 L -1
RL d-1 test affirmed the reduced performance, as Pmax declined to 16 mW -1
RL (Fig.
5.3B) and Rint increased to 94 Ω (Table 5.1). Consequently, syngas flow rates higher than 10
L -1
RL d-1 were not tested.
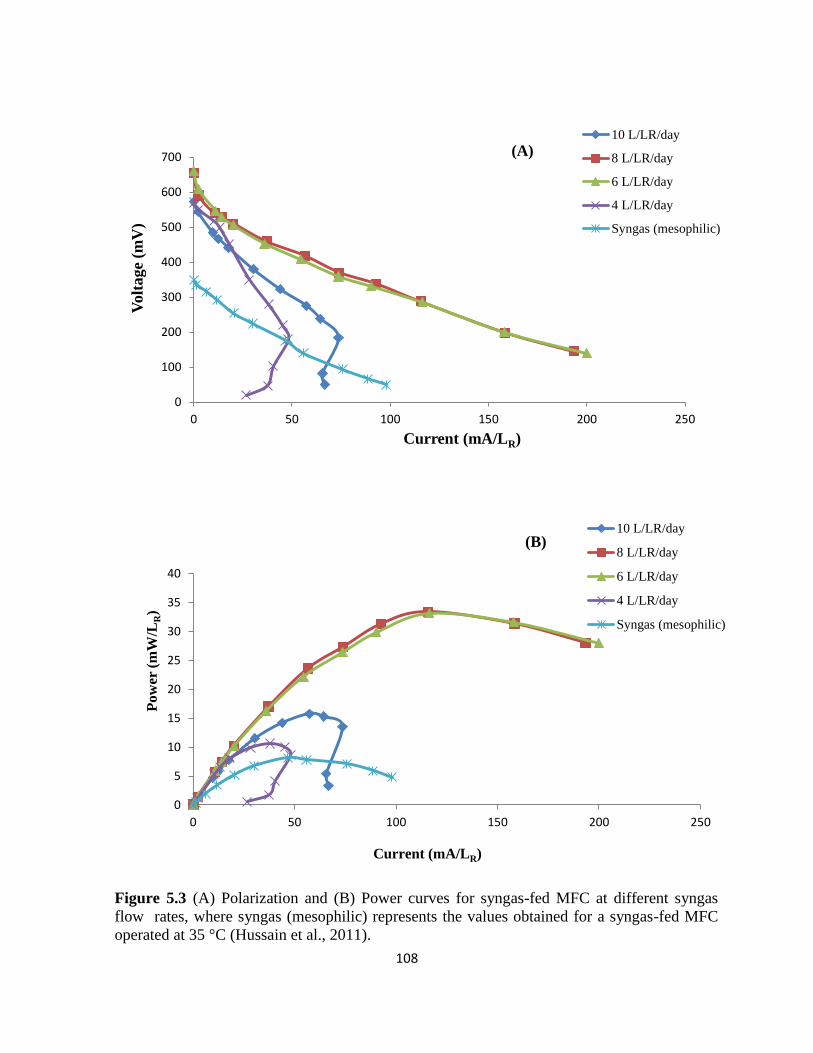
108
Figure 5.3 (A) Polarization and (B) Power curves for syngas-fed MFC at different syngas
flow rates, where syngas (mesophilic) represents the values obtained for a syngas-fed MFC
operated at 35 °C (Hussain et al., 2011).
0
100
200
300
400
500
600
700
0 50 100 150 200 250
Vo
lta
ge
(mV
)
Current (mA/LR)
10 L/LR/day
8 L/LR/day
6 L/LR/day
4 L/LR/day
Syngas (mesophilic)
0
5
10
15
20
25
30
35
40
0 50 100 150 200 250
Po
wer
(m
W/L
R)
Current (mA/LR)
10 L/LR/day
8 L/LR/day
6 L/LR/day
4 L/LR/day
Syngas (mesophilic)
(B)
(A)
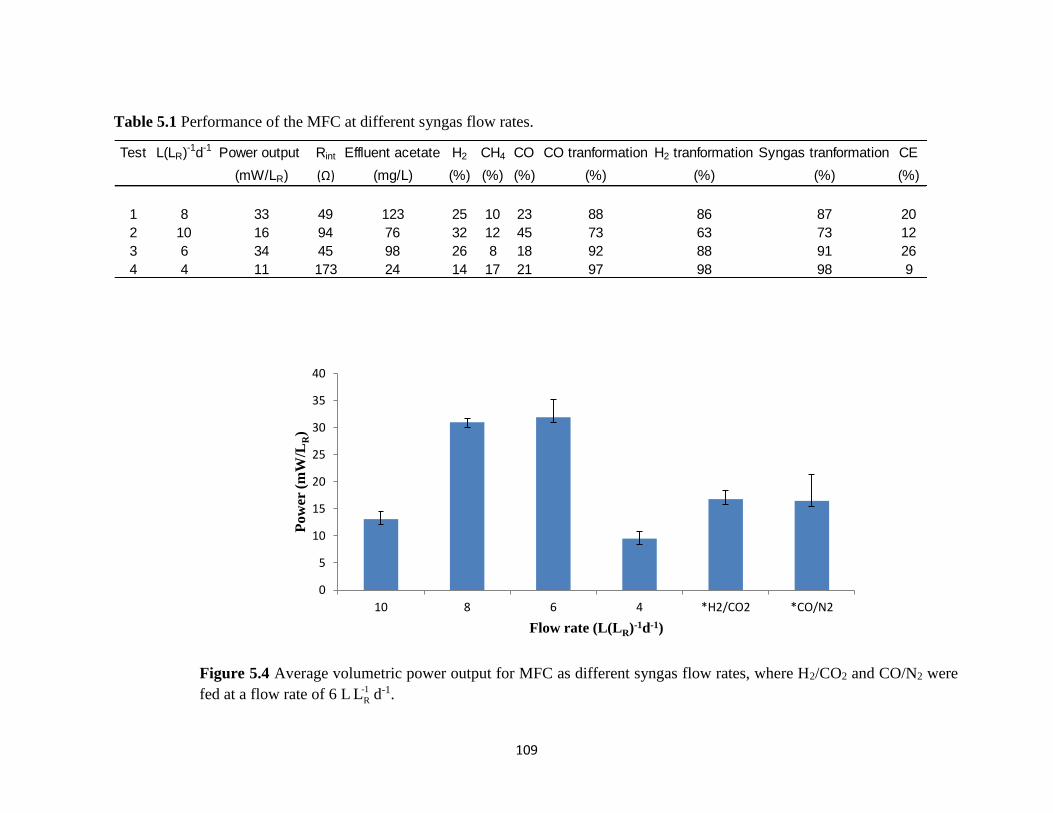
109
0
5
10
15
20
25
30
35
40
10 8 6 4 *H2/CO2 *CO/N2
Po
wer
(m
W/L
R)
Flow rate (L(LR)-1d-1)
Table 5.1 Performance of the MFC at different syngas flow rates.
Test L(LR)-1d-1 Power output Rint Effluent acetate H2 CH4 CO CO tranformation H2 tranformation Syngas tranformation CE
(mW/LR) (Ω) (mg/L) (%) (%) (%) (%) (%) (%) (%)
1 8 33 49 123 25 10 23 88 86 87 20
2 10 16 94 76 32 12 45 73 63 73 12
3 6 34 45 98 26 8 18 92 88 91 26
4 4 11 173 24 14 17 21 97 98 98 9
Figure 5.4 Average volumetric power output for MFC as different syngas flow rates, where H2/CO2 and CO/N2 were
fed at a flow rate of 6 L -1
RL d-1.
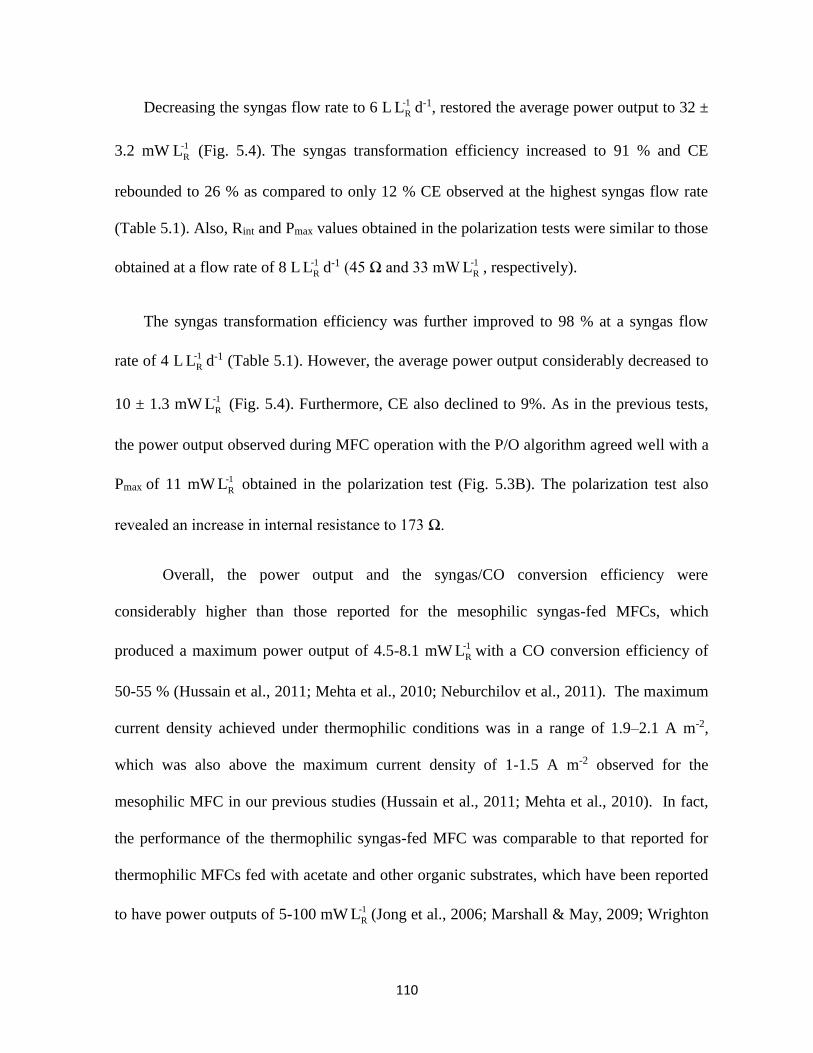
110
Decreasing the syngas flow rate to 6 L -1
RL d-1, restored the average power output to 32 ±
3.2 mW -1
RL (Fig. 5.4). The syngas transformation efficiency increased to 91 % and CE
rebounded to 26 % as compared to only 12 % CE observed at the highest syngas flow rate
(Table 5.1). Also, Rint and Pmax values obtained in the polarization tests were similar to those
obtained at a flow rate of 8 L -1
RL d-1 (45 Ω and 33 mW -1
RL , respectively).
The syngas transformation efficiency was further improved to 98 % at a syngas flow
rate of 4 L -1
RL d-1 (Table 5.1). However, the average power output considerably decreased to
10 ± 1.3 mW -1
RL (Fig. 5.4). Furthermore, CE also declined to 9%. As in the previous tests,
the power output observed during MFC operation with the P/O algorithm agreed well with a
Pmax of 11 mW -1
RL obtained in the polarization test (Fig. 5.3B). The polarization test also
revealed an increase in internal resistance to 173 Ω.
Overall, the power output and the syngas/CO conversion efficiency were
considerably higher than those reported for the mesophilic syngas-fed MFCs, which
produced a maximum power output of 4.5-8.1 mW -1
RL with a CO conversion efficiency of
50-55 % (Hussain et al., 2011; Mehta et al., 2010; Neburchilov et al., 2011). The maximum
current density achieved under thermophilic conditions was in a range of 1.9–2.1 A m-2,
which was also above the maximum current density of 1-1.5 A m-2 observed for the
mesophilic MFC in our previous studies (Hussain et al., 2011; Mehta et al., 2010). In fact,
the performance of the thermophilic syngas-fed MFC was comparable to that reported for
thermophilic MFCs fed with acetate and other organic substrates, which have been reported
to have power outputs of 5-100 mW -1
RL (Jong et al., 2006; Marshall & May, 2009; Wrighton

111
et al., 2008). Power density could be further increased by improvement in system design
such as increase in anodic surface area (Di Lorenzo et al., 2010). For example, in our tests
the anode occupied 25 mL of the 50 mL anodic chamber. By recalculating the volumetric
power output per anode volume, a power density of 70-75 mW L-1anode was obtained.
Several reasons can be cited to explain improved MFC performance at thermophilic
conditions. As described in the previous section, the supply of CO to the anodic liquid was
improved. Also, the thermophilic conditions might affect the activation, ohmic, and
diffusion losses at the anode. Indeed, the activation losses contribute to 5-10 % of the total
internal resistance in a mesophilic MFC (Logan, 2008; Zhang & Liu, 2010). The
electrochemical reaction rates might increase with increasing temperature thus leading to
lower activation losses. Furthermore, temperature also affects the diffusion of the substrates
in the anodic liquid thereby influencing the concentration losses, which account for 45-50 %
of the total internal resistance of a MFC (Logan, 2008; Zhang & Liu, 2010). Likely, the
operation of the syngas-fed MFC at thermophilic temperatures increased the transfer rate of
CO and H2 not only to the anodic liquid, but also facilitated the transport of the dissolved
gasses through the stagnant liquid layer adjacent to the anode fibers, thus reducing the
diffusion losses. Overall, the internal resistance of the thermophilic MFC at optimized
performance was less than 50 Ω, whereas the mesophilic MFC had an internal resistance of
above 120 Ω (Hussain et al., 2011; Mehta et al., 2010).
In addition to affecting the process electrochemistry, it can be hypothesized that the
thermophilic conditions increased the activity of the carboxidotrophic microorganisms. Up
to a certain temperature, the biomass growth and substrate conversion rates increase with
112
temperature according to the Arrhenius relationship. In general, the thermophilic
microorganisms feature higher growth and reaction rates as compared to the mesophilic
cultures (Min et al., 2008). Therefore, a higher carboxidotrophic activity could be expected
at thermophilic temperatures. In a mesophilic CO-fed MFC the step of CO conversion to
acetate appeared to limit the overall transformation rate (Mehta et al., 2010). Another
advantage could be related to the reduced O2 solubility at elevated temperatures. While most
of the O2 diffusing through the cathode surface is consumed by the cathodic reaction, the
residual O2 diffuses to the anodic liquid thus resulting in the inhibition of the electricigenic
and carboxidotrophic populations (Oelgeschlager & Rother, 2008) as well as competing
with the anode as the final electron acceptor (Liu & Logan, 2004). The presence of trace
amounts of O2 in the anodic chamber was observed to greatly impair the power output of
mesophilic syngas-fed MFC (Hussain et al., 2011).
5.4.3 H2 and CO tests
Analyses of the MFC effluent and off-gas composition at various syngas feeding rates
led to the identification of several soluble and gaseous degradation products (Table 5.1). In
particular, up to 123 mg L-1 of acetate was present in the effluent along with trace amounts
(less than 5 mg L-1) of propionate, methanol and ethanol. Notably, improved electricity
production correlated with higher levels of acetate in the effluent. CH4 was detected in all
off-gas samples at concentrations varying between 10-17 %. The CH4 concentration was
inversely proportional to the power output (Table 5.1).
In order to evaluate the pathways leading to electricity generation, single electron donor
(H2 or CO) tests were performed. Prior to each test, the anodic compartment was fed solely
113
with N2 for at least 12 h to flush out the metabolic products formed during the previous test.
Feeding the MFC with H2 produced an average power output of 17 ± 1.6 mW -1
RL (Fig. 5.4),
with CH4 (16 %) and acetate (38 mg L-1) observed to be the major degradation products
(Table 5.1). The subsequent feeding of the MFC with CO produced a comparable power
output of 20 ± 2.1 mW -1
RL (Fig 5.4), with the presence of significant amounts of acetate (26
mg L-1) in the effluent and H2 (8 %), CH4 (12 %) in the anode off-gas.
An additional test was performed to study CO conversion to volatile fatty acids and
methane in the absence of the electricigenic activity. For this test the bioreactor used for KLa
estimations was inoculated with the mixed thermophilic enrichment culture and then fed
with CO at a flow rate of 4 L -1
RL d-1. The appearance of CH4 in the off-gas and acetate in the
effluent was observed after 5 days of operation. At a steady state, the off-gas contained 14 %
CH4, 13 % CO, and 6 % H2, while the effluent mainly consisted of acetate (81 mg L-1). The
presence of H2 in the off-gas of the CO-fed bioreactor was indicative of hydrogenogenic
activity. The hydrogenogenic activity was also most likely to be present in the MFC, but its
presence could not be confirmed since H2 constituted 50 % of the syngas.
Overall, the single electron donor tests suggested the existence of at least two
alternative pathways leading to acetate formation. One pathway apparently proceeded
through acetate formation from CO by the acetogenic carboxidotrophic microorganisms,
while in the second pathway acetate was formed from H2 by the homoacetogenic
microorganisms, as shown in Figure 5.5. In either case, acetate might serve as a carbon
source for the electricigenic microorganisms.
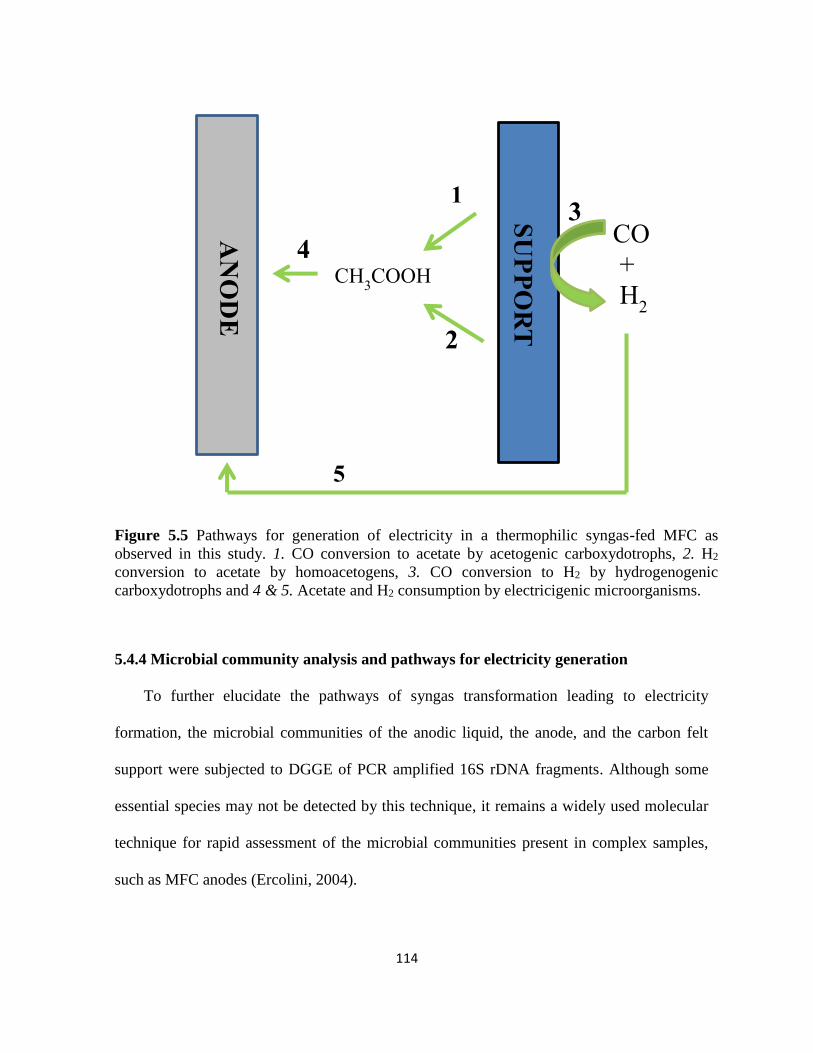
114
Figure 5.5 Pathways for generation of electricity in a thermophilic syngas-fed MFC as
observed in this study. 1. CO conversion to acetate by acetogenic carboxydotrophs, 2. H2
conversion to acetate by homoacetogens, 3. CO conversion to H2 by hydrogenogenic
carboxydotrophs and 4 & 5. Acetate and H2 consumption by electricigenic microorganisms.
5.4.4 Microbial community analysis and pathways for electricity generation
To further elucidate the pathways of syngas transformation leading to electricity
formation, the microbial communities of the anodic liquid, the anode, and the carbon felt
support were subjected to DGGE of PCR amplified 16S rDNA fragments. Although some
essential species may not be detected by this technique, it remains a widely used molecular
technique for rapid assessment of the microbial communities present in complex samples,
such as MFC anodes (Ercolini, 2004).
AN
OD
E
SU
PP
OR
T
CO
+
H2
CH3COOH
1
2
4
5
3

115
The identified eubacterial species were primarily present at the anode and were not
found on the sample of the carbon felt used as a support for the silicone tubing. This felt was
separated from the anode by a synthetic cloth and therefore was excluded from the electrical
circuit. The anode population included sulfur-reducing bacteria belonging to the
Geobacteraceae family (Table 5.2), such as Geobacter sulfurreducens, Geobacter sp.T32,
and an uncultured Geobacterium originally isolated in a Microbial Electrolysis Cell (MEC)
(Thygesen et al., 2011). This selective colonization of the anodic surface by the sulfur-
reducing bacteria agreed with their ability to utilize the anode as the electron acceptor. The
ability of the sulfur-reducing bacteria to grow or utilize CO as the sole source of energy has
been reported (Sipma et al., 2006a). Other eubacterial populations identified at the anode
largely consisted of uncultured bacteria which were originally isolated in MFCs, or MECs,
or anaerobic digesters.
Homoacetogens belonging to the genus Acetobacterium were found to be present on
the silicone tubing support (Table 5.2). The genus includes anaerobes capable of utilizing H2
and CO2 and forming acetate. Acetobacterium wieringae grows chemolithotrophically with
H2 and CO2 forming acetic acid as the sole end product (Braun & Gottschalk, 1982).
Acetobacterium wieringae have been widely identified in CO and syngas fed reactors
(Sipma et al., 2006b; Van Houten et al., 2006) and were also found in the CO fed MFC
described by Kim and Chang (2009).

116
Table 5.2 Eubacterial species identified in the syngas-fed MFC operated at 50 °C.
Where: S denotes support, L denotes effluent liquid and A denotes anode
*GenBank accession no.
Identified Microorganism Identity
(%)
Origin / Growth Conditions Hypothesized Activity
in a syngas-fed MFC
Surface Reference
Uncultured Bacterium 99 Industrial anaerobic digester _ A,L FJ462092*
Uncultured Bacterium 99 Microbial community of a biocathode in
hydrogen producing MEC _ A,L (Croese et
al., 2011)
Uncultured Bacterium 99 Isolated from the anaerobic tank of a
water treatment plant
_ A,L (Liu et al.,
2010)
Uncultured Bacterium 99 Thermophilic anaerobic hydrid reactor
degrading terephthalate _ A,L (Chen et al.,
2004)
Uncultured Bacterium 99 Sulfate-reducing communities in a
fluidized-bed reactor treating acidic metal
and sulphate containing water
Electricigenesis A (Kaksonen
et al., 2004)
Geobacter sp. T32 99 Anodic community of an MFC Electricigenesis A (Michaelido
u et al.,
2011)
Geobacter sulfurreducen 99 Acetate Electricigenesis A AB568596*
Uncultured Geobacter 99 MEC Electricigenesis A,L (Thygesen
et al., 2011)
Uncultured Bacterium 99 MFC - S,L EF515355*
Acetobacterium wieringae 100 H2/CO2 Homoacetogenesis S (Braun &
Gottschalk,
1982)
Uncultured Acetobacterium 98 Paddy soil Homoactegenesis S FR774812*
117
As mentioned above, acetate was observed to be the major metabolite throughout the
MFC operation on syngas and also during the H2 and CO tests. Moreover, the electricity
generation was always accompanied by the presence of acetate in the anodic chamber (Table
5.1). Therefore, the identification of acetogens confirmed that at least one of the pathways
for electricity production involved H2 and CO conversion to acetate, and subsequent
oxidation of acetate by electricigenic microorganisms (Fig 5.5). The ability of G.
sulfurreducens to use acetate and H2 for electricity generation in an MFC has previously
been demonstrated (Bond & Lovley, 2003). Interestingly, the acetogenic species were
detected on the carbon felt support, which was not connected to the electrical circuit, while
all electricigenic species were found in the anode felt samples.
The presence of H2 in the off-gas when the MFC was fed solely with a CO/N2 mix,
affirmed the presence of hydrogenogenic activity. It was also confirmed in the bioreactor
test, when CO was fed and the presence of H2 was detected in the off-gas. An increase in H2
formation from CO at temperatures of 45-55°C has been reported (Sipma et al., 2006b).
This H2 derived from CO, along with the H2 in the syngas mixture could be utilized directly
by the electricigenic microorganisms and/or can be used for acetate formation by
homoacetogens as described earlier.
The archaea identified in this study were methanogens (Table 5. 3). The ability to grow
in the presence of CO or utilize CO as a sole source of energy has been reported in
phylogenetically and physiologically diverse methanogenic groups (Oelgeschlager & Rother,
2008). The identified methanogens had the capacity for the sequential reduction of CO2 to
CH4 in the hydrogenotrophic pathway, which might explain the significant amount of CH4
in the anodic off-gas.
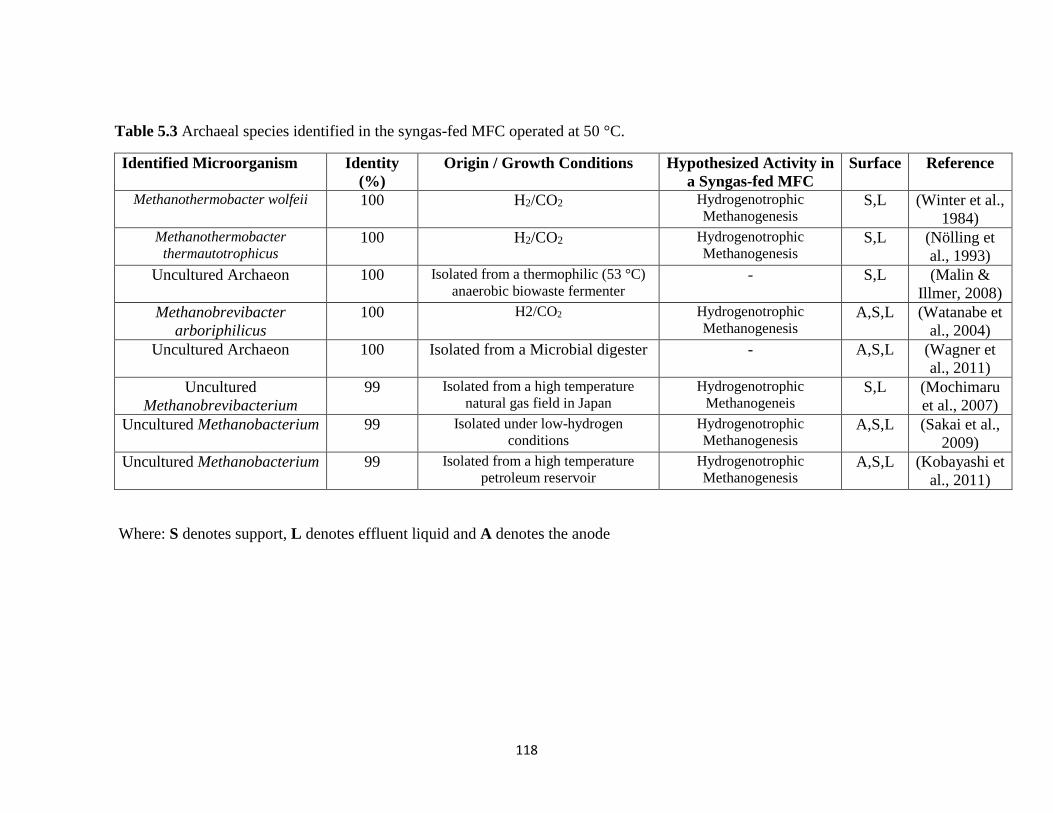
118
Table 5.3 Archaeal species identified in the syngas-fed MFC operated at 50 °C.
Where: S denotes support, L denotes effluent liquid and A denotes the anode
Identified Microorganism Identity
(%)
Origin / Growth Conditions Hypothesized Activity in
a Syngas-fed MFC
Surface Reference
Methanothermobacter wolfeii 100 H2/CO2 Hydrogenotrophic
Methanogenesis S,L (Winter et al.,
1984) Methanothermobacter
thermautotrophicus 100 H2/CO2 Hydrogenotrophic
Methanogenesis S,L (Nölling et
al., 1993)
Uncultured Archaeon 100 Isolated from a thermophilic (53 °C)
anaerobic biowaste fermenter - S,L (Malin &
Illmer, 2008)
Methanobrevibacter
arboriphilicus
100 H2/CO2 Hydrogenotrophic
Methanogenesis A,S,L (Watanabe et
al., 2004)
Uncultured Archaeon 100 Isolated from a Microbial digester - A,S,L (Wagner et
al., 2011)
Uncultured
Methanobrevibacterium
99 Isolated from a high temperature
natural gas field in Japan
Hydrogenotrophic
Methanogeneis S,L (Mochimaru
et al., 2007)
Uncultured Methanobacterium 99 Isolated under low-hydrogen
conditions
Hydrogenotrophic
Methanogenesis A,S,L (Sakai et al.,
2009)
Uncultured Methanobacterium 99 Isolated from a high temperature
petroleum reservoir
Hydrogenotrophic
Methanogenesis A,S,L (Kobayashi et
al., 2011)
119
Methanothermobacter wolfeii, Methanothermobacter thermautotrophicus and
Methanobrevibacter arboriphilicus were identified. These species utilize H2 and CO2 for
growth and CH4 formation (Daniels et al., 1977;Wasserfallen et al., 2000; Winter et al.,
1984). In addition, the ability of M. thermoautotrophicus and M. arboriphilicus, to remove
CO in the gas phase while growing on CO2 and H2 has been reported (Daniels et al., 1977).
M. thermoautotrophicus could utilize CO as the sole energy source by disproportionating
CO to CO2 and CH4. This ability could be attributed to the presence of carbon monoxide
dehydrogenase (CODH) and acetyl-CoA synthase (ACS) in the microorganisms, the two
metalloenzymes fundamental for growth on CO (Oelgeschlager & Rother, 2008). The other
uncultured archaea identified in the MFC belonged to the genera Methanobacterium and
Methanobrevibacterium, that again possess the hydrogenotrophic pathway for CH4
formation (Wasserfallen et al., 2000). Overall, the methanogens must have competed with
the electricigenic microorganisms for the electron donor, resulting in a low CE. A similar
observation was also made in our previous studies (Hussain et al., 2011; Mehta et al., 2010)
and in the study of Kim et al. (2005), where a 30 % increase in CE was observed, when a
methanogenic inhibitor was utilized. MFC operation at a retention time of 5 days (liquid
inflow of 10 mL d-1) might have contributed to the proliferation of methanogens in the
anodic liquid. This implies that the CE of the system could be further improved by the
optimization of the influent flow rate to find a right balance between the retention of
intermediates utilized for electricity production and the wash out of the planktonic
methanogenic microorganisms.
We propose that the methanogenesis, which does not result in electricity generation,
could be eliminated by the development of thermophilic syngas-fed MFC with an

120
engineered microbial consortium. A thermophilic syngas-fed MFC seeded with pure cultures
of electricigenic microorganism such as Thermincola ferriacetica, a CO-tolerant, acetate
utilizing bacterium, in a syntrophic relationship with homoacetogens and carboxydotrophic
microorganisms might be capable of achieving higher power densities due to the elimination
of methanogenesis and additionally due to the higher catalytic activity of the thermophilic
microorganisms. Thermophilic acetate fed MFC seeded with a pure culture of Thermincola
ferriacetica was recently demonstrated to achieve a CE of ~ 97 %. The power densities
reported were comparable or even higher than the thermophilic MFCs inoculated with
anaerobic sludge (Marshall & May, 2009).
5.5 Conclusion
This study for the first time demonstrates electricity generation in a thermophilic MFC
fed with syngas. The thermophilic conditions led to a higher power density and improved
syngas transformation efficiency as compared to a similar MFC operated under mesophilic
conditions. The Coulombic efficiency was also improved to 20-26% as compared to 6-9%
reported for the mesophilic MFC. Significant methane production remains the main obstacle
to a higher Coulombic efficiency.
The analyses of the effluent and off-gas compositions in combination with DGGE
analysis of 16S rDNA fragments indicated the existence of several concurrent pathways
leading to electricity formation. Electricity generation predominantly takes place in a two-
step process in which syngas is converted to acetate and then acetate is oxidized by the
electricigenic microorganisms to produce electricity. This pathway is accomplished by a

121
syntrophic association between electricigenic, carboxydotrophic and homo-acetogenic
microorganisms.
5.6 References
Ahmed, T., Semmens, M.J. 1992. Use of sealed end hollow fibers for bubbleless membrane
aeration: experimental studies. J Membr Sci, 69, 1-10.
Bond, D.R., Lovley, D.R. 2003. Electricity Production by Geobacter sulfurreducens
Attached to Electrodes. Appl Environ Microbiol, 69, 1548-1555.
Braun, M., Gottschalk, G. 1982. Acetobacterium Wieringae sp. nov., a new species
producing acetic acid from molecular hydrogen and carbon dioxide Zentralbl Bakteriol
Microbiol Hyg C3, 368-376.
Chen, C., Macarie, H., Ramirez, I., Olmos, A., Ong, S.L., Monroy, O., Liu, W.-T. 2004.
Microbial community structure in a thermophilic anaerobic hybrid reactor degrading
terephthalate. Microbiology, 150, 3429-3440.
Croese, E., Pereira, M., Euverink, G.J.W., Stams, A., Geelhoed, J.S. 2011. Analysis of the
microbial community of the biocathode of a hydrogen-producing microbial electrolysis
cell. Appl Microbiol Biotechnol, 82, 1083-1093.
Daniels, L., Fuchs, G., Thauer, R.K., Zeikus, J.G. 1977. Carbon Monoxide Oxidation by
Methanogenic Bacteria. J. Bacteriol., 132, 118-126.
Davidova, M., Tarasova, N., Mukhitova, F., Karpilova, I. 1994. Carbon monoxide in
metabolism of anaerobic bacteria. Can J Microbiol, 40(417-425).
Di Lorenzo, M., Scott, K., Curtis, T.P., Head, I.M. 2010. Effect of increasing anode surface
area on the performance of a single chamber microbial fuel cell. Chem. Eng. J, 156, 40-
48.
Ercolini, D. 2004. PCR-DGGE fingerprinting: novel strategies for detection of microbes in
food. J. Microbiol. Methods, 56, 297-314.
Ferreira, A., Ferreira, C., Teixeira, J.A., Rocha, F. 2010. Temperature and solid properties
effects on gas–liquid mass transfer. Chemical Eng J, 162, 743-752.
Guiot, S., Cimpoia, R., Carayon, G. 2011. Potential of Wastewater-Treating Anaerobic
Granules for Biomethanation of Synthesis Gas. Environ. Sci. Technol., 45, 2006-2012.
122
Hussain, A., Tartakovsky, B., Guiot, S.R., Raghavan, V. 2011. Use of silicone membranes
to enhance gas transfer during microbial fuel cell operation on carbon monoxide.
Bioresour Technol, 102, 10898-10906.
Jong, B.C., Kim, B.H., Chang, I.S., Liew, P.W.Y., Choo, Y.F., Kang, G.S. 2006.
Enrichment, Performance, and Microbial Diversity of a Thermophilic Mediatorless
Microbial Fuel Cell. Environ Sci Technol, 40, 6449-6454.
Kaksonen, A.H., Plumb, J.J., Franzmann, P.D., Puhakka, J.A. 2004. Simple organic electron
donors support diverse sulfate-reducing communities in fluidized-bed reactors treating
acidic metal- and sulfate-containing wastewater. FEMS Microbiol Ecol, 47, 279-289.
Kim, D., Chang, I. 2009. Electricity generation from synthesis gas by microbial processes:
CO fermentation and microbial fuel cell technology. Bioresour Technol, 100, 4527-
4530.
Kim, J.R., Min, B., Logan, B.E. 2005. Evaluation of procedures to acclimate a microbial
fuel cell for electricity production. Appl. Microbiol. Biotechnol., 68, 23-30.
Kobayashi, H., Endo, K., Sakata, S., Mayumi, D., Kawaguchi, H., Ikarashi, M., Miyagawa,
Y., Maeda, H., Sato, K. 2011. Phylogenetic diversity of microbial communities
associated with the crude-oil, large-insoluble-particle and formation-water components
of the reservoir fluid from a non-flooded high-temperature petroleum reservoir. J Biosci
Bioeng.
Lide, D., Frederickse, H. 1995. Handbook of Chemistry and Physics. 76 ed. CRC Press Inc.,
Boca Raton, FL.
Liu, H., Logan, B.E. 2004. Electricity Generation Using an Air-Cathode Single Chamber
Microbial Fuel Cell in the Presence and Absence of a Proton Exchange Membrane.
Environ Sci Technol, 38, 4040-4046.
Liu, R., Li, D., Gao, Y., Zhang, Y., Wu, S., Ding, R., Hesham, A.E.-L., Yang, M. 2010.
Microbial diversity in the anaerobic tank of a full-scale produced water treatment plant.
Process Biochem, 45, 744-751.
Logan, B. 2008. Microbial Fuel Cells. John Wiley & Sons Inc., Hoboken, NJ, USA.
Logan, B. 2010. Scaling up microbial fuel cells and other bioelectrochemical systems. Appl
Microbiol Biotechnol, 85, 1665-1671.
Logan, B.E., Regan, J.M. 2006. Electricity-producing bacterial communities in microbial
fuel cells. Trends Microbiol, 14, 512-518.
123
Lovley, D.R. 2008. The microbe electric: conversion of organic matter to electricity. Curr
Opinion Biotechnol, 19, 564-571.
Malin, C., Illmer, P. 2008. Ability of DNA content and DGGE analysis to reflect the
performance condition of an anaerobic biowaste fermenter. Microbiol Research, 163,
503-511.
Marshall, C.W., May, H.D. 2009. Electrochemical evidence of direct electrode reduction by
a thermophilic Gram-positive bacterium, Thermincola ferriacetica. Energy Environ Sci,
2, 699-705.
Mathis, B., Marshall, C., Milliken, C., Makkar, R., Creager, S., May, H. 2008. Electricity
generation by thermophilic microorganisms from marine sediment. Appl Microbiol
Biotechnol, 78, 147-155.
Mehta, P., Hussain, A., Raghavan, V., Neburchilov, V., Wang, H., Tartakovsky, B., Guiot, S.
2010. Electricity generation from a carbon monoxide in a single chamber microbial fuel
cell. Enzyme Microb Technol, 46, 450-455.
Michaelidou, U., ter Heijne, A., Euverink, G.J.W., Hamelers, H.V.M., Stams, A.J.M.,
Geelhoed, J.S. 2011. Microbial Communities and Electrochemical Performance of
Titanium-Based Anodic Electrodes in a Microbial Fuel Cell. Appl. Environ. Microbiol.,
77(3), 1069-1075.
Min, B., Román, Ó., Angelidaki, I. 2008. Importance of temperature and anodic medium
composition on microbial fuel cell (MFC) performance. Biotechnol Letters, 30, 1213-
1218.
Mochimaru, H., Yoshioka, H., Tamaki, H., Nakamura, K., Kaneko, N., Sakata, S., Imachi,
H., Sekiguchi, Y., Uchiyama, H., Kamagata, Y. 2007. Microbial diversity and
methanogenic potential in a high temperature natural gas field in Japan. Extremophiles,
11, 453-461.
Munasinghe, P.C., Khanal, S.K. 2010a. Biomass-derived syngas fermentation into biofuels:
Opportunities and challenges. Bioresour Technol, 101, 5013-5022.
Munasinghe, P.C., Khanal, S.K. 2010b. Syngas fermentation to biofuel: Evaluation of
carbon monoxide mass transfer coefficient (kLa) in different reactor configurations.
Biotechnol Prog, 26, 1616-1621.
Neburchilov, V., Mehta, P., Hussain, A., Raghavan, V., Wang, H., Guiot, S., Tartakovsky, B.
2011. Microbial Fuel Cell Operation On Carbon Monoxide: Cathode Catalyst Selection.
Int J Hydrogen Energ, 36, 11929-11935.
124
Nölling, J., Hahn, D., Ludwig, W., De Vos, W.M. 1993. Phylogenetic Analysis of
Thermophilic Methanobacterium sp.: Evidence for a Formate-Utilizing Ancestor. Syst
Appl Microbiol, 16, 208-215.
Oelgeschlager, E., Rother, M. 2008. Carbon monoxide - dependant energy metabolism in
anaerobic bacteria and archaea. Arch Microbiol, 190, 257-269.
Perry, R., Green, D., Maloney, J. 1997. Perry's chemical engineer's Handbook. McGraw-
Hill , New York.
Riggs, S.S., Heindel, T.J. 2006. Measuring Carbon Monoxide Gas - Liquid Mass Transfer in
a Stirred Tank Reactor for Syngas Fermentation. Biotechnol Prog, 22, 903-906.
Rinaldi, A., Mecheri, B., Garavaglia, V., Licoccia, S., Di Nardo, P., Traversa, E. 2008.
Engineering materials and biology to boost performance of microbial fuel cells: a
critical review. Energy Environment Sci, 1, 417-429.
Sakai, S., Imachi, H., Sekiguchi, Y., Tseng, I., Ohashi, A., Harada, H., Kamagata, Y. 2009.
Cultivation of Methanogens under Low-Hydrogen Conditions by Using the Coculture
Method. Appl Environmental Microbiol 75, 4892-4896.
Sipma, J., Henstra, A.M., Parshina, S.N., Lens, P.N.L., Lettinga, G., Stams, A.J.M. 2006a.
Microbial CO Conversions with Applications in Synthesis Gas Purification and Bio-
Desulfurization. Crit Rev Biotechnol, 26, 41 - 65.
Sipma, J., Lettinga, G., Stams, A.J., Lens, P.N. 2006b. Hydrogenogenic CO Conversion in a
Moderately Thermophilic (55 °C) Sulfate-Fed Gas Lift Reactor: Competition for CO-
Derived H2. Biotechnol Prog, 22, 1327-1334.
Tartakovsky, B., Manuel, M.F., Neburchilov, V., Wang, H., Guiot, S.R. 2008. Biocatalyzed
hydrogen production in a continuous flow microbial fuel cell with a gas phase cathode.
J. Power Sources, 182, 291-297.
Thygesen, A., Marzorati, M., Boon, N., Thomsen, A., Verstraete, W. 2011. Upgrading of
straw hydrolysate for production of hydrogen and phenols in a microbial electrolysis
cell (MEC). Appl Microbiol Biotechnol, 89, 855-865.
Van Houten, B.H., Roest, K., Tzeneva, V.A., Dijkman, H., Smidt, H., Stams, A.J. 2006.
Occurrence of methanogenesis during start-up of a full-scale synthesis gas-fed reactor
treating sulfate and metal-rich wastewater. Water Res, 40, 553-560.
Wagner, A.O., Malin, C., Lins, P., Illmer, P. 2011. Effects of various fatty acid amendments
on a microbial digester community in batch culture. Waste Management, 31, 431-437.
125
Wasserfallen, A., Nolling, J., Pfister, P., Reeve, J., Conway de Macario, E. 2000.
Phylogenetic analysis of 18 thermophilic Methanobacterium isolates supports the
proposals to create a new genus, Methanothermobacter gen. nov., and to reclassify
several isolates in three species, Methanothermobacter thermautotrophicus comb. nov.,
Methanothermobacter wolfeii comb. nov., and Methanothermobacter marburgensis sp.
nov. Int J Syst Evol Microbiol, 50, 43-53.
Watanabe, T., Asakawa, S., Nakamura, A., Nagaoka, K., Kimura, M. 2004. DGGE method
for analyzing 16S rDNA of methanogenic archaeal community in paddy field soil.
FEMS Microbiol Letters, 232, 153-163.
Winter, J., Lerp, C., Zabel, H.P., Wildenauer, F.X., König, H., Schindler, F. 1984.
Methanobacterium wolfei, sp. nov., a new tungsten-requiring, thermophilic, autotrophic
methanogen Syst Appl Microbiol, 5, 457-466.
Woodward, L., Perrier, M., Srinivasan, B., Pinto, R.P., Tartakovsky, B. 2010. Comparison
of real-time methods for maximizing power output in microbial fuel cells. AIChE J., 56,
2742-2750.
Woodward, L., Tartakovsky, B., Perrier, M., Srinivasan, B. 2009. Maximizing power
production in a stack of microbial fuel cells using multiunit optimization method.
Biotechnol Prog, 25, 676-682.
Wrighton, K.C., Agbo, P., Warnecke, F., Weber, K.A., Brodie, E.L., DeSantis, T.Z.,
Hugenholtz, P., Andersen, G.L., Coates, J.D. 2008. A novel ecological role of the
Firmicutes identified in thermophilic microbial fuel cells. ISME J, 2, 1146-1156.
Zhang, P., Liu, Z. 2010. Experimental study of the microbial fuel cell internal resistance. J
Power Sources, 195, 8013-8018.
126
Connecting text
Chapter 5 demonstrated electricity production from syngas under thermophilic
conditions for the first time. Themophilic conditions considerably enhanced the MFC power
output and Coulombic efficiency (CE). However, practical applications of CO/syngas-fed
MFCs would require much higher volumetric efficiencies. We hypothesized that volumetric
efficiency of a CO/syngas-fed MFC could be increased by further improvements in the MFC
design. Accordingly, the following study (Chapter 6) evaluated ability of a multi-electrode
design containing three anodes and two cathodes to achieve improved volumetric efficiency
on syngas at several operating temperatures and anode-cathode arrangements.
This study is to be published in Journal of Chemical Technology and Biotechnology
(2013).

127
CHAPTER 6
Electricity production from synthesis gas in a multi-electrode
microbial fuel cell
6.1 Abstract
This study demonstrated electricity production in a multi-anode/cathode MFC fed with
synthesis gas (syngas) as the sole electron donor at several operating temperatures ranging
from 37 °C to 50 °C. In addition to providing a compact system design, the adoption of a
multi-electrode configuration considerably enhanced the system performance. A maximum
power density of 33 mW -1
RL (normalized to the anodic compartment volume) and a
Coulombic efficiency (CE) of 43 % was achieved at an operating temperature of 37 °C. The
MFC performance at elevated temperatures was restricted by low thermophilic microbial
activity. Consequently, a much lower power density of 10 mW -1
RL and a CE of 15 % were
obtained at 50 °C. The MFC power density was also greatly impacted by the anode-cathode
arrangement. Among the several electrode arrangements tested in this study, the highest
power density was achieved in a three anode-two cathode (3A-2C) arrangement.
Keywords: Microbial fuel cell; Synthesis gas; Carbon monoxide; Multi-electrode design
128
6.2 Introduction
The utilization of syngas as an electron donor for electricity production in a microbial
fuel cell (MFC) represents a promising alternative technology for renewable energy
production that could offer several advantages including a high transformation efficiency,
broad range of operating conditions, a high bio-catalytic activity and considerable resistance
to poisoning by fuel impurities (Hussain et al., 2011a). Electricity production in an MFC
directly fed with syngas has been recently demonstrated (Hussain et al., 2011b; Mehta et al.,
2010). Improvements in the design of syngas-fed MFCs have led to a substantial increase in
their volumetric power output, syngas transformation and Coulombic efficiency (CE)
(Hussain et al., 2011b; Neburchilov et al., 2011). However, practical applications of such
systems would require much higher volumetric efficiencies.
Electricity production from syngas has so far been tested in a single-anode/cathode
MFC design (Hussain et al., 2011a). An efficient way of increasing power production in an
MFC might be with the adoption of a multi-electrode design. Multi-anode/cathode MFCs
fed with acetate, waste water and other liquid organic substrates have been reported to attain
improved volumetric efficiencies (Jiang et al., 2011; Jiang et al., 2010). However, electricity
production from syngas is a culmination of complex electrochemical, transport phenomena
and microbiological interactions, all of which are greatly affected by system architecture and
design, such that the overall outcome of enhanced system performance is uncertain and thus
warrants a systematic experimental study to examine the applicability of a multi-
anode/cathode design to achieve high volumetric efficiency on syngas.

129
This study presents the first attempt to operate an MFC with a multi-electrode design
(meMFC) on syngas. First, the impact of the proposed system design including different
anode-cathode arrangements on power output was evaluated in an acetate-fed meMFC.
Subsequently, a similar meMFC was operated on syngas at temperatures of 37 °C, 45 °C
and 50 °C, and the impact of different electrode arrangements on power output was
simultaneously examined.
6.3 Material and Methods
6.3.1 Medium composition and analytical methods
The composition of the stock solution of nutrients used in this study was (in g L-1): 1.87
NH4Cl, 14.81 KCl, 6.40 K2HPO4, 4.07 KH2PO4 and 0.215 yeast extract. The trace metal
stock solution was prepared according to Tartakovsky et al.(2008) and contained (in g/L): 2
FeCl24H2O, 0.05 H3BO3, 50 ZnCl2, 0.03 CuCl2, 0.5 MnCl24H2O, 0.5 (NH4)6Mo7O244H2O,
0.5 AlCl3, 0.5 CoCl26H2O, 0.5 NiCl2, 0.5 EDTA, and concentrated HCl (1 mL). The
chemicals used were of analytical grade. The stock solutions were filter-sterilized with a
0.22 µm filter (Fisher Scientific, Ottawa, ON, Canada) and maintained at 4°C until use. The
influent solution was prepared by adding 35 mL of the nutrient solution and 1 mL of the
trace metal solution to 1 L of de-ionized water. This solution had a conductivity of 12 -14
mS cm-1. For meMFC operation on acetate, an acetate solution was prepared by adding 40 g
of sodium acetate to 1 L of de-ionized water.
Acetate and other volatile fatty acids (VFAs) in the effluent stream were analyzed using
an Agilent 6890 gas chromatograph (Agilent Technologies Inc, Santa Clara, CA, USA)
equipped with a flame ionization detector. The off-gas flow rate was measured using the
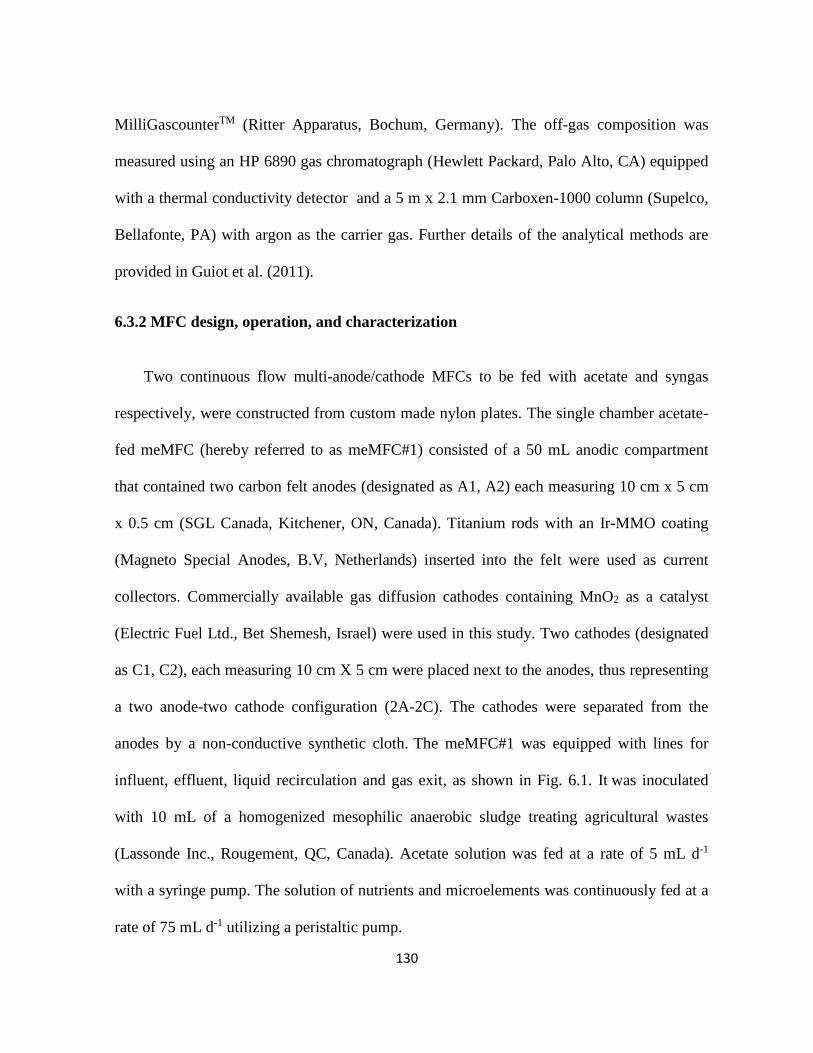
130
MilliGascounterTM (Ritter Apparatus, Bochum, Germany). The off-gas composition was
measured using an HP 6890 gas chromatograph (Hewlett Packard, Palo Alto, CA) equipped
with a thermal conductivity detector and a 5 m x 2.1 mm Carboxen-1000 column (Supelco,
Bellafonte, PA) with argon as the carrier gas. Further details of the analytical methods are
provided in Guiot et al. (2011).
6.3.2 MFC design, operation, and characterization
Two continuous flow multi-anode/cathode MFCs to be fed with acetate and syngas
respectively, were constructed from custom made nylon plates. The single chamber acetate-
fed meMFC (hereby referred to as meMFC#1) consisted of a 50 mL anodic compartment
that contained two carbon felt anodes (designated as A1, A2) each measuring 10 cm x 5 cm
x 0.5 cm (SGL Canada, Kitchener, ON, Canada). Titanium rods with an Ir-MMO coating
(Magneto Special Anodes, B.V, Netherlands) inserted into the felt were used as current
collectors. Commercially available gas diffusion cathodes containing MnO2 as a catalyst
(Electric Fuel Ltd., Bet Shemesh, Israel) were used in this study. Two cathodes (designated
as C1, C2), each measuring 10 cm X 5 cm were placed next to the anodes, thus representing
a two anode-two cathode configuration (2A-2C). The cathodes were separated from the
anodes by a non-conductive synthetic cloth. The meMFC#1 was equipped with lines for
influent, effluent, liquid recirculation and gas exit, as shown in Fig. 6.1. It was inoculated
with 10 mL of a homogenized mesophilic anaerobic sludge treating agricultural wastes
(Lassonde Inc., Rougement, QC, Canada). Acetate solution was fed at a rate of 5 mL d-1
with a syringe pump. The solution of nutrients and microelements was continuously fed at a
rate of 75 mL d-1 utilizing a peristaltic pump.

131
The 100 mL, single chamber syngas-fed meMFC (hereby referred to as meMFC#2) was
similar in design to the acetate-fed meMFC. For syngas delivery in the anodic liquid,
silicone tubing coiled around a third layer of carbon felt anode (designated as A3) was
placed in the middle of the two pre-installed anodes (Fig. 6.1). The silicone tubing (VWR
International LLC, Radnor, PA, USA) had a thickness of 90 µm, an external diameter of
1.76 mm and a total surface area of 75 cm2. As shown in Fig. 6.1, the tubing was operated
under a dead-end mode, with its inlet connected to the gas line, while the outlet was
connected to a manometer. The solution of nutrients and microelements was fed at a rate of
20 mL d-1. To evaluate the effect of temperature on the system performance, meMFC#2 was
operated at temperatures of 37 °C, 45 °C and 50 °C. The anodic liquid was maintained at the
desired temperature by heating the liquid in the external recirculation loop of the MFC. To
simulate syngas feeding, CO & H2 (50:50 v/v) were simultaneously fed at the desired flow
rate. At 45 °C and 50 °C, meMFC #2 was fed with a syngas flow rate of 2 L -1
RL d-1
(expressed as L of syngas fed per L of anodic chamber ( -1
RL ) volume per day). Two
additional flow rates of 1.2 and 3 L -1
RL d-1 were tested at 37 °C. Each flow rate was tested for
a period of at least 5 days.

132
Figure 6.1 Diagram of the experimental set-up of syngas-fed multi-anode/cathode MFC
(meMFC#2), where GC represents the gas counter. The meMFC#1 setup lacked H2 and
CO lines and middle anode (A3) with silicone tubing.
During start-up, meMFC#1 was operated in the two anode-two cathode (2A-2C)
arrangement, in which all anodes were interconnected by a wire and two cathodes were also
electrically connected by a wire. Similarly, meMFC#2 was initially operated under three
anode-two cathode (3A-2C) arrangement (Fig. 6.2A). Both MFCs were started at a constant

133
external resistance of 500 Ω. Once a steady power output was observed, the external
resistance was optimized using the Perturbation and Observation MPPT algorithm, which
constantly adjusted the external resistance to maximize the MFC power output in real time
(Woodward et al., 2009). The MFC voltage was measured and recorded at 20 min intervals
using Labjack U12 (Labjack Corp., Lakewood, CO, USA). Different anode-cathode
arrangements were then tested by varying the external electrical connections and
maintaining each arrangement for a period of at least 6 h to stabilize output voltage and
current. All tested electrode arrangements for meMFC#1 and meMFC#2 are listed in Table
6.1. The 3A-2C and 1A-1C electrode arrangements for meMFC#2 are illustrated in Fig.
6.2A and 6.2B, respectively. Polarization tests were carried out at the end of each test
following the procedure described in Logan et al. (2008).
Coulombic efficiency (CE) of the syngas-fed meMFC was calculated as:
, , 2, 2,
2
100%CO in CO out H in H out
CO H
I tCE
M M M MFn
M M
..................................... (6.1)
Where, I is the average current (A), t is the time interval during which the current was
measured (s), MCO is the molar mass of CO (g/mol), MH2 is the molar mass of H2 (g/mol), F
is the Faraday constant (C/mol-e-), n is the number of electrons exchanged (mol-e-/mol),
MCO,in and MH2,in are the amounts of CO and H2, respectively, supplied (g) to meMFC#2
during t, MCO,out and MH2,out are the amounts of CO and H2, respectively, recovered (g) in
the off-gas during t.

134
Table 6.1 List of different electrode arrangements tested for acetate and syngas-fed multi-
anode/cathode MFCs (meMFC#1 and meMFC#2).
Test Substrate Flow rate
(L -1
RL d-1) Electrode
Arrangement Description
Temperature
(°C)
1 Acetate - 2A-2C (A1,A2)-(C1,C2)
electrically connected 22
2 Acetate - 2A-1C (L) (A1,A2)-(C1) electrically
connected 22
3 Acetate - 2A- 1C (R) (A1,A2)-(C2) electrically
connected 22
4 Acetate - 1A-1C (L)
(A1)-(C1) electrically
connected and optimized
separately using P/O
algorithm
22
5 Acetate - 1A-1C (R)
(A2)-(C2) electrically
connected and optimized
separately using P/O
algorithm
22
6 Syngas 1.2, 2, 3 3A-2C (A1, A2, A3)-(C1,C2)
electrically connected 37, 45, 50
7 Syngas 1.2, 2, 3 3A-1C (L) (A1, A2, A3)-(C1)
electrically connected 37,45, 50
8 Syngas 1.2, 2, 3 1A-1C (L) (A1)-(C1) electrically
connected 37, 45, 50
9 Syngas 1.2, 2, 3 3A-1C (R) (A1, A2, A3)-(C2)
electrically connected 37, 45, 50
10 Syngas 1.2, 2, 3 1A-1C (R) (A2)-(C2) electrically
connected 37, 45, 50
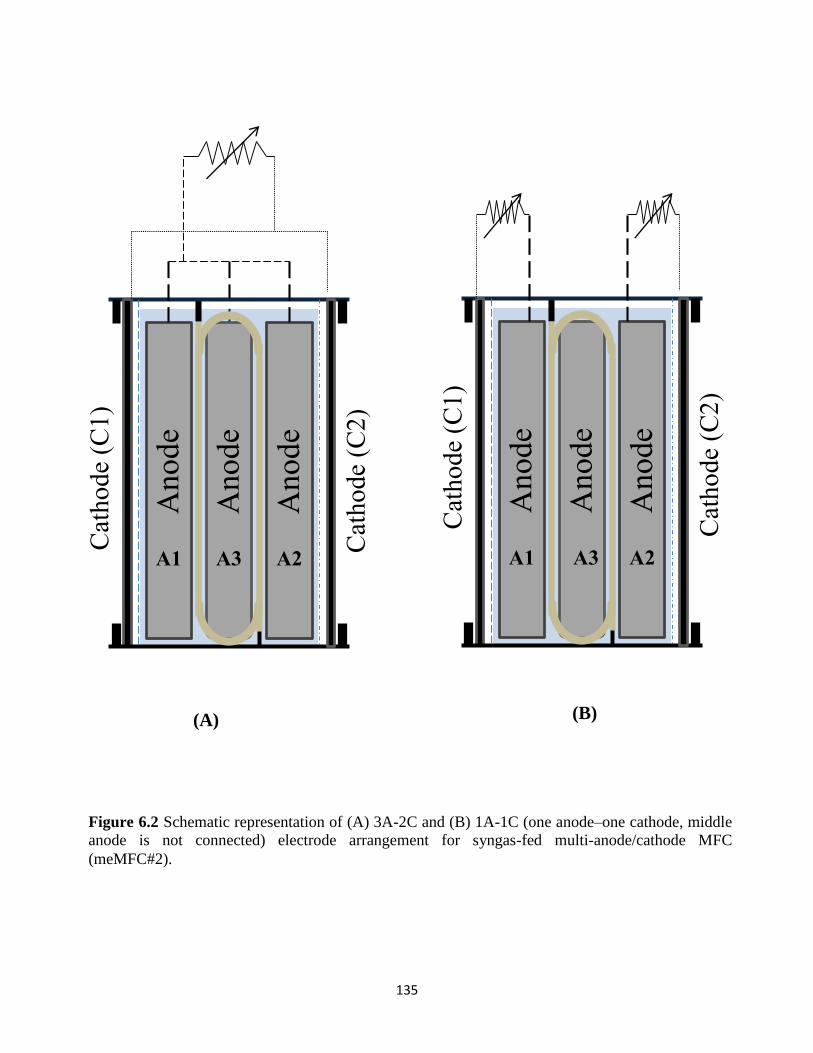
135
Cathode (C1)
Anode
Anode
Anode
Cathode (C2)
A3 A1 A2
Cathode (C1)
Anode
Anode
Anode
Cathode (C2)
A1 A3 A2
(A) (B)
Figure 6.2 Schematic representation of (A) 3A-2C and (B) 1A-1C (one anode–one cathode, middle
anode is not connected) electrode arrangement for syngas-fed multi-anode/cathode MFC
(meMFC#2).

136
6.3.3 Protein quantification
Protein quantification was performed at the end of meMFC#2 operation to evaluate the
cell density in the anodic biofilm. Pieces of carbon felt measuring 1 cm x 1 cm x 5 cm were
cut from the middle and bottom of each anode using a surgical scissor and stored at -20 °C
until use. Protein analysis was performed following the procedure described in Gil-Carrera
et al. (2011) and expressed as mg of protein/mL of anode (LA−1).
6.4 Results and Discussion
6.4.1 Impact of electrode arrangements on power output of meMFC#1
To validate the ability of our MFC design to achieve enhanced power outputs, the
proposed multi-electrode design (meMFC) was first tested on acetate. The test was initiated
with meMFC #1 being operated in a 2A-2C arrangement at an external load of 500 Ω.
Within 2 days of initiation of the test, the output voltage increased from 0 to 100 mV,
corresponding to a power output of 0.4 mW -1
RL . From day 3 onwards, the on-line
perturbation/observation (P/O) algorithm was utilized to optimize the external resistance,
thus maximizing the power output at all times (Woodward et al., 2009). A steady power
output of 73 ± 5 mW -1
RL was obtained after 5 days of operation. To estimate the internal
resistance (Rint), the open circuit voltage (OCV), and the maximum power output (Pmax),
polarization tests were performed on day 7. An OCV value of 620 mV was measured and a
Rint of 21 Ω was estimated based on the polarization curve shown in Fig. 6.3A. Accordingly,
Pmax of 82 mW -1
RL was obtained, as shown in Fig. 6.3B. The Rint estimation agreed well with
the optimal value of Rext chosen by the P/O algorithm, which varied between 15-25 Ω.
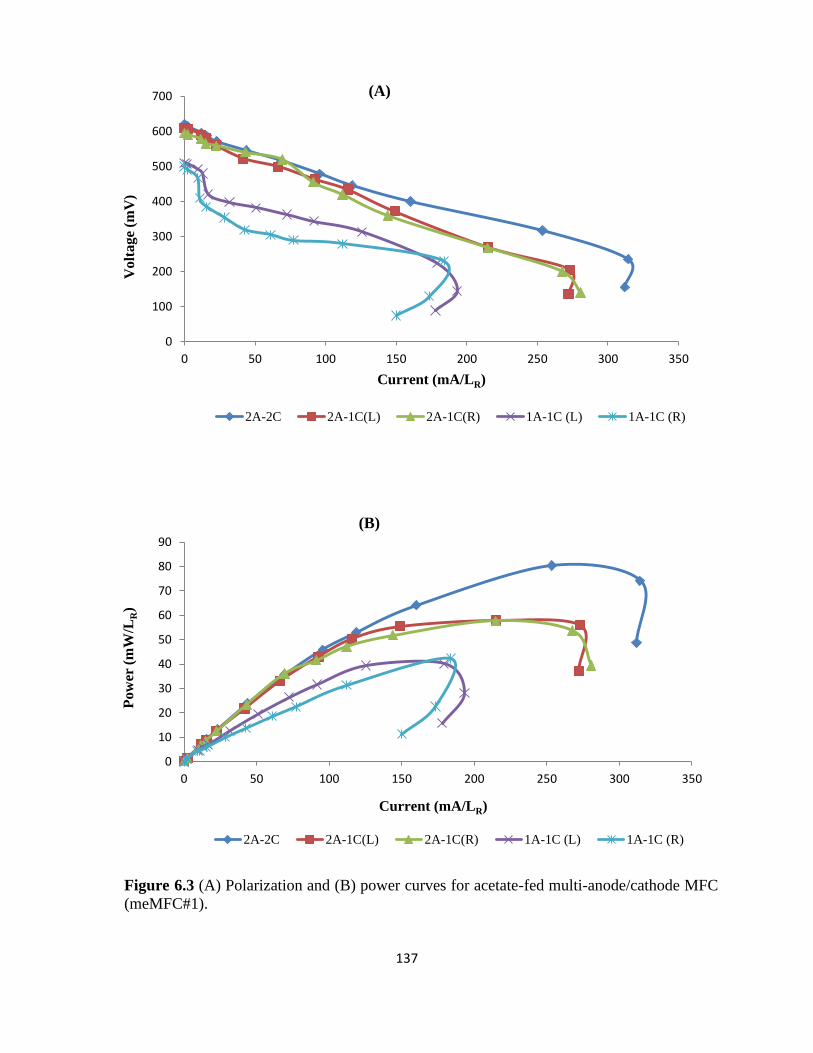
137
Figure 6.3 (A) Polarization and (B) power curves for acetate-fed multi-anode/cathode MFC
(meMFC#1).
0
100
200
300
400
500
600
700
0 50 100 150 200 250 300 350
Vo
lta
ge
(mV
)
Current (mA/LR)
2A-2C 2A-1C(L) 2A-1C(R) 1A-1C (L) 1A-1C (R)
(A)
0
10
20
30
40
50
60
70
80
90
0 50 100 150 200 250 300 350
Pow
er (
mW
/LR)
Current (mA/LR)
2A-2C 2A-1C(L) 2A-1C(R) 1A-1C (L) 1A-1C (R)
(B)

138
The impact of different anode-cathode arrangements on power output of meMFC#1
were studied by comparing different external circuit connections. Five different circuit
connections as outlined in Table 6.1 were tested. Highest power outputs and lowest Rint
values were obtained in 2A-2C configuration (two interconnected anodes and two
interconnected cathodes). A reduction in number of interconnected electrodes negatively
impacted meMFC#1 performance. Operating meMFC#1 in a two anode-one cathode
arrangement (2A-1C) resulted in up to 30 % reduction in power density. A reduced
maximum power output of 58 mW -1
RL was obtained in 2A-1C(L) arrangement (Fig. 6.3B, L
denotes left-side cathode), compared to 82 mW -1
RL achieved in 2A-2C configuration.
Similarly, the power density reduced to 57 mW -1
RL when operated in 2A-1C(R) electrode
arrangement (Fig. 6.3B, R denotes right-side cathode). The decrease in power output was
manifested by 25-30 % increase in Rint to 30-32 Ω, compared to 24 Ω in 2A-2C
configuration.
A reduction in the number of interconnected anodes had an equally significant effect on
power density. The operation of meMFC#1 in a 1A-1C(L) arrangement resulted in a
maximum power density of 39 mW -1
RL , a reduction of ~ 33 % compared to the power
density obtained in 2A-1C(L) arrangement (Fig. 6.3B). Similarly, the power density of 40
mW -1
RL obtained in 1A-1C(R) arrangement was 30 % less than that observed in 2A-1C(R)
arrangement (Fig.6.3B). Notably, the power produced by each anode-cathode pair was
almost equal to the power produced by single-anode/cathode MFCs fed with acetate (Pinto
et al., 2011). Also, the cumulative sum of the power densities for each electrode pair

139
(39 mW -1
RL + 40 mW -1
RL ) was almost equal to the power density achieved in 2A-2C
arrangement (82 mW -1
RL ), thereby further substantiating the ability of multi-electrode MFCs
to achieve high power outputs with lower reactor volumes.
Overall, the power output of meMFC#1 was almost two times higher in comparison to
single-anode/cathode MFCs (20-45 mW -1
RL ) operated on acetate in our previous tests (Pinto
et al., 2011; Pinto et al., 2010). The power output was also higher in comparison to multi-
anode/cathode MFCs used in other studies, which have been reported to have power outputs
of 40-60 mW -1
RL at similar organic loads (Ahn andLogan, 2012; Jiang et al., 2011; Jiang et
al., 2010). These results clearly elucidated the ability of our meMFC design to achieve an
improved performance, which is most likely due to improved system design leading to a
reduced internal resistance.
6.4.2 Impact of temperature and electrode arrangements on meMFC#2 operation on
syngas
Following meMFC#1 tests on acetate, a second meMFC (meMFC#2) was operated on
syngas. The syngas tests were aimed at evaluating the impact of temperature and electrode
arrangements on the performance of syngas-fed MFCs. Consequently, meMFC#2 was
operated at several operating temperatures, and the effect of different electrode arrangements
was examined. The meMFC#2 operation was initiated with the system being operated at a
temperature of 50 °C and fed with syngas at a flow rate of 2 L -1
RL d-1. As found to be optimal
in previous test, during start-up of meMFC#2 all anodes and cathodes were electrically
connected (3A-2C arrangement) as shown in Fig. 6.2A. No electricity production was
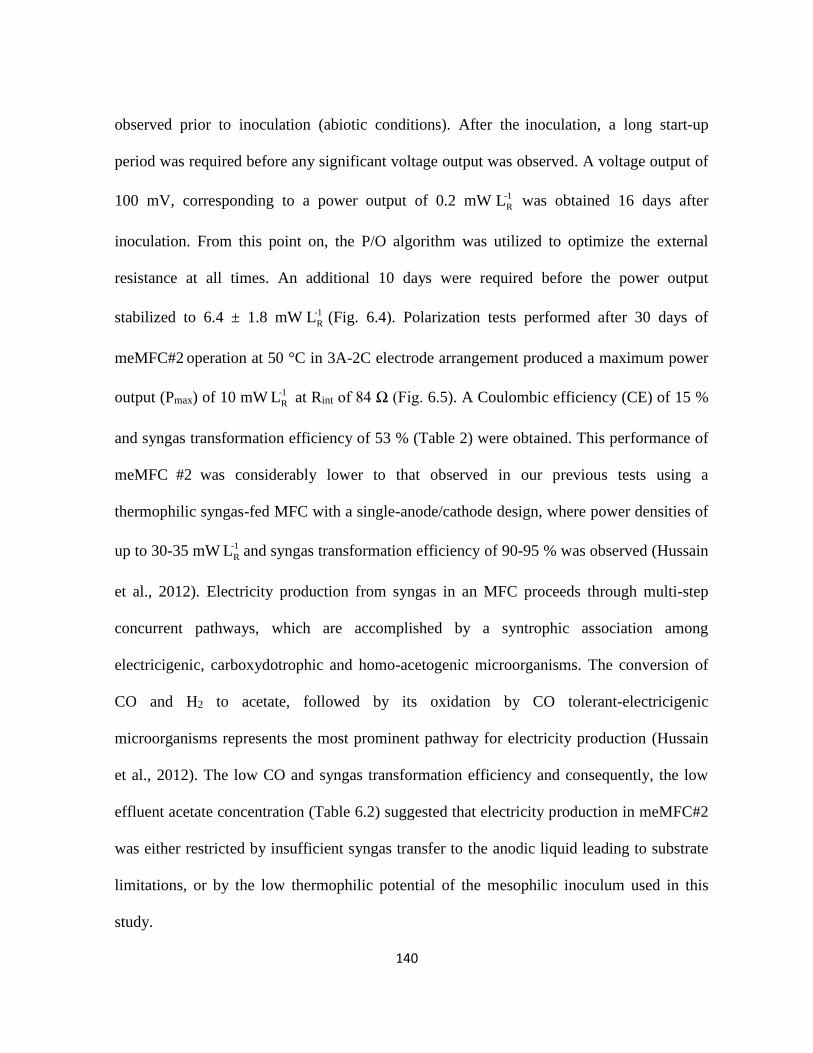
140
observed prior to inoculation (abiotic conditions). After the inoculation, a long start-up
period was required before any significant voltage output was observed. A voltage output of
100 mV, corresponding to a power output of 0.2 mW -1
RL was obtained 16 days after
inoculation. From this point on, the P/O algorithm was utilized to optimize the external
resistance at all times. An additional 10 days were required before the power output
stabilized to 6.4 ± 1.8 mW -1
RL (Fig. 6.4). Polarization tests performed after 30 days of
meMFC#2 operation at 50 °C in 3A-2C electrode arrangement produced a maximum power
output (Pmax) of 10 mW -1
RL at Rint of 84 Ω (Fig. 6.5). A Coulombic efficiency (CE) of 15 %
and syngas transformation efficiency of 53 % (Table 2) were obtained. This performance of
meMFC #2 was considerably lower to that observed in our previous tests using a
thermophilic syngas-fed MFC with a single-anode/cathode design, where power densities of
up to 30-35 mW -1
RL and syngas transformation efficiency of 90-95 % was observed (Hussain
et al., 2012). Electricity production from syngas in an MFC proceeds through multi-step
concurrent pathways, which are accomplished by a syntrophic association among
electricigenic, carboxydotrophic and homo-acetogenic microorganisms. The conversion of
CO and H2 to acetate, followed by its oxidation by CO tolerant-electricigenic
microorganisms represents the most prominent pathway for electricity production (Hussain
et al., 2012). The low CO and syngas transformation efficiency and consequently, the low
effluent acetate concentration (Table 6.2) suggested that electricity production in meMFC#2
was either restricted by insufficient syngas transfer to the anodic liquid leading to substrate
limitations, or by the low thermophilic potential of the mesophilic inoculum used in this
study.
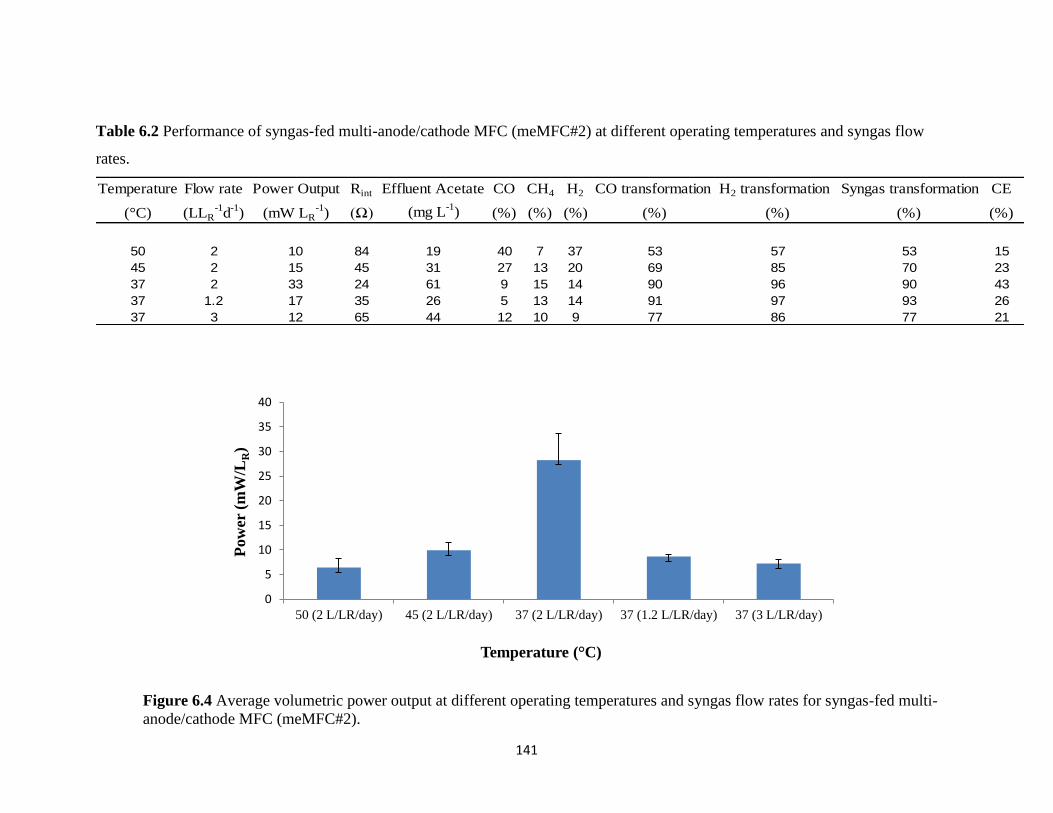
141
Table 6.2 Performance of syngas-fed multi-anode/cathode MFC (meMFC#2) at different operating temperatures and syngas flow
rates.
Temperature Flow rate Power Output Rint Effluent Acetate CO CH4 H2 CO transformation H2 transformation Syngas transformation CE
(°C) (LLR-1
d-1
) (mW LR-1
) (Ω) (mg L-1
) (%) (%) (%) (%) (%) (%) (%)
50 2 10 84 19 40 7 37 53 57 53 15
45 2 15 45 31 27 13 20 69 85 70 23
37 2 33 24 61 9 15 14 90 96 90 43
37 1.2 17 35 26 5 13 14 91 97 93 26
37 3 12 65 44 12 10 9 77 86 77 21
Figure 6.4 Average volumetric power output at different operating temperatures and syngas flow rates for syngas-fed multi-
anode/cathode MFC (meMFC#2).
0
5
10
15
20
25
30
35
40
50 (2 L/LR/day) 45 (2 L/LR/day) 37 (2 L/LR/day) 37 (1.2 L/LR/day) 37 (3 L/LR/day)
Pow
er (
mW
/LR)
Temperature (°C)
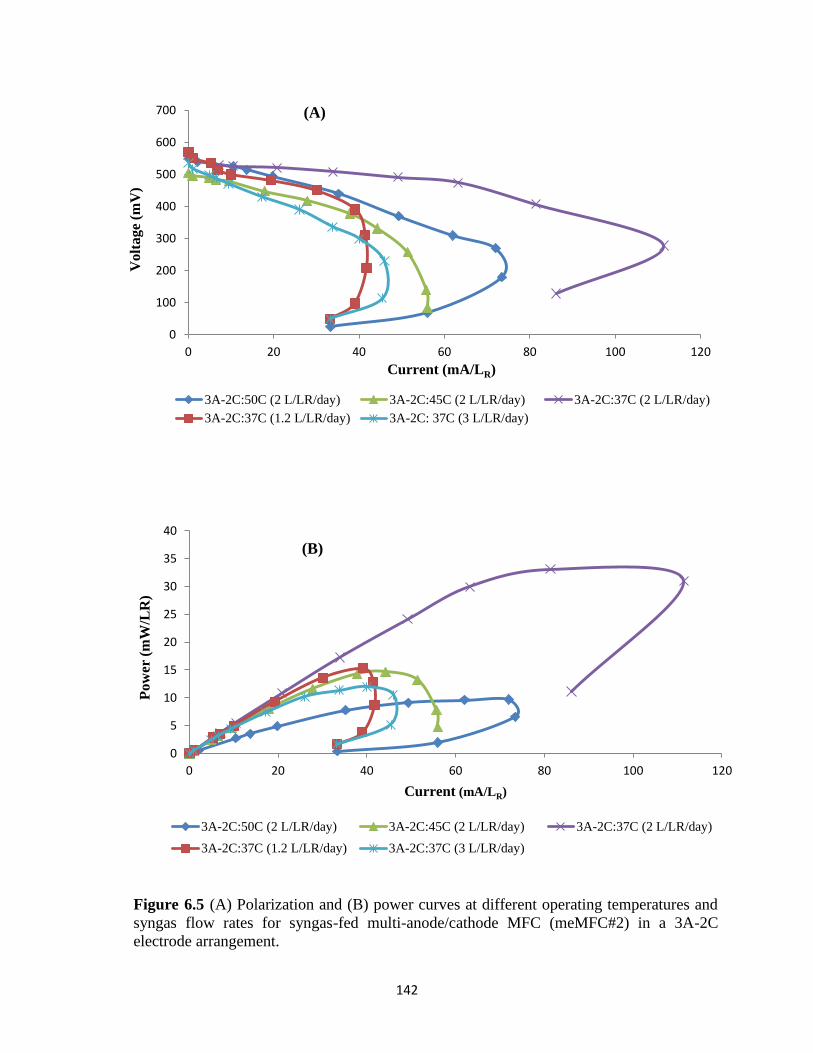
142
0
100
200
300
400
500
600
700
0 20 40 60 80 100 120
Vo
lta
ge
(mV
)
Current (mA/LR)
3A-2C:50C (2 L/LR/day) 3A-2C:45C (2 L/LR/day) 3A-2C:37C (2 L/LR/day)
3A-2C:37C (1.2 L/LR/day) 3A-2C: 37C (3 L/LR/day)
0
5
10
15
20
25
30
35
40
0 20 40 60 80 100 120
Pow
er (
mW
/LR
)
Current (mA/LR)
3A-2C:50C (2 L/LR/day) 3A-2C:45C (2 L/LR/day) 3A-2C:37C (2 L/LR/day)
3A-2C:37C (1.2 L/LR/day) 3A-2C:37C (3 L/LR/day)
Figure 6.5 (A) Polarization and (B) power curves at different operating temperatures and
syngas flow rates for syngas-fed multi-anode/cathode MFC (meMFC#2) in a 3A-2C
electrode arrangement.
(A)
(B)
143
Gas-liquid mass transfer limits the conversion rates in bioprocesses that utilize sparingly
soluble gases such as syngas. MFC operation on syngas at thermophilic temperatures is
expected to further limit syngas transfer in the anodic liquid; however, this is counteracted
by increase in the mass transfer rate (Guiot et al., 2011; Hussain et al., 2011a). To examine
if the electricity production in meMFC#2 was limited by substrate availability, dissolved gas
concentrations in the anodic liquid were measured. While the dissolved CO concentrations
could be measured, the measurement of dissolved H2 was unsuccessful due to its low
solubility in the liquid and the insufficient detection limit of the analytical method. A
dissolved CO concentration of ~ 6 mg/L was obtained, which was similar to that measured
in mesophilic syngas-fed MFCs fed with similar gas flow rate (Hussain et al., 2011b).
Though the dissolved H2 concentration could not be measured, we hypothesize that the
dissolved H2 concentration should have been similar to that under mesophilic conditions.
Also, the ability of silicone tubing systems to efficiently transfer H2 to the anodic liquid
under thermophilic conditions has been previously demonstrated (Hussain et al., 2012;
Hussain et al., 2011b). Based on these observations, and the near-saturation concentration of
dissolved CO in the anodic liquid of meMFC#2, it was concluded that sufficient amounts of
substrate were available for microbial metabolism and the electricity production in
meMFC#2 was not restricted by the MFC design. The power output of meMFC#2 at 50°C
was conceivably restricted by the low carboxydotrophic and homo-acetogenic activity under
thermophilic conditions. Additionally, to evaluate the electricigenic potential of the anodic
bacterial communities at thermophilic temperatures, 1 mL of acetate solution was injected in
the anodic compartment of meMFC#2. Contrary to previous observations, where acetate
injection always led to an instant increase in power output of syngas-fed MFCs (Hussain et

144
al., 2011b; Mehta et al., 2010), acetate addition in this case had no significant effect on the
power output of meMFC#2. This indicated the low electricigenic activity at thermophilic
temperatures, which might have further restricted electricity production at 50 °C. Also,
repetitive inoculations had no significant effect on meMFC#2 power output, clearly
elucidating the low thermophilic potential of the mesophilic inoculum used in this study.
Lowering the operating temperature to 45 °C augmented the average power output to 10
± 1.5 mW -1
RL (Fig. 6.4), with a corresponding increase in CE to 23 %. Polarization
experiments performed after 4 days of power stabilization, revealed a Pmax of 15 mW -1
RL (Fig.
6.5B) at a reduced Rint of 45 Ω compared to 84 Ω at 50 °C (Table 6.2). The improved
performance of meMFC#2 could be attributed to the increased microbial activity at the
mesophilic operating temperature of 45 °C. This is corroborated by the increase in syngas
transformation efficiency to 70 % and the increased concentration of acetate in the MFC
effluent to 31 mg L-1 (Table 6.2). An injection of 1 mL of acetate solution in the anodic
chamber further raised the power output to 18 mW -1
RL , indicating an increased electricigenic
activity at mesophilic temperatures.
Considering that the mesophilic microorganisms have an optimal growth and activity
between 35-40 °C, the performance of meMFC#2 was also evaluated at 37 °C. The
temperature reduction from 45 °C to 37 °C considerably enhanced the system performance.
A steady power output of 28 ± mW -1
RL (Fig. 6.4) was obtained within 3 days of operation at
37 °C. Polarization curves acquired towards the end of meMFC#2 operation at 37 °C,
affirmed the enhanced performance with a maximum power density of 33 mW -1
RL (Fig.

145
6.5B), the highest observed for a syngas-fed MFC under mesophilic conditions. The
enhanced power density was manifested by a substantial reduction in Rint to 24 Ω and an
increased syngas transformation and Coulombic efficiency to 90 % and 43 %, respectively
(Table 6.2).
To further maximize syngas consumption and meMFC#2 performance, additional
syngas flow rates were tested at 37 °C. First, the syngas flow rate was reduced to
1.2 L -1
RL d-1. This reduction in flow rate marginally increased the syngas transformation
efficiency to 93 %, but decreased the average and maximum power outputs to 9.2 ± 0.4 mW
-1
RL and 17 mW -1
RL (Fig. 6.4, 6.5), respectively. The increased Rint of 35 Ω and low acetate
concentration in the effluent suggested that electricity generation was plausibly restricted by
low carbon source concentrations. As previously mentioned, acetate serves as the primary
intermediate for electricity production in a syngas-fed MFC, with low acetate levels in the
anodic liquid at lower syngas flow rates limiting electricity generation (Hussain et al., 2012;
Hussain et al., 2011b). Also, an increase in Rint under substrate limited conditions has been
previously reported (Ieropoulos et al., 2010; Zhang andLiu, 2010).
Following the 1.2 L -1
RL d-1 test, the syngas flow rate was stepped-up to 3 L -1
RL d-1. This
increase in flow rate significantly impaired meMFC#2 performance. The average power
output was reduced to 7.2 ± 1 mW -1
RL (Fig. 6.4) and the syngas transformation efficiency
dropped to 77 %. The Rint increased to 65 Ω, with a corresponding decrease in the maximum
power output to 12 mW -1
RL , which was deduced from the polarization curves obtained at the
end of 3 L -1
RL d-1 test (Fig. 6.5). This reduced performance could be attributed to the
146
increased levels of dissolved CO in the anodic liquid at high syngas flow rates, which might
have inhibited the carboxydotrophic and electricigenic microorganisms, thereby impeding
MFC performance (Hussain et al., 2011b; Mehta et al., 2010). Consequently, flow rates
above 3 L -1
RL d-1 were not tested.
Overall, meMFC#2 operation at different temperatures demonstrated syngas
consumption and syngas dependant bioelectrochemical activity at a wide temperature range
of 37 to 50 °C. The power output and syngas/CO conversion efficiency obtained in
meMFC#2 during mesophilic operation was considerably higher to that observed for
mesophilic syngas-fed MFCs with a single-anode/cathode design, which produced
maximum power outputs of 4.8-8.1 mW -1
RL , with a CO conversion efficiency of 50-55 %
(Hussain et al., 2011b; Mehta et al., 2010). The maximum current density for meMFC#2 at
37 °C was in the range of 1.0 – 1.2 Am-2 (0.1-0.12 A -1
RL ) which was also well above the
current density of 0.4 – 0.5 Am-2 (0.04 – 0.05 A -1
RL ) observed for mesophilic syngas-fed
MFCs in our previous studies (Hussain et al., 2011b; Mehta et al., 2010; Neburchilov et al.,
2011). In fact, the volumetric densities achieved in meMFC#2 at 37 °C was comparable to
the mesophilic multi-anode/cathode MFCs fed with acetate, waste water and other organic
substrates that have been reported to have power outputs in the range of 15-45 mW -1
RL with
similar MFC dimensions and design (Ahn andLogan, 2012; Fan et al., 2007; Jiang et al.,
2010). In addition to the increased volumetric densities, the utilization of a multi-
anode/cathode configuration led to a significant enhancement in Coulombic efficiency on
syngas. The maximum CE of 40-43 % obtained in this study was considerably higher than

147
those previously reported for mesophilic (CE of 6-8 %) and thermophilic (CE of 20-26%)
syngas-fed MFCs (Hussain et al., 2012; Hussain et al., 2011b). These results clearly indicate
that power generation and CE on syngas can be efficiently enhanced by the adoption of a
multi-anode/cathode configuration and provides a promise of further improving power
generation by integrating multiple electrodes. Practical applications would require the
stacking of multiple large-scale MFC systems with a multi-anode/cathode configuration
operated under continuous flow conditions. Stacking of multiple syngas-fed meMFCs
sharing a common gas and influent passage as that demonstrated in this study might avoid
the requirement of an extensive distribution system to pump the substrate gas and influent
individually to different reactors as required for a stack of multiple single-anode/cathode
systems (Ieropoulos et al., 2008; Zhuang andZhou, 2009), thereby providing easy
construction and implementation of scale-up systems.
To confirm the impact of different anode-cathode arrangements on MFC power output,
meMFC#2 was also operated under several external circuit connections as previously
described in Table 6.1. Similar to tests with meMFC#1, reduction in number of electrically
connected electrodes negatively impacted the power output of meMFC#2. However, the
extent of impact was dependent on the operating conditions and microbial activity.
Similar to meMFC#1 tests, a reduction in power density in meMFC#2 on reducing the
number of electrically connected cathodes was more profound under optimal operating
conditions. A decrease in power density of up to 55 % upon cathode area reduction was
observed for meMFC#2 at the optimal operating temperature of 37 °C and a syngas flow
rate of 2 L -1
RL d-1. Compared to a power output of 33 mW -1
RL in a 3A-2C arrangement, a
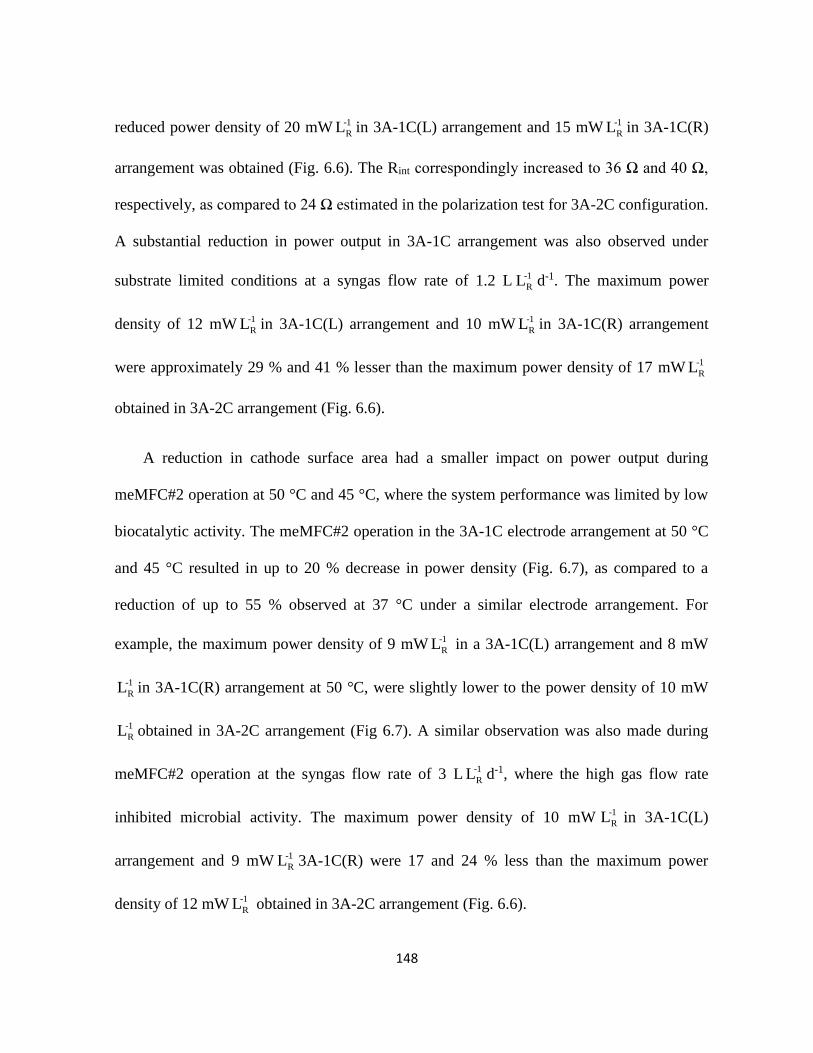
148
reduced power density of 20 mW -1
RL in 3A-1C(L) arrangement and 15 mW -1
RL in 3A-1C(R)
arrangement was obtained (Fig. 6.6). The Rint correspondingly increased to 36 Ω and 40 Ω,
respectively, as compared to 24 Ω estimated in the polarization test for 3A-2C configuration.
A substantial reduction in power output in 3A-1C arrangement was also observed under
substrate limited conditions at a syngas flow rate of 1.2 L -1
RL d-1. The maximum power
density of 12 mW -1
RL in 3A-1C(L) arrangement and 10 mW -1
RL in 3A-1C(R) arrangement
were approximately 29 % and 41 % lesser than the maximum power density of 17 mW -1
RL
obtained in 3A-2C arrangement (Fig. 6.6).
A reduction in cathode surface area had a smaller impact on power output during
meMFC#2 operation at 50 °C and 45 °C, where the system performance was limited by low
biocatalytic activity. The meMFC#2 operation in the 3A-1C electrode arrangement at 50 °C
and 45 °C resulted in up to 20 % decrease in power density (Fig. 6.7), as compared to a
reduction of up to 55 % observed at 37 °C under a similar electrode arrangement. For
example, the maximum power density of 9 mW -1
RL in a 3A-1C(L) arrangement and 8 mW
-1
RL in 3A-1C(R) arrangement at 50 °C, were slightly lower to the power density of 10 mW
-1
RL obtained in 3A-2C arrangement (Fig 6.7). A similar observation was also made during
meMFC#2 operation at the syngas flow rate of 3 L -1
RL d-1, where the high gas flow rate
inhibited microbial activity. The maximum power density of 10 mW -1
RL in 3A-1C(L)
arrangement and 9 mW -1
RL 3A-1C(R) were 17 and 24 % less than the maximum power
density of 12 mW -1
RL obtained in 3A-2C arrangement (Fig. 6.6).
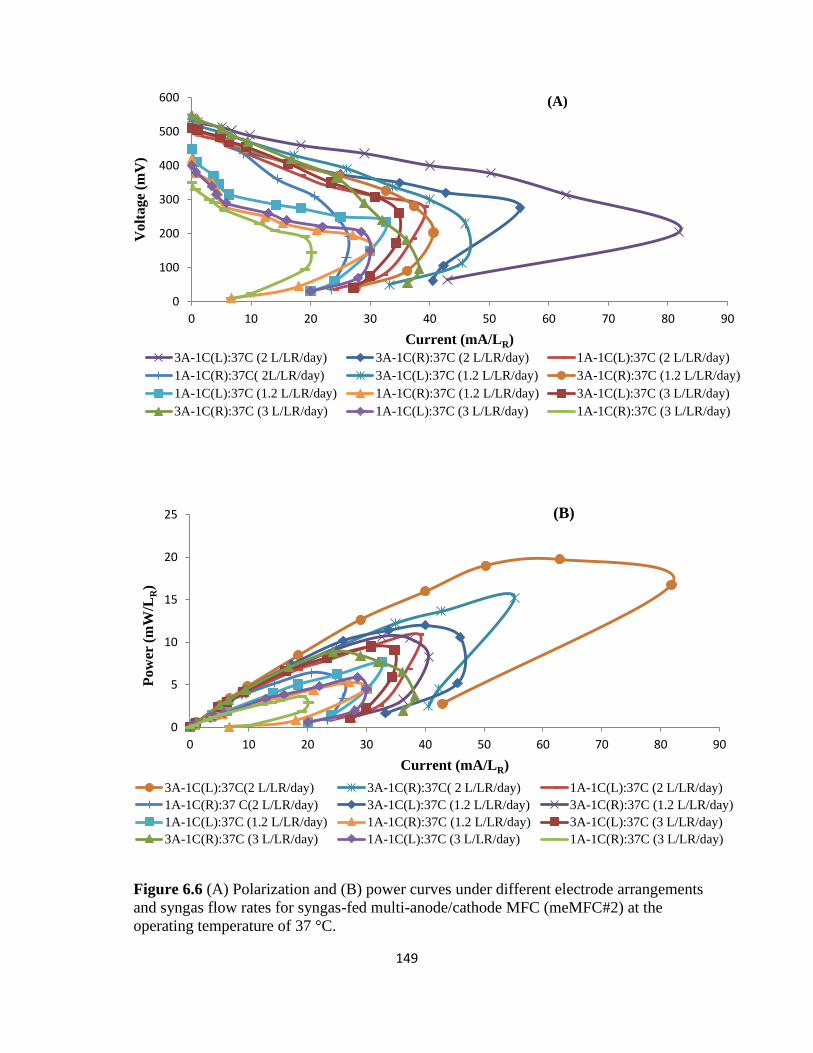
149
0
5
10
15
20
25
0 10 20 30 40 50 60 70 80 90
Pow
er (
mW
/LR)
Current (mA/LR)
3A-1C(L):37C(2 L/LR/day) 3A-1C(R):37C( 2 L/LR/day) 1A-1C(L):37C (2 L/LR/day)
1A-1C(R):37 C(2 L/LR/day) 3A-1C(L):37C (1.2 L/LR/day) 3A-1C(R):37C (1.2 L/LR/day)
1A-1C(L):37C (1.2 L/LR/day) 1A-1C(R):37C (1.2 L/LR/day) 3A-1C(L):37C (3 L/LR/day)
3A-1C(R):37C (3 L/LR/day) 1A-1C(L):37C (3 L/LR/day) 1A-1C(R):37C (3 L/LR/day)
Figure 6.6 (A) Polarization and (B) power curves under different electrode arrangements
and syngas flow rates for syngas-fed multi-anode/cathode MFC (meMFC#2) at the
operating temperature of 37 °C.
0
100
200
300
400
500
600
0 10 20 30 40 50 60 70 80 90
Vo
lta
ge
(mV
)
Current (mA/LR)
3A-1C(L):37C (2 L/LR/day) 3A-1C(R):37C (2 L/LR/day) 1A-1C(L):37C (2 L/LR/day)
1A-1C(R):37C( 2L/LR/day) 3A-1C(L):37C (1.2 L/LR/day) 3A-1C(R):37C (1.2 L/LR/day)
1A-1C(L):37C (1.2 L/LR/day) 1A-1C(R):37C (1.2 L/LR/day) 3A-1C(L):37C (3 L/LR/day)
3A-1C(R):37C (3 L/LR/day) 1A-1C(L):37C (3 L/LR/day) 1A-1C(R):37C (3 L/LR/day)
(A)
(B)
150
0
2
4
6
8
10
12
14
0 10 20 30 40 50P
ow
er (
mW
/LR)
Current (mA/LR)
3A-1C(R)/50C 1A-1C(R)/50C 3A-1C(R)/45C 1A-1C(R)/45C
Figure 6.7 (A) Polarization and (B) power curves for syngas-fed multi-anode/cathode MFC (meMFC#2) under different electrode
arrangement at operating temperatures of 45 °C and 50 °C.
0
100
200
300
400
500
600
0 10 20 30 40 50
Volt
age
(mV
)
Current (mA/LR)
3A-1C(L)/50C 1A-1C(L)/50C 3A-1C(L)/45C 1A-1C(L)/45C
0
100
200
300
400
500
600
0 10 20 30 40 50
Volt
age
(mV
)
Current (mA/LR)
3A-1C(R)/50C 1A-1C(R)/50C 3A-1C(R)/45C 1A-1C(R)/45C
0
2
4
6
8
10
12
14
0 10 20 30 40 50
Po
wer
(m
W/L
R)
Current (mA/LR)
3A-1C(L)/50C 1A-1C(L)/50C 3A-1C(L)/45C 1A-1C(L)/45C
(A)
(B)
151
Anode connection tests in meMFC#2 also confirmed the trends observed for meMFC#1,
where a reduction in the number of electrically interconnected anodes resulted in a reduction
in power densities of up to 46 % (Fig. 6.6). For instance, the power density of 11 mW -1
RL
achieved in 1A-1C(L) arrangement at 37 °C and a syngas flow rate of 2 L -1
RL d-1, was ~ 45 %
less as compared to the power output observed in 3A-1C(L) arrangement (20 mW -1
RL ).
Similarly, the power density of 8 mW -1
RL achieved in 1A-1C(R) arrangement at 37 °C was ~
46 % less as compared to the power density of 15 mW -1
RL achieved in 3A-1C(R)
arrangement at similar flow rate (Fig 6.6).
The impact of anodic area reduction in meMFC#2 was slightly more pronounced at
45 °C and 50 °C. The meMFC#2 operation in 1A-1C(R) arrangement at 50 °C resulted in
50 % decrease in power density to 4 mW -1
RL , as against 8 mW -1
RL obtained in 3A-1C(R)
arrangement (Fig.6.7). Similarly, at the operating temperature of 45 °C, the power density of
5 mW -1
RL in 1A-1C(R) arrangement was ~ 55 % lower than the power output of 12 mW -1
RL
achieved in 3A-1C(R) arrangement (Fig 6.7). The reduction in power density was even
higher during meMFC#2 operation at 37 °C at a syngas flow rate of 3 L -1
RL d-1, where the
bioelectrocatalytic activity was inhibited by the high gas flow rate. The maximum power
density of 3 mW -1
RL obtained in 1A-1C(R) arrangement was ~ 63 % lower than the power
output of 9 mW -1
RL achieved in 3A-1C(R) arrangement (Fig 6.6).

152
At the end of the electrode arrangement tests and meMFC#2 operation, test samples
were drawn from each carbon felt anode for protein analysis. A protein concentration of 0.16
mgLA−1 for anode A1, 0.12 mgLA
−1 for A2 and 0.06 mgLA−1 for A3 were obtained. Assuming
that the protein concentration is proportional to the anodic biofilm density (Gil-Carrera et al.,
2011), it can be inferred that the biofilm growth was highest at anodes (A1, A2) closest to
the cathodes, while the increased distance from the cathodes might have restricted biofilm
growth at anode A3. A reduction in anodic biofilm formation and growth upon the increased
distance from the cathode has been previously reported (Gil et al., 2003). This dependence is
related to an increased resistance to charge transport with increased electrode distances
which limits the growth of anodic microorganisms. This implies that the performance of
meMFC#2 can be further enhanced by improvements in system design and hydraulic
conditions to minimize charge transport resistance.
Several reasons can be cited to explain the enhanced efficiency of the multi-
anode/cathode configuration used in this study. First, the incorporation of multiple anodes
allowed for increased anodic packing (total volume of anodes to the total volume of the
anodic compartment). The anodic packing density of 0.75 (75 mL anode/ 100 mL anodic
compartment) for meMFC #2 was 25 % higher than the anode packing density of 0.5 (25 mL
anode/50 mL anodic chamber) for syngas-fed single anode/cathode MFCs in our previous
studies (Hussain et al., 2011b; Mehta et al., 2010). An enhanced power density and CE with
increased anodic packing due to the availability of a larger surface area for biofilm
attachment and development has been widely reported (Logan, 2008). However, an
increased anodic volume in a single-cathode configuration also leads to an increased Rint due
153
to a greater distance to the cathode, and consequently a greater mass and charge transport
resistance (Logan, 2008). Such transport limitations may have been reduced by the two-
cathode arrangement used in this study, consequently resulting in higher power outputs.
The improved performance of meMFC#2, at least at mesophilic temperatures, also
suggests that the power density up to a certain level can be enhanced by increasing the
number of cathodes while keeping the total cathode area constant. Notably, the cathode
specific area of 0.1 m2 -1
RL (geometric cathode area of 100 cm2/ total anodic compartment of
100 mL) for meMFC#2 was equal to the cathode specific area obtained for syngas-fed single
anode/cathode MFCs in our previous studies (geometric cathode area of 50 cm2/ 50 mL
anodic compartment). This observation is consistent with the study of Jian et al.(2010),
where it was demonstrated that for increasing the power production of an MFC increasing
the number of cathodes was more effective than increasing the cathodic surface area. The
same study elucidated that for MFCs with similar volumes and dimensions, a 2-
anode/cathode configuration with a total cathode area of 39 cm2 produced a considerably
higher power output of 159 mW/m3 compared to 64 mW/m3 obtained for a single-
anode/cathode configuration with an equal cathode area (39 cm2). Moreover, doubling the
cathode area to 79 cm2 with the single-anode/cathode configuration marginally increased the
power output to 87 mW/m3. It was suggested that increasing the number of cathodes allows
the electrons generated at the multiple anodes in a multi-anode/cathode configuration to
achieve much higher oxidation rates at the multiple cathodes, while limiting charge, mass
and ohmic losses associated with the increased cathode area (Jiang et al., 2010). This
phenomenon of improved power generation with an increase in the number of cathodes
154
while keeping the total cathode area constant could have considerable economic and
operational benefits for large scale MFC systems, especially considering that the high cost
of cathodes is one of the major factors governing the economic feasibility of the MFC
systems.
The meMFC#2 performance at 50 °C was limited by the low thermophilic potential of
the inoculum, which was further substantiated by the steady increase in performance in
terms of power density and CE upon the reduction of the operating temperature from 50 °C
to 37 °C. A drastic decline in power production at temperatures of 50 °C in MFCs
inoculated with mesophilic sludge having a low thermophilic potential has been previously
reported (Behera et al., 2011; Liu et al., 2011). These observations provide good evidence
that for enhanced performance at thermophilic conditions, an efficient MFC design needs to
be well complemented with an optimized microbial consortium. Low power production due
to biological constraints even after the optimization of the system architecture and design for
thermophilic operations has also been reported (Carver et al., 2011). The microbiological
activity and consequently the performance of syngas-fed meMFC at thermophilic
temperatures could be improved by suitable microbial adaptation, selection and enrichment
procedures or by directly utilizing inocula obtained from thermophilic anaerobic digesters
with conceivably high thermophilic potential. In this case, much higher power densities can
be expected due to the increased biocatalytic activity and electrochemical reaction rates at
elevated temperatures within a certain range.
Significant methane production was observed throughout meMFC#2 operation
(Table 6.2). Methanogens compete with the electricigenic microorganisms for the electron
155
donor and thereby negatively influence the Coulombic Efficiency. Similar observations were
made in our previous studies (Hussain et al., 2011b; Mehta et al., 2010) and also in the study
of Kim et al.(2005), where a 30 % increase in CE was obtained upon the utilization of a
methanogenic inhibitor. Notably, meMFC#2 was operated with a hydraulic retention time
of 5 days for improved biomass retention; this however, might have led to the retention and
proliferation of methanogens in the anodic liquid. This implies that the CE can be further
improved by the optimization of the influent flow rate to find a right balance between the
retention of the intermediates utilized for electricity production and the removal of the
planktonic methanogenic microorganisms. Methanogenesis could also be curtailed by the
development of an MFC with an engineered microbial consortium. A syngas-fed meMFC
seeded with pure cultures of CO-tolerant electricigenic microorganisms such as Geobacter
sulfurreducens (for mesophilic operation) or Thermincola ferriacetica (for thermophilic
operation), in a syntrophic relationship with carboxydotrophic and homoacetogenic
microorganisms might be capable of achieving higher power densities and correspondingly
an improved CE. A Coulombic Efficiency of ~ 97 % for a thermophilic acetate-fed MFC
inoculated with a pure culture of T. ferriacetica has been recently reported (Marshall and
May, 2009). Similarly, acetate-fed MFCs inoculated with an axenic culture of G.
sufurreducens have been reported to achieve high power densities that were comparable to
the MFCs inoculated with anaerobic sludge (Nevin et al., 2008).
156
6.5 Conclusion
This study demonstrates electricity generation in a multi-anode/cathode MFC fed with
syngas, and systematically elucidates the impact of the operating temperature and electrode
arrangement on system performance. The adoption of a multi-electrode design effectively
enhanced the performance of syngas-fed MFC with a small operational space requirement.
The power output of 33 mW -1
RL and CE of 43 % obtained at 37 °C in this study, is the
highest observed for any mesophilic syngas-fed MFC. The MFC performance at 50 °C was
restricted by the low biocatalytic activity, which implies that for an enhanced system
performance under thermophilic conditions an efficient system design needs to be well
complemented with an optimized biological system.
The MFC performance was greatly affected by the electrode arrangement, with the
highest power being achieved in a 3A-2C electrode arrangement. A reduction in power
density upon reducing the number of electrically connected cathodes was more pronounced
under optimal operating conditions, whereas reducing the number of anodes had a much
greater impact under conditions limited by microbial activity.
An improvement in the anodic design, hydraulic conditions and biological system to
restrict methanogenesis and mass and charge transport related resistance may further
enhance the performance of a syngas-fed multi-anode/cathode MFC. Also, to our knowledge,
this is the first study where MnO2 based cathodes were used in a syngas-fed MFC. The
absence of any visible CO-related inhibition of the MnO2 cathode suggests that this non-
noble cathode can be utilized to reduce the MFC construction costs.

157
6.6 References
Ahn, Y., Logan, B. 2012. A multi-electrode continuous flow microbial fuel cell with
separator electrode assembly design. Appl Microbiol Biotechnol, 93, 2241-2248.
Behera, M., Murthy, S., Ghangrekar, M. 2011. Effect of operating temperature on
performance of microbial fuel cell. Water sci technol, 64, 917-922.
Carver, S.M., Vuoriranta, P., Tuovinen, O.H. 2011. A thermophilic microbial fuel cell
design. J Power Sources, 196, 3757-3760.
Fan, Y., Hu, H., Liu, H. 2007. Enhanced Coulombic efficiency and power density of air-
cathode microbial fuel cells with an improved cell configuration. J Power Sources, 171,
348-354.
Gil-Carrera, L., Mehta, P., Escapa, A., Morán, A., García, V., Guiot, S.R., Tartakovsky, B.
2011. Optimizing the electrode size and arrangement in a microbial electrolysis cell.
Bioresource Technology, 102, 9593-9598.
Gil, G.-C., Chang, I.-S., Kim, B.H., Kim, M., Jang, J.-K., Park, H.S., Kim, H.J. 2003.
Operational parameters affecting the performannce of a mediator-less microbial fuel
cell. Biosensors and Bioelectronics, 18, 327-334.
Guiot, S., Cimpoia, R., Carayon, G. 2011. Potential of Wastewater-Treating Anaerobic
Granules for Biomethanation of Synthesis Gas. Environ Sci Technol, 45, 2006-2012.
Hussain, A., Guiot, S., Mehta, P., Raghavan, V., Tartakovsky, B. 2011a. Electricity
generation from carbon monoxide and syngas in a microbial fuel cell. Appl Microbiol
Biotechnol, 90, 827-836.
Hussain, A., Mehta, P., Raghavan, V., Wang, H., Guiot, S., Tartakovsky, B. 2012. The
performance of a thermophilic microbial fuel cell fed with synthesis gas. Enzyme
Microb Technol, 51, 163-170.
Hussain, A., Tartakovsky, B., Guiot, S.R., Raghavan, V. 2011b. Use of silicone membranes
to enhance gas transfer during microbial fuel cell operation on carbon monoxide.
Bioresour Technol, 102, 10898-10906.
Ieropoulos, I., Greenman, J., Melhuish, C. 2008. Microbial fuel cells based on carbon veil
electrodes: Stack configuration and scalability. Int J Energy Res, 32, 1228-1240.
Ieropoulos, I., Winfield, J., Greenman, J. 2010. Effects of flow-rate, inoculum and time on
the internal resistance of microbial fuel cells. Bioresource Technol, 101, 3520-3525.
158
Jiang, D., Curtis, M., Troop, E., Scheible, K., McGrath, J., Hu, B., Suib, S., Raymond, D., Li,
B. 2011. A pilot-scale study on utilizing multi-anode/cathode microbial fuel cells (MAC
MFCs) to enhance the power production in wastewater treatment. Int J.Hydrogen Energ,
36, 876-884.
Jiang, D., Li, X., Raymond, D., Mooradain, J., Li, B. 2010. Power recovery with multi-
anode/cathode microbial fuel cells suitable for future large-scale applications. Int J
Hydrogen Energ, 35, 8683-8689.
Kim, J.R., Min, B., Logan, B.E. 2005. Evaluation of procedures to acclimate a microbial
fuel cell for electricity production. Appl. Microbiol. Biotechnol., 68, 23-30.
Liu, Y., Climent, V., Berná, A., Feliu, J.M. 2011. Effect of Temperature on the Catalytic
Ability of Electrochemically Active Biofilm as Anode Catalyst in Microbial Fuel Cells.
Electroanalysis, 23, 387-394.
Logan, B. 2008. Microbial Fuel Cells. John Wiley & Sons Inc., Hoboken, NJ, USA.
Marshall, C.W., May, H.D. 2009. Electrochemical evidence of direct electrode reduction by
a thermophilic Gram-positive bacterium, Thermincola ferriacetica. Energy Environ Sci,
2, 699-705.
McKendry, P. 2002. Energy production from biomass (part 1): overview of biomass.
Bioresource Technology, 83, 37-46.
Mehta, P., Hussain, A., Raghavan, V., Neburchilov, V., Wang, H., Tartakovsky, B., Guiot, S.
2010. Electricity generation from a carbon monoxide in a single chamber microbial fuel
cell. Enzyme Microb Technol, 46, 450-455.
Neburchilov, V., Mehta, P., Hussain, A., Raghavan, V., Wang, H., Guiot, S., Tartakovsky, B.
2011. Microbial Fuel Cell Operation On Carbon Monoxide: Cathode Catalyst Selection.
Int J Hydrogen Energ, 36, 11929-11935.
Nevin, K.P., Richter, H., Covalla, S.F., Johnson, J.P., Woodard, T.L., Orloff, A.L., Jia, H.,
Zhang, M., Lovley, D.R. 2008. Power output and columbic efficiencies from biofilms
of Geobacter sulfurreducens comparable to mixed community microbial fuel cells.
Environ Microbiol, 10, 2505-2514.
Pinto, R.P., Srinivasan, B., Guiot, S.R., Tartakovsky, B. 2011. The effect of real-time
external resistance optimization on microbial fuel cell performance. Water Res, 45,
1571-1578.
Pinto, R.P., Srinivasan, B., Manuel, M.F., Tartakovsky, B. 2010. A two-population bio-
electrochemical model of a microbial fuel cell. Bioresource Technol, 101, 5256-5265.
159
Tartakovsky, B., Manuel, M.F., Neburchilov, V., Wang, H., Guiot, S.R. 2008. Biocatalyzed
hydrogen production in a continuous flow microbial fuel cell with a gas phase cathode.
J. Power Sources, 182, 291-297.
Woodward, L., Tartakovsky, B., Perrier, M., Srinivasan, B. 2009. Maximizing power
production in a stack of microbial fuel cells using multiunit optimization method.
Biotechnol Prog, 25, 676-682.
Zhang, P., Liu, Z. 2010. Experimental study of the microbial fuel cell internal resistance. J
Power Sources, 195, 8013-8018.
Zhuang, L., Zhou, S. 2009. Substrate cross-conduction effect on the performance of serially
connected microbial fuel cell stack. Electrochemistry Communications, 11, 937-940.

160
CHAPTER 7
General Summary, Novelty and Recommendations for future Research
Carbon monoxide and synthesis gas conversion to electricity in an MFC represents
an ingenious yet simple technology for sustainable energy production from biomass which
promises high transformation efficiency. Besides low environmental impact and efficient
utilization of indigenous resources, CO/syngas conversion to electricity in an MFC may
offer several advantages including higher durability, ease of operation and maintenance, and
an effective platform for decentralized electricity production which could have major impact
on the socio-economic development of the rural sectors across the globe. CO/syngas fed-
MFCs are currently at an early developmental stage with only two exploratory studies been
conducted prior to this thesis. A number of challenges pertaining to microbiology,
electrochemistry, mass transfer and reactor design need to be addressed before the full
potential of this technology can be realised. The studies performed in this thesis addressed
two such challenges; first, the improvements in the reactor design and operating conditions
to enhance gas-liquid mass transfer and system performance on CO/syngas, and second, the
understanding of the biochemical pathways and microbiology driving electricity generation
in a CO/syngas-fed MFC.
In this thesis, Chapter 1 and Chapter 2 (Hussain et al., 2011a), introduced the
concept of electricity production from CO/syngas in an MFC and elaborated on the
principles governing MFC operation. Various microbial communities including homo-

161
acetogens, acetogenic and hydrogenogenic carboxydotrophs, novel metal-reducing
carboxydotrophs and other engineered consortia that could be utilized for efficient
CO/syngas transformation and electricity generation were reviewed. Besides the
microbiological consortium, the two chapters also reviewed and proposed various reactor
designs and membrane systems suitable for improving MFC performance on CO/syngas and
enhancing gas-liquid mass transfer. The ability of silicone membrane systems to efficiently
transfer CO into the anodic liquid of an MFC was demonstrated in Chapter 3 (Hussain et al.,
2011b). The use of flat silicone membrane system and thin wall silicone tubing efficiently
enhanced the mass transfer with reduced reactor volumes, correspondingly resulting in
enhanced CO transformation efficiency and improved volumetric power output.
The microbial communities enriched at the anode of two mesophilic CO-fed MFC and
the biotransformation pathways involved in electricity generation were studied in Chapter 4.
The identification of the microorganisms belonging to the genera Geobacter, Desulfovibrio,
and Clostridium, along with the validated ability of pure cultures of Geobacter
sulfurreducens to grow in 100 % CO atmosphere, affirmed that electricity production from
CO/syngas in a mesophilic MFC dominantly takes place by a two-step process: CO is first
converted to acetate, which is then oxidized by CO-tolerant electricigenic bacteria such as G.
sulfurreducens for electricity production. A similar pathway of electricity production by a
tight collaboration amongst interdependent and competing bacterial species collectively
contributing to the consortium and catalyzing CO/syngas conversion to electricity was also
observed at thermophilic temperatures. The analyses of the microbial communities and
metabolic products of the syngas-fed MFC in Chapter 5 (Hussain et al., 2012), indicated the

162
existence of several concurrent pathways leading to electricity production under
thermophilic conditions. Similar to the observations at mesophilic temperatures, electricity
production under thermophilic conditions also involved syngas conversion to acetate by
thermophilic homo-acetogens and acetogenic carboxydotrophs, followed by acetate
oxidation by CO-tolerant electricigenic microorganisms. Efficient syngas transfer into the
anodic liquid with the utilization of silicone membranes, and increased microbial catalytic
activity at thermophilic conditions led to much higher power density, Coulombic efficiency
and improved syngas transformation efficiency as compared to the mesophilic syngas-fed
MFC in Chapter 3.
Finally in Chapter 6, the MFC design was further improved by the development of a
multi-anode/cathode MFC comprised of three anodes and two cathodes. The ability of the
multi-electrode design to achieve high volumetric efficiencies on syngas was examined at
several operating temperatures and anode-cathode arrangements. Due to the improved
design, the multi-electrode approach considerably increased the power output and
Coulombic efficiency. The maximum power output and Coulombic efficiency was achieved
under mesophilic conditions. The MFC performance at elevated temperatures was restricted
by the low thermophilic potential of the mesophilic inoculum. MFC power output was also
greatly impacted by the anode-cathode arrangement with the highest power output being
achieved by electrically interconnecting all anodes and cathodes. Reduction in number of
interconnected cathodes or/and anodes considerably decreased the power density. The extent
of this decrease was found to be dependent upon the operating condition and microbial
activity. Reduction in power density upon decreasing the number of interconnected cathodes
163
was more pronounced under optimal operating conditions, whereas anode reduction had a
much greater impact under conditions limited by microbial activity.
7.1 Novelty and contribution to knowledge
This thesis presents the first detailed study of the microbiological interactions
associated with CO/syngas conversion to electricity in an MFC and the reactor design
improvements thereof. The outcome of this comprehensive study has contributed to our
knowledge in several ways related to scientific and engineering/application challenges. The
following are a few of the several commendable contributions of this research.
1. Low aqueous solubility of carbon monoxide and hydrogen is one of the major limiting
factors in the efficient utilization and biotransformation of these gaseous substrates. The
ability of relatively inexpensive silicone membrane systems to efficiently transfer
CO/syngas into the anodic liquid of an MFC under mesophilic and thermophilic
conditions offers a tangible solution to this engineering challenge, which may not only
assist in the future development and optimization of CO/syngas-fed MFCs, but also in
the microbiological conversion of CO/syngas to biofuels/bioproducts.
2. This study for the first time elucidated the microbial communities and biotransformation
pathways involved in CO/syngas conversion to electricity under mesophilic and
thermophilic conditions. Also, syngas dependent bioelectrochemical activity at
thermophilic temperatures was demonstrated for the first time. Given that electricity
production in an MFC is governed by biological activity, the results obtained in this
study play a crucial role for understanding and optimization of the microbiological

164
process and the MFC performance using CO/syngas. In addition, the identified
microbial communities may further assist in the understanding of carbon monoxide-
dependent energy metabolism, microbe-electrode interactions and ecophysiological
features of mesophilic and thermophilic homo-acetogens and carboxydotrophs.
3. We demonstrated the ability of pure cultures of Geobacter sulfurreducens to grow in
100 % CO atmosphere. This previously unknown physiology of G. sulfurreducens, may
further assist in the optimization of the microbiological constortium of CO/syngas-fed
MFCs. G. sulfurreducens have been widely utilized for electricity production in MFCs
with high Coulombic efficiency. Axenic cultures of this microorganism in syntrophic
relationship with homo-acetogens and carboxydotrophs may also result in increased
power outputs and Coulombic efficiency on CO/syngas. The ability of G.
sulfurreducens to grow in 100 % CO atmosphere may also contribute in the
advancement of studies focusing on the utilization of this microorganism for
environmental decontamination and desulfurization with CO/syngas serving as the
electron donor.
4. This study also presented the development of several reactor designs including multi-
anode/cathode MFC for improved performance on CO/syngas under mesophilic and
thermophilic conditions. These reactor designs may be used in the future for continued
enhancement of this technology, and may result in the development of stackable MFCs
capable of efficient operation on CO/syngas and with power outputs suitable for
commercial applications. The reactor configurations presented herein may also be
extended for addressing reactor design issues for CO/syngas fermentation.
165
7.2 Recommendations for further research
This study presented the reactor designs that can be utilized for improving MFC
performance on CO/syngas. In addition the complex microbial interactions and
biotransformation pathways involved in electricity production from CO/syngas were also
elucidated. Commercial applications of CO/syngas-fed MFCs would require much higher
volumetric efficiencies, which in turn would require further analysis and optimization of
process microbiology, operating conditions and reactor design. Some of the
recommendations for future research are as follows:
1. Methanogenesis presents one of the major barriers to achieving high Coulombic
efficiency and power output in CO/syngas-fed MFCs. Methanogens compete with the
electricigens for electron donor and use electron acceptors which does not result in
electricity production. Such alternative metabolism could be curtailed by the pre-
treatment of the inocula and the optimization of the auxiliary operating conditions such
as pH and hydraulic retention time. The optimization of the influent flow rate to find a
right balance between the retention of the intermediates and wash out/removal of
planktonic methanogenic microorganisms may result in higher power outputs and
correspondingly higher Coulombic efficiency.
2. Alternative metabolisms that do not result in electricity production could also be limited
by the development of an MFC with an engineered microbial consortium. Future studies
could focus on the development of a CO/syngas-fed MFC seeded with pure cultures of
CO-tolerant electricigenic microorganisms such as G. sulfurreducens, which in a

166
syntrophic relationship with pure cultures carboxydotrophic and homoacetogenic
microorganisms might be capable of achieving higher power densities.
3. Future studies might focus on testing other gas diffusion membranes with a high affinity
for CO and H2 or the development of CO/syngas-fed columnar MFC reactors such as
bubble column, trickle bed, and airlift reactors that could offer improved gas transport
with small reactor volume. Improved gas transfer may also allow for focusing on the
process microbiology, which could lead to the isolation of novel electricigenic
carboxidotrophic microorganisms.
4. Further studies could also be focused on the investigation and analysis of recently
isolated novel metal reducing carboxydotrophic microorganisms to generate electricity
in a CO-fed MFC. Bacteria such as Geobacter sulfurreducens, G. Metallireducens,
Desulfobulbus propionicus etc, capable of metal reduction have been widely used to
produce electricity in an acetate and waste water-fed MFC with high Coulombic
efficiency. Metal reducing microorganisms such as Thermosinus carboxydivorans,
Carboxydothermus ferrireducens, Thermincola ferriacetica, etc. which are capable of
utilizing Fe(III) as the final electron acceptor with CO serving as the sole source of
energy, may also be capable of generating electricity in a CO-fed MFC with high
Coulombic efficiency.
5. The task of process and design optimization of a CO/syngas-fed MFC could also be
facilitated by process modelling. Development of bio-electrochemical models
analyzing/describing anodic biofilm formation, species distribution and competition
among methogenic, carboxydotrophic, and electricigenic microorganisms may allow for
167
a deeper understanding of MFC operation on CO/syngas and assist in identifying and
circumventing major limitations.
6. Practical applications of CO/syngas-fed MFCs would conceivably require the stacking
of multiple large-scale MFC systems with a multi-anode/cathode configuration operated
under continuous flow conditions. Future research could be focused on developing
CO/syngas-fed stack configurations capable of achieving high volumetric efficiencies.
Proposed design for a fluidically bridged stack comprising two individual multi-
electrode MFCs is provided in Fig. 7.1. The MFCs in the stack configuration may share
a common gas and influent passage as shown in the figure below. This design might
help to avoid the requirement of an extensive distribution system to pump the substrate
gas and influent individually to different reactors and thereby allowing easy
construction and implementation of scale-up systems.

168
Figure 7.1 Proposed experimental design of a two MFC stack configuration for operation
on CO/syngas.
CO
H2
BC
utrients
MFC-2
MFC-1
R1 R2
A
N
O
D
E
A
N
O
D
E
A
N
O
D
E
A
N
O
D
E
Data Acquisition
and Control
C
A
T
H
O
D
E
C
A
T
H
O
D
E
C
A
T
H
O
D
E
C
A
T
H
O
D
E
Manometer
Effluent
Liquid Recirculation
Liquid Recirculation
Recirculation
Silicon Tube
Silicon Tube
BC
BC

169
7.3 List of References
Ahmed, T., Semmens, M.J. 1992. Use of sealed end hollow fibers for bubbleless
membrane aeration: experimental studies. J Membr Sci, 69, 1-10.
Ahn, Y., Logan, B. 2012. A multi-electrode continuous flow microbial fuel cell with
separator electrode assembly design. Appl Microbiol Biotechnol, 93, 2241-2248.
Balk, M., van Gelder, T., Weelink, S.A., Stams, A.J.M. 2008. (Per)chlorate Reduction by
the Thermophilic Bacterium Moorella perchloratireducens sp. nov., Isolated from
Underground Gas Storage. Appl Environ Microbiol, 74, 403-409.
Baschuk, J.J., Li, X. 2001. Carbon monoxide poisoning of proton exchange membrane
fuel cells. Int J Energ Res, 25, 695-713.
Behera, M., Murthy, S., Ghangrekar, M. 2011. Effect of operating temperature on
performance of microbial fuel cell. Water sci technol, 64, 917-922.
Bernalier, A., Willems, A., Leclerc, M., Rochet, V., Collins, M.D. 1996. Ruminococcus
hydrogenotrophicus sp. nov., a new H2/CO2-utilizing acetogenic bacterium
isolated from human feces. Arch Microbiol, 166, 176-183.
Birry, L., Mehta, P., Jaouen, F., Dodelet, J.P., Guiot, S.R., Tartakovsky, B. 2010.
Application of iron-based cathode catalysts in a microbial fuel cell. Electrochim
Acta, 56, 1505-1511.
Bond, D.R., Lovley, D.R. 2003. Electricity Production by Geobacter sulfurreducens
Attached to Electrodes. Appl Environ Microbiol, 69, 1548-1555.
Brandis, A., Thauer, R.K. 1981. Growth of Desulfovibrio species on Hydrogen and
Sulphate as Sole Energy Source. J. Gen. Microbiol., 126, 249-252.
Braun, M., Gottschalk, G. 1982. Acetobacterium Wieringae sp. nov., a new species
producing acetic acid from molecular hydrogen and carbon dioxide Zentralbl
Bakteriol Microbiol Hyg C3, 368-376.
Braun, M., Mayer, F., Gottschalk, G. 1981. Clostridium aceticum (Wieringa), a
microorganism producing acetic acid from molecular hydrogen and carbon
dioxide. Arch Microbiol, 128, 288-293.
Bredwell, M.D., Srivastava, P., Worden, R.M. 1999. Reactor Design Issues for Synthesis-
Gas Fermentations. Biotechnol Prog, 15, 834-844.
Bridgwater, T. 2006. Biomass for energy. J Sci Food Agriculture, 86, 1755-1768.
170
Carver, S.M., Vuoriranta, P., Tuovinen, O.H. 2011. A thermophilic microbial fuel cell
design. J Power Sources, 196, 3757-3760.
Charpentier, J.C. 1981. Advances in Chemical Engineering. Elsevier, NY, USA.
Chaudhuri, S.K., Lovley, D.R. 2003. Electricity generation by direct oxidation of glucose
in mediatorless microbial fuel cells. Nat Biotech, 21, 1229-1232.
Chen, C., Macarie, H., Ramirez, I., Olmos, A., Ong, S.L., Monroy, O., Liu, W.-T. 2004.
Microbial community structure in a thermophilic anaerobic hybrid reactor
degrading terephthalate. Microbiology, 150, 3429-3440.
Cheng, S., Liu, H., Logan, B.E. 2005. Power Densities Using Different Cathode Catalysts
(Pt and CoTMPP) and Polymer Binders (Nafion and PTFE) in Single Chamber
Microbial Fuel Cells. Environ Sci Technol, 40, 364-369.
Chisti, Y., Kasper, M., Moo-Young, M. 1990. Mass transfer in external-loop airlift
bioreactors using static mixers. Can J Chem Eng, 68, 45-50.
Choi, Y. 2004. Construction of microbial fuel cells using thermophilic microorganisms,
Bacillus licheniformis and Bacillus thermoglucosidasius. Bull Korean Chem Soc,
25, 813-818.
Côté, P., Bersillon, J.-L., Huyard, A. 1989. Bubble-free aeration using membranes: mass
transfer analysis. J Membr Sci, 47, 91-106.
Côté, P., Bersillon, J.-L., Huyard, A., Faup, G. 1988. Bubble-Free Aeration Using
Membranes: Process Analysis. Res J Water Pollut C, 60, 1986-1992.
Croese, E., Pereira, M., Euverink, G.J.W., Stams, A., Geelhoed, J.S. 2011. Analysis of the
microbial community of the biocathode of a hydrogen-producing microbial
electrolysis cell. Appl Microbiol Biotechnol, 82, 1083-1093.
Daniel, S.L., Hsu, T., Dean, S.I., Drake, H.L. 1990. Characterization of the H2 and CO-
dependent chemolithotrophic potentials of the acetogens Clostridium
thermoaceticum and Acetogenium kivui. J Bacteriol, 172, 4464-4471.
Daniels, L., Fuchs, G., Thauer, R.K., Zeikus, J.G. 1977. Carbon Monoxide Oxidation by
Methanogenic Bacteria. J Bacteriol, 132, 118-126.
Davidova, M., Tarasova, N., Mukhitova, F., Karpilova, I. 1994. Carbon monoxide in
metabolism of anaerobic bacteria. Can J Microbiol, 40,417-425.

171
Demirbas, A. 2001. Biomass resource facilities and biomass conversion processing for
fuels and chemicals. Energ Convers Manag, 42, 1357-1378.
Demirbas, A. 2007. Progress and recent trends in biofuels. Progr Energ Combust Sci, 33,
1-18.
Di Lorenzo, M., Scott, K., Curtis, T.P., Head, I.M. 2010. Effect of increasing anode
surface area on the performance of a single chamber microbial fuel cell. Chem.
Eng. J, 156, 40-48.
Drake, H.L., Daniel, S.L. 2004. Physiology of the thermophilic acetogen Moorella
thermoacetica. Res Microbiol, 155, 869-883.
Drew, T.B. 1981. Adances in Chemical Engineering. Elsevier, NY,USA.
Ellenberger, J., Krishna, R. 2003. Shaken, not stirred, bubble column reactors:
Enhancement of mass transfer by vibration excitement. Chem Eng Sci, 58, 705-
710.
Ercolini, D. 2004. PCR-DGGE fingerprinting: novel strategies for detection of microbes
in food. J. Microbiol. Methods, 56, 297-314.
Faaij, A., van Ree, R., Waldheim, L., Olsson, E., Oudhuis, A., van Wijk, A., Daey-
Ouwens, C., Turkenburg, W. 1997. Gasification of biomass wastes and residues
for electricity production. Biomass Bioenerg, 12, 387-407.
Fadavi, A., Chisti, Y. 2005. Gas-liquid mass transfer in a novel forced circulation loop
reactor. Chem Eng J, 112, 73-80.
Fan, Y., Hu, H., Liu, H. 2007. Enhanced Coulombic efficiency and power density of air-
cathode microbial fuel cells with an improved cell configuration. J Power Sources,
171, 348-354.
Ferreira, A., Ferreira, C., Teixeira, J.A., Rocha, F. 2010. Temperature and solid properties
effects on gas–liquid mass transfer. Chemical Eng J, 162, 743-752.
Fonknechten, N., Chaussonnerie, S., Tricot, S., Lajus, A., Andreesen, J., Perchat, N.,
Pelletier, E., Gouyvenoux, M., Barbe, V., Salanoubat, M., Le Paslier, D.,
Weissenbach, J., Cohen, G., Kreimeyer, A. 2010. Clostridium sticklandii, a
specialist in amino acid degradation:revisiting its metabolism through its genome
sequence. BMC Genomics, 11, 555.
Gariépy, Y., Raghavan, G.S.V., Munroe, J.A. 1994. Long-term storage of leek stalks
under regular and controlled atmospheres. Int J Refrig, 17, 140-144.
172
Gavrilescu, M., Roman, R.V., Tudose, R.Z. 1997. Hydrodynamics in external-loop airlift
bioreactors with static mixers. Bioproc Biosystems Eng, 16, 93-99.
Genthner, B.R.S., Bryant, M.P. 1987. Additional characteristics of one-carbon-compound
utilization by Eubacterium limosum and Acetobacterium woodii. Appl Environ
Microbiol, 53, 471-476.
Gil, G.-C., Chang, I.-S., Kim, B.H., Kim, M., Jang, J.-K., Park, H.S., Kim, H.J. 2003.
Operational parameters affecting the performannce of a mediator-less microbial
fuel cell. Biosensors and Bioelectronics, 18, 327-334.
Gil-Carrera, L., Mehta, P., Escapa, A., Morán, A., García, V., Guiot, S.R., Tartakovsky, B.
2011. Optimizing the electrode size and arrangement in a microbial electrolysis
cell. Bioresource Technology, 102, 9593-9598.
Greene, A.C., Patel, B.K.C., Sheehy, A.J. 1997. Deferribacter thermophilus gen. nov., sp.
nov., a Novel Thermophilic Manganese- and Iron-Reducing Bacterium Isolated
from a Petroleum Reservoir. Int J Syst Bacteriol, 47, 505-509.
Guiot, S., Cimpoia, R., Carayon, G. 2011. Potential of Wastewater-Treating Anaerobic
Granules for Biomethanation of Synthesis Gas. Environ. Sci. Technol., 45, 2006-
2012.
HaoYu, E., Cheng, S., Logan, B., Scott, K. 2009. Electrochemical reduction of oxygen
with iron phthalocyanine in neutral media. . J Appl Electrochem, 39, 705-711.
Harnisch, F., Wirth, S., Schröder, U. 2009. Effects of substrate and metabolite crossover
on the cathodic oxygen reduction reaction in microbial fuel cells: Platinum vs.
iron(II) phthalocyanine based electrodes. Electrochem Communications, 11, 2253-
2256.
Henstra, A., Sipma, J., Rinzema, A., Stams, J. 2007. Microbiology of synthesis gas
fermentation for biofuel production. Current Opinion Biotechnol, 18, 200-206.
Henstra, A.M., Stams, A.J.M. 2004. Novel Physiological Features of Carboxydothermus
hydrogenoformans and Thermoterrabacterium ferrireducens. Appl Environ
Microbiol, 70, 7236-7240.
Herrmann, I., Kramm, U.I., Fiechter, S., Bogdanoff, P. 2009. Oxalate supported pyrolysis
of CoTMPP as electrocatalysts for the oxygen reduction reaction. Electrochimica
Acta, 54, 4275-4287.
Hickey, R., Datta, R., Tsai, s.-P., Basu, R. 2008. Memrane supported bioreactor for
conversion of syngas components to liquid products, (Ed.) U.S.P. Publication, Vol.
US 200/0305539 A1. US, pp. 1-5.
173
Houten, B., Meulepas, R., Doesburg, W., Smidt, H., Muyzer, G., Stams, A. 2009.
Desulfovibrio paquesii sp. nov., a hydrogenotrophic sulfate-reducing bacterium
isolated from a synthesis-gas-fed bioreactor treating zinc- and sulfate-rich
wastewater. Int. J. Syst. Evol. Microbiol., 59, 229-233.
Hussain, A., Guiot, S., Mehta, P., Raghavan, V., Tartakovsky, B. 2011. Electricity
generation from carbon monoxide and syngas in a microbial fuel cell. Appl
Microbiol Biotechnol, 90, 827-836.
Hussain, A., Mehta, P., Raghavan, V., Wang, H., Guiot, S., Tartakovsky, B. 2012. The
performance of a thermophilic microbial fuel cell fed with synthesis gas. Enzyme
Microb Technol., 51, 163-170.
Hussain, A., Tartakovsky, B., Guiot, S.R., Raghavan, V. 2011. Use of silicone
membranes to enhance gas transfer during microbial fuel cell operation on carbon
monoxide. Bioresour Technol, 102, 10898-10906.
Ieropoulos, I., Greenman, J., Melhuish, C. 2008. Microbial fuel cells based on carbon veil
electrodes: Stack configuration and scalability. Inter J Energy Res, 32, 1228-1240.
Ieropoulos, I., Winfield, J., Greenman, J. 2010. Effects of flow-rate, inoculum and time
on the internal resistance of microbial fuel cells. Bioresource Technol, 101, 3520-
3525.
Imachi, H., Aoi, K., Tasumi, E., Saito, Y., Yamanaka, Y., Saito, Y., Yamaguchi, T.,
Tomaru, H., Takeuchi, R., Morono, Y., Inagaki, F., Takai, K. 2011. Cultivation of
methanogenic community from subseafloor sediments using a continuous-flow
bioreactor. ISME J, 1, 1-13.
Ishii, S.i., Watanabe, K., Yabuki, S., Logan, B.E., Sekiguchi, Y. 2008. Comparison of
Electrode Reduction Activities of Geobacter sulfurreducens and an Enriched
Consortium in an Air-Cathode Microbial Fuel Cell. Appl Environ Microbiol, 74,
7348-7355.
Jasinski, R. 1964. A new fuel cell cathode Catalyst. Nature, 201, 1212-1213.
Jiang, D., Curtis, M., Troop, E., Scheible, K., McGrath, J., Hu, B., Suib, S., Raymond, D.,
Li, B. 2011. A pilot-scale study on utilizing multi-anode/cathode microbial fuel
cells (MAC MFCs) to enhance the power production in wastewater treatment. Int
J.Hydrogen Energ, 36, 876-884.
Jiang, D., Li, X., Raymond, D., Mooradain, J., Li, B. 2010. Power recovery with multi-
anode/cathode microbial fuel cells suitable for future large-scale applications. Int
J Hydrogen Energ, 35, 8683-8689.
174
Jong, B.C., Kim, B.H., Chang, I.S., Liew, P.W.Y., Choo, Y.F., Kang, G.S. 2006.
Enrichment, Performance, and Microbial Diversity of a Thermophilic
Mediatorless Microbial Fuel Cell. Environ Sci Technol, 40, 6449-6454.
Jung, S., Regan, J. 2007. Comparison of anode bacterial communities and performance in
microbial fuel cells with different electron donors. Appl Microbiol Biotechnol,
77(2), 393-402.
Kaksonen, A.H., Plumb, J.J., Franzmann, P.D., Puhakka, J.A. 2004. Simple organic
electron donors support diverse sulfate-reducing communities in fluidized-bed
reactors treating acidic metal- and sulfate-containing wastewater. FEMS
Microbiol Ecol, 47, 279-289.
Kashefi, K., Holmes, D.E., Baross, J.A., Lovley, D.R. 2003. Thermophily in the
Geobacteraceae: Geothermobacter ehrlichii gen. nov., sp. nov., a Novel
Thermophilic Member of the Geobacteraceae from the "Bag City" Hydrothermal
Vent. Appl. Environ. Microbiol., 69, 2985-2993.
Kashefi, K., Lovley, D.R. 2000. Reduction of Fe(III), Mn(IV), and Toxic Metals at 100 C
by Pyrobaculum islandicum. Appl Environ Microbiol, 66, 1050-1056.
Kerby, R., Zeikus, J.G. 1983. Growth ofClostridium thermoaceticum on H2/CO2 or CO
as energy source. Curr Microbiol, 8, 27-30.
Kim, D., Chang, I. 2009. Electricity generation from synthesis gas by microbial processes:
CO fermentation and microbial fuel cell technology. Bioresour Technol, 100,
4527-4530.
Kim, J.R., Min, B., Logan, B.E. 2005. Evaluation of procedures to acclimate a microbial
fuel cell for electricity production. Appl Microbiol Biotechnol, 68, 23-30.
Klasson, K., Ackerson, C., Clausen, E., Gaddy, J. 1992. Biological conversion of
synthesis gas into fuels. Int J Hydrogen Energ, 17, 281-288.
Kobayashi, H., Endo, K., Sakata, S., Mayumi, D., Kawaguchi, H., Ikarashi, M.,
Miyagawa, Y., Maeda, H., Sato, K. 2011. Phylogenetic diversity of microbial
communities associated with the crude-oil, large-insoluble-particle and formation-
water components of the reservoir fluid from a non-flooded high-temperature
petroleum reservoir. J Biosci Bioeng.
Krichnavaruk, S., Pavasant, P. 2002. Analysis of gas-liquid mass transfer in an airlift
contactor with perforated plates. Chem Eng J, 89, 203-211.
Kumar, A., Dewulf, J., Van Langenhove, H. 2008. Membrane-based biological waste gas
treatment. Chem Eng J, 136, 82-91.
175
Larrosa-Guerrero, A., Scott, K., Head, I.M., Mateo, F., Ginesta, A., Godinez, C. 2010.
Effect of temperature on the performance of microbial fuel cells. Fuel, 89, 3985-
3994.
Lee, J., Phung, N.T., Chang, I.S., Kim, B.H., Sung, H.C. 2003. Use of acetate for
enrichment of electrochemically active microorganisms and their 16S rDNA
analyses. FEMS Microbiol Lett, 223, 185-191.
Lefebvre, O., Ha Nguyen, T.T., Al-Mamun, A., Chang, I.S., Ng, H.Y. 2010. T-RFLP
reveals high β-Proteobacteria diversity in microbial fuel cells enriched with
domestic wastewater. J Appl Microbiol, 109, 839-850.
Lefebvre, O., Uzabiaga, A., Chang, I., Kim, B.-H., Ng, H. 2010. Microbial fuel cells for
energy self-sufficient domestic wastewater treatment—a review and discussion
from energetic consideration. Appl Microbiol Biotechnol, 89, 1-12.
Lens, P., Vallerol, M., Esposito, G., Zandvoort, M. 2002. Perspectives of sulfate reducing
bioreactors in environmental biotechnology. Rev Environ Sci Biotechnol, 1, 311-
325.
Lide, D., Frederickse, H. 1995. Handbook of Chemistry and Physics. 76 ed. CRC Press
Inc., Boca Raton, FL.
Liu, H., Logan, B.E. 2004. Electricity Generation Using an Air-Cathode Single Chamber
Microbial Fuel Cell in the Presence and Absence of a Proton Exchange Membrane.
Environ Sci Technol, 38, 4040-4046.
Liu, R., Li, D., Gao, Y., Zhang, Y., Wu, S., Ding, R., Hesham, A.E.-L., Yang, M. 2010.
Microbial diversity in the anaerobic tank of a full-scale produced water treatment
plant. Process Biochem, 45, 744-751.
Liu, Y., Climent, V., Berná, A., Feliu, J.M. 2011. Effect of Temperature on the Catalytic
Ability of Electrochemically Active Biofilm as Anode Catalyst in Microbial Fuel
Cells. Electroanalysis, 23, 387-394.
Logan, B. 2008. Microbial Fuel Cells. John Wiley & Sons Inc., Hoboken, NJ, USA.
Logan, B. 2010. Scaling up microbial fuel cells and other bioelectrochemical systems.
Appl Microbiol Biotechnol, 85, 1665-1671.
Logan, B.E. 2009. Exoelectrogenic bacteria that power microbial fuel cells. Nat Rev
Micro, 7, 375-381.
176
Logan, B.E., Hamelers, B., Rozendal, R., Schröder, U., Keller, J., Freguia, S., Aelterman,
P., Verstraete, W., Rabaey, K. 2006. Microbial Fuel Cells: Methodology and
Technology†. Environ Sci Technol, 40, 5181-5192.
Logan, B.E., Regan, J.M. 2006. Electricity-producing bacterial communities in microbial
fuel cells. Trends Microbiol, 14, 512-518.
Lorowitz, W.H., Bryant, M.P. 1984. Peptostreptococcus productus strain that grows
rapidly with CO as the energy source. Appl Environ Microbiol, 47, 961-964.
Lovley, D.R. 2006. Bug juice: harvesting electricity with microorganisms. Nat Rev Micro,
4, 497-508.
Lovley, D.R. 1993. Dissimilatory Metal Reduction. Annual Rev Microbiol, 47, 263-290.
Lovley, D.R. 2008. The microbe electric: conversion of organic matter to electricity. Curr
Opinion Biotechnol, 19, 564-571.
Lovley, D.R. 2006. Microbial fuel cells: novel microbial physiologies and engineering
approaches. Curr Opin Biotechnol, 17, 327-332.
Lovley, D.R., Holmes, D.E., Nevin, K.P. 2004. Dissimilatory Fe(III) and Mn(IV)
Reduction. Adv Microb Physiol, 49, 219-286.
Malin, C., Illmer, P. 2008. Ability of DNA content and DGGE analysis to reflect the
performance condition of an anaerobic biowaste fermenter. Microbiol Research,
163, 503-511.
Maness, P.-C., Huang, J., Smolinski, S., Tek, V., Vanzin, G. 2005. Energy Generation
from the CO Oxidation-Hydrogen Production Pathway in Rubrivivax gelatinosus.
Appl Environ Microbiol, 71, 2870-2874.
Marshall, C.W., May, H.D. 2009. Electrochemical evidence of direct electrode reduction
by a thermophilic Gram-positive bacterium, Thermincola ferriacetica. Energy
Environ Sci, 2, 699-705.
Martin, E., Savadogo, O., Guiot, S.R., Tartakovsky, B. 2010. The influence of operational
conditions on the performance of a microbial fuel cell seeded with mesophilic
anaerobic sludge. Biochem Eng J, 51, 132-139.
Mathis, B., Marshall, C., Milliken, C., Makkar, R., Creager, S., May, H. 2008. Electricity
generation by thermophilic microorganisms from marine sediment. Appl
Microbiol Biotechnol, 78, 147-155.

177
McKendry, P. 2002. Energy production from biomass (part 1): overview of biomass.
Bioresource Technol, 83, 37-46.
Mehta, P., Hussain, A., Raghavan, V., Neburchilov, V., Wang, H., Tartakovsky, B., Guiot,
S. 2010. Electricity generation from a carbon monoxide in a single chamber
microbial fuel cell. Enzyme Microb Technol, 46, 450-455.
Methe, B.A., Nelson, K.E., Eisen, J.A., Paulsen, I.T., Nelson, W., Heidelberg, J.F., Wu,
D., Wu, M., Ward, N., Beanan, M.J., Dodson, R.J., Madupu, R., Brinkac, L.M.,
Daugherty, S.C., DeBoy, R.T., Durkin, A.S., Gwinn, M., Kolonay, J.F., Sullivan,
S.A., Haft, D.H., Selengut, J., Davidsen, T.M., Zafar, N., White, O., Tran, B.,
Romero, C., Forberger, H.A., Weidman, J., Khouri, H., Feldblyum, T.V.,
Utterback, T.R., Van Aken, S.E., Lovley, D.R., Fraser, C.M. 2003. Genome of
Geobacter sulfurreducens: Metal Reduction in Subsurface Environments. Science,
302, 1967-1969.
Michaelidou, U., ter Heijne, A., Euverink, G.J.W., Hamelers, H.V.M., Stams, A.J.M.,
Geelhoed, J.S. 2011. Microbial Communities and Electrochemical Performance of
Titanium-Based Anodic Electrodes in a Microbial Fuel Cell. Appl Environm
Microbiol, 77, 1069-1075.
Min, B., Kim, J., Oh, S., Regan, J.M., Logan, B.E. 2005. Electricity generation from
swine wastewater using microbial fuel cells. Water Res, 39, 4961-4968.
Min, B., Román, Ó., Angelidaki, I. 2008. Importance of temperature and anodic medium
composition on microbial fuel cell (MFC) performance. Biotechnol Letters, 30,
1213-1218.
Mochimaru, H., Yoshioka, H., Tamaki, H., Nakamura, K., Kaneko, N., Sakata, S., Imachi,
H., Sekiguchi, Y., Uchiyama, H., Kamagata, Y. 2007. Microbial diversity and
methanogenic potential in a high temperature natural gas field in Japan.
Extremophiles, 11, 453-461.
Munasinghe, P.C., Khanal, S.K. 2010. Biomass-derived syngas fermentation into biofuels:
Opportunities and challenges. Bioresour Technol, 101, 5013-5022.
Munasinghe, P.C., Khanal, S.K. 2010. Syngas fermentation to biofuel: Evaluation of
carbon monoxide mass transfer coefficient (kLa) in different reactor
configurations. Biotechnol Prog, 26, 1616-1621.
Neburchilov, V., Mehta, P., Hussain, A., Raghavan, V., Wang, H., Guiot, S., Tartakovsky,
B. 2011. Microbial Fuel Cell Operation On Carbon Monoxide: Cathode Catalyst
Selection. Int J Hydrogen Energ, 36, 11929-11935.
Nevin, K.P., Richter, H., Covalla, S.F., Johnson, J.P., Woodard, T.L., Orloff, A.L., Jia, H.,
Zhang, M., Lovley, D.R. 2008. Power output and columbic efficiencies from

178
biofilms of Geobacter sulfurreducens comparable to mixed community microbial
fuel cells. Environ Microbiol, 10, 2505-2514.
Niessen, J., Schröder, U., Scholz, F. 2004. Exploiting complex carbohydrates for
microbial electricity generation - a bacterial fuel cell operating on starch.
Electrochem Commun, 6, 955-958.
Nölling, J., Hahn, D., Ludwig, W., De Vos, W.M. 1993. Phylogenetic Analysis of
Thermophilic Methanobacterium sp.: Evidence for a Formate-Utilizing Ancestor.
Syst Appl Microbiol, 16, 208-215.
Oelgeschlager, E., Rother, M. 2008. Carbon monoxide - dependant energy metabolism in
anaerobic bacteria and archaea. Arch Microbiol, 190, 257-269.
Ormerod, M.R. 2003. Solid oxide fuel cells. Chem Soc Rev, 32, 17-28.
Pant, D., Van Bogaert, G., Diels, L., Vanbroekhoven, K. 2010. A review of the substrates
used in microbial fuel cells (MFCs) for sustainable energy production. Bioresour
Technol, 101, 1533-1543.
Parshina, S.N., Kijlstra, S., Henstra, A.M., Sipma, J., Plugge, C.M., Stams, A.J.M. 2005.
Carbon monoxide conversion by thermophilic sulfate-reducing bacteria in pure
culture and in co-culture with Carboxydothermus hydrogenoformans. Applied
Microbiology and Biotechnology, 68, 390-396.
Parshina, S.N., Sipma, J., Henstra, A.M., Stams, A.J.M. 2010. Carbon Monoxide as an
Electron Donor for the Biological Reduction of Sulphate. Int J Microbiol, 25, 1-9.
Parshina, S.N., Sipma, J., Nakashimada, Y., Henstra, A.M., Smidt, H., Lysenko, A.M.,
Lens, P.N.L., Lettinga, G., Stams, A.J.M. 2005. Desulfotomaculum
carboxydivorans sp. nov., a novel sulfate-reducing bacterium capable of growth at
100 % CO. Int J Syst Evol Microbiol, 55(5), 2159-2165.
Pengmei, L., Yuan, Z., Wu, C., Ma, L., Chen, Y., Tsubaki, N. 2007. Bio-syngas
production from biomass catalytic gasification. Energy Convers Managem, 48,
1132-1139.
Perry, R., Green, D., Maloney, J. 1997. Perry's chemical engineer's Handbook. McGraw-
Hill , New York.
Pinto, R.P., Srinivasan, B., Guiot, S.R., Tartakovsky, B. 2011. The effect of real-time
external resistance optimization on microbial fuel cell performance. Water Res 45,
1571-1578.

179
Pinto, R.P., Srinivasan, B., Manuel, M.F., Tartakovsky, B. 2010. A two-population bio-
electrochemical model of a microbial fuel cell. Bioresource Technol, 101, 5256-
5265.
Preez, L., Maree, J. 1994. Pilot-scale biological sulphate and nitrate removal utilizing
producer gas as energy source. Water sci technol, 30, 275-285.
Rabaey, K., Verstraete, W. 2005. Microbial fuel cells: novel biotechnology for energy
generation. Trends Biotechnol, 23, 291-298.
Ragsdale, S.W. 2004. Life with Carbon Monoxide. Cri Rev Biochem and Molecul Biol,
39, 165-195.
Reij, M.W., Keurentjes, J.T.F., Hartmans, S. 1998. Membrane bioreactors for waste gas
treatment. J Biotechnol, 59, 155-167.
Riggs, S.S., Heindel, T.J. 2006. Measuring Carbon Monoxide Gas - Liquid Mass Transfer
in a Stirred Tank Reactor for Syngas Fermentation. Biotechnol Prog, 22, 903-906.
Rinaldi, A., Mecheri, B., Garavaglia, V., Licoccia, S., Di Nardo, P., Traversa, E. 2008.
Engineering materials and biology to boost performance of microbial fuel cells: a
critical review. Energy Environment Sci, 1, 417-429.
Rismani-Yazdi, H., Carver, S.M., Christy, A.D., Tuovinen, O.H. 2008. Cathodic
limitations in microbial fuel cells: An overview. J Power Sourc, 180, 683-694.
Robb, W.L. 1968. Thin silicon membranes-their permeation properties and some
applications. Annals of the New York Academy of Sciences, 146, 119-137.
Sakai, S., Imachi, H., Sekiguchi, Y., Tseng, I., Ohashi, A., Harada, H., Kamagata, Y.
2009. Cultivation of Methanogens under Low-Hydrogen Conditions by Using the
Coculture Method. Appl Environmental Microbiol 75, 4892-4896.
Savage, M.D., Wu, Z.G., Daniel, S.L., Lundie, L.L., Jr, Drake, H.L. 1987. Carbon
monoxide-dependent chemolithotrophic growth of Clostridium
thermoautotrophicum. Appl Environ Microbiol, 53, 1902-1906.
Scott, K., Hughes, R. 1996. Industrial Membrane Separation Technology. Blackie
Academic & Professional, Glasgow, UK.
Singer, S.W., Hirst, M.B., Ludden, P.W. 2006. CO-dependent H2 evolution by
Rhodospirillum rubrum: Role of CODH:CooF complex. Biochimica et Biophysica
Acta (BBA) - Bioenergetics, 1757, 1582-1591.
180
Sipma, J., Henstra, A.M., Parshina, S.N., Lens, P.N.L., Lettinga, G., Stams, A.J.M. 2006.
Microbial CO Conversions with Applications in Synthesis Gas Purification and
Bio-Desulfurization. Crit Rev Biotechnol, 26, 41 - 65.
Sipma, J., Lens, P.N.L., Stams, A.J.M., Lettinga, G. 2003. Carbon monoxide conversion
by anaerobic bioreactor sludges. FEMS Microbiol Ecol, 44, 271-277.
Sipma, J., Lettinga, G., Stams, A.J., Lens, P.N. 2006. Hydrogenogenic CO Conversion in
a Moderately Thermophilic (55 °C) Sulfate-Fed Gas Lift Reactor: Competition for
CO-Derived H2. Biotechnol Prog, 22, 1327-1334.
Slepova, T.V., Sokolova, T.G., Kolganova, T.V., Tourova, T.P., Bonch-Osmolovskaya,
E.A. 2009. Carboxydothermus siderophilus sp. nov., a thermophilic,
hydrogenogenic, carboxydotrophic, dissimilatory Fe(III)-reducing bacterium from
a Kamchatka hot spring. Int J Syst Evol Microbiol, 59, 213-217.
Slepova, T.V., Sokolova, T.G., Lysenko, A.M., Tourova, T.P., Kolganova, T.V.,
Kamzolkina, O.V., Karpov, G.A., Bonch-Osmolovskaya, E.A. 2006.
Carboxydocella sporoproducens sp. nov., a novel anaerobic CO-utilizing/H2-
producing thermophilic bacterium from a Kamchatka hot spring. Int J Syst Evol
Microbiol, 56, 797-800.
Sokolova, T., Gonzalez, J., Kostrikina, N., Chernyh, N., Tourova, T., Kato, C., Bonch-
Osmolovskaya, E., Robb, F. 2001. Carboxydobrachium pacificum gen. nov., sp.
nov., a new anaerobic, thermophilic, CO-utilizing marine bacterium from
Okinawa Trough. Int J Syst Evol Microbiol, 51(1), 141-149.
Sokolova, T., Hanel, J., Onyenwoke, R.U., Reysenbach, A.L., Banta, A., Geyer, R.,
Gonzalez, J.M., Whitman, W.B., Weigel. 2007. Novel chemolithotrophic,
thermophilic, anaerobic bacteria Thermolithobacter ferrireducens gen. nov., sp.
nov. and Thermolithobacter carboxydivorans sp. nov. Extremophiles, 11, 145-157.
Sokolova, T.G., Gonzalez, J.M., Kostrikina, N.A., Chernyh, N.A., Slepova, T.V., Bonch-
Osmolovskaya, E.A., Robb, F.T. 2004. Thermosinus carboxydivorans gen. nov.,
sp. nov., a new anaerobic, thermophilic, carbon-monoxide-oxidizing,
hydrogenogenic bacterium from a hot pool of Yellowstone National Park. Int J
Syst Evol Microbiol, 54, 2353-2359.
Sokolova, T.G., Henstra, A.-M., Sipma, J., Parshina, S.N., Stams, A.J.M., Lebedinsky,
A.V. 2009. Diversity and ecophysiological features of thermophilic
carboxydotrophic anaerobes. FEMS Microbiol Ecol, 68, 131-141.
Sokolova, T.G., Kostrikina, N.A., Chernyh, N.A., Kolganova, T.V., Tourova, T.P.,
Bonch-Osmolovskaya, E.A. 2005. Thermincola carboxydiphila gen. nov., sp. nov.,
181
a novel anaerobic, carboxydotrophic, hydrogenogenic bacterium from a hot spring
of the Lake Baikal area. Int J Syst Evol Microbiol, 55, 2069-2073.
Sokolova, T.G., Kostrikina, N.A., Chernyh, N.A., Tourova, T.P., Kolganova, T.V.,
Bonch-Osmolovskaya, E.A. 2002. Carboxydocella thermautotrophica gen. nov.,
sp. nov., a novel anaerobic, CO-utilizing thermophile from a Kamchatkan hot
spring. Int J Syst Evol Microbiol, 52, 1961-1967.
Song, C. 2002. Fuel processing for low-temperature and high-temperature fuel cells:
Challenges, and opportunities for sustainable development in the 21st century.
Catal today, 77, 17-49.
Steele, B.C.H., Heinzel, A. 2001. Materials for fuel-cell technologies. Nature, 414, 345-
352.
Tartakovsky, B., Manuel, M.F., Beaumier, D., Greer, C., Guiot, S.R. 2001. Enhanced
selection of an anaerobic pentachlorophenol-gegrading consortium. Biotechnol
and Bioeng, 73, 476-83.
Tartakovsky, B., Manuel, M.F., Neburchilov, V., Wang, H., Guiot, S.R. 2008.
Biocatalyzed hydrogen production in a continuous flow microbial fuel cell with a
gas phase cathode. J. Power Sources, 182, 291-297.
Thygesen, A., Marzorati, M., Boon, N., Thomsen, A., Verstraete, W. 2011. Upgrading of
straw hydrolysate for production of hydrogen and phenols in a microbial
electrolysis cell (MEC). Appl Microbiol Biotechnol, 89, 855-865.
Tor, J.M., Kashefi, K., Lovley, D.R. 2001. Acetate Oxidation Coupled to Fe(III)
Reduction in Hyperthermophilic Microorganisms. Appl Environ Microbiol, 67,
1363-1365.
Ugwu, C.U., Ogbonna, J.C. 2002. Improvement of mass transfer characteristics and
productivities of inclined tubular photobioreactors by installation of internal static
mixers. Appl Microbiol Biotechnol, 58, 600-607.
Van Houten, B.H., Roest, K., Tzeneva, V.A., Dijkman, H., Smidt, H., Stams, A.J. 2006.
Occurrence of methanogenesis during start-up of a full-scale synthesis gas-fed
reactor treating sulfate and metal-rich wastewater. Water Res, 40, 553-560.
Vorapongsathorn, T., Wongsuchoto, P., Pavasant, P. 2001. Performance of airlift
contactors with baffles. Chem Eng J, 84, 551-556.
Wagner, A.O., Malin, C., Lins, P., Illmer, P. 2011. Effects of various fatty acid
amendments on a microbial digester community in batch culture. Waste Managem,
31, 431-437.
182
Wasserfallen, A., Nolling, J., Pfister, P., Reeve, J., Conway de Macario, E. 2000.
Phylogenetic analysis of 18 thermophilic Methanobacterium isolates supports the
proposals to create a new genus, Methanothermobacter gen. nov., and to reclassify
several isolates in three species, Methanothermobacter thermautotrophicus comb.
nov., Methanothermobacter wolfeii comb. nov., and Methanothermobacter
marburgensis sp. nov. Int J Syst Evol Microbiol, 50, 43-53.
Watanabe, T., Asakawa, S., Nakamura, A., Nagaoka, K., Kimura, M. 2004. DGGE
method for analyzing 16S rDNA of methanogenic archaeal community in paddy
field soil. FEMS Microbiol Letters, 232, 153-163.
Wayne, L. 1994. Actions of the judial commission of the international committee on
systematic bacteriology on requests for opinions published between January 1985
and July 1993. Int J Syst Bacteriol, 44, 177-178.
Winter, J., Lerp, C., Zabel, H.P., Wildenauer, F.X., König, H., Schindler, F. 1984.
Methanobacterium wolfei, sp. nov., a new tungsten-requiring, thermophilic,
autotrophic methanogen Syst Appl Microbiol, 5, 457-466.
Woodward, L., Perrier, M., Srinivasan, B., Pinto, R.P., Tartakovsky, B. 2010.
Comparison of real-time methods for maximizing power output in microbial fuel
cells. AIChE Journal, 56, 2742-2750.
Woodward, L., Tartakovsky, B., Perrier, M., Srinivasan, B. 2009. Maximizing power
production in a stack of microbial fuel cells using multiunit optimization method.
Biotechnol Prog, 25, 676-682.
Wrighton, K.C., Agbo, P., Warnecke, F., Weber, K.A., Brodie, E.L., DeSantis, T.Z.,
Hugenholtz, P., Andersen, G.L., Coates, J.D. 2008. A novel ecological role of the
Firmicutes identified in thermophilic microbial fuel cells. ISME J, 2, 1146-1156.
Wu, W.-M., Hickey, R.F., Jain, M.K., Zeikus, J.G. 1993. Energetics and regulations of
formate and hydrogen metabolism by Methanobacterium formicicum. Arch
Microbiol, 159, 57-65.
Yasuda, H., Lamaze, C.E. 1972. Transfer of gas to dissolved oxygen in water via porous
and nonporous polymer membranes. J Appl Polym Sci, 16, 595-601.
Zavarzina, D., Sokolova, T., Tourova, T., Chernyh, N., Kostrikina, N., Bonch-
Osmolovskaya, E. 2007. Thermincola ferriacetica sp. nov., a new anaerobic,
thermophilic, facultatively chemolithoautotrophic bacterium capable of
dissimilatory Fe(III) reduction. Extremophiles, 11, 1-7.

183
Zhang, P., Liu, Z. 2010. Experimental study of the microbial fuel cell internal resistance.
J Power Sources, 195, 8013-8018.
Zhao, F., Harnisch, F., Schröder, U., Scholz, F., Bogdanoff, P., Herrmann, I. 2005.
Application of pyrolysed iron(II) phthalocyanine and CoTMPP based oxygen
reduction catalysts as cathode materials in microbial fuel cells. Electrochem
Commun, 7, 1405-1410.
Zhuang, L., Zhou, S. 2009. Substrate cross-conduction effect on the performance of
serially connected microbial fuel cell stack. Electrochemistry Communications, 11,
937-940.
184
APPENDIX A
The entire experimental work for this thesis was performed at the Bioenegineering Facility
at the Biotechnology Research Institute, National Research Council of Canada (NRC), 6100
Royal Mount Avenue, Montreal, Quebec, Canada. All the appropriate ethics, and biosafety
guidelines and regulations were carefully followed.