electricity distribution annual report for 2010-11
TRANSCRIPT

Electricity Distribution Annual Report for 2010-11
Document Type: Annual Report
Ref: 46/12
Overview
Ofgem regulates Great Britain‟s electricity distribution network companies, which have
regional monopolies, in order to protect consumers. Ofgem sets the revenues DNOs can
collect from network users. In return for these revenues, the companies are required to
provide customers with a safe, secure and reliable network and a range of other
services, such as timely connections and effective complaint handling.
DNOs provide Ofgem with information each year to help us monitor performance against
their price control incentives and obligations. This report reviews DNO performance in
2010-11. It covers key areas such as customer service, connections, the environment
and providing network reliability in a cost effective manner.
We have put new requirements on the DNOs to engage more effectively with their
stakeholders and to use stakeholder views in making business decisions. This report
aims to give stakeholders key information on the performance of their electricity
distribution network. We seek feedback from stakeholders on the content and format of
this report.
Contact name and details: James Hope, Head of Electricity Distribution Costs
and Outputs
Tel: 020 7901 7029
Email: [email protected]
Team: Electricity Distribution Costs and Outputs
Date of Publication: 30 March 2012
Target Audience: Consumers and their representatives, electricity distribution
network operators (DNOs), suppliers, environmental organisations, independent
distribution network operators (IDNOs), independent connection providers, investors
and other interested parties.

ii
Electricity Distribution Annual Report for 2010-11 30 March 2012
Electricity distribution network operators (DNOs) are responsible for providing the
network which transports electricity from the transmission system to consumers.
Each of the 14 DNOs has a monopoly in its designated area. We therefore
regulate the DNOs to protect consumers, ensuring they receive high-quality
network services at value for money. We do this by setting the allowed revenues
which DNOs can collect from customers. In return for this revenue they must
provide the services and meet the standards set out in their licences. Customers
and other stakeholders play an important part in ensuring that they receive a
good service by raising a complaint when they do not get the service they are due
or by contacting the companies to set out where they think they could be
performing better.
In October 2010, we introduced RIIO1, our new approach to network regulation.
RIIO aims to promote smarter gas and electricity networks for a low carbon
future and puts sustainability alongside consumers at the heart of what network
companies do. RIIO will be introduced in 2015 for electricity distribution. The
network companies are now required to engage with stakeholders when
developing their long-term business plans and demonstrate how they have
responded to stakeholder views. This report aims to give stakeholders important
information on the performance of their electricity distribution networks.
DNOs provide information each year to Ofgem to help us monitor performance
against their price control incentives and obligations. This report brings together
and summarises a number of key indicators of DNOs' performance in 2010-11,
including a number of new indicators introduced in our fifth electricity distribution
price control (DPCR5) which runs from April 2010 to March 2015. This is the
second consolidated electricity distribution report of its kind to be published by
Ofgem. We seek feedback on the content and presentation of this report so that
we can continue to improve the accessibility of the information we publish.
Electricity Distribution Annual Report for 2008-09 and 2009-10 (Reference
50/11)
Electricity Distribution Price Control Review Final Proposals (Reference
144/09)
Distributed Generation (DG) Forum 2011
2008-09 Quality of Service Report (Reference 162/09)
2007-08 Quality of Service Report (Reference 166/08)
2006-07 Quality of Service Report (Reference 268/07)
2005-06 Quality of Service Report (Reference 204/06)
Electricity Distribution Cost Review 2007-2008 (Reference 165/08)
Electricity Distribution Cost Review 2006-2007 (Reference 289/07)
Electricity Distribution Cost Review 2005-2006 (Reference 18/07)
Connections Industry Review 2009-10 (Reference 20/11)
Connections Industry Review 2008-09 (Reference 15/10)
Connections Industry Review 2007-08 (Reference 143/08)
Connections Industry Review 2006-07 (Reference 215/07)
1 RIIO is a new performance based model for setting price controls and stands for Revenue = Incentives + Innovation + Outputs. More information about RIIO-ED1 is available on our website at: http://www.ofgem.gov.uk/Networks/ElecDist/PriceCntrls/riio-ed1/Pages/index.aspx
Context
Associated Documents

iii
Electricity Distribution Annual Report for 2010-11 30 March 2012
Table of contents
Summary ....................................................................................... 5 Electricity distribution price control overview ............................................... 5 DNO performance .................................................................................... 5
1. Background and introduction .................................................... 7 Electricity distribution in Great Britain......................................................... 7 Ofgem and stakeholder role in driving performance improvements ................. 8 Changes from previous annual report ......................................................... 9
2. Overview of performance in 2010-11 ...................................... 10 DNO performance snapshot for 2010-11 ................................................... 10
Performance summary ........................................................................ 11 Reliability and availability .................................................................... 11 Customer satisfaction .......................................................................... 12 Connections ....................................................................................... 12 Social responsibility ............................................................................ 13 Network health index .......................................................................... 14 Environment ...................................................................................... 15
3. Network investment, expenditure and outputs ........................ 16 Reported expenditure in 2010-11 against DPCR5 allowances ....................... 16 Breakdown of expenditure ...................................................................... 18 Secondary network deliverables ............................................................... 18
Secondary network deliverables performance indicator ............................ 19 Workforce renewal ................................................................................. 20
4. Safety, reliability and availability ............................................ 21 Quality of service metrics ........................................................................ 21 Performance against interruption targets in 2010-11 .................................. 23 Performance against interruption benchmark in 2010-11 ............................ 25 Performance trends 2001-02 to 2010-11 .................................................. 26 Impact of performance on customers ....................................................... 27 Electricity Standards of Performance ........................................................ 30 ESQCR and tree cutting .......................................................................... 30 Flood defence ........................................................................................ 31
5. Customer satisfaction and social responsibility ....................... 33 Broad measure of customer satisfaction .................................................... 33 Telephone response performance ............................................................. 34
Quality of response ............................................................................. 34 Performance trends ............................................................................ 35 Speed of response .............................................................................. 36
Worst Served Customer Scheme .............................................................. 37 Priority Services Register ........................................................................ 38 Electricity discretionary reward scheme (DRS) ........................................... 38
Wider communication strategies ........................................................... 39 Corporate social responsibility initiatives ............................................... 40 Future of the Discretionary Reward Scheme ........................................... 40
Undergrounding in areas of outstanding natural beauty and national parks ... 41 6. Connections ............................................................................. 43
Competition in connections ..................................................................... 43 Provision of connection offer quotations .................................................... 46 Connections Standards of Performance ..................................................... 48 Distributed generation ............................................................................ 49
Distributed generation fora .................................................................. 50 7. Environment ............................................................................ 51

iv
Electricity Distribution Annual Report for 2010-11 30 March 2012
Low Carbon Networks Fund ..................................................................... 51 Innovation Funding Incentive (IFI) ........................................................... 52 Business Carbon Footprint (BCF) reporting in DPCR5 .................................. 53 Network loss incentive ............................................................................ 54 Oil top ups ............................................................................................ 54 Distributed generation ............................................................................ 55
8. Financial issues ....................................................................... 57 Revenue recovered ................................................................................ 57 Return on regulatory equity (RoRE) .......................................................... 58 Pensions ............................................................................................... 59 Regulatory asset value ........................................................................... 62 Taxation ............................................................................................... 63
9. Compliance .............................................................................. 64 Review of compliance arrangements ......................................................... 64 Audits in 2010-11 .................................................................................. 65 Compliance issues in 2010-11 ................................................................. 65
Appendices .................................................................................. 67 Appendix 1 - Responses and questions ........................................ 68 Appendix 2 – Distribution Network Operator contact information 69 Appendix 3 – Contact information for stakeholders ..................... 70 Appendix 4 – The Authority’s Powers and Duties ........................ 71 Appendix 5 – Electricity Guaranteed Standards of Performance .. 73 Appendix 6 – Indicator calculation methodology ......................... 75
A – Network health index .................................................................... 75 B - Customer interruptions and Customer minutes lost ............................ 76 C - Customer satisfaction .................................................................... 76 D – Connections ................................................................................. 77 E – Environment ................................................................................. 77 F - Social ........................................................................................... 78
Appendix 7 - Feedback Questionnaire ......................................... 79

5
Electricity Distribution Annual Report for 2010-11 30 March 2012
Summary
Electricity distribution price control overview
Ofgem regulates each of Great Britain‟s 14 electricity distribution network
operators (DNOs) to protect the interests of current and future consumers. We do
this by putting in place a price control, which sets the total revenues that each
DNO may recover from customers at a level that allows an efficient operator to
finance its activities. In return for these revenues, DNOs must provide the
services and the standards set out in their licences. We also place incentives on
DNOs to innovate and identify more efficient ways to deliver for consumers.
Distribution Price Control Review Five (DPCR5) is the current price control which
runs from April 2010 to March 2015.
DNO performance
This report provides a review of the performance of each DNO in the first year of
DPCR5 in the following areas: reliability and availability; customer satisfaction;
connections; environment; and social responsibility. Some of these performance
indicators, which are presented in Chapter 2, are still being refined.
Disappointingly, we are not publishing the secondary network deliverables
indicator in this report as we are not confident in the robustness of the data. A
number of DNOs have resubmitted data, which in places considerably revised
their 2011 formal submissions under the licence. We expect all DNOs to provide
robust data across all metrics, both as part of DPCR5 and, importantly, in their
submissions for the next price control RIIO-ED1. Where we do not have
confidence in a company‟s data, their plans will be subject to greater regulatory
scrutiny and, if required, may take enforcement action.
DNOs generally are showing improving performance against reliability and
availability measures and are engaging well in the environmental arena through
the Low Carbon Networks Fund. However, we have concerns about performance
in the areas of customer service and connections for some companies. We will
continue to monitor progress in these areas across the price control and have
measures under the price control to penalise poor performance. Key aspects of
performance in 2010-11 are reported below.
Reliability and availability
In 2010-11 the trend of improving network reliability and availability continued.
This is monitored through customer interruptions (CI) and customer minutes lost
(CML). On average, DNOs beat their CI and CML targets by 9 per cent and 11 per
cent respectively. Over the period 2002-03 to 2010-11, CI and CML performance
improved by 17 per cent and 25 per cent respectively. This is positive progress in
an area which directly affects customers.
Environment
The Low Carbon Networks (LCN) Fund allows up to £500m over DPCR5 to support
projects sponsored by the DNOs to try out new technology, operating and
commercial arrangements. Ofgem facilitates an annual competition under the LCN
Fund for an allocation of up to £64million to help fund a small number of flagship
projects. In 2010-11, the Fund allocated £61.7m to four DNO projects. The panel

6
Electricity Distribution Annual Report for 2010-11 30 March 2012
were impressed with the overall quality and ambition of the 11 submissions
received. They were particularly pleased to see the partnerships the DNOs had
formed with parties in other parts of the energy sector.
For 2011-12 we have refined the Regulatory Instructions and Guidance on the
reporting of environmental data we collect to be able to report in future on areas
such as business carbon footprint, oil and sulphur hexafluoride losses.
Secondary network deliverables
Secondary network deliverables are important leading indicators, which we use to
determine if DNOs have delivered the network improvements that customers
have funded. The deliverables are measured through a network health index,
network load index and fault rates. DNOs have committed to deliver specific
deliverables against these measures by the end of DPCR5. Although there are no
annual network deliverables commitments to measure performance against, we
will be reviewing companies‟ progress as part of the mid-period review. As noted
above, due to the actions of some companies, we have not published a
performance indicator on secondary network deliverables in this report.
Low expenditure on network investment (NI) potentially suggests slow delivery
by a number of companies. On average across the DNOs, expenditure on NI was
73 per cent of 2010-11 allowances. Whilst this was only the first year of DPCR5,
and DNOs can recover their position in subsequent years, we have concerns over
the extent of underspends in this area and will continue to monitor DNO
performance closely. The aforementioned mid-period review is a key opportunity
for licensees to allay such concerns. As set out in DPCR5 Final Proposals, in the
event that a DNO fails to achieve its secondary network deliverables, a penalty
greater than any gains from underspending will be applied.
Customer satisfaction and social responsibility
The current price control places significant emphasis on the DNOs‟ social and
customer service performance. The discretionary reward scheme (DRS) is
designed to acknowledge outstanding customer service and can award up to £1m
annually. By now DNOs are expected to have identified their stakeholders‟
priorities, used these to shape their company strategy and measured the impact
of their initiatives on stakeholders and the environment. In 2010-11, the panel
did not award the full amount of the DRS in recognition that DNOs are not
meeting these expectations. Furthermore DNOs have been slow to make use of
funding mechanisms to address the needs of worst served customers and
improving visual amenity by undergrounding lines in national parks and areas of
outstanding natural beauty.
Connections
We have concerns regarding DNO performance on connections. Despite there
being no licence infringements recorded for connections and performance against
the Connections Standards of Performance Regulations being adequate, there is
potential for improvement, particularly in the level of service for distributed
generation (DG) customers. We held a series of discussion fora to explore
stakeholder feedback on the experience of getting DG connected to a distribution
network. Stakeholders requested better and more timely information from DNOs
and also greater transparency with regard to the scope and cost of works to
provide a connection. We want to be sure that these issues are addressed and
service levels will be monitored through a second round of DG fora.

7
Electricity Distribution Annual Report for 2010-11 30 March 2012
1. Background and introduction
Electricity distribution in Great Britain
1.1. Electricity distribution systems are networks of overhead wires and
underground cables that transport electricity across Great Britain. The
transmission system conveys electricity from large power plants to local
distribution networks for transportation to customers.
1.2. Ofgem sets price controls which define the revenues that each electricity
distribution network operator (DNO) may recover from its customers. The price
control also puts incentives in place to promote innovation, efficiency, and the
provision of adequate network capacity, security, reliability and quality of service.
The current price control which runs from April 2010 to March 2015 is known as
DPCR5.
1.3. Electricity customers currently pay an average of £4.4 billion annually for
electricity distribution.2 This amounts to approximately 17 per cent of an average
domestic customer‟s bill or about £72 per year, based on consumption of
3300kWh of electricity.3
1.4. There are 14 DNOs in Great Britain. Each is granted a distribution licence to
operate4. In 2010-11 the 14 licences were owned by one of seven companies.
Figure 1.1 shows the name and location of each licence owner and distribution
system in 2010-11.
1.5. The most recent names and abbreviations of the 14 individual DNOs are used
in this report to facilitate comparison with subsequent reports.
2 Electricity Distribution Price Control Review, Final Proposals, December 2009, 144/09, pp. 1. 3 Updated Household Energy Bills Explained Factsheet. Number 97. 18 January 2011. Ofgem. 4 The Standard Conditions of the Electricity Distribution Licence are available on our website at: http://epr.ofgem.gov.uk/document_fetch.php?documentid=15992

8
Electricity Distribution Annual Report for 2010-11 30 March 2012
Figure 1.1 Map of DNOs in Great Britain
1. Central Networks5: West (CN West),
now Western Power Distribution: West
Midlands (WMID)
2. Central Networks5: East (CN East), now
Western Power Distribution: East
Midlands (EMID)
3. Electricity North West Limited (ENWL)
4. CE Electric UK6: Northern Electric
Distribution Limited (NEDL), now
Northern Powergrid: Northeast Ltd
(NPGN)
5. CE Electric UK6: Yorkshire Electricity
Distribution plc (YEDL), now Northern
Powergrid: Yorkshire Plc (NPGY)
6. Western Power Distribution: South
Wales (SWALES)
7. Western Power Distribution: South
West (SWEST)
8. UK Power Networks7: London Power
Networks (LPN)
9. UK Power Networks: South East Power Networks (SPN)
10. UK Power Networks: Eastern Power Networks (EPN)
11. Scottish Power: Distribution (SPD)
12. Scottish Power: Manweb (SPMW)
13. Scottish & Southern Energy: Hydro (SSEH)
14. Scottish & Southern Energy: Southern Electric Power Distribution (SSES).
Ofgem and stakeholder role in driving performance improvements
1.6. Each DNO is required to report to us each year on various aspects of their
performance. We review this data to ensure that companies adhere to the price
control revenue restrictions and that they comply with their licence conditions.
We also use this information when we review the price control arrangements and
look to enhance incentives for the companies to continue to improve. We think
stakeholders, including customers, also play an important role in encouraging the
companies to continue to improve their performance. Access to good information
on how the companies are performing is critical if they are to play this role.
1.7. In the past we have published separate comprehensive and technical
documents on areas such as quality of service (customer service), connections
and costs. This is the second condensed report that brings together and
summarises a number of key indicators of the DNOs performance. This report
5 In April 2011, Western Power Distribution (WPD) acquired the two distribution businesses and licences owned by Central Networks (CN). This means that from April 2011 the 14 distribution licences are owned by one of six companies. 6 In November 2011, CE Electric UK (CE) was renamed Northern Powergrid (NPG). 7 In October 2010 UKPN acquired three distribution businesses and licences previously owned by Electricité de France (EDF).

9
Electricity Distribution Annual Report for 2010-11 30 March 2012
covers performance in 2010-11, the first year of the fifth electricity distribution
price control (DPCR5) which runs from 1 April 2010 to 31 March 2015.
1.8. Network users and other stakeholders (such as local authorities and energy
retailers) can encourage the DNOs to improve their performance by engaging
with the DNOs to help them understand what their needs are and what
improvements they are prepared to pay for. The broad measure of customer
satisfaction, which will be active from 2012-13, provides DNOs with an
opportunity to earn rewards if they are particularly successful in understanding
and responding to stakeholder requirements. The companies should be actively
seeking stakeholders‟ input, particularly as they begin engagement exercises for
the next price control.
Changes from previous annual report
1.9. This report aims to present information in a format that is easy to
understand, allowing stakeholders to compare and track the DNOs‟ overall
performance. We have endeavoured to integrate the comments and suggestions
received on the 2008-09 and 2009-10 joint report and the new measures
introduced in DPCR5. As a result this document has the following structure:
Chapter 2 – Overview of performance in 2010-11
Chapter 3 – Network investment, expenditure and outputs
Chapter 4 – Safety, reliability and availability
Chapter 5 – Customer satisfaction
Chapter 6 – Connections
Chapter 7 – Environment
Chapter 8 – Financial issues
Chapter 9 – Compliance.
1.10. Summary tables of the DNOs‟ performance in 2010-11 are included in this
report. More detailed specific and historical information is available on our website
and in the associated documents published with this report.
1.11. We have refined the selection and composition of the traffic light indicators
specified in the 2008-09 and 2009-10 report which covered the final two years of
the previous price control. We will continue to evaluate refinements in future
reports and again seek comments on the content and format of this report.

10
Electricity Distribution Annual Report for 2010-11 30 March 2012
2. Overview of performance in 2010-11
This chapter provides a snapshot of the distribution network operators‟ (DNOs)
performance against six key indicators in 2010-11. This is the first year of the
fifth electricity distribution price control (DPCR5), which runs from 1 April 2010 to
31 March 2015.
2.1. In October 2010, Ofgem introduced a new framework for network regulation.
The RIIO model (revenue = incentives + innovation + outputs) was designed to
promote smarter gas and electricity networks for a low carbon future. The sixth
electricity price control will be set using the RIIO model. The RIIO model
categorises the outputs DNOs will be expected to deliver into six primary output
categories:
1. Reliability and availability
2. Customer satisfaction
3. Safety
4. Connections
5. Environment
6. Social obligations.
2.2. The performance snapshot for 2010-11 is set out similar to the RIIO model‟s
six primary output categories. The DPCR5 requirements were not designed to fit
into these categories. Nevertheless, specifically presenting performance against
these output areas starts to provide an indication of DNOs‟ performance relative
to the RIIO categories.
2.3. For 2010-11 we have created the four traffic light performance indicators
shown in Table 2.1: reliability and availability; customer satisfaction;
connections; and social responsibility.
2.4. There is no traffic light performance indicator on each DNO‟s overall safety
performance in this report. All DNOs are subject to industry safety legislation and
standards and are monitored by the Health and Safety Executive (HSE)
independently of Ofgem.
2.5. Although we monitor the DNOs‟ environmental performance, as shown in
Chapter 6, the format of the data did not lend itself to presentation as a traffic
light indicator. We are looking to collect data in a more comparable form to
produce an environmental traffic light indicator in future reports.
DNO performance snapshot for 2010-11
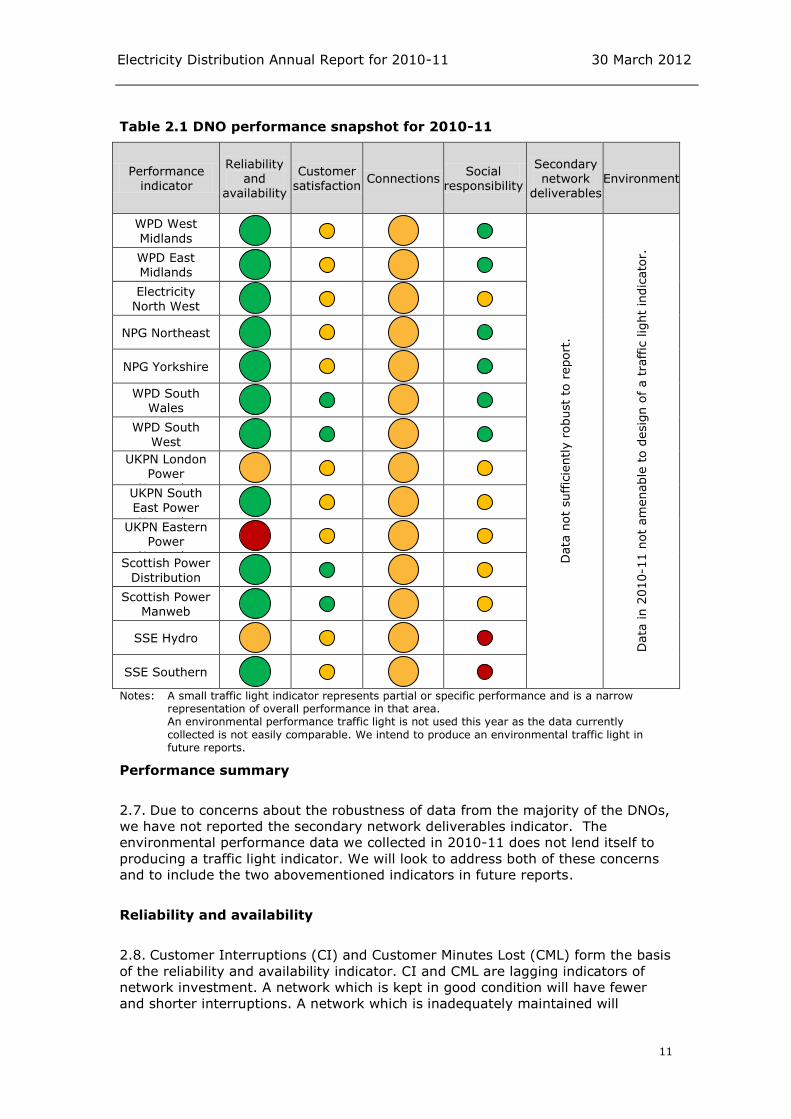
2.6. A performance snapshot for 2010-11 against the five key indicators is set out
in Table 2.1. The composition of the traffic light indicators is described below. A
comprehensive description of the scoring methodology for each indicator is
provided in Appendix 7.
11
Electricity Distribution Annual Report for 2010-11 30 March 2012
Table 2.1 DNO performance snapshot for 2010-11
Performance indicator
Reliability and
availability
Customer satisfaction
Connections Social
responsibility
Secondary network
deliverables Environment
WPD West
Midlands
Data
not
suffic
iently r
obust
to r
eport
.
Data
in 2
010-1
1 n
ot
am
enable
to d
esig
n o
f a t
raffic
lig
ht
indic
ato
r.
WPD East Midlands
Electricity
North West
NPG Northeast
NPG Yorkshire
WPD South Wales
WPD South
West
UKPN London Power
Networks
UKPN South
East Power Networks
UKPN Eastern Power
Networks
Scottish Power
Distribution
Scottish Power Manweb
SSE Hydro
SSE Southern
Notes: A small traffic light indicator represents partial or specific performance and is a narrow representation of overall performance in that area.
An environmental performance traffic light is not used this year as the data currently
collected is not easily comparable. We intend to produce an environmental traffic light in future reports.
Performance summary
2.7. Due to concerns about the robustness of data from the majority of the DNOs,
we have not reported the secondary network deliverables indicator. The
environmental performance data we collected in 2010-11 does not lend itself to
producing a traffic light indicator. We will look to address both of these concerns
and to include the two abovementioned indicators in future reports.
Reliability and availability
2.8. Customer Interruptions (CI) and Customer Minutes Lost (CML) form the basis
of the reliability and availability indicator. CI and CML are lagging indicators of
network investment. A network which is kept in good condition will have fewer
and shorter interruptions. A network which is inadequately maintained will

12
Electricity Distribution Annual Report for 2010-11 30 March 2012
degrade and, after a time, have more frequent and lengthy faults which will be
reflected in CI and CML performance.
2.9. The traffic light indicator is a measure of the DNOs‟ actual performance
against their respective individual targets. CI is the average number of
interruptions experienced (per 100 customers). CML is the number of minutes of
lost supply (per customer). We set targets for both measures for each DNO at the
start of the price control. In each instance, performance better than the target
results in a reward and performance worse that the target results in a penalty.
2.10. The reliability and availability indicator shows green for DNOs which beat
both their CI and their CML target, amber for DNOs which beat one of their
targets and red for DNOs which beat neither of their targets.
2.11. On average in 2010-11, DNOs beat their CI and CML targets by nine per
cent and 11 per cent respectively. Over the period 2002-03 to 2010-11, CI and
CML performance under the Interruptions Incentive Scheme (IIS) improved by 17
per cent and 25 per cent respectively8. This reflects a strong improvement in
quality of service and customers‟ experience.
Customer satisfaction
2.12. The indicator for customer satisfaction is based on the quality of telephone
performance measure. This measure is derived from monthly customer
satisfaction surveys. DNOs were rewarded or penalised based on their overall
annual score.
2.13. As telephony performance is a limited measure of customer satisfaction and
has low materiality in the price control, we have used a small traffic light in Table
2.1. The traffic light shows green for DNOs which gained a reward and amber for
DNOs which did not receive a reward.
2.14. Four of the 14 DNOs received a reward under the telephony incentive
scheme for performance in 2010-11. The telephony incentive scheme has
continued to be applied in 2011-12 but from 2012-13 it will be replaced by the
broad measure of customer satisfaction which covers three customer satisfaction
measures: telephony via a customer survey; a complaints metric; and an
assessment of stakeholder engagement.
Connections
2.15. The indicator for connections performance is based on performance against
the competition tests; Connections and Distributed Generation (DG)9 Standards of
Performance; and stakeholder feedback from the DG fora.
8 CI and CML numbers have been weighted by type of interruption and exclude storms and other exceptional events as further explained in Chapter 4. 9 Distributed generation is any electricity generation which is connected directly to the distribution network, as opposed to the transmission network, as well as combined heat and power schemes of any scale.

13
Electricity Distribution Annual Report for 2010-11 30 March 2012
2.16. The Electricity (Connections Standards of Performance) Regulations10; and
the Distributed Generation (DG) Standards of Performance Direction11 set out
minimum service levels for DNOs in respect of individual customers and the
payments that must be made to customers should the DNO fail to meet these
standards. These Standards of Performance came into force in October 2010.
2.17. DNOs have a key role in supporting the integration of DG into their
networks. A series of discussion fora were held to explore stakeholder feedback
on the experience of getting DG connected to a distribution network. Strong
concerns were raised by DG and other stakeholders regarding the level of service
experienced across the industry. 12 For this, we have assigned all DNOs an amber
component rating. DNOs have put new processes in place to improve how they
address the needs of this important customer group and service levels will be
monitored through a second round of DG fora.
2.18. For 2010-11, the first year of the DPCR5 price control, no DNO had come
forward for the competition test. This means that in 2010-11, no DNO had any
market segments that passed the competition tests. All companies were therefore
assigned an amber component rating.
2.19. The connections guaranteed standards of performance were only in place
for six months of the year therefore for this year all DNOs were assigned an
amber component rating.
2.20. For future years we envisage refining the connections traffic light to reflect
each DNO‟s competition test outcomes, performance under the broad measure,
full year performance across the range of guaranteed and DG standards and
potentially the outcome of connections related determinations.
Social responsibility
2.21. The social obligations performance indicator is based on investment to
improve the network for worst served customers (WSCs)13, use of the
undergrounding funding mechanism and awards from the electricity discretionary
reward scheme (DRS).
2.22. The current price control introduced a new WSC funding mechanism to
improve service to customers experiencing large numbers of interruptions over a
number of years. Costs incurred by DNOs in improving service to WSCs can be
recovered following the end of the DPCR5 period, up to a limit defined for each
DNO according to the number of WSCs on its network.
2.23. At the end of the price control each DNO may recover expenditure on the
undergrounding of network cables in areas of outstanding natural beauty (AONBs)
10 Electricity (Connections Standards of Performance) Regulations 2010. Statutory Instrument 2088. 11 Direction under paragraph 15a.16 Of Standard Condition 15a (Connection Policy And Connection Performance) of the Electricity Distribution Licence 12 Further information on the feedback from DG stakeholders is available on our website at: http://www.ofgem.gov.uk/Pages/MoreInformation.aspx?docid=220&refer=NETWORKS/ELECDIST/POLICY/DISTGEN 13 A Worst Served Customer is defined as a network user who has had 15 or more interruptions to supply over three years and at least three interruptions in each of those three years.

14
Electricity Distribution Annual Report for 2010-11 30 March 2012
and National Parks, up to a certain limit. This funding limit was based on a survey
of Great Britain customer willingness to pay. DNOs are expected to consult with
local stakeholders on where and how best to use the allowance.
2.24. Frontier and innovative performance by DNOs in the field of customer
service is recognised through the DRS Scheme. The scheme provides a £1 million
fund to reward best practice in customer service areas which cannot be easily
measured or incentivised through more mechanistic regimes, such as corporate
social responsibility and supporting vulnerable customers. As the scheme has
been in place since 2006, we expect DNOs to have identified their stakeholders‟
priorities, used these to shape their company strategy and measured the impact
of their initiatives on stakeholders and the environment. In recent years the panel
has not awarded the full amount of the DRS in recognition that DNOs are not
meeting these expectations.
2.25. The traffic light shows green for DNOs which took advantage of two or more
of these mechanisms, amber for DNOs which took advantage of one of these
mechanisms and red for DNOs which took advantage of none of these
mechanisms. A small traffic light was used to reflect that some of these initiatives
are new or modified and others are available for use at any time during the price
control. In 2010-11 not all DNOs used these schemes but we anticipate that
2010-11 performance may not be representative of long term performance in
these areas.
2.26. The use of expenditure as an indicator of performance on these aspects of
social responsibility may be reviewed in subsequent reports. We will look to
include the stakeholder engagement component of the broad measure from
2012-13.
Network health index
2.27. Secondary network deliverables are new measures introduced in DPCR5 to
help us determine if DNOs have effectively delivered the network investment
programmes that customers have funded. These measures incorporate leading
indicators which reflect present activity to sustain the network for the future.
2.28. Secondary network deliverables are assessed using three measures:
health indices (HI), measuring the condition of the network
load indices (LI), measuring the capacity and loading at substations
asset fault rates.
2.29. The DNOs provide data on these areas in a common framework, which
reflects the individual asset management practices of each company.
2.30. The DNOs have committed to deliver the agreed secondary network
deliverables in respect of asset loading, health and fault rates by March 2015, the
end of the DPCR5 period. The agreed measures fully reconcile with each DNO‟s
respective network investment allowances for asset replacement and

15
Electricity Distribution Annual Report for 2010-11 30 March 2012
reinforcement up to the end of the price control period and there are financial
consequences for under delivery.14
2.31. Disappointingly, we are not publishing the secondary network deliverables
indicator in this report as we are not confident in the robustness of the data. A
number of DNOs have resubmitted data, which in places considerably revised
their 2011 formal submissions under the licence.
2.32. We expect all DNOs to provide robust data across all metrics, both as part
of DPCR5 and, importantly, in their submissions for the next price control RIIO-
ED1. Where we do not have confidence in a company‟s data, their plans will be
subject to greater regulatory scrutiny and, if required, may take enforcement
action.
Environment
2.33. Under the current price control, we monitor several aspects of the DNOs‟
environmental performance. We continued the application of the distribution
losses incentive scheme and monitored business carbon footprint, oil leakage and
sulphur hexafluoride15 leakage.
2.34. We also introduced further initiatives to encourage environmental
innovation through the Low Carbon Networks Fund (LCNF). In 2010-11, the LCNF
allocated £63.6m of the annual funding limit of £64m. The panel were impressed
with the overall quality and ambition of the 11 submissions received.
2.35. The environmental performance data we currently collect does not lend
itself to a traffic light indicator. We have refined the Regulatory Instructions and
Guidance16 on the reporting of environmental data we collect to be able to report
in future on areas such as business carbon footprint, oil losses and sulphur
hexafluoride losses. There is an environmental indicator placeholder in the table
to represent this.
2.36. In future, we will look to use improvements in business carbon footprint, oil
leakage and SF6 leakage as comparative measures to represent each DNO‟s
environmental performance. We would potentially also look to use electrical
losses.
14 Electricity Distribution Price Control Review, Final Proposals, Incentives and Obligations, December 2009, 145/09, pp. 98-105. 15 Sulphur Hexafluoride (SF6) is a greenhouse gas used by DNOs as an insulator in electrical switchgear. 16 DPCR5 Regulatory Instructions and Guidance (RIGs) v.3 March 2012. Ref: 36/12.

16
Electricity Distribution Annual Report for 2010-11 30 March 2012
3. Network investment, expenditure and outputs
This chapter sets out key figures for DNO expenditure against allowances;
composition of expenditure; and expenditure on workforce renewal.
3.1. In the fifth electricity distribution price control (DPCR5) we set each
electricity distribution network operator (DNO) an allowance for capital
expenditure (capex)17 and operating expenditure (opex)18 for the period. This
chapter reports each DNO‟s capex and opex compared to their allowances.
3.2. The Information Quality Incentive (IQI) mechanism is designed so that
underspends against the allowances are shared between DNOs‟ shareholders and
customers, and overspends present an additional expense shared between DNOs‟
shareholders and customers. Not all areas of expenditure are subject to the IQI.
See DPCR5 Final Proposals document for further details.19
3.3. Expenditure on network investment was significantly lower in 2010-11 than
forecast. On average across the DNOs, capex (also referred to as network
investment) was 73 per cent of 2010-11 allowances. We will continue to monitor
DNO delivery of the outputs associated with network investment closely, notably
in the forthcoming mid-period review of secondary network deliverables progress.
3.4. This chapter further provides information of the composition of each DNO‟s
in-year expenditure. DNO expenditure on workforce renewal is also outlined in
this chapter. This allowance was provided to facilitate the investment required to
build and maintain the skilled workforce needed to operate the networks in
future.
Reported expenditure in 2010-11 against DPCR5 allowances
3.5. Figures 3.1 and 3.2 set out the capex and opex for 2010-11 compared to the
allowance. 20,21,22,23 These figures and statistics quoted in the following text
exclude all pension costs and are on a 2010-11 price basis. The information
presented in the below figures is also available in the excel file published with this
report.
17 Capital expenditure (capex) is expenditure on investment in long-lived distribution assets, such as underground cables, overhead electricity lines and substations. 18 Operating expenditure (opex) is the expenditure incurred by DNOs as a result of performing their business operations and maintaining their network. 19 Electricity Distribution Price Control Review, Final Proposals, Incentives and Obligations, December 2009, 145/09, pp. 107-113. Available at: http://www.ofgem.gov.uk/Networks/ElecDist/PriceCntrls/DPCR5/Pages/DPCR5.aspx 20 For the purposes of this report, expenditure relating to connection projects has been excluded from both capex and the capex allowance. 21 Top-up, stand-by and enhanced system security (ES4) costs incurred outside of the price control have all been removed from capex, although a portion of these would have been incurred under Closely Associated Indirects. ES4 costs amounted to £15.1m in 2010-11. 22 Expenditure on Undergrounding in designated areas and Worst Served Customer schemes (described in Chapter 5) is included in capex but, since these costs are recovered at the end of the price control, no specific allowance is included in the capex allowance. 23 Income from connection projects which relates to Closely Associated Indirects (a sub category of opex) has been subtracted from Closely Associated Indirects expenditure.

17
Electricity Distribution Annual Report for 2010-11 30 March 2012
Figure 3.1 Capital expenditure against allowance in 2010-11 (£2010-11
price basis)
Figure 3.2 Operating expenditure against allowance in 2010-11 (2010-11
price basis)
3.6. In 2010-11, DNOs underspent against the capex allowance by a total of
£359.0 million (equivalent to 27 per cent) and underspent against the opex
allowance by £77.6 million (equivalent to five per cent). Underspending against
the allowance is not an issue provided that the DNO meets its statutory
obligations and delivers the outputs it agreed to by the end of the price control
period.
-60%
-50%
-40%
-30%
-20%
-10%
0%
10%
-60.0
-50.0
-40.0
-30.0
-20.0
-10.0
0.0
10.0
WM
ID
EMID
ENW
L
NP
GN
NP
GY
SWal
es
SWes
t
LPN
SPN
EPN
SPD
SPM
W
SSEH
SSES
£m
Difference between expenditure and allowance
Percentage difference between expenditure and allowance
-30%
-25%
-20%
-15%
-10%
-5%
0%
5%
10%
15%
-50.0
-40.0
-30.0
-20.0
-10.0
0.0
10.0
20.0
WM
ID
EMID
ENW
L
NP
GN
NP
GY
SWal
es
SWes
t
LPN
SPN
EPN
SPD
SPM
W
SSEH
SSES
£m
Difference between expenditure and allowance
Percentage difference between expenditure and allowance

18
Electricity Distribution Annual Report for 2010-11 30 March 2012
Breakdown of expenditure
3.7. Figure 3.3 shows the breakdown of expenditure for each DNO in 2010-11.
The expenditure categories shown are for capex and opex which is the sum of:
network operating costs (NOC)24, closely associated indirects (CAI)25, business
support costs26 and non-op capex27.
Figure 3.3 Breakdown of each DNO’s expenditure in 2010-11
Secondary network deliverables
3.8. During the DPCR5 consultation process, we identified the need for a leading
measure which maps network investment spend to the delivery of results. The
existing interruptions measures provide an indication of the impact of network
investment on network performance by a DNO over the long run. However, if
there is underinvestment in the network, the impacts on interruptions
performance may not be visible for some time.
3.9. To address this, we introduced new measures of DNO network stewardship in
DPCR5 in the form of the network load index (LI) and health index (HI). These
indices monitor the capacity and condition of network assets as indicated by each
DNO‟s assessment of their own assets. The DNOs provide data in a common
framework, which reflects the individual asset management practices of each
company.
24 Network Operating Costs consist of the costs incurred in the day to day running of the network. This includes the following activities: dealing with faults; network inspections and maintenance; tree cutting. 25 CAI collectively includes the costs of the following network specific support activities: Network Design and Engineering; Project Management; Engineering Management and Clerical Support; System Mapping; Control Centre; Call Centre; Stores; Operational Training; Vehicles and Transport. 26 Business Support Costs consist of the costs incurred from the following support activities: IT & Telecoms, Property Management, HR & Non-Operational Training, Finance and Regulation and CEO costs. 27 Non-op Capex is expenditure on new and replacement assets which are not system assets.
0%
10%
20%
30%
40%
50%
60%
70%
80%
90%
100%
UK
WM
ID
EMID
ENW
L
NP
GN
NP
GY
SWA
LES
SWES
T
LPN
SPN
EPN
SPD
SPM
W
SSEH
SSES
Pe
rce
nta
ge o
f D
NO
's 2
01
0-1
1 t
ota
l e
xpe
nd
itu
re Non-op capex
Bus support
CAI
NOC
Capex

19
Electricity Distribution Annual Report for 2010-11 30 March 2012
3.10. In agreeing the HI outputs at the time of the price control, each DNO
provided us with forecasts of what the health of the assets on their networks
would be at the end of the price control period in 201528 based on two scenarios –
one assuming the DNO makes no investment on the network and one assuming
that the DNO makes the investments set out in its plans. For the LI outputs, the
DNOs provided similar forecasts looking at the capacity and loading of the
substations on their networks.
3.11. The difference between the abovementioned „no investment‟ and „with
investment‟ forecast scenarios represent what the DNO has agreed to deliver
during the price control.
3.12. Each year, the DNOs provide data on capacity and loading at substations,
on asset health and on fault rates.
3.13. The DNOs have committed to deliver the agreed outputs in respect of asset
loading, health and fault rates over the DPCR5 period. The agreed outputs data
fully reconciles with each DNO‟s respective network investment allowances for
asset replacement and reinforcement up to the end of the price control period.
There are financial consequences for under delivery.29
3.14. There are no agreed network outputs set for individual years of the price
control. As such, DNOs can meet their DPCR5 agreed outputs by increasing
network investment activity in the remaining years of price control.
3.15. Although a DNO may appear to benefit financially in the short term from
underspending against the agreed network investment allowance, there is a
penalty for not achieving secondary network deliverables by the end of the
period.
Secondary network deliverables performance indicator
3.16. We have been working with the DNOs to develop an objective assessment
methodology to generate an interim indicator of progress towards the health
index deliverable. There are no secondary network deliverables agreed for
individual years of the price control so this was based on 2010-11 progress
towards the end of period deliverable.
3.17. Disappointingly, we are not publishing the secondary network deliverables
indicator in this report as we are not confident in the robustness of the data. A
number of DNOs have resubmitted data, which in places considerably revised
their 2011 formal submissions under the licence. We will be reviewing companies‟
progress as part of the mid-period review.
28 For example, the number of assets that would be in need of replacement. 29 Electricity Distribution Price Control Review, Final Proposals, Incentives and Obligations, December
2009, 145/09, pp. 98-105.

20
Electricity Distribution Annual Report for 2010-11 30 March 2012
Workforce renewal
3.18. Sustainability of the operational workforce is essential to the long term
operation of distribution networks. To ensure sustainability and renewal of the
necessary skill sets, DNOs were provided with funding under the Closely
Associated Indirects Allowance specifically for operational workforce renewal,
including training of staff. Figure 3.4 shows each DNO‟s expenditure in 2010-11
against the DPCR5 allowance for workforce renewal. Each DNO‟s allowance may
be used at any point over the DPCR5 period.
Figure 3.4 Workforce renewal expenditure
3.19. Figure 3.4 shows what each DNO spent under the workforce renewal
mechanism in 2010-11. This is a „use it or lose it‟ allowance which is available
over the DPCR5 period.
0.0
1.0
2.0
3.0
4.0
5.0
6.0
2011 Baseline (£m 2010-11) 2011 actual (£m 2010-11)

21
Electricity Distribution Annual Report for 2010-11 30 March 2012
4. Safety, reliability and availability
This chapter sets out the electricity distribution companies‟ performance in 2010-
11 against the interruptions incentive scheme; the Electricity Standards of
Performance Regulations; tree-cutting for line clearance; and flood defence.
4.1. Network reliability is one of the key priorities for network regulation.
Customers expect electricity distribution network operators (DNOs) to minimise
interruptions and to restore supply as quickly as possible. We place financial
incentives on DNOs to deliver an appropriate level of service, based on a number
of key performance metrics.
4.2. The Interruptions Incentive Scheme (IIS) is the main reliability and
availability mechanism in the current price control. It uses two key performance
metrics to assess reliability and availability across the 14 DNOs: the number of
customer interruptions per 100 customers (CI) and the duration of these
interruptions to supply per customer known as customer minutes lost (CML).
2010-11 continued the trend of improving network reliability and availability.
Over the period 2002-03 to 2010-11, CI and CML performance improved by 17
per cent and 25 per cent respectively.30
4.3. Furthermore, this chapter shows DNO performance against the Electricity
Standards of Performance Regulations31. These Standards set out minimum
service levels for DNOs and payments due to customers should the DNO fail to
meet these standards.
4.4. All DNOs are subject to industry safety legislation and standards and are
monitored by the Health and Safety Executive (HSE) independently of Ofgem. We
collected data on each DNO‟s tree cutting and flood defence activity in 2010-11
and have outlined this below.
Quality of service metrics
4.5. CI and CML metrics are used to evaluate DNO performance and the rewards
or penalties under the IIS scheme. CI is the number of customers whose supplies
have been interrupted per 100 customers each year, where an interruption to
supply lasts for three minutes or longer, excluding re-interruptions. CMLs are the
duration of interruptions to supply each year, measured by the average customer
minutes lost per customer, where an interruption of supply to the customer lasts
three minutes or longer.
4.6. Ofgem sets CI and CML targets for the DNOs‟ performance on an annual
basis over the price control. An interruption to the supply of one customer for one
hour costs the DNO approximately £15, based on an averaged incentive rate
across all DNOs. Further information on the CI and CML metrics may be found in
the Special Conditions of the Electricity Distribution Licence.
30 CI and CML numbers have been weighted by type of interruption and exclude storms and other exceptional events. 31 Electricity (Standards of Performance) Regulations 2010. Statutory Instrument 698.

22
Electricity Distribution Annual Report for 2010-11 30 March 2012
4.7. Table 4.1 provides an overview of performance against quality of service
metrics. CI and CML performance is shown against several different target pairs.
The IIS indicators show performance against the IIS targets. These form the
basis for the IIS penalty or reward. The unplanned interruptions indicator shows
unplanned interruptions relative to that portion of the indicator and pre-arranged
components in the third and fourth indicators. The benchmark indicator shows
DNO performance against a benchmarked target.
4.8. The benchmark target is derived from the average performance of similar
types of high voltage circuit and the number of these which each DNO operates.
The IIS targets are derived from the benchmark but are also adjusted for
historical performance. Each aspect of performance shown in Table 4.1 is
explained in more detail in this chapter.
4.9. The interruptions over 12 hours indicator is based on the number of
customers off supply for over 12 hours per 1000 connected customers in 2010-
11. The red, amber and green performance bands are defined by thirds of the
range from zero to the maximum reported value of this measure.
Table 4.1 Quality of service indicators for 2010-11
DNO
IIS
(Incentivised) Unplanned
interruptions
Pre-arranged
interruptions
HV
Benchmark
Interruptions
over 12 hours
CI CML
WMID
EMID
ENWL
NPGN
NPGY
SWales
SWest
LPN
SPN
EPN
SPD
SPMW
SSEH

23
Electricity Distribution Annual Report for 2010-11 30 March 2012
SSES
Note: A red traffic light denotes failure to meet both the CI target and the CML target. An amber traffic light denotes failure to meet one of these two targets. Green indicates that the DNO has met or performed better than the CI and the CML target. A hashed traffic light indicates that performance is within 10% of the target.
Performance against interruption targets in 2010-11
4.10. For DPCR5 we set targets for each DNO for CI and CML. Performance
against these targets is linked to financial rewards and penalties under the IIS.
4.11. Under the IIS there are various weightings depending on the source of the
interruption, a weighting of 50 per cent is applied to pre-arranged interruptions in
the DNO‟s CI and CML count as customers are given a minimum of two days of
advance notice and can make necessary arrangements to deal with the
interruption. Approximately eight per cent of customer interruptions are pre-
arranged.
4.12. Interruptions due to problems on the transmission network are weighted at
zero per cent for CI but ten per cent for CML, acknowledging that DNOs can take
steps during an incident to mitigate the duration of interruptions. A ten per cent
weighting also applies for incidents caused by other connected systems.
4.13. DNOs may also claim an adjustment to their CI and CML annual
performance for exceptional events outside the DNO‟s control which had a
significant impact on their performance. Ofgem will only make such an
adjustment if the effects of the event exceed threshold levels set out in the
licence. In 2010-11 we recorded seven severe weather exceptional events (eg
storms and gales) and eight one-off exceptional events (eg vandalism,
unforeseeable asset failure, etc.).
4.14. IIS targets are set taking into account DNOs' historical performance and
other network factors which vary for each DNO. Figures 4.1 and 4.2 show the
DNOs' 2010-11 performance relative to their IIS targets for the year. To provide
an additional perspective, interruptions performance against the pure benchmark
target for each DNO is shown in figure 4.3 and 4.4. DNOs that outperformed their
targets are below the line and those that did not are above.

24
Electricity Distribution Annual Report for 2010-11 30 March 2012
Figure 4.1 CI – 2010-11 performance relative to IIS targets
Figure 4.2 CML – 2010-11 performance relative to IIS targets
4.15. Figure 4.1 shows that in 2010-11, 13 of the 14 DNOs outperformed their CI
targets and will receive a financial reward under the incentive scheme while the
remaining DNO (EPN) incurred a financial penalty.
4.16. Figure 4.2 shows that 11 DNOs beat their CML targets over the same period
and will receive a financial reward. The remaining three DNOs (LPN, EPN and
SSEH) incurred a financial penalty.
4.17. The DNOs‟ individual performance and resulting rewards and penalties for
2010-11 are set out in Table 4.2 below. The CI and CML values used here are
weighted as described in paragraphs 4.11 and 4.12.
0
20
40
60
80
100
120
WM
ID
EMID
ENW
L
NP
GN
NP
GY
SWal
es
SWe
st
LPN
SPN
EPN
SPD
SPM
W
SSEH
SSES
%
CIs as a % of benchmark
Above line = performing worse, below = performing
better than benchmark
0
20
40
60
80
100
120
WM
ID
EMID
ENW
L
NP
GN
NP
GY
SWal
es
SWe
st
LPN
SPN
EPN
SPD
SPM
W
SSEH
SSES
%
CML as a percentage of target
above line = performing worse, below = performing
better than target

25
Electricity Distribution Annual Report for 2010-11 30 March 2012
Table 4.2 2010-11 Rewards and penalties for CI and CML
Customer interruptions 2010-11 Customer minutes lost 2010-11
DNO Target Performance
Penalty/
reward
(£
million)
Target Performance
Penalty/
reward
(£
million)
WMID 109.9 102.2 0.8 97.0 89.5 3.0
EMID 75.7 61.7 1.7 69.0 54.9 5.9
ENWL 52.9 47.8 0.6 55.6 47.3 4.6
NPGN 68.3 65.2 0.2 71.3 71.1 0.0
NPGY 75.3 69.9 0.5 76.0 68.2 2.9
SWales 79.5 58.4 1.1 44.6 32.4 2.2
SWest 73.6 61.5 0.8 51.0 42.6 2.1
LPN 33.4 24.4 2.7 41.0 42.4 -0.5
SPN 85.0 76.9 0.8 87.6 73.2 5.2
EPN 76.1 86.0 -1.6 71.1 72.4 -0.8
SPD 60.1 50.7 0.8 65.5 49.4 5.3
SPMW 45.6 39.3 0.4 61.1 47.5 2.8
SSEH 77.0 74.0 0.1 75.1 78.4 -0.5
SSES 73.8 63.6 1.3 69.1 64.1 2.4
GB total 10.3 34.6
GB average 0.7 2.5
4.18. Thirteen DNOs received a reward and one DNO received a penalty for CI
performance. Eleven DNOs received a reward and three DNOs received a penalty
for CML performance. On average, DNOs were awarded £740,000 for CI
performance and £2.5 million for CML performance. In total, DNOs earned £45m
in 2010-11 under the IIS scheme.
4.19. The underlying average number of interruptions per 100 customers has
fallen (improved) by 17 per cent and the number of customer minutes lost has
decreased (improved) by 25 per cent from 2002-03 to 2010-11. Over the 2010-
11 reporting year, average CI was 9.2 per cent lower (better) than the average
target and average CML was 10.5 per cent lower (better) than the average
target. These values are weighted as described in paragraphs 4.11 and 4.12 and
exclude severe weather and other one-off exceptional events.
Performance against interruption benchmark in 2010-11
4.20. DNO networks have inherited differences, including network design,
configuration, and topographical factors such as length of network, customer
location and customer density. In order to take these factors into account when
comparing quality of supply, Ofgem, jointly with the Quality of Service Working
Group, has developed a method for calculating benchmark targets for CI and CML
(excluding exceptional events).
4.21. This method involves grouping physically similar parts of networks together
and then comparing performance at a disaggregated level. Overall benchmarks
are then calculated for each company based on the number of circuits it has in

26
Electricity Distribution Annual Report for 2010-11 30 March 2012
each group, DNO customer numbers per circuit and average circuit length. DNO
performance against their benchmark CI and CML targets are shown in Figures
4.3 and 4.4.
Figure 4.3 CI – 2010-11 high voltage circuit performance against
benchmarks
Figure 4.4 CML – 2010-11 high voltage circuit performance against
benchmarks
4.22. In the Figures 4.3 and 4.4, CI and CML performance below the target (red
line) is better than performance above the line. The benchmark figures show a
wider range of DNO performance than the Figures 4.1 and 4.2. This is because
the IIS targets are a combination of historic performance and benchmarking.
Performance trends 2001-02 to 2010-11
The effect of exceptional events on CI and CML
0
20
40
60
80
100
120
WM
ID
EMID
ENW
L
NP
GN
NP
GY
SWal
es
SWe
st
LPN
SPN
EPN
SPD
SPM
W
SSEH
SSES
%
CIs as a % of benchmark
Above line = performing worse, below = performing
better than benchmark
0
20
40
60
80
100
120
140
WM
ID
EMID
ENW
L
NP
GN
NP
GY
SWal
es
SWe
st
LPN
SPN
EPN
SPD
SPM
W
SSEH
SSES
%
CML as a % of benchmark
above line = performing worse, below = performing
better than benchmark

27
Electricity Distribution Annual Report for 2010-11 30 March 2012
4.23. Figures 4.5 and 4.6 show the average CI and CML performance for Great
Britain‟s distribution networks over the past decade from April 2002 to March
2011. The CI and CML chart below are not IIS-weighted as described in
paragraphs 4.10, 4.11, 4.12. This allows comparison of performance including
exceptional events and performance excluding exceptional events.
Figure 4.5 Average CI per 100 customers in Great Britain
Figure 4.6 Average CML per customer in Great Britain
Impact of performance on customers
4.24. In each year performance can vary across the DNOs due to the severity of
the weather. Each DNO‟s CI and CML performance can be used to indicate an
average customer‟s experience of interruptions, that is, how often they have had
a power-cut, and its duration. For 2010-11, including interruptions due to storms,
performance nationally for Great Britain was 69 CI and 70 CML. These values are
not IIS-weighted according to the description in paragraphs 4.10, 4.11, 4.12.
4.25. Table 4.3 provides a guide to what each DNO‟s CI and CML performance
means on average for customers. This data is based on performance including
0
20
40
60
80
100
2001-02 2002-03 2003-04 2004-05 2005-06 2006-07 2007-08 2008-09 2009-10 2010-11
Including exceptional events Excluding exceptional events
0
20
40
60
80
100
120
2001-02 2002-03 2003-04 2004-05 2005-06 2006-07 2007-08 2008-09 2009-10 2010-11
Including exceptional events Excluding exceptional events

28
Electricity Distribution Annual Report for 2010-11 30 March 2012
storms. For example, based on 2010-11 performance, an average customer in
Great Britain would be interrupted seven times over a ten year period. Averaging
customer minutes lost across all Great Britain customers, each customer would be
off supply for 1 hour and 10 minutes each year.
Table 4.3 Interruption frequency and duration
DNO Customer interruptions
Average minutes of lost
supply per customer per
year
WMID 1 every year 1 hour 40 minutes
EMID 3 every 5 years 1 hour
ENWL 1 every 2 years 55 minutes
NPGN 4 every 5 years 1 hour 25 minutes
NPGY 7 every 10 years 1 hour 15 minutes
SWales 3 every 5 years 37 minutes
SWest 7 every 10 years 49 minutes
LPN 1 every 3 years 43 minutes
SPN 4 every 5 years 1 hour 20 minutes
EPN 9 every 10 years 1 hour 20 minutes
SPD 1 every 2 years 54 minutes
SPMW 1 every 2 years 1 hour 3 minutes
SSEH 1 every year 1 hour 56 minutes
SSES 7 every 10 years 1 hour 13 minutes
GB average 7 every 10 years 1 hour 10 minutes
4.26. Table 4.4 shows each DNO‟s number of customers and the number of faults
that have occurred on their network. From these we can determine the average
number of customers interrupted by each fault. The number of faults shown here
includes those due to storms. On average there were 102 customers interrupted
for every network fault in Great Britain in 2010-11.

29
Electricity Distribution Annual Report for 2010-11 30 March 2012
Table 4.4 2010/11 Customers interrupted per fault
2010/11
DNO
Total number of
Customers
Interrupted
Total number of
faults
Customers per
fault
WMID 2,408,508 13,560 178
EMID 1,542,421 14,802 104
ENWL 1,128,266 14,147 80
NPGN 993,847 10,997 90
NPGY 1,545,118 17,472 88
S Wales 605,589 6,743 90
S West 949,855 12,899 74
LPN 533,307 7,583 70
SPN 1,685,037 11,021 153
EPN 2,944,308 19,493 151
SPD 1,006,145 13,274 76
SPMW 606,295 11,186 54
SSEH 554,821 7,021 79
SSES 1,826,844 20,187 90
GB Total 18,330,361 180,385 102
4.27. Table 4.5 shows the length of each DNO‟s network and the number of faults
that have occurred on their network. From these we can determine the number of
faults per kilometre of network. The number of faults shown here includes those
due to storms. On average there were 0.228 faults for each kilometre of network
in Great Britain in 2010-11.
Table 4.5 Faults per kilometre
Faults per km km Total number of
faults Faults per km
WMID 63,459 13,560 0.214
EMID 71,700 14,802 0.206
ENWL 56,952 14,147 0.248
NPGN 40,160 10,997 0.274
NPGY 52,783 17,472 0.331
SWales 35,162 6,743 0.192
SWest 50,183 12,899 0.257
LPN 36,628 7,583 0.207
SPN 52,200 11,021 0.211
EPN 96,266 19,493 0.202
SPD 63,848 13,274 0.208
SPMW 49,680 11,186 0.225
SSEH 47,024 7,021 0.149
SSES 76,220 20,187 0.265
GB Total 792,266 180,385 0.228
30
Electricity Distribution Annual Report for 2010-11 30 March 2012
Electricity Standards of Performance
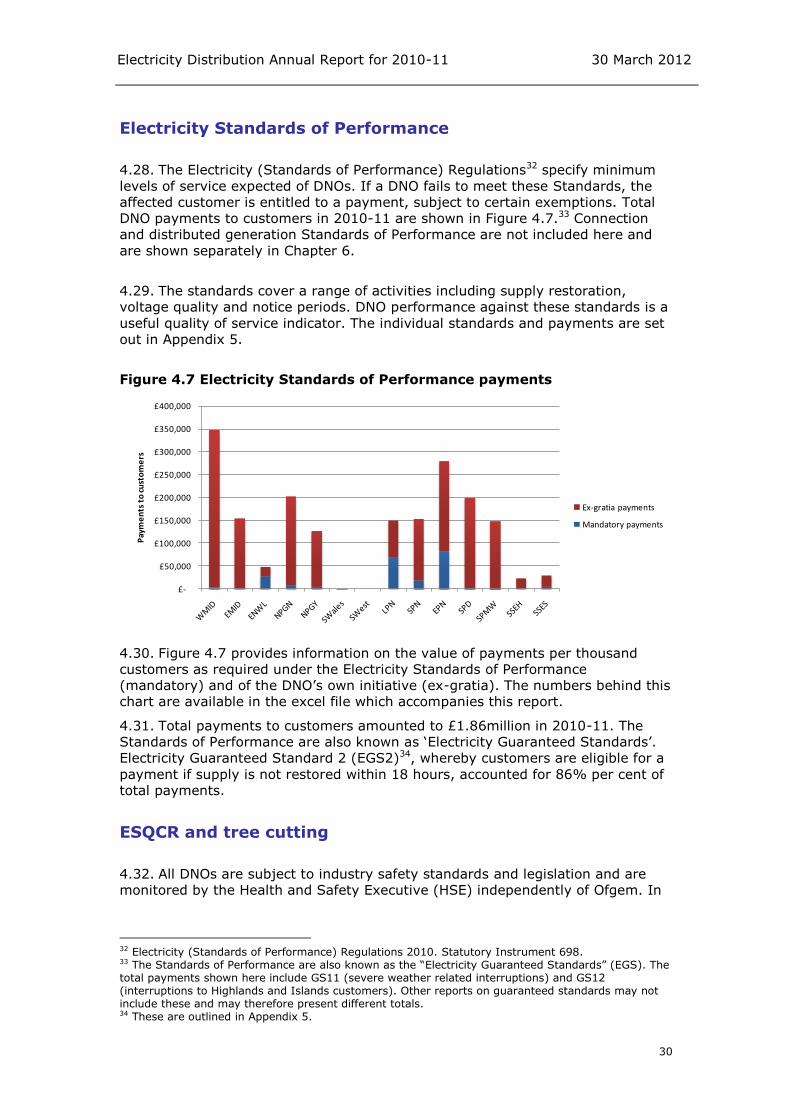
4.28. The Electricity (Standards of Performance) Regulations32 specify minimum
levels of service expected of DNOs. If a DNO fails to meet these Standards, the
affected customer is entitled to a payment, subject to certain exemptions. Total
DNO payments to customers in 2010-11 are shown in Figure 4.7.33 Connection
and distributed generation Standards of Performance are not included here and
are shown separately in Chapter 6.
4.29. The standards cover a range of activities including supply restoration,
voltage quality and notice periods. DNO performance against these standards is a
useful quality of service indicator. The individual standards and payments are set
out in Appendix 5.
Figure 4.7 Electricity Standards of Performance payments
4.30. Figure 4.7 provides information on the value of payments per thousand
customers as required under the Electricity Standards of Performance
(mandatory) and of the DNO‟s own initiative (ex-gratia). The numbers behind this
chart are available in the excel file which accompanies this report.
4.31. Total payments to customers amounted to £1.86million in 2010-11. The
Standards of Performance are also known as „Electricity Guaranteed Standards‟.
Electricity Guaranteed Standard 2 (EGS2)34, whereby customers are eligible for a
payment if supply is not restored within 18 hours, accounted for 86% per cent of
total payments.
ESQCR and tree cutting
4.32. All DNOs are subject to industry safety standards and legislation and are
monitored by the Health and Safety Executive (HSE) independently of Ofgem. In
32 Electricity (Standards of Performance) Regulations 2010. Statutory Instrument 698. 33 The Standards of Performance are also known as the “Electricity Guaranteed Standards” (EGS). The total payments shown here include GS11 (severe weather related interruptions) and GS12 (interruptions to Highlands and Islands customers). Other reports on guaranteed standards may not include these and may therefore present different totals. 34 These are outlined in Appendix 5.
£-
£50,000
£100,000
£150,000
£200,000
£250,000
£300,000
£350,000
£400,000
Pay
me
nts
to
cu
sto
me
rs
Ex-gratia payments
Mandatory payments

31
Electricity Distribution Annual Report for 2010-11 30 March 2012
DPCR5 we allocated DNOs allowances for safety related activities, such as flood
defence and tree-cutting to maintain clearances around network assets.
4.33. The Electricity Safety, Quality and Continuity Regulations 2002 (ESQCR),
set out a number of requirements for electricity networks, including the
requirement that DNOs maintain trees a safe distance from overhead line
networks. The Energy Networks Association (ENA) has produced a technical
specification on overhead line clearances.35
4.34. The DNOs provide forecast business plans to Ofgem at the start of the price
control which detail forecast expenditure and activities. The forecasts include an
estimate of the volume of tree cutting activity anticipated for each year of the
price control. Figure 4.8 shows DNO‟s progress relative to their forecasts.
Figure 4.8 Progress on forecast tree-cutting volumes
4.35. Figure 4.8 shows that DNOs have made variable levels of progress
achieving their forecast tree cutting programmes. Several DNOs carried out a
lower proportion of the 2010-11 tree cutting volumes than they had planned to
complete. To comply with the statutory obligations placed on DNOs by the
Department of Energy and Climate Change (DECC), it is expected that DNOs will
need to complete their planned volumes over the DPCR5 period.
Flood defence
4.36. Flood defence is protection installed to limit or eliminate the risk of flood
damage to a substation. For DPCR5 DNOs have been asked to report their activity
in terms of flood mitigation schemes and flooding site surveys completed for each
substation. DNOs submitted a forecast of the number of substations where they
expected to complete flood mitigation schemes in 2010-11 to Ofgem. Table 4.6
shows the progress that each DNO has made against these forecasts.
4.37. The majority of DNOs did not complete any schemes in 2010-11 and the
overall number of schemes completed was much lower than forecast. Ofgem
therefore expects the number of schemes completed by each DNO to increase
35 Energy Networks Association. ENATS 43-8: Overhead Line Clearances.
0%
20%
40%
60%
80%
100%
120%
WMID EMID ENWL NPGN NPGY SWales SWest SPN EPN SPD SPMW SSEH SSES GB
Pe
rce
nta
ge o
f fo
reca
st s
pan
s cu
t

32
Electricity Distribution Annual Report for 2010-11 30 March 2012
significantly over the remainder of DPCR5 and will continue to monitor progress in
this area closely.
Table 4.6 Flood defence activity
Forecast
2010-11
activity
volumes
2010-11
activity
volumes
Per cent of forecast complete
WMID 3 0 0%
EMID 4 0 0%
ENWL 10 11 Completed more schemes than forecast
NPGN 0 0 No schemes forecast for completion
NPGY 0 0 No schemes forecast for completion
SWales 6 1 17%
SWest 3 2 67%
LPN 3 0 0%
SPN 5 0 0%
EPN 6 0 0%
SPD 1 0 0%
SPMW 2 0 0%
SSEH 1 0 0%
SSES 0 0 No schemes forecast for completion

33
Electricity Distribution Annual Report for 2010-11 30 March 2012
5. Customer satisfaction and social responsibility
This chapter sets out distribution network operators‟ performance against
customer service incentives which include telephone response performance; the
worst served customer funding mechanism; priority services; the electricity
discretionary reward scheme and undergrounding of overhead lines in national
parks and areas of outstanding natural beauty.
5.1. Customer service is one of Ofgem's key priorities for network regulation.
Customers expect electricity distribution network operators (DNOs) to be readily
contactable and responsive to the needs of their stakeholders. We place financial
incentives on DNOs to deliver an appropriate level of service based on, where
possible, customers‟ willingness to pay. DNOs also have licence obligations to
ensure their services meet customers‟ expectations and needs.
5.2. There are a number of metrics against which customer service is assessed.
These metrics form the basis of the financial incentives to encourage DNOs to
deliver an appropriate level of service. DNOs receive a financial reward or penalty
according to their performance.
5.3. Customer service is a key focus of the current price control (DPCR5) and the
future RIIO price control framework. There has also been some delay in the DNOs
making use of the funding mechanism to address the needs of worst served
customers. We will continue to monitor performance in these areas and the
effects of the introduction of the broad measure of customer satisfaction in 2012-
13.
5.4. The electricity discretionary reward scheme (DRS) has been an effective
mechanism. However, following an open letter consultation, the DRS has been
terminated as it is considered that the scope of other DPCR5 incentives (ie the
broad measure of customer satisfaction and the LCNF) cover activities included in
the DRS.
Broad measure of customer satisfaction
5.5. In 2010 we developed the broad measure of customer satisfaction as part of
the review process for the current price control to capture the views of all types
of customers across a range of contact experiences. The broad measure consists
of three components: the customer satisfaction survey, complaints metric and
DNO stakeholder engagement. The broad measure will come into effect in April
2012 for the 2012-13 regulatory year.
5.6. The broad measure of customer satisfaction provides DNOs with an
opportunity to earn a financial reward if they are successful in understanding and
responding to stakeholder requirements. They can also be penalised if they fail to
meet the targets set out under the customer satisfaction survey and the
complaints metric. Therefore, network companies are expected to actively engage
with and listen to stakeholders‟ views about their performance.

34
Electricity Distribution Annual Report for 2010-11 30 March 2012
Telephone response performance
5.7. Pending the introduction of the broad measure of customer satisfaction in
2012-13, we continued the application of two telephony performance measures in
2010-11. These are the quality of response and the speed of response.
Quality of response
5.8. Each DNO is assessed on the quality of its telephone response through a
monthly customer satisfaction survey. DNOs may be rewarded or penalised
depending on their overall annual score. Performance in DPCR5 is assessed
across the three key areas listed below:
The politeness of the members of staff
The usefulness of the information given
Satisfaction with the speed of response.
5.9. Customers are asked to score DNOs on a scale of 1 (very dissatisfied) to 5
(very satisfied) based on their individual experiences of the telephone
conversation they had with the DNO during a power outage.
5.10. DNOs are subject to a sliding-scale penalty if their annual mean
performance deteriorates below 3.9. There is a small reward of 0.05 per cent of
revenue for those DNOs with annual mean scores equal to or greater than 4.4.
This gives DNOs an incentive to maintain a high level of telephone performance
where only exceptional performance is rewarded.
5.11. Table 5.1 shows each DNO‟s score for the period from 1 April 2010 until
31 March 2011 for the three assessed attributes listed above. The performance
scores and rankings reported here are based on the mean annual scores.

35
Electricity Distribution Annual Report for 2010-11 30 March 2012
Table 5.1 2010-11 Quality of telephone response overall performance
scores
Rank 2010-11 DNO 2010-11 Scores Rewards/Penalties
(£m 2010-11)
1 SWales 4.64 0.39
2 SWest 4.60 0.58
3 SPMW 4.49 0.67
4 ENWL 4.43 0.0036
5 SPD 4.42 0.77
6 EMID 4.38 0.00
7 NPGY 4.37 0.00
8 WMID 4.36 0.00
9 NPGN 4.33 0.00
10 EPN 4.30 0.00
11 SSES 4.27 0.00
12 SPN 4.24 0.00
13 SSEH 4.18 0.00
14 LPN 4.15 0.00
GB average 4.37
Note: Quality of telephone overall performance scores are out of five.
5.12. The overall assessed mean score for the 12 month period was 4.37. All
DNOs recorded overall mean scores above the penalty threshold. Four DNOs were
eligible for rewards for their quality of telephone response performance scores.
These were SWales (4.64), SWest (4.60), SPMW (4.49) and SPD (4.42).
Performance trends
5.13. Figure 5.1 shows that in general after a decline in 2006-07 the average
quality of telephone response (both hold and redial systems) in Great Britain
improved over the previous price control period (DPCR4) but has declined slightly
in 2010-11. The decline may be due to the inclusion of unsuccessful calls within
the telephony incentive metric from April 2010. This was included to supplement
the telephony survey and to encourage DNOs to keep their unsuccessful calls to a
minimum.
36 Further details of ENWL‟s telephony response is available in Chapter 9.

36
Electricity Distribution Annual Report for 2010-11 30 March 2012
Figure 5.1 2010-11 Quality of telephone response overall performance
Speed of response
5.14. DNOs must also report their performance on the speed of telephone
response by an agent once a customer has decided to speak to an agent. This
metric feeds into the quality of telephone response score.
5.15. In 2010-11 WMID and EMID reported performance against redial systems.
All other DNOs reported performance against hold systems. Table 5.2 sets out the
average speed of response (in seconds) for the period 1 April 2010 until 31 March
2011 for each DNO split by telephone system.
3.7
3.8
3.9
4.0
4.1
4.2
4.3
4.4
4.5
4.6
4.7
Ind
. Me
an 0
5-0
6
Ind
. Me
an 0
6-0
7
Ind
. Me
an 0
7-0
8
Ind
. Me
an 0
8-0
9
Ind
. Me
an 0
9-1
0
Ind
. Me
an 1
0-1
1
WM
ID
EMID
ENW
L
NP
GN
NP
GY
SWal
es
SWe
st
LPN
SPN
EPN
SPD
SPM
W
SSEH
SSES
Pe
rfo
rman
ce s
core
s (o
ut
of
five
)
2010-11 quality of telephone response overall performance scores Quality of telephone response overall mean performance scoresabove line = performance that resulted in reward

37
Electricity Distribution Annual Report for 2010-11 30 March 2012
Table 5.2 2010-11 average speed of telephone response (seconds)
Hold system
DNO Response time (s)
WMID* 24.6
EMID* 18.5
ENWL 3.7
NPGN 12.2
NPGY 11.6
SWales 1.5
SWest 1.5
LPN 31.8
SEPN 33.8
EPN 35.0
SPD 10.4
SPMW 10.5
SSEH 19.0
SSES 18.7
Average 16.6
Note: *WMID and EMID use redial systems. All other DNOs use hold systems.
5.16. SWales and SWest reported the fastest response times of 1.5 seconds each.
An average response time of 15.8 seconds was reported for hold systems and
21.5 seconds for redial systems.
Worst Served Customer Scheme
5.17. A funding mechanism of up to £42m is available over the price control
period for DNOs completing work to support their worst served customers
(WSCs). This was put in place because the Interruptions Incentive Scheme (IIS)
did not provide adequate incentives to improve service to customers experiencing
large numbers of interruptions over a number of years. Each DNO can log up their
costs against this scheme and can reclaim these up to a maximum amount
defined for each DNO according to the number of WSCs on its network. There is a
£1,000 cap which can be reclaimed per WSC.
5.18. WSCs are defined as customers experiencing greater than or equal to five
higher voltage interruptions on average over a three year period, with a minimum
of three faults in each year. Expenditure may be reclaimed post-implementation
for interventions which are shown to have been successful in improving service to
WSCs.
5.19. In 2010-11 SWales and SWest were the only DNOs to record expenditure
on schemes to improve service to WSCs. WSC is a new initiative and we
anticipate that more companies will take advantage of it in time.

38
Electricity Distribution Annual Report for 2010-11 30 March 2012
Priority Services Register
5.20. DNOs have a duty to establish and maintain a Priority Services Register
(PSR) of customers who are of pensionable age, are disabled, are chronically sick,
have special communication needs or where a request has been made to add a
person‟s name to the PSR.37 Table 5.3 shows the percentage of customers on
each DNO network who are registered on the PSR.
Table 5.3 Customers on PSR by DNO
DNO
Number of customers
on the PSR at the end of the reporting year
Number of customers Percentage of
customers on PSR
WMID 129,046 2,446,951 5.3%
EMID 163,673 2,614,165 6.3%
ENWL 138,804 2,359,391 5.9%
NPGN 131,297 1,575,686 8.3%
NPGY 149,214 2,258,404 6.6%
SWales 74,337 1,099,333 6.8%
SWest 112,499 1,541,188 7.3%
LPN 15,184 2,251,892 0.7%
SPN 37,370 2,233,288 1.7%
EPN 13,021 3,516,859 0.4%
SPD 74,269 1,992,998 3.7%
SPMW 66,259 1,485,153 4.5%
SSEH 31,973 740,768 4.3%
SSES 98,833 2,934,581 3.4%
5.21. The DNOs have the duty to give information and advice to PSR customers
and to provide a range of services for other vulnerable domestic customers, such
as a service which provides a password to identify representatives of the network
operator. Required services are detailed in the Electricity Distribution Licence38.
Electricity discretionary reward scheme (DRS)
5.22. Under the DRS, the panel can allocate up to £1 million per year to DNOs
who have best served the interests of their customers. The scheme is not
intended to directly fund initiatives proposed by DNOs. It is instead designed to
highlight leading performance within the industry and to recognise DNOs who go
beyond their licence obligations in the categories of service covered by the
scheme.
5.23. Each year DNOs are invited to submit entries to Ofgem detailing the
initiatives and strategies they consider have best served the interests of
37 Subject to certain conditions according to the Standard Conditions of the Electricity
Licence. 38 Electricity Distribution Licence. Condition 10. Special services and complaints procedures.
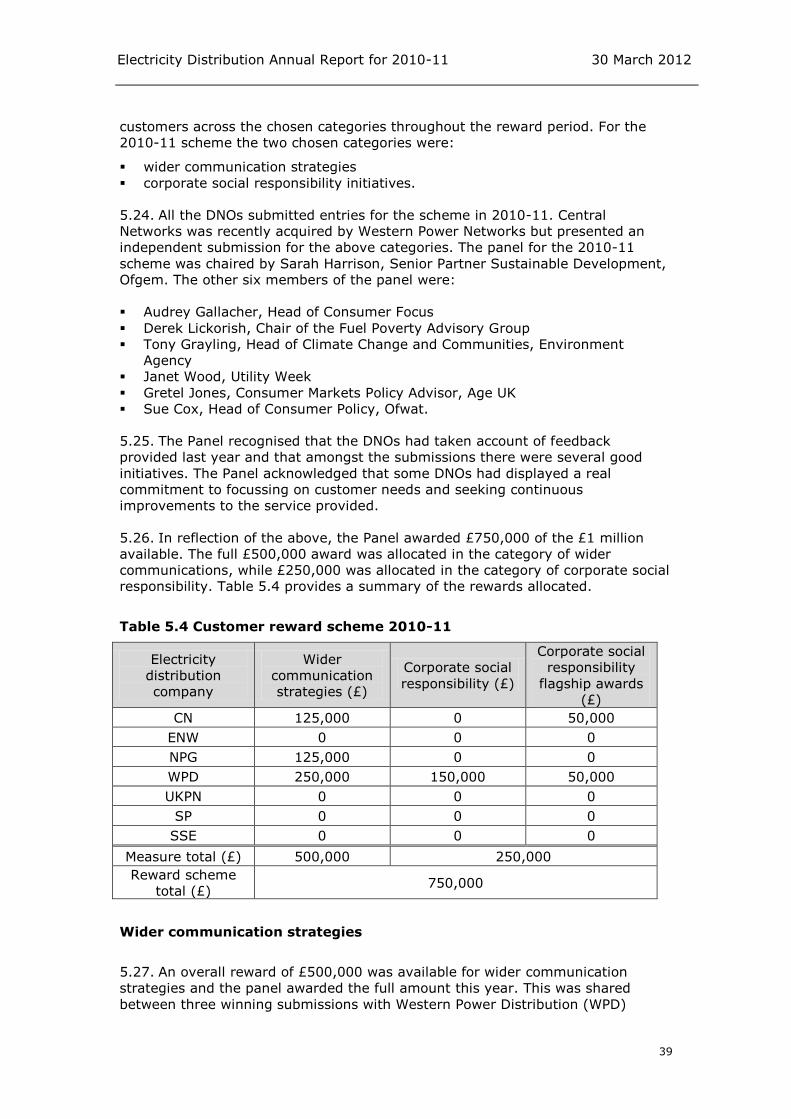
39
Electricity Distribution Annual Report for 2010-11 30 March 2012
customers across the chosen categories throughout the reward period. For the
2010-11 scheme the two chosen categories were:
wider communication strategies
corporate social responsibility initiatives.
5.24. All the DNOs submitted entries for the scheme in 2010-11. Central
Networks was recently acquired by Western Power Networks but presented an
independent submission for the above categories. The panel for the 2010-11
scheme was chaired by Sarah Harrison, Senior Partner Sustainable Development,
Ofgem. The other six members of the panel were:
Audrey Gallacher, Head of Consumer Focus
Derek Lickorish, Chair of the Fuel Poverty Advisory Group
Tony Grayling, Head of Climate Change and Communities, Environment
Agency
Janet Wood, Utility Week
Gretel Jones, Consumer Markets Policy Advisor, Age UK
Sue Cox, Head of Consumer Policy, Ofwat.
5.25. The Panel recognised that the DNOs had taken account of feedback
provided last year and that amongst the submissions there were several good
initiatives. The Panel acknowledged that some DNOs had displayed a real
commitment to focussing on customer needs and seeking continuous
improvements to the service provided.
5.26. In reflection of the above, the Panel awarded £750,000 of the £1 million
available. The full £500,000 award was allocated in the category of wider
communications, while £250,000 was allocated in the category of corporate social
responsibility. Table 5.4 provides a summary of the rewards allocated.
Table 5.4 Customer reward scheme 2010-11
Electricity
distribution
company
Wider
communication
strategies (£)
Corporate social
responsibility (£)
Corporate social
responsibility
flagship awards
(£)
CN 125,000 0 50,000
ENW 0 0 0
NPG 125,000 0 0
WPD 250,000 150,000 50,000
UKPN 0 0 0
SP 0 0 0
SSE 0 0 0
Measure total (£) 500,000 250,000
Reward scheme
total (£) 750,000
Wider communication strategies
5.27. An overall reward of £500,000 was available for wider communication
strategies and the panel awarded the full amount this year. This was shared
between three winning submissions with Western Power Distribution (WPD)

40
Electricity Distribution Annual Report for 2010-11 30 March 2012
receiving £250,000, Central Networks (CN, now part of WPD) receiving £125,000
and Northern Powergrid (NPG, previously CE Electric UK) receiving £125,000.
5.28. WPD was awarded £250,000 in recognition of the continuous wide breadth
and depth of their communication strategy and the extent to which its initiatives
and activities are embedded into their ongoing business practices. Its broad range
of initiatives continues to demonstrate innovative thinking and effective use of the
feedback opportunities provided by an established process of stakeholder
engagement.
5.29. CN and NPG also received an award of £125,000 each, for the clear
evolution of their strategies and the way they had taken account of learning from
previous years. This included the use of new technologies and their commitment
to finding out, understanding and responding to customer needs.
Corporate social responsibility initiatives
5.30. An overall reward of £500,000 was available for corporate social
responsibility. The Panel was disappointed that whilst there was some progress in
this area, this was still not at the level expected from the companies. The view
was that there was still room for improvement in the quality of submissions,
specifically in relation to DNOs being able to demonstrate the measurable benefits
delivered through their initiatives. Therefore, it was decided to limit the award to
£250,000.
5.31. WPD received a reward of £150,000 for their use of partnerships, the way
carbon reduction initiatives had been embedded within the business and their
staff engagement.
5.32. In addition, two flagship awards totalling £100,000 were granted under the
corporate social responsibility category. WPD received £50,000 for their
Community Chest initiative which was considered a good demonstration of the
impact of forging relationships with stakeholders. CN received £50,000 for their
Pathfinder internet application which allowed developers of distributed generation
to identify potential areas of development.
5.33. Further information about the customer reward scheme can be found on our
website and the associated documents published with this report.39
Future of the Discretionary Reward Scheme
5.34. The scheme has resulted in a number of customer focussed initiatives
including improvements to the priority services register, working with
communities and charities, improving communications with customers,
particularly through new technology and facilitating the development of green
technologies.
5.35. However as the scheme has run since 2006, we expected DNOs to
demonstrate that they were focussing on initiatives that they had identified as
39 www.ofgem.gov.uk/Networks/ElecDist/QualofServ/CustServRewSch/Pages/CustServRewSch.aspx

41
Electricity Distribution Annual Report for 2010-11 30 March 2012
their stakeholders‟ priorities, demonstrate how the initiatives shaped their
company strategy and measure the impact their initiatives have on stakeholders
and the environment. In recent years the panel has not awarded the full amount
of the DRS available to them in recognition that they are not meeting these
expectations.
5.36. Ofgem published an open letter consultation seeking stakeholder views on
whether to continue with the scheme, to modify it or to terminate it. We have
taken into account all responses and have decided to remove the scheme on the
basis that the scope of other DPCR5 incentives (ie the broad measure of
Customer Satisfaction and the LCNF) cover activities included in the DRS.
Undergrounding in areas of outstanding natural beauty and national parks
5.37. Each DNO has a defined amount of funding which they can recover at the
end of the price control period to pay for undergrounding of network cables in
AONBs and National Parks. This allowance is separate from other network asset
funding because it is more expensive to put cables underground. This allowance is
provided to reflect stakeholder interest in visual amenity and each DNO‟s funding
is based on the extent of its network which crosses AONBs or National Parks.
5.38. For DPCR5 there is an overall expenditure cap on undergrounding of
£65.8m (on a 2010-11 price basis). This figure has been calculated from the
national average level of customer willingness to pay for the undergrounding of
1.5 per cent of overhead lines in AONBs and National Parks.40
5.39. The funding cap applies to the entire DPCR5 period. As such there are no
requirements to spend it in any given year. Similarly, there is no obligation on
DNOs to spend the allowances, although we would expect them to be able to
communicate with stakeholders as to what they are doing and why.
5.40. This expenditure is ultimately recovered from customers and DNOs are
expected to engage with local stakeholders to determine their views, expectations
and priorities.
5.41. Figure 5.2 shows each DNO‟s spend on undergrounding in 2010-11, the first
year of the current price control period. A total of £2.91m was spent in 2010-11
for undergrounding of the £65.8m available throughout the five year period.
40 Electricity Distribution Price Control Review, Final Proposals - Incentives and Obligations, 7 December 2009, 145/09, pp. 48.
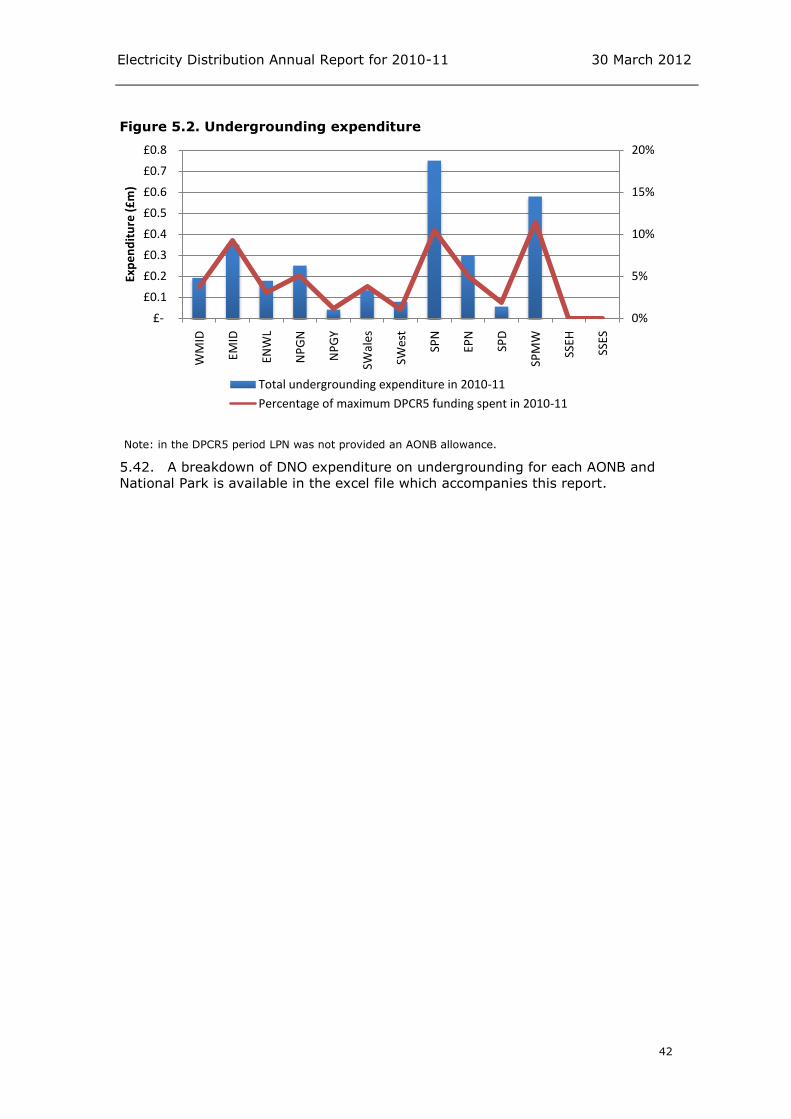
42
Electricity Distribution Annual Report for 2010-11 30 March 2012
Figure 5.2. Undergrounding expenditure
Note: in the DPCR5 period LPN was not provided an AONB allowance.
5.42. A breakdown of DNO expenditure on undergrounding for each AONB and
National Park is available in the excel file which accompanies this report.
0%
5%
10%
15%
20%
£-
£0.1
£0.2
£0.3
£0.4
£0.5
£0.6
£0.7
£0.8
WM
ID
EMID
ENW
L
NP
GN
NP
GY
SWal
es
SWes
t
SPN
EPN
SPD
SPM
W
SSEH
SSES
Exp
en
dit
ure
(£
m)
Total undergrounding expenditure in 2010-11
Percentage of maximum DPCR5 funding spent in 2010-11

43
Electricity Distribution Annual Report for 2010-11 30 March 2012
6. Connections
This chapter sets out key information on competition in connections; timeliness of
connection offer quotations; Connections Standards of Performance; and
distributed generation connections.
6.1. The connections market is important to consumers who require a new or
upgraded electricity supply41. It also has a key role to play in the efficient and
timely connection of low-carbon generation to the distribution networks, a key
element of the Government‟s plan for the transition to a low carbon economy by
2020.
6.2. The market is open to competition and a number of new players compete
with incumbent network companies to provide new connections. We use the
regulatory framework to protect customers and facilitate the continued
development of competition in this market in order to drive efficient and timely
delivery of connection services for customers.
6.3. Feedback from DG stakeholder discussion fora highlighted the potential for
improvement in DNO‟s DG connections service. Stakeholders requested better
and more timely information from DNOs and also greater transparency with
regard to the scope and cost of works to provide a connection.42 DNOs have put
measures in place to improve how they address the needs of this important
customer group and service levels will be monitored through a second round of
DG fora.
6.4. This report does not cover the competition tests which were introduced in
April 2010. No DNO submitted an application to submit to the test in 2010-11.
Competition in connections
6.5. In 2010-11 a total of 196,134 metered electricity connections were
completed by distribution network operators (DNOs), independent distribution
network operators (IDNOs) and independent connection providers (ICPs) in Great
Britain.43 This represents a four per cent increase on the 188,608 connections
undertaken in 2009-10.
6.6. Table 6.1 shows that 18 per cent of the connections in 2010-11 were made
to IDNOs‟ networks and 82 per cent were made to DNOs‟ networks. This
compares to five and nine per cent of connections being made to IDNOs‟
networks in 2008-09 and 2009-10 respectively.
41 This refers to the upgrading of existing exit points without the provision of new exit points and must account for either an increase in capacity available to an existing exit point of the DNO network, or allow an existing exit point to be able to feed a new supply of electricity into the DNO network. 42 Further information on the feedback from DG stakeholders is available on our website at: http://www.ofgem.gov.uk/Pages/MoreInformation.aspx?docid=220&refer=NETWORKS/ELECDIST/POLICY/DISTGEN 43 Service alterations are excluded from DNO connection volumes but are included in IDNO reporting.

44
Electricity Distribution Annual Report for 2010-11 30 March 2012
Table 6.1 Total number of new and modified metered electricity
connections
2008-09 2009-10 2010-11
Connections by: DNO IDNO DNO IDNO DNO IDNO
Licensee 233,836 12,133 164,832 16,634 151,533 29,059
(90.1%) (4.7%) (87.4%) (8.8%) (77.3%) (14.8%)
Independent
Connection Provider
12,911 678 6,025 1,117 8,869 6,673
(5.0%) (0.3%) (3.2%) (0.6%) (4.5%) (3.4%)
Total 246,747 12,811 170,857 17,751 160,402 35,732
(95.1%) (4.9%) (90.6%) (9.4%) (81.8%) (18.2%)
Industry Total 259,558 188,608 196,134
Note: Percentages may not add due to rounding. Companies affiliated to the licensee are included in licensee figures in 2010-11. IDNO totals for 2009-10 and 2010-11 include connections to out-of-area networks operated by SSE.
6.7. Figure 6.1 shows that the trends of increasing competition in electricity
connections have accelerated in 2010-11. Overall, market penetration of third
parties (IDNOs and ICPs) in the electricity connections market has risen to 23 per
cent in 2010-11, compared to 13 per cent in 2009-10 and 10 per cent in 2008-
09.44
6.8. The following figures show competition in connections based on the volume
of end connections rather than overall market value. These figures are therefore
strongly influenced by the high volume of small-scale LV connections which are
less likely to be attractive to competing third parties.
Figure 6.1 DPCR5 trends in Great Britain in the provision of new and
modified metered electricity connections
6.9. The majority of third party market penetration in connections is due to an
increase in connections by IDNOs. Figure 6.1 shows that over the past six years,
44 The 2009-10 IDNO totals include 1,321 out-of-area connections by Scottish & Southern Energy.
2005-06 2006-07 2007-08 2008-09 2009-10 2010-11
0%
10%
20%
30%
40%
50%
60%
70%
80%
90%
100%Connections by IDNOs
Connections by ICPs
Connections by DNOs
Connections to IDNO networks

45
Electricity Distribution Annual Report for 2010-11 30 March 2012
a progressively higher percentage of metered connections were carried out by
IDNOs. However, there has also been an increase in the number of connections
carried out by independent connection providers to both DNO and IDNO networks
from four per cent in 2009-10 to eight per cent in 2010-11.
6.10. Figure 6.2 shows the breakdown by connection provider of connections
made in each distribution service area (DSA). This reflects the level of
connections market share held by each type of provider in each DSA.
Figure 6.2 Connections by distribution service area (to both DNO and
IDNO networks)
6.11. Figure 6.2 shows that SPD has the lowest share of connections made in its
DSA with 50 per cent of connections made by an IDNO or ICP. SSEH has the
highest share of connections made in its DSA with 3 per cent of connections were
made by an IDNO or ICP.
6.12. Figure 6.3 shows market share for connections made to the DNOs‟ networks
only. This means that connections to IDNO networks are not included. While
Figure 6.2 shows competition in connections by DSA, the figure below shows
competition in connections to the DNO‟s network, ie where DNOs are the
incumbent provider.
WMID EMID ENWL NPGN NPGY SWales SWest LPN SPN EPN SPD SPMW SSEH SSES GB
IDNO % 31% 32% 20% 9% 13% 7% 9% 12% 14% 16% 48% 21% 3% 17% 18%
ICP % 8% 4% 17% 9% 10% 0% 0% 1% 1% 7% 2% 4% 0% 0% 5%
DNO % 61% 64% 62% 82% 77% 93% 91% 87% 85% 77% 50% 75% 97% 82% 77%
0%
10%
20%
30%
40%
50%
60%
70%
80%
90%
100%
Pe
rce
nta
ge o
f co
nn
ect
ion
s ca
rrie
d o
ut
in D
SA

46
Electricity Distribution Annual Report for 2010-11 30 March 2012
Figure 6.3 Connections to DNO networks only
Note: The percentage values are rounded to whole numbers.
6.13. Figure 6.3 shows that ENWL has the lowest share of connections made to its
network with 22 per cent of connections carried out by an ICP. SWales has the
highest share of connections made to its network with 0.02 per cent of
connections carried out by an ICP.
Provision of connection offer quotations
6.14. SLC 12 requires each DNO to provide offers for connection as soon as
reasonably practicable, and in any event within three months of the receipt of an
application. This is provided that the application contains all such information as
may reasonably be required by the DNO for the purpose of formulating an offer.
6.15. An SLC15 connection offer any connection quotation provided under
standard condition 15 of the Electricity Distribution Licence, which applies to the
provision of non-contestable connection services45 to third-party connection
providers.
6.16. Table 6.2 shows the average and maximum timescales for each DNO to
provide a connection offer.
45 This is work that can only be carried out by the host DNO licence holder.
WMID EMID ENWL NPGN NPGY SWales SWest LPN SPN EPN SPD SPMW SSEH SSES GB
ICP % 12% 6% 22% 10% 11% 0% 0% 1% 1% 8% 5% 5% 0% 0% 6%
DNO % 88% 94% 78% 90% 89% 100% 100% 99% 99% 92% 95% 95% 100% 100% 94%
0%
10%
20%
30%
40%
50%
60%
70%
80%
90%
100%
Pe
rce
nta
ge o
f co
nn
ect
ion
s ca
rrie
d o
ut
in D
SA

47
Electricity Distribution Annual Report for 2010-11 30 March 2012
Table 6.2 Average and maximum timescales to provide quotations
Quotations provided for SLC15 connection offers
made in 2010-11
Quotations provided for
SLC12 connection offers, excluding SLC15, made in
2010-11
DNO
Average number of
working days taken
Maximum number of
working days taken
Average number of
working days taken
Maximum number of
working days taken
WMID 16 49 7 65
EMID 16 51 8 65
ENWL 9 55 8 63
NPGN 12 63 11 65
NPGY 12 49 10 65
SWales 4 14 1 63
SWest 15 65 3 65
LPN 14 65 10 64
SPN 14 63 11 65
EPN 14 65 8 64
SPD 12 55 10 65
SPMW 15 64 5 65
SSEH 12 50 7 65
SSES 15 50 2 64
6.17. In 2010-11, all DNOs provided connection offers within 65 days of receipt of
a complete application. The average numbers of working days taken to provide
connection offers show some variation between DNOs. Note that these figures
reflect both performance and the typical mix of connections work in each DNO
area. For example, applications for single points of connection make up a larger
portion of requests for connection in some DNO areas than in others and these
single services are often faster to turnaround than connection requests requiring
more complex design work.
6.18. Table 6.3 shows the percentage of quotations accepted by connecting
customers for connections quotations issued in 2010-11 (referred to as
acceptance rate within the table). The acceptance rates across Great Britain are
shown in Table 6.3 along with the minimum and maximum acceptance rates that
any DNO has reported.
6.19. The acceptance rates are shown against the four connection types as
detailed below. SLC15 connection offers are defined in paragraph 6.15.
Distribution generation connection offer refers to any connection quotation
provided that allows the potential export of electricity from the customer‟s
premises into the DNO network. Metered connection offer refers to any quotation
providing a metered supply from the DNO network without allowing for any
export. This category would include the majority of domestic customer
connections. Finally, unmetered connection offer refers to any connection
quotation relating to an unmetered electricity supply. The times are shown in
working days to reflect reporting practices under the guaranteed standards.

48
Electricity Distribution Annual Report for 2010-11 30 March 2012
Table 6.3 Quotations issued in 2010-11 and number of these which were
accepted
Connection
offers
issued
Number of
these
offers
accepted
Min
acceptance
rate for
any DNO
Max
acceptance
rate for
any DNO
GB
acceptance
rate
Total number of
quotations provided
for SLC15
connection offers
made in 2010-11
8,687 1,308 9% 31% 15%
Number of
quotations provided
for distributed
generation
connection offers
made in 2010-11
4,636 956 5% 76% 21%
Number of
quotations provided
for metered
connection offers
made in 2010-11
94,123 52,819 45% 63% 56%
Number of
quotations provided
for unmetered
connection offers
made in 2010-11*
9,301 4,028 1% 86% 43%
All GB connections 116,747 59,111 0% 0% 51%
Note: * Unmetered connections figures were not available for SPN.
Connections Standards of Performance
6.20. Obligations to connect new customers are set out in the Electricity Act 1989
and in the Standard Licence Conditions (SLC) 12, 15 and 1946. SLC 12 requires
each DNO to provide offers for connection as soon as reasonably practicable and,
in any event, within three months. SLC 15 relates to the timeliness of the
provision of non-contestable connection services47 to third party providers. SLC
19 prohibits the discrimination between classes of consumers.
6.21. Each of these obligations is a minimum standard of acceptable performance
and DNOs‟ performance on connections must be seen in this light. We are
concerned about the number of reports we hear about delays or poor customer
service in the field of connections, despite the positive snapshot shown below.
6.22. On 1 October 2010 the Electricity (Connection Standards of Performance)
Regulations48 and Distributed Generation (DG) Standards Direction49 took effect
requiring specific connection services to be provided within specified timescales.
46 The Standard Conditions of the Electricity Distribution Licence are available on our website at: http://epr.ofgem.gov.uk/document_fetch.php?documentid=15992 47 This is work that can only be carried out by the host DNO licence holder. 48 Electricity (Connections Standards of Performance) Regulations 2010. Statutory Instrument 2088. 49 Direction under paragraph 15a.16 Of Standard Condition 15a (Connection Policy And Connection Performance) of the Electricity Distribution Licence

49
Electricity Distribution Annual Report for 2010-11 30 March 2012
Standard condition 15A.14 of the Electricity Distribution Licence requires these
timescales to be met in 90% of cases against the aggregated standards below:
Metered standards of performance relating to budget estimates and
quotations (in total)
All other metered standards of performance (in total)
All unmetered standards of performance (in total)
6.23. Performance against these Standards of Performance is shown in Table 6.4.
All DNOs passed the 90% licence requirement.
Table 6.4 Electricity Connections and DG Standards of Performance
Metered standards
of performance
relating to budget
estimates and
quotations
All other metered
standards of
performance
All unmetered
standards of
performance
DNO Q3 Q4 Q3 Q4 Q3 Q4
WMID 99.93% 99.87% 99.31% 99.81% 98.47% 99.43%
EMID 100.00% 99.92% 99.77% 99.48% 99.56% 99.52%
ENWL 99.54% 99.82% 100.00% 100.00% 98.62% 98.47%
NPGN 99.75% 99.66% 99.73% 100.00% 99.41% 99.80%
NPGY 99.82% 99.87% 99.84% 99.93% 99.89% 99.96%
SWales 100.00% 100.00% 100.00% 100.00% 100.00% 100.00%
SWest 100.00% 100.00% 100.00% 100.00% 100.00% 100.00%
LPN 100.00% 99.94% 99.82% 99.83% 99.63% 99.95%
SPN 100.00% 99.88% 98.78% 99.77% 99.69% 100.00%
EPN 100.00% 99.74% 99.68% 99.80% 99.73% 100.00%
SPD 99.45% 98.80% 96.21% 96.14% 90.78% 90.66%
SPMW 100.00% 99.92% 100.00% 99.72% 98.92% 99.56%
SSEH 99.95% 100.00% 100.00% 100.00% 100.00% 100.00%
SSES 99.98% 100.00% 99.97% 100.00% 98.38% 98.78%
Distributed generation
6.24. Traditionally electricity has been produced by large power stations which
connect to the high voltage transmission network. More recently there has been a
rise in Distributed Generation (DG), which is where smaller-scale electrical power
generators connect to the lower voltage distribution network.
6.25. There has been continued growth in demand for connection to the
distribution networks to support DG. Across all DNOs, 14,351 new DG projects
were connected to the DNO networks in 2010-11.
6.26. At the start of the current price control, Ofgem stepped up DG related
incentives and obligations, with new guaranteed standards, a requirement for
DNOs to produce a DG Connections Guide and to have in place a DG information
strategy. More generally the broad measure of customer satisfaction, which will
come into effect in 2012-13, is intended to ensure DNOs remain focussed on
customer service and engage effectively with DG and all other stakeholder and

50
Electricity Distribution Annual Report for 2010-11 30 March 2012
customer groups. It is important that we monitor the success of the above
measures in providing DG customers with the information and service levels they
require.
Distributed generation fora50
6.27. In May 2011 we issued an open letter asking for industry views on the
experience of getting DG connected to the distribution network. After receiving
responses to this open letter, we held a series of fora to explore the issues raised,
with stakeholders. The fora were held in London, Glasgow and Cardiff in
September 2011. These were designed to allow the DNOs and Ofgem to
understand the issues faced by DG customers over the previous years and to
promote improved communication between the DG community and DNOs. An
open letter has been published on the outcomes of the DG fora.
6.28. The events were extremely well attended, with over 150 DG stakeholders
represented. The following key themes were identified by stakeholders:
Customers require better and more timely information from DNOs
There needs to be greater transparency of cost information
There is confusion over the DNOs adopting different technical standards and
different approaches to the application process
DG stakeholders would like to see a quicker and clearer connections process
and a reduction in the overall costs of connection
Stakeholders want more engagement with the DNOs
6.29. All of the DNOs were represented at the events and they have heard for
themselves the views of customers on the above. We want to be sure that the
issues above are addressed and that DNOs put measures in place to improve how
they meet the needs of this important customer group. We are following this up
through a second round of DG fora. Although the DG fora were held after the
2010-11 reporting year, we consider this feedback to be relevant to that period.
50 An overview of the Distributed Generation (DG) Forum 2011 is available on our website at: http://www.ofgem.gov.uk/Pages/MoreInformation.aspx?docid=244&refer=Networks/ElecDist/Policy/DistGen

51
Electricity Distribution Annual Report for 2010-11 30 March 2012
7. Environment
This chapter sets out environmental performance measures and incentive
schemes in 2010-11 including the Low Carbon Networks Fund; the Innovation
Funding Incentive; the business carbon footprint; the network loss incentive; and
oil leakage monitoring.
7.1. Several aspects of the electricity distribution network operators‟ (DNOs‟)
environmental performance are incentivised or monitored in under the current
price control arrangements. These arrangements include: the Low Carbon
Networks (LCN) Fund which provides financial awards for innovative projects to
reduce the DNOs‟ carbon footprints; the Innovation Funding Incentive (IFI) for
research and development work; and an incentive scheme to minimize network
losses.
7.2. In addition, we monitor DNO performance on oil leakage. We are also looking
to monitor sulphur hexafluoride losses going forward51 and will monitor
improvements in Business Carbon Footprint (BCF) over the five year price control
period.
Low Carbon Networks Fund
7.3. DNOs are entering a period of significant change. The challenges presented
by the transition to a low carbon economy will directly impact their networks. The
widespread connection of distributed generation (DG), the electrification of heat
and transport and the introduction of smart meters will require new approaches
to the design, construction and operation of these networks. To meet these
challenges in a timely and cost effective way DNOs will need to innovate in the
way they design, build and operate their networks.
7.4. As part of the current price control, we created the £500 million LCN Fund to
encourage the DNOs to try out new technologies, operating practices and
commercial arrangements which are required to meet these challenges.52
7.5. The first tier, up to £16 million a year, is spread across all DNOs to spend
against set criteria. This funding can be used for small scale projects or to put in
place the people, resources and processes to progress larger innovative projects.
The second tier, up to £64 million a year, is provided to a small number of
significant scale projects that win an annual competition. Finally, a discretionary
reward totalling up to £100 million over the five year period can be awarded by
Ofgem for successful project completion and exceptional projects.
7.6. In 2010 we ran the first annual competition for second tier funding. Four
projects were selected and awarded funding of a combined value of £63.6m, as
shown in Table 7.1. The projects and individual awards are described below.
51 Sulphur Hexafluoride (SF6) is a greenhouse gas used by DNOs as an insulator in electrical switchgear. 52 Further information about the LCN Fund is on the Ofgem website at:http://www.ofgem.gov.uk/Networks/ElecDist/lcnf/Pages/lcnf.aspx

52
Electricity Distribution Annual Report for 2010-11 30 March 2012
Table 7.1 Low Carbon Networks Fund tier 2 awards
DNO Project title Funding awarded
£m
NPGN Customer-led Network Revolution 27.6
LPN Low Carbon London – A Learning Journey 24.9
EMID Low Carbon Hub 3.1
SWales LV Network Templates for a Low-carbon Future 8
Total
63.6
7.7. Customer-led Network Revolution explores how customers and networks can
work better together through the use of smart meters, new tariffs, improved
network infrastructure, better communication and improved use of data. This
work is in partnership with British Gas and Durham University amongst others.
7.8. Low Carbon London investigates how a network to serve a low-carbon city
(London) might work. This involves trialling new tariffs and smart meters, and
improving understanding of the impact of low carbon technologies on the
networks. This project leverages London‟s low carbon initiatives and is in
partnership with Logica and Imperial College amongst others.
7.9. Low Carbon Hub develops new ways to connect renewable generation
(mainly wind) to distribution networks. The project explores ways to maximise
the capacity of renewable generation in the area and trials new ways of
dynamically controlling voltage on the network as well as new commercial
arrangements.
7.10. LV Network Templates for a Low-carbon Future investigates the impact of
low carbon technologies on the low voltage electricity network. The project will
create generic network models to assist DNOs in efficiently planning and
operating networks. The project leverages Welsh Assembly Government and RWE
npower initiatives.
7.11. These projects can provide learning which will be beneficial across
networks. We require second tier projects to report on progress every six months.
We are monitoring these reports to understand the learning which is emerging
and to ensure that it is communicated across the industry.
7.12. A second competition for second tier funding took place in 2011 which
allocated over £56 million to six winning projects. We have also recently
completed a review of the fund. We consider that the LCN Fund has worked well
to date. We are pleased to note that respondents to the review supported our
view and emphasised the role the LCN Fund has played in stimulating innovation.
Some refinements to the fund will be carried out as detailed in the review letter.53
Innovation Funding Incentive (IFI)
7.13. The IFI was introduced during DPCR4 in response to declining levels of
investment in research and development by DNOs since the 1990s. The IFI has
53 Decision on the Low Carbon Networks Fund Two Year Review, 22 February 2010. This letter is available on our website at: http://www.ofgem.gov.uk/Pages/MoreInformation.aspx?docid=115&refer=Networks/ElecDist/lcnf
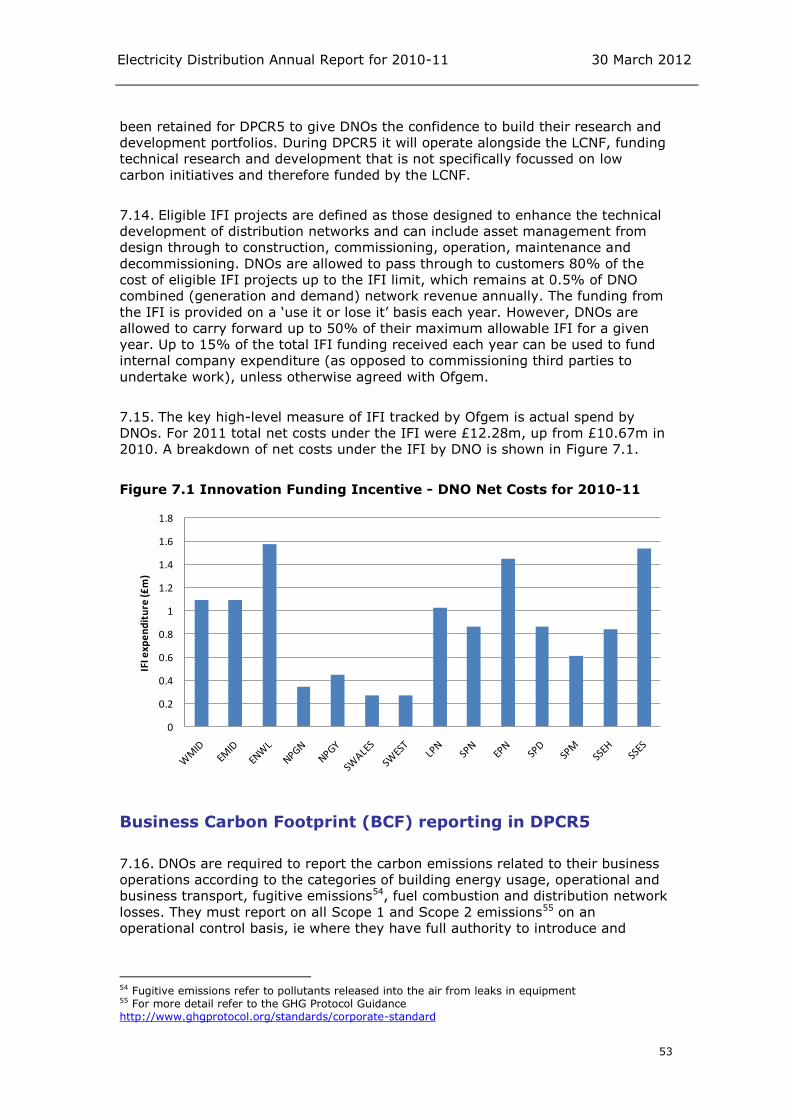
53
Electricity Distribution Annual Report for 2010-11 30 March 2012
been retained for DPCR5 to give DNOs the confidence to build their research and
development portfolios. During DPCR5 it will operate alongside the LCNF, funding
technical research and development that is not specifically focussed on low
carbon initiatives and therefore funded by the LCNF.
7.14. Eligible IFI projects are defined as those designed to enhance the technical
development of distribution networks and can include asset management from
design through to construction, commissioning, operation, maintenance and
decommissioning. DNOs are allowed to pass through to customers 80% of the
cost of eligible IFI projects up to the IFI limit, which remains at 0.5% of DNO
combined (generation and demand) network revenue annually. The funding from
the IFI is provided on a „use it or lose it‟ basis each year. However, DNOs are
allowed to carry forward up to 50% of their maximum allowable IFI for a given
year. Up to 15% of the total IFI funding received each year can be used to fund
internal company expenditure (as opposed to commissioning third parties to
undertake work), unless otherwise agreed with Ofgem.
7.15. The key high-level measure of IFI tracked by Ofgem is actual spend by
DNOs. For 2011 total net costs under the IFI were £12.28m, up from £10.67m in
2010. A breakdown of net costs under the IFI by DNO is shown in Figure 7.1.
Figure 7.1 Innovation Funding Incentive - DNO Net Costs for 2010-11
Business Carbon Footprint (BCF) reporting in DPCR5
7.16. DNOs are required to report the carbon emissions related to their business
operations according to the categories of building energy usage, operational and
business transport, fugitive emissions54, fuel combustion and distribution network
losses. They must report on all Scope 1 and Scope 2 emissions55 on an
operational control basis, ie where they have full authority to introduce and
54 Fugitive emissions refer to pollutants released into the air from leaks in equipment 55 For more detail refer to the GHG Protocol Guidance http://www.ghgprotocol.org/standards/corporate-standard
0
0.2
0.4
0.6
0.8
1
1.2
1.4
1.6
1.8
IFI e
xpe
nd
itu
re (£
m)

54
Electricity Distribution Annual Report for 2010-11 30 March 2012
implement operating policy. They must also report on a subset of Scope 3
emissions, ie business travel and external contractors.
7.17. All DNOs are required to report these figures on an annual basis, and we
will publish a league table of the annual change in business carbon emissions
(BCF) measured against a baseline year of 2010-11. The league table will exclude
BCF from electricity losses because there is a separate price control incentive
associated with electricity losses. The first league table will be published based
on the 2011-12 data submitted by DNOs in the third quarter of 2012.
Network loss incentive
7.18. The Distribution Losses Incentive Mechanism incentivises DNOs to reduce
distribution losses on their networks. Distribution losses are calculated as the
difference between electricity put into the distribution network and electricity
taken out, with adjustments made for distributed generation. The Authority56 sets
an allowed loss percentage (ie an annual target) for each DNO at the beginning of
the price control period and DNOs receive a reward or penalty based on their
performance against the target.
7.19. It is not possible to provide details of DNOs losses performance in 2010-11
(as is the intention of this Annual Report), because of a two year reporting lag
that was introduced in the Final Proposals57 for the fifth price control (DPCR5).
The policy framework for DPCR5 introduced a number of measures aimed at
increasing consistency and accuracy around losses. This included a common
reporting methodology based on settlement data and a requirement to report
losses performance with a two year lag to reduce volatility arising from
settlement corrections. This means that losses for 2010-11 will be reported by the
DNOs on or by 31 July 2013.58
7.20. Ongoing work on the Losses Incentive Mechanism includes resolving the
process by which the DPCR4 losses mechanism will be 'closed-out' and new
targets set for DPCR5 (more detail is available in the DPCR5 Final Proposals).
More recently, Ofgem published a decision document on 9 March 2012 to address
issues with abnormal levels of data-cleansing that had been legitimately
undertaken by suppliers, but which affected 2009-10 loss performance of some
DNOs.
Oil top ups
7.21. DNOs use oil-based fluids as electrical insulators on certain cables. Ofgem
collects data on the leakage of such fluids from each network because leakage
can be detrimental to ecosystems. Each DNO reports to Ofgem on the total
volume of oil used to top up cables as shown in Table 7.2.
56 Ofgem is the Office of Gas and Electricity Markets which supports the Gas and Electricity Markets Authority (“the Authority”), the regulator of the gas and electricity industries in GREAT BRITAIN. Further information on the Authority is available in Appendix 4. 57 This document is available on our website at: http://www.ofgem.gov.uk/Networks/ElecDist/PriceCntrls/DPCR5/Pages/DPCR5 58 Further information may be found on our website at: http://www.ofgem.gov.uk/Networks/ElecDist/PriceCntrls/DPCR5/Documents1/ Consultation_on_methodology_to_address_losses_settlement_data.pdf

55
Electricity Distribution Annual Report for 2010-11 30 March 2012
7.22. The data for 2010-11 should be treated with caution as we have had to
make a number of improvements to the definitions and guidance around the
reporting of this data. In addition the data below provides no indication of the
extent of network or fluid-filled equipment which each DNO operates. Better
quality data should be available from next year onwards.
Table 7.2 Fluid used to top up cables
DNO
Oil used to top up
cables minus oil
recovered (L)
WMID 27,126
EMID 24,056
ENWL 34,770
NPGN 18,010
NPGY 31,250
SWales 730
SWest 1,688
LPN 99,113
SPN 51,556
EPN 63,118
SPD 190
SPMW 4,722
SSEH 833
SSES 29,905
GB total 387,067
7.23. In future, we are looking to have a comparable measure of DNO
performance and to normalise fluid top ups against the extent of fluid filled cables
the DNOs operate. In future, DNOs will report on the volume of fluid in service in
cables which will enable us to determine a percentage of fluid lost.
Distributed generation
7.24. In total 789.4MW of DG were connected in 2010-11, down from 1206.3
reported in 2009-10. DNOs reported expenditure of £26.62m in providing DG
connections in 2010-11, up from £23.09m in 2009-10.
7.25. The number of megawatts of DG installed on each DNO‟s network in 2010-
11 is shown in Table 7.3. These figures exclude the capacity of existing DG
installed on the DNO networks prior to the 2010-11 reporting year.

56
Electricity Distribution Annual Report for 2010-11 30 March 2012
Table 7.3 MW Distributed generation installed in 2010-11
DNO MW installed on network
in 2010-11
WMID 12
EMID 61
ENWL 37
NPGN 42
NPGY 63
SWales 32
SWest 32
LPN 5
SPN 309
EPN 34
SPD 53
SPMW 12
SSEH 79
SSES 17
7.26. Table 7.4 outlines the DG technology installed on the DNOs‟ networks for all
DNOs in Great Britain in 2010-11. This does not show the breakdown of
generation capacity contributed by each type of DG technology installed in 2010-
11 but outlines the total number of individual connection projects carried out by
the DNOs for each technology type.
Table 7.4 Distributed generation composition by technology
No. of projects
Technology type 2009-10 2010-11
Total 2347 14351
Onshore wind 296 204
Offshore wind 4 0
Tidal stream & wave power 1 0
Biomass & energy crops (not
CHP) 5 4
Hydro 47 16
Landfill gas, sewage gas,
biogas (not CHP) 84 85
Waste incineration (not CHP) 3 4
Photovoltaic 1783 13964
Micro CHP (domestic) 21 11
Mini CHP (<1MW) 64 47
Small CHP (>=1MW, <5MW) 8 12
Medium CHP (>=5MW,
<50MW) 2 0
Large CHP (>=50MW) 0 0
Other generation 29 4

57
Electricity Distribution Annual Report for 2010-11 30 March 2012
8. Financial issues
This chapter sets out the DNOs‟ performance against their allowances for total
revenue; return on regulatory equity; regulatory asset value; pension costs; and
current taxation.
Revenue recovered
8.1. Figure 8.1 shows each licensee‟s revenue as reported in their regulatory
accounts (black line). Base demand price controlled allowed revenues are the
amounts set out in the DPCR5 Final Proposals document for the distribution
business. Excluded services are reported net of customer contributions (where
they are not treated as revenue in the accounts) and includes the amortisation of
contributions in accordance with IFRS59; they also include any miscellaneous
revenues. Pass-through adjustments include Ofgem licence fees and network
rates, which in 2010-11 includes the adjustment for the difference between the
allowance and actual cost. The over/(under) recovery and correction factor
includes the allowed under-recovery of base demand revenues for the previous
year (or a reduction in an over-recovery). The latter also allow for the interest
adjustment for the time value of money on those over/under-recoveries.
Figure 8.1 Revenue per regulatory accounts
59 International Financial Reporting Standards
-100
0
100
200
300
400
500
600
£m
Base Demand price controlled allowed revenues
Pass-through adjustments
Over/(Under) Recovery & Correction factor from prior year
Excluded Services and miscellaneous revenues outside the price control
Revenues from legacy metering, de minimis activities and out of area networks
Assistance for Areas with High Distribution Costs
Revenue as per Regulatory Accounts

58
Electricity Distribution Annual Report for 2010-11 30 March 2012
Return on regulatory equity (RoRE) 60
8.2. As outlined in the DPCR5 Final Proposals, we have developed the RoRE and
have monitored DNO performance for the first year of the price control. This
shows that, in practice, DNO returns have varied significantly from the DPCR5
assumed return on equity, with the majority of DNOs earning in excess of the
assumed return, some substantially. However, as this is the first year of the price
control, the results are likely to have been impacted by deferred capital
expenditure, which would be expected to reverse in later years in order to deliver
outputs.
8.3. As well as each DNO's performance in controlling totex and business support
costs, outturn RoRE has been driven by performance under the quality of service
incentive, and deviations in real interest rates from those assumed when we set
the price control.
8.4. The RoRE achieved in the first year of DPCR5 is set out in Figure 8.2; we
note that the results presented are indicative only. These returns do not reflect
any additional returns DNOs may have earned from distributed generation use of
system charging, excluded services, legacy meter asset provision, out of area
networks or de minimis business.
Figure 8.2 Return on Regulated Equity (RoRE) achieved versus allowed
cost of equity, ranked by RoRE in descending order
60 The concept of Return on Regulatory Equity (RoRE) is discussed in Chapter 4 of DPCR5 Final Proposals. December 2009. 145/09, This document is available on our website at : http://www.ofgem.gov.uk/Pages/MoreInformation.aspx?docid=346&refer=Networks/ElecDist/PriceCntrls/DPCR5
6%
7%
8%
9%
10%
11%
12%
13%
14%
15%
SSES
NP
GN
SSEH
NP
GY
SWales
SWest
SPM
W
Average
ENW
L
LPN
EMID
WM
ID
SPD
SPN
EPN
RoRE achieved allowing for Totex and other main variables
RoRE adjusted for Totex, business support & non-op capex
RoRE adjusted for Totex
Returns @ OFGEM allowances
Cost of Equity in DPCR5 price control

59
Electricity Distribution Annual Report for 2010-11 30 March 2012
8.5. These returns are only indicative for 2010-11 and may be influenced by
deferment of capital expenditure which would reverse in later years and give a
more accurate representation of returns over the price control period. Whilst a
DNO may appear to benefit financially in the short term from a network
investment underspend, the DPCR5 secondary network deliverables mechanism
penalises DNOs which do not deliver on their outputs. As explained in paragraph
2.30, companies face a penalty for not delivering on outputs which is 2.5% higher
than any gains from underspending on network investment.
Caveats
8.6. We have developed our RoRE approach as a means to gauge company
performance against the Final Determination on a consistent basis. There is no
direct read across to returns that companies report in their accounts since the
methodology for RoRE recognises some gains that companies will only see over
time.
8.7. The results are based on our modelled approach to notional gearing. The
calculation of each company's specific cost of debt is problematic given different
funding structures, instruments and hedging strategies. We have therefore used
the iBoxx trailing average as a best view of actual rates which we compare to our
notional funding assumption. It should be noted that the actual cost of debt for
DNOs will be significantly different to this, and therefore increased or decreased
return will vary per company.
8.8. We do not adjust for differences in pension expenditure.
8.9. The quality of service difference is calculated using the incentive earned
during 2010-11 which relates to 2008-09 performance.
Pensions
8.10. In DPCR5, there is provision for a true up of efficient Pension Protection
Fund (PPF) levies and an asymmetric true up of ongoing employer pension
contributions (including scheme administration costs). Overspend is funded 80
per cent and underspend clawed back at 50 per cent; this is to recognise the
amount of influence licensees were perceived to have over pension costs at
DPCR5.
8.11. These amounts (reported in Tables 8.1 and 8.2) for true up will be made in
RIIO-ED1 and are subject to review for efficiency in accordance with our
published methodologies. The fast money61 amount will be spread evenly on a
NPV neutral basis over 8 years; and the slow money62 will be adjusted in RAV.
8.12. The adjustment to revenue will comprise the fast money amount and that
for regulatory depreciation on the RAV additions and return. The adjustments will
be made net of tax at the applicable rate of corporation tax of the year to avoid
double-counting the tax effect on revenues.
61 Fast money is the revenue that is matched to the year of expenditure. 62 Slow money is where costs are added to the RAV and revenues allow recovery of the cost over time (currently 20 years) together with the cost of financing this expenditure in the interim.

60
Electricity Distribution Annual Report for 2010-11 30 March 2012
Table 8.1 Ongoing pension costs
£m (2010-
11)
Fast money Slow Money Total fast & slow money
Actual spend
Allowance
True up amount subject
to sharing
Actual spend
Allowance
True up amount subject
to sharing
Actual spend
Allowance
True up amount subject
to sharing
WMID 2.8 3.0 (0.2 ) 8.5 9.7 (1.2 ) 11.3 12.7 (1.4 )
EMID 2.4 2.6 (0.1 ) 6.7 7.5 (0.8 ) 9.1 10.1 (1.0 )
ENWL 3.1 7.1 (3.9 ) 8.9 8.1 0.8 12.1 15.2 (3.2 )
NPGN 1.7 2.1 (0.4 ) 4.0 5.4 (1.4 ) 5.7 7.5 (1.8 )
NPGY 2.3 2.4 (0.1 ) 5.7 6.9 (1.3 ) 7.9 9.3 (1.4 )
SWales 3.0 1.5 1.4 12.7 4.5 8.1 15.6 6.0 9.6
SWest 4.5 1.9 2.6 19.3 6.7 12.6 23.8 8.6 15.2
LPN 2.0 1.7 0.3 5.2 5.8 (0.5 ) 7.2 7.5 (0.3 )
SPN 2.1 2.0 0.1 6.3 6.5 (0.2 ) 8.4 8.5 (0.1 )
EPN 3.1 3.0 0.1 9.0 9.6 (0.6 ) 12.1 12.7 (0.5 )
SPD 2.6 2.0 0.6 6.1 7.4 (1.3 ) 8.7 9.5 (0.8 )
SPMW 2.5 2.0 0.6 6.7 4.3 2.4 9.2 6.3 2.9
SSEH 2.0 2.0 0.1 5.1 4.3 0.8 7.1 6.3 0.8
SSES 1.9 2.3 (0.4 ) 6.3 6.0 0.2 8.2 8.4 (0.2 )
GB total 36.1 35.6 0.5 110.4 92.9 17.4 146.5 128.5 18.0
Table 8.2 Pension Protection Fund levies
£m (2010-
11)
Fast money Slow Money Total fast & slow money
Actual spend
Allowance
True up amount subject
to sharing
Actual spend
Allowance
True up amount subject
to sharing
Actual spend
Allowance
True up amount subject
to sharing
WMID 0.1 0.0 0.1 0.3 0.1 0.2 0.5 0.2 0.3
EMID 0.1 0.1 0.1 0.4 0.1 0.2 0.5 0.2 0.3
ENWL 0.1 0.3 (0.2 ) 0.3 0.2 0.1 0.4 0.4 (0.1 )
NPGN 0.0 0.1 (0.0 ) 0.1 0.1 (0.0 ) 0.1 0.2 (0.1 )
NPGY 0.0 0.0 0.0 0.1 0.1 0.0 0.2 0.1 0.1
SWales 0.0 0.1 (0.1 ) 0.1 0.3 (0.1 ) 0.2 0.4 (0.2 )
SWest 0.0 0.1 (0.1 ) 0.2 0.3 (0.2 ) 0.2 0.4 (0.2 )
LPN 0.0 0.0 0.0 0.1 0.1 (0.0 ) 0.2 0.2 (0.0 )
SPN 0.0 0.1 (0.0 ) 0.1 0.2 (0.1 ) 0.2 0.3 (0.1 )
EPN 0.1 0.0 0.0 0.2 0.1 0.1 0.3 0.1 0.2
SPD 0.1 0.1 0.1 0.3 0.2 0.1 0.4 0.2 0.1
SPMW 0.1 0.0 0.1 0.3 0.1 0.2 0.4 0.1 0.3
SSEH 0.0 0.0 (0.0 ) 0.1 0.1 0.0 0.1 0.1 0.0
SSES 0.9 0.1 0.7 0.0 0.3 (0.3 ) 0.9 0.5 0.4
GB total 1.8 1.0 0.7 2.5 2.3 0.2 4.3 3.3 1.0
8.13. Outturn pension deficit costs reported in Table 8.3 show, for most DNOs, a
significant overspend against allowances. The main reasons are that some have
made additional lump sum payments. These were E.ON to the Central Networks
scheme prior to sale to PPL, EDF Energy prior to sale of their three networks to
UKPN; both as part of the respective sectionalisation of the schemes of which

61
Electricity Distribution Annual Report for 2010-11 30 March 2012
they were formally part. WPD S Wales and S West made payments in advance in
March 2010, which we agreed would be treated as 2010-11 costs. SP Manweb
(SPMW) has made two year‟s agreed deficit funding payments in 2010-11; for the
purpose of truing up pensions costs we will treat the second payment as being
made in 2011-12. In both cases this is to ensure that payments match the year in
which they should have been incurred, as will the true-up. For SSE Southern the
underspend arises as the allowance is based on the forecast deficit at March 2010
and the actual funding is made in accordance with the previous March 2007
deficit funding plan. Similarly, for SPD the deficit funding payment is based on the
2009 valuation and not the March 2010 forecast deficit used to set allowances.
Table 8.3 Pension deficit costs
£m (2010-11) Actual spend Allowance Over/(under) spend
WMID 39.4 17.9 21.5
EMID 36.6 16.6 20.0
ENWL 15.9 16.0 (0.1 )
NPGN 21.0 16.8 4.2
NPGY 8.1 8.1 0.0
SWales 23.7 12.2 11.5
SWest 41.5 21.7 19.8
LPN 85.7 27.0 58.7
SPN 72.5 22.2 50.3
EPN 23.6 7.8 15.8
SPD 6.7 8.2 (1.5 )
SPMW 37.5 15.0 22.5
SSEH 16.8 12.8 4.0
SSES 25.0 31.8 (6.7 )
GB total 454.0 234.1 219.9
8.14. The annual pension deficit allowances are the funding of the forecast deficit
at 31 March 2010, based on 30 September 2010 updated valuations, spread over
15 years in accordance with our methodologies. In DPCR5, we introduced our new
methodology wherein the opening forecast deficit would be revised at ED1 and
trued up based on the deficits shown by valuations as at 31 March 2010 (the cut-
off date). These valuations would be subject to an efficiency review and, subject
to the outcome of that review, adjustment. That review is currently underway and
the conclusions will be reported separately. In addition, the deficit at the cut-off
date is split into that related to all members arising at the cut-off date (the
established deficit) and, for active members, that arising after the cut-off date.
The actual spend shown in Table 8.3 relates to the pre cut-off date deficit.

62
Electricity Distribution Annual Report for 2010-11 30 March 2012
Regulatory asset value
Table 8.4 RAV changes in the year
£m (2010-11)
Opening RAV
at 1 April 2010
Additions Depreciation
Closing
RAV at 31 March 2011
Closing RAV at 31 March 2011 (year
end prices)
RAV
additions more/
(less) than allowance
£m £m £m £m
£m
£m
WMID 1,507.7 171.3 (128.3 ) 1,550.7
1,598.5
(15.9 )
EMID 1,441.0 157.6 (126.2 ) 1,472.4
1,517.7
(29.4 )
ENWL 1,302.5 121.7 (117.7 ) 1,306.5
1,346.8
(48.9 )
NPGN 892.5 85.1 (78.5 ) 899.0
926.7
(31.8 )
NPGY 1,153.4 121.8 (100.5 ) 1,174.7
1,210.9
(38.8 )
SWales 726.2 87.3 (73.2 ) 740.3
763.1
6.6
SWest 992.6 122.0 (89.1 ) 1,025.5
1,057.1
5.8
LPN 1,276.0 131.4 (113.6 ) 1,293.8
1,333.7
(35.4 )
SPN 1,107.1 168.2 (90.3 ) 1,185.0
1,221.5
0.6
EPN 1,805.6 252.2 (148.7 ) 1,909.1
1,967.9
1.1
SPD 1,379.4 109.6 (114.8 ) 1,374.2
1,416.5
(17.0 )
SPMW 1,161.3 121.2 (98.6 ) 1,184.0
1,220.4
(48.9 )
SSEH 903.7 64.2 (75.9 ) 891.9
919.4
(23.8 )
SSES 1,790.7 155.8 (166.6 ) 1,780.0
1,834.8
(63.8 )
Total 17,439.8 1,869.4 (1,522.0 ) 17,787.3
18,335.1
(339.6 )
8.15. The variance in actual additions compared to allowances reflects the
underspend in totex (all costs except Business Support, pension and pass-through
items) as defined at DPCR5, in particular 30% in capex over all licensees, except
WPD S Wales and S West.

63
Electricity Distribution Annual Report for 2010-11 30 March 2012
Taxation
Table 8.5 Tax Allowances compared to charge for DUoS activity
£m (2010-11) Allowance
Current CT
charge from
DUoS activity
Over-/
(under-)
against
allowance
WMID 27.9 56.4 28.5
EMID 23.7 46.0 22.2
ENWL 51.0 36.6 (14.4 )
NPGN 27.7 27.7 0.0
NPGY 39.4 41.7 2.2
SWales 27.7 13.9 (13.8 )
SWest 32.9 13.6 (19.3 )
LPN 32.1 22.6 (9.5 )
SPN 20.3 11.6 (8.7 )
EPN 33.1 11.4 (21.7 )
SPD 27.4 52.0 24.5
SPMW 26.3 12.0 (14.4 )
SSEH 27.5 21.3 (6.2 )
SSES 49.1 65.4 16.3
GB total 446.3 432.2 (14.1 )
8.16. Table 8.5 shows the tax allowances63 and reported corporation tax charge
for DUoS64 activities in the year. The variance reflects the under spend in capex
reducing the allowable capital allowances for offset against taxable profits but
also the reduction in taxable profits where there have been increase pension
deficit payments. It also reflects changes in the opening capital allowance pools
from that forecast for DPCR5 arising the subsequent settlement with HMRC on
open tax years; and the difference between actual net interest and modelled
notional interest and notional gearing used in setting the allowances. Overall
there are variances between the individual DNOs attribution to capital allowance
pools and the generic attributions assumed for setting allowances.
8.17. For this year, no licensees has triggered a clawback of the additional benefit
of reducing its tax burden arising from actual gearing and interest both exceeding
notional gearing and notional interest assumed in setting the tax allowance.
63 Current corporation tax charge (excludes deferred tax or prior year adjustments, if any. 64 Demand use of system charges

64
Electricity Distribution Annual Report for 2010-11 30 March 2012
9. Compliance
This chapter sets out the DNOs compliance in 2010-11 with the requirements and
obligations specified in the standard and special conditions of their respective
electricity distribution licences.
9.1. The licences held by the monopoly electricity distribution network operators
(DNOs) reflect the terms of the “contract” we set with the network companies as
part of the price control settlement. In other words, the licence sets out what the
companies will deliver and the revenues they are allowed to earn for delivering
these outcomes. In some cases the licence obligations set a minimum level of
service the licence holder is funded to deliver.
9.2. Misreporting is taken seriously by Ofgem. We rely on receiving accurate data
from the companies in order to monitor performance and also to set revenue
allowances at the start of the price control. Without accurate information, there is
a risk that customers pay more for network services than they should, or that
they do not receive a level of service in line with that expected when the allowed
revenues were agreed.
9.3. Our ultimate objective is that companies take full responsibility for
submitting accurate data to us and that prioritise the establishment and
maintenance of appropriate systems and processes to ensure compliance with the
licence.
9.4. Where we discover that a licensee has breached the terms of its distribution
licence, we have the ability to impose a financial penalty on that company.
Ongoing investigations are described on the Ofgem enforcement website.65
Review of compliance arrangements
9.5. Over the past year, we have started to review the arrangements we have in
place to ensure the accuracy of data submitted by licensees. The reporting
requirements on DNOs and the associated assurance requirements have
developed over time and we currently employ a variety of methods to provide
assurance that data submitted is accurate.
9.6. While the existing arrangements in this area have been largely effective in
providing comfort on the reliability of regulatory returns, there is scope to
introduce a more coherent assurance framework, where greater assurance is
required for the areas of highest risk.
9.7. Last year, we proposed to the licensees a framework whereby we would
establish a common risk assessment methodology covering the catalogue of data
65 Ofgem Enforcement website http://www.ofgem.gov.uk/About%20us/enforcement/Investigations/CurrentInvest/Pages/CurrentInvs
tgtns.aspx
65
Electricity Distribution Annual Report for 2010-11 30 March 2012
that the companies provide to us. This risk assessment would cover various
aspects of the likelihood and impact of the mis-statement of data to us. The
licensees would be required to carry out this assessment themselves, and
demonstrate to us that they have the appropriate checks in place to minimise the
risks identified. Over the course of the 2012-13 year, we will be working with all
of these companies to develop these proposals.
9.8. Our work on reviewing the compliance arrangements covers not only the
DNOs but also the Transmission and Gas Distribution licensees as well. We are
working towards implementing the new compliance arrangements at the start of
the new price controls in the transmission and gas distribution sectors. These
commence in April 2013.
9.9. We anticipate that the new arrangements for the DNOs will be in place for
the start of the next price control, RIIO-ED1.
Audits in 2010-11
9.10. A number of DNOs commissioned audits on their reporting against the
Electricity (Standards of Performance)66. This is not a requirement but is
considered best practise.
9.11. In December 2011, Ofgem undertook an extended audit of the systems that
UKPN‟s three DNOs (LPN, SPN and EPN) have in place to measure incidents,
customer interruptions (CIs), customer minutes lost (CMLs) and the accuracy of
the information reported by each DNO on these matters for the 2010/11 period.
All three DNOs passed the CI and CML audit checks on a sample of incidents at
each voltage level.
Compliance issues in 2010-11
Secondary network deliverables – health index
9.12. Disappointingly, we are not publishing the secondary network deliverables
indicator in this report as we are not confident in the robustness of the data. A
number of DNOs have resubmitted data, which in places considerably revised
their 2011 formal submissions under the licence.
9.13. Table 9.1 shows the extent of data revisions made by each DNO.
66 Electricity (Standards of Performance). Statutory Instrument 698 of 2010.

66
Electricity Distribution Annual Report for 2010-11 30 March 2012
Table 9.1 Revisions to data made by each DNO
Number of
asset
categories
Number of asset
categories where
data corrected
Changed categories
as percentage of
total categories
WMID 20 12 60%
EMID 18 12 67%
ENWL 20 0%
NPGN 19 0%
NPGY 19 0%
SWALES 13 1 8%
SWEST 13 1 8%
LPN 18 3 17%
SPN 20 7 35%
EPN 18 10 56%
SPD 9 0%
SPMW 15 0%
SSEH 12 1 8%
SSES 19 2 11%
9.14. We expect all DNOs to provide robust data across all metrics, both as part
of DPCR5 and, importantly, in their submissions for the next price control RIIO-
ED1. Where we do not have confidence in a company‟s data, their plans will be
subject to greater regulatory scrutiny and, if required, may take enforcement
action.
Telephony
9.15. ENWL was unable to provide the speed of telephone response data over a
total period of 29 days in 2010 (15 days in May and 14 days in June) due to a
server problem. ENWL was also unable to report any data under the KM5a (total
calls not reaching specified lines) throughout 2010/11. When this issue was
raised, ENWL cooperated with Ofgem and provided proxy data to fill gaps in
reported data.
9.16. ENWL‟s performance fell within the reward bracket (4.43). This data is used
for reporting purposes. However, given the issues highlighted above no financial
reward was allocated to ENWL.67
67 Network companies are required under Standard Licence Condition (SLC45) to maintain appropriate systems, processes and procedures to enable them to measure, record and report the required information to the Authority within the specified timeframe.

67
Electricity Distribution Annual Report for 2010-11 30 March 2012
Appendices
Appendices
Index
Appendix Name of Appendix Page Number
1 Responses and questions
2 Distribution Network Operators contact information
3 Contact information for stakeholders
4 The Authority‟s Power and Duties
5 Electricity guaranteed standards of performance
6 Glossary
7 Indicator calculation methodology
8 Feedback Questionnaire

68
Electricity Distribution Annual Report for 2010-11 30 March 2012
Appendices
Appendix 1 - Responses and questions
We welcome views on the content and format of information that users of this
report would find useful.
Please send your comments to:
Martin Hughes
Costs & Outputs
Distribution
9 Millbank
London
SW1P 3GE

69
Electricity Distribution Annual Report for 2010-11 30 March 2012
Appendices
Appendix 2 – Distribution Network Operator contact information
1.1. Table A2.1 sets out the electricity distribution network operators (DNOs) contact information. Complaints regarding a DNO that
does not have a dedicated complaints phone number should be raised via their general enquiries phone number.
Table A2.1 DNO contact information
DNO Area
Emergency /
Loss of supply (24 hour)
General enquires
Complaints Website address
Western Power Distribution: West Midlands West (WMID)
West Midlands 0800 328 1111 0845 724 0240 www.westernpower.co.uk
Western Power Distribution: East Midlands (EMID)
East Midlands 0800 056 8090 0845 724 0240 www.westernpower.co.uk
Electricity North West Limited (ENWL) North West
England 0800 195 4141 0800 048 1820 www.enwl.co.uk
Northern Powergrid: Northeast (NPGN) Northeast England 0800 668 877 0845 070 7172 0800 781 8848 www.northernpowergrid.com
Northern Powergrid: Yorkshire (NPGY) Yorkshire and
North Lincolnshire 0800 375 675 0845 070 7172 0800 781 8848 www.northernpowergrid.com
Western Power Distribution: South Wales (SWALES)
South Wales 0800 365 900 0845 601 2989 www.westernpower.co.uk
Western Power Distribution: South West (SWEST)
South West England
0800 052 0400 0845 601 3341 www.westernpower.co.uk
UK Power Networks: London Power Networks (LPN)
London 0800 028 0247 0845 601 4516 0800 028 4587 www.ukpowernetworks.co.uk
UK Power Networks: South East Power Networks (SPN)
South East England
0800 783 8866 0845 601 4516 0800 028 4587 www.ukpowernetworks.co.uk
UK Power Networks: Eastern Power Networks (EPN)
East Anglia 0800 783 8838 0845 601 4516 0800 028 4587 www.ukpowernetworks.co.uk
Scottish Power: Distribution (SPD) Central and
Southern Scotland 0845 272 7999 0845 273 4444 www.spenergynetworks.co.uk
Scottish Power: Manweb (SPMW) Merseyside,
Cheshire and North Wales
0845 272 2424 0845 273 4444 www.spenergynetworks.co.uk
Scottish & Southern Energy: Hydro (SSEH)
North Scotland 0800 300 999 0800 048 3515 www.ssepd.co.uk
Scottish & Southern Energy: Southern Electric Power Distribution (SSES)
South England 0800 072 7282 0800 048 3516 www.ssepd.co.uk

70
Electricity Distribution Annual Report for 2010-11 30 March 2012
Appendices
Appendix 3 – Contact information for stakeholders
1.1. Stakeholders and in particular customers can contact a number of third parties should
they have a complaint regarding an energy network company. A consumer who has a
complaint about an energy network company should direct their complaint to the company
in the first instance. If a consumer considers the company has not satisfactorily resolved
the issue they can contact one of the organisations below.
1.2. Consumer Focus is a consumer advocacy body. It operates across the whole of the
economy, including the energy sector, promoting and campaigning for better access, value
and service levels for consumers. Consumer Focus can investigate any consumer complaint
if it is in the general interest of consumers. More information about Consumer Focus can be
found on their website: www.consumerfocus.org.uk.
1.3. The Energy Ombudsman is an independent and impartial body. It can investigate
complaints from domestic and micro-business customers about their energy supplier or
network operator and decide what actions should be taken when the parties cannot come
to an agreement. More information about the Energy Ombudsman is available on their
website: www.energy-ombudsman.org.uk.
1.4. Consumer Direct is a telephone and online service offering information and advice on
consumer issues. It is funded by the Office of Fair Trading and delivered in partnership with
Local Authority Trading Standards Services. It provides clear, practical and impartial advice
to help consumers sort out problems and disagreements with suppliers of goods or
services. It offers help and advice to every consumer in Great Britain who is buying or has
bought goods or services. More information about Consumer Direct can be found on their
website: www.consumerdirect.gov.uk.
1.5. The Citizens Advice Bureau is a registered charity that provides consumer advice and
information, education and advocacy. It has assumed a number of these responsibilities
from Consumer Direct. These services are free, independent and confidential, and provide
impartial advice to everyone on their rights and responsibilities. More information about the
Citizens Advice (England and Wales) and Citizens Advice Scotland can be found on their
respective websites: www.citizensadvice.org.uk and www.cas.org.uk.
1.6. The Health and Safety Executive (HSE) is the national independent regulatory body for
work-related health, safety and illness. It promotes better health and safety at work within
Great Britain. The HSE and local authorities work in partnership to assist dutyholders in
preventing work-related accidents and ill health. It aims to achieve this through
investigations, inspections and proactive measures including stakeholder engagement,
communications programmes and the provision of information and advice. More information
about the HSE is available on their website: www.hse.gov.uk.
1.7. Energy suppliers and network operators offer a range of free services to their most
vulnerable customers who are on their priority services register. These services are free to
join and are available to domestic gas and electricity customers that are one of the
following: of pensionable age, have a disability, have a hearing and or visual impairment or
have long-term ill health. For more information contact your local energy supplier or
network operator. Contact details for all the DNOs are set out in Appendix 2 of this report.

71
Electricity Distribution Annual Report for 2010-11 30 March 2012
Appendices
Appendix 4 – The Authority‟s Powers and Duties
1.1. Ofgem is the Office of Gas and Electricity Markets which supports the Gas and
Electricity Markets Authority (“the Authority”), the regulator of the gas and electricity
industries in Great Britain. This appendix summarises the primary powers and duties of the
Authority. It is not comprehensive and is not a substitute to reference to the relevant legal
instruments (including, but not limited to, those referred to below).
1.2. The Authority's powers and duties are largely provided for in statute, principally the
Gas Act 1986, the Electricity Act 1989, the Utilities Act 2000, the Competition Act 1998, the
Enterprise Act 2002 and the Energy Act 2004, as well as arising from directly effective
European Community legislation. References to the Gas Act and the Electricity Act in this
appendix are to Part 1 of each of those Acts.68
1.3. Duties and functions relating to gas are set out in the Gas Act and those relating to
electricity are set out in the Electricity Act. This appendix must be read accordingly69.
1.4. The Authority‟s principal objective when carrying out certain of its functions under each
of the Gas Act and the Electricity Act is to protect the interests of existing and future
consumers, wherever appropriate by promoting effective competition between persons
engaged in, or in commercial activities connected with, the shipping, transportation or
supply of gas conveyed through pipes, and the generation, transmission, distribution or
supply of electricity or the provision or use of electricity interconnectors.
1.5. The Authority must when carrying out those functions have regard to:
the need to secure that, so far as it is economical to meet them, all reasonable
demands in Great Britain for gas conveyed through pipes are met;
the need to secure that all reasonable demands for electricity are met;
the need to secure that licence holders are able to finance the activities which are the
subject of obligations on them70;
the need to contribute to the achievement of sustainable development; and
the interests of individuals who are disabled or chronically sick, of pensionable age, with
low incomes, or residing in rural areas.71
1.6. Subject to the above, the Authority is required to carry out the functions referred to in
the manner which it considers is best calculated to:
promote efficiency and economy on the part of those licensed72 under the relevant Act
and the efficient use of gas conveyed through pipes and electricity conveyed by
distribution systems or transmission systems;
68 Entitled “Gas Supply” and “Electricity Supply” respectively. 69 However, in exercising a function under the Electricity Act the Authority may have regard to the interests of consumers in relation to gas conveyed through pipes and vice versa in the case of it exercising a function under the Gas Act. 70 under the Gas Act and the Utilities Act, in the case of Gas Act functions, or the Electricity Act, the Utilities Act and certain parts of the Energy Act in the case of Electricity Act functions. 71 The Authority may have regard to other descriptions of consumers.

72
Electricity Distribution Annual Report for 2010-11 30 March 2012
Appendices
protect the public from dangers arising from the conveyance of gas through pipes or the
use of gas conveyed through pipes and from the generation, transmission, distribution
or supply of electricity; and
secure a diverse and viable long-term energy supply.
1.7. In carrying out the functions referred to, the Authority must also have regard, to:
the effect on the environment of activities connected with the conveyance of gas
through pipes or with the generation, transmission, distribution or supply of electricity;
the principles under which regulatory activities should be transparent, accountable,
proportionate, consistent and targeted only at cases in which action is needed and any
other principles that appear to it to represent the best regulatory practice; and
certain statutory guidance on social and environmental matters issued by the Secretary
of State.
1.8. The Authority has powers under the Competition Act to investigate suspected anti-
competitive activity and take action for breaches of the prohibitions in the legislation in
respect of the gas and electricity sectors in Great Britain and is a designated National
Competition Authority under the EC Modernisation Regulation73 and therefore part of the
European Competition Network. The Authority also has concurrent powers with the Office of
Fair Trading in respect of market investigation references to the Competition Commission.
72 or persons authorised by exemptions to carry on any activity. 73 Council Regulation (EC) 1/2003

73
Electricity Distribution Annual Report for 2010-11 30 March 2012
Appendices
Appendix 5 – Electricity Guaranteed Standards of Performance
9.17. Table A5.1 gives an outline of the Electricity Guaranteed Standards of Performance (EGS) and the payments due to customers for not
meeting these. Some exemptions apply. The EGS codes shown here are only those which relate to DNOs.
Table A5.1 Electricity Guaranteed Standards of Performance
Reporting code Service Performance Level Guaranteed standards Payments
EGS1
Responding to failure of
distributor‟s fuse
(Regulation 12)
All DNOs to respond within 3 hours on a
working day (at least) 7 am to 7 pm, and
within 4 hours on other days between (at
least) 9 am to 5 pm , otherwise a payment
must be made
£22 for domestic and non-
domestic customers
EGS2*
Supply restoration - normal
conditions
(Regulation 5)
Supply must be restored within 18 hours;
otherwise a payment must be made.
£54 for domestic customers and
£108 for non-domestic
customers, plus £27 for each
further 12 hours
EGS2A*
Supply restoration: multiple
interruptions
(Regulation 11)
If four or more interruptions each lasting 3 or
more hours occur in any single year (1 April –
31 March), a payment must be made
£54 for domestic and non-
domestic customers
EGS2B*
Supply restoration - normal
conditions (5,000 or more
premises interrupted)
(Regulation 6)
Where a large scale event occurs, that is
where 5,000 or more customers‟ premises are
interrupted by a single failure of, fault in or
damage to a distributor‟s distribution system,
then supply must be restored within 24 hours,
otherwise a payment must be made
£54 for domestic customers and
£108 for non-domestic
customers, plus £27 for each
further 12 hours up to a cap of
£216 per customer
EGS2C* Supply restoration – rota
disconnections (Regulation 8)
Where supply to a customer‟s premises is
interrupted as a result of rota disconnection
on a distributor‟s distribution system by a
failure of, fault in or damage to that system,
then supply must be restored within 24 hours,
otherwise a payment must be made
£54 for domestic customers and
£108 for non-domestic
customers

74
Electricity Distribution Annual Report for 2010-11 30 March 2012
Appendices
Reporting code Service Performance Level Guaranteed standards Payments
EGS3 Estimate of charges for
connections (Regulation 13)
Distributors must dispatch an estimate to the
customer within either 5 working days or 15
working days (15 working days applies if
significant work beyond a distributor‟s fuse
and service line are necessary), otherwise a
payment must be made
£44 for domestic and non-
domestic customers
EGS4*
Notice of planned interruption to
supply
(Regulation 14)
Customers must be given at least 2 days
notice, otherwise a payment must be made
£22 for domestic and £44 for
non-domestic customers
EGS5
Investigation of voltage
complaints
(Regulation 15)
Visit customer‟s premises within 7 working
days or dispatch an explanation of the
probable reason for the complaint within 5
working days, otherwise a payment must be
made
£22 for domestic and non-
domestic customers
EGS8
Making and keeping
appointments
(Regulation 19)
Companies must offer and keep a timed
appointment, or offer and keep a timed
appointment where requested by the
customer, otherwise a payment must be made
£22 for domestic and non-
domestic customers
EGS9
Payments owed under the
standards
(Regulation 21)
Payment to be made within 10 working days,
otherwise a payment must be made
£22 for domestic and non-
domestic customers
EGS11*
(EGS11A,
EGS11B and
EGS11C)
Supply restoration: severe
weather conditions
(Regulation 7)
Depending on category of event supply must
be restored within 24, 48 or a multiple of 48
hours, otherwise a payment must be made
£27 for domestic and non
domestic customers, plus £27 for
each further 12 hours up to a
cap of £216 per customer
EGS12*
Supply restoration: Highlands
and Islands
(Regulation 9)
Supply must be restored within 18 hours,
otherwise a payment must be made
£54 for domestic customers and
£108 for non-domestic
customers, plus £27 for each
further 12 hours Note: *Customers need to claim under standards marked with an asterisk. The remaining standards require DNOs to make payments proactively.

75
Electricity Distribution Annual Report for 2010-11 30 March 2012
Appendices
Appendix 6 – Indicator calculation methodology
1.1. This appendix sets out the methods for calculating the traffic light
performance indicators shown in Table 2.1 of Chapter 2. Table A6.1 presents the
measures on which the 2010-11 traffic lights are based and an outline of the
measures which may be used in future traffic lights.
Table A6.1 Basis of Traffic Light Indicators
Traffic light Current basis Potential future basis Network health
index None % delivery of network health
deliverable. Refinements to
the method likely Network load index None We would look to include this
in future reports Reliability and
Availability Customer interruptions
(CI) and Customer
minutes lost (CML)
performance against
respective targets
No planned change
Customer
satisfaction Quality of telephone
performance We will base this on the
broad measure of customer
satisfaction from 2011-12 Connections Competition tests,
Connections and
distributed generation
(DG) standards of
performance, DG fora
feedback
In future we may base this
on feedback from
connections customers
through the broad measure
and potentially include the
outcomes of connections
related determinations Environment Placeholder only Losses, Business carbon
footprint (BCF), oil leakage,
sulphur hexafluoride (SF6)
leakage Social responsibility Use of Worst Served
Customer (WSC) funding,
Discretionary reward
scheme (DRS), spend on
undergrounding
The use of expenditure to
consider performance on
these aspects of social
responsibility may be
reviewed for subsequent
reports. We will look to
include the stakeholder
engagement component of
the broad measure from
2012-13.
A – Network health index
1.2. We are currently refining a methodology to assess interim progress on the
network health deliverable which is due by the end of the price control period. We
will look to provide information on each DNO‟s progress in this area following the
mid-period review of secondary network deliverables.

76
Electricity Distribution Annual Report for 2010-11 30 March 2012
Appendices
B - Customer interruptions and Customer minutes lost
1.3. Each DNO‟s respective Customer interruptions (CI) and Customer minutes
lost (CML) performance is set out in the second column of Table 2.1. The traffic
light indicator is a measure of the DNO‟s performance against their respective
targets.
1.4. Table A6.2 shows how CI and CML achieved by each DNO differed from their
respective CI and CML targets. Performance better (lower) than both CI and CML
targets scored green. Performance better (lower) than only one of the two targets
scored amber. Performance worse (higher) than both CI and CML targets scored
red.
Table A6.2 CI and CML performance by DNO
%
Performance
against CI
target
Performance
against CML
target
Traffic Light
Indicator
WMID -7.01 -7.73 green
EMID -18.49 -20.43 green
ENWL -9.64 -14.93 green
NPGN -4.54 -0.28 green
NPGY -7.17 -10.26 green
SWales -26.54 -27.35 green
SWest -16.44 -16.47 green
LPN -26.95 3.41 amber
SPN -9.53 -16.44 green
EPN 13.01 1.83 red
SPD -15.64 -24.58 green
SPMW -13.82 -22.26 green
SSEH -3.90 4.39 amber
SSES -13.82 -7.24 green
C - Customer satisfaction
1.5. The customer satisfaction traffic light indicator is a measure of telephone
response performance. Quality of telephone performance was measured using
monthly customer surveys. DNOs were rewarded or penalised based on their
overall annual score (out of five).
1.6. The traffic lights score is based on whether the DNO received a financial
reward, penalty or neither, as shown in Table A6.3.

77
Electricity Distribution Annual Report for 2010-11 30 March 2012
Appendices
Table A6.3 Basis of customer satisfaction traffic light
Financial outcome Component score
Penalty
Neither reward nor penalty
Reward
1.7. A broad measure of customer satisfaction will come into effect from the
2012-13 regulatory year and will replace the telephony indicator. The broad
measure encompasses three aspects of customer satisfaction including the results
of the customer satisfaction survey, complaints metric and DNO stakeholder
engagement.
D – Connections
1.8. The indicator for connections performance is based on performance against
the competition tests; Connections and Distributed Generation (DG)74 Standards
of Performance; and stakeholder feedback from the DG fora.
1.9. Concerns were raised by DG connections customers and other stakeholders
regarding the level of service experienced across the industry. 75 For this reason,
we have assigned all DNOs an amber component rating.
1.10. For 2010-11, the first year of the DPCR5 price control, no DNO had come
forward for the competition test. This means that in 2010-11, no DNO had any
market segments that passed the competition tests. All companies were therefore
assigned an amber component rating.
1.11. The connections guaranteed standards of performance were only in place
for six months of the year, therefore for this year all DNOs were assigned an
amber component rating.
1.12. Based on these three aspects of performance, all DNOs received an amber
rating for connections. We are looking to develop an indicator which provides
more of a differential on connections performance in future.
E – Environment
9.18. The environmental performance data we currently collect does not lend
itself to a traffic light indicator. We are looking to collect performance data in a
more amenable format to producing a traffic light in future. There is an
environmental indicator placeholder in the table to represent this.
74 Distributed generation is any electricity generation which is connected directly to the distribution network, as opposed to the transmission network, as well as combined heat and power schemes of any scale. 75 Further information on the feedback from DG stakeholders is available on our website at: http://www.ofgem.gov.uk/Pages/MoreInformation.aspx?docid=220&refer=NETWORKS/ELECDIST/POLICY/DISTGEN

78
Electricity Distribution Annual Report for 2010-11 30 March 2012
Appendices
9.19. In future, we will look to use improvements in business carbon footprint, oil
leakage and SF6 leakage as comparative measures to represent each DNO‟s
environmental performance. We would potentially also look to use electrical
losses.
F - Social
1.13. The social obligations performance indicator is based on investment to
improve the network for worst served customers (WSC)76, use of the
undergrounding (UG) funding mechanism and awards from the electricity
discretionary reward scheme (DRS).
1.14. DNOs scored one point for each of the mechanisms above. DNOs received a
green traffic light indicator for two or more points, amber for one point and red
for zero points as shown for each DNO in Table A6.4. A small traffic light indicator
is used to reflect that some of these initiatives are new and others are available
for use at any time during the price control, so we anticipate that 2010-11
performance may not be representative of long term performance in these areas.
Table A6.4 Basis of social responsibility traffic light
Social responsibility
WMID DRS UG
EMID DRS UG
ENWL UG
NPGN DRS UG
NPGY DRS UG
SWales WSC DRS UG
SWest WSC DRS UG
LPN *
SPN UG
EPN UG
SPD UG
SPMW UG
SSEH none
SSES none Note: At the time of setting DPCR5 final proposals, LPN had no worst served customers and therefore received no allowance. As such, LPN was awarded one point because it is considered to have high performance with regards to WSC. LPN also has no undergrounding allowance.
76 A Worst Served Customer is defined as a network user who has had 15 or more interruptions to supply over 3 years and at least 3 interruptions in each of those three years.

79
Electricity Distribution Annual Report for 2010-11 30 March 2012
Appendices
Appendix 7 - Feedback Questionnaire
Ofgem considers that consultation is at the heart of good policy development. We
are keen to consider any comments or complaints about the manner in which this
consultation has been conducted. In any case we would be keen to get your
answers to the following questions:
Does the report adequately reflect your views? If not, why not?
Does the report offer a clear explanation as to why not all the views offered
had been taken forward?
Did the report offer a clear explanation and justification for the decision? If
not, how could this information have been better presented?
Do you have any comments about the overall tone and content of the report?
Was the report easy to read and understand, could it have been better
written?
Please add any further comments?
Please send your comments to:
Andrew MacFaul
Consultation Co-ordinator
Ofgem
9 Millbank
London
SW1P 3GE