electrical stimulation of renal nerves for modulating
TRANSCRIPT

RESEARCH ARTICLE Open Access
Electrical stimulation of renal nerves formodulating urine glucose excretion in ratsAhmad A. Jiman1,2, Kavaljit H. Chhabra3, Alfor G. Lewis4, Paul S. Cederna1,5, Randy J. Seeley4, Malcolm J. Low3
and Tim M. Bruns1,2*
Abstract
Background: The role of the kidney in glucose homeostasis has gained global interest. Kidneys are innervated byrenal nerves, and renal denervation animal models have shown improved glucose regulation. We hypothesized thatstimulation of renal nerves at kilohertz frequencies, which can block propagation of action potentials, wouldincrease urine glucose excretion. Conversely, we hypothesized that low frequency stimulation, which has beenshown to increase renal nerve activity, would decrease urine glucose excretion.
Methods: We performed non-survival experiments on male rats under thiobutabarbital anesthesia. A cuff electrodewas placed around the left renal artery, encircling the renal nerves. Ureters were cannulated bilaterally to obtainurine samples from each kidney independently for comparison. Renal nerves were stimulated at kilohertzfrequencies (1–50 kHz) or low frequencies (2–5 Hz), with intravenous administration of a glucose bolus shortly intothe 25–40-min stimulation period. Urine samples were collected at 5–10-min intervals, and colorimetric assays wereused to quantify glucose excretion and concentration between stimulated and non-stimulated kidneys. A Kruskal-Wallis test was performed across all stimulation frequencies (α = 0.05), followed by a post-hoc Wilcoxon rank sumtest with Bonferroni correction (α = 0.005).
Results: For kilohertz frequency trials, the stimulated kidney yielded a higher average total urine glucose excretionat 33 kHz (+ 24.5%; n = 9) than 1 kHz (− 5.9%; n = 6) and 50 kHz (+ 2.3%; n = 14). In low frequency stimulation trials,5 Hz stimulation led to a lower average total urine glucose excretion (− 40.4%; n = 6) than 2 Hz (− 27.2%; n = 5). Theaverage total urine glucose excretion between 33 kHz and 5 Hz was statistically significant (p < 0.005). Similaroutcomes were observed for urine flow rate, which may suggest an associated response. No trends or statisticalsignificance were observed for urine glucose concentrations.
Conclusion: To our knowledge, this is the first study to investigate electrical stimulation of renal nerves tomodulate urine glucose excretion. Our experimental results show that stimulation of renal nerves may modulateurine glucose excretion, however, this response may be associated with urine flow rate. Future work is needed toexamine the underlying mechanisms and identify approaches for enhancing regulation of glucose excretion.
Keywords: Electrical stimulation, Kidney, Renal nerve, Glucose, Urine, Glycosuria
* Correspondence: [email protected] of Biomedical Engineering, University of Michigan, Ann Arbor,MI, USA2Biointerfaces Institute, University of Michigan, Ann Arbor, MI, USAFull list of author information is available at the end of the article
Bioelectronic Medicine
© The Author(s). 2018 Open Access This article is distributed under the terms of the Creative Commons Attribution 4.0International License (http://creativecommons.org/licenses/by/4.0/), which permits unrestricted use, distribution, andreproduction in any medium, provided you give appropriate credit to the original author(s) and the source, provide a link tothe Creative Commons license, and indicate if changes were made. The Creative Commons Public Domain Dedication waiver(http://creativecommons.org/publicdomain/zero/1.0/) applies to the data made available in this article, unless otherwise stated.
Jiman et al. Bioelectronic Medicine (2018) 4:7 https://doi.org/10.1186/s42234-018-0008-5

BackgroundDiabetes mellitus is a chronic progressive disease that re-quires continuous monitoring and medical care to preventthe development of severe complications (American Dia-betes Association (ADA) 2018). Medications for diabeticmanagement are numerous and have different mecha-nisms of action (Chatterjee and Davies 2015). Recently,sodium-glucose co-transporter 2 (SGLT-2) inhibitors wereapproved by the US Food and Drug Administration (FDA)for patients with type 2 diabetes. SGLT-2 inhibitors pre-vent the activity of SGLT-2 transporters in the renal prox-imal tubule, thereby reducing glucose reuptake by thekidneys and increasing glucose excretion into urine (Lewand Wick 2015). Despite the progress in the developmentof diabetic medications, many lose their effectiveness overtime, which makes achieving blood glucose control targetsdifficult for many diabetic patients (Blak et al. 2012;Khunti et al. 2013; Ali et al. 2013). Furthermore, sustainedpatient adherence to these diabetic medications in a life-long therapy is a major challenge (García-Pérez et al.2013; Sabaté 2003). Therefore, there is a crucial need foralternative diabetic therapies that overcome these pharma-ceutical limitations.In recent years, a global interest has emerged for
catheter-based renal denervation as a potential treat-ment for drug-resistant hypertension (Pan et al. 2015;Bhatt et al. 2014). Early clinical trials of renal denerv-ation showed significant blood pressure improvements(Esler et al. 2010; Krum et al. 2009). Interestingly, renaldenervation was also associated with significant de-creases in blood glucose levels (Mahfoud et al. 2011;Witkowski et al. 2011). Renal denervation studies in ani-mals align with the observed blood glucose control im-provements reported in clinical trials (Rafiq et al. 2015;Iyer et al. 2016). Furthermore, a recent study reportedthat mutant (neuronal POMC-deficient) mice showedimproved capability for tolerating high blood glucoselevels by exaggerating urine glucose excretion (glyco-suria) compared to wild-type mice at similar inducedblood glucose concentrations (Chhabra et al. 2016). Afollowing study determined that the observed glycosuriaand improved glucose tolerance were a result of reducedactivity in renal sympathetic nerves (Chhabra et al.2017). A non-pharmaceutical and reversible approachthat has emerged in recent years for reducing nerve ac-tivity is kilohertz frequency stimulation, which has dem-onstrated nerve conduction block on multiple types ofnerves (Kilgore and Bhadra 2014; Joseph and Butera2009; Joseph and Butera 2011). We hypothesized thatkilohertz frequency stimulation (1–50 kHz) on renalnerves would attain similar results to renal denervationand induce urine glucose excretion.Several studies have successfully influenced renal nerve
activity in humans and animals by applying electrical
stimulation. Electrical stimulation of renal nerves with anintra-arterial catheter electrode demonstrated increasedblood pressure, and was considered as a method for locat-ing suitable renal denervation targets for the treatment ofdrug-resistant hypertensive patients (Chinushi et al. 2013;Madhavan et al. 2014; Gal et al. 2015). Direct stimulationof renal nerves in rats using wire hook electrodes at lowfrequencies (0.5–10 Hz) showed increased renin secretionand water reabsorption, and decreased renal blood flowand sodium excretion responses (DiBona and Kopp 1997;DiBona and Sawin 1982; Bello-Reuss et al. 1976; Her-mansson et al. 1981; Van Vliet et al. 1991). Sodium andglucose reabsorption are partially associated due to thepresence of sodium-glucose co-transporters (SGLTs) inthe renal proximal tubule (Mather and Pollock 2011). Ourhypothesis was that direct stimulation of renal nerves atlow frequencies (0.5–10 Hz) would decrease urine glucoseexcretion.Therapies that directly alter neural activity (neuromo-
dulation) are commonly prescribed as treatments for avariety of conditions (Krames et al. 2009; Famm et al.2013). Gastric electrical stimulation is used to help pa-tients with delayed stomach-emptying of solid foods(gastroparesis), which is commonly observed in patientswith diabetes (Abell et al. 2003). Vagal nerve block(vBloc) therapy was recently approved by the FDA forcertain patients with morbid obesity (Apovian et al.2017). Clinical trials on vBloc therapy reported improve-ments in blood glucose control for patients with obesityand type 2 diabetes but were not sustained after24 months (Herrera et al. 2017). Despite the success ofneuromodulation therapies, to our knowledge, no clin-ical studies have investigated organ-targeted neuromo-dulation as a treatment approach for diabetes. In thisstudy, we investigated modulation of urine glucose ex-cretion with kilohertz and low frequency stimulation onrenal nerves.
MethodsAll experimental procedures were approved by the Uni-versity of Michigan Institutional Animal Care and UseCommittee (IACUC).
Animals and housingRats have a similar urinary system to humans and ratrenal nerves have been visualized by several researchgroups (Stocker and Muntzel 2013; Miki et al. 2002).Non-survival, anesthetized experiments were performedon 24 male 290–550 g Long-Evans and Sprague-Dawleyrats (Charles Rivers Laboratories, Wilmington, MA,USA). All animals were housed in ventilated cages undercontrolled temperature, humidity, and photoperiod(12-h light/dark cycle). The animals were provided with
Jiman et al. Bioelectronic Medicine (2018) 4:7 Page 2 of 11
laboratory chow (5L0D, LabDiet, St. Louis, MO, USA)and tap water ad libitum.
Experimental preparationFor anesthesia, a single dose of thiobutabarbital sodiumsalt hydrate (Inactin, T133-1G, Sigma-Aldrich Corp., St.Louis, MO, USA) was injected intraperitoneally (110 mg/kg BW). Thiobutabarbital is commonly used in renal stud-ies and is known to preserve renal function duringanesthesia (Walter et al. 1989; Sohtell et al. 1983). Ratswere placed on a heating pad (ReptiTherm, Zoo Med La-boratories Inc., San Luis Obispo, CA, USA) andtemperature was monitored through a rectal temperaturesensor (SurgiVet, Smiths Medical, Norwell, MA, USA).Under a dissection microscope (Lynx EVO, Vision Engin-eering Inc., New Milford, CT, USA), a midline cervical in-cision was made and the jugular vein was cannulated withpolyethylene tubing (BTPE-50, Instech Laboratories Inc.,Plymouth Meeting, PA, USA). Through the jugular vein,0.9% NaCl (saline), equivalent to 10% body weight, was in-fused over 30 min, and then followed by a continuous in-fusion of 0.2 mL/min using a syringe pump (NE-1000,New Era Pump Systems Inc., Farmingdale, NY, USA) (Bel-lo-Reuss et al. 1976). A tracheotomy was performed to en-sure a clear airway. Ureters were cannulated bilaterallywith polyethylene tubing (BTPE-10, Instech LaboratoriesInc., Plymouth Meeting, PA, USA) to obtain urine samplesfrom each kidney independently. The left kidney was ex-posed through a midline abdominal incision. Fat and con-nective tissue surrounding the kidney were separatedusing cotton-tipped applicators to further expose the kid-ney and renal artery. A bipolar nerve cuff electrode(1.00 mm inner-diameter, 100 μm platinum contacts, Mi-croprobes for Life Science, Gaithersburg, MD, USA) wasplaced around the renal artery, encircling renal nerves thatrun along the artery (Stocker and Muntzel 2013; Miki etal. 2002). Care was taken to not damage the renal nervebranches and to not occlude blood flow in the renal artery.To ensure that the renal nerves were intact, biphasicstimulation pulses at 10 Hz, 10 V were applied for ap-proximately 1 min through the nerve cuff electrode. Thisresulted in temporary kidney ischemia, which was con-firmed by the observation of kidney surface blanching(Hermansson et al. 1981; Yao et al. 2014). Thisstimulation-driven ischemia occurred in all the experi-ments in which we performed the test (n = 18). Prior toimplant, electrode impedance measurements (4.77 ± 1.53kΩ) were taken using an impedance tester (nanoZ, WhiteMatter LLC, Seattle, WA, USA) at 1 kHz in saline to con-firm functionality of the nerve cuff electrode.
Electrical stimulationThe nerve cuff electrode placed on the renal nerves wasconnected to an isolated pulse stimulator (Model 4100,
A-M Systems, Loop Sequim, WA, USA). For kilohertzfrequency stimulation, a function generator (33220A,Agilent Technologies, Santa Clara, CA, USA) was con-nected to the isolated pulse stimulator to generate sinus-oidal waveforms at 1, 33 or 50 kHz. The stimulationamplitude was fixed at 15 V, which has been shown toprovide nerve conduction block for all selected frequen-cies on unmyelinated nerves (Joseph and Butera 2009;Joseph and Butera 2011). For low frequency stimulation,the isolated pulse stimulator generated biphasic pulses at2 or 5 Hz. The stimulation amplitude and pulse widthwas fixed at 10 V and 0.5 msec, respectively, which isabove the activation threshold for rat C-fibers using cuffelectrodes (Woodbury and Woodbury 1990). The stimu-lation frequencies were randomly ordered between trialsacross all experiments to mitigate sequential effects.
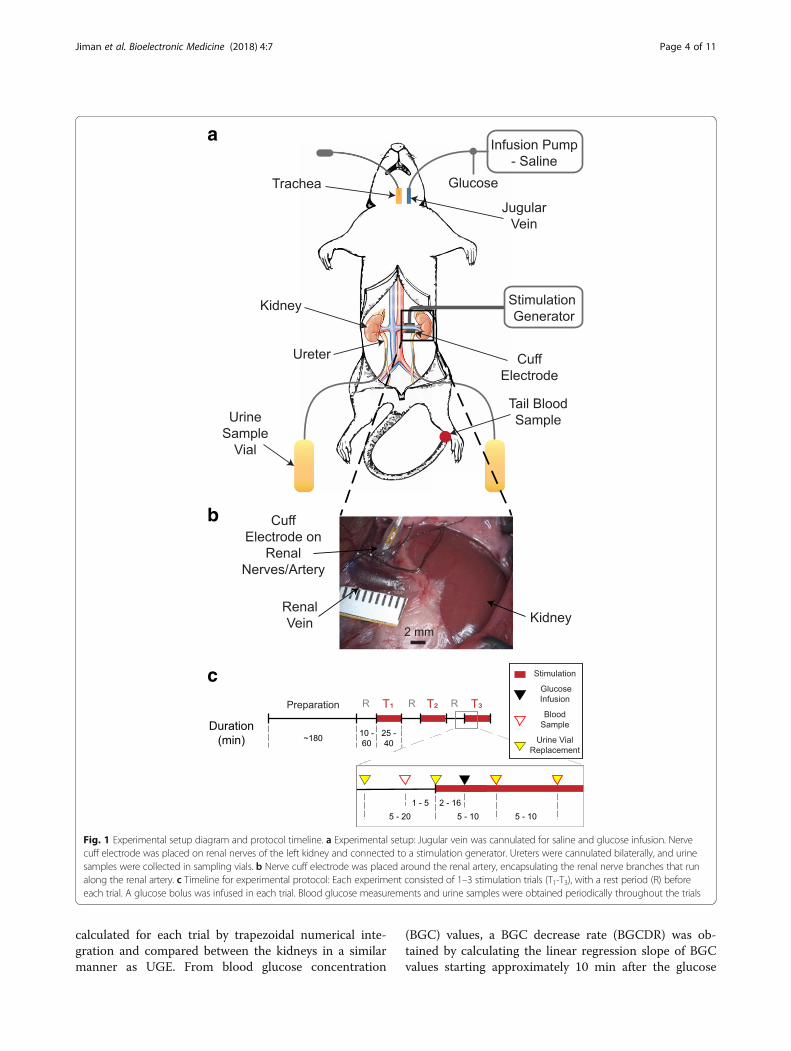
Experimental protocolAfter completion of surgery, a stabilization period of10–60 min was provided. In each experiment, 1–3 trialswith different stimulation frequencies were applied onthe nerve cuff electrode. Stimulation was applied at thestart of a trial and remained on for 25–40 min. To ele-vate blood glucose levels beyond the expected renalthreshold for glucose excretion (400 mg/dL) (Liang et al.2012), a 0.30–1.00 g bolus dose of glucose (50% Dex-trose Injection USP, Hospira Inc., Lake Forest, IL, USA)was delivered through the jugular vein at 2–16 min intoeach trial. To confirm blood glucose increase and tomonitor blood glucose levels over time, drops of blood(< 0.1 mL) from a tail cut were used to obtain blood glu-cose concentration measurements using a glucometer(AlphaTRAK 2, Abbott, Abbott Park, IL, USA) beforeglucose infusion and every 5–10 min after glucose infu-sion. Urine samples from each kidney were collected inpre-weighed sampling tubes (3448, Thermo Fisher Scien-tific, Waltham, WA, USA) at 5–10-min intervals. Tenminutes after the end of a trial, blood glucose measure-ments were expected to be around baseline levels. If not,a longer washout period was provided to the rat beforeproceeding to the next experimental trial. The collectedurine samples were weighed on a scale (AE 160, MettlerToledo, Columbus, OH, USA) for volume estimations(1 μL/mg). Urine glucose concentrations were measuredusing colorimetric assays (10009582, Cayman Chemical,Ann Arbor, MI, USA). The experimental setup andprotocol timeline are summarized in Fig. 1.From the urine sample volumes and glucose concen-
tration measurements, the total urine glucose excretion(UGE) was calculated and compared between the stimu-lated and non-stimulated kidney [ΔUGE = (UGEstimulated
– UGEnon-stimulated)/UGEnon-stimulated × 100] for eachtrial. For urine glucose concentration (UGC) and urineflow rate (UFR), the area under the curve (AUC) was
Jiman et al. Bioelectronic Medicine (2018) 4:7 Page 3 of 11
calculated for each trial by trapezoidal numerical inte-gration and compared between the kidneys in a similarmanner as UGE. From blood glucose concentration
(BGC) values, a BGC decrease rate (BGCDR) was ob-tained by calculating the linear regression slope of BGCvalues starting approximately 10 min after the glucose
c
b
a
Fig. 1 Experimental setup diagram and protocol timeline. a Experimental setup: Jugular vein was cannulated for saline and glucose infusion. Nervecuff electrode was placed on renal nerves of the left kidney and connected to a stimulation generator. Ureters were cannulated bilaterally, and urinesamples were collected in sampling vials. b Nerve cuff electrode was placed around the renal artery, encapsulating the renal nerve branches that runalong the renal artery. c Timeline for experimental protocol: Each experiment consisted of 1–3 stimulation trials (T1-T3), with a rest period (R) beforeeach trial. A glucose bolus was infused in each trial. Blood glucose measurements and urine samples were obtained periodically throughout the trials
Jiman et al. Bioelectronic Medicine (2018) 4:7 Page 4 of 11

bolus infusion and ending with the final value in thetrial. The glucometer was unable to read blood glucoseconcentrations above 750 mg/dL, which occasionally oc-curred during the first 10 min after a glucose bolus infu-sion. Therefore, BGC values within 10 min after aglucose bolus infusion were excluded in BGCDR calcula-tions for all stimulation trials.
Statistical analysisAcross all experiments, data sets did not follow a normal dis-tribution (confirmed by one-sample Kolmogorov-Smirnovtest). Therefore, a non-parametric Kruskal-Wallis test wasperformed to measure statistical significance across stimula-tion frequencies. Statistical significance was considered at p< 0.05. A two-sided Wilcoxon rank sum test was then ap-plied between pairs of stimulation frequencies. The signifi-cance level (α) was adjusted according to a Bonferronicorrection, where α was divided by the number of stimula-tion pairs (10). Thus, statistical significance for the Wilcoxonrank sum test was considered at p < 0.005. All data analysisand statistical tests were performed using MATLAB software(R2014b, MathWorks, Natick, MA, USA).
ResultsAcross the 24 experiments on male rats, we performedstimulation trials at kilohertz frequencies (1 kHz [n = 6],33 kHz [n = 9] and 50 kHz [n = 14]) and low frequencies
(2 Hz [n = 5] and 5 Hz [n = 6]). We obtained measure-ments of urine glucose excretion, urine glucose concen-tration, urine flow rate, and blood glucose concentrationin each trial.
Urine glucose excretionGlucose excretion was analyzed and compared betweenthe urine samples obtained from the stimulated andnon-stimulated kidneys. The percentage difference ofurine glucose excretion (ΔUGE) between the stimulatedand non-stimulated kidneys for all stimulation frequen-cies are shown in Fig. 2a. Overall, stimulation frequencyhad a statistically significant effect on ΔUGE (Kruskal--Wallis test, p < 0.05). In kilohertz frequency trials,33 kHz yielded a higher average ΔUGE (+ 24.5%; n = 9)than 1 kHz (− 5.9%; n = 6) and 50 kHz (+ 2.3%; n = 14).In low frequency trials, 5 Hz stimulation led to a loweraverage ΔUGE (− 40.4%; n = 6) than 2 Hz (− 27.2%; n =5). Statistical significance only occurred between theΔUGE of 33 kHz and 5 Hz trials (Wilcoxon rank sumtest, p < 0.005). Stimulation at kilohertz frequencies metour hypothesis of increased UGE in 14 trials (48.2%),had no apparent effect (|ΔUGE| < 5%) in 10 trials(34.5%), and showed a decrease in UGE in 5 trials(17.2%) out of the 29 total kilohertz frequency trials. Inlow frequency stimulation trials, we observed a decreaseof UGE in 9 trials (81.8%), no apparent effect in 1 trial
a
b
c
d
Fig. 2 Changes in urine glucose excretion. a The percentage difference in urine glucose excretion between the stimulated and non-stimulatedkidney (ΔUGE) at the applied stimulation frequencies. Stimulation frequency had a statistically significant main effect (Kruskal-Wallis test, p < 0.05),with one within-frequency comparison being significant (5 Hz and 33 kHz, post-hoc Wilcoxon rank sum test, * = p < 0.005). b Representativestimulation trial at 33 kHz that showed an increase in UGE. c Representative stimulation trial at 33 kHz that showed no apparent effect on UGE.d Representative stimulation trial at 33 kHz that showed a decrease in UGE
Jiman et al. Bioelectronic Medicine (2018) 4:7 Page 5 of 11

(9.1%), and an increase of UGE in 1 trial (9.1%) out of11 trials in total. Examples of stimulation trials at33 kHz that displayed an increase, no apparent effect, ora decrease in UGE are shown in Fig. 2b-d.
Urine glucose concentrationThe urine glucose concentration (UGC) differences be-tween the urine samples obtained from the stimulated andnon-stimulated kidneys at all stimulation frequencies areshown in Fig. 3a. The average UGC difference was + 5.9%at 2 Hz (n = 5), + 12.6% at 5 Hz (n = 6), + 3.7% at 1 kHz (n= 6), + 3.7% at 33 kHz (n = 9), and − 6.2% at 50 kHz (n =14). Stimulation frequency did not have an overall signifi-cant effect on UGC (Kruskal-Wallis test, p = 0. 2365).
Urine flow rateThe urine flow rate (UFR) differences between the urinesamples obtained from the stimulated and non-stimulatedkidneys at all stimulation frequencies are shown inFig. 4a. The average UFR difference was − 27.7% at2 Hz (n = 5), − 40.6% at 5 Hz (n = 6), − 6.0% at 1 kHz(n = 6), + 14.6% at 33 kHz (n = 9), and + 9.8% at50 kHz (n = 14). Stimulation frequency had a statisti-cally significant main effect on UFR (Kruskal-Wallistest, p < 0.05), with trials at 33 kHz and 5 Hz signifi-cantly different from one another (post-hoc Wilcoxonrank sum test, p < 0.005).
Blood glucose concentrationThe blood glucose concentration decrease rates (BGCDRs)during stimulation at all frequencies are shown in Fig. 5a.The average BGCDR was − 9.1 mg/dL/min at 2 Hz (n = 4),− 13.5 mg/dL/min at 5 Hz (n = 5), − 13.5 mg/dL/min at1 kHz (n = 6), − 12.0 mg/dL/min at 33 kHz (n = 9), and −12.5 mg/dL/min at 50 kHz (n = 13). No statistically signifi-cant main effect occurred across all stimulation frequencies(Kruskal-Wallis test, p = 0.4708). BGCDR at some stimula-tion trials [2 Hz (n = 1), 5 Hz (n = 1) and 50 kHz (n = 1)]were not calculated due to insufficient BGC values.
DiscussionThe aim of this study was to investigate modulation ofurine glucose excretion by electrical stimulation of renalnerves. We hypothesized that stimulation of renal nervesat kilohertz frequencies (1–50 kHz) would increase urineglucose excretion (UGE), while low frequency stimu-lation (2–5 Hz) would decrease UGE. Althoughstimulation at kilohertz frequencies did not alwayslead to an increase in UGE, 33 kHz showed a not-able average increase in UGE in accordance with ourhypothesis. In contrast, low frequency stimulationtypically showed a decrease in UGE, with the stron-gest effect observed at 5 Hz stimulation (Fig. 2). Toour knowledge, this study is the first to demonstrateinfluence of electrical stimulation of renal nerves onglucose excretion.
a
b
c
d
Fig. 3 Changes in urine glucose concentration. a The percentage difference between the area under the curve for urine glucose concentration of thestimulated and non-stimulated kidney (ΔAUCUGC) at the applied stimulation frequencies. b Urine glucose concentration (UGC) measurements for thetrial shown in Fig. 2b. c UGC measurements for the trial shown in Fig. 2c. d UGC measurements for the trial shown in Fig. 2d
Jiman et al. Bioelectronic Medicine (2018) 4:7 Page 6 of 11

a
b
c
d
Fig. 4 Changes in urine flow rate. a The percentage difference between the area under the curve for urine flow rate of the stimulated andnon-stimulated kidney (ΔAUCUFR) at the applied stimulation frequencies. Stimulation frequency had a significant main effect (Kruskal-Wallis test,p < 0.05), with 5 Hz and 33 kHz trials significantly different from each other (post-hoc Wilcoxon rank sum test, * = p < 0.005). b Urine flow rate(UFR) measurements for the trial shown in Fig. 2b. c UFR measurements for the trial shown in Fig. 2c. d UFR measurements for the trial shownin Fig. 2d
a
b
c
d
Fig. 5 Changes in blood glucose concentration. a The blood glucose concentration decrease rate (BGCDR) at the applied stimulation frequencies.b Blood glucose concentration (BGC) measurements and BGCDR (slope) for the trial shown in Fig. 2b. c BGC and BGCDR measurements for thetrial shown in Fig. 2c. d BGC and BGCDR measurements for the trial shown in Fig. 2d. BGC measurements above 750 mg/dL were not availabledue to the limitations of the glucometer
Jiman et al. Bioelectronic Medicine (2018) 4:7 Page 7 of 11
The average differences in UGE were similar to theaverage differences observed in urine flow rate (UFR), asshown in Fig. 4. This associated response may suggestthat either UGE or UFR was the primary effect of stimu-lation, while the other was a secondary response. Previ-ous studies that applied stimulation of renal nerves atlow frequencies observed a 25–52% reduction in UFR(Bello-Reuss et al. 1976; Pontes et al. 2015). Thosepercentages align with the average reduction of UFR weobserved at low frequency stimulation (28% at 2 Hz,41% at 5 Hz), suggesting that UFR may be the primaryresponse of stimulation at low frequencies. On the otherhand, we observed an increase in UFR at 33 and 50 kHzstimulation. To our knowledge, no studies have reportedan increase in UFR by stimulation of renal nerves.Although it is possible that changes in UFR may havedirectly led to corresponding changes in UGE, the pri-mary response of UFR or UGE to stimulation at kilo-hertz frequencies cannot be determined in this study.UFR and UGE are normally associated, as increasedurination is a common adverse event in diabetic patientstreated with sodium-glucose co-transporter 2 (SGLT2)inhibitors that primarily increase urine glucose excretion(Seufert 2015; Wilding 2014). Additional studies are re-quired to distinguish the glucose excretion and urineflow effects for stimulation of renal nerves.Stimulation of renal nerves did not have a clear effect
on urine glucose concentration (UGC), as no statisticalsignificance occurred across stimulation frequencies(Fig. 3). Furthermore, we did not observe a clear differ-ence between kilohertz or low frequency stimulation onthe decrease rate for blood glucose concentration (BGC)after infusion of a glucose bolus (Fig. 5). Typically, BGCwould reach a peak value within the first 10 min afterglucose bolus infusion. Then, BGC values would grad-ually decrease and return to around baseline values at30–40 min after the glucose infusion, regardless of thestimulation parameters. The variation in the sample sizeof the stimulation frequency groups may have also con-tributed to these unclear responses. Modifications andimprovements in experimental design may be necessaryto capture clear and consistent responses to stimulationof renal nerves.Renal nerve branches are distributed around the renal
artery in a plexus form. Ultrastructural studies usingelectron microscopy techniques have shown that renalnerve fibers innervate epithelial cells of proximal tu-bules, the glucose reabsorption region of the kidney(Mather and Pollock 2011; Muller and Barajas 1972; Luffet al. 1992). Although studies have examined the distri-bution of renal nerves around the renal artery (Maeda etal. 2014; Sakakura et al. 2014; van Amsterdam et al.2016), we could not determine the renal nerve branchesthat innervate the proximal tubules in this study.
Therefore, we utilized a cuff electrode with the purposeof encircling all the renal nerve branches surroundingthe renal artery. In order to place a cuff electrode, therenal artery was isolated by removing adjacent connect-ive tissue that may have contained fine renal nervebranches. Although we ensured that the renal nerves weremoderately intact by observing temporary kidney surfaceblanching at 10 Hz stimulation (Hermansson et al. 1981;Yao et al. 2014), the variations in connective tissue re-moval and relative shifts in the electrode placement alongthe renal artery across experiments may have contributedto the variability of our outcome results. This inconsist-ency in outcomes has also been observed in renal denerv-ation studies, where conflicting results were reported inclinical studies (Bhatt et al. 2014; Mahfoud et al. 2011;Witkowski et al. 2011). The reported variability is sus-pected to be from variations in ablation locations acrossrenal denervation procedures performed in multiple cen-ters (Mahfoud et al. 2014). Experimental improvements inelectrode placement and the plexus-electrode interfacemay be required to obtain more consistent results.An anatomical analysis in rats showed that 96% of
renal nerve axons are unmyelinated C-fibers (DiBona etal. 1996). Although nerve conduction block experimentsusing kilohertz frequency stimulation have been typicallyperformed using cuff electrodes encircling myelinatedmotor neurons while monitoring muscle tension forblock validation (Kilgore and Bhadra 2014; Bhadra andKilgore 2005), nerve block has also been demonstratedon purely unmyelinated fibers using suction electrodesand confirmed by direct recordings of action potentialpropagation (Joseph and Butera 2009). In this study, theamplitude of sinusoidal kilohertz frequency stimulationwas fixed at 15 V, which is expected to be above thethreshold for nerve conduction block at the selected fre-quencies (Joseph and Butera 2011; Bhadra and Kilgore2005; Patel and Butera 2015). On the other hand, previ-ous studies increased renal nerve activity by low fre-quency stimulation (Bello-Reuss et al. 1976; DiBona2000). The stimulation amplitude and pulse width in thisstudy at low frequencies was consistent at 10 V and0.5 msec, respectively, which is above the activationthreshold for rat C-fibers using cuff electrodes (Wood-bury and Woodbury 1990). However, to validate the truepresence of nerve conduction block or increased neuralactivity, multiple recording and stimulating electrodesmust be placed along the renal nerves. Unfortunately,this was difficult to accomplish in this study due to ourlimited ability to expose and isolate the renal nerves (~2–4 mm), in addition to the anticipated noise contamin-ation issues between adjacent stimulating and recordingelectrodes (Kilgore and Bhadra 2014). Additional experi-ments are required to examine the mechanism of actionfor stimulation of renal nerves.
Jiman et al. Bioelectronic Medicine (2018) 4:7 Page 8 of 11
The work presented here was a feasibility study to in-vestigate glucose excretion modulation by stimulation ofrenal nerves. There are numerous limitations to thisstudy. Although changes in UGE were observed inresponse to stimulation of renal nerves, this study doesnot provide any evidence on the underlying mechanismsfor these changes. It is unknown if the observed changesin UGE were a consequence of changes in UFR, ordirectly related to the gluconeogenesis process or theglucose transport pathways in the proximal tubules thatare innervated by renal nerves (Mather and Pollock2011; Muller and Barajas 1972; Luff et al. 1992).Measurements of renal function, such as glomerular fil-tration rate, renal plasma flow and sodium excretion(Toto 1995; Phillips and Hamilton 1948) were notobtained in this feasibility study. The assessment of renalfunction is an absolute necessity for the progression ofthis research. The large variation in the results of thisstudy may have been due to multiple reasons. Inaddition to the variability in electrode placement, the uni-lateral stimulation approach in this study may have pro-voked reno-renal reflexes, where the non-stimulatedkidney modifies its activity based on changes in the stimu-lated kidney (Zanchetti et al. 1984). The possible presenceof these reflexes may have altered the outcomes of thisstudy. Further experiments with reno-renal reflex elimin-ation procedures, such as bilateral stimulation or denerv-ation of non-stimulated kidneys, may be necessary toobtain unhindered stimulation outcomes.Although further experiments are required to examine
the underlying mechanisms for stimulation of renalnerves, this study may introduce a new approach for regu-lation of glucose excretion. Recently approved medicationsfor patients with type 2 diabetes are SGLT-2 inhibitors,which prevent the activity of glucose transporters in thekidney and lead to increased glucose excretion into urine(Lew and Wick 2015). Stimulation of renal nerves mayprovide an alternative treatment approach for glycemiccontrol that avoids patient compliance issues typicallyseen with medications (Polonsky and Henry 2016).
ConclusionTo our knowledge, this is the first study to investigateelectrical stimulation of renal nerves to modulate urineglucose excretion. Our experimental results show thatstimulation of renal nerves may modulate urine glucoseexcretion, however, this outcome may be associated withurine flow rate. Future work is needed to examine theunderlying mechanisms and identify approaches for en-hancing regulation of glucose excretion.
AbbreviationsAUC: Area under the curve; BGC: Blood glucose concentration; BGCDR: Bloodglucose concentration decrease rate; UFR: Urine flow rate; UGC: Urineglucose concentration; UGE: Urine glucose excretion
AcknowledgementsThe authors thank Eric Kennedy, Zachary Ricca, Christopher Stephan, ShaniRoss, Aileen Ouyang, Zachariah Sperry, and Lauren Zimmerman for theirassistance with experimental preparation and protocol, Cynthia Chestek andStephen Kemp for their expert advice, and Robert Kennedy, AlexandrosZestos and Jack Magrisso for their assistance with sample analysis.
FundingThis research was supported by a grant from the University of MichiganMCubed Program. The work of A. Jiman was also supported by the KingAbdulaziz University Scholarship.
Availability of data and materialsThe data generated during the current study and relevant MATLAB code areavailable in a repository on the Open Science Framework: https://osf.io/w8mrp/. DOI: https://doi.org/10.17605/OSF.IO/W8MRP
Authors’ contributionsPlanned study – AJ, KC, AL, PC, RS, ML, TB. Performed surgeries and collecteddata – AJ, KC, AL, PC, TB. Analyzed data – AJ, KC, TB. Drafted manuscript –AJ, TB. Reviewed manuscript and approved final version – AJ, KC, AL, PC, RS,ML, TB.
Ethics approvalAll animal procedures were approved by the University of MichiganInstitutional Animal Care and Use Committee (IACUC).
Competing interestsRJS has received research support from and/or has served as an advisor orconsultant to Ethicon Endo-Surgery/Johnson & Johnson, Orexigen, NovoNordisk, Daiichi Sankyo, Janssen/Johnson & Johnson, Novartis, Paul HastingsLaw Firm, Zafgen, MedImmune, Sanofi, Kallyope, and Scohia.
Publisher’s NoteSpringer Nature remains neutral with regard to jurisdictional claims inpublished maps and institutional affiliations.
Author details1Department of Biomedical Engineering, University of Michigan, Ann Arbor,MI, USA. 2Biointerfaces Institute, University of Michigan, Ann Arbor, MI, USA.3Department of Molecular and Integrative Physiology, University of Michigan,Ann Arbor, MI, USA. 4Department of Surgery, University of Michigan, AnnArbor, MI, USA. 5Department of Surgery, Plastic Surgery Section, MichiganMedicine, Ann Arbor, MI, USA.
Received: 18 March 2018 Accepted: 17 May 2018
ReferencesAbell T, McCallum R, Hocking M, Koch K, Abrahamsson H, Leblanc I, et al. Gastric
electrical stimulation for medically refractory gastroparesis. Gastroenterology.2003;125:421–8.
Ali MK, Bullard KM, Saaddine JB, Cowie CC, Imperatore G, Gregg EW.Achievement of goals in U.S. diabetes care, 1999-2010. N Engl J Med. 2013;368:1613–24. https://doi.org/10.1056/NEJMsa1213829.
American Diabetes Association. Standards of medical Care in Diabetes - 2018.Diabetes Care. 2018;41(Suppl 1):S1–159.
Apovian CM, Shah SN, Wolfe BM, Ikramuddin S, Miller CJ, Tweden KS, et al. Two-year outcomes of vagal nerve blocking (vBloc) for the treatment of obesityin the ReCharge trial. Obes Surg. 2017;27:169–76. https://doi.org/10.1007/s11695-016-2325-7.
Bello-Reuss E, Trevino DL, Gottschalk CW. Effect of renal sympathetic nervestimulation on proximal water and sodium reabsorption. J Clin Invest. 1976;57:1104–7.
Bhadra N, Kilgore KL. High-frequency electrical conduction block of mammalianperipheral motor nerve. Muscle Nerve. 2005;32:782–90.
Bhatt DL, Kandzari DE, O’Neill WW, D’Agostino R, Flack JM, Katzen BT, et al. Acontrolled trial of renal denervation for resistant hypertension. N Engl J Med.2014;370:1393–401. https://doi.org/10.1056/NEJMoa1402670.
Jiman et al. Bioelectronic Medicine (2018) 4:7 Page 9 of 11

Blak BT, Smith HT, Hards M, Maguire A, Gimeno VA. Retrospective database studyof insulin initiation in patients with type 2 diabetes in UK primary care.Diabet Med. 2012;29:e191–8.
Chatterjee S, Davies MJ. Current management of diabetes mellitus and futuredirections in care. Postgrad Med J. 2015;91:612–21. https://doi.org/10.1136/postgradmedj-2014-133200.
Chhabra KH, Adams JM, Fagel B, Lam DD, Qi N, Rubinstein M, et al. HypothalamicPOMC deficiency improves glucose tolerance despite insulin resistance byincreasing glycosuria. Diabetes. 2016;65:660–72.
Chhabra KH, Morgan DA, Tooke BP, Adams JM, Rahmouni K, Low MJ. Reducedrenal sympathetic nerve activity contributes to elevated glycosuria andimproved glucose tolerance in hypothalamus-specific Pomc knockout mice.Mol Metab. 2017;6:1274–85. https://doi.org/10.1016/j.molmet.2017.07.005.
Chinushi M, Izumi D, Iijima K, Suzuki K, Furushima H, Saitoh O, et al. Bloodpressure and autonomic responses to electrical stimulation of the renalarterial nerves before and after ablation of the renal artery. Hypertension.2013;61:450–6. https://doi.org/10.1161/HYPERTENSIONAHA.111.00095.
DiBona GF. Neural control of the kidney: functionally specific renal sympatheticnerve fibers. Am J Physiol Regul Integr Comp Physiol. 2000;279:R1517–24.
DiBona GF, Kopp UC. Neural control of renal function. Physiol Rev. 1997;77:75–197.
DiBona GF, Sawin LL. Effect of renal nerve stimulation on NaCl and H2O transportin Henle’s loop of the rat. Am J Phys. 1982;243:F576–80.
DiBona GF, Sawin LL, Jones SY. Differentiated sympathetic neural control of thekidney. Am J Physiol- regulatory integrative comp. Physiol. 1996;271:R84–90.
Esler MD, Krum H, Sobotka PA, Schlaich MP, Schmieder RE, Böhm M, et al. Renalsympathetic denervation in patients with treatment-resistant hypertension(the Symplicity HTN-2 trial): a randomised controlled trial. Lancet. 2010;376:1903–9. https://doi.org/10.1016/S0140-6736(10)62039-9.
Famm K, Litt B, Tracey KJ, Boyden ES, Slaoui M. A jump-start for electroceuticals.Nature. 2013;496:159–61.
Gal P, de Jong MR, Smit JJJ, Adiyaman A, Staessen JA, Elvan A. Blood pressureresponse to renal nerve stimulation in patients undergoing renaldenervation: a feasibility study. J Hum Hypertens. 2015;29:292–5. https://doi.org/10.1038/jhh.2014.91.
García-Pérez L-E, Alvarez M, Dilla T, Gil-Guillén V, Orozco-Beltrán D. Adherence totherapies in patients with type 2 diabetes. Diabetes Ther. 2013;4:175–94.https://doi.org/10.1007/s13300-013-0034-y.
Hermansson K, Larson M, Källskog O, Wolgast M. Influence of renal nerve activityon arteriolar resistance, Ultrafiltration Dynamics and Fluid Reabsorption.Pflugers Arch. 1981;389:85–90.
Herrera MF, Toouli J, Kulseng B, Brancatisano R, Kow L, Pantoja JP, et al. Vagalnerve block for improvements in glycemic control in obese patients withtype 2 diabetes mellitus: three-year results of the VBLOC DM2 study. JDiabetes Obesity. 2017;4:1–6.
Iyer MS, Bergman RN, Korman JE, Woolcott OO, Kabir M, Victor RG, et al. Renaldenervation reverses hepatic insulin resistance induced by high-fat diet.Diabetes. 2016;65:3453–63.
Joseph L, Butera RJ. Unmyelinated Aplysia nerves exhibit a nonmonotonicblocking response to high-frequency stimulation. IEEE Trans Neural SystRehabil Eng. 2009;17:537–44.
Joseph L, Butera RJ. High-frequency stimulation selectively blocks different typesof fibers in frog sciatic nerve. IEEE Trans Neural Syst Rehabil Eng. 2011;19:550–7.
Khunti K, Wolden M, Thorsted BL, Andersen M, Davies MJ. Clinical inertia inpeople with type 2 diabetes. Diabetes Care. 2013;36:3411–7.
Kilgore KL, Bhadra N. Reversible nerve conduction block using kilohertzfrequency alternating current. Neuromodulation. 2014;17:242–55.
Krames E, Peckham PH, Rezai A. Neuromodulation. 1st ed: Academic Press; 2009.Krum H, Schlaich M, Whitbourn R, Sobotka PA, Sadowski J, Bartus K, et al.
Catheter-based renal sympathetic denervation for resistant hypertension: amulticentre safety and proof-of-principle cohort study. Lancet. 2009;373:1275–81. https://doi.org/10.1016/S0140-6736(09)60566-3.
Lew KN, Wick A. Pharmacotherapy of type 2 diabetes mellitus: navigating currentand new therapies. Medsurg Nurs. 2015;24:413.
Liang Y, Arakawa K, Ueta K, Matsushita Y, Kuriyama C, Martin T, et al. Effect ofCanagliflozin on renal threshold for glucose, Glycemia, and body weight innormal and diabetic animal models. PLoS One. 2012;7:e30555.
Luff SE, Hengstberger SG, McLachlan EM, Anderson WP. Distribution ofsympathetic neuroeffector junctions in the juxtaglomerular region of therabbit kidney. J Auton Nerv Syst. 1992;40:239–54.
Madhavan M, Desimone CV, Ebrille E, Mulpuru SK, Mikell SB, Johnson SB, et al.Transvenous stimulation of the renal sympathetic nerves increases systemicblood pressure: a potential new treatment option for Neurocardiogenicsyncope. J Cardiovasc Electrophysiol. 2014;25:1115–8. https://doi.org/10.1111/jce.12466.
Maeda S, Kuwahara-Otani S, Tanaka K, Hayakawa T, Seki M. Origin of efferentfibers of the renal plexus in the rat autonomic nervous system. J Vet Med Sci.2014;76:763–5. https://doi.org/10.1292/jvms.13-0617.
Mahfoud F, Edelman ER, Böhm M. Catheter-based renal denervation is no simplematter: lessons to be learned from our anatomy? J Am Coll Cardiol. 2014;64:644–6. https://doi.org/10.1016/j.jacc.2014.05.037.
Mahfoud F, Schlaich M, Kindermann I, Ukena C, Cremers B, Brandt MC, et al.Effect of renal sympathetic denervation on glucose metabolism in patientswith resistant hypertension: a pilot study. Circulation. 2011;123:1940–6.https://doi.org/10.1161/CIRCULATIONAHA.110.991869.
Mather A, Pollock C. Glucose handling by the kidney. Kidney Int. 2011;79(Suppl120):S1–6. https://doi.org/10.1038/ki.2010.509.
Miki K, Kosho A, Hayashida Y. Method for continuous measurements of renalsympathetic nerve activity and cardiovascular function during exercise inrats. Exp Physiol. 2002;87:33–9.
Muller J, Barajas L. Electron microscopic and histochemical evidence for a tubularinnervation in the renal cortex of the monkey. J Ultrastruct Res. 1972;41:533–49.
Pan T, Guo J, Teng G. Renal denervation, a potential novel treatment for type 2diabetes mellitus? Medicine (Baltimore). 2015;94 https://doi.org/10.1097/MD.0000000000001932.
Patel YA, Butera RJ. Differential fiber-specific block of nerve conduction inmammalian peripheral nerves using kilohertz electrical stimulation. JNeurophysiol. 2015;113:3923–9. https://doi.org/10.1152/jn.00529.2014.
Phillips RA, Hamilton PB. Effect of 20, 60 and 120 minutes of renal Iscemia onglomerular and tubular function. Am J Phys. 1948;152:523–30.
Polonsky W, Henry R. Poor medication adherence in type 2 diabetes: recognizingthe scope of the problem and its key contributors. Patient Prefer Adherence.2016;10:1299–307. https://doi.org/10.2147/PPA.S106821.
Pontes RB, Crajoinas RO, Nishi EE, Oliveira-Sales EB, Girardi AC, Campos RR, et al.Renal nerve stimulation leads to the activation of the Na+/H+ exchangerisoform 3 via angiotensin II type I receptor. Am J Physiol Ren Physiol. 2015;308:F848–56. https://doi.org/10.1152/ajprenal.00515.2014.
Rafiq K, Fujisawa Y, Sherajee SJ, Rahman A, Sufiun A, Kobori H, et al. Role of therenal sympathetic nerve in renal glucose metabolism during thedevelopment of type 2 diabetes in rats. Diabetologia. 2015;58:2885–98.https://doi.org/10.1007/s00125-015-3771-9.
Sabaté E. Adherence to long-term therapies: evidence for action. Geneva: WorldHealth Organization; 2003.
Sakakura K, Ladich E, Cheng Q, Otsuka F, Yahagi K, Fowler DR, et al. Anatomicassessment of sympathetic Peri-arterial renal nerves in man. J Am CollCardiol. 2014;64:635–43.
Seufert J. SGLT2 inhibitors - an insulin-independent therapeutic approach fortreatment of type 2 diabetes: focus on canagliflozin. Diabetes Metab SyndrObes. 2015;8:543–54.
Sohtell M, Karlmark B, Ulfendahl H. FITC-inulin as a kidney tubule marker in therat. Acta Physiol Scand. 1983;119:313–6.
Stocker SD, Muntzel MS. Recording sympathetic nerve activity chronically in rats:surgery techniques, assessment of nerve activity, and quantification. Am JPhysiol Heart Circ Physiol. 2013;305:H1407–16. https://doi.org/10.1152/ajpheart.00173.2013.
Toto RD. Conventional measurement of renal function utilizing serum creatinine,creatinine clearence, inulin and Para-aminohippuric acid clearance. Curr OpinNephrol Hypertens. 1995;4:505–9.
van Amsterdam WAC, Blankestijn PJ, Goldschmeding R, Bleys RLAW. Themorphological substrate for renal denervation: nerve distribution patternsand parasympathetic nerves. A post-mortem histological study. Ann Anat.2016;204:71–9. https://doi.org/10.1016/j.aanat.2015.11.004.
Van Vliet BN, Smith MJ, Guyton AC. Time course of renal responses to greatersplanchnic nerve stimulation. Am J Physiol. 1991;260:R894–905.
Walter SJ, Zewde T, Shirley DG. The effect of anaesthesia and standard clearanceprocedures on renal function in the rat. Q J Exp Physiol. 1989;74:805–12.
Wilding JPH. The role of the kidneys in glucose homeostasis in type 2 diabetes:clinical implications and therapeutic significance through sodium glucoseco-transporter 2 inhibitors. Metabolism. 2014;63:1228–37. https://doi.org/10.1016/j.metabol.2014.06.018.
Jiman et al. Bioelectronic Medicine (2018) 4:7 Page 10 of 11

Witkowski A, Prejbisz A, Florczak E, Kadziela J, Šliwiński P, Bieleń P, et al. Effects ofrenal sympathetic denervation on blood pressure, sleep apnea course, andglycemic control in patients with resistant hypertension and sleep apnea.Hypertension. 2011;58:559–65.
Woodbury DM, Woodbury JW. Effects of vagal stimulation on experimentallyinduced seizures in rats. Epilepsia. 1990;31(Suppl 2):S7–19.
Yao Y, Fomison-Nurse IC, Harrison JC, Walker RJ, Davis G, Sammut IA. Chronicbilateral renal denervation attenuates renal injury in a transgenic rat modelof diabetic nephropathy. AJP Ren Physiol. 2014;307:F251–62. https://doi.org/10.1152/ajprenal.00578.2013.
Zanchetti A, Stella A, Golin R, Genovesi S. Neural control of the kidney - are thereReno-renal reflexes? Clin Exp Hypertens. 1984;6:275–86.
Jiman et al. Bioelectronic Medicine (2018) 4:7 Page 11 of 11