electrical resistivity measurements in frozen ground...
TRANSCRIPT
Electrical Eesistivity Measurements in Frozen Ground, Mackenzie Delta area, Northwest Territories
Electrical Resistivity Measurements in Frozen Ground, Mackenzie Delta area, Northwest Territories
D . K . MacKay,
Hydrologie Sciences Division, Inland Waters Branch, Department of Energy, Mines and Resources, Ottawa, Ontario
R É S U M É : L'utilisation de la résistivité dans le but d'aider à l'identification de types de roches et de sols et de dresser une carte de la surface supérieure du permafrost est discutée avec renvoi au delta du Mackenzie, Territoires du Nord-Ouest. L a résistivité apparente de certains matériaux gelés identifiables est disposée en forme de tables. Des matériaux sondés, le sable et le gravier ont la plus haute résistivité, le lais la plus bas, et la tourbe a une valeur intermédiaire.
Les variations dans la topographie, le drainage et la végétation peuvent être des indicateurs d'écarts relatifs dans la résistivité apparente. La température du sol est un facteur important qui influe sur la résistivité, par exemple, la résistivité double lorsque la température d'une couche de gravier de trois mètres d'épaisseur baisse de 1.5°C (ou de 2°C.
Les techniques de la résistivité sont utilisées pour dresser une carte de la surface supérieure du permafrost, surtout dans les deltas ou de nombreuses sources de chaleur, tels les chenaux et les lacs influencent sa configuration. Les données de résistivité complète les sondages séismiques, le forage, et les mesures de la température du sol, dans l'étude du permafrost.
A B S T R A C T : The use of resistivity as an aid in the identification of frozen rock/soil types and in mapping the upper permafrost surface is discussed with referen:; to the Mackenzie Delta .egion, Northwest Territories.
Apparent resistivity ranges of some identifiable frozen materials are tabled. O f materials sounded, sands and gravels have the highest resistivities, silts the lowest, with peats falling into an intermediate category.
Variations in topography, drainage, and vegetative cover may be useful indicators of relative differences in apparent resistivity.
Ground temperature is an important factor affecting apparent resistivity; for example, resistivity doubles for a drop of 1.5°C to 2 ° C in the top three meters of frozen gravels.
Resistivity techniques are of use in mapping the upper permafrost surface, particu'arly in dsltas where numerous heat sources such as channels and lakes influence its cDnfiguratian. Resistivity data complements seismic, drillhole and ground temperature data in permafrost investigations
INTRODUCTION
Electrical resistivity surveys were carried out in the Mackenzie Delta area to examine the application of resistivity techniques to permafrost investigations. T w o possible applications were examined, the determination of depths to permafrost and the identification of constituent rock and soil types, as both are important to oil exploration, mining, and construction in the north.
Resistivity data can be acquired rapidly and economically, and can be used to complement data gathered through seismic, drillhole and ground temperature investigations. Resistivity methods m a y be particularly useful in a reconnaissance role as for example in rapid mapping of the upper permafrost surface in deltas where heat sources such as river channels and lakes cause considerable variation. Such information could be of significant help in the location and engineering of pipelines and wharves.
Resistivity methods m a y also be useful in identifying and delineating construction materials such as sands and gravels in permafrost as well as other rock and soil types, or
363
D. K. MacKay
ground ice bodies which m a y affect construction on a particular site. At present, field data on rock and soil resistivities are scarce and additions to published data are required before the value of resistivity to such permafrost studies can be assessed. Although surveys are incomplete, this paper adds to published data of frozen rock and soil resistivities and also points out some of the difficulties associated with the identification of materials in frozen ground and with the mapping of the upper permafrost surfaces.
Russian geophysical abstracts and papers (Dement'ev et al., 1967) suggest resistivity techniques have been widely used in permafrost investigations in the Soviet Union. In North America, Joesting (1941) m a d e some four hundred field measurements in the Y u k o n -Tanana area of Alaska; his summary of resistivities in thawed and frozen overburden and bedrock has been extended by Barnes ( 1963). Canadian activities have mainly involved the use of resistivity techniques in glacier and sea ice studies, although Bush and Schwarz (1965) attempted to sound through frozen overburden to bedrock in the Kettle Rapids area, Nelson River, Manitoba. Their results were inconclusive but did suggest that resistivity methods could be useful in determining the distribution and thickness of frozen ground in discontinuous permafrost areas.
S o m e resistivity studies have been m a d e in Antarctica. Hatherton (1960) measured the resistivity of frozen basaltic material mixed with clay at Scott Base and of frozen gravel admixture at Hallet Station. Robertson and Macdonald (1962) installed permanent electrodes at Scott Base to investigate the variation of resistivity in interbedded scoria and lava flows with seasonal changes in ground temperature.
In Scandinavia, 0strem (1964) used resistivity methods to estimate depths to buried ici in ice-cored moraines; and there, as in North America, resistivity has been used in the estimation of glacier ice thickness.
INSTRUMENTATION A N D METHODS
Resistivity instrumentation and methods are covered thoroughly by Keller and Frizch-knecht (1966) and by V a n Nostrand and C o o k (1966). The instrument used in the field work was a Geophysical Specialties Model E R - 2 Earth Resistivity Meter providing a low frequency (20 cps) reversal of current and direct digital read-out of thequantity 2nV/I, where V is the voltage across the potential electrodes, and / is the current flowing through the ground.
WENNER ARRAY
SURFACE
C 2 >2 Pl C1
J ! 1 L U— a —fc-U— a - * - U — a—*H
LEE ARRAY
SURFACE
C2 P2 P0 P ! C ,
2 2
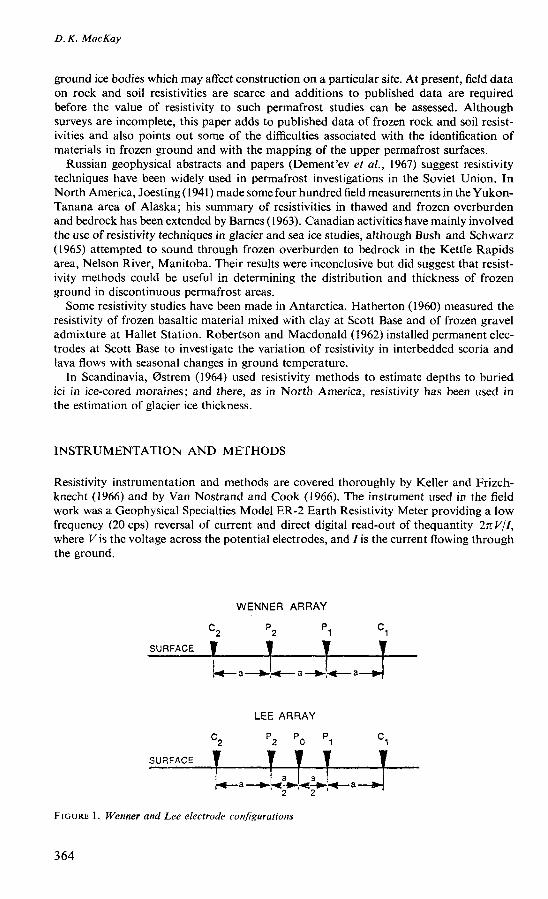
F I G U R E 1. Wenner and Lee electrode configurations
364
Electrical Resistivity Measurements in Frozen Ground, Mackenzie Delta area, Northwest Territories
Figure 1 illustrates the two systems of electrode spacing used in the surveys. T h e Lee five-electrode configuration is the same as the standard Wenner except for the addition of a third potential electrode at the centre of the array. In both systems current is induced through the outer electrodes, C 1 C 2 , and potential is measured between the inner, P ! P 2 , electrodes. In the Lee system, potential can also be measured between P i P 0 and P 2 P o ; this aids in the detection of lateral resistivity variations.
Both vertical sounding and horizontal profiling surveys were m a d e at locations in the Delta region. Horizontal profiles, used to detect resistivity changes along traverses, were developed by overlapping the Wenner array a distance equivalent to that of the a-span (fig. 1). Vertical soundings, to examine resistivity changes with depth, were m a d e by expanding the electrode array symmetrically about its centre. Available cable lengths limited current electrode spreads to 90 metres.
Field measurements of resistivity, when multiplied by a suitable factor related to the electrode separation, are referred to as apparent resistivity values. True resistivities would only be obtained if the materials being surveyed were electrically isotropic and homogeneous, a condition that is seldom, if ever, found in field investigations. Apparent resistivity m a y approximate the volume-weighted m e a n of a heterogeneous substance, or the true resistivity of one of its constituents or, as V a n Nostrand and C o o k (1966) point out, it m a y fall above or below the actual resistivity of the materials involved.
C O N D I T I O N S A F F E C T I N G RESISTIVITY
Moisture content and salinity are major determinants of electrical resistivity in rocks and soils. Generally, in the unfrozen state, the greater the moisture content and/or the higher the salinity, the lower is the resistivity. A s moisture begins to freeze, however, the formation of ice is accompanied by a marked increase in soil and rock resistivity because the conductivity of ice is very low. At — 12°C, the resistivity of a rock is about 10 to 100 times larger than that measured at 18 °C (Keller and Frischknecht, 1966).
The salts in solution affect resistivity in two ways. First, the presence of salts lowers the freezing point. Secondly, as freezing begins, the salts in solution tend to migrate and form pockets of liquid brine in the interstices or pores of the material, and these pockets m a y remain partially unfrozen d o w n to temperatures of - 60 °C (Keller and Frischknecht, 1966).
Pressure is another factor that can lower the freezing point of interstitial water. This could be important during freeze-back of the active layer in the fall. A s freezing begins at the ground surface and the frost table starts to migrate upward, pressure could develop in the diminishing active layer and retard the increase in resistivity of the near-surface layer.
Temperature is obviously an important variable bearing on resistivity of materials. Robertson and Macdonald (1962) for example, found that frozen ground resistivity varies exponentially with ground temperature, resistivity values doubling for every 3.8 °C drop in temperature. Thus, small variations in the temperature of materials m a y cause significant variations in apparent resistivity.
AREA CHARACTERISTICS
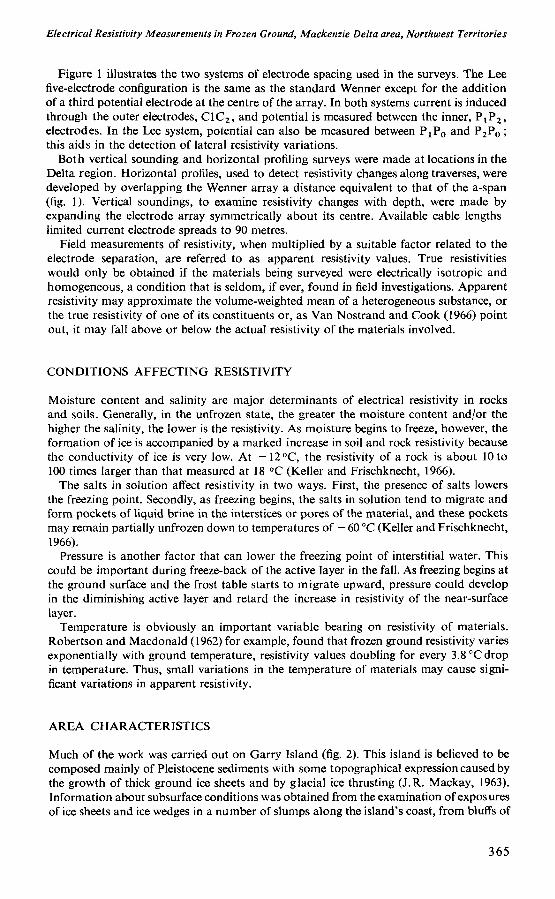
M u c h of the work was carried out on Garry Island (fig. 2). This island is believed to be composed mainly of Pleistocene sediments with some topographical expression caused by the growth of thick ground ice sheets and by glacial ice thrusting (J.R. Mackay , 1963). Information about subsurface conditions was obtained from the examination of exposures of ice sheets and ice wedges in a number of slumps along the island's coast, from bluffs of
365
D.K. Mac Kay
eroding headlands or low-cut banks fronting sedgy flats and h u m m o c k y ground, and from sand spits and other beach features. Knowledge of subsurface conditions has also been gained by shallow drilling around ice wedges and across low- and high-centred polygons, in sectioning h u m m o c k s and excavating channels to drain lakes, and in the examination of other geomorphic features of the island.
The active layer on Garry Island ranges from a few centimetres to more than a metre in depth. Its depth depends on vegetative cover, surface topography, drainage, materials present, etc. In mid-summer, for example, the frost table is found about one metre below the surface of the island's sand and gravel beaches, but it rises in such places as the
F I G U R E 2. General locations (*) of resistivity surveys in the Mackenzie Delta area
366
Electrical Resistivity Measurements in Frozen Ground, Mackenzie Delta area. Northwest Territories
middles of low-centred polygons, and under sedgy flats and h u m m o c k interstices to 7-20 centimetres below the base of the surficial vegetation.
Garry Island fronts on the Beaufort Sea. Surrounding waters are brackish in varying degree, depending principally on the volume of Mackenzie River discharge and on the strength and direction of winds. The modified marine influence and its effect on the salinity of the beach materials has not been investigated.
Other surveys were carried out on Richards Island, which like Garry Island, is part of the old Pleistocene delta; over sand bars and other alluvial deposits in the modern Mackenzie Delta; and over a variety of unconsolidated materials in the Inuvik area (fig. 2).
RESISTIVITY S U R V E Y S
A . P R O F I L I N G
A number of resistivity traverses were made on Garry Island across high resistivity ground-ice features, on beaches, over tussock and h u m m o c k areas, and across low ridges covered with different patterns and types of vegetation.
1. Resistivity, Vegetation, and Microtopography
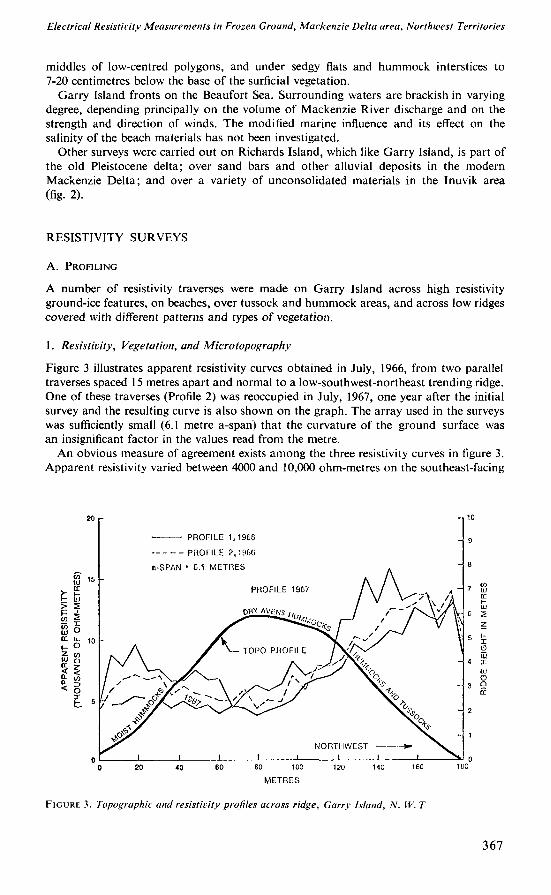
Figure 3 illustrates apparent resistivity curves obtained in July, 1966, from two parallel traverses spaced 15 metres apart and normal to a low-southwest-northeast trending ridge. O n e of these traverses (Profile 2) was reoccupied in July, 1967, one year after the initial survey and the resulting curve is also shown on the graph. The array used in the surveys was sufficiently small (6.1 metre a-span) that the curvature of the ground surface was an insignificant factor in the values read from the metre.
A n obvious measure of agreement exists a m o n g the three resistivity curves in figure 3. Apparent resistivity varied between 4000 and 10,000 ohm-metres on the southeast-facing
0 20 40 60 60 100 120 140 160 1B0
M E T R E S
F I G U R E 3. Topographic and resistivity profiles across ridge, Garry Island, N. W. T
367
D. K. MacKay
slope and remained relatively stable across the top of the ridge at roughly 4000-7000 o h m -metres. Coincidental with the steepening of slope into the northwest face, resistivity values jumped to around 10,000 ohm-metres and then climbed to 16,000 ohm-metres. Changes in resistivity along the traverses are accompanied by changes in microtopo-graphy and vegetation.
The southeast-facing slope is dominated by loose row-like structures of moist, oval h u m mocks angled across the slope. A drier type of low h u m m o c k , characterized by a dominant avens and lichen cover, prevails on the ridge crest. Mosses, sedges and heather cover the depressions between the h u m m o c k s . The northwest-facing slope grades from a moist h u m m o c k cover down-slope into tussock-covered terrain. In mid-slope, approximately 50 per cent of the raised forms are tussocks. These changes in vegetation and micro-relief occur partly in response to changes in drainage.
Tussocks and other sedge forms are typical of poorly-drained areas while h u m m o c k s are characteristic of better-drained ones, with the dry avens-type of h u m m o c k usually prevailing on ridge crests. In the tussock and sedge areas, ice content of the subsurface materials is generally high. In fact, there is often excess ice or, in other words, a condition that would result in supersaturation if the materials were thawed. This is in contrast to ice conditions in better drained areas. Differences in ice content are probably responsible for the significant changes in resistivity along the traverses. Soundings m a d e on adjacent ridges and intervening swales also indicate higher resistivities in the ill-drained low areas than in the better-drained materials of upland areas. This suggests that variations in vegetative cover, topographic expression, and drainage m a y be useful indicators of relative resistivity differences in permafrost areas.
The resistivity curve resulting from reoccupation of Profile 2 (fig. 3) indicated lower values than were obtained in the previous year along the full length of the traverse. In 1967, surface moisture increased markedly; ice wedges were full and low-lying areas marshy with standing water. A n examination of moisture sites along the traverse showed increases in the moisture content of the active layer; moreover, temperatures at 1966 frost levels and in deep sections of the active layer had increased an average of approximately 2° C .
APPARENT RESISTIVITY PROFILE
t _ 6 > w ¡= "J
« E 00 vu L'J « ^
Z I LU O CC LU O a. o CL a < — 0
DIAGRAMMATIC TOPOGRAPHIC PROFILE
DRY PEATY RIDGE DRY PEATY RIDGE
USSOCKS, SEDGES
,15 CMS
M E T R E S
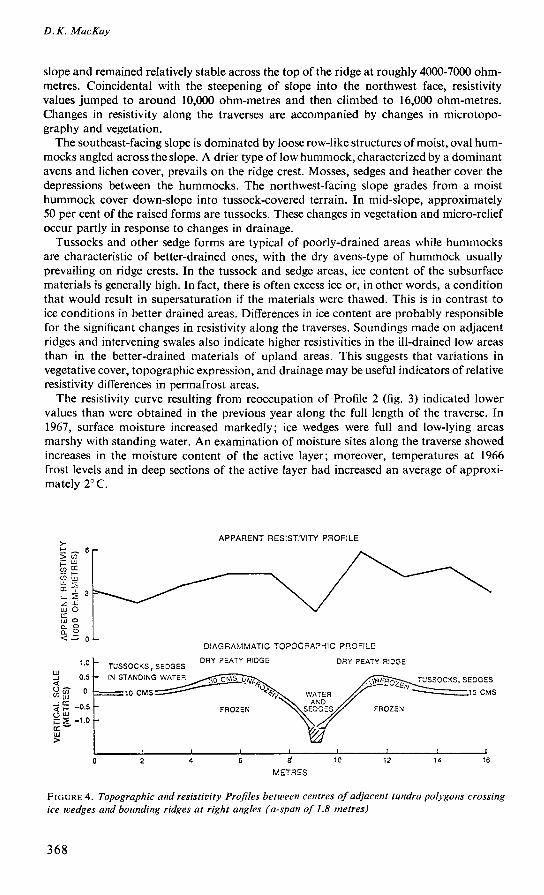
F I G U R E 4 . Topographic and resistivity Profiles between centres of adjacent tundra polygons crossing
ice wedges and bounding ridges at right angles (a-span of 1.8 metres)
368
Electrical Resistivity Measurements in Frozen Ground, Mackenzie Delta area, Northwest Territories
2. Resistivity and Tundra Polygons
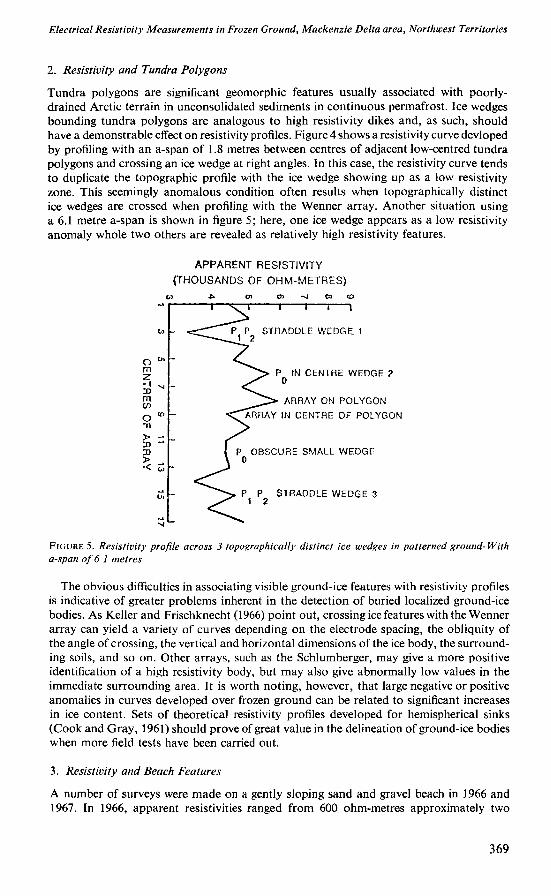
Tundra polygons are significant geomorphic features usually associated with poorly-drained Arctic terrain in unconsolidated sediments in continuous permafrost. Ice wedges bounding tundra polygons are analogous to high resistivity dikes and, as such, should have a demonstrable effect on resistivity profiles. Figure 4 shows a resistivity curve devloped by profiling with an a-span of 1.8 metres between centres of adjacent low-centred tundra polygons and crossing an ice wedge at right angles. In this case, the resistivity curve tends to duplicate the topographic profile with the ice wedge showing up as a low resistivity zone. This seemingly anomalous condition often results when topographically distinct ice wedges are crossed when profiling with the Wenner array. Another situation using a 6.1 metre a-span is shown in figure 5; here, one ice wedge appears as a low resistivity anomaly whole two others are revealed as relatively high resistivity features.
APPARENT RESISTIVITY
(THOUSANDS OF OHM-METRES)
o •*>- en 01 ~j co to
to
rn
m w
O «° TI
> -D 3)
> , -< V,
CJi
v|
F I G U R E 5. Resistivity profile across 3 topographically distinct ice wedges in patterned ground-With
a-span of 6 1 metres
The obvious difficulties in associating visible ground-ice features with resistivity profiles is indicative of greater problems inherent in the detection of buried localized ground-ice bodies. A s Keller and Frischknecht (1966) point out, crossing ice features with the Wenner array can yield a variety of curves depending on the electrode spacing, the obliquity of the angle of crossing, the vertical and horizontal dimensions of the ice body, the surrounding soils, and so on. Other arrays, such as the Schlumberger, m a y give a more positive identification of a high resistivity body, but m a y also give abnormally low values in the immediate surrounding area. It is worth noting, however, that large negative or positive anomalies in curves developed over frozen ground can be related to significant increases in ice content. Sets of theoretical resistivity profiles developed for hemispherical sinks (Cook and Gray, 1961) should prove of great value in the delineation of ground-ice bodies when more field tests have been carried out.
3. Resistivity and Beach Features
A number of surveys were m a d e on a gently sloping sand and gravel beach in 1966 and 1967. In 1966, apparent resistivities ranged from 600 ohm-metres approximately two
T r P STRADDLE WEDGE 1
2
P IN CENTRE WEDGE 2 0
ARRAY ON POLYGON
"ARRAY IN CENTRE OF POLYGON
P OBSCURE SMALL WEDGE 0
P P STRADDLE WEDGE 3 1 2
369
D. K. MacKay
metres inshore of high tide level to 1500 ohm-metres at the top of the beach. O n resurvey in 1967, values were lower measuring from 100 ohm-metres near the high tide mark to 240 ohm-metres near the vegetation-beach boundary. Arrays in both years were set parallel to the waterline and involved the use of 3-metre a-spans (see also fig. 7B) .
Probing to frost indicated active layer depths were similar in both years grading from 1.2 metres near the high tide line to 0.5 metres at the head of the beach. Localized d o m e s in the frost table were evident under patches of drift w o o d and peat in 1966. T h e following year, the beach survey area was clear of debris and there were no obvious undulations in the frost table. Irregularities in the frost table m a y partly account for the higher resistivities in 1966. It is also possible that surveys in the following year were conducted during an accelerated melt period or, at least, w h e n greater amounts of free water were moving across the frost table. Such a condition could mask the higher resistivities of the underlying frozen zone.
A s illustrated in Table 1, there was an increase in apparent resistivity with decreasing depth to frost.
T A B L E 1. 1967 Array with 3-Metre A-Span Parallel to Waterline
Distance Inshore Depth to Frost Apparent Resistivity m cm ohm-m
2 118 103 5 110 99 8 88 148
11 79 180 13 55 236
4 . Resistivity and Ground Temperature
Temperatures in frozen ground oscillate in response to seasonal fluctuations in the surface temperature of the ground. The oscillations decrease in magnitude with increasing depth to the "level of zero annual amplitude" which is located at a depth in the order of 15 metres (Brown, 1963). These temperature variations together with the development and freeze-back of an active layer have a marked influence on resistivities measured at different times of the year.
In order to measure seasonal changes in apparent resistivity, permanent electrode arrays were installed over silt and gravel deposits in the Inuvik area; however, only one array over gravel proved operational through the winter season. Near the array site, a pit dug as a test ice cellar to a depth of 4 metres showed 30 centimetres of peaty soil over 2 metres of brown gravel underlain by grey gravels. Both the weathered brown and the underlying gray gravels have sand, silt, and clay fractions with s o m e lenses or inclusions formed by the sands and clays.
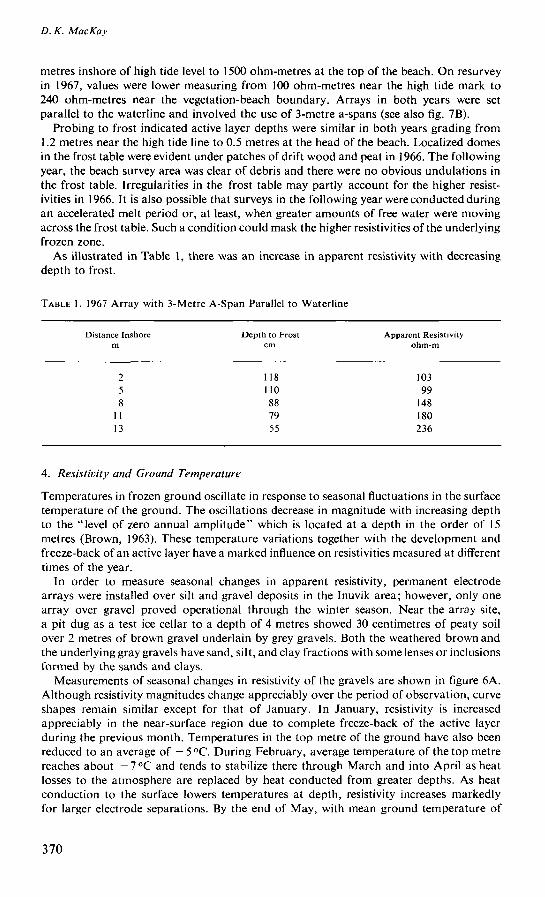
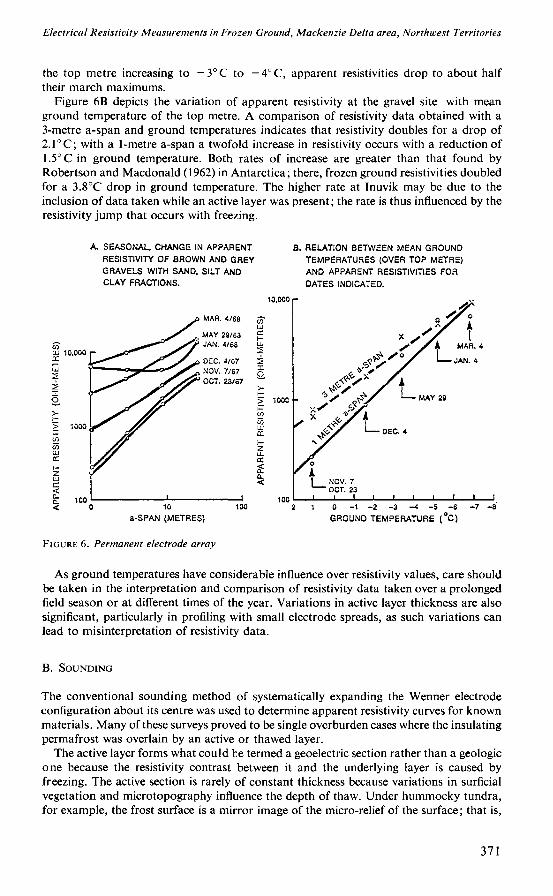
Measurements of seasonal changes in resistivity of the gravels are shown in figure 6 A . Although resistivity magnitudes change appreciably over the period of observation, curve shapes remain similar except for that of January. In January, resistivity is increased appreciably in the near-surface region due to complete freeze-back of the active layer during the previous month . Temperatures in the top metre of the ground have also been reduced to an average of - 5 °C . During February, average temperature of the top metre reaches about — 7 ° C and tends to stabilize there through March and into April as heat losses to the atmosphere are replaced by heat conducted from greater depths. A s heat conduction to the surface lowers temperatures at depth, resistivity increases markedly for larger electrode separations. By the end of M a y , with mean ground temperature of
370
Electrical Resistivity Measurements in Frozen Ground, Mackenzie Delta area, Northwest Territories
the top metre increasing to - 3 ° C to — 4 ° C , apparent resistivities drop to about half their march m a x i m u m s .
Figure 6 B depicts the variation of apparent resistivity at the gravel site with m e a n ground temperature of the top metre. A comparison of resistivity data obtained with a 3-metre a-span and ground temperatures indicates that resistivity doubles for a drop of 2.1°C; with a 1-metre a-span a twofold increase in resistivity occurs with a reduction of 1.5°C in ground temperature. Both rates of increase are greater than that found by Robertson and Macdonald (1962) in Antarctica; there, frozen ground resistivities doubled for a 3.8°C drop in ground temperature. T h e higher rate at Inuvik m a y be due to the inclusion of data taken while an active layer was present; the rate is thus influenced by the resistivity j u m p that occurs with freezing.
A. SEASONAL. CHANGE IN APPARENT B. RELATION BETWEEN MEAN GROUND
RESISTIVITY OF BROWN AND GREY TEMPERATURES (OVER TOP METRE)
GRAVELS WITH SAND, SILT AND AND APPARENT RESISTIVITIES FOR
CLAY FRACTIONS. DATES INDICATED.
a-SPAN (METRES) GROUND TEMPERATURE (°C)
F I G U R E 6. Permanent electrode array
A s ground temperatures have considerable influence over resistivity values, care should be taken in the interpretation and comparison of resistivity data taken over a prolonged field season or at different times of the year. Variations in active layer thickness are also significant, particularly in profiling with small electrode spreads, as such variations can lead to misinterpretation of resistivity data.
B . S O U N D I N G
The conventional sounding method of systematically expanding the Wenner electrode configuration about its centre was used to determine apparent resistivity curves for k n o w n materials. M a n y of these surveys proved to be single overburden cases where the insulating permafrost was overlain by an active or thawed layer.
T h e active layer forms what could be termed a geoelectric section rather than a geologic one because the resistivity contrast between it and the underlying layer is caused by freezing. T h e active section is rarely of constant thickness because variations in surficial vegetation and microtopography influence the depth of thaw. Under h u m m o c k y tundra, for example, the frost surface is a mirror image of the micro-relief of the surface; that is,
371
D.K. MacKay
the depth of thaw is greatest under the tops of h u m m o c k s and least below the depressions separating them. These undulations in the frost table often m a k e it difficult to obtain top-layer resistivity measurements in h u m m o c k y terrain. O n the other hand, where vegetation is sparse and the ground is comparatively flat (e.g., m u d flows, point bars, beaches), the resistivity of the top layer can usually be obtained because of its thickness and the relative uniformity of the frost table.
In the single overburden problem the apparent resistivity of the active layer is that measured with a-spans approximating the layer's thickness. W h e n the a-span is large compared to the thickness of thawed material, the measured resistivity is close to that of the insulating underlying permafrost.
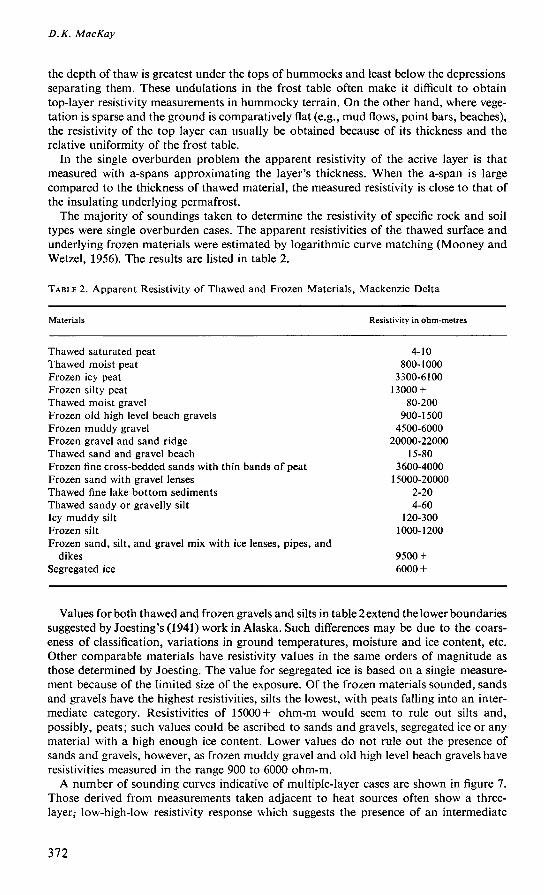
The majority of soundings taken to determine the resistivity of specific rock and soil types were single overburden cases. The apparent resistivities of the thawed surface and underlying frozen materials were estimated by logarithmic curve matching (Mooney and Wetzel, 1956). The results are listed in table 2 .
T A B L E 2 . Apparent Resistivity of Thawed and Frozen Materials, Mackenzie Delta
Materials
Thawed saturated peat Thawed moist peat Frozen icy peat Frozen silty peat Thawed moist gravel Frozen old high level beach gravels Frozen m u d d y gravel Frozen gravel and sand ridge Thawed sand and gravel beach Frozen fine cross-bedded sands with thin bands c Frozen sand with gravel lenses Thawed fine lake bottom sediments Thawed sandy or gravelly silt Icy m u d d y silt Frozen silt Frozen sand, silt, and gravel mix with
dikes Segregated ice
ice lenses,
if peat
, pipes, and
Resistivity in ohm-metres
4-10 800-1000
3300-6100 13000 +
80-200 900-1500
4500-6000 20000-22000
15-80 3600-4000
15000-20000 2-20 4-60
120-300 1000-1200
9500 + 6000 +
Values for both thawed and frozen gravels and silts in table 2 extend the lower boundaries suggested by Joesting's (1941) work in Alaska. Such differences m a y be due to the coarseness of classification, variations in ground temperatures, moisture and ice content, etc. Other comparable materials have resistivity values in the same orders of magnitude as those determined by Joesting. The value for segregated ice is based on a single measurement because of the limited size of the exposure. O f the frozen materials sounded, sands and gravels have the highest resistivities, silts the lowest, with peats falling into an intermediate category. Resistivities of 15000+ o h m - m would seem to rule out silts and, possibly, peats; such values could be ascribed to sands and gravels, segregated ice or any material with a high enough ice content. Lower values do not rule out the presence of sands and gravels, however, as frozen m u d d y gravel and old high level beach gravels have resistivities measured in the range 900 to 6000 o h m - m .
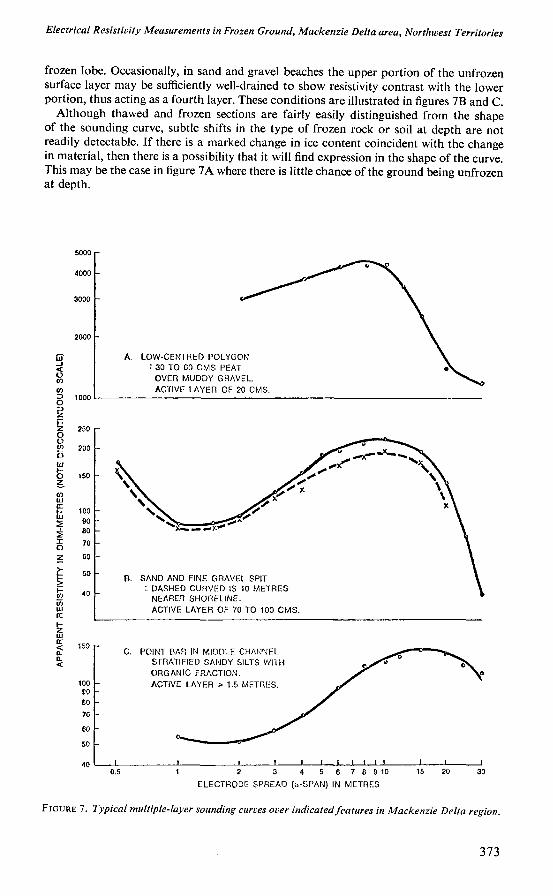
A number of sounding curves indicative of multiple-layer cases are shown in figure 7. Those derived from measurements taken adjacent to heat sources often show a three-layer; low-high-low resistivity response which suggests the presence of an intermediate
372
Electrical Resistivity Measurements in Frozen Ground, Mackenzie Delta area, Northwest Territories
frozen lobe. Occasionally, in sand and gravel beaches the upper portion of the unfrozen surface layer m a y be sufficiently well-drained to show resistivity contrast with the lower portion, thus acting as a fourth layer. These conditions are illustrated in figures 7 B and C .
Although thawed and frozen sections are fairly easily distinguished from the shape of the sounding curve, subtle shifts in the type of frozen rock or soil at depth are not readily detectable. If there is a marked change in ice content coincident with the change in material, then there is a possibility that it will find expression in the shape of the curve. This m a y be the case in figure 7 A where there is little chance of the ground being unfrozen at depth.
LOW-CENTRED POLYGON : 30 TO CO CMS PEAT
OVER MUDDY GRAVEL. ACTIVE LAYER OF 20 CMS.
SAND AND FINE GRAVEL SPIT : DASHED CURVED IS 10 METRES-
NEARER SHORELINE. ACTIVE LAYER OF 70 TO 100 CMS.
C. POINT DAR IN MIDDLE CHANNEL STRATIFIED SANDY SILTS WITH ORGANIC FRACTION. ACTIVE LAYER > 1.5 METRES.
' i i i i i
2 3 4 5 6 7 6 9 10
ELECTRODE SPREAD (;.-SPAN) IN METRES
F I G U R E 7. Typical multiple-layer sounding curves over indicated features in Mackenzie Delta region.
373
D. K. MacKay
CONCLUSIONS
In permafrost areas, horizontal profiles developed with short a-spans ( < 1 0 metres) suggest that vegetative cover, topography, and drainage can be useful indicators of relative differences in near-surface resistivity. O n Garry Island, apparent resistivity in the top few metres is lower on hilltops than on slopes or in swales, lower under dry avens-type h u m m o c k s than under moist oval h u m m o c k s or tussocks; and these differences are related to drainage. In poorly-drained areas, it is assumed that the ice content of near-surface materials is higher than those in well-drained areas.
Buried localized ice bodies are often difficult to detect and m a p by profiling with the Wenner configuration because of the variety of resistivity curves and, therefore, possible interpretations that can result from such measurements. Positive identification is hindered by possible ice lensing in the surrounding material, the shape of the ice body, the angles at which the resistivity traverses cross ice boundaries, and other factors; but delineation should be possible through comparison of field curves and theoretical curves (Cook and Gray, 1961) when more knowledge of field conditions has been accumulated.
O n beaches, irregularities in the frost table can result from the deposition of drift peat and w o o d . D o m i n g of the frost surface under such deposits causes variations in resistivity; and curves m a y differ seasonally and from year to year. O n gently sloping beaches clear of debris, free water moving across the frost table m a y mask resistivity of the lower insulating frozen layer.
Permanent electrodes set in a gravel deposit indicate that apparent resistivity doubles for every 1.5 °C to 2 °C drop in ground temperature over the top three metres.
Sounding surveys show that apparent resistivities of "frozen" materials have wide ranges that extend into the range of unfrozen materials. There is also overlap in resistivity ranges of "frozen" rock and soil types. Such conditions inhibit the identification and areal definition of sand and gravel deposits or other materials of economic importance in permafrost, at least on the basis of resistivity alone.
A frozen lobe or section surrounded by thawed ground is generally well-defined on a sounding curve; thus, mapping of permafrost adjacent to heat sources and under the bottoms of drained lakes is possible using resistivity techniques. These data will provide a useful complement to local temperature, seismic, and drillhole data.
ACKNOWLEDGMENTS
The writer wishes to thank D r . J. Ross Mackay , University of British Columbia for his advice and comments and M r . L . S . Collett, Geological Survey of Canada, D r . O . H . Loken and D r . M . C . B . Hotz, Inland Waters Branch, for critically reading the manucripts.
REFERENCES
B A R N E S , David F. (1963) : Geophysical methods for delineating permafrost. In Proceedings Permafrost International Conference, National Academy of Science-National Research Council. Publ. N o . 1287, Washington, 349-355.
B R O W N , R . J . E . (1963): Relation between mean annual air and ground temperatures in the permafrost region of Canada. In Proceedings Permafrost International Conference. National Academy of Sciences-National Research Council, Publ. N o . 1287, Washington, 241-247.
B U S H , B . O . and S C H W A R Z , S . D . (1965): Seismic refraction and electrical resistivity measurements over frozen ground. In Proceedings of the Canadian Regional Permafrost Conference, Dec. 1964, N R C Tech. M e m o . 86, Ottawa, 32-39.
C O O K , K . L . and G R A Y , R . L . (1961): Theoretical horizontal resistivity profiles over hemispherical sinks. Geophysics, Vol. X X V I , N o . 3, (June, 1961), 342-345.
374
Hydrology of the Pamlico Estuary in the State of North Carolina
D E M E N T ' E V , A . I . et al. (1967): Principles of geocryology; Part II, Engineering geocryology; Chapter XII, Methods of Investigations in Engineering Geocryology, pp. 298-347. Tech. Transi. 1287, N R C , Ottawa, 67 p.
H A T H E R T O N , T . (1960): Electrical resistivity of frozen earth. J. of Geophys. Res. Vol. 65, N o . 9, 3023-3024.
J O E S T I N G , H . R . (1941): Magnetometer and direct-current resistivity studies in Alaska. Tech. Publ. N o . 1284, A m . Inst, of Min. and Metall. Eng. , N e w York, 20 p.
K E L L E R , G . V . and F R I S C H K N E C H T , F. C . (1966): Electrical methods of geophysical prospecting. Pergamon Press, Toronto, 519 p.
M A C K A Y , J .R . (1963): The Mackenzie Delta area, N . W . T . Geog. Br. Memoir 8, Queen's Printer, Ottawa, 202 p.
M O O N E Y , H . M . and W E T Z E L , W . W . (1956): The potentials about a point electrode and apparent resistivity curves for a two-, three-, and four-layered earth. University of Minnesota Press, Minneapolis, Minn. , 146 p.
0STREM, G . (1964): Ice-cored moraines in Scandinavia, Geografiska Annaler, Vol. X L V I , N o . 3, 282-337.
R O B E R T S O N , E.I. and M A C D O N A L D , W . J.P. (1962): Electrical resistivity and ground temperature at Scott Base, Antarctica. N e w Zealand, / . of Geo. and Geophys., N o . 5, 797-809.
V A N N O S T R A N D , R . G . and C O O K , K . L . (1966): Interpretation of resistivity data, Geol. Surv. Paper 499, U . S . Govt. Printing Office, Washington, 310 p.
Hydrology of the Pamlico Estuary in the State of North Carolina
Roger J. M . D e Wiest, Professor, Department of Civil and Geological Engineering, Princeton University. Princeton, N e w Jersey
A B S T R A C T : The open pit mining of large phosphate deposits along the Pamlico River estuary in Beaufort County, North Carolina, requires pumping water from an underlying aquifer, the Castle Hayne formation, at the rate of about 65 million gallons per day. As see water encroaches upon each esturary, the water in the Pamlico esturary is therefore often brackish, sometimes running from about 6,000 to 8,000 p p m of chloride. It has been assumed, from the observed pattern of piezometric head in the Castle Hayne formation, that under normal circumstances the estuary is freshened notably by the seepage of ground water. It was also feared that the heavy draft on the aquifer at the site of the phosphate mine might reverse the hydraulic gradient and change the upward leakage into downward leakage, with a resulting contamination of the Castle Hayne aquifer by brackish water from the esturary.
The extent to which such contamination would occur, whether it would be localized and limited to the site of the mine or whether it would spread and radiate from the center of pumping was determined by means of a study of the hydrologie inter-relationship between surface water and ground water.
The paper describes the geology and hydrology of the aquifers adjacent to the esturary.
R É S U M É : L'exploitation à ciel ouvert des dépôts de phosphates tout le long de l'estuaire de Pamlico, comté de Beaufort, Caroline du Nord, réclame 65 millions de gallons par jour, d'eau pompée des horizons subjacents, de la formation Castle Hayne. C o m m e l'eau de mer pénètre dans tout
375