electrical products group conference · 2018-05-23 · 1 electrical products group conference david...
TRANSCRIPT

1
Electrical Products Group
Conference
David N. Farr
Emerson Chairman and Chief Executive Officer
May 23, 2018
Safe Harbor Statement Our commentary and responses to your questions may contain forward-looking statements, including our outlook for the remainder of the fiscal year, and Emerson undertakes no obligation to update any such statements to reflect later developments. Factors that could cause actual results to vary materially from those discussed today, including, among others, the impact of the Tax Cuts and Jobs Act, are provided in our most recent Annual Report on Form 10-K and subsequent reports filed with the SEC.
Non-GAAP Measures In this presentation we will discuss some non-GAAP measures (denoted with *) in talking about our company’s performance, and the reconciliation of those measures to the most comparable GAAP measures is contained within this presentation or available at our website www.Emerson.com under Investors.
2 2
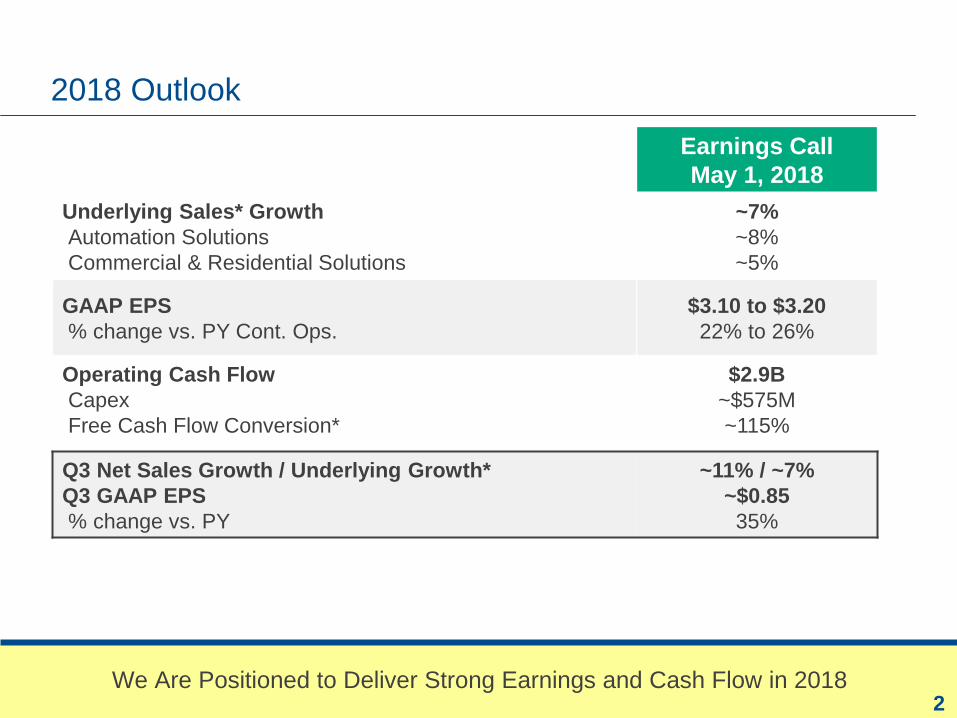
2018 Outlook
We Are Positioned to Deliver Strong Earnings and Cash Flow in 2018
Earnings Call
May 1, 2018
Underlying Sales* Growth
Automation Solutions
Commercial & Residential Solutions
~7%
~8%
~5%
GAAP EPS
% change vs. PY Cont. Ops.
$3.10 to $3.20
22% to 26%
Operating Cash Flow
Capex
Free Cash Flow Conversion*
$2.9B
~$575M
~115%
Q3 Net Sales Growth / Underlying Growth*
Q3 GAAP EPS
% change vs. PY
~11% / ~7%
~$0.85
35%

3 3
In Power Markets, We Continue to Strengthen Our DCS Platform, Ovation, to Expand Our Plant Footprint and Drive Into Adjacent Markets
Our Horizontal Expansion Strategy Enables Strong Participation in Plant Retrofits and Greenfield Projects -- Power Net Sales and Orders Grew in the 1st Half
4 4
(30%)
(20%)
(10%)
0%
10%
20%
30%
Aug-16 Dec-16 Apr-17 Aug-17 Dec-17 Apr-18
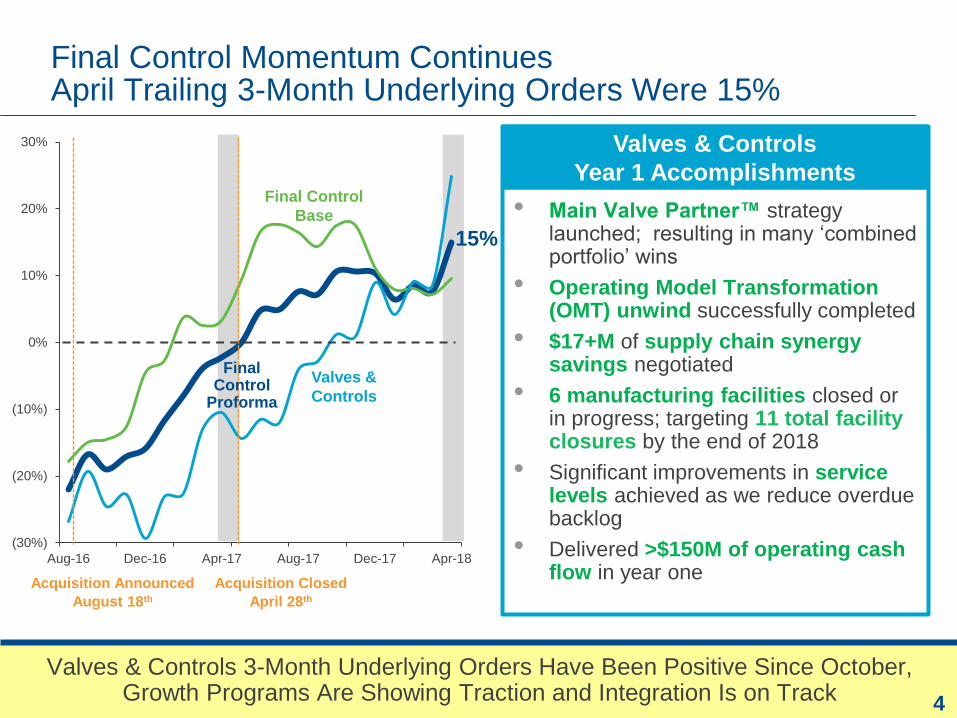
Final Control Momentum Continues April Trailing 3-Month Underlying Orders Were 15%
Valves & Controls 3-Month Underlying Orders Have Been Positive Since October, Growth Programs Are Showing Traction and Integration Is on Track
• Main Valve Partner™ strategy launched; resulting in many ‘combined portfolio’ wins
• Operating Model Transformation (OMT) unwind successfully completed
• $17+M of supply chain synergy savings negotiated
• 6 manufacturing facilities closed or in progress; targeting 11 total facility closures by the end of 2018
• Significant improvements in service levels achieved as we reduce overdue backlog
• Delivered >$150M of operating cash flow in year one
Valves & Controls
Year 1 Accomplishments
Acquisition Closed
April 28th
Acquisition Announced
August 18th
(2%)
Valves &
Controls
Final Control
Base
Final Control
Proforma
15%

5
Emerson Will Continue to Expand Automation Solutions’ Capabilities
Data Management Converts rich data to information and develops actionable insights
Control Performs action on rich data collected from the field
Devices / Instruments / Sensors Generates rich data
Process Hybrid Discrete
Sa
fety
& C
ontr
ol
Solutions &
Services
• Packaged
Solutions
• Machine
Integration
• Energy &
Environment
• Consulting
Enterprise Management
Production Management (Data Management, Manufacturing Execution System (MES))
Process Control
I/O Networking
Machine Control
Instrumentation
Control & Actuated Valves Motion Control
Intelligent Sensors
Rotating Equipment
Mechanical Processes
Pneumatics
Electrical & Power
Specialty & Robotics
On/Off Valves & Fittings
Motors & Drives
Areas of Focus
Paradigm
Geofields
Prosys
Pentair Valves
& Controls Aventics
Recent Acquisitions

6
Rest of
Europe
Aventics Synergies and Transaction Summary
Emerson
Fluid & Motion Control Aventics
• Cash purchase price €527M, ~12x 2018E EBITDA
• Slightly EPS accretive in 2019, excluding restructuring and
acquisition accounting charges
• Preliminary amortization and acquisition accounting charges
communicated after close
• Expected closing in fiscal Q4 2018
Transaction
Summary
Combination
Geographic
Mix
16%
37% 37%
10% Americas Asia Pacific
39%
28%
16%
17% Americas Asia Pacific
50%
24%
6%
20%
Asia Pacific
Americas Germany
Rest of
Europe Germany
Germany
Rest of Europe
Sales
Margins
1% growth above 3-5% market, driven by cross-selling and solutions offering
>5 points margin expansion, closer to Fluid & Motion Control margins
24%
34%
35%
7%
End Market
Mix 66% 11%
23%
Hybrid
37%
27%
31%
5%
Discrete
Other
Discrete
Discrete
Process / Hybrid
Other
Industrial
Process / Hybrid
Industrial
Industrial

7
Emerson Will Continue to Expand Our Leadership in Commercial & Residential Solutions’ Markets
Residential Commercial Cold Chain Contractor
Cooper-Atkins
Locus Traxx &
PakSense
Gas Valves Temperature Monitoring
Loggers Sensors
AC & Ref Compressors
Electrical Tools
Condensing Units/ Systems Heat Pump Solutions Disposers
Joining Technologies
Dehumidification Inspection Tools
Case Controls Sensi Thermostats
Refrigeration Controls HVAC Controls
Compressor Controls Drives
IAQ Controls Dampers & Actuators
Multiple Thermostats Grind2Energy
Sensi Monitoring Temperature Monitoring
Building Management Cargo Monitoring
Container Monitoring Facility/Asset Monitoring
Data Management Converts rich data to information and develops actionable insights
Control Performs action on rich data collected from the field
Devices / Instruments / Sensors Generates rich data
Textron
Tools & Test
Areas of Focus
Recent Acquisitions

8
82%
7% 11%
56% 31%
13%
Tools & Test Update -- Greenlee & Klauke
EMR Tools &
Home Products1 Tools & Test
Sales by
Geography United
States Europe
Europe
All Others All Others
United
States
Europe
United
States
• Grow sales 1% above market
• Expected closing June / July 2018
• Expected Q4 2018 one-time accounting charges
of ~$25M pre-tax, or ~($0.03) EPS impact
• Ongoing amortization (full year): ~$25M
• Earnings and cash accretive in Fiscal 2019
Sales
EBIT %
$1,645M $470M
23% 11% • Drive to ~20% EBIT margin
excluding amortization costs
• Reduce TWC by $25M - $50M
FY 2017
Transaction
Update
76%
12%
12%
Meaningful Value Creation
All Others
1 Reported, includes ClosetMaid results (divested Oct 2017)
Ops. CF Tools & Test contributes ~$100M of OPCF in 2022
No change to 2018
GAAP EPS Guidance
of $3.10 to $3.20

9 9
$10B
$15B
$20B
$25B
2016 Bridge to 2021T Sales
Acquisitions Contribution for the 2021 Sales Target Is Now Secured ---
Additional Debt Capacity Allows Us to Target ~$2.5B of Incremental Dollar Spend on Bolt-On Acquisitions / Internal Investments
~$2.0B
2021
Target
~$21+B
~5%
Underlying
Growth
2016 - 2021
Pentair V&C
2017
Actual
Excl. V&C*
~$1.5+B
$14.7B
~$3.5B
Including:
• Paradigm
• Cooper-Atkins
+ Tools & Test
+ Aventics
Reported 2016 - 2021 CAGR: ~8%
Reported 2017 - 2021 CAGR: ~8.5%
Underlying* 2016 - 2021 CAGR: ~5%
Underlying* 2017 - 2021 CAGR: ~5.5%
2016 - 2021 Bridge
2016
Continuing
Ops
Large
Acquisition(s) Underlying
Growth
Bolt-On
Acquisitions
$14.5B
Feb. 2018 Investor Day
Bolt-On
Acquisitions

10 10
$2.00
$2.50
$3.00
$3.50
$4.00
$4.50
2016 Bridge to 2021T EPS
Acquisition Contribution for 2021 EPS Target Is Now Secured ---
Potential ~$0.20 Upside to $4.50 Plan Driven by ~$0.4B / Year Higher Share Repurchase (Totaling ~$1B / Year) and Additional Bolt-On Acquisitions
$2.69
~$0.90
~$0.15
2017
Actual
Excl. V&C*
Underlying
Growth
plus V&C
Share Count
Reduction
2021T
Target
Underlying Sales Growth: ~5%
Base EBIT Expansion: ~2.5 pts
Margin
Expansion
~$0.15+
Acquisitions
~$4.15
~$0.35 ~$4.50
2016 - 2021 CAGR w/o Tax Reform*: ~11%
2017 - 2021 CAGR w/o Tax Reform*: ~11.5%
2021T
Target w/ Tax
Reform
Tax
Reform
Benefit
$2.45
2016
Cont. Ops
~$0.50
FCF*($M) $2,052 $2,214 ~$2,900 ~$3,100
2016 - 2021 Bridge
Feb. 2018 Investor Day
Bolt-On
Acquisitions Share
Repurchase

11 11
$4B Additional Debt Capacity Provides Upside to 2021 Plan
The $4B of Higher Capital Allocation Is Due to Higher Underlying Sales Growth, Better Earnings Growth, and the Benefit of U.S. Tax Reform
$0B
$5B
$10B
$15B
$20B
$25B
Sources Uses
Depreciation &
Amortization ~$4B
Net Income
~$11.5
NWC & Other ~$1B
Net Divestiture
Proceeds
~$4.5B
Net Debt Increase ~$1.5B
Acquisitions
~$6B
CapEx
~$3B
Dividends
~$6.5B
Share Repurchase
~$3B
2016 - 2021T
Inclusive of Cash Sources and Uses from ‘17, ‘18, ‘19, ‘20, & ‘21
Cash Uses Cash Sources
~$22.5B ~$22.5B $4B Additional Debt Capacity
Feb. 2018 Investor Day
~$1.6B Share Repurchase
~$2.4B Acquisition & Internal Investments
Complete
40% Share Repo
60%
Acquisitions &
Internal
Investments
“Upside”
“Upside”

12 12
Key Messages
We Expect a Strong 2nd Half Finish to 2018 With Orders Pace Continuing and Large Projects Starting to Convert
• Orders momentum is on track and supports Emerson’s 2018 ~7%
underlying growth*
• Valves & Controls target margin improvement is reading through --
integration with Final Control is near completion
• Completed / Announced ~$2.3B of strategic bolt-on acquisitions over the
last 6 months -- accretive and in our two core platforms
• Set-up into 2019 is solid:
– Large project momentum continues in our key end markets
– Emerging markets will outpace mature markets, picking-up in 2019
– Emerson is positioned to outperform
• 2021 acquisition plan targets are complete -- Deploying an additional $4B
capital to acquisitions, internal investments and share repurchase
2017 - 2020
Growth CAGR
Mature Markets: 3+% GFI Drives 5+% Sales Growth*
Emerging Markets: 5+% GFI Drives 6% - 7% Sales Growth*

13
Reconciliation of Non-GAAP Measures
Reconciliations of Non-GAAP measures (denoted by *) with the most directly comparable GAAP
measure (dollars in millions, except per share amounts):
Q3 2018E Underlying Sales Change Emerson
Reported (GAAP) ~ 11%
FX ~ ( 3)%
Acquisitions/Divestitures ~ (1)%
Underlying* ~ 7%
FY 2018E Underlying Sales Change Auto Solns
Comm &
Res Solns Emerson
Reported (GAAP) ~ 20% ~ 2% ~ 13%
FX ~ (3)% ~ (2)% ~ (2)%
Acquisitions/Divestitures ~ (9)% ~ 5% ~ (4)%
Underlying* ~ 8% ~ 5 % ~ 7%
Free Cash Flow Conversion FY18E
Operating Cash Flow Conversion (GAAP) ~ 145%
Capital Expenditures ~ (30)
Free Cash Flow Conversion* ~ 115%

14
Reconciliation of Non-GAAP Measures
Insert footer or confidential information here if needed.
Sales CAGR 2016-2021T 2017-2021T
Sales CAGR (GAAP) ~8% ~8.5%
Acq/Div/FX ~(3)% ~(3)%
Sales underlying CAGR* ~5% ~5.5%
EPS Growth 2016-2021T 2017-2021T
EPS growth with tax reform (GAAP) ~13% ~15.5%
Tax reform impact ~(2)% ~(4.0)%
EPS growth without tax reform* ~11% ~11.5%
Free Cash Flow ($ in millions) 2016
Operating cash flow (GAAP) $ 2,881
Impact of repositioning items 179
Operating cash flow adjusted* 3,060
Capital expenditures including discontinued operations (523)
Free cash flow* 2,537
Impact of discontinued operations (485)
Free cash flow continuing operations* $ 2,052
Reconciliations of Non-GAAP measures (denoted by *) with the most directly comparable GAAP
measure (dollars in millions, except per share amounts):

15
Reconciliation of Non-GAAP Measures
Free Cash Flow 2017 2021T
Operating cash flow (GAAP) $ 2,690 ~3,800
Capital expenditures (476) ~(700)
Free cash flow* $ 2,214 ~3,100
Impact of tax reform ~(200)
Free cash flow excluding tax reform* ~$2,900
Reconciliations of Non-GAAP measures (denoted by *) with the most directly comparable GAAP
measure (dollars in millions, except per share amounts):
Mature Market Sales CAGR 2017 - 2020T
Sales CAGR (GAAP) ~6+%
Acq/Div/FX ~(1)%
Sales underlying CAGR* ~5+%
Emerging Market Sales CAGR 2017 - 2020T
Sales CAGR (GAAP) 8 - 9%
Acq/Div/FX ~(2)%
Sales underlying CAGR* 6 - 7%