electrical and mechanical stress responses for carbcm
TRANSCRIPT

Electrical and Mechanical Stress Responses for Carbcm Black Loaded Rubber
by
Chin Jung Chen
Thesis submitted to the Faculty of the
Virginia Polytechnic Institute and State University
in partial fulfillment of the requirements for the degree of
Master of Science
in
Materials Engineering
APPROVED:
Larry C. Burton, Chairman
F. William Stephenson
August, 1987
Blacksburg, Virginia
Shinzo Onishi
Electrical and Mechanical Stress Responses for Carbon Black Loaded Rubber
by
Chin Jung Chen
Larry C. Burton, Chairman
Materials Engineering
(ABSTRACT)
The major objective of this study was to determine the relations between cer-
tain electrical parameters (resistance, capacitance) and mechanical parame-
ters (stress, strain) for carbon black loaded rubber. Resistance and
capacitance were measured under constant strain and constant stress condi-
tions in an effort to determine these relations for rubber filled with 30 to 70
parts carbon black per hundred parts rubber.
Seven materials for making electrical contact were investigated. Silver paint
was found to resulr in low contact resistance, to be reliable, and fairly inex-
pensive.
Electrical parameters (resistance, capacitance) and mechanical parameters
(stress, strain) were found to exhibit similar trends as functions of carbon
black content. This is in agreement with previous theories of the conduction
network and electron percolation. Resistance and stress relaxation equations
were quantitatively determined. These follow a power law time dependence,

with relaxation rates depending mainly on carbon black content and temper-
ature.

Acknowledgements
The author whishes to express his sincere appreciation to his advisor Dr.
LC.Burton for his guidance, and his invaluable assistance during the course
of his study. Many thanks also go to the members of his committee,
Dr.F.W.Stephenson, and Dr.S.Onishi for their review and suggestions.
Also, the author would like to thank his friends and fellow officemates
Mr.E.Cole, Mr.E.Ellis, Mr.Y.L.Hwang, Mr.P.Johnson, Mr.H.Y.Lee, Mr.R.Reddy
Mr.S.Sen, Mr.A.Vaseashta, and Mr.T.Zhang, who provided both friendship and
support when he needed them the most.
A special thanks goes to his wife, Li-Di, for her assistance and encouragement.
The U.S. Army Tank and Automotive Command is acknowledged for providing
financial support during the course of this study.
Acknowledgements iv

Table of Contents
1.0 INTRODUCTION . . . . . . . . . . . . . . . . . . . . . . . . . . . . . . . . . . . . . . . . . . . . . . . . . . . . . 1
2.0 LITERATURE REVIEW . . . . . . . . . . . . . . . . . . . . . . . . . . . . . . . . . . . . . . . . . . . . . . . . . 3
2.1 CONDUCTIVE POLYMER . . . . . . . . . . . . . . . . . . . . . . . . . . . . . . . . . . . . . . . . . . . . . . 4
2.2 CARBON BLACK .................................................... 8
2.3 CARBON BLACK FILLED RUBBER . . . . . . . . . . . . . . . . . . . . . . . . . . . . . . . . . . . . . . . 9
2.4 STRESS RELAXATION AND CREEP IN CARBON BLACK FILLED RUBBER . . . . . . . . 11
2.5 EFFECT OF LOADING, STRUCTURE, AND MIXING ON RESISTIVITY OF CARBON
BLACK FILLED RUBBER . . . . . . . . . . . . . . . . . . . . . . . . . . . . . . . . . . . . . . . . . . . . . . . . 13
2.5.1 LOADING ...................................................... 13
2.5.2 STRUCTURE ................................................... 15
2.5.3 MIXING ................................ ·. . . . . . . . . . . . . . . . . . . . . . . 15
2.6 EFFECT OF DEFORMATION ON ELECTRICAL PROPERTIES OF CARBON BLACK
FILLED RUBBER . . . . . . . . . . . . . . . . . . . . . . . . . . . . . . . . . . . . . . . . . . . . . . . . . . . . . . . 16
2.7 EFFECT OF ELECTRICAL CONTACT ON RESISTANCE MEASUREMENTS .......... 19
2.8 RESISTANCE AND CAPACITANCE CORRELATIONS IN CARBON BLACK FILLED RUB-
BER ................................................................ 20
Table of Contents V
3.0 EXPERIMENTAL METHODS AND MATERIALS .............................. 24
3.1 RESISTANCE OF "AS RECEIVED" SAMPLES (STATIC) ....................... 25
3.2 RESISTANCE OF SAMPLES WITH DIFFERENT CONTACTS (STATIC) ............. 31
3.3 RESISTANCE AND STRAIN VERSUS COMPRESSIVE LOAD .................... 32
3.4 RESISTANCE RELAXATION AND STRESS RELAXATION ...................... 33
3.5 THERMAL RELIEF OF STRESSED SAMPLES ............................... 35
3.6 ELECTRICAL AND MECHANICAL PROPERTIES AS FUNCTIONS OF CARBON BLACK
CONTENT ............................................................ 37
3.7 EFFECT OF MIXING TIME ............................................. 37
4.0 RESULTS AND DISCUSSION . . . . . . . . . . . . . . . . . . . . . . . . . . . . . . . . . . . . . . . . . . 39
4.1 RESISTANCE OF "AS RECEIVED" SAMPLES (STATIC) ....................... 39
4.2 RESISTANCE OF SAMPLES WITH DIFFERENT CONTACTS (STATIC) ............. 40
4.3 RESISTANCE AND STRAIN VERSUS COMPRESSIVE LOAD .................... 45
4.4 RESISTANCE RELAXATION AND STRESS RELAXATION ...................... 50
4.5 THERMAL RELIEF . . . . . . . . . . . . . . . . . . . . . . . . . . . . . . . . . . . . . . . . . . . . . . . . . . 58
4.6 ELECTRICAL AND MECHANICAL PROPERTIES AS FUNCTIONS OF CARBON BLACK
CONTENT ............................................................ 60
4.7 RESISTANCE AND CAPACITANCE CORRELATION .......................... 75
4.8 ELECTRICAL AND MECHANICAL PROPERTIES WITH DIFFERENT MIXING TIME . . . . 80
5.0 CONCLUSIONS AND RECOMMENDATIONS ............................... 86
5.1 CONCLUSIONS . . . . . . . . . . . . . . . . . . . . . . . . . . . . . . . . . . . . . . . . . . . . . . . . . . . . 86
5.2 RECOMMENDATIONS FOR FUTURE WORK . . . . . . . . . . . . . . . . . . . . . . . . . . . . . . . 88
BIBLIOGRAPHY . . . . . . . . . . . . . . . . . . . . . . . . . . . . . . . . . . . . . . . . . . . . . . . . . . . . . . . . 90
Table of Contents vi

CURRICULUM VITAE • • • • • • • . . . . . . . • • • • . • • • . . . . . . • • . • . • . • • . . . . • . . • . . • . • . . 93
Table of Contents vii

List of Illustrations
Figure 1. Resistance as a function of carbon black content . . . . . . . . . . . 5
Figure 2. Strain as a funtion of carbon black content ................ 6
Figure 3. DC conductivity (1/ohm-cm) of carbon black filled rubber . . . . 14
Figure 4. Log resistivity as a function of mixing time . . . . . . . . . . . . . . 17
Figure 5. Capacitance and conductance versus pressure . . . . . . . . . . . 22
Figure 6. Equivalent circuit for carbon black filled rubber . . . . . . . . . . . 23
Figure 7. INSTRON 1331 Dynamic Material Testing Machine . . . . . . . . . 34
Figure 8. Experimental setup for electrical and mechanical relaxation 36
Figure 9. Resistance versus load for Akron samples . . . . . . . . . . . . . . . 48
Figure 10. Strain versus load for Akron samples .................. 49
Figure 11. Standardized strain profile for testing electrical response . . . 51
Figure 12. Typical resistance response with standardized load profile of Figure 11 . . . . . . . . . . . . . . . . . . . . . . . . . . . . . . . . . . . . . . . . . 52
Figure 13. Typical stress response with standardized load profile of Figure 11 . . . . . . . . . . . . . . . . . . . . . . . . . . . . . . . . . . . . . . . . . . . . . . 53
Figure 14. Typical capacitance transient . . . . . . . . . . . . . . . . . . . . . . . . . 61
Figure 15. Typical strain transient .............................. 62
Figure 16. RO, R2 and R4 resistance parameters versus carbon black con-tent . . . . . . . . . . . . . . . . . . . . . . . . . . . . . . . . . . . . . . . . . . . . . 66
List of Illustrations viii

Figure 17. RO, R2 and R4 resistance parameters versus carbon black con-tent ............................................. 67
Figure 18. CO, C2 and C4 capacitance parameters versus carbon black content . . . . . . . . . . . . . . . . . . . . . . . . . . . . . . . . . . . . . . . . . . . 68
Figure 19. CO, C2 and C4 capacitance parameters versus carbon black content . . . . . . . . . . . . . . . . . . . . . . . . . . . . . . . . . . . . . . . . . . . 69
Figure 20. Sensitivity factor (R1-RO)/RO versus carbon black content 71
Figure 21. L 1 (load required for 10 percent strain) versus carbon black content . . . . . . . . . . . . . . . . . . . . . . . . . . . . . . . . . . . . . . . . . . . 72
Figure 22. Durometer hardness versus carbon black content . . . . . . . . . 73
Figure 23. S1 (Strain at 150 lb. load) versus carbon black content ..... 74
Figure 24. RO versus CO plot . . . . . . . . . . . . . . . . . . . . . . . . . . . . . . . . . 76
Figure 25. R2 versus C2 plot . . . . . . . . . . . . . . . . . . . . . . . . . . . . . . . . . 77
Figure 26. R4 versus C4 plot . . . . . . . . . . . . . . . . . . . . . . . . . . . . . . . . . 78
Figure 27. Typical resistance and capacitance relaxation curves for sample with silver coated faces . . . . . . . . . . . . . . . . . . . . . . . . . . . . . . 79
Figure 28. Resistance, for two mixing times of Akron samples, versus car-bon black content . . . . . . . . . . . . . . . . . . . . . . . . . . . . . . . . . . . 82
Figure 29. Capacitance, for two mixing times of Akron samples, versus carbon black content . . . . . . . . . . . . . . . . . . . . . . . . . . . . . . . . 83
Figure 30. Young's Modulus for different mixing times of Akron samples 84
Figure 31. Durometer Hardness for different mixing times of Akron sam-ples . . . . . . . . . . . . . . . . . . . . . . . . . . . . . . . . . . . . . . . . . . . . . 85
List of Illustrations ix

List of Tables
Table 1. Effects of carbon black size and structure on rubber mechanical properties . . . . . . . . . . . . . . . . . . . . . . . . . . . . . . . . . . . . . . . . . 1 O
Table 2. Akron sample compositions . . . . . . . . . . . . . . . . . . . . . . . . . . . 26
Table 3. Fort Belvoir sample compositions . . . . . . . . . . . . . . . . . . . . . . 27
Table 4. Fort Belvoir sample compositions (cont.) . . . . . . . . . . . . . . . . . 28
Table 5. Fort Belvoir sample compositions (cont.) . . . . . . . . . . . . . . . . . 29
Table 6. Fort Belvoir sample compositions (cont.) . . . . . . . . . . . . . . . . . 30
Table 7. Resistances of Akron samples with different contacts ....... 41
Table 8. Resistances of Fort Belvoir samples with brass electrodes . . . 42
Table 9. Resistances of Fort Belvoir samples with and without brass con-tact . . . . . . . . . . . . . . . . . . . . . . . . . . . . . . . . . . . . . . . . . . . . . . 43
Table 10. Resistances of Akron samples with copper and aluminum con-tacts for short and long time storage . . . . . . . . . . . . . . . . . . . . . 44
Table 11. Resistances of samples with EKG and NaCl solution contacts, as compared to that of silver paint contact . . . . . . . . . . . . . . . . . . . 46
Table 12. Numerical values for resistance relaxation in region A for Akron samples ........................................... 55
Table 13. Numerical values for resistance relaxation in region B for Akron samples ........................................... 56
Table 14. Numerical values for the stress relaxation for Akron samples . 59
List of Tables X

Table 15. Electrical Parameters of Akron Samples . . . . . . . . . . . . . . . . . 63
Table 16. Electrical Parameters of Akron Samples (cont.) . . . . . . . . . . . . 64
Table 17. Mechanical Parameters of Akron Samples . . . . . . . . . . . . . . . . 65
List of Tables xi
1.0 INTRODUCTION
Rubber pads are used on the tracks of tanks and armored personnel carriers
for the purposes of reducing vibration and preventing damage to the road
surfaces. These rubber pads generally consist of a synthetic elastomer, e.g.,
styrene-butadiene rubber (SBR). Such elastomers must be strengthened by
the addition of fillers such as carbon black.
The United States Army's Tank and Automotive Command (TACOM) is cur-
rently conducting a systematic study for improving the field-service life of
these tank track pad materials. The scope of the work described in this thesis
is designed to assist TACOM in the study of electrical and mechanical prop-
erties of tank track rubber pads. The objectives are
1. To determine if electrical measurements can be used to distinguish be-
tween different types of carbon black filled rubber with different compos-
itions and/or made with different manufacturing processes;
INTRODUCTION 1

2. To determine if electrical properties can be correlated with mechanical
properties;
3. To gain fundamental information related to processes occuring in
mechanically-stressed track pad rubber;
4. To make recommendations as to the feasibility of electrical measurements
toward improving the reliability of track pad rubber, and make recommen-
dations for future work.
The electrical and mechanical parameters of tank track pad type rubber that
have been measured in this investigation are resistance, capacitance, stress,
and strain for rubbers with varied carbon black content. Correlations between
electrical and mechanical properties are observed and discussed in the thesis.
INTRODUCTION 2

2.0 LITERATURE REVIEW
Research that has been reported related to electrical properties of carbon-
black polymer composites mostly focuses on (1 ):
1. The polymer physics of organic conductors;
2. Composites of metals and insulators such as cermets;
3. Industrial use of carbon black-polymer composites for capacitive video
disks and xerographic applications.
Our interests, unlike the three mentioned above, are related to correlation be-
tween electrical and mechanical properties, with application to wear charac-
teristics, for rubber pads on military vehicles. However, the above-mentioned
studies still may assist to a great extent in the understanding of electrical
properties of carbon black filled rubber.
LITERATURE REVIEW 3

Carbon black has long been used as a reinforcing agent in elastomers which
otherwise fail to crystalize on stretching (2,3,4). Many studies have been done
to investigate mechanical properties such as stress relaxation, creep,
elongation, hardness etc.. However, there are insufficient studies on the cou-
pling between mechanical and electrical properties of carbon black filled
composites.
A generic relation between carbon black concentration and the resistance in
a particular carbon black filled rubber can be seen in Figure 1. In this figure
a trend of the resistance decreasing with increasing carbon black content is
shown. A similar trend for mechanical properties is shown in Figure 2. The
strain, at a constant applied stress, decreases with increasing carbon black
content. The reasons for these trends can be better understood by further in-
vestigating the physical properties of these materials.
2.1 CONDUCTIVE POLYMER
Electrical resistivity of materials is a property which spans a very wide range,
from roughly 1020 ohm-cm for insulating materials such as polyethylene and
dry fused quartz to 10-24 ohm-cm for superconductive materials like lead at
4°K. The electrical resistivity of polymers in their pure state is usually larger
than 1012 ohm-cm, which lies in the insulating region. Polymers, however can
LITERATURE REVIEW 4

-e u • e .c 0 -> E--t -> -E--t Cll -Cll t&l a: t:) 0 ..J
! "
• .a j • "' ~-----' ' \ \
\ \ tll - \ \ . \ .. \ . \
\ \ . ' \ , \ \ • 12 ... \ • \
\ ' , \ \ 1 \ \ \ \ LO ' \ \
! \ t l \ \ , ' a .J \ \ \ \ \ \ \ j ' \
l'5 \ \ ' \ ' i ' \ , ... ' ...... \
' " i ' j
2 .. 0 lO 20 '!O 1&0 50 60 71'.) ... 90 '. l'.lC
CARBON BLACK CONCENTRA'!'ION (phr)
Flgura 1. Resistance as a function of carbon black content: The resistance decreases with in-creasing carbon black content. The same trend is seen for strain obtained at same applied load (see Figure 2 on page 6).
LITERATURE REVIEW 5

A ..
.1,
,1
••
• • V
C .. • • • •
STIHN (at t• IN el 61 INS 161 1•.) n IUCI
A 038-71
Figure 2. Strain as a funtlon of carbon black content: The strain is measured after 150 lb. applied at rubber for 60 secs.
LITERATURE REVIEW 6
be modified by processing to be relatively good electrical conductors with
resistivity less than 10 ohm-cm. This can be accomplished either by doping
with impurities or by simply making a mixture of the polymer and a good
conductive material.
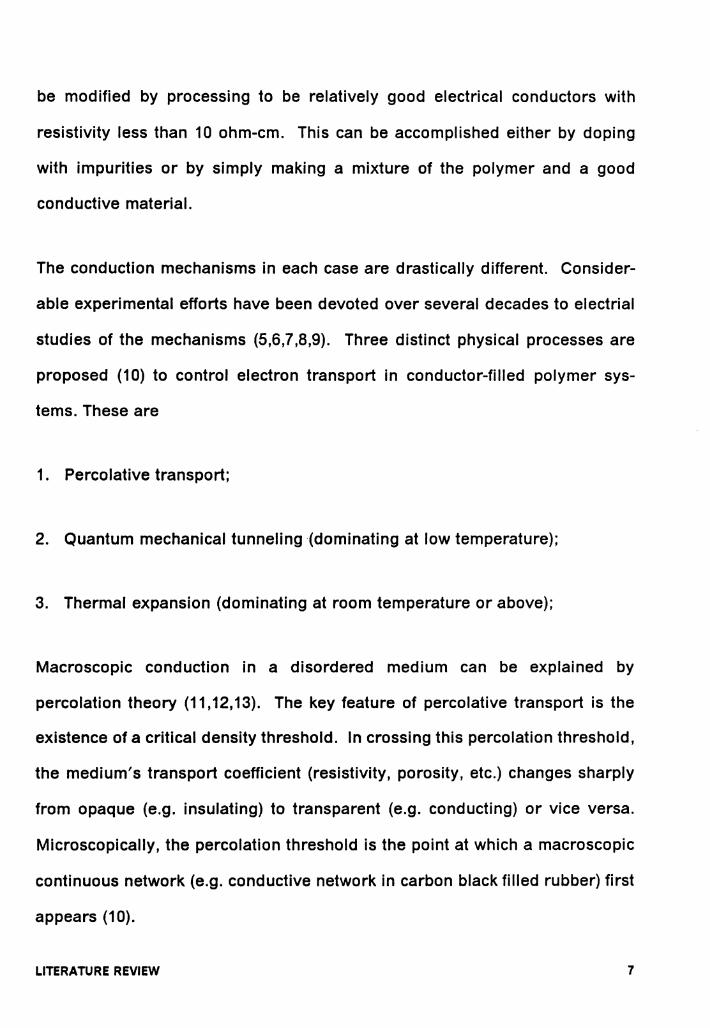
The conduction mechanisms in each case are drastically different. Consider-
able experimental efforts have been devoted over several decades to electrial
studies of the mechanisms (5,6,7,8,9). Three distinct physical processes are
proposed (10) to control electron transport in conductor-filled polymer sys-
tems. These are
1. Percolative transport;
2. Quantum mechanical tunneling (dominating at low temperature);
3. Thermal expansion (dominating at room temperature or above);
Macroscopic conduction in a disordered medium can be explained by
percolation theory (11, 12, 13). The key feature of percolative transport is the
existence of a critical density threshold. In crossing this percolation threshold,
the medium's transport coefficient (resistivity, porosity, etc.) changes sharply
from opaque (e.g. insulating) to transparent (e.g. conducting) or vice versa.
Microscopically, the percolation threshold is the point at which a macroscopic
continuous network (e.g. conductive network in carbon black filled rubber) first
appears (10).
LITERATURE REVIEW 7

Conduction between adjacent conductive particles at the microscopic level can
also be described by quantum mechanical tunneling (8,9, 14). In a system of
two conductors, emdedded in an insulating polymer, having separation less
than 1 ooA, the electrons may tunnel quantum mechanically between
conductive elements, leading to a lower resistance than would be expected
from the polymer alone.
At room temperature and above, thermal expansion is involved in the con-
duction mechanism. When thermal expansion occurs, the constituent volume
densities decrease and microscopic tunnel lengths increase. If quantum me-
chanical tunneling is reduced because of the larger gap width, the dominant
mechanism now may be the thermally activated transport of electrons over the
potential barrier, which is known as hopping (39,46).
2.2 CARBON BLACK
Carbon black is primarily used as a reinforcing agent in rubber compounds.
The process of carbon black formation is complex, involving cracking,
dehydrogenation and subsequent accretion into large molecular species (1 ).
Particle size and structure are two of the most important carbon black param-
eters influencing processing and properties of black filled rubber compounds.
Carbon black particles adhere and fuse together to form the smallest
LITERATURE REVIEW 8

dispersible unit of carbon black - the primary aggregate. The number of par-
ticles forming the primary aggregate determines the structure. The greater the
number of particles per aggregate, the higher is the structure of the carbon
black (15, 16).
The particle size usually varies from roughly 100A to 3,000A (17). Structure
can be measured by adding a vehicle such as linseed oil or dibutyl phthalate
(DBP) until the void spaces in the carbon blacks are filled (18). The higher the
DBP absorption,the higher is the structure, by definition.
Table 1 shows how rubber mechanical properties depend, in a general way,
on carbon black particle size and structure (22).
2.3 CARBON BLACK FILLED RUBBER
The physical properties of carbon black filled rubber are affected mainly by the
amount, distribution, and structure of the carbon black. When carbon black is
added to rubber, the agglomerates may flocculate under the influence of
London-Van der Waals force. And a network of interconnected carbon black
agglomerates can be formed (19), which is used to explain the onset of elec-
trical conduction in a carbon black filled rubber.
LITERATURE REVIEW 9

Table 1. Effects of carbon black size and structure on rubber mechanical properties
Property of Rubber Decreasing Particle size Increasing Structure
Tensile Strenth Increase Variable
Modulus Not a Major Factor Increase
Elongation Not a Major Factor Decrease
Hardness Increase Increase
Impact Resistance Decrease Not a Major Factor
Abrasion Resistance Increase Variable
LITERATURE REVIEW 10
Electrical measurements can be very useful for investigating the interactions
which occur inside the rubber. DC conductivity can be used to probe changes
in the carbon black structures. In addition, the overall shape of dispersed
aggregates may be estimated by dielectric measurement. The dielectric con-
stant is lowest for spherical particles and increases rapidly with increasing
particle assymetry (19,20,21). Mechanisms that can account for these phe-
nomena are discussed later.
2.4 STRESS RELAXATION AND CREEP IN CARBON
BLACK FILLED RUBBER
Stress relaxation and creep for pure rubber, and for carbon black filled rubber
under tensile or compressive loading, have been studied extensively (23-32).
When vulcanized rubbers are deformed, the applied stresses required to
maintain the same level of deformation gradually decrease with time. This is
the phenomenon of stress relaxation. It can constitute a major defect in rubber
springs for engineering applications (23,24). A similar delayed response ap-
pears in other circumstances, such as:
1. When a constant stress is imposed, the resulting deformation increases
continuously; this is known as "creep";
LITERATURE REVIEW 11

2. When the stress is eventually removed, the unstrained state is not attained
immediately; the deformation that remains is known as "set"; it gradually
decreases.
Many investigators (24,33-36) have studied relaxation in pure elastomers and
carbon black filled stocks under compression at room temperature, and found
an empirical equation of the form
where fr is force at time t, fio is a constant, and n, is the relaxation rate of the
material (by definition). In later investigations Mackenzie and Scanlan (32),
and Cotten and Boonstra (24) concluded that both n, and fio increase with in-
crease in carbon black loading.
Bartenve (37) has modeled stress relaxation mechanisms in carbon black filled
rubber in terms of relaxation of free segments of chain molecules, relaxation
of the carbon black filler network, and chemical crosslink relaxation.
Creep is essentially the inverse of the stress relaxation. A simple approxi-
mation to convert creep to stress relaxation or vice versa is given by Smoluk
(38) using the equation
LITERATURE REVIEW 12

Where, g0 is the initial strain, and g(t) is the creep strain after time t, cr0 is the
initial stress measured at the beginning of the test, and cr(t) is the stress after
time t.
2.5 EFFECT OF LOADING, STRUCTURE, AND MIXING ON
RESISTIVITY OF CARBON BLACK FILLED RUBBER
2.5.1 LOADING
At low loading (i.e. small weight percentage) of carbon black, the conductivity
of the composite is essentially that of the dielectric medium (region A of Figure
3). As the loading is increased, a percolation threshold (or critical loading) is
reached where the conductivity starts to increase rapidly as a function of
loading. Region B of Figure 3 is called the percolation region. In this region,
conductivity is limited by potential barriers which prevent passage of electrons
from one carbon black aggregate to an adjacent but seperate aggregate (39).
The dominant mechanism of conduction is either tunneling through the ag-
gregates' gap (at low temperature), assisted by thermal fluctuations, or ther-
mal activation of electrons over the potential barrier of the gap.
LITERATURE REVIEW 13

ELEC I RICAL CONDUCTION
C C 0 .. N D u 0 B T I y
I T y
.... o o.oe 0.1 o. 1e 0.2 o.2e
VOLUME FRACTION OF CARBON BLAO<
Figure 3. DC conductivity (1/ohm-cm) of carbon black filled rubber: After Medalia (39), with re. gions added as indicated: A, insulating; B, percolation; C, limiting high conductivity.
LITERATURE REVIEW 14

As Kawamoto(40) indicated, "As the loading density is increased, the aggre-
gates are more tightly packed and pressed against each other. This results in
the reduction of matrix resistance Rm (the resistance of rubber and of the
interface between rubber and carbon); thus the net resistance decreases with
increasing loading level.". Once sufficient loading is reached so that resistance
between aggregates (Rm) is no longer significant, further increase in loading
would not cause any significant increase in conductivity, as illustrated in re-
gion C of Figure 3.
2.5.2 STRUCTURE
Medalia (41), Janzen (42), and others (44) have reported that the "structure"
of the carbon black aggregates plays a role similar to that of loading. They
predicted that high-structure blacks should have a low percolation threshold,
and at a given loading a high-structure black would have a lower resistivity
than a low-structure black.
2.5.3 MIXING
The resistivity of a carbon black filled rubber rapidly decreases to a minimum
during the very first stage of mixing, as carbon black is incorporated and
pathways are established in the rubber matrix. The resistivity then increases
LITERATURE REVIEW 15
gradually during the later stages of mixing as the black pathways are broken
down and the gap width between individual aggregates is increased (39,43,45).
Figure 4 shows the plot of resistivity as a function of mixing time (45).
High-structure carbon takes less mixing time to reach the resistivity minimum.
Cembrola(47) explained this phenomenon as follows, "The high-structure black
requires less mixing for dispersion into the rubber than the low-structure
black. A minimum in resistivity would then be shifted to shorter mixing time for
the high-structure black compared to the low-structure.".
2.6 EFFECT OF DEFORMATION ON ELECTRICAL
PROPERTIES OF CARBON BLACK FILLED RUBBER
The effect of deformation on electrical properties of carbon black filled rubber
has been studied and reported (29, 43, 48-50, 58). These reports describe the
changes of conductivity on flexing, bending, elongation, and compression.
With an applied deformation, the resistivity increases to a high value, and de-
creases slowly as soon as conditions are stationary again. The return to
equilibrium proceeds more rapidly at higher temperature. This behavior is
thought to be due to the breakup of the conducting network at deformation and
the formation of another network after the load is released.
LITERATURE REVIEW 16

16
1
1a
I\ 1 I
I V
I
§ '
2
fl 35 n• •an• D 55 nhl' I '5 n•
Lot ltsistivity VIPSIIS Nixing filll
1 Nixin• Ii• <•in>
I I
1 2
Figure 4. Log resistivity as a function of mixing time: for four different amounts of HAF-LS black in SBR (reference 45) :.635phr; A45phr; 055phr;l65phr
LITERATURE REVIEW 17
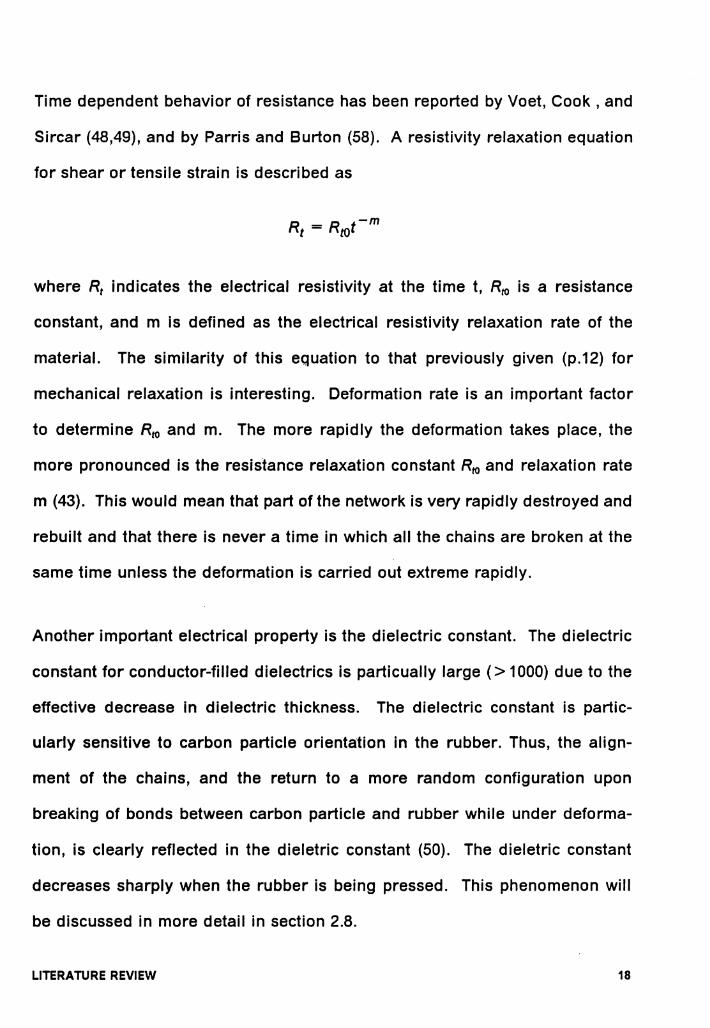
Time dependent behavior of resistance has been reported by Voet, Cook , and
Sircar (48,49), and by Parris and Burton (58). A resistivity relaxation equation
for shear or tensile strain is described as
where R, indicates the electrical resistivity at the time t, R10 is a resistance
constant, and m is defined as the electrical resistivity relaxation rate of the
material. The similarity of this equation to that previously given (p.12) for
mechanical relaxation is interesting. Deformation rate is an important factor
to determine Rto and m. The more rapidly the deformation takes place, the
more pronounced is the resistance relaxation constant Rio and relaxation rate
m (43). This would mean that part of the network is very rapidly destroyed and
rebuilt and that there is never a time in which all the chains are broken at the
same time unless the deformation is carried out extreme rapidly.
Another important electrical property is the dielectric constant. The dielectric
constant for conductor-filled dielectrics is particually large ( > 1000) due to the
effective decrease in dielectric thickness. The dielectric constant is partic-
ularly sensitive to carbon particle orientation in the rubber. Thus, the align-
ment of the chains, and the return to a more random configuration upon
breaking of bonds between carbon particle and rubber while under deforma-
tion, is clearly reflected in the dieletric constant (50). The dieletric constant
decreases sharply when the rubber is being pressed. This phenomenon will
be discussed in more detail in section 2.8.
LITERATURE REVIEW 18

2.7 EFFECT OF ELECTRICAL CONTACT ON RESISTANCE
MEASUREMENTS
Contact resistance is one of the major obstacles to accurate and reproducible
measurements of the resistivity of conductive rubbers, and may increase the
measured resistance by orders of magnitude.
The mechanism of contact resistance in conductive rubber has not been elu-
cidated, but at least four factors may be involved, and these may have different
relative importance with different electrodes and materials of different
resistivities (52,53).
These four factors are:
1. The resistance of the electrode material, which is most important with low
resistance test pieces;
2. The sample surface roughness;
3. The resistance due to imperfect contact of the rubber with the electrode
(e.g. air gaps);
LITERATURE REVIEW 19

4. A potential barrier effect; the current is not proportional to voltage and the
apparent resistance (voltage + current) drops sharply as the voltage is
raised.
Many types of contacts have been used by investigators, such as brass
electrodes, tin foil attached with Aquadag, vacuum evaporated gold, etc .. The
brass electrode attached to rubber while the rubber is being vulcanized is
considered the best type of contact by many investigators (46,52,53). Gold
evaporated electrodes are also considered as very good contacts by other in-
vestigators (9,55).
2.8 RESISTANCE AND CAPACITANCE CORRELATIONS
IN CARBON BLACK FILLED RUBBER
Electrical resistivity and dielectric constant of carbon black filled rubber are
very sensitive to externally applied force. Capacitive and conductive behavior
have been shown to be due to the same mechanisms, by Burton and Parris
(54,56), who discuss an equivalent circuit of the carbon black filled rubber.
Citing Parris (54) ,"It will consist of a network of conductive carbon black par-
ticles (above the percolation threshold) and a separate network of "micro"
capacitors. Stress can cause the dimensions of the "micro" capacitors to
change and it can also cause part of the conductive network to break down
LITERATURE REVIEW 20

creating new capacitors.". For any solid that exhibits resistance and
capacitance, the RC product is a constant, i.e. RC= pE (p = electrical resistivity,
E=permittivity). Thus, for a given solid Rex: c- 1 • So an increasing resistance
and a decreasing capacitance (i.e. RC~ constant) are expected when the
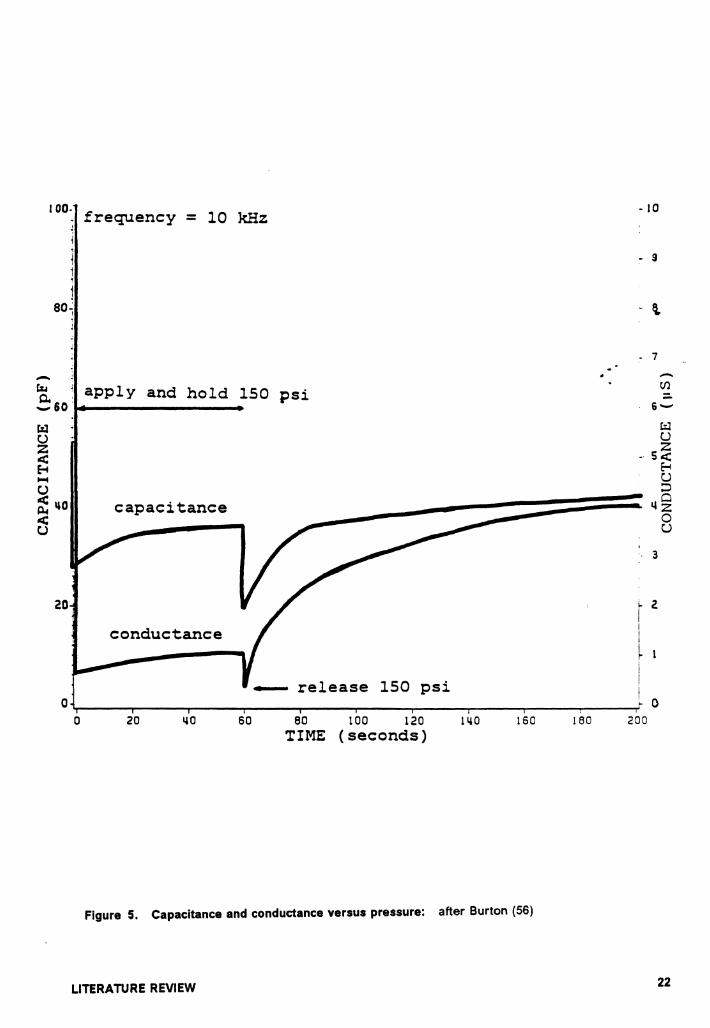
sample is compressed. Similar R and C transients (called "fingerprints" by
Burton and Parris) are shown in Figure 5 for a given carbon black filled rub-
ber. Figure 6 depicts this equivalent circuit for an uncompressed and a com-
pressed sample.
LITERATURE REVIEW 21
I 00- frequency = 10 kHz
80;
- ; apply and hold 150 ~s1· ,e 60 •.., ________ • r
u z < E-4 -
• 10
• 9
7 -en =-t:J u z
5~ C..) ::, u
llO < C.>
capacitance ---------------.-,-::::::=======4~ C..)
20
conductance
3
i 2
I I
I o<r----r---,----r---,---r---.----.----.-----_jl o
0 20 40 60 80 100 120 140 160 !60 200 TIME (seconds)
Figure 5. Capacitance and conductance versus pressure: after Burton (56)
LITERATURE REVIEW 22

/
NETWORK
R
R
R
EQUIVALENT CIRCUIT resistance= 1.5 R capacitance= 2 C
BEFORE COMPRESSIVE LOADING
NETWORK
R
R
EQUIVALENT CIRCUIT resistance= 3 R
capacitance= 1 C
AFTER COMPRESSIVE LOADING
Figure 6. Equivalent circuit for carbon black filled rubber: after Parris (54)
LITERATURE REVIEW 23
3.0 EXPERIMENT AL METHODS AND MA TE RIALS
Carbon black filled samples used in this study were obtained from Akron
Rubber Development Laboratory in Akron, Ohio and from the U.S. Army Ma-
terials Research and Development Laboratory in Fort Belvoir, Virginia. Akron
supplied two sets of samples. These samples contain 30, 40, 50, 60, and 70
pphr (parts of carbon black per hundred parts of rubber) carbon black. Sample
dimensions were .5" (height) x 1.0625" (diameter). The only difference be-
tween these two sample sets is that one set was mill mixed five minutes longer
than the other set (samples marked with suffix A all through this thesis). The
Fort Belvoir samples are of 15 different compositions, of 0.5" x 1" x 1" in di-
mension, with brass plates bonded onto each face during vulcanization to
serve as electrical contacts. The carbon black content of most of the Fort
Belvoir samples is 45 pphr. Sample compositions are listed in Tables 2
through 6.
The following measurements were made on these samples.
EXPERIMENTAL METHODS AND MATERIALS 24

1. RESISTANCE OF "AS RECEIVED" SAMPLES (STATIC)
2. RESISTANCE OF SAMPLES WITH DIFFERENT CONTACTS (STATIC)
3. RESISTANCE VERSUS COMPRESSIVE LOAD
4. RESISTANCE AND STRESS RELAXATION
5. THERMAL RELIEF OF STRESSED SAMPLES
6. ELECTRICAL AND MECHANICAL PROPERTIES AS FUNCTION OF CAR-
BON BLACK CONTENT
7. RESISTANCE AND CAPACITANCE WITH DIFFERENT MIXING TIME
8. STRESS AND STRAIN WITH DIFFERENT MIXING TIME
These experiments are described in more detail in the following sections.
3.1 RESISTANCE OF "AS RECEIVED" SAMPLES (STATIC)
Electrical resistance is used as an important parameter at varied testing con-
ditions throughout this study. It is important to record the resistances of "as
received" rubber samples for later reference.
EXPERIMENTAL METHODS AND MATERIALS 25
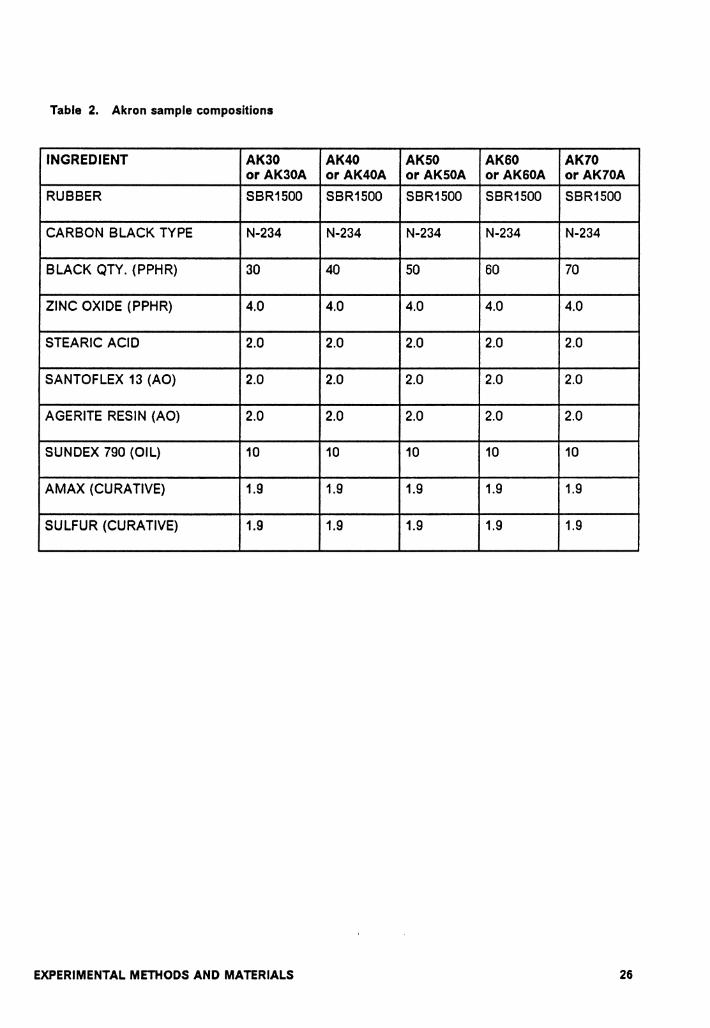
Table 2. Akron sample compositions
INGREDIENT AK30 AK40 AKS0 AK60 AK70 or AK30A or AK40A or AKS0A or AK60A or AK70A
RUBBER SBR1500 SBR1500 SBR1500 SBR1500 SBR1500
CARBON BLACK TYPE N-234 N-234 N-234 N-234 N-234
BLACK QTY. (PPHR) 30 40 50 60 70
ZINC OXIDE (PPHR) 4.0 4.0 4.0 4.0 4.0
STEARIC ACID 2.0 2.0 2.0 2.0 2.0
SANTOFLEX 13 (AO) 2.0 2.0 2.0 2.0 2.0
AGERITE RESIN (AO) 2.0 2.0 2.0 2.0 2.0
SUNDEX 790 (OIL) 10 10 10 10 10
AMAX (CURATIVE) 1.9 1.9 1.9 1.9 1.9
SULFUR (CURATIVE) 1.9 1.9 1.9 1.9 1.9
EXPERIMENTAL METHODS AND MATERIALS 26

Table 3. Fort Belvoir sample compositions
INGREDIENT NAT25A NAT14 NAT1 NAT15
RUBBER NR NR NR NR
CARBON BLACK TYPE N-110 N-110 N-110 N-110
BLACK QTY. (PPHR) 45 45 45 45
SULFUR (PPHR) 0.75 1.5 2.5 5.0
ZINC OXIDE (PPHR) 4.0 4.0 4.0 4.0
STEARIC ACID 2.0 2.0 2.0 2.0
AGERITE RESIN D 0.5 0.5 0.5 0.5
AGERITE WHITE 0.5 0.5 0.5 0.5
ANTOZITE 2 3.0 3.0 3.0 3.0
SANTOCURE 0.8 0.8 0.8 0.8
EXPERIMENTAL METHODS AND MATERIALS 27

Table 4. Fort Belvoir sample compositions (cont.)
INGREDIENT NAT16 NAT18 NAT41
RUBBER NR NR NR
CARBON BLACK TYPE N-220 N-220 N-220
BLACK QTY. (PPHR) 45 45 45
SULFUR (PPHR) 2.5 2.5 2.5
ZINC OXIDE (PPHR) 4.0 4.0 4.0
STEARIC ACID 2.0 2.0 2.0
AGERITE RESIN D 0.5 0.5 0.5
AGERITE WHITE 0.5 0.5 0.5
ANTOZITE 2 3.0 3.0 3.0
SANTOCURE 0.8 0.8 0.8
EXPERIMENTAL METHODS AND MATERIALS 28

Table 5. Fort Belvoir sample compositions (cont.)
INGREDIENT NAT42 NAT44 NAT43 NAT38
RUBBER NR NR NR NR
CARBON BLACK TYPE N-326 N-330 N-351 N-472
BLACK QTY. (PPHR) 45 45 45 45
SULFUR (PPHR) 2.5 2.5 2.5 2.5
ZINC OXIDE (PPHR) 4.0 4.0 4.0 4.0
STEARIC ACID 2.0 2.0 2.0 2.0
AGERITE RESIN D 0.5 0.5 0.5 0.5
AGERITE WHITE 0.5 0.5 0.5 0.5
ANTOZITE 2 3.0 3.0 3.0 3.0
SANTOCURE 0.8 0.8 0.8 0.8
EXPERIMENTAL METHODS AND MATERIALS 29

Table 6. Fort Belvoir sample compositions (cont.)
INGREDIENT NAT57 NAT61 NAT60 NAT22A
RUBBER NR NR NR NR
CARBON BLACK TYPE N-110/XE-2 N-110/XE-2 N-220 N-110
BLACK QTY. (PPHR) 30/10 30/10 60 45
SULFUR (PPHR) 2.5 0.4 0.7 0.4
ZINC OXIDE (PPHR) 4.0 4.0 5.0 4.0
STEARIC ACID 2.0 2.0 2.0 2.0
AGERITE RESIN D 0.5 0.5 2.0 0.5
AGERITE WHITE 0.5 0.5 0.5 -ANTOZITE 2 3.0 - - 5.0
SANTOCURE 0.8 - - -SANTOFLEX 13 - 1.5 - 1.5
VANOX MTI - 0.5 - 0.5
NOVOR 924 - 4.2 7.5 4.2
TM TM MONEX - 1.5 1.6 1.5
SANTOCURE NS - 0.10 0.14 0.08
VULCANOX ZMB - - 2.0 -
EXPERIMENTAL METHODS AND MATERIALS 30

These measurements were made with a FLUKE 8012A Digital Voltmeter (DVM).
Electrical contact was made via two gold plated brass sample stands which
were then connected to the DVM. The brass stands were electroplated by im-
mersing them into "Bright Electroless Gold" solution (TRANSENE Company
Inc.) at 90 ° C for 10 minutes.
3.2 RESISTANCE OF SAMPLES WITH DIFFERENT
CONTACTS (STATIC)
As was previously mentioned, contact resistance tremendously influences the
results of the resistance measurements of carbon black filled rubbers. A va-
riety of contacts such as brass electrode (Fort Belvoir samples only), gold
evaporated coating, copper evaporated coating, aluminum evaporated coat-
ing, NaCl solution, EKG electrocardiography liquid, and silver paint were tried
in this study in order to find a reliable and economical contact. The ease with
which a contact can be made is also very important, as an objective of this
work is that it be applicable to a production line.
For the Fort Belvoir samples, brass electrodes were attached to the rubber (at
Fort Belvoir) while it was being vulcanized. The gold, copper, and aluminum
evaporated coatings were done at VPI in a DENTON VACUUM DV-502 High
Vacuum Evaporator. Gold, copper, aluminum were evaporated thermally onto
EXPERIMENTAL METHODS AND MATERIALS 31

rubber samples. The charge material was placed in a tungsten filament and
evaporation was done under vacuum (about 10-s Torr). The sample was kept
just beneath the evaporation source. The W filament, along with the charge
material, was held between filament posts through which current of around 200
amps at 8 volts was maintained during the course of evaporation. Evaporation
was terminated by rotating a shutter and switching off the filament power
supply. For the silver paint contact, Colloidal Silver Liquid (Cat. #16031 TED
PELLA, Inc.) was painted on rubber by hand.
3.3 RESISTANCE AND STRAIN VERSUS COMPRESSIVE
LOAD
The electrical behavior of the carbon black filled rubber under compressive
loading is of interest in this study, as these materials are often under a
compressive load on a tracked vehicle.
An INSTRON 1331 Dynamic Material Testing Machine (see Figure 7) was used
throughout this study to apply the desired compressive load or strain on the
sample. This system is capable of applying loads to the test sample in the
range of a few pounds to ± 1000 lb .. Test specimens can be cycled from very
low frequency rates (0.001 Hz) to frequencies as high as 200 Hz, and dis-
placement amplitudes range from micro-inches to ± 0.5 inches. A
EXPERIMENTAL METHODS AND MATERIALS 32

HEWLETT-PACKARD 0-10 Volt 6113A DC Power Supply was used to apply a
potential across samples. A KEITHLEY 617 Programmable Electrometer inter-
faced with an IEEE 488 board to an IBM AT Personal Computer collected the
resulting current data and automatically converted it to resistance.
3.4 RESISTANCE RELAXATION AND STRESS
RELAXATION
The rate of stress or strain application on an elastomer material is very im-
portant in a relaxation experiment. At a very fast rate, the material behaves
like a perfect elastic solid, and at an extremely slow rate it acts like a perfect
Newtonian liquid. Accordingly, the rate also influences the electrical proper-
ties, especially at the moment the stress or strain is applied or released.
An intermediate application rate (e.g. ramp from O to 150 pounds in two sec-
onds) was selected on the INSTRON 1331 Material Testing Machine to assure
steady and reproducible electrical and mechanical properties. A KEITHLEY
705 Scanner was used together with a KEITHLEY 617 Programmable
Electrometer to scan through the Load and Strain output channels of the
INSTRON machine and simultaneously the resistance of the sample. In this
way, the mechanical and electrical data were collected simultaneously by the
IBM AT and stored on floppy disks for further analysis and graphical repre-
EXPERIMENTAL METHODS AND MATERIALS 33

~\ Ill
Flgure 7. INSTRON 1331 Dynamic Material Testing Machine: from INSTRON Corp
EXPERIMENTAL METHODS AND MATERIALS 34

sentation. The experiment setup is shown in Figure 8. A HEWLETT PACKARD
4332A LCR Meter was used, and its analog output was also collected through
the 705 Scanner by the AT when capacitance was measured. The computer
software was written with BASICA language in this laboratory. Stress relaxa-
tion was monitored when using constant strain (usually 10 percent strain) and
creep was monitored with constant load (usually 150 lb.).
3.5 THERMAL RELIEF OF STRESSED SAMPLES
It is very important for all samples to be in some equivalent initial microstruc-
tural state when each experiment is started. For example, the resistance in-
creases during compressive loading, and immediately decreases significantly
after pressure removal. This relaxation becomes slower as time progress. It
could take several weeks or months for the sample resistance to come back to
its original value or its original microstructural state. But at higher temper-
ature the relaxation speed is accelerated. Therefore, a 70 ° C heat-treatment
was used on all samples whenever it was desired to return samples to their
original "unstressed" condition.
EXPERIMENTAL METHODS AND MATERIALS 35

EXPERI~1ENTAL SETUP
1Btv1 AT
INSTR:N CCNTR:L CCNS1E
• T
I I
T I II II
A I I I T
N • A
11 i 705
9:ANNER
1331
617 ELECTRJ-
tvlEIER
Figure 8. Experimental setup for electrical and mechanical relaxation
EXPERIMENTAL METHODS AND MATERIALS
.. IIIIA
36
3.6 ELECTRICAL AND MECHANICAL PROPERTIES AS
FUNCTIONS OF CARBON BLACK CONTENT
Resistance and capacitance before, during, and after compressive loading
were measured for the Akron samples for carbon black content ranging from
30 pphr to 70 pphr. A pressure of 150 lb. was applied by the INSTRON Ma-
chine, held for 60 seconds, and released. A two seconds full scale ramp load
application and release rate was chosen for all experiments. Resistance and
capacitance were recorded as mentioned previously. The strain versus time
(with the sample under compressive load) was also recorded.
All samples were then thermally relieved for one hour at 70 ° C and kept in the
oven to cool slowly to room temperature. The experiments were then repeated.
In this case, 10 percent constant strain was used instead of 150 lb. constant
stress. The resistances, capacitances, and stress during constant strain load-
ing were recorded.
3.7 EFFECT OF MIXING TIME
That DC conductivity depends on mixing time has been well known for dec-
ades for carbon black filled rubber (45,52). Electrical resistance and
EXPERIMENTAL METHODS AND MATERIALS 37

capacitance for two sets of Akron samples with different mixing time were
measured to observe the effect of mixing time.
Mechanical properties (e.g. hardness, tensile strength, elongation, etc.) of
carbon black filled rubber are also affected by the mixing time. The stress re-
quired for 10 percent strain deformation, and the strain required for 150 lb.
loading on samples, were monitored on the two sets of Akron samples with
different mixing times.
EXPERIMENTAL METHODS AND MATERIALS 38
4.0 RESULTS AND DISCUSSION
4.1 RESISTANCE OF "AS RECEIVED" SAMPLES (STATIC)
Resistances of samples as received from Akron were very high (approx. 109 to
1010 ohm). Our initial measurement technique used mechanical contacts, but
due to resistance variation, results were irreproducible and inconsistent. This
was caused by dirt, oil stains etc. remaining on the sample suriaces, resulting
in poor electrical contact with samples. As per the sponsor's recommenda-
tion, the samples were cleaned with hexane (C6H14), and resistances were re-
measured. The resistances decreased (approx. 106 to 108 ohm) but were still
irreproducible. It was felt that contact resistance was still a serious problem.
Thus we learned that the measured resistances of bare samples are unreliable
and a suitable material should be applied more directly to the contact suriaces
for reliable and reproducible measurements.
RESULTS AND DISCUSSION 39

4.2 RESISTANCE OF SAMPLES WITH DIFFERENT
CONTACTS (STATIC)
Gold, aluminum or copper evaporated coatings, silver paint, and brass
electrodes attached during vulcanization provided good reliable contacts as
indicated by the static resistance measurements. Tables 7 and 8 show the
static resistances of Akron samples and Fort Belvoir samples with such con-
tacts.
In order to determine the differences between brass electrodes and other
contacts, the brass electrodes of several Fort Belvoir samples were removed
by using a BUEHLER ISOMET Low Speed Saw, and painted with silver paint.
The resistances of these samples with brass electrodes and with silver paint
were almost the same. Table 9 shows the resistances with brass electrode
contact, bare contact (after brass electrode removed), and silver paint contact.
These five metal contacts produce reliable and reproducible results by elimi-
nating undesirable contact reistance. However, aluminum and copper
coatings can readily oxidize and deteriorate. Aluminum and copper coatings
therefore, are not suitable for long term experiments. Table 10 shows the re-
sistances of aluminum and copper coated samples as a function of storage
time after coating. The increase in resistance with time is attributed to
oxidation and deterioration of the contacts.
RESULTS AND DISCUSSION 40
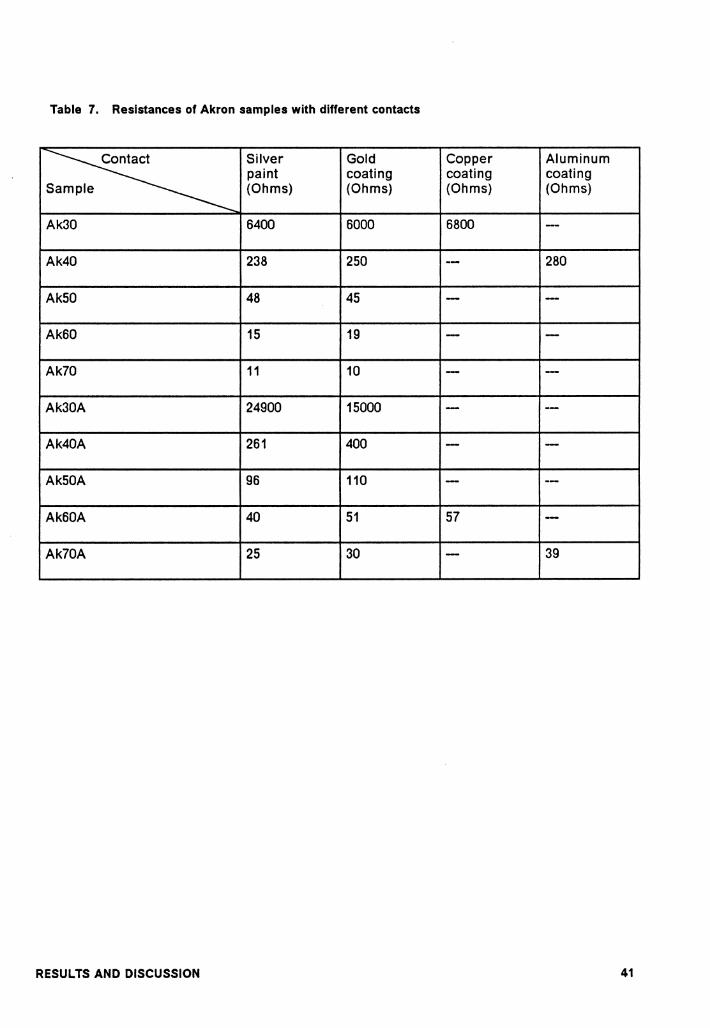
Table 7. Resistances of Akron samples with different contacts
Silver Gold Copper Aluminum paint coating coating coating (Ohms) (Ohms) (Ohms) (Ohms) e
Ak30 6400 6000 6800 -Ak40 238 250 - 280
Ak50 48 45 - --Ak60 15 19 - -Ak70 11 10 - --Ak30A 24900 15000 - --Ak40A 261 400 - -AkS0A 96 110 - --Ak60A 40 51 57 -Ak70A 25 30 - 39
RESULTS AND DISCUSSION 41

Table 8. Resistances of Fort Belvoir samples with brass electrodes
Sample Resistance (Ohms)
NAT25A 293
NAT14 77
NAT1 59
NAT1 59
NAT15 33
NAT16 2500
NAT18 170
NAT41 228
NAT42 774
NAT44 31300
NAT43 14900
NAT38 28
NAT60 11000
NAT57 5.1
NAT22A 90000
RESULTS AND DISCUSSION 42

Table 9. Resistances of Fort Belvoir samples with and without brass contact
Brass Silver Bare Metal Electrodes paint Contacts (Ohms) (Ohms) (Ohms) s
NAT60 11000 20000 7.8E8
NAT16 2500 1400 7.4E7
NAT22 90000 100000 1E8
RESULTS AND DISCUSSION 43

Table 10. Resistances of Akron samples with copper and aluminum contacts for short and long time storage
Resistance Resistance Resistance Oday 3 days 30 days (Ohms) (Ohms) (Ohms) s
Ak30-Cu coating 7000 11000 31000
Ak60A-Cu coating 57 105 23000
Ak40-AI coating 280 390 29000
Ak70A-AI coating 39 95 24000
RES UL TS AND DISCUSSION 44

Liquid contact materials were also investigated. Using a NaCl solution or EKG
Electrocardiography Liquid (used as a contact medium for
electrocardiography) as contacting media resulted in very high contact resist-
ances, in some cases even higher than the bare contact. The measurements
were irreproducible. A comparison of these two contacts with the silver paint
contact is shown in Table 11. Use of these materials for contacts was not fur-
ther pursued.
Therefore, the gold evaporated coating, silver paint, and brass electrodes at-
tached during vulcanization are found to be the most reliable contacts among
the seven contacts tested in this study. However, for potential use on a large
number of samples, silver paint is the most suitable and economical one, as
it can be air dried and used within one minute of application. (The price of the
silver paint is $30.00 per bottle, and can be used on more than one thousand
samples.)
4.3 RESISTANCE AND STRAIN VERSUS COMPRESSIVE
LOAD
According to Bulgin's theory (57), a statistical conductive network is formed
and secured in place during rubber vulcanization. An applied uniaxial
RESULTS AND DISCUSSION 45

Table 11. Resistances of samples with EKG and NaCl solution contacts, as compared to that of silver paint contact
EKG Salt water Silver contact contact paint (Ohms) (Ohms) (Ohms) s
Ak70 12000 25000 11
Ak30 2.5E6 3.3E7 6400
RESULTS AND DISCUSSION 46
compressive stress disrupts the conductive network, and increases the resist-
ance.
In order to determine how resistance and strain varied with pressure on the
sample, we increased the pressure from 0 to 150 lb., in 25 lb. steps, and re-
corded resistance and strain when pressure was applied, and 60 seconds
later, still under load. A maximum of 150 lb. pressure was chosen due to the
possibility of failure of the low carbon black sample at higher pressure. The
results for Akron samples are shown in Figure 9 (resistance versus load) and
in Figure 10 (strain versus load).
As expected, the resistances of all the samples under test increased with in-
crease in pressure. However, the samples with lower initial resistance show
a weaker pressure response than those samples with higher initial resistance.
This is. expected because a sample with a lower initial electrical resistance
must have a higher carbon black content and hence a stronger and denser
conductive network.
The strains also increased with increasing pressure as a general rule when
materials were under compressive load. In addition, a trend similar to those
of resistance versus load was observed. This trend shows the slope of the
"strain versus pressure" plot decreasing with increasing carbon black content.
Such responses are reasonable because the more carbon black in the rubber
the more bonds will be created between carbon black particles and rubber,
RES UL TS AND DISCUSSION 47

Le,(I> H, LDN H3Hl71
I
A H31
'AMI
D H51
I••• 0 H?I
Figure 9. Resistance versus load for Akron samples: Ak30-Ak70 have 30 to 70 pphr carbon black content
RESULTS AND DISCUSSION 48

C ... f • •
.11
, ...... 038-ffll
IAil (U.>
A 031
'A141
a am
I HO 0 H71
Figure 10. Strain versus load for Akron samples: Ak30-Ak70 have 30 to 70 pphr carbon black content
RESULTS AND DISCUSSION 49

and the stronger the composites will be. Sample's electrical resistance and
"compressive resistance" (i.e. Young's modulus) variation with pressure show
similar trends.
Hence, by measuring the slope of the "resistance versus pressure" curve, one
can predict the sample's ''compressive resistance". The smaller the slope of
"resistance versus pressure" curve the weaker the rubber's "compressive re-
sistance".
4.4 RESISTANCE RELAXATION AND STRESS
RELAXATION
It is known that the resistance increases upon compressive loading and de-
creases when the load is removed. How does the resistance relax during ap-
plication of pressure to a sample, and also when the pressure is released ?
This phenomenon is defined as "relaxation". Figure 11 shows the load profile
for resistance relaxation experiments. The time for the increasing pressure
"ramp'' from O to 10 percent strain was 2 seconds. This constant 10 percent
strain was maintained for 60 seconds and then the time for decreasing pres-
sure "ramp" from 10 percent strain to O was again 2 seconds. The typical re-
sistance and stress plots versus time are shown in Figures 12 and 13.
RESULTS AND DISCUSSION 50

X z ... I .. •
STMND STIAIN PIOflLI !,~----------------------------.
1
I
'
Figure 11. Standardized strain profile for testing electrical response
RESULTS AND DISCUSSION 51

TYPICAL RISISTANCI TRANSIOO 1!•,.,..-----------------------------,
11+3
I
" 0
1E+2
RO
Ragion ( ...
Rl
Ragion 8 A
' R3 R2
11,1,·4+---.----.--.................. ...--..... ---.................... .,...--r----,---r--,.,-,-,...,..'1""1 11+1 11+
TINI INS
Figure 12. Typical resistance response with standardized load profile of Figure 11
RES UL TS AND DISCUSSION 52
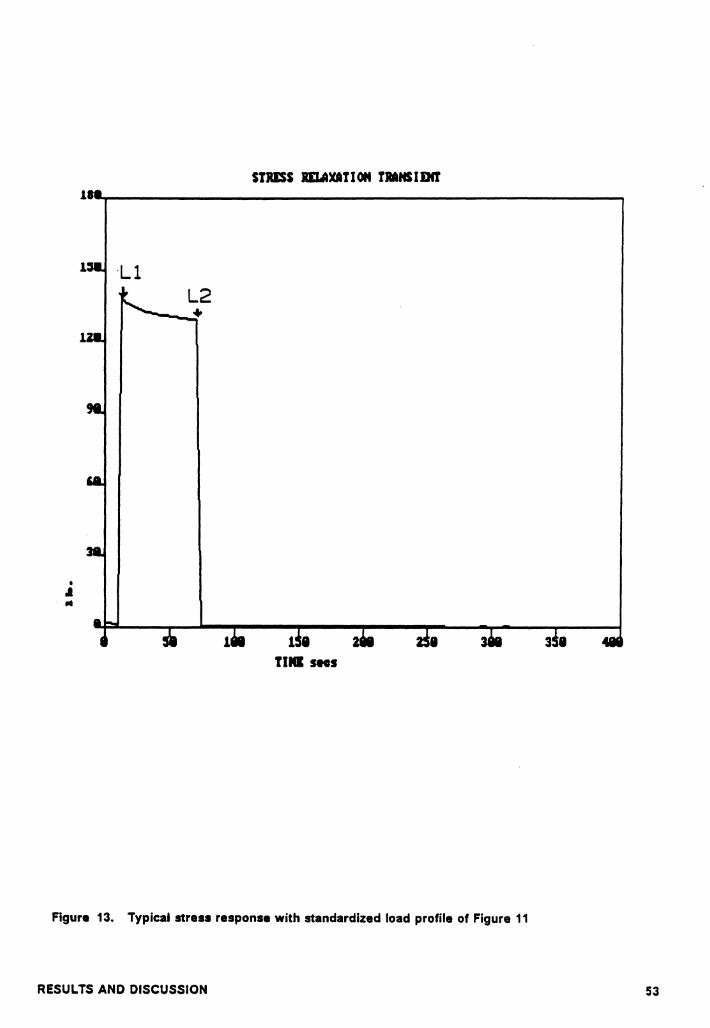
STUSS IIUUCATJ ON TMNS I DIT 11,--..-----------------------------,
• .. .. TINI SNS
Figure 13. Typical stress response with standardized load profile of Figure 11
RESULTS AND DISCUSSION 53

The resistance relaxation curves can be seperated into two parts. They are:
when the sample is under pressure (region A in Figure 12), and after the
pressure is released (region 8 in Figure 12). These two relaxations in general
behave linearly when plotted on log-log paper. This means that resistance R
can be written versus time t as power laws of the form
and
where Ru is the resistance of sample under pressure , Rr is the resistance of
sample after pressure is released, Rua• Rro, nu, and nr are constants. These two
equations have the same form as the resistance relaxation equation of sample
under shear or tensile strain reported in references (48) and (49).
Such relations can also be written as
/ogRu = logRuo - nu log(t)
and
/ogRr = /ogRro - nr log(t)
Numerical values for these two relaxation regions (region A and region B) for
the Akron samples are shown in Tables 12 and 13.
RESULTS AND DISCUSSION 54

Table 12. Numerical values for resistance relaxation in region A for Akron samples
Resistance Relaxation Relaxation Rate Constant Ruo Constant nu
s (Ohms) Ak30 2000000 0.08054
Ak40 8200 0.06328
Ak50 526 0.04516
Ak60 66 0.03681
Ak70 21 0.01955
AK30A 18800000 0.1172
Ak40A 30760 0.08947
Ak50A 29~4 0.0738
Ak60A 555 0.0821
Ak70A 85 0.01465
RESULTS AND DISCUSSION 55
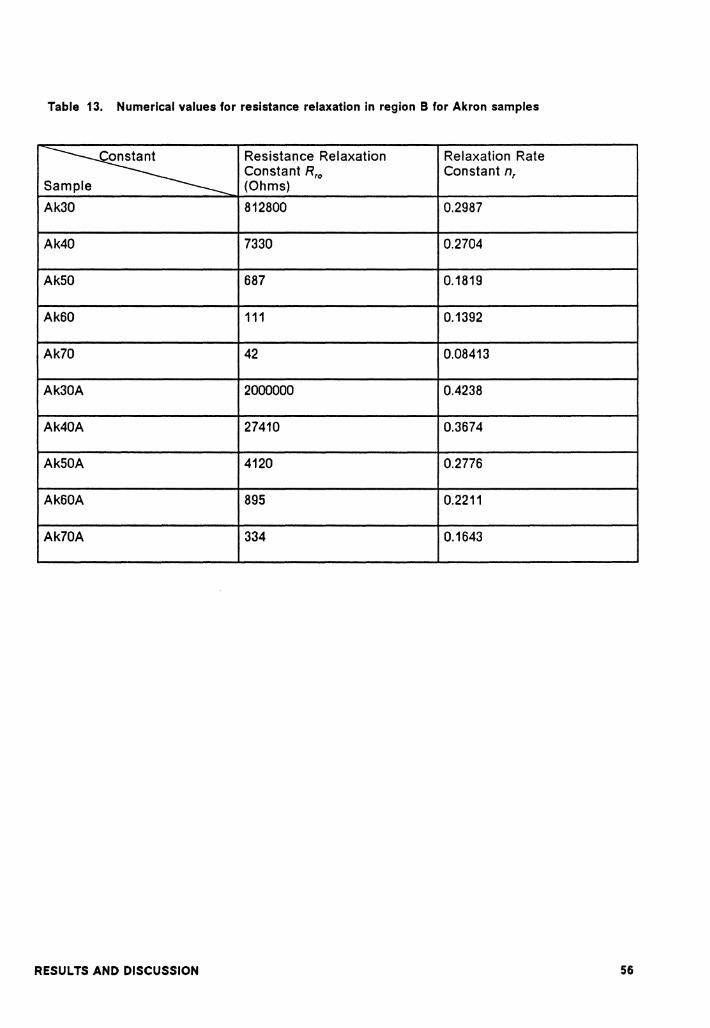
Table 13. Numerical values for resistance relaxation in region B for Akron samples
Resistance Relaxation Relaxation Rate Constant R,0 Constant n,
s p (Ohms) Ak30 812800 0.2987
Ak40 7330 0.2704
AkSO 687 0.1819
Ak60 111 0.1392
Ak70 42 0.08413
Ak30A 2000000 0.4238
Ak40A 27410 0.3674
AkS0A 4120 0.2776
Ak60A 895 0.2211
Ak70A 334 0.1643
RESULTS AND DISCUSSION 56

It is found that the resistance constant Ruo increases with decreasing carbon
black content. This is reasonable because the sample with lower carbon black
content will have weaker conductive network and will be easily broken while
being compressed; its resistance constant Ruo then will be much higher than
those samples with higher carbon black content.
Furthermore, the percentage of broken bonds in the conductive network for
low carbon black samples is obviously larger than that of the high carbon
samples. So, if the broken bonds are rebonded at the same rate for both high
and low carbon samples, the resistance will decrease more rapidly for low
carbon content samples. This is verified by the faster relaxation rate nu for the
low carbon black samples.
After the pressure is released, the partly healed conductive network re-
fractures and the resistance increases to R,0 (the "released resistance con-
stant"). This leads to resistance relaxation (region 8), such as occurred in
region A. But this time the relaxation rate n, is much faster than the previous
nu. This is because in the absence of pressure the carbon blacks will move
more freely, allowing the conductive network to reform much faster than in
region A.
The stress relaxation of samples under constant strain was also measured
(Figure 13). The results followed the previously mentioned empirical equation:
RES UL TS AND DISCUSSION 57
Table 14 shows the numerical values for this measurement on Akron samples.
The stress relaxation rate n, varied between .02 to .03 and an increasing trend
was observed fo,r samples, from low carbon black to high carbon black. The
stress relaxation constant ((10) also increases with increasing carbon black
content. Both transients are more or less as expected, and as reported (24,
32). Higher carbon black loading inside the rubber forms a tougher and denser
network than results from low loading. With this tougher network, the sample
should have higher Young's Modulus (high stress relaxation constant f10 in this
case) and accordingly a faster relaxation rate. This is the trend that is ob-
served.
4.5 THERMAL RELIEF
All the samples investigated in this study were mechanically stressed several
times during the measurements. In order to maintain an "equivalent" initial
state for each new electrical measurement, an appropriate thermal relief of
stressed sample was necessary. As discussed in section 3.5, we thermally re-
lieved the samples at 70 °C for an hour. For example, sample Ak70 had an
initial resistance of 11 ohms which increased to 100 ohms after a 150 lb. pres-
sure test. After heat treating the sample for one hour at 70 °C and cooling it
to room temperature, the resistance dropped to 13 ohms. Parris (54) used the
same method to thermally relieve his samples, and achieved similar results.
RESULTS AND DISCUSSION 58

Table 14. Numerical values for the stress relaxation for Akron samples
Stress Relaxation Relaxation Rate Constant ft0 Constant n.
s (lb.) Ak30 114 0.02387
Ak40 128 0.02686
AkS0 141 0.02723
Ak60 216 0.02999
Ak70 246 0.02935
Ak30A 92 0.02258
Ak40A 121 0.02562
AkS0A 148 0.02913
Ak60A 209 0.0304
Ak70A 217 0.02926
RESULTS AND DISCUSSION 59

4.6 ELECTRICAL AND MECHANICAL PROPERTIES AS
FUNCTIONS OF CARBON BLACK CONTENT
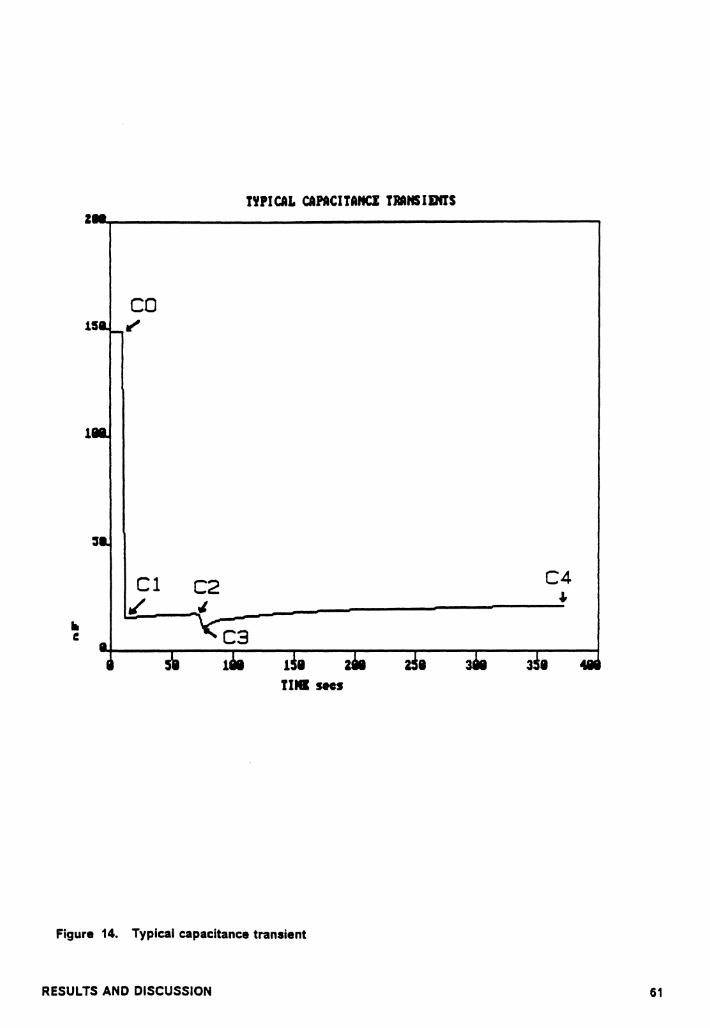
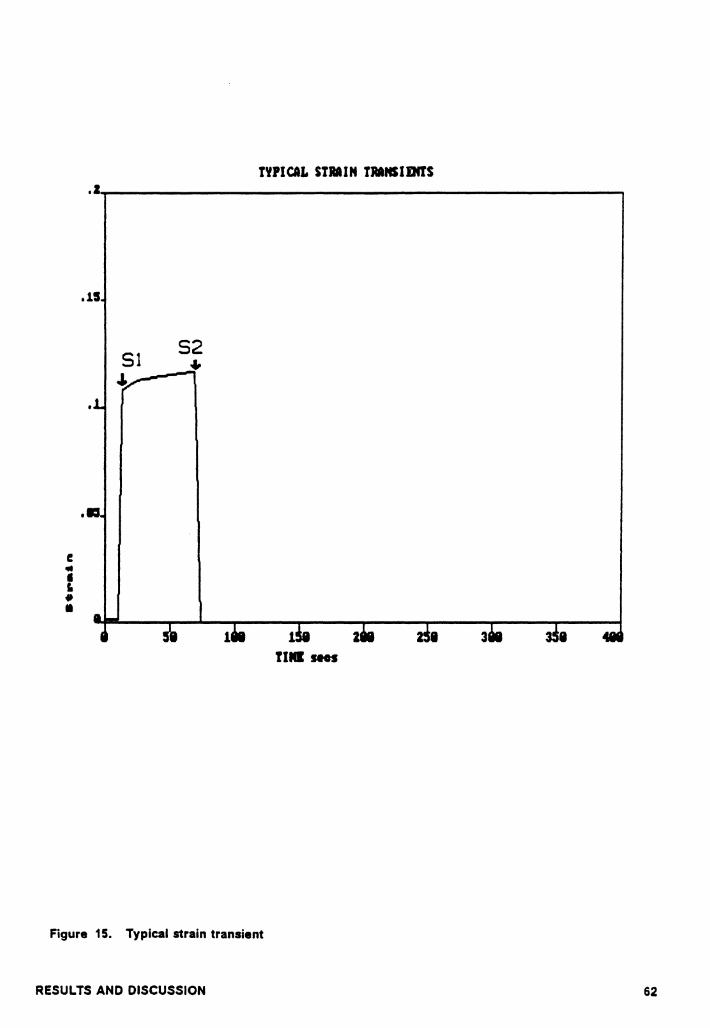
Typical resistance, capacitance, stress (at constant strain), and strain (at con-
stant stress ) transients of the experiments described in section 3.6 are shown
in Figures 12 to 15. Pertinent electrical properties (resistance and capacitance)
and mechanical parameters (stress and strain) for these transients for the
Akron samples are tabulated in Tables 15 to 17.
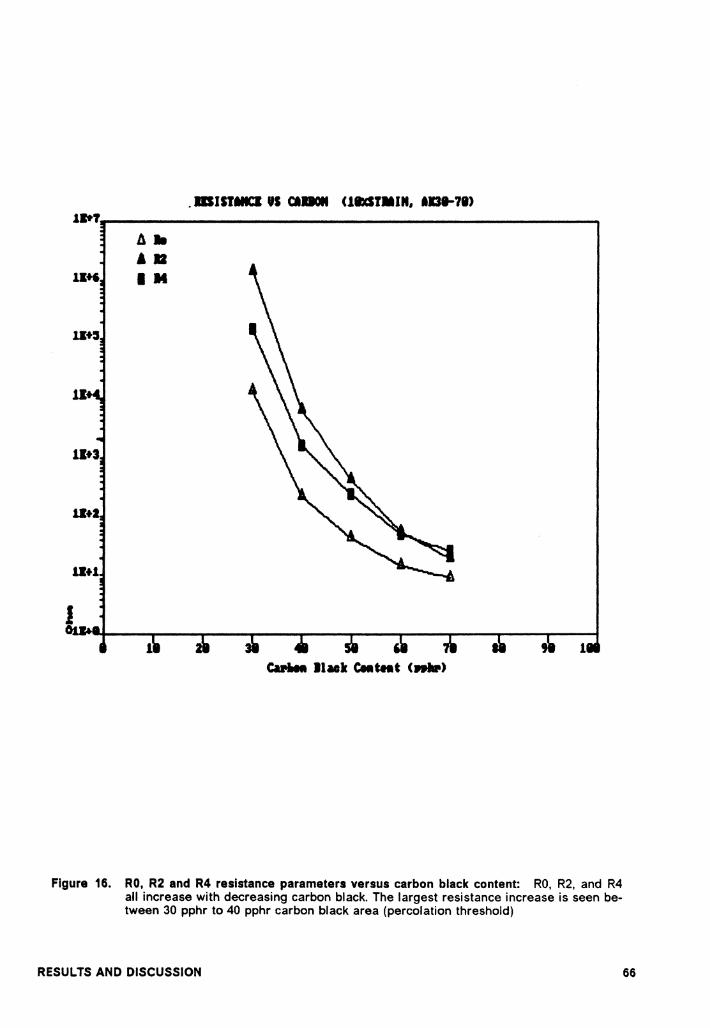
The unstressed resistance value (RO) is shown in Tables 15 and 16. RO in-
creases slowly from approximately 1 O ohms (for 70 pphr) to about 200 ohms
(for 40 pphr) with decreasing carbon black content. RO then rapidly increases
to approximately 104 ohms for the 30 pphr carbon black samples. This indi-
cates that the percolation threshold for both sets of Akron samples is located
between 30 pphr and 40 pphr carbon black. Figures 16 and 17 show the re-
sistance versus carbon black content for the Akron samples. Figures 18 and
19 show the capacitance versus carbon black content for the same samples.
The percolation threshold can also be seen in the 30 pphr to 40 pphr carbon
area of the capacitance versus carbon black curves.
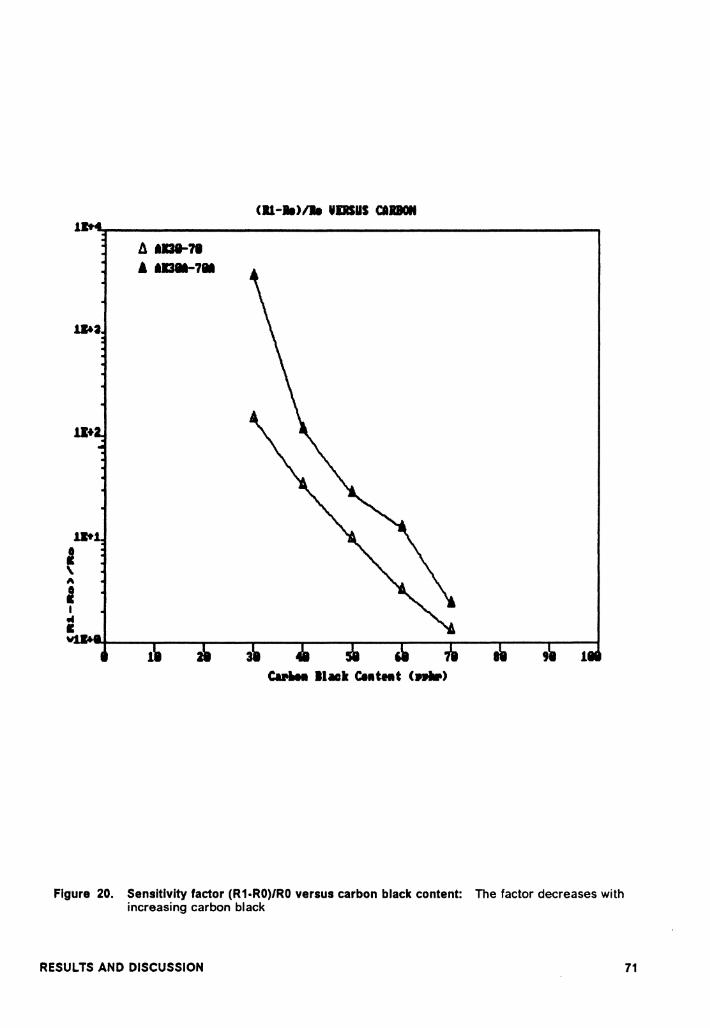
A "sensitivity factor'', defined as (R1-RO)/RO, gives the fractional change in re-
sistance when stress is applied. Figure 20 shows the sensitivity factor versus
the carbon black content of samples. Lower carbon black content sample
RESULTS AND DISCUSSION 60
TYPICAL CAPACITANCI TBANSIDffS 2-..--------------------------,
... e
co 15
1
Cl
TINI INS
Figure 14. Typical capacitance transient
RESULTS AND DISCUSSION
C4 ...
61
TYPICAL STRAIN TMNSIDffS ,1,..,....---------------------------t
e .. • r. • •
,11
...
S2 ,I,
Figure 15. Typical strain transient
RESULTS AND DISCUSSION
TIIII HOS
62
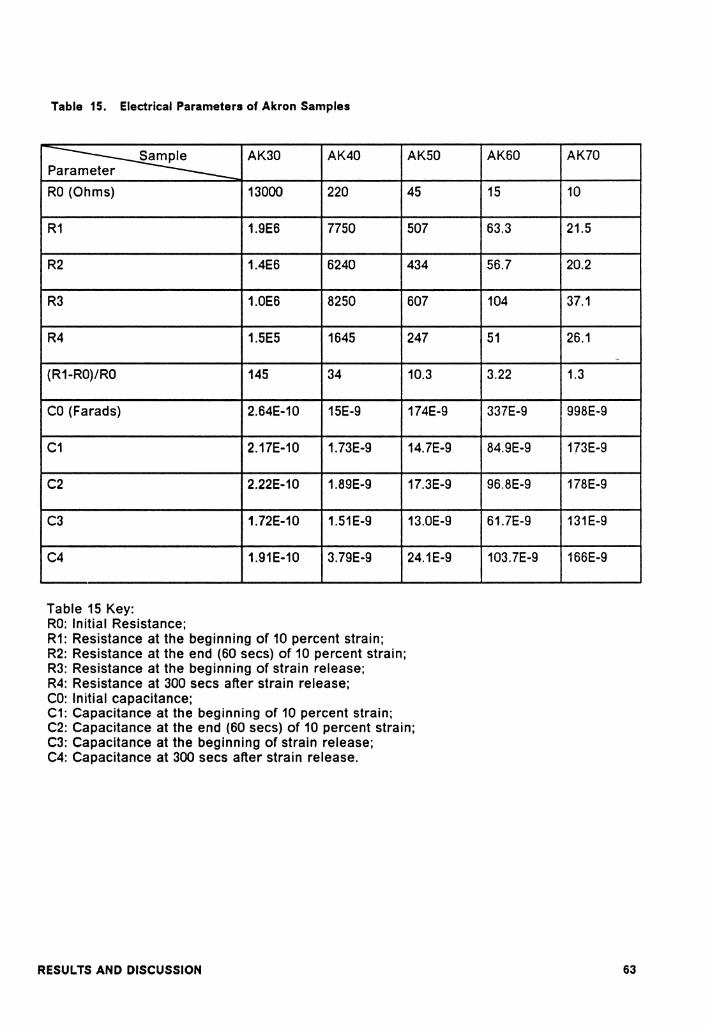
Table 15. Electrical Parameters of Akron Samples
AK30 AK40 p
RO (Ohms) 13000 220
R1 1.9E6 7750
R2 1.4E6 6240
R3 1.0E6 8250
R4 1.5E5 1645
(R1-R0)/R0 145 34
CO (Farads) 2.64E-10 15E-9
C1 2.17E-10 1.73E-9
C2 2.22E-10 1.89E-9
C3 1.72E-10 1.51E-9
C4 1.91E-10 3.79E-9
Table 15 Key: RO: Initial Resistance; R1: Resistance at the beginning of 10 percent strain; R2: Resistance at the end (60 secs) of 10 percent strain; R3: Resistance at the beginning of strain release; R4: Resistance at 300 secs after strain release; CO: Initial capacitance:
AK50
45
507
434
607
247
10.3
174E-9
14.7E-9
17.3E-9
13.0E-9
24.1E-9
C1: Capacitance at the beginning of 10 percent strain; C2: Capacitance at the end (60 secs) of 10 percent strain; C3: Capacitance at the beginning of strain release; C4: Capacitance at 300 secs after strain release.
RES UL TS AND DISCUSSION
AK60 AK70
15 10
63.3 21.5
56.7 20.2
104 37.1
51 26.1 ..
3.22 1.3
337E-9 998E-9
84.9E-9 173E-9
96.8E-9 178E-9
61.7E-9 131E-9
103.7E-9 166E-9
63

Table 16. Electrical Parameters of Akron Samples (cont.)
AK30A AK40A p
RO (Ohms) 4800 247
R1 1.7E7 28300
R2 1.3E7' 20980
R3 1.1E6 32500
R4 1.8E5 3640
(R1-R0)/RO 3540 114
CO (Farads) 2.76E-10 14.4E-9
C1 2.49E-10 1.00E-9
C2 2.52E-10 1.06E-9
C3 1.97E-10 0.92E-9
C4 2.18E-10 2.00E-9
Table 16 Key: RO: Initial Resistance; R1: Resistance at the beginning of 10 percent strain; R2: Resistance at the end (60 secs) of 10 percent strain; R3: Resistance at the beginning of strain release; R4: Resistance at 300 secs after strain release; CO: Initial capacitance;
AKS0A
94
2770
2170
41111
880
28
89.8E-9
2.38E-9
2.93E-9
2.11E-9
5.66E-9
C1: Capacitance at the beginning of 10 percent strain; C2: Capacitance at the end (60 secs) of 10 percent strain; C3: Capacitance at the beginning of strain release; C4: Capacitance at 300 secs after strain release.
RESULTS ANO DISCUSSION
AK60A AK70A
38 25
536 84.8
275 80.8
768 273
262 133
13 2.4
139E-9 170E-9
20.SE-9 71.6E-9
24.6E-9 81.6E-9
11.5E-9 24.1E-9
21.9E-9 42.4E-9
64

Table 17. Mechanical Parameters of Akron Samples
L1(Ib.) L2(Ib.) S1 s p Ak30 108.3 101.1 0.1452
Ak40 125 115 0.1309
Ak50 138.2 129.2 0.1073
Ak60 208 191 0.07473
Ak70 238 220 0.06217
Ak30A 90.4 84 0.1375
Ak40A 119 109 0.138
Ak50A 114 132 0.12076
Ak60A 201 184 0.08514
Ak70A 208.7 192.3 0.0713
Table 17 Key: L 1: Load at the beginning of 10 percent strain (stress relaxation); L2: Load at the end (60 secs) of 10 percen strain; S1: Strain at the beginning of 150 lb. load (creep test); S2: Strain at the end (60 secs) of 150 lb. load; Hardness: Durometer Hardness, supplied by Akron.
RESULTS AND DISCUSSION
S2 Hardness
0.153 60
0.1383 66
0.1206 72
0.08455 77
0.06966 82
0.14113 56
0.1454 64
0.1269 71
0.09105 76
0.0792 80
65
A• •• IN
.mJSTMICI US caDON UIXSTMIN, Al31-71)
CuliN llack CNt.llt <nllP>
Figure 16. RO, R2 and R4 resistance parameters versus carbon black content: RO, R2, and R4 all increase with decreasing carbon black. The largest resistance increase is seen be-tween 30 pphr to 40 pphr carbon black area (percolation threshold)
RESULTS AND DISCUSSION 66

/j lo
'12 I R4
DSISTANCI US CAIION Ul'I.STMIN, AX31A-71A>
81 1 ear .. n lluk Content <Hhr>
Figure 17. RO, R2 and R4 resistance parameters versus carbon black content: RO, R2, and R4 all increase with decreasing carbon black. The largest resistance increase is seen be-tween 30 pphr to 40 pphr carbon black area (percolation threshold)
RESULTS AND DISCUSSION 67

CDCIIANCI US CAIION (JIXSTMIN,AJc3HJc"II) Ji-I~----------------------,----------,
C.
'C2 I C4
CANN llack Cetttetlt (nllP)
Figure 18. CO, C2 and C4 capacitance parameters versus carbon black content: The percolation threshold also can be seen in the 30 pphr to 40 pphr carbon area
RESULTS AND DISCUSSION 68

CAPCITANCI US CARBON (11XSIJIAIN,AX31A-71A> 11-, ____________________________ ....,.
A Co ,a I C4
J
,. 1
lhr1clr CNtent <nllP>
Figure 19. CO, C2 and C4 capacitance parameters versus carbon black content: The percolation threshold also can be seen in the 30 pphr to 40 pphr carbon area
RESULTS AND DISCUSSION 69

gives a much greater sensitivity. The trend of sensitivity factor shows that the
percentage of broken bonds in the conductive network for low carbon black
samples is much higher than for samples with high carbon black content.
The maximum stress (L 1) at 1 O percent strain increases with increasing carbon
black content. Another mechanical property with the same trend as the maxi-
mum stress L 1 is the Durometer Hardness (Durometer Hardness values were
supplied by Akron). Conversely, the maximum strain (S1) at 150 lb. constant
stress decreases with increasing carbon black content. Figures 21 to 23 show
maximum stress (L 1), Durometer Hardness, and strain (S1) versus carbon
black content.
No strong threshold (corresponding to percolation) is seen in the mechanical
properties. However, the consistently varying trend of the mechanical prop-
erties (as well as the electrical properties mentioned above) with increasing
carbon black content provides a technique for estimating the mechanical
properties of samples with varied carbon black content via electrical meas-
urements.
RESULTS AND DISCUSSION 70
<11-11>11a ,mus caDON la-r•~------------------------------,
Figure 20. Sensitivity factor (R1-R0)/R0 versus carbon black content: The factor decreases with increasing carbon black
RESULTS AND DISCUSSION 71

• C :s G •
/J. L1 Al31-78 A L1 Al31M-71M
LIN at lb sbain US CARBON
81 1 lluJc Cent111t (nhP)
Figure 21. L 1 (load required for 10 percent strain) versus carbon black content: L1 increases with increasing carbon black. The same trend is seen for Ourometer hardness (Figure 22)
RESULTS AND DISCUSSION 72

I I • 1 z
MIIIIISS US CdlON 1 ... _____________________________ ___
D Al38-71
Figure 22. Durometer hardness versus carbon black content: Data supplied by Akron Rubber Development Laboratory
RES UL TS AND DISCUSSION 73

.11
" ... .. • V
-= "' • ' • •
STMIN (SU US CAIION KACI <AT 151 lit.>
A 038-71 • Al311-7•
Figure 23. S1 (Strain at 150 lb. load) versus carbon black content: S1 decreases with increasing carbon black
RESULTS AND DISCUSSION 74

4.7 RESISTANCE AND CAPACITANCE CORRELATION
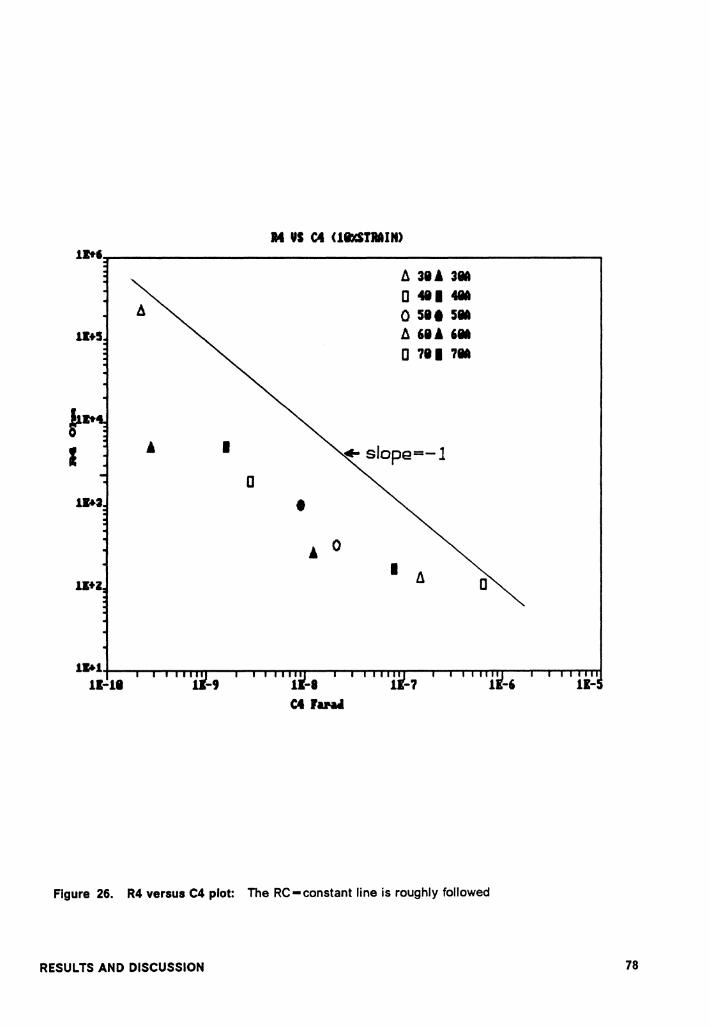
The resistances RO, R2, and R4 listed in Tables 15 and 16 are plotted versus
capacitance CO, C2, and C4 listed in the same tables. These three plots are
shown in Figures 24, 25, and 26.
Most of the data points (except for the 30 pphr samples) lie around the line
with a slope of -1, showing that RC~ constant. This result shows that the
capacitance transients are compatible with resistance transients for the same
samples.
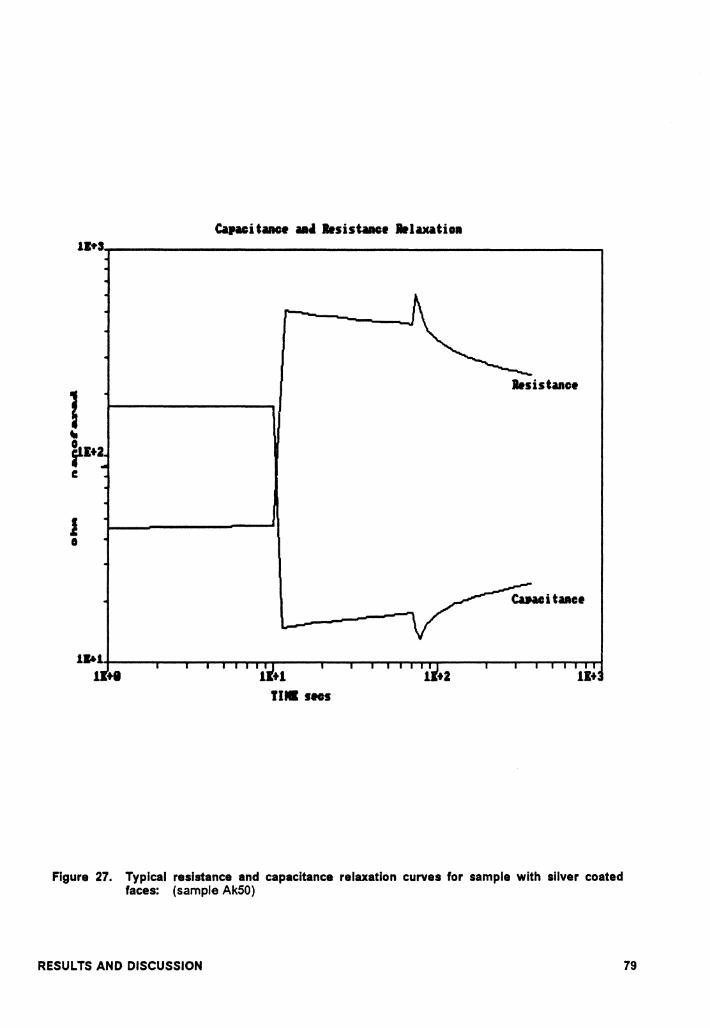
Another resistance and capacitance correlation is seen from the relaxation
measurements. (These relaxation measurements were done using the load
profile shown in Figure 11.) Figure 27 shows the resistance relaxation and
capacitance relaxation transients of the Ak50 sample.
An interesting result was found by observing these figures carefully. The re-
sistance transients and capacitance transients show similar but opposite
shapes, i.e. the inverse of the resistance transient curve appears like the
capacitance transient curve. This similarity between the inverse of resistance
transient and capacitance transient again shows that they are compatible with
each other for the same samples.
RESULTS AND DISCUSSION 75

Ro US Co UIXSTIAIN>
ClfaNII
/J. 31.& 31A a •1 • 0 51t 51A
/J. "" , .. a 111 1•
slope=-1
a
Figure 24. RO versus CO plot: The slope of about -1 verifies that the relation RC-constant is satisfied
RESULTS AND DISCUSSION 76

R2 US C2 UIXSTJIAIN> 11-t-1 _________________________ _
A
CZ FANII
A 31.& 31M a •1 • 0 511 5M A 61.& 6fM a 111 7M
Figure 25. R2 versus C2 plot: The RC- constant line is roughly followed
RESULTS AND DISCUSSION 77
t~ I • I
a
u;+
14 VS C4 UIXSDAJN>
• • 0
/j, 31. 38A a •1 • 0 511 58A
/j, "' ,. 0 711 7M
I fl a
11+1+---,--,,-.--....w---.-...... --...... ------....... ..---....-,.....,. ...... ------~ 11-11
C4 JaNII
Figure 26. R4 versus C4 plot: The RC-constant line is roughly followed
RESULTS AND DISCUSSION 78
Capaci tace •• Jlesistuce •1aution
1 " ~1•2 C
I I
IHisbace
1 .. 1+---..-~~..-.,...,l"'"'\"" ............ --...... ---.-...... T"""'l-.-.,....._--~-T--l'"""'T'-r-.-.-t 1 ti
IHI
Figure 27. Typical resistance and capacitance relaxation curves for sample with silver coated faces: (sample Ak50)
RESULTS AND DISCUSSION 79

As mentioned previously, Burton and Parris have shown that the capacitive
and conductive behavior of carbon black filled rubber under stress are due to
similar mechanisms. The above results confirm this, for a new set of samples.
The equivalent circuit model proposed by Parris (see Figure 6) can also be
used to explain the above capacitance and resistance transients. The
compressive load causes the dimensions of the capacitors in the circuit to
change and can also cause some of the conductive network bonds to fracture,
creating new capacitors (54). Thus, capacitance decreases and resistance in-
creases during compressive loading. After the load is released, the dimen-
sions of the capacitors change again, and the partly healed conductive
network again fractures. The capacitance then decreases and resistance in-
creases again (see Figure 27).
4.8 ELECTRICAL AND MECHANICAL PROPERTIES WITH
DIFFERENT MIXING TIME
That the resistance of carbon black filled rubber increases with greater mixing
time (after the minimum at the very first stage of mixing) has been reported in
literature (see section 2.5.3). This phenomenon was also observed in this
study. This is caused by part of the conductive network breaking down and the
gap widths between network fragments increasing when the compound is
subjected to more mixing.
RESULTS AND DISCUSSION 80
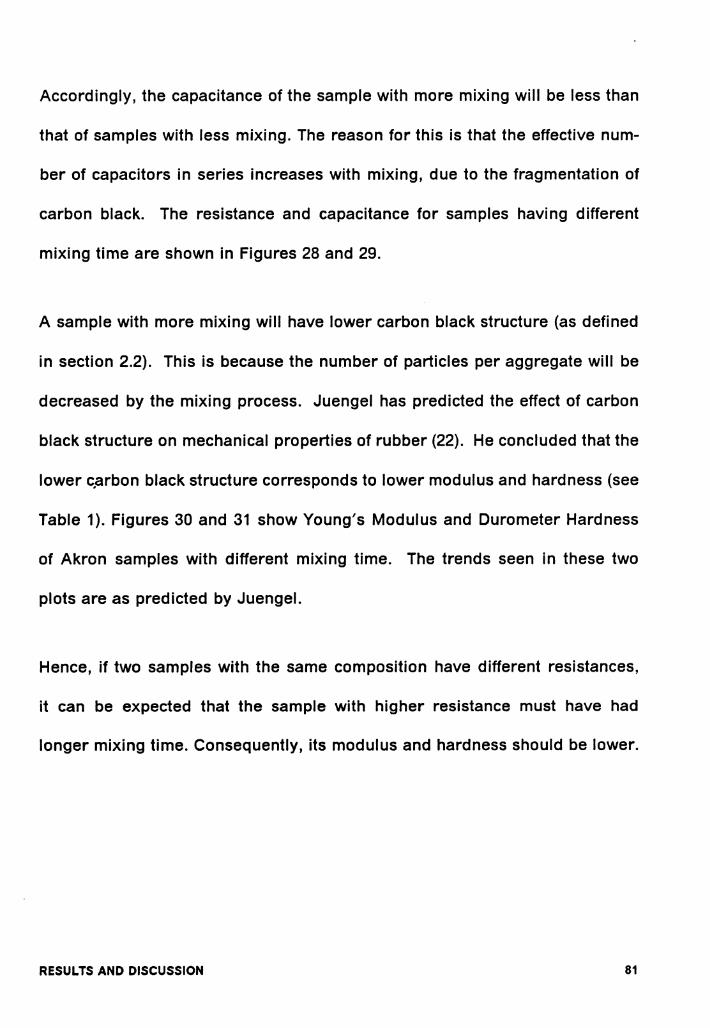
Accordingly, the capacitance of the sample with more mixing will be less than
that of samples with less mixing. The reason for this is that the effective num-
ber of capacitors in series increases with mixing, due to the fragmentation of
carbon black. The resistance and capacitance for samples having different
mixing time are shown in Figures 28 and 29.
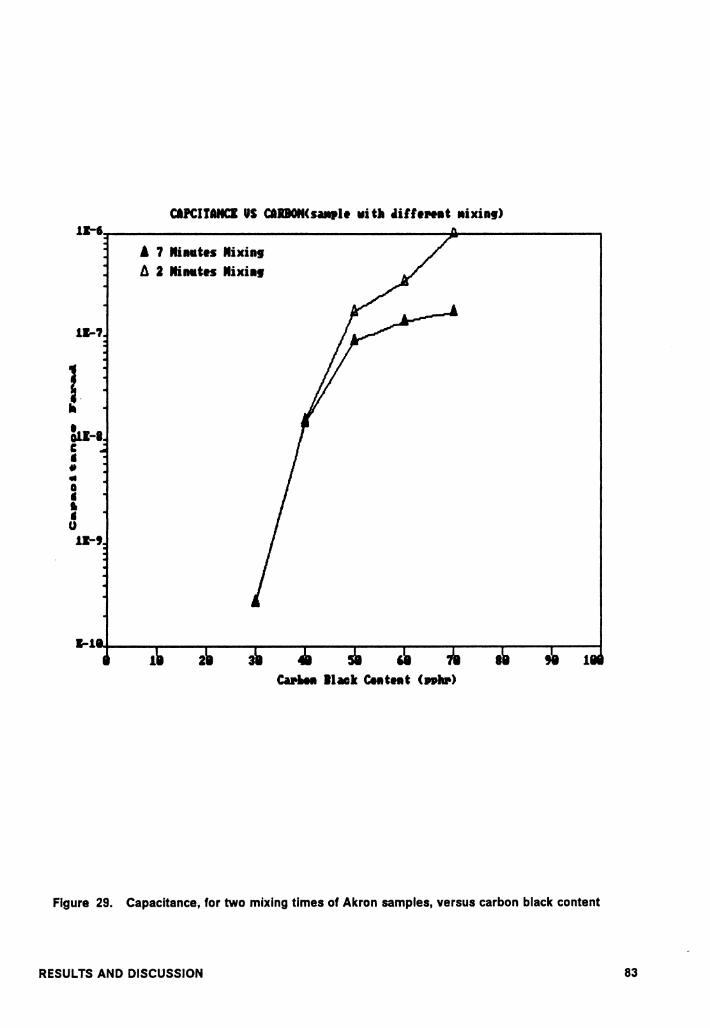
A sample with more mixing will have lower carbon black structure (as defined
in section 2.2). This is because the number of particles per aggregate will be
decreased by the mixing process. Juengel has predicted the effect of carbon
black structure on mechanical properties of rubber (22). He concluded that the
lower c,arbon black structure corresponds to lower modulus and hardness (see
Table 1). Figures 30 and 31 show Young's Modulus and Durometer Hardness
of Akron samples with different mixing time. The trends seen in these two
plots are as predicted by Juengel.
Hence, if two samples with the same composition have different resistances,
it can be expected that the sample with higher resistance must have had
longer mixing time. Consequently, its modulus and hardness should be lower.
RESULTS AND DISCUSSION 81

IISISTANCI VS CARBON(sa1111l• wit• dill•N•t Mixin1>
11+
!
.l 7 Nixin1 A 2 Nixing
CuliN llac• Contat (nb)
Figure 28. Resistance, for two mixing times of Akron samples, versus carbon black content
RESULTS AND DISCUSSION 82
CAPCITANCI US CilBON(sa.,lt wit• •ixing) 1.1-6,~-------------------.----------,
.. Cl • • • u 1.1-,
, 7 Ninatts Nixing 2 Ni1111tu
Figure 29. Capacitance, for two mixing times of Akron samples, versus carbon black content
RESULTS AND DISCUSSION 83
VOU111' s llldtalus ot su,11 11i tit ditt1Nt1t •ixing s-..... ----------------------------
25
I § 0 • 1
1
' 7 llinutes Nixing /j, 2 llimates llixin,
WliH llaclt C..tNt (ffllp)
Figure 30. Young's Modulus for different mixing times of Akron samples
RESULTS AND DISCUSSION 84

MRINDS US CAIIOII COlffllff 1.-------------------------------,
• • • C
1 z
2 Ni•tes NixiDI ' 7 Ni•tes Nlxi11
Figure 31. Durometer Hardness for different mixing times of Akron samples
RESULTS AND DISCUSSION 85

5.0 CONCLUSIONS AND RECOMMENDATIONS
5.1 CONCLUSIONS
Several experiments on carbon black filled rubber were conducted in this
study to establish a correlation between their electrical and mechanical prop-
erties. In summary, the important results of this study are:
1. Mechanical (stress and creep) and electrical (resistance and capacitance)
relaxation experiments used constant stress and constant strain profiles. Each
experiment and each sample type recorded a unique response (relaxation
transient). All sample types measured are distinguishable via their unique re-
laxation transients. This could be useful for sample identification and to mon-
itor changes in characteristics with time.
CONCLUSIONS AND RECOMMENDATIONS 86

2. The two stages of resistance relaxation can be expressed as Ru = Ru0 t-nu
and R, = Rrot-n, , which correspond to a sample under pressure, and when
pressure is released, respectively. The two equations found in this study are
consistent with the equation expressed in the previous study with sample un-
der shear or tensile strain (48,49). The equation of stress relaxation found in
this study is expressed as fr = ftot-ns. This also has been observed by other
investigators (24, 33-36). The relaxation rate constants nu, n,, and ns were
found to vary as a function of carbon black content.
3. The capacitance response is similar to the resistance response for a given
sample type, hence the mechanisms for changes are likely to be the same.
This phenomenon can be seen from the fact that the reverse of the capacitance
transient is similar to the resistance transient, and the fact that RC is constant
(the R versus C plot has roughly "-1" slope). The electrical behavior is de-
scribed by the forming of a conductive network inside the rubber when the
carbon black content is larger than the percolation threshold (30 to 40 pphr for
Akron samples), and by its response to mechanical stimulations. When a car-
bon black filled rubber sample is compressed, the conductive network is bro-
ken, and its resistance increases. In the meantime, the broken network
fragments create more capacitors, and the capacitance then decreases. The
model thus agrees with the observations.
4. At some particular points on the electrical relaxation transients (such as
Ro, R2, R4, Co, C2, C4) and the mechanical relaxation transient (such as L1, L2,
CONCLUSIONS AND RECOMMENDATIONS 87
S1, S2), all vary as a function of carbon black content. This provides a way to
judge the correlations between electrical and mechanical properties of carbon
black filled rubber via the variation of carbon black content.
5. Mixing time affects all the parameters mentioned above. Its effects are
consistent for all parameters. Ro, R2, R4, S1, and S2 are larger with more mixing
time. Co, C2, C4, L1, L2, and hardness are smaller for more mixed samples.
6. Contact resistance is very sensitive to mechanical pressure, especially when
the contact resistance is high (e.g. the contact resistance of bare sample).
Seven types of contacts have been investigated in this study. The silver paint
and gold contacts are found to be as good as the brass electrode contact
which is attached when the rubber is vulcanized.
5.2 RECOMMENDATIONS FOR FUTURE WORK
More information is needed to determine if electrical measurements can be
used as a diagnostic tool for track pad material composition analysis and
processing control. Such information may be obtained by the following exper-
iments.
1. Use the computer controlled INSTRON machine to perform road simulation
on samples, and analyse the resistance and capacitance responses.
CONCLUSIONS AND RECOMMENDATIONS 88

2. Obtain actual tank track pads with field service history. Compare their
electrical parameters with those recorded in above road simulation exper-
iments.
3. Do the relaxation experiments over a temperature range (from -50 ° C to 70
° C for example) to see how the electrical and mechanical parameters change.
4. Obtain samples that vary in carbon black content from 15 pphr to 85 pphr in
steps of 5 pphr to further quantify relations between electrical and mechanical
parameters with the variation of carbon black content.
5. Obtain samples with the same compositions but varied in mixing time to
quantize the relationship between their electrical and mechanical parameters
via the variation of mixing time.
CONCLUSIONS AND RECOMMENDATIONS 89

BIBLIOGRAPHY
1. E.K. Sichel. Carbon Black-Polymer Composites, Marcel Dekker Inc., N.Y., (1982).
2. J.M.G. Cowie. Polymers: Chemistry & Physics of Modern Materials, Inter-national Textbook Company Ltd., Great Britain, (1973).
3. J.A. Manson and L.H. Sperling. Polymer Blends and Composites, Plenum Press, N.Y., (1976).
4. J.B. Dennet and A. Voet. Carbon Black, Marcel Dekker, Inc., N.Y., (1976).
5. L.K.H. Van Beek and B.I.C.F. Van Pal, Carbon, 2, 121 (1964).
6. J. Meyer, Polym. Eng. Sci., 13, 462 (1973).
7. J. Meyer, Polym. Eng. Sci., 14, 706 (1974).
8. P. Sheng, E.K. Sichel, and J.I. Gittleman, Phys. Rev. Lett., 40, 1197 (1978).
9. E.K. Sichel, J.I. Gittleman and P. Sheng, Phys. Rev.,B18, 5712 (1978).
10. R.D. Sherman, L.M. Middleman, and S.M. Jacobs, Polym. Eng. Sci., 23, 36 (1983).
11. S. Kirkpatrick, Rev. of Mod. Phys., 45, 574 (1973).
12. V.K.S. Shante and S. Kirkpatrick, Adv. Phys., 20, 325 (1971).
13. J. Bernasconi, Phys. Rev., B1, 2252 (1973).
14. P. Sheng, Phys. Rev., 1321, 2180 (1980).
15. J.B. Dennet and A. Voet. Carbon Black, Marcel Dekker, N.Y., (1976).
16. G. Kraus, Adv. Polym. Sci., 8 155 (1971).
17. W.S. Stoy and M.D. Garret. Treatise on Coatings, Vol. 3, Pigments, part 1, Chap. 5, Marcel Dekker, N.Y., (1975).
BIBLIOGRAPHY 90
18. ASTM test 02414-76.
19. A. Vote. J. Chem. Phys., 61, 301 (1957).
20. G.E. Wardell, Rubber division ACS 124th Meeting, Houston, Oct. 24-28, 71, 1983.
21. A. Voet, J. Chem. Phys., 51, 1037 (1947).
22. R.R. Juengel, Carbon Black Selection for Rubber Compounding ,TG-76-1 R #2, Cobot Corporation.
23. A.N. Gent, J. Appl. Polym. Sci., Vol VI, 22, 433 (1962).
24. G.R. Cotten and 8.8. Boonstra, J. Appl. Polym. Sci., Vol. 9, 3395 (1965).
25. C.J. Derham and A.G. Thomas, Rubber Chem. Technol., Vol.SO, 397 (1976).
26. A.I. Medalia, Rubber Chem. Technol., 51, 437 (1978).
27. K. Tobisch, Rubber Chem. Technol., 52, 836 (1979).
28. G.B. McKenna and L.J. Zapas, Rubber Chem. Technol., 54, 718 (1981).
29. J.L. Thiele and R.E. Cohen, Rubber Chem. Technol., 56, 465 (1983).
30. U. Meier, J.Kuster, and J.F. Mondell, Rubber Chem. Technol., 67, 254 (1984).
31. Y. lsono and J.D. Ferry, Rubber Chem. Technol., 57, 925 (1984).
32. C.I. Mackenzie and J. Scanlan, Polymer, 25, 559 (1984).
33. P.M. Nichols, R.N. Kienle, and M.C. Clifton, paper presented at the Rubber Division, 145th Meeting, American Chemical Society, N.Y. Sep. 1963.
34. R. Buchdahl and L.W. Nielsen, J. Appl. Phys., 22, 1344 (1951).
35. R.F. Landel and P.J. Stedny, J. Appl. Phys., 31, 1885 (1960).
36. A.V. Tobolsky and M. Takahashi, J. Appl. Polym. Sci., 7, 1341 (1963).
37. G.M. Bartenve, chap. 10, Relaxation Phenomenon in Polymers , G.M. Bartenve and Yu.V. Zelenev editors, Wiley and Sons, N.Y., (1974).
38. G.R. Smoluk, Modern Plast, 41, #12, 119 (1964).
39. A.I. Medalia, Rubber Chem. Technol., 59 452 (1986).
40. H. Kawamoto, Chap. 5, Carbon Black Polymer Composites, E.K. Sichel, editor, Marcel Dekker, N.Y. (1982).
BIBLIOGRAPHY 91
41. A.I. Medalia, Rubber Chem. Technol., 45, 1171 (1972).
42. J. Janzen, J. Appl. Phys., 46 966 (1975).
43. B.B.S.T. Boonstra and Eli M. Dannenberg, Industrial engr. Chem., Jan., 218 (1954).
44. W.F. Verhelst, K.G. Wolthnis, A. Voet, P. Ehrburger, and J.B. Dennet , Rubber Chem. Technol., 50, 735 (1977).
45. R.J. Cembrola, Rubber Chem. Technol., 56, 233 (1983).
46. M. Amin, H.H. Hassan, and E.M. Abdel-Bary, J. Polym. Sci., Vol. 12 2651 (1974).
47. R.J. Cembrola, Polym. Engr. Sci., Vol.22, No.10, 601 (1982).
48. A. Voet, F. R. Cook, and A. K. Sircar, Rubber Chem. Technol., 44, 175 (1971 ).
49. A.K. Sircar, A. Voet, and F.R. Cook, Rubber Chem. Technol., 44, 185 (1971).
50. A. Voet, A.K. Sircar, and T.J. Mullens, Rubber Chem. Technol., 42, 874 (1969).
51. R.H. Norman, Trans. IRI, 27, 276 (1951).
52. R.H. Norman, Conductive Rubber & Plastics, Elesvier Publishing Co. Ltd., (1970).
53. D. Bulgin, Trans. IRI, 21, 188 (1945).
54. D.R. Parris, Electrical Characterization of Carbon Black Filled Rubber, Thesis of Master of Science in Materials Engr., Virginia Tech, (1986).
55. E.K. Sichel, J.I. Gittleman, and P. Sheng, J. Electronic Materials, Vol. 11, 4, 699 (1982).
56. L.C. Burton, paper presented at the Rubber Division, 125th meeting, American Chemical Society, Indianapolis, May (1984).
57. D. Bulgin, Trans. Inst. Rubber Ind., 21, 188 (1945)
58. D.R. Parris and L.C. Burton, to be published in Rubber Chem. Technol.
BIBLIOGRAPHY 92

The two page vita has been removed from the scanned
document.
Page 1 of 2

The two page vita has been removed from the scanned
document.
Page 2 of 2