electric utilities response to climate change environmental federation of oklahoma october 2, 2008...
TRANSCRIPT
Electric Utilities Response to Climate Change
Environmental Federation of Oklahoma
October 2, 2008
Michael MillerDirector, EnvironmentElectric Power Research Institute

2© 2007 Electric Power Research Institute, Inc. All rights reserved.
About EPRI
• Founded in 1973 as an independent, nonprofit center for public interest energy and environmental research.
• Objective, tax-exempt, collaborative electricity research organization
• Science and technology focus--development, integration, demonstration and applications
• Broad technology portfolio ranging from near-term solutions to long-term strategic research
Together…Shaping the Future of Electricity
3© 2007 Electric Power Research Institute, Inc. All rights reserved.
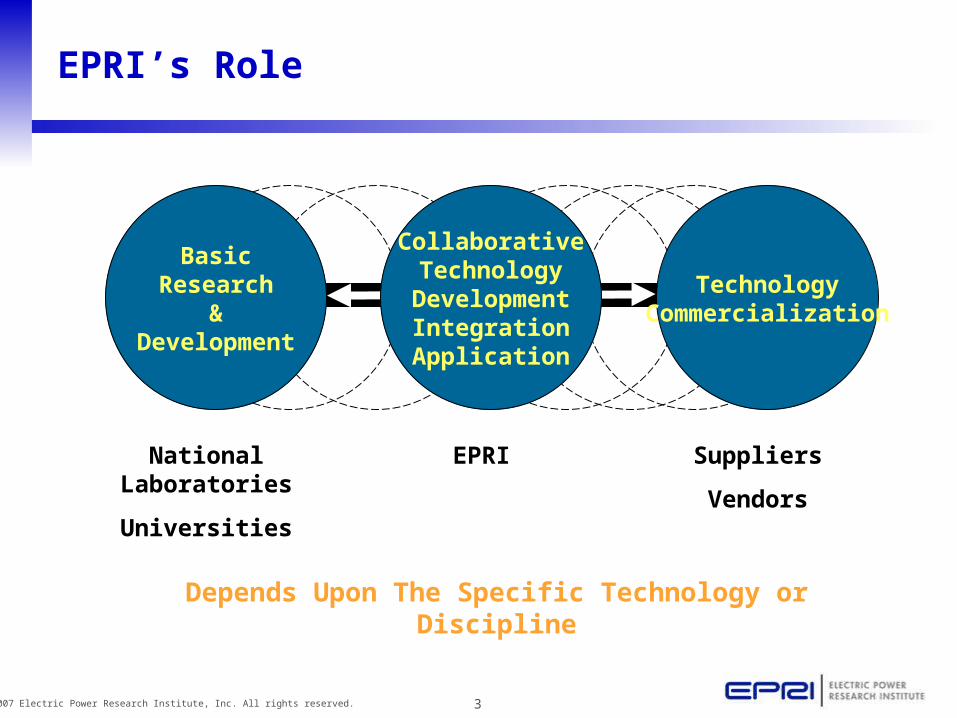
EPRI’s Role
Depends Upon The Specific Technology or Discipline
National Laboratories
Universities
Suppliers
Vendors
EPRI
BasicResearch
&Development
TechnologyCommercialization
CollaborativeTechnology
DevelopmentIntegrationApplication
4© 2007 Electric Power Research Institute, Inc. All rights reserved.
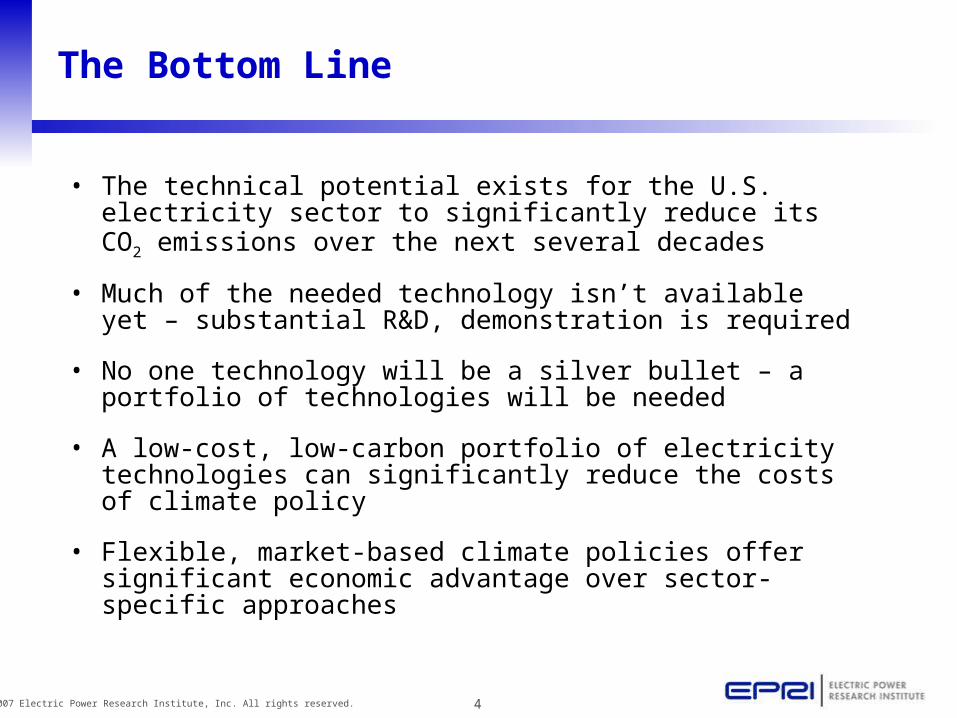
The Bottom Line
• The technical potential exists for the U.S. electricity sector to significantly reduce its CO2 emissions over the next several decades
• Much of the needed technology isn’t available yet – substantial R&D, demonstration is required
• No one technology will be a silver bullet – a portfolio of technologies will be needed
• A low-cost, low-carbon portfolio of electricity technologies can significantly reduce the costs of climate policy
• Flexible, market-based climate policies offer significant economic advantage over sector-specific approaches
5© 2007 Electric Power Research Institute, Inc. All rights reserved.
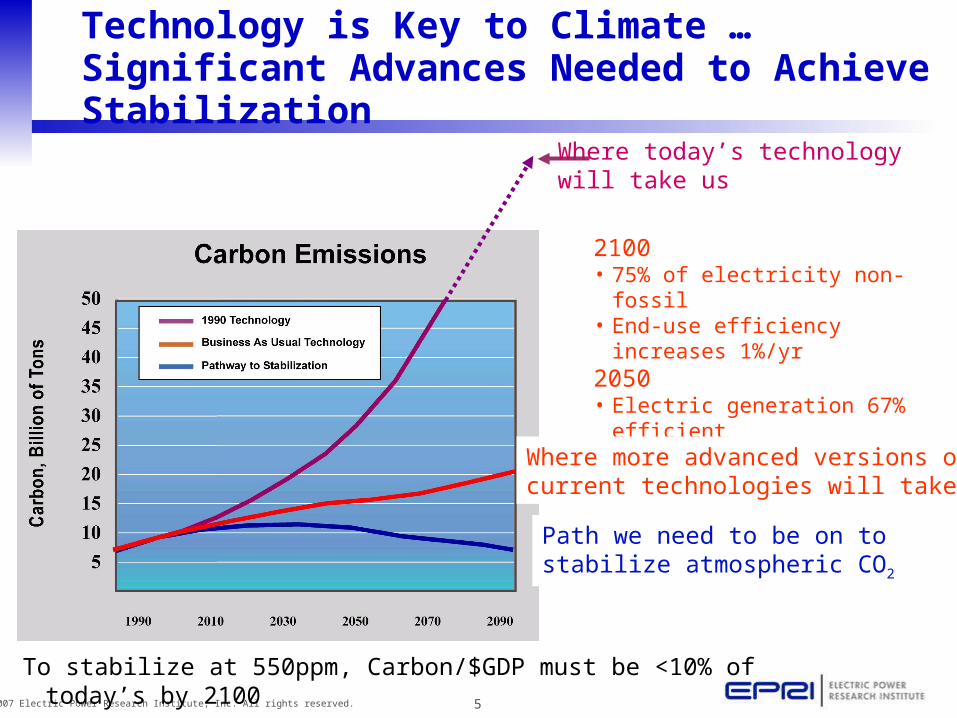
2100• 75% of electricity non-fossil• End-use efficiency increases 1%/yr2050• Electric generation 67% efficient• Passenger vehicles average 50mpg
Stabilization pathway
Technology is Key to Climate … Significant Advances Needed to Achieve Stabilization
To stabilize at 550ppm, Carbon/$GDP must be <10% of today’s by 2100
1300 GT C
480 GT C
Path we need to be on tostabilize atmospheric CO2
Where more advanced versions ofcurrent technologies will take us
Where today’s technologywill take us
6© 2008 Electric Power Research Institute, Inc. All rights reserved.
With accelerated electricity R&D, how quickly can the U.S. electric sector cut
its future CO2 emissions?

7© 2007 Electric Power Research Institute, Inc. All rights reserved.
0
500
1000
1500
2000
2500
3000
3500
1990 1995 2000 2005 2010 2015 2020 2025 2030
U.S
. Ele
ctri
c S
ecto
rC
O2
Em
issi
on
s (m
illio
n m
etri
c to
ns)
U.S. Electricity Sector CO2 Emissions
• Base case from EIA “Annual Energy Outlook 2007”
– includes some efficiency, new renewables, new nuclear
– assumes no CO2 capture or storage due to high costs
Using EPRI deployment assumptions, calculate change in CO2 relative to EIA base case

8© 2007 Electric Power Research Institute, Inc. All rights reserved.
Technology Deployment Targets
Technology EIA 2007 Base Case EPRI Analysis Target*
Efficiency Load Growth ~ +1.5%/yr Load Growth ~ +1.1%/yr
Renewables 30 GWe by 2030 70 GWe by 2030
Nuclear Generation 12.5 GWe by 2030 64 GWe by 2030
Advanced Coal GenerationNo Existing Plant Upgrades
40% New Plant Efficiencyby 2020–2030
150 GWe Plant Upgrades
46% New Plant Efficiency by 2020; 49% in 2030
Carbon Capture and Storage (CCS)
NoneWidely Available and Deployed
After 2020
Plug-in Hybrid Electric Vehicles (PHEV)
None10% of New Vehicle Sales by
2017; +2%/yr Thereafter
Distributed Energy Resources (DER) (including distributed solar)
< 0.1% of Base Load in 2030 5% of Base Load in 2030
EPRI analysis targets do not reflect economic considerations, or potential regulatory and siting constraints.

9© 2007 Electric Power Research Institute, Inc. All rights reserved.
0
500
1000
1500
2000
2500
3000
3500
1990 1995 2000 2005 2010 2015 2020 2025 2030
U.S
. Ele
ctri
c S
ecto
rC
O2 E
mis
sio
ns
(mill
ion
met
ric
ton
s)
EIA Base Case 2007
9% reduction in base load by 2030
Benefit of Achieving Efficiency Target
Technology EIA 2007 Reference Target
Efficiency Load Growth ~ +1.5%/yr Load Growth ~ +1.1%/yr
Renewables 30 GWe by 2030 70 GWe by 2030
Nuclear Generation 12.5 GWe by 2030 64 GWe by 2030
Advanced Coal GenerationNo Existing Plant Upgrades
40% New Plant Efficiency by 2020–2030
150 GWe Plant Upgrades
46% New Plant Efficiency by 2020; 49% in 2030
CCS None Widely Deployed After 2020
PHEV None10% of New Vehicle Sales by 2017;
+2%/yr Thereafter
DER < 0.1% of Base Load in 2030 5% of Base Load in 2030
10© 2007 Electric Power Research Institute, Inc. All rights reserved.
0
500
1000
1500
2000
2500
3000
3500
1990 1995 2000 2005 2010 2015 2020 2025 2030
U.S
. E
lec
tric
Se
cto
rC
O2
Em
iss
ion
s (
mil
lio
n m
etr
ic t
on
s) EIA Base Case 2007
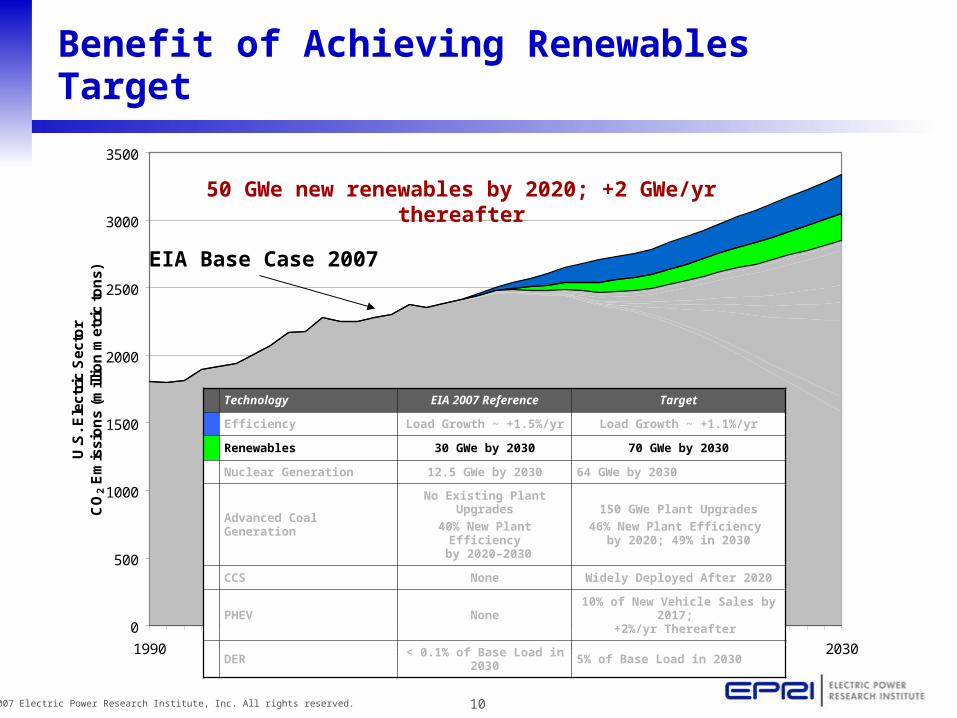
Benefit of Achieving Renewables Target
50 GWe new renewables by 2020; +2 GWe/yr thereafter
Technology EIA 2007 Reference Target
Efficiency Load Growth ~ +1.5%/yr Load Growth ~ +1.1%/yr
Renewables 30 GWe by 2030 70 GWe by 2030
Nuclear Generation 12.5 GWe by 2030 64 GWe by 2030
Advanced Coal GenerationNo Existing Plant Upgrades
40% New Plant Efficiency by 2020–2030
150 GWe Plant Upgrades
46% New Plant Efficiency by 2020; 49% in 2030
CCS None Widely Deployed After 2020
PHEV None10% of New Vehicle Sales by 2017;
+2%/yr Thereafter
DER < 0.1% of Base Load in 2030 5% of Base Load in 2030

11© 2007 Electric Power Research Institute, Inc. All rights reserved.
0
500
1000
1500
2000
2500
3000
3500
1990 1995 2000 2005 2010 2015 2020 2025 2030
U.S
. Ele
ctri
c S
ecto
rC
O2 E
mis
sio
ns
(mill
ion
met
ric
ton
s)
EIA Base Case 2007
Benefit of Achieving Nuclear Generation Target
24 GWe new nuclear by 2020; +4 GWe/yr thereafter
Technology EIA 2007 Reference Target
Efficiency Load Growth ~ +1.5%/yr Load Growth ~ +1.1%/yr
Renewables 30 GWe by 2030 70 GWe by 2030
Nuclear Generation 12.5 GWe by 2030 64 GWe by 2030
Advanced Coal GenerationNo Existing Plant Upgrades
40% New Plant Efficiency by 2020–2030
150 GWe Plant Upgrades
46% New Plant Efficiency by 2020; 49% in 2030
CCS None Widely Deployed After 2020
PHEV None10% of New Vehicle Sales by 2017;
+2%/yr Thereafter
DER < 0.1% of Base Load in 2030 5% of Base Load in 2030
12© 2007 Electric Power Research Institute, Inc. All rights reserved.
0
500
1000
1500
2000
2500
3000
3500
1990 1995 2000 2005 2010 2015 2020 2025 2030
U.S
. Ele
ctri
c S
ecto
rC
O2 E
mis
sio
ns
(mill
ion
met
ric
ton
s)
EIA Base Case 2007
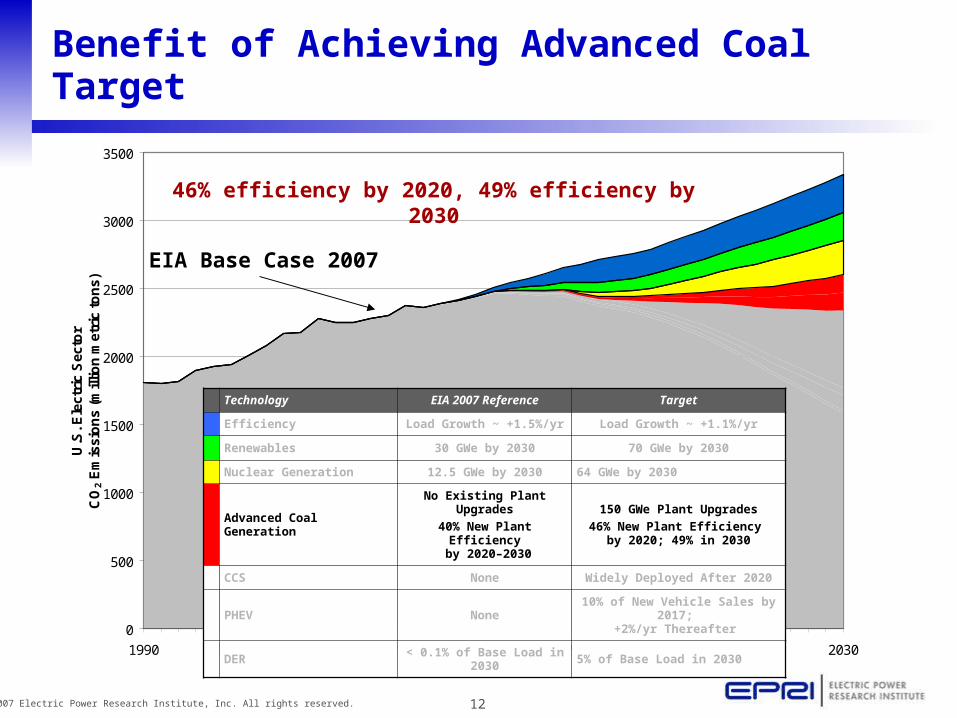
Benefit of Achieving Advanced Coal Target
46% efficiency by 2020, 49% efficiency by 2030
Technology EIA 2007 Reference Target
Efficiency Load Growth ~ +1.5%/yr Load Growth ~ +1.1%/yr
Renewables 30 GWe by 2030 70 GWe by 2030
Nuclear Generation 12.5 GWe by 2030 64 GWe by 2030
Advanced Coal GenerationNo Existing Plant Upgrades
40% New Plant Efficiency by 2020–2030
150 GWe Plant Upgrades
46% New Plant Efficiency by 2020; 49% in 2030
CCS None Widely Deployed After 2020
PHEV None10% of New Vehicle Sales by 2017;
+2%/yr Thereafter
DER < 0.1% of Base Load in 2030 5% of Base Load in 2030

13© 2007 Electric Power Research Institute, Inc. All rights reserved.
0
500
1000
1500
2000
2500
3000
3500
1990 1995 2000 2005 2010 2015 2020 2025 2030
U.S
. Ele
ctri
c S
ecto
rC
O2 E
mis
sio
ns
(mill
ion
met
ric
ton
s)
EIA Base Case 2007
Benefit of Achieving CCS Target
After 2020, all new coal plants capture and store 90% of their CO2 emissions
Technology EIA 2007 Reference Target
Efficiency Load Growth ~ +1.5%/yr Load Growth ~ +1.1%/yr
Renewables 30 GWe by 2030 70 GWe by 2030
Nuclear Generation 12.5 GWe by 2030 64 GWe by 2030
Advanced Coal GenerationNo Existing Plant Upgrades
40% New Plant Efficiency by 2020–2030
150 GWe Plant Upgrades
46% New Plant Efficiency by 2020; 49% in 2030
CCS None Widely Deployed After 2020
PHEV None10% of New Vehicle Sales by 2017;
+2%/yr Thereafter
DER < 0.1% of Base Load in 2030 5% of Base Load in 2030
14© 2007 Electric Power Research Institute, Inc. All rights reserved.
0
500
1000
1500
2000
2500
3000
3500
1990 1995 2000 2005 2010 2015 2020 2025 2030
U.S
. Ele
ctri
c S
ecto
rC
O2 E
mis
sio
ns
(mill
ion
met
ric
ton
s)
EIA Base Case 2007
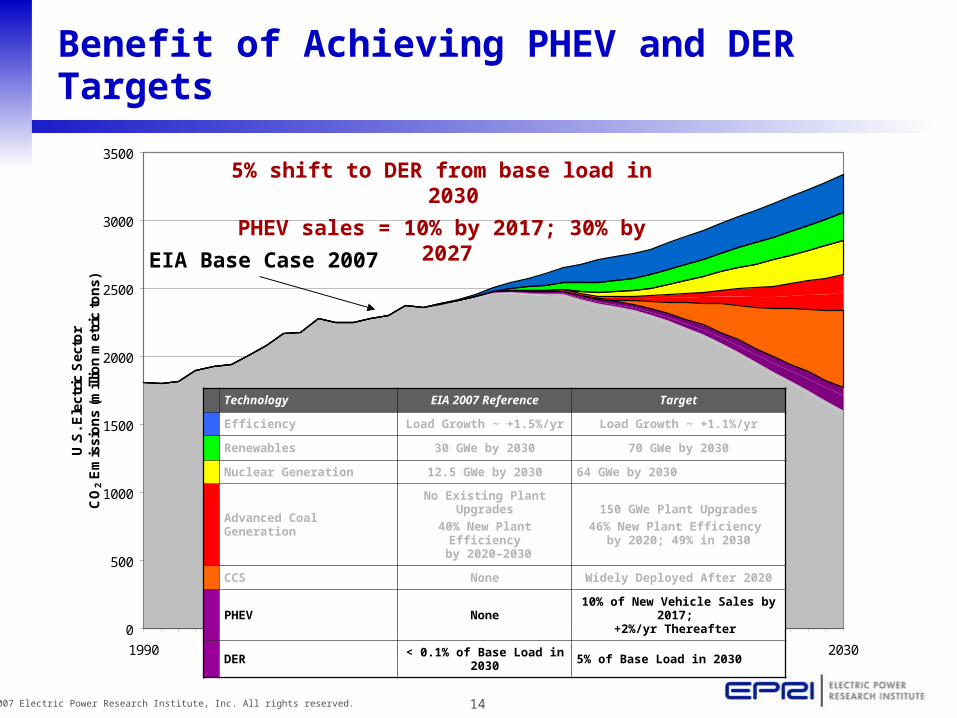
Benefit of Achieving PHEV and DER Targets
5% shift to DER from base load in 2030
PHEV sales = 10% by 2017; 30% by 2027
Technology EIA 2007 Reference Target
Efficiency Load Growth ~ +1.5%/yr Load Growth ~ +1.1%/yr
Renewables 30 GWe by 2030 70 GWe by 2030
Nuclear Generation 12.5 GWe by 2030 64 GWe by 2030
Advanced Coal GenerationNo Existing Plant Upgrades
40% New Plant Efficiency by 2020–2030
150 GWe Plant Upgrades
46% New Plant Efficiency by 2020; 49% in 2030
CCS None Widely Deployed After 2020
PHEV None10% of New Vehicle Sales by 2017;
+2%/yr Thereafter
DER < 0.1% of Base Load in 2030 5% of Base Load in 2030
15© 2007 Electric Power Research Institute, Inc. All rights reserved.
0
500
1000
1500
2000
2500
3000
3500
1990 1995 2000 2005 2010 2015 2020 2025 2030
U.S
. Ele
ctri
c S
ecto
rC
O2 E
mis
sio
ns
(mill
ion
met
ric
ton
s)
EIA Base Case 2007
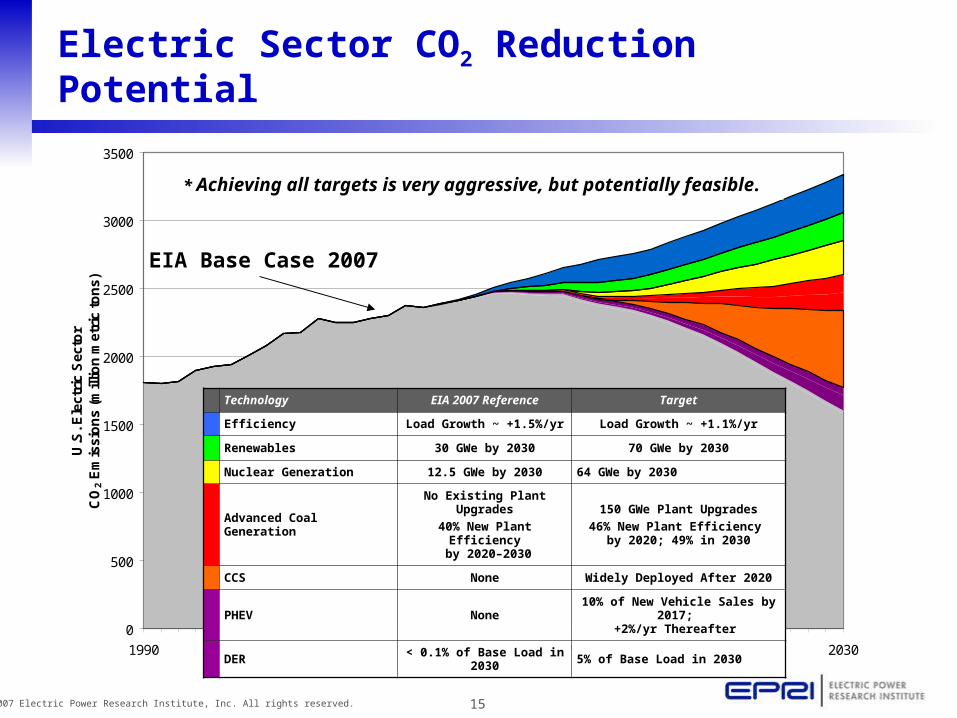
Electric Sector CO2 Reduction Potential
Technology EIA 2007 Reference Target
Efficiency Load Growth ~ +1.5%/yr Load Growth ~ +1.1%/yr
Renewables 30 GWe by 2030 70 GWe by 2030
Nuclear Generation 12.5 GWe by 2030 64 GWe by 2030
Advanced Coal GenerationNo Existing Plant Upgrades
40% New Plant Efficiency by 2020–2030
150 GWe Plant Upgrades
46% New Plant Efficiency by 2020; 49% in 2030
CCS None Widely Deployed After 2020
PHEV None10% of New Vehicle Sales by 2017;
+2%/yr Thereafter
DER < 0.1% of Base Load in 2030 5% of Base Load in 2030
* Achieving all targets is very aggressive, but potentially feasible.

16© 2007 Electric Power Research Institute, Inc. All rights reserved.
0
500
1000
1500
2000
2500
3000
3500
1990 1995 2000 2005 2010 2015 2020 2025 2030
U.S
. Ele
ctri
c S
ecto
rC
O2 E
mis
sio
ns
(mill
ion
met
ric
ton
s)
Technology EIA 2008 Reference Target
Efficiency Load Growth ~ +1.05%/yr Load Growth ~ +0.75%/yr
Renewables 55 GWe by 2030 100 GWe by 2030
Nuclear Generation 15 GWe by 2030 64 GWe by 2030
Advanced Coal Generation
No Heat Rate Improvement for Existing Plants
40% New Plant Efficiency by 2020–2030
1-3% Heat Rate Improvement for 130 GWe Existing Plants
46% New Plant Efficiency by 2020; 49% in 2030
CCS None Widely Deployed After 2020
PHEV None10% of New Light-Duty Vehicle Sales
by 2017; 33% by 2030
DER < 0.1% of Base Load in 2030 5% of Base Load in 2030
Achieving all targets is very aggressive, but potentially feasible
AEO2007*
AEO2008*
AEO2008*
*Energy Information Administration (EIA) Annual Energy Outlook (AEO)
Impact of efficiency measures in Energy Independence and Security Act of 2007 (EISA2007)
Updated EPRI “Prism” for 2008

17© 2008 Electric Power Research Institute, Inc. All rights reserved.
What advanced electricity technologies will be needed in a carbon-constrained
world?

18© 2007 Electric Power Research Institute, Inc. All rights reserved.
Key Technology Challenges
• Expanded Advanced Light Water Reactor Deployment
• Enabling Efficiency, PHEVs, DER via the Smart Distribution Grid
• Enabling Intermittent Renewables via Advanced Transmission Grids
• Advanced Coal Plants with CO2 Capture and Storage
19© 2007 Electric Power Research Institute, Inc. All rights reserved.
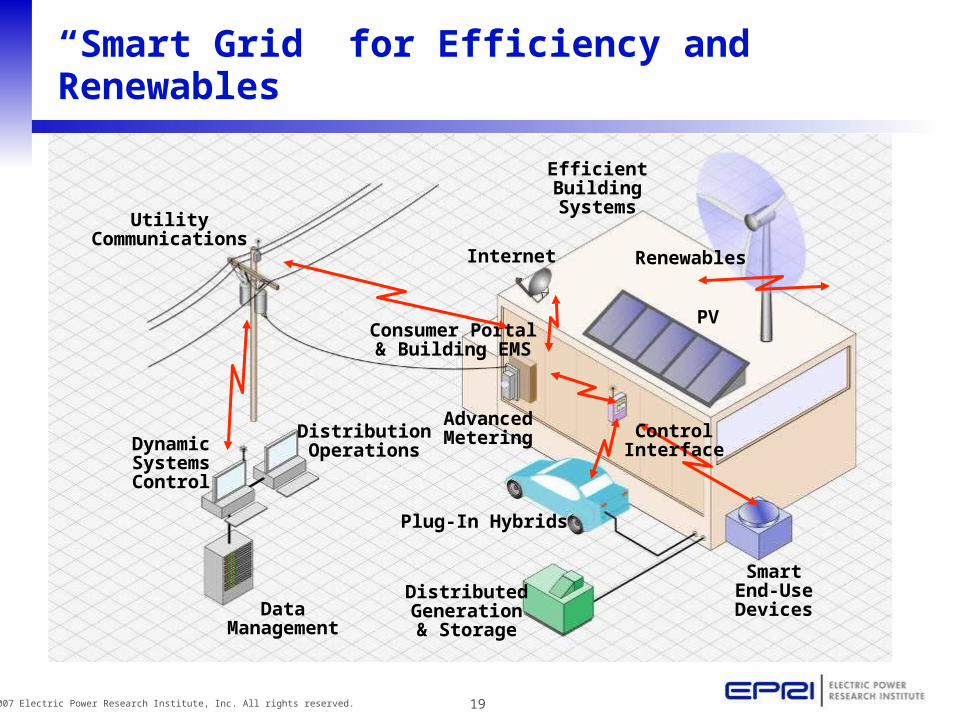
EfficientBuildingSystems
UtilityCommunications
DynamicSystemsControl
DataManagement
DistributionOperations
DistributedGeneration& Storage
Plug-In Hybrids
SmartEnd-UseDevices
AdvancedMetering
Consumer Portal& Building EMS
Internet Renewables
PV
“Smart Grid” for Efficiency and Renewables
ControlInterface
20© 2007 Electric Power Research Institute, Inc. All rights reserved.
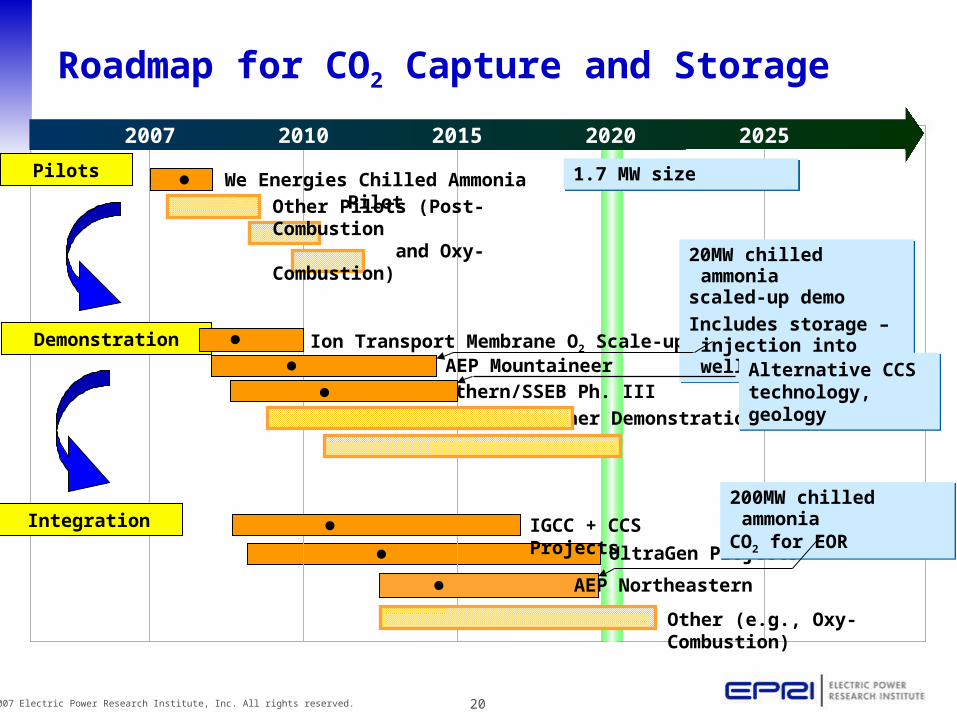
2005 2010 2015 20202007 2010 2015 20252020
We Energies Chilled Ammonia Pilot
Other Pilots (Post-Combustion and Oxy-Combustion)
●Pilots
Demonstration
Integration
Other Demonstrations
AEP MountaineerSouthern/SSEB Ph. III
●●
UltraGen Projects
Other (e.g., Oxy-Combustion)
●IGCC + CCS Projects●
Ion Transport Membrane O2 Scale-up●
AEP Northeastern●
20MW chilled ammoniascaled-up demo
Includes storage – injection into wells
20MW chilled ammoniascaled-up demo
Includes storage – injection into wells
Alternative CCS technology, geologyAlternative CCS technology, geology
200MW chilled ammonia
CO2 for EOR
200MW chilled ammonia
CO2 for EOR
1.7 MW size1.7 MW size
Roadmap for CO2 Capture and Storage
21© 2007 Electric Power Research Institute, Inc. All rights reserved.
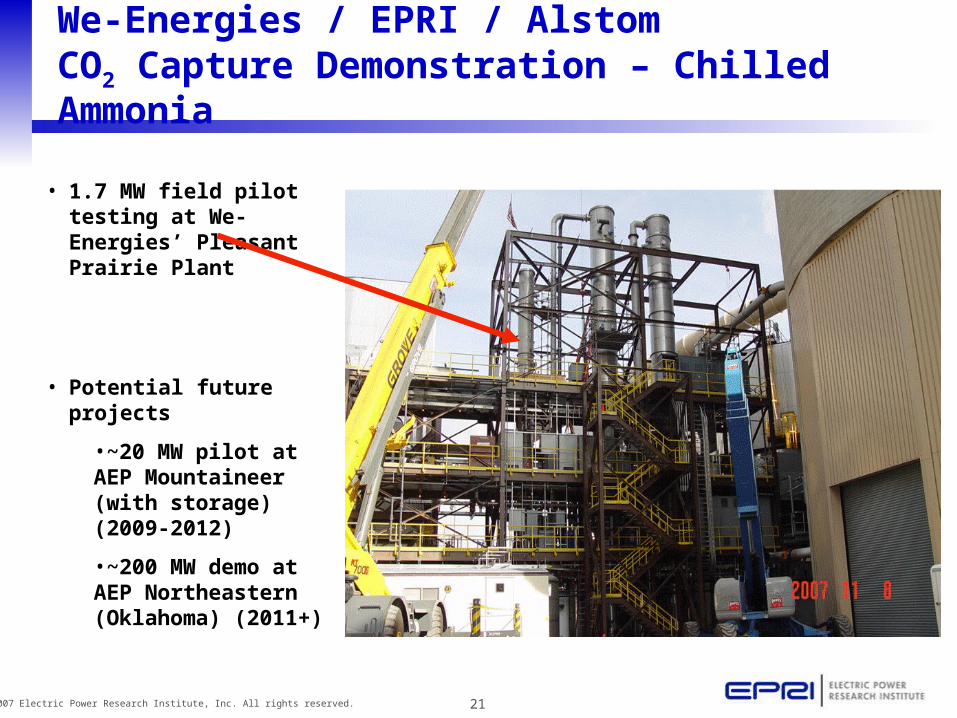
We-Energies / EPRI / Alstom CO2 Capture Demonstration – Chilled Ammonia
• 1.7 MW field pilot testing at We-Energies’ Pleasant Prairie Plant
• Potential future projects
•~20 MW pilot at AEP Mountaineer (with storage) (2009-2012)
•~200 MW demo at AEP Northeastern (Oklahoma) (2011+)
22© 2007 Electric Power Research Institute, Inc. All rights reserved.
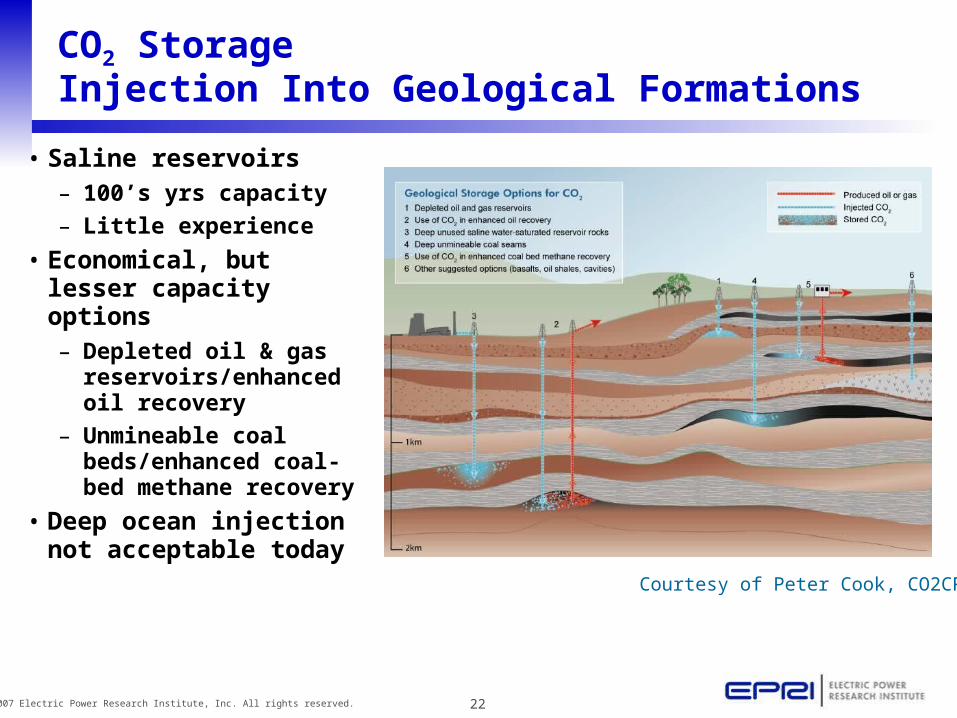
CO2 Storage Injection Into Geological Formations
• Saline reservoirs– 100’s yrs capacity
– Little experience
• Economical, but lesser capacity options– Depleted oil & gas
reservoirs/enhanced oil recovery
– Unmineable coal beds/enhanced coal-bed methane recovery
• Deep ocean injection not acceptable today
Courtesy of Peter Cook, CO2CRC
23© 2007 Electric Power Research Institute, Inc. All rights reserved.
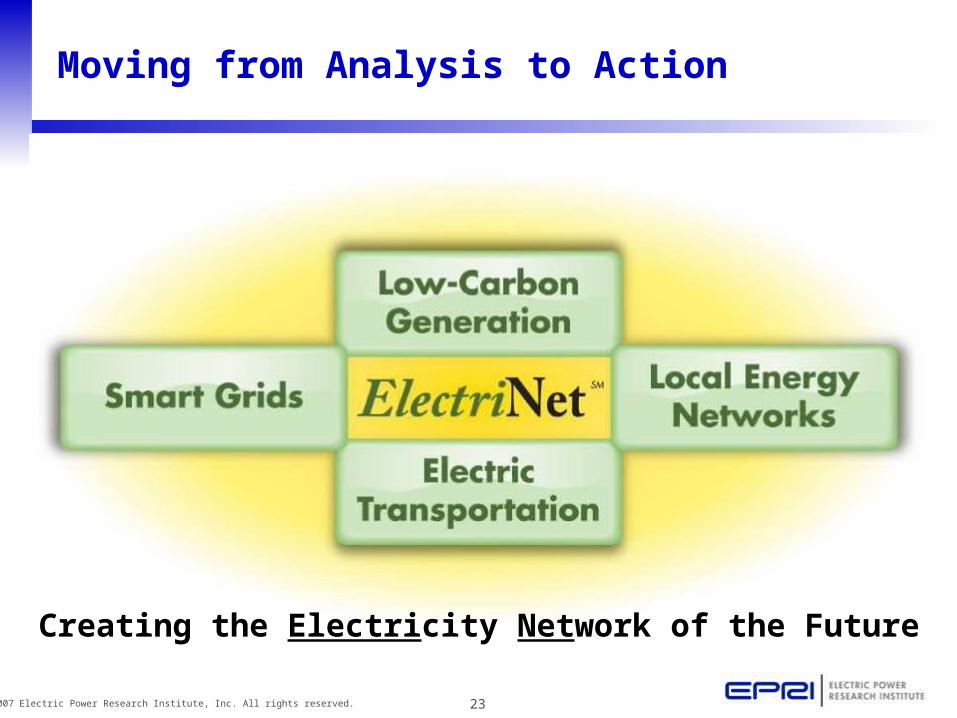
Moving from Analysis to Action
Creating the Electricity Network of the Future
24© 2007 Electric Power Research Institute, Inc. All rights reserved.
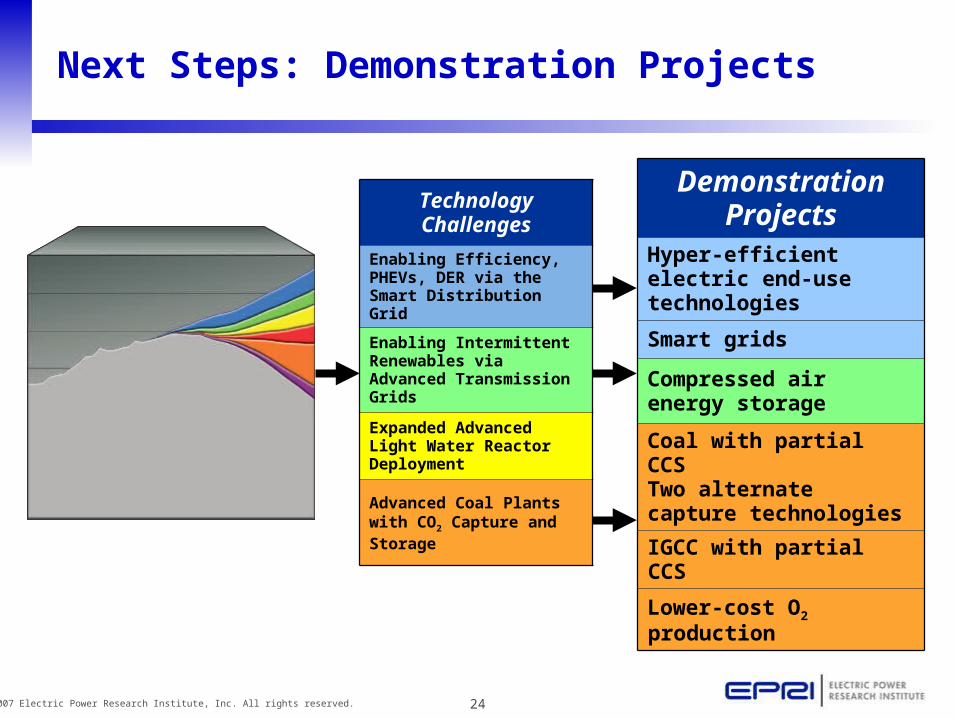
Demonstration Projects
Hyper-efficient electric end-use technologies
Smart grids
Compressed air energy storage
Coal with partial CCSTwo alternate capture technologies
IGCC with partial CCS
Lower-cost O2 production
Technology Challenges
Enabling Efficiency, PHEVs, DER via the Smart Distribution Grid
Enabling Intermittent Renewables via Advanced Transmission Grids
Expanded Advanced Light Water Reactor Deployment
Advanced Coal Plants with CO2 Capture and Storage
Next Steps: Demonstration Projects

25© 2007 Electric Power Research Institute, Inc. All rights reserved.
What is the potential value of these advanced electricity technologies to
the U.S. economy and to consumers?
26© 2007 Electric Power Research Institute, Inc. All rights reserved.
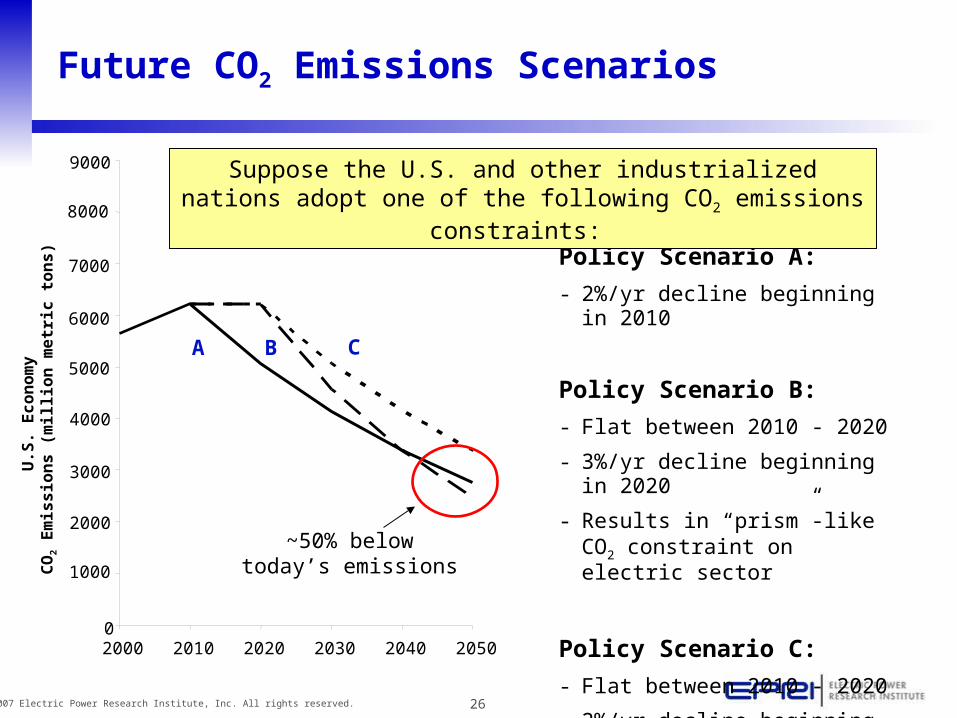
Future CO2 Emissions Scenarios
A CB
Policy Scenario A:
- 2%/yr decline beginning in 2010
Policy Scenario B:
- Flat between 2010 - 2020
- 3%/yr decline beginning in 2020
- Results in “prism”-like CO2 constraint on electric sector
Policy Scenario C:
- Flat between 2010 - 2020
- 2%/yr decline beginning in 2020
Suppose the U.S. and other industrialized nations adopt one of the following CO2 emissions constraints:
0
1000
2000
3000
4000
5000
6000
7000
8000
9000
2000 2010 2020 2030 2040 2050
U.S
. E
co
no
my
C
O2
Em
iss
ion
s (
mil
lio
n m
etr
ic t
on
s)
~50% belowtoday’s emissions
27© 2007 Electric Power Research Institute, Inc. All rights reserved.
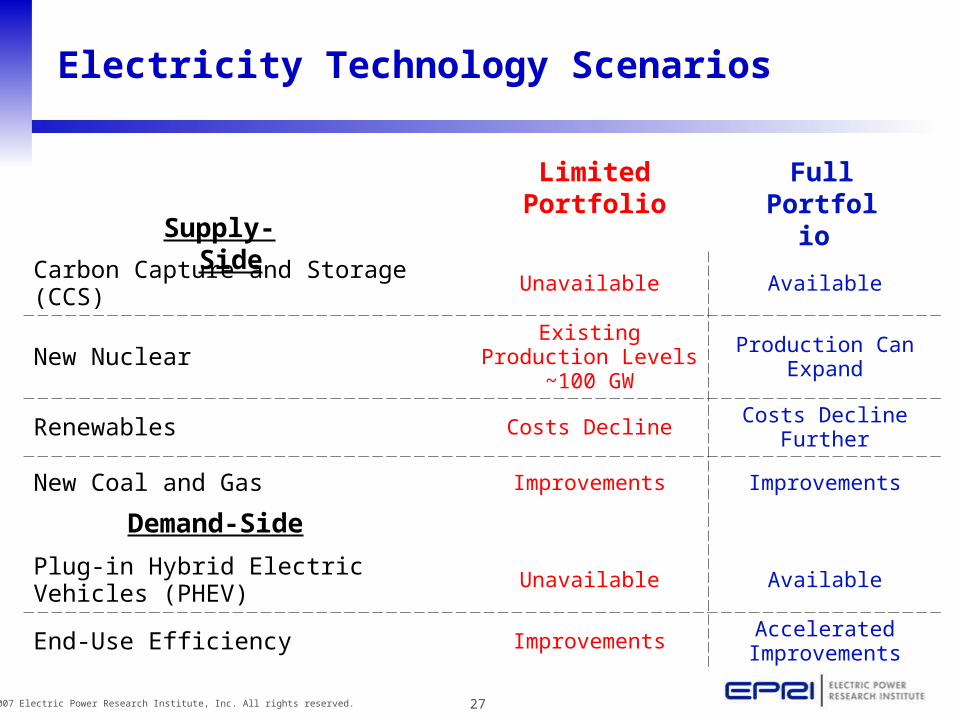
Electricity Technology Scenarios
Supply-Side
Carbon Capture and Storage (CCS) Unavailable Available
New Nuclear Existing Production Levels ~100 GW
Production Can Expand
Renewables Costs Decline Costs Decline Further
New Coal and Gas Improvements Improvements
Plug-in Hybrid Electric Vehicles (PHEV) Unavailable Available
End-Use Efficiency ImprovementsAccelerated
Improvements
Demand-Side
Limited Portfolio
Full Portfolio
28© 2007 Electric Power Research Institute, Inc. All rights reserved.
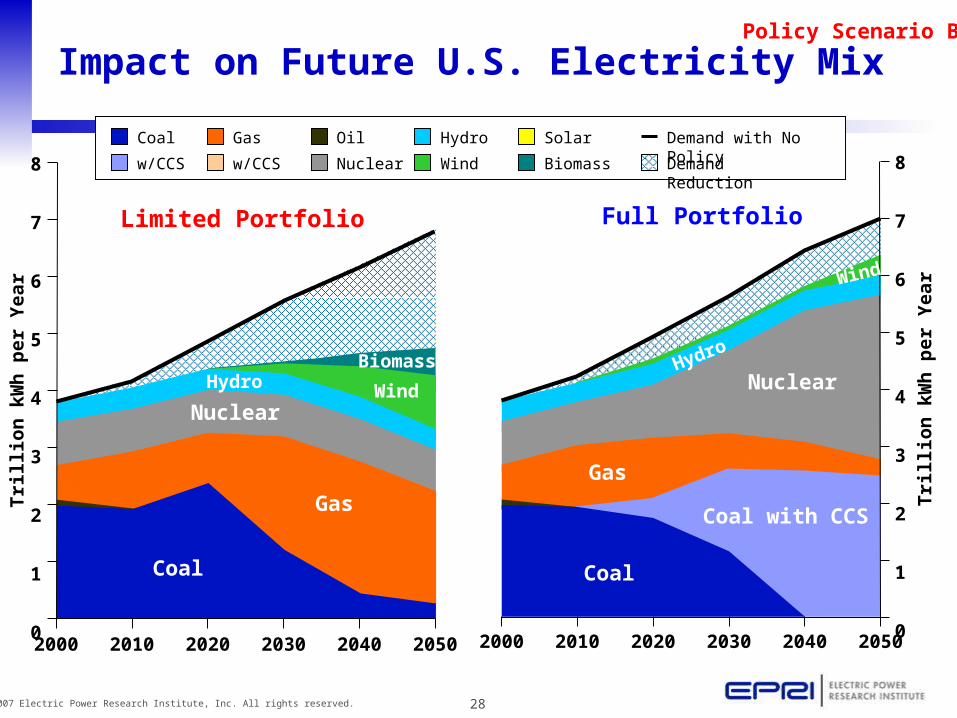
Policy Scenario B
Full Portfolio
8
7
6
5
4
3
2
1
02000 2010 2020 2030 2040 2050
Tri
llio
n k
Wh
per
Ye
ar
8
7
6
5
4
3
2
1
02000 2010 2020 2030 2040 2050
Tri
llio
n k
Wh
per
Ye
ar
Limited Portfolio
Impact on Future U.S. Electricity Mix
Coal
w/CCS
Gas
w/CCS Nuclear
Hydro
Wind
SolarOil
Demand Reduction
Demand with No Policy
Biomass
Coal Coal
Coal with CCSGas
Gas
Nuclear
NuclearHydro
Hydro Wind
Biomass
Wind

29© 2007 Electric Power Research Institute, Inc. All rights reserved.
Policy Scenario B
U.S. Electric Generation in 2030
Limited Portfolio
Total: 4,500 TWh
Full Portfolio
Total: 5,125 TWh
27%
43%
17%
22%
12%
28%
30%
13% 8%
Coal
w/CCS
Gas
w/CCS
Hydro
Other Renewables
30© 2007 Electric Power Research Institute, Inc. All rights reserved.
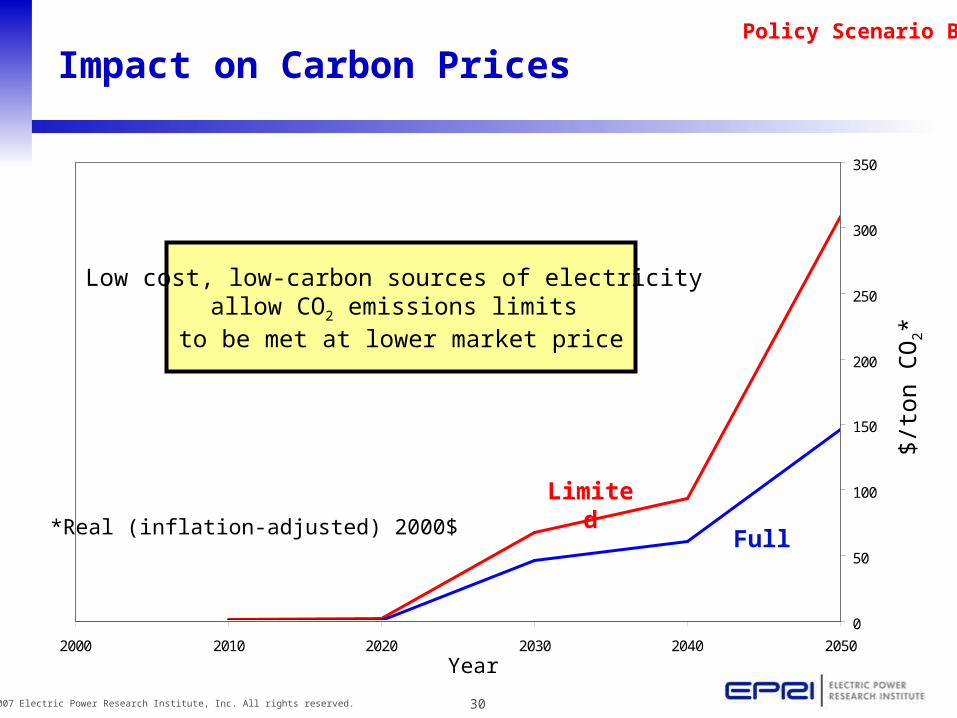
Policy Scenario B
2000 2010 2020 2030 2040 2050
0
50
100
150
200
250
300
350
Full
Limited
$/to
n C
O2*
*Real (inflation-adjusted) 2000$
Impact on Carbon Prices
Year
Low cost, low-carbon sources of electricity allow CO2 emissions limits
to be met at lower market price
31© 2007 Electric Power Research Institute, Inc. All rights reserved.
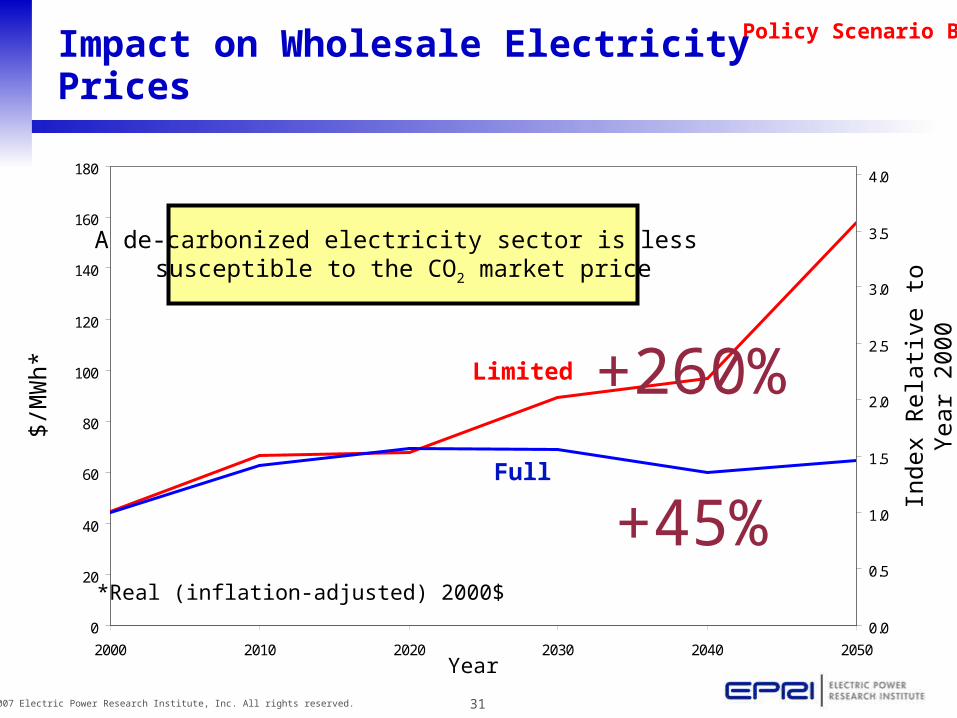
Policy Scenario B
0
20
40
60
80
100
120
140
160
180
2000 2010 2020 2030 2040 2050
0.0
0.5
1.0
1.5
2.0
2.5
3.0
3.5
4.0
Impact on Wholesale Electricity Prices
Full
Limited
$/M
Wh*
Inde
x R
elat
ive
to Y
ear
2000
*Real (inflation-adjusted) 2000$
Year
A de-carbonized electricity sector is less susceptible to the CO2 market price
+260%
+45%

32© 2007 Electric Power Research Institute, Inc. All rights reserved.
Policy Scenario B
Impact on Natural Gas Markets
0
5
10
15
20
25
30
2000 2010 2020 2030 2040 2050 2000 2010 2020 2030 2040 2050
Nat
ura
l G
as C
on
sum
pti
on
(T
CF
)
0
2
4
6
8
10
12
14
Nat
ura
l G
as W
ellh
ead
Pri
ce (
$/M
CF
)
Non-Electric Sector
Electric Sector
Price
Limited Portfolio Full Portfolio
33© 2007 Electric Power Research Institute, Inc. All rights reserved.
Policy Scenario B
-1.5
-1.0
-0.5
0.0
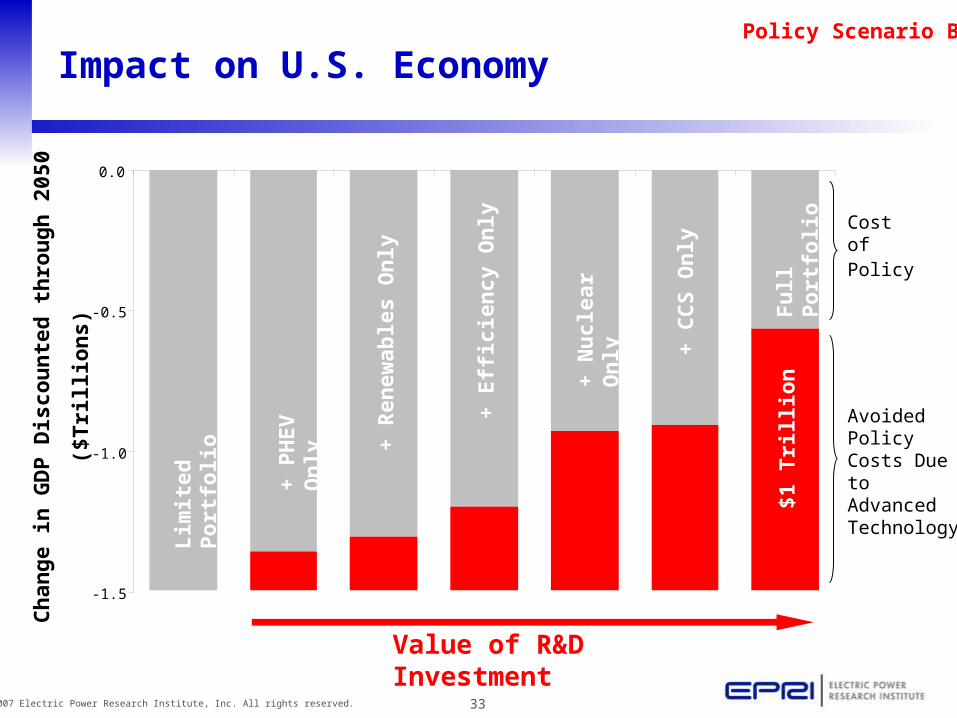
Impact on U.S. EconomyC
han
ge
in G
DP
Dis
cou
nte
d t
hro
ug
h 2
050
($T
rilli
on
s)
Avoided Policy Costs Due to Advanced Technology
Cost of Policy
Fu
ll P
ort
folio
Lim
ited
Po
rtfo
lio
+ P
HE
V O
nly
+ R
enew
able
s O
nly
+ E
ffic
ien
cy O
nly
+ N
ucl
ear
On
ly
+ C
CS
On
ly
Value of R&D Investment
$1 T
rilli
on
34© 2007 Electric Power Research Institute, Inc. All rights reserved.
-2.0
-1.5
-1.0
-0.5
0.0
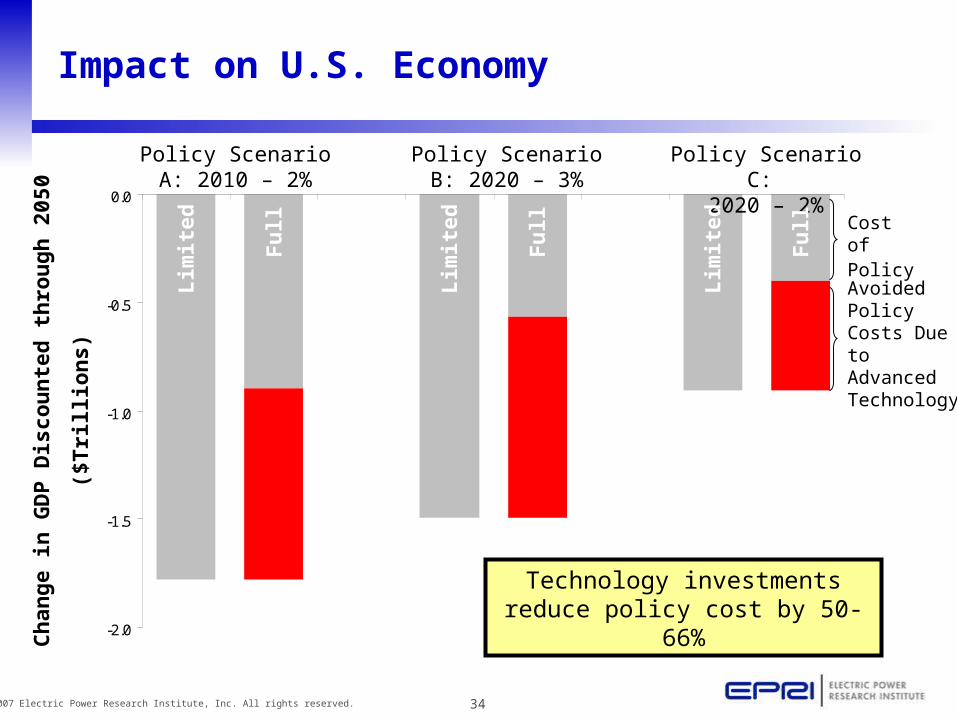
Impact on U.S. EconomyC
han
ge
in G
DP
Dis
cou
nte
d t
hro
ug
h 2
050
($T
rilli
on
s)
Policy Scenario A: 2010 – 2%
Policy Scenario C: 2020 – 2%
Policy Scenario B: 2020 – 3%
Cost of Policy
Technology investments reduce policy cost by 50-66%
Fu
ll
Lim
ited
Fu
ll
Lim
ited
Fu
ll
Lim
ited
Avoided Policy Costs Due to Advanced Technology
35© 2007 Electric Power Research Institute, Inc. All rights reserved.
The Bottom Line (Again)
• The technical potential exists for the U.S. electricity sector to significantly reduce its CO2 emissions over the next several decades
• Much of the needed technology isn’t available yet – substantial R&D, demonstration is required
• No one technology will be a silver bullet – a portfolio of technologies will be needed
• A low-cost, low-carbon portfolio of electricity technologies can significantly reduce the costs of climate policy
• Flexible, market-based climate policies offer significant economic advantage over sector-specific approaches