elec 492 senior design project ii critical design...
TRANSCRIPT

Engineering a Brighter Sudan BRINGING SUSTAINABLE ENERGY TO THE THEOU VILLAGE SCHOOL
ELEC 492 Senior Design Project II
Critical Design Review
A Design Report Submitted by
Emmett Perl, Enrique Rayon, Mou Riiny, Michael Rios
March 22nd, 2011

1 | P a g e
Abstract “Engineering a Brighter Sudan” involves bringing sustainable energy to a primary school in the remote village of Theou, Southern Sudan, where project member Mou Riiny was born. The project consists of specifying, designing, and building a power generation and storage system for the school as well as building a prototype system on campus at the University of San Diego. The prototype system provides electricity to a standard outlet at 230 Volts and 50 Hertz to conform to the standard in Sudan. This can power various loads including lights, laptops, and battery chargers.
We are using a 1.3 kW photovoltaic array on the roof of Loma Hall to provide power for the entire system. These solar panels are connected to a combiner box and wired to a mechanical skid in room 311 in Loma Hall. The mechanical skid houses all of the electrical equipment including a charge controller, inverter, battery bank, breaker box, and all the loads. The charge controller is used to regulate the power flow into our 48 Volt battery bank. The inverter converts the DC power from the solar panels and battery bank into standard AC power that is used to power the loads. The entire system uses a diagnostic program to monitor the system and show power flow in real time.

2 | P a g e
Table of Contents
Abstract ........................................................................................................................................... 1
List of Figures ................................................................................................................................. 3
List of Tables .................................................................................................................................. 4
1. Context and Deliverables ............................................................................................................ 5
2. Design Analysis and Results ....................................................................................................... 6
2.1. System Description .............................................................................................................. 6
2.2. Subsystem Descriptions ....................................................................................................... 9
2.3. Test Plan............................................................................................................................. 23
3. Works Cited .............................................................................................................................. 25
Appendix A: Complete Parts List ................................................................................................. 27
Appendix B: Technical Design Documents .................................................................................. 29
Appendix B.1. Flow Charts and Code ...................................................................................... 29
Appendix B.2. Electrical Safety Design ................................................................................... 31
Appendix B.3. Mechanical Subsystem BOMs and Physical Specifications ............................ 34
Appendix B.4. Mechanical Drawings ....................................................................................... 36
Appendix B.5. Datasheets ......................................................................................................... 50
Appendix B.6. Operation and Maintenance Manual ................................................................ 56
Appendix C: Other Documentation .............................................................................................. 69
Appendix C.1. Schedule ........................................................................................................... 69
Appendix C.2. Budget............................................................................................................... 70
Appendix C.3. Personnel .......................................................................................................... 71

3 | P a g e
List of Figures Figure 1: System Block Diagram .................................................................................................................................... 6
Figure 2: System Layout Diagram .................................................................................................................................. 7
Figure 3: Prototype System on the Roof of Loma Hall ................................................................................................. 10
Figure 4: Power Flow Block Diagram ........................................................................................................................... 11
Figure 5: Power Flow Front Panel ................................................................................................................................ 11
Figure 6: System Wiring Diagram ................................................................................................................................ 14
Figure 7: Raw Data Feed .............................................................................................................................................. 16
Figure 8: Byte Definition Map for Inverter ................................................................................................................... 16
Figure 9: COM Port Error ............................................................................................................................................. 17
Figure 10: Executable File Popup ................................................................................................................................. 17
Figure 11: Power Flow Program Flow Chart ................................................................................................................ 29
Figure 12: Serial Communications Flowchart .............................................................................................................. 30
Figure 13: Diagnostics LabVIEW Code ......................................................................................................................... 30
Figure 14: Skid Assembly Drawing 1 ............................................................................................................................ 36
Figure 15: Skid Assembly Drawing 2 ............................................................................................................................ 37
Figure 16: Skid Assembly Drawing 3 ............................................................................................................................ 38
Figure 17: Skid Assembly Drawing 4 ............................................................................................................................ 39
Figure 18: Skid Assembly Drawing 5 ............................................................................................................................ 40
Figure 19: Skid Assembly Drawing 6 ............................................................................................................................ 41
Figure 20: Skid Assembly Drawing 7 ............................................................................................................................ 42
Figure 21: Skid Assembly Drawing 8 ............................................................................................................................ 43
Figure 22: Skid Assembly Drawing 9 ............................................................................................................................ 44
Figure 23: Skid Assembly Drawing 10 .......................................................................................................................... 45
Figure 24: Skid Assembly Drawing 11 .......................................................................................................................... 46
Figure 25: Skid Assembly Drawing 12 .......................................................................................................................... 47
Figure 26: Skid Assembly Drawing 13 .......................................................................................................................... 48
Figure 27: Skid Assembly Drawing 14 .......................................................................................................................... 49
Figure 28: OutBack Inverter Datasheet ....................................................................................................................... 50
Figure 29: OutBack Charge Controller Datasheet ........................................................................................................ 51
Figure 30: Combiner Box Datasheet ............................................................................................................................ 52
Figure 31: FlexWare 500 Datasheet ............................................................................................................................ 53
Figure 32: OutBack MATE Datasheet .......................................................................................................................... 54
Figure 33: OutBack HUB Datasheet ............................................................................................................................. 54
Figure 34: FlexNET DC Datasheet ................................................................................................................................ 55

4 | P a g e
List of Tables
Table 1: Design Specifications for Power Delivery Subsystem ....................................................................................... 9
Table 2: Design Specifications for Electrical Safety Subsystem .................................................................................... 12
Table 3: Design Specifications for Diagnostic Subsystem ............................................................................................ 15
Table 4: Design Specifications for Mechanical Subsystem........................................................................................... 18
Table 5: Overall Parts List ............................................................................................................................................ 27
Table 6: Skid Part List ................................................................................................................................................... 28
Table 7: Skid Bill of Materials and Specifications ......................................................................................................... 28
Table 8: Wire ampacity ratings .................................................................................................................................... 31
Table 9: 5% voltage drop and wire length table .......................................................................................................... 32
Table 10: NEC Table 310.16 showing wire gauge ratings ............................................................................................ 33
Table 11: Skid Assembly Overall Physical Specifications .............................................................................................. 34
Table 12: Loma Hall Physical Constraints .................................................................................................................... 34
Table 13: Electrical Component Specifications ............................................................................................................ 35
Table 14: Compartment Specifications ........................................................................................................................ 35
Table 15: Electrical Components per Compartment Specifications ............................................................................. 35
Table 16: Project Schedule ........................................................................................................................................... 69
Table 17: Project Budget .............................................................................................................................................. 70

5 | P a g e
1. Context and Deliverables Engineering a Brighter Sudan is a sustainable solution for bringing electricity to the Theou Village School in South Sudan. Electricity carries with it a world of benefits for rural communities, including the alleviation of poverty, reduction of illiteracy, and help for the local economy by providing opportunities for entrepreneurship. Our goal is to empower the people to obtain a higher level of education and independence, which will help a newly independent South Sudan prosper as a country.
To help achieve this goal, we have built a scaled prototype of the system on the University of San Diego campus. Because this project is a multidisciplinary effort, the system incorporates many aspects of both Mechanical and Electrical Engineering design. The Electrical Engineering component includes the wiring of all the electrical components, sizing of the system and wires, programming of all the equipment, and programming of the diagnostic system in LabVIEW. The Mechanical Engineering component includes designing and manufacturing of a skid to house the major electrical components of the system so they can be easily moved around Loma Hall.
The final design of the electrical system is modeled after the system that will be used in Sudan. For this reason, the system will provide electricity that is 230 Volts and 50 Hertz. This will be fed into a type D outlet which is the standard outlet for Sudan. This outlet will be used to power various loads including lights, laptops, and a battery charger.
A large portion of the electrical design comes from sizing the wires and the circuit breakers for safety. Each wire used in the system must be sized for the correct amperage and must be protected by a breaker to ensure that this current is not exceeded. In addition to this, we have incorporated ground fault protectors in the AC and DC side of the system to protect people from the electrical hazards inherent in a system like this.
We have also created a program to read data from the inverter, charge controller, and FlexNET DC and analyze it in LabVIEW. This program has two primary purposes: first to monitor the power flow of the system in real-time, and second to diagnose when the system is not functioning correctly. This is done by comparing the real time data to historic data that is also logged using the LabVIEW program.
Finally, there is the mechanical component of our prototype design. This consists of the design and fabrication of a skid which carries many of the electrical components of the system. This skid houses the inverter, charge controller, batteries, breaker box, and all the loads that our system will power. The skid is mounted on wheels so that we can move our system around Loma Hall with ease.
The final system is located both on the roof and in room 311 in Loma Hall. The solar panels and combiner box are on the roof while the skid and all the other electrical components are in Loma 311. The system in room 311 will be on display for the campus community.

6 | P a g e
2. Design Analysis and Results Our design analysis and results can be broken down into three subsections. First, there is a description of the overall prototype system. Second, there is a section detailing all of the subsystems. Finally, there is a section describing our test plan for the system.
2.1. System Description The block diagram for the final prototype system can be seen in Figure 1 below.
48 Volt Battery
Bank
LightLaptop
Computers
Engineering a Brighter Sudan
Prototype System Block Diagram
Tuesday, March 22nd
, 2011
Trina Solar
Panels
(DC Electrical
Power)
Solar Radiation
Loads
LoadsService Controls Battery Bank
Legend
Solar EnergySolar Panels
OutBack HUB
Diagnostic
Combiner Box
Charge
Controller
(OutBack
FlexMax 60)
DC-AC
Inverter
(OutBack
VFX3048E)
AC Service
Panel
OutBack
MATE
Mechanical
Skid
Circuit
Breakers
Figure 1: System Block Diagram
The block diagram can be separated into three major categories. First, the flow of power from the solar panels to the loads is represented by the black arrows. Second, the flow of information from the different electrical components to the diagnostic is represented by the orange arrows. Finally, the box on the right illustrates which electrical components are mounted on the mechanical skid.
A better representation of our final prototype system can be seen in the system layout diagram in Figure 2 on the next page. Note, scaled drawings of the skid and electrical components can be found in Appendix B.3. and Appendix B.4.

7 | P a g e
Co
nduit
Solar Panels
Combiner BoxRoof
Loma 311
Solar Panels
Air D
uct
Laptop
Charge
Controller
Inverters
24 V AGM Batteries
Skid LightLight
Switch
Communications
Hot Wire
Flexware
AC
Flexware
DC
OutBack
HUB
OutBack
MATE
AC Service
PanelNeutral Wire Type D
Outlet
Figure 2: System Layout Diagram

8 | P a g e
Figure 2 shows all of the components that are being used in the final prototype system. The solar panels and the combiner box are located on the roof of Loma Hall while the rest of the electrical equipment and the mechanical skid are housed in Loma 311. The black lines in the figure represent neutral wires, the red lines represent positive wires, and the orange lines represent the flow of information through the system.
The final prototype system has two sets of three solar panels connected in parallel by a combiner box on the roof of Loma Hall. The combiner box houses 15 amp circuit breakers to ensure that none of the solar panel circuits exceed the current rating for the wires that are being used. The two strings of solar panels can be treated as current sources when they are connected together.
The output of the combiner box is connected to the equipment in Loma 311 using existing wires from the old wind turbine on the roof. These wires are housed in conduits and routed through an air duct which leads to Loma 311. The wires are connected to a charge controller which regulates the solar panel voltage and current to charge a 48 Volt battery bank. Power from the charge controller and battery bank is sent to the inverter which converts the 48 Volt DC input to AC electricity at 230 Volts and 50 Hertz which is used by the loads.
This output is sent to the AC service panel which houses the circuit breakers for each individual circuit. One circuit is wired to a light switch which is used to turn a light on and off. The other circuit is used to power a type D outlet which can power various loads. Both of these circuits are wired to ground fault circuit interrupter (GFCI) breakers to add an element of safety for people using the equipment. An outlet adaptor and voltage transformer are being utilized to accommodate loads that run on different voltage standards.
Data from the inverter, charge controller, and batteries are sent to a laptop using the OutBack HUB and MATE. This includes information such as voltage, current, battery charge level, equipment mode, and much more. This information is uploaded to a laptop using an RS 232 to USB cable. A LabVIEW program is used to read and analyze this data in real time. The program has two primary purposes. First, it shows the power flow through the entire system using a user interface that makes it easy to monitor what is going on with the system. Second, there is a diagnostic program that is running in the background which monitors the system to find potential system failures. The program also allows the user to send basic commands to control the inverter.
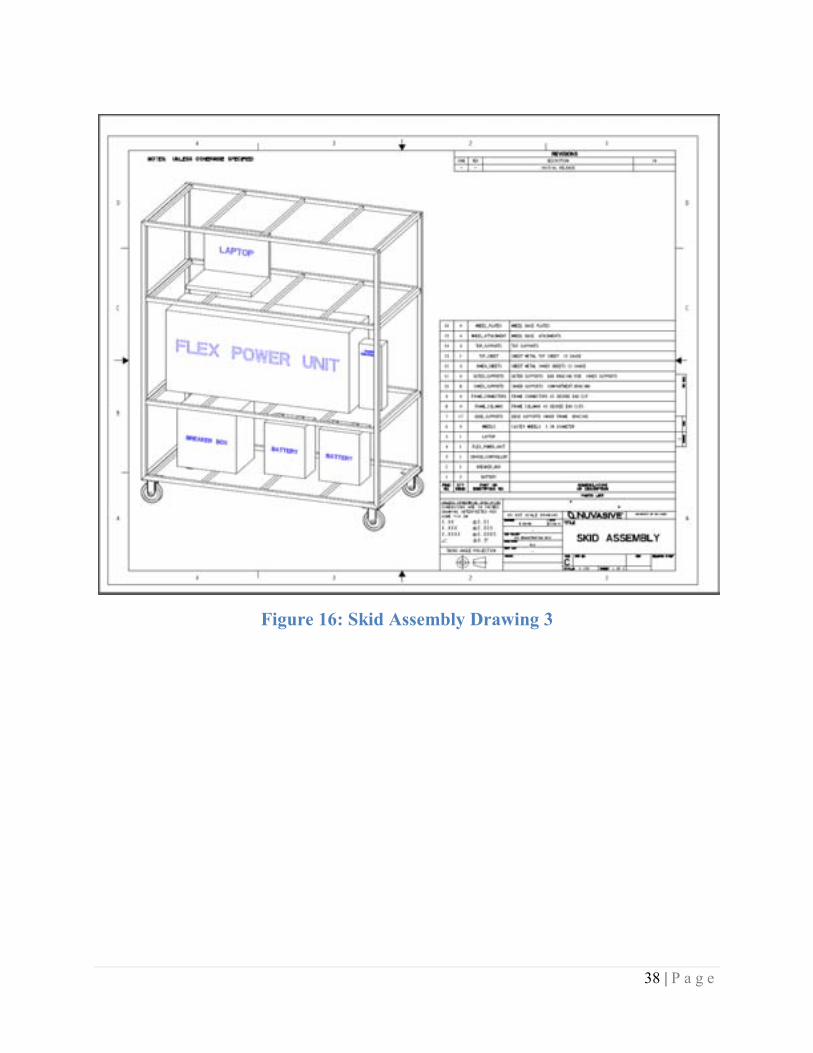
All of the electrical equipment that is used in Loma 311 is housed in a mechanical skid. The first level of the skid holds four 24 Volt batteries connected in both parallel and series. The second level houses the FlexPower unit which includes the charge controller, inverter, DC wiring box, and AC wiring box. The third level of the skid houses the AC Service Panel and all of the loads that our system is powering. The skid is mounted on wheels and is designed to easily transport all the electrical equipment.

9 | P a g e
2.2. Subsystem Descriptions The responsibilities for our project can be divided into four parts. Emmett Perl is in charge of the power delivery subsystem, Mou Riiny is in charge of the safety subsystem, Michael Rios is in charge of the diagnostic subsystem, and Enrique Rayon is in charge of the mechanical subsystem.
Power Delivery Subsystem
Subsystem Lead Personnel: Emmett Perl Subsystem Support Personnel: Mou Riiny
Design Specifications
The design specifications for the power delivery subsystem are shown below in Table 1:
Table 1: Design Specifications for Power Delivery Subsystem
The design for the power delivery subsystem meets all of the specifications from Table 1. The design is centered around the inverter, which is the central component in the power delivery subsystem. Since the inverter requires a 48 Volt DC input and a 230 Volt, 50 Hertz AC output, all of the electrical equipment must conform to these power levels. To accommodate the DC input, the charge controller has been programmed and the battery bank has been wired to provide 48 Volts to the inverter. All of the AC circuit breakers are designed for 230 Volt, 50 Hertz power and a type D outlet and switch have been wired to the AC service panel.

10 | P a g e
The power flow program was designed to read data from the inverter, charge controller, and FlexNET DC in real time. This data is placed into an array and sorted so that it can be shown in a meaningful manner on the front panel of the LabVIEW program. This allows us to extract useful data such as battery level, solar panel voltage, output AC current, and the mode for each piece of equipment. The front panel of this program is designed to show all of this data in a user friendly way that can be easily interpreted by people unfamiliar with the system. The program also saves the data into a large array and writes it to a text file after a specified amount of time has passed. This text file can be read back into the program to show the historic performance of the system.
Subsystem Current Status
This subsystem is currently in the testing stage. All of the necessary electrical components have arrived and are hooked up in the system. This includes solar panels, a combiner box, charge controller, battery bank, inverter, AC service panel, and all the necessary wires. Figure 3 shows many of the components that are used in the power delivery subsystem.
The power delivery subsystem consists of six 230 watt Trina solar panels, an OutBack combiner box, an OutBack Flexmax 60 charge controller, a 48 Volt battery bank, an OutBack VFX3048E inverter, and an AC service panel which connects to all of the loads.
The entire system is currently connected and running. We are testing the voltages throughout using a digital multimeter and are starting to characterize the system using a power flow program. When this program is developed and debugged, it will be possible to monitor the functionality of the power delivery subsystem through LabVIEW alone. Once historic data is logged for the system, it will be possible to integrate the power flow data into the diagnostic program that is currently being developed.
The second part of the power delivery subsystem is the design of a power flow program. This program reads in data from the charge controller, inverter, and FlexNET DC. It then sorts this data into an array and displays it on the front panel. Some of the data that it displays includes solar panel voltage, solar panel current, charger mode, battery charge level, and solar power
Figure 3: Prototype System on the Roof of Loma Hall

11 | P a g e
output. The flowchart for the power flow program is shown in Appendix B.1. The commented LabVIEW code for the current power flow program is shown below in Figure 4.
Figure 4: Power Flow Block Diagram
The data from the system is displayed on the front panel of LabVIEW. This is designed to show the layout of the system and to show the how the power is flowing through the major components. It also graphs the historic data and gives the user the option of looking at power flow for each individual subsystem. The front panel design is shown in Figure 5 below:
Figure 5: Power Flow Front Panel

12 | P a g e
Data from the power flow program is stored in a text file which can be read back into LabVIEW. This data is used for two purposes: to show the power production history and for the diagnostic subsystem.
The power flow program is currently in the debugging stage. While it is working with the system, there are many improvements that can be made. In particular, the reading and writing of the data needs to be perfected. Debugging this program will be the primary objective for the remainder of the semester.
Electrical Safety Subsystem
Subsystem Lead Personnel: Mou Riiny Subsystem Support Personnel: Emmett Perl Design Specifications
All the design specifications for the electrical safety subsystem can be seen in Table 2 below:
Table 2: Design Specifications for Electrical Safety Subsystem

13 | P a g e
All wires have been designed to meet national safety standards. This means that the wire sizing of the entire system has met or exceeded the standards necessary for the National Electric Code (NEC). The system has also been wired with proper wire sizes to minimize losses and to prevent the wires from overheating. Wire gauge selection was based on several factors including the wire carrying capacity (ampacity), temperature, location covering, insulation, and outer jacket type.
Based on the wire sizing calculations shown in Table 6 in Appendix B.3, the wire connecting the solar panel array to the charge controller and inverter must be able to carry at least 25.97 Amps and the wire from the storage system to the inverter must be able to handle a current of 104.17 Amps. Taking this into account, the gauge selections were AWG #10 (American Wire Gauge) from the array to the charge controller, AWG #2/0 from storage system to the inverter, and AWG #2 from the inverter to the AC Service Panel. All of the wires are copper. All of the calculations, tables, and figures are shown in Appendix B.3.
Each piece of equipment in a PV system must be able to be disconnected from all sources of power (NEC 690.15). The NEC also requires that every ungrounded conductor be protected by an overcurrent device (NEC 240.20). This provides multiple levels of protection for the vital electrical components of the Inverter in the event of an electrical surge or nearby lightning strike. The wiring diagram in Figure 6 shows all the breakers, surge protectors, and GFCI’s required to adequately protect the system and meet all the design requirements.
Subsystem Current Status
The sizing and gauge selection of the wires for the entire system has been completed. This was done according to the NEC code. All wires for the demonstration were ordered and have been received. There are many circuit breakers in the system and selecting the correct sizes to meet the design specifications presented a challenge because they must all match the wires that will be used both for the prototype system and for the final system in Sudan. At this point all the circuit breakers required for the demonstration have been ordered and received. In addition to this, two surge protectors were also sized to protect the system and have been wired to the OutBack inverters.
Grounding the system was one of the biggest challenges because it is hard to make sure that everything is grounded and because there are many dangers that can occur when a system is grounded incorrectly. A professional engineer has looked over our system to confirm that the grounding and wiring of the system is correct.
The circuit breakers for the system are located in the combiner box, the Flexware DC enclosure, the Flexware AC enclosure, and the AC service panel. The combiner box has two 15 Amp circuit breakers to protect the solar panel circuits. The Flexware DC has two 80 Amp circuit breakers and a GFCI breaker to protect the circuits connecting the charge controller to the battery bank and solar panels. The Flexware AC has six 30 Amp circuit breakers to protect the inverter output circuit. The AC service panel has two GFCI breakers to protect the circuits that are connecting

14 | P a g e
the loads. An operation and maintenance manual has been developed to categorize the system and identify all the safety hazards associated with it. This is shown in Appendix B.6.
A wiring diagram for the entire prototype system is shown below in Figure 6:
Figure 6: System Wiring Diagram Figure 6 shows all of the intricacies of the system wiring. This diagram has a lot of information including the gauge of each wire group, the grounding scheme, the location all of the circuit breakers, the location of the diagnostic cables, the location of the hot and neutral wires, and the location of all the major electrical components. All of the major electrical components and the neutral wire must be connected to ground. The legend on the left side of the diagram shows what each color in the diagram represents.

15 | P a g e
Diagnostic Subsystem
Subsystem Lead Personnel: Michael Rios Subsystem Support Personnel: Emmett Perl
Design Specifications
All the design specifications for the diagnostic subsystem can be seen in Table 3 below:
Table 3: Design Specifications for Diagnostic Subsystem
Specification Design Communicate with the system via the OutBack MATE. Use LabVIEW to pull raw data from the MATE
Manipulate raw data from MATE Sort through the raw data to extract the important information
Provide instructions for system debugging in the presence of a system error
Use LabVIEW to create “cases” that will notify the user of system errors
The diagnostic subsystem is a critical component to the overall system because it helps assure that the system is functioning properly. The main purpose of the diagnostic is to take the raw data from the major electrical components and upload them to a laptop. This is done by communicating with the OutBack MATE using the serial communication protocol in LabVIEW. We are able to extract the useful information from the raw data which allows us to display it to the user. It is necessary to manipulate the raw data in a way that will extract the important information.
The second major component to the diagnostic system is the ability to communicate errors to the user. When an error occurs, the diagnostic program will create a popup which will provide instructions for debugging the system. This allows the user to physically see when the system is not functioning correctly. The user can then follow the error window’s instructions or refer to the system manual to correct the error. The goal of the diagnostic is to make the debugging process as simple as possible.
Subsystem Current Status
The status of the diagnostic subsystem can be summarized by the serial communication configurations, raw data sorting, and error windows.
The serial communication configuration was necessary to be able to pull raw data from the MATE into LabVIEW. The process began with the specifications defined in the MATE Serial Communications Guide. Information from the charge controller, FlexNet DC, and inverter is combined through the HUB and sent to the MATE. An isolated RS-232 port allows for all the

16 | P a g e
data from the MATE to be sent to a computer. An RS-232 to USB cable is used to facilitate the data flow from the MATE to LabVIEW.
The next step was the get LabVIEW to display the string of raw data and provide real time data gathering. The serial communication program configures all the correct settings on the PC: 19200 baud rate, 8 bits, no parity, and 1 stop bit. In addition to configuring all of these settings, it was required that the DTR (pin 4) be driven high and that RTS (pin 7) be driven low in order to power the port. Once the DTR and RTS pins were set to the correct values, we were able to extract live raw data from the MATE. The raw data feed can be seen in Figure 7.
The next step was to sort this data into meaningful information about the system. By using the byte definitions from the Serial Communications Guide, we were able to sort the raw data into the appropriate fields. For example, the byte definitions for the inverter can be seen in Figure 8:
Figure 8: Byte Definition Map for Inverter
The next step is to separate the data according to the appropriate electrical component, i.e. charge controller, inverter, FlexNET DC. Once this is done, it can be broken down further based on the different byte definitions. For example, the AC output voltage of the inverter can be extracted by looking at the byte definitions from Figure 8. The Figure shows that bytes 17-19 represent the AC output voltage. By first extracting the row that corresponds to the inverter data and then extracting these three bytes, we are able to get a numeric value for the AC output voltage.
Figure 7: Raw Data Feed

17 | P a g e
The last major component to the diagnostic system is error detection. The primary functionality of this component is to analyze data from the hardware in order to automate error detection and correction to prevent harm to the system and user.
This was achieved by utilizing LabVIEW’s case blocks. These cases can perform logical comparisons or cause a new executable file to launch, which will visually communicate with the user that there is a system error. Figure 9 shows an example of an error message that occurs when the user has designated the incorrect COM port.
Figure 10 is an example of using a case structure to launch an executable file to visually communicate an error to the user. An executable file gives us the opportunity to customize the error popup to visually communicate what is going on with the system. For users in Sudan, the visual warning is necessary to help them understand what is going wrong. In this case the user is asked if they want to turn off the inverter. If they say yes, a command will be sent to the MATE
and the inverter will be shut down.
Similar messages will be implemented for various errors that could occur in the system. For example, an error message will popup when the battery charge level reaches a critical value. Once the charge drops below 20%, the program will automatically shut down the system to prevent permanent damage to the batteries.
Additional error messages will be integrated into the system in the coming weeks as we start to run the system continuously.
Figure 9: COM Port Error
Figure 10: Executable File Popup

18 | P a g e
Mechanical Subsystem
Subsystem Lead Personnel: Enrique Rayon Subsystem Support Personnel: Emmett Perl
Design Specifications
The design specifications for the power delivery subsystem are shown below in Table 4:
Table 4: Design Specifications for Mechanical Subsystem
Specification Design Skid must have the structural capability of supporting all electrical components with a safety factor between 1.5 -2.0
The skid is designed to have a maximum load capacity of 1200 lbs with a safety factor 2.0
Skid must have the capability of being safely transported in the Loma Hall elevator
The skid is designed to weigh no more than 350 lbs to accommodate an elevator load factor of safety of 2.0
Skid must be mobile and have the ability to transport all electrical equipment from one location to another
Skid has four casters two of which will have the ability to swivel and two that will be rigid
Skid must be able to fit through a standard Loma Hall door way
Skid will be designed to have a maximum width/depth of 30 inches and maximum height of 71.25 inches
Skid must be accommodate the ventilation of all electrical equipment to prevent accumulation of thermal energy
The skid will be uncovered on the front, back, left and right side to promote maximum natural convection heat removal.
Skid must be aesthetically pleasing Skid will have outside frame members welded at 45 degree angles. All sheet metal shelves will be flush with frame.
Skid must facilitate the organization and integration of all electrical equipment
The layout of the skid and volumetric design of each compartment accommodates clean, effective electrical integration.
Skid must allow for easy access to any electrical component
Skid will maintain sufficient space around all components. Minimum of 4 inches around the top and back side.
Skid must contain all fundamental electrical components involved in the USD demonstration
Skid will have three compartments or levels that have sufficient volume to comfortably accommodate all prototype components.

19 | P a g e
The Skid is designed to be a resource for the USD prototype demonstration for the Critical Design Review, the Final Design Review, and the USD engineering open house event. It is intended to house the major electrical components in a safe, secure, organized, and meaningful manner. In addition to this, the skid must facilitate the presentation and transportation of all electrical components. All of these design specifications can be found in greater detail in Table 4. All the specifications listed in this table have been successfully achieved.
When addressing the skid’s ability to house and transport all electrical components, the material selection was a central design variable. To ensure that the skid could handle an overall distributed load of approximately 550 lbs, hollow square tubing was chosen because of its durability, strength, and low cost. Given our established connections with West Coast Iron, Inc. a steel fabrication company in Spring Valley, San Diego, the financial cost of the steel was not an issue. The major tradeoff in using steel as opposed to another building material such as wood is an increase in weight per linear foot. This translates to a heavier skid and thus decreased mobility. This design implication was weighed against the cost, durability, and strength implications in selecting steel as the skid material.
The physical dimensions of the skid were maximized to comfortably accommodate all electrical components. Each compartment was designed to house specific electrical components of the system. Please see Table 13, 14, and 15 in Appendix B.3. for greater detail on this design. The top compartment (Compartment #1) was designed for the AC service panel, the laptop diagnostic unit, and all demonstration loads. This compartment was designed to be 52.25 inches (4.4 ft) high, chest level for an average adult male. The middle compartment (Compartment #2) was designed for the charge controller, inverter, Flexware DC, and Flexare AC. The bottom compartment (Compartment #3) was designed to hold all of the deep cycle batteries. Both the top and bottom compartments have a cross-sectional area defined by a 60 inch length and 18 inch height; these dimensions quantify the compartment openings. The cross-sectional dimensions for the second compartment are a 60 inch length and 25 inch height. The compartment dimensions govern the overall size and weight of the skid in conjunction with the constraints of Loma Hall.
The overall dimensions of the skid as shown in Table 11 in Appendix B.3. allow the skid to meet all Loma Hall physical constraints. Thus the skid is able to fit in the Loma Hall elevator and classrooms. Important design parameters to consider are the height and width of the elevator door opening and the Loma Hall doors. The minimum dimensions here dictate the overall height and width constraints of the skid. The overall width of the skid is 30 inches while the width of the Loma door openings are 35 inches as shown in Table 12 in Appendix B.3. Therefore a 5 inch clearance is achieved. The overall height of the skid is 71.25 inches while the doorway height is 84 inches. Again clearance is achieved. Finally, the maximum weight carrying capacity of the Loma elevator is 2500 lbs. The fully loaded skid weight is 833.3 lbs thus there is a factor of safety of approximately 3 in regards to the elevator load capacity. The other design consideration is due to the skid’s fully loaded total weight and the load capabilities of the steel caster plate wheels. Four of these wheels are rated per the Grainger manufacturer specifications for a

20 | P a g e
maximum weight of 1,800 lbs. Therefore a 2.2 factor of safety is associated with the wheels ability to handle the skid load. This factor of safety is within the design specifications outlined in Table 4.
In addressing the mobility and ventilation design specifications, the skid was designed to maximize natural convection cooling by maximizing the skid open area. For this reason, the back, front, left and right sides of the skid were left uncovered.
The safety and mobility specifications for the skid were achieved by fastening all electrical components to solid 12 gauge sheet metal shelves anchored to steel square tubing. The fastening of all electrical components enables the safe transportation of skid from one location to another. The other important design consideration taken into account is the tendency for the skid to tip. This occurrence was minimized by concentrating 88% of the component load on the lower half of the skid, essentially lowering the skid’s center of gravity and thus decreasing its propensity to tip.
The aesthetic design specification was achieved by recessing the steel square tubing frame members and minimizing the visibility of welds. All external conspicuous welds were eliminated with a metal grinder. In addition, the recessing of steel members particularly the edge and inner supports allowed the sheet metal shelving to be flush with the outer skid frame connectors. Lastly the physical strategic arrangement of the electrical components within the skid promotes an organized and easily identifiable perspective of the prototype electrical components.
Subsystem Current Status
The current status of the Skid mechanical engineering subsystem is marked by completion of the skid construction and the mounting of all the prototype electrical system components. Please see Appendix B.4.4. for all of the mechanical drawings of the assembled Skid and the mechanical drawings for the subcomponents. The physical specifications for all procured items can be found in Appendix B.4.1. Please also refer to Table 7 for a detailed Bill of Materials for the metal frame subcomponents of the skid assembly found in Appendix A.
The following is a summary of the build process including inspections, evaluations, the build procedure, and the mounting procedure.
Initial Material Evaluation
The first step in the build process was to validate and inspect all skid components to verify accuracy and precision of the critical physical dimensions. All the square steel tubing was measured and inspected for material defects. The sheet metal and caster wheel plates were also evaluated in a similar but less critical fashion.

21 | P a g e
Machining
After inspecting the material it was discovered that two of the frame columns, four of the inner supports and two of the frame connectors were not cut to the appropriate lengths. These assembly subcomponents and parts were identified and cut to the appropriate lengths. In addition, the four quarter inch wheel plates were machined according to the engineering assembly subcomponent drawing found in Appendix B.4.4. All of these machined parts were then deburred using a metal grinder.
Assembly via Weld Connections
The construction of the Skid was defined by assembling the steel frame using a series of welded T-Corner (TC) Butt joints. After analyzing the build process it was decided that the most effective approach to assemble the frame was to begin with the four components that comprise one side of the frame, two frame columns, and two frame connectors. These four components were welded together to establish one side of the frame. Subsequent to welding and inspecting the four joints, this procedure was repeated for the opposite side of the skid to establish both sides of the outer skid frame.
After establishing the outer skid frame the locations of the three compartments were marked using a black felt marker. The aforementioned compartment locations refer to the location of each of the 28 hollow square steel compartment supports. These 28 members consist of 17 edge supports, 3 top supports and 8 inner supports. These locations specified by the engineering drawings were carefully checked and inspected multiple times before proceeding to assemble the rest of the skid.
Using the previously marked and measured locations, 2 inner supports were welded at the extreme upper right and upper left corner of one of the two four member outer frames. 2 inner supports were welded at the extreme lower right and lower left corners of one of the four member outer frames. Subsequent to welding and inspecting these four joints, the remaining 3 top supports were welded onto the same four member outer frame. All welds were then inspected before proceeding to weld the remaining 4 inner supports and 17 edge supports to the same outer frame. From the engineering drawings it can be seen that there are 5 edge supports that comprise the middle and bottom compartment. The top compartment is comprised of only two edge supports. Each of the welds was then inspected and re-worked as needed. Subsequent to this build evaluation the complementary four member outer skid frame was then welded at each support location to the other four member outer skid frame. The two inner supports at the extreme upper left and right hand corner were welded first. This was followed by the two inner supports at the extreme lower left and right hand corners of the frame. Next the remaining 3 top supports were welded, followed by the remaining 17 edge supports and 4 inner supports. At this point both four member outer skid frames were connected via butt joint welds by 17 edge

22 | P a g e
supports, 8 inner supports, and 3 top supports resulting in 56 weld locations. These 56 welds were then inspected, reworked, and aesthetically refined with a grinder as needed.
Lastly the wheel plates were welded to the bottom of the skid frame as indicated in the skid assembly engineering drawing in Appendix B.4. The ¼ inch wheel plates facilitated the attachment of the 4 Grainger caster wheels. Two swivel wheels were welded to the base plates on one side while two rigid wheels were welded to the opposite side. The pairing of swivel and rigid wheels was employed to improve skid control during transportation.
Finally, the four 12 gauge sheet metal shelves were then inserted into the four shelf compartments and lightly spot welded to secure them to the frame. A global evaluation of the skid was conducted by the Vice President of West Coast Iron, Inc. Enrique Rayon Sr. All weld joints were inspected, reworked, and aesthetically refined as needed.
Equipment Mounting
The next aspect of the skid build process was to locate and drill the appropriate holes for the electrical components. The first step was to situate the electronic components on the skid in order to visualize the physical arrangement of all the components and evaluate the feasibility of the electrical interconnections. This process was carried out by the entire team. The primary considerations taken into account at this step were the electrical integration, electrical safety, aesthetics/appearance, and component fastening to the skid structure. Once agreed upon, locations were confirmed. These locations were marked and recorded. Using these marked locations the components were secured to the skid via number 8 crown bolt zinc plated self drilling screws, mounting plates, and straps. Equipment such as the FlexPower unit came with mounting plates that were used to secure the unit to the skid. Other components such as the batteries were strapped to the skid during transportation. The crown bolt zinc plated self drilling pan head Phillips metal screws were anchored to both the 14 gauge sheet metal as well as the steel tubing to secure the electrical components.
The last mounting procedure was to secure all demonstration items: light fixtures, electrical outlets, and electrical switches. The light fixture was directly mounted to the top compartment of the skid while the electrical outlets and switches were mounted to wooden blocks which were then secured to the skid. The mounting of demonstration items to wooden blocks was achieved using zinc plated crown bolt number 8 wood screws. The location and presentation of all demonstration items is a key design aspect to the design. It is for this reason that this task was accomplished last. Several different component arrangements were explored for visual appeal as well as electrical integration feasibility.

23 | P a g e
Weld Procedure Specification & Analysis
This section of the report will discuss the welding employed in the Skid build process. Specifically, it will address the welding codes, the weld type, weld process, and welding strength.
The welding procedure and parameters employed to assemble the Skid are in accordance with the American Welding Society (AWS) Structural Welding Code for Steel approved by the American National Standards Institute (ANSI).
The weld process employed was multi-pass fillet welding using inert gas metal arc welding (GMAW). The inert gas used was 100% CO2 set at a flow rate of 30-50 CFM (AWS, 2010). The base metal material specification used in the skid is ASTM A-36 and the filler metal AWS specification is A5.20 with an AWS classification of E71T-1 (Excel Arc) (AWS, 2010).
The general welding technique employed was a vertical progression in the upward direction of the welding gun using a stringer technique with the contact from the tube to the work piece characterized by a distance of 0.5-1.0 inches. There was no peening and the inter-pass cleaning was performed with a wire brush. The GMAW equipment used was semi-automatic (AWS, 2010).
The general welding procedure used the class A5.20 filler metal with a wire diameter of 0.045 inches in conjunction with a current setting of 125-255 Amps with 22-24 Volts. The travel speed of the weld gun and the number of passes or layers were variable parameters manipulated as required (AWS, 2010).
Heat treatment was utilized in accordance with the AWS structural welding code for steel. The preheat minimum temperature for the base metal was attained from AWS Table 3.1 D1.1-96. The minimum temperature was found to be 70 degrees Fahrenheit for the base metal. The maximum inter-pass temperature was 500 degrees Fahrenheit (AWS, 2010).
The mechanical properties as well as the chemical analysis for the welding procedure was based on WestAir Gases and Equipment testing information. In terms of the mechanical properties the tensile strength is 87,000 psi, the yield strength is 76,000 psi, and the elongation is 2 inches (Weld Strength Calculations, 2010). The chemical analysis of the weld for the aforementioned welding procedure is 0.043 Carbon, 1.311 Maganese, 0.746 Silicon, 0.050 Chromium, 0.01 Aluminum, 0.019 Phosphorus, 0.01 Sulfur, 0.016 Molybdenum, 0.028 Nickel and 0.02 Vanadium.
2.3. Test Plan Each of the four subsystems detailed in the section above are integrated smoothly into the prototype system as a whole. The safety subsystem is directly incorporated into the power delivery subsystem in the combiner box, Flexware DC, Flexware AC, and AC service panel.

24 | P a g e
Circuit breakers housed in these four enclosures are placed between each major electrical component to protect all the wires and equipment in the system. Ground fault circuit interrupters are used in both the AC and DC sections of the system to protect people from electrical hazards.
The diagnostic subsystem is integrated using the OutBack HUB and MATE. The inverter, charge controller, and Flexware DC have outputs which send data to the HUB and MATE via CAT 5 cables. This data is uploaded to a laptop which is powered by the system.
The mechanical subsystem is used to house many of the electrical components which belong to each of the other three subsystems. This includes the inverter, charge controller, batteries, Flexware enclosures, AC service panel, and all of the loads. The entire diagnostic subsystem is housed on the mechanical skid as well as many components from the safety and power delivery subsystems.
Each subsystem will be tested individually. The power delivery subsystem will be tested using a digital multimeter and data from the MATE. The digital multimeter will read the voltage and current at each point in the system to make sure that it is running properly. In addition to reading the DC power levels, we will also test the AC frequency and voltage to make sure that the inverter is functioning properly. Data from the inverter, charge controller, and batteries will also be used to assess the power delivery subsystem. By reading this data in the diagnostic program, we are able to tell what is going on in the system without exposing ourselves to any dangerous electrical hazards.
Each of the circuit breakers in the safety subsystem will be tested. This will be done by shorting each circuit to force them to exceed their current rating. This test will assure that the grounding wire is connected correctly and that each circuit breaker is functioning properly. In addition, the ground fault circuit interrupters can be checked using a test button to ensure that they are working.
The diagnostic subsystem will be tested primarily using a debugging process. When the system is turned on, the diagnostic program will be running continuously and will constantly be storing data to text files on the computer. We will incur various errors that will show up in the program to make sure that it is diagnosing them correctly. By exposing the program to many different errors, we will be able to find when the program malfunctions and debug it so it works correctly.
The design testing for the mechanical subsystem will include accurate and precise physical and thermal measurements. The physical measurements will focus on the weight of the fully loaded skid assembly, which will be compared with the physical constraints shown in Table 4. The thermal analysis will consist of temperature readings of the inverter and batteries using the Remote Temperature Sensor. The final design aspect that will be explored is skid mobility. Various skid attachments such as handles and straps will be examined as possible solutions to improve mobility of the skid.

25 | P a g e
3. Works Cited
All About Circuits. (n.d.). Electrical Safety. Retrieved December 4, 2010, from Safe Circuit
Design: http://www.allaboutcircuits.com/vol_1/chpt_3/8.html
American Institute of Steel Construction. (2001). Manual of Steel Construction: Load and
Resistance Factor Design. American Institute of Steel Construction.
ASME International. (n.d.). American Society of Mechanical Engineers. Retrieved September 29, 2010, from ASME Codes and Standards: http://www.asme.org/
ASME International. (n.d.). American Society of Mechanical Engineers. Retrieved September 29, 2010, from ASME Codes and Standards: http://www.asme.org/
AWS, A. W. (2010). Structual Welding Code - Steel. Miami: American Welding Society D1 Committee.
batterystuff.com. (n.d.). Solar Calculator. Retrieved September 28, 2010, from http://www.batterystuff.com/solar-calculator.html
Construction Technology Laboratories, Inc. (CTL). (2010, June 6). WBDG: Energy Codes and
Standards. Retrieved September 29, 2010, from Whole Building Design Guide: http://www.wbdg.org/resources/energycodes.php
Homer TLC, Inc. (2011, March). Lumber & Composites. Retrieved March 2011, Home Depot: http://www.homedepot.com/webapp/wcs/stores/servlet/Navigation?storeId=10051&N=+90401+http://www.wbdg.org/resources/energycodes.php
IEEE Standards Association. (n.d.). Retrieved September 27, 2010, from IEEE: http://www.ieee.org/index.html
Ireland, B. (2010, August 1). EC&M Electric Resource. Retrieved Septemeber 28, 2010, from Power Quality: http://ecmweb.com/power_quality/photovoltaic-panel-performance-standards-20100801/
McNichols Inc. (2011). McNichols. Retrieved March 2011, from Table of Gauges and Weights: http://www.mcnichols.com/cdscontent/attachments/charts/gaugechart.pdf
Omer, A. (2010, 10 7). Renewable Energy Resources for Electricity generation in Sudan. Renweable & Sustainable Energy Reviews, pp. 1481-1497.
Online Metals Inc. (2011). OnlineMetals Weight Calculator. Retrieved March 2011, from OnlineMetals.com: http://www.onlinemetals.com/calculator.cfm

26 | P a g e
Quimby, B. (2009, September 17). Chapter 5 - Welded Connections. Retrieved March 2011, from A Beginner's Guide to the Steel Construction Manual: http://www.bgstructuralengineering.com/BGSCM/BGSCM005/index.htm
Sun Catalytix Corporation. (n.d.). Sun Catalytix: Our Technology. Retrieved September 29, 2010, from Sun Catalytix: http://www.suncatalytix.com/tech.html
Wiles, J. (2008, January-February). ground-fault protection for pv systems. IAEI NEWS .
Weld Strength Calculations. (2010, September 2). Retrieved March 2010, from Roymech:
http://www.roymech.co.uk/Useful_Tables/Form/Weld_strength.html
W.W. Grainger, Inc. (2011). Plate Casters. Retrieved March 2011, from Grainger:
http://www.grainger.com/Grainger/plate-casters/casters-and-wheels/material-handling/ecatalog/N-cnt

27 | P a g e
Appendix A: Complete Parts List A complete parts list for the system and the skid are shown below in Tables 5, 6, and 7:
Table 5: Overall Parts List

28 | P a g e
Table 7: Skid Bill of Materials and Specifications
Material Height (in) Width (in) Length (in) Area (in2) Weight (lbs) Volume (in
3) Quantity
Material Height (in) Width (in) Span/Length (in) Area (in2) Weight (lbs) Volume (in3) Quantity
Square Tubing Subtotal 1 0.75 0.75 560 420 115.36 964 20
Square Tubing Subtotal 2 1 1 964 964 35.14 315 20
Material Height (in) Width (in) Span/Length (in) Area (in2) Weight (lbs) Volume (in3) Quantity
Steel Square Tubing Total 4 16 6.0 4 8
6.375 N/A N/A N/A 2.35 N/A 2
Grainger Rigid Wheels 6.375 N/A N/A N/A 2.13 N/A 2
3
Wheel Base Plates 0.25 4 4 16 1.50 4 4
Grainger Swivel Wheels
Top Supports 0.75 0.75 28 21 1.76 15.75
Edge Supports 0.75 280.75
1384 150.5 40Steel Square Tubing Total 1524 1279
1680 36.5
47.1860
65
60
60
1
1
15.75 1721
3
Inner Bracing Supports 1 28 83.35
Outer Supports 1 60
28 28
60
1
1 47.1860
1 47.78
7080 4
60
153.6
52
SKID ASSEMBLY BILL OF MATERIALS
Top Sheet 28 10.1046 175.728
1.76
30
1
TOTAL 8480.0 310.1 2023.6
188.28
740.568
65
60
Frame Columns
Sheet Metal Total
Interior Sheet
Frame Connectors
0.1046 39.11800
65
Table 6: Skid Parts List
Material Supplier/Vendor Material Description Product Code Dimensions Weight (lbs/ft2) Length (ft) Quantity Cost Material Total
Total 1,290.85$
0.753 46.67 N/A $ 7.04 $ 328.53
$ 44.06
$ 27.15
Wheel Plate Caster Grainger Load Capacity 450lbs, Rigid, Overall height 6-3/8" 4W903 D 5" X W 1-1/2" 2 $ 22.03
1
2
SKID VENDOR BILL OF MATERIALS
$ 54.30 Wheel Plate Caster Grainger Load Capacity 450lbs, Swivel, Overall height 6-3/8" 4W900 D 5" X W 1-1/2" 2
Sheet Metal All Metals Inc. 14 USS Gauge Steel (Hot Rolled) N/A W 60" x L 120"
Hss 1'' X 1" X 1/8" (Grade A500)Steel Square Tubing All Metals Inc. N/A 1" X 1" X 1/8"
Steel Square Tubing All Metals Inc. Hss 3/4'' X 3/4" X 1/8" (Grade A500) N/A 3/4" X 3/4" X 1/8"
$ 267.88 3.125 $ 267.88
$ 267.88
98.36$
$ 596.07 1.436 N/A $ 7.42
N/A
N/A
N/A
80.33
1

29 | P a g e
Appendix B: Technical Design Documents
Appendix B.1. Flow Charts and Code All the flowcharts and code are shown below in Figures 11, 12, and 13:
Figure 11: Power Flow Program Flow Chart
Data Acquisition
Program
Data from
OutBack
MATE
Which Data is
Being Displayed
Separate and
Store Comma
Separated Data in
Array
Isolate Useful Real
Time Flow Data
Stored Inverter
Data
Stored Charge
Controller Data
Stored FlexNet
DC Data
Isolate Useful Real
Time Flow Data
Isolate Useful Real
Time Flow Data
Display on Front
Panel Using
Numeric Indicators
and Charts
Display on Front
Panel Using
Numeric Indicators
and Charts
Display on Front
Panel Using
Numeric Indicators
and Charts
Build Array with
Historic Data
Store In
Spreadsheet File
for Future Use

30 | P a g e
Turn on PC
Communication on
Mate
Connect RS232
port from Mate to
USB on PC
Open LabVIEWRun Serial
Communication VI
Check settings
19200 baud rate
8 bits
No parity
1 stop bit
Verify DTR (pin4)
is set high and
RTS (pin7) is set
low
Can raw data from the
Mate be viewed on the
Front Panel
Communication
VerifiedYES
NO
Verify the Mate is
ON
Verify correct
cable connections
Figure 12: Serial Communications Flowchart
Figure 13: Diagnostics LabVIEW Code

31 | P a g e
Appendix B.2. Electrical Safety Design This section details the electrical safety design for the entire system. This includes the wire ampacity calculations and wire sizing tables.
Wire Sizing
When sizing the wires, the most important criteria to consider is the ampacity and the voltage drop. Ampacity refers to the current carrying capacity of the wire; the larger the wire, the more it can carry. The system must be wired with proper wire sizes to minimize losses and to prevent the wires from overheating. To calculate the required amperage (According to NEC Requirements) of the wire that connects the array to the batteries, the rated short circuit current of the module is multiplied by a factor of 1.25 twice to ensure that the wire can handle any current surges produced by the panels caused by reflection or exceptionally sunny days. The calculations are shown in Table 8 below. The required amperage of the wire connecting the storage system to the loads is the inverter rated watts divided by the inverter efficiency and divided by the DC system voltage. This gives the maximum load current which is then multiplied by 1.25 to provide for a factor of safety. This ensures that the conductor never carries more than 80% of its rated capacity. Calculations for this section are below in Table 8.
Table 8: Wire ampacity ratings
Voltage Drop
The second consideration for wire sizing is the voltage drop, which is a measurement of the decrease in voltage due to a wire’s resistance and length. This can be analyzed by equating the wire size to the amp rating. These relationships can be seen below in Table 9. Since our system will be implemented over a relatively short range, voltage drop will not be a factor of concern for power loss. This is because the largest wires in the system will run a very short distance (less

32 | P a g e
than 50 feet). For example, the maximum wire length we can use for the wire that runs from the array to the storage system is 74.3 feet, but in reality we only need about 20 feet. The same thing goes for the wire connecting the storage system to the AC load center. The max length that we can use there is 64 feet, but only about 10 feet of that is needed for this system.
Table 9: 5% voltage drop and wire length table
Wire Gauge Selection
Wire Gauge selection is based on several factors; the wire carrying capacity (ampacity), temperature, location covering, insulation, and outer jacket type. Theou Village is located in a region that is very hot and dry for approximately half the year and wet for the other half so these factors are very important in selecting the type of wiring that will be used in this system. Based on the wire sizing calculations from Tables 8 and 9 above, the wire connecting the array to the storage system must be able to carry at least 25.97 Amps and the one from the storage system to the loads must be able to carry a total load of 104.17 Amps. Type THWN will be selected because it best fits all the weather related criteria of the region. Since THWN is not available for 60°C (140°F), selection will be made under 75°C (167°F). Taking all these factors into account, the gauge selections (NEC) are AWG #10 (American Wire Gauge #10) from the array to the storage system and AWG #2 from the storage system to the loads. All wires are copper.

33 | P a g e
Table 10: NEC Table 310.16 showing wire gauge ratings
Disconnects
Each piece of equipment in a PV system, such as charge controllers, inverters, and batteries must be able to be disconnected from all sources of power (NEC 690.15). The requirements of what a disconnect must be include:
They can be switches or circuit breakers They must not have any exposed live parts They must plainly indicate whether they are in the open or closed position They must be rated for the nominal system voltage and available current (NEC 690.17)
Overcurrent Protection
The NEC requires that every ungrounded conductor be protected by an overcurrent device (NEC 240.20). This provides multiple levels of protection for the vital electrical components of the Inverter/Charger in the event of an electrical surge or nearby lightning strike. The selected FW-

34 | P a g e
SP-250 will protect the two inverter/chargers via thermally fused Metal Oxide Varistors (MOVs). Furthermore, since this is designed to operate between 120 to 240 VAC at 50/60 Hz and 12 to 48 VDC, it meets this systems’ voltage and frequency requirements of 230 VAC and 50 Hertz.
Appendix B.3. Mechanical Subsystem BOMs and Physical Specifications This section includes tables for the skid dimensions, physical constraints, and specifications. Table 11 shows the overall physical specifications of the skid assembly.
Table 11: Skid Assembly Overall Physical Specifications
Overall Skid Dimensions
Height (in) Width (in) Length/Depth (in) Area (in2) Volume (in3) Weight (lbs) 71.25 60 30 4402.5 132075 833.3
Table 12 illustrates the physical constraints of moving the skid through Loma Hall.
Table 12: Loma Hall Physical Constraints
Loma Doors and Elevator Constraints
Height (in)
Width (in) Length/Depth (in)
Area (in2) Volume (in3)
Elevator 90 82 52.5 7380 387450 Elevator Door Way 84 42 N/A 3528 N/A Door Way 84 35 N/A 2940 N/A
Table 13 shows the electrical component specifications for the equipment that will be mounted on the skid.

35 | P a g e
Table 13: Electrical Component Specifications
Electrical Component Physical Dimensions
Component Weight (lbs) Height (in) Length (in) Width (in) Area (in2) Volume (in3)
Laptop 17 12 16.5 12 198 2376 Charge Controller 12.2 16.25 5.75 4 93.44 373.75 AGM Concorde Battery 182 12.94 7.06 10.28 182.71 1878.29 Flex Power Unit 232 20.25 46.5 13 941.63 12241.13 Breaker Box Unit 30 9 14.1 4.1 126.90 520.29 Loads 50 15 5 10 75 750
Total 523.2 1617.7 18139.5
Table 14 shows the specifications for each compartment in the skid
Table 14: Compartment Specifications
Skid Compartment Physical Dimensions
Height (in) Length (in) Width (in) Area (in2) Volume (in3) Weight (lbs) Compartment #1 18 60 28 1080 30240 67 Compartment #2 25 60 28 1500 42000 244.2 Compartment #3 18 60 28 1080 30240 212
Table 15 shows how the electrical components relate to the compartment specifications
Table 15: Electrical Components per Compartment Specifications
Maximum Physical Dimensions of Electrical Components
Electrical Components
Max Height (in)
Max Length(in)
Max Width (in)
Total Area (in2)
Total Volume
(in3)
Total Weight
(lbs) C1 Laptop and Loads 15 28.22 15 423.3 6349.5 67.0
C2 Flex Power Unit and Charge Controller 16.25 52.25 15 849.1 12736.0 244.2
C3 AGM Batteries (2) and Breaker Unit 18 28.22 15 508.0 7619.4 212.0

36 | P a g e
Appendix B.4. Mechanical Drawings This section includes many drawings of the final mechanical skid design. These drawings can be seen below in Figures 14 thru 27.
Figure 14: Skid Assembly Drawing 1

37 | P a g e
Figure 15: Skid Assembly Drawing 2
38 | P a g e
Figure 16: Skid Assembly Drawing 3

39 | P a g e
Figure 17: Skid Assembly Drawing 4

40 | P a g e
Figure 18: Skid Assembly Drawing 5

41 | P a g e
Figure 19: Skid Assembly Drawing 6

42 | P a g e
Figure 20: Skid Assembly Drawing 7

43 | P a g e
Figure 21: Skid Assembly Drawing 8

44 | P a g e
Figure 22: Skid Assembly Drawing 9

45 | P a g e
Figure 23: Skid Assembly Drawing 10
46 | P a g e
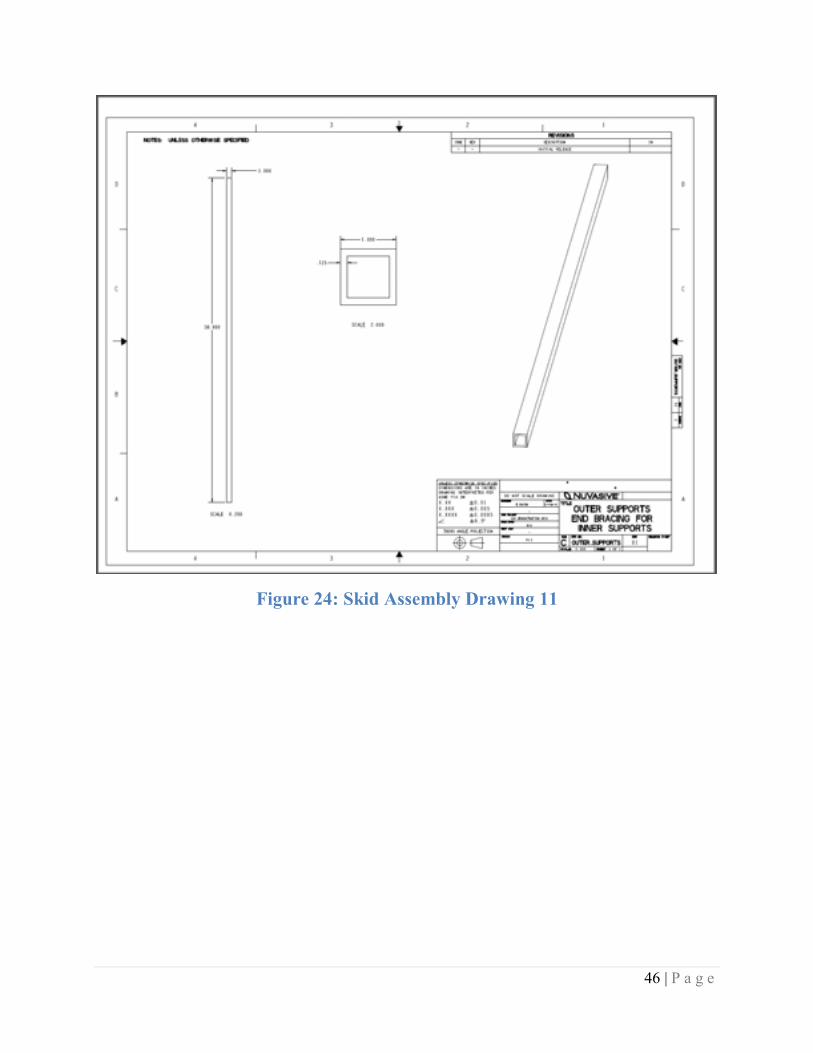
Figure 24: Skid Assembly Drawing 11
47 | P a g e
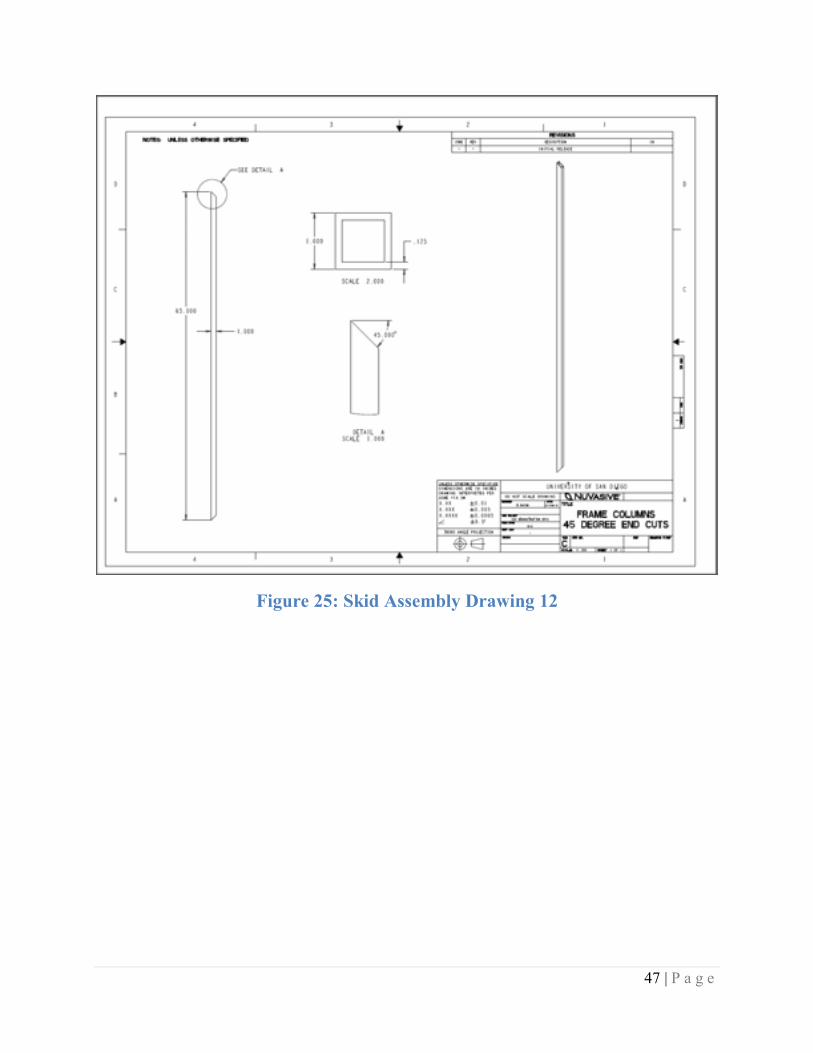
Figure 25: Skid Assembly Drawing 12

48 | P a g e
Figure 26: Skid Assembly Drawing 13

49 | P a g e
Figure 27: Skid Assembly Drawing 14

50 | P a g e
Appendix B.5. Datasheets The datasheets for all of the major electrical components are shown in this section. The datasheet for the VFX3048E OutBack inverter is shown in Figure 28 Below.
Figure 28: OutBack Inverter Datasheet

51 | P a g e
The datasheet for the OutBack FLEXmax 60 Charge Controller is shown in Figure 29 below.
Figure 29: OutBack Charge Controller Datasheet

52 | P a g e
The datasheet for the OutBack FWPV-12 Combiner Box is shown in Figure 30 below.
Figure 30: Combiner Box Datasheet

53 | P a g e
The datasheet for the two FlexWare 500 enclosures is shown in Figure 31 below:
Figure 31: FlexWare 500 Datasheet
The datasheets for the OutBack HUB and MATE are shown in Figures 32 and 33 on the next page.

54 | P a g e
Figure 32: OutBack MATE Datasheet
Figure 33: OutBack HUB Datasheet
The datasheet for the FlexNET DC is shown in Figure 34 on the next page.

55 | P a g e
Figure 34: FlexNET DC Datasheet

56 | P a g e
Appendix B.6. Operation and Maintenance Manual
Operation & Maintenance
1. Turning the Lights on/off
1.1 To turn on the lights,
1.2 Flip the switch up as shown in figure 1.
1.3 Flip the switch down to turn off as shown in figure 2.
ON OFF
Figure 35: Light Switch ON Figure 36: Light switch OFF
(http://www.gosolarenergyforlife.com) (http://www.gosolarenergyforlife.com)
Figure 37: Solar modules

57 | P a g e
2. Modules
2.1 How to measure voltage of a solar module
2.1.1 Unplug the panel from the rest of the panels
2.1.2 Plug the (+) end of the measuring wire to the (+) terminal of the
voltmeter and (-) end into the (-) terminal
2.1.3 Make sure the voltmeter is set to measure voltage
2.1.4 Clamp the other end of the black wire (-) to the negative (-)
terminal of the panels (on the back side), next, clamp the positive
end of the red wire to the positive terminal of the panel.
2.1.5 Output should now be shown on the voltmeter display
Figure 38: How to measure voltage/current of solar module (http://cleantechnica.com)

58 | P a g e
2.2 Cleaning the Panels
2.2.1 Use the soapy water to wash the surface of the solar panels,
2.2.2 Brush away any visible dust or streaks. Gentle scrubbing may be
necessary as shown in figure 6 below.
2.2.3 After wiping away dirt, dry the panels off with a dry towel
Figure 39: cleaning the panels: (http://www.smu.edu)

59 | P a g e
Figure 40 (http://solarmetalfoil.com/)
3. Batteries
3.1 Battery Health
3.1.1 Measuring Voltage of Battery
3.1.1.1 Use a voltmeter
3.1.1.2 Make sure the batteries are disconnected from the
charge controller
3.1.1.3 Have the batteries sit for a few hours after disconnecting
them from the system
Take caution! Batteries are extremely dangerous if improperly handled, installed, or maintained
** Do not short the batteries by connecting the negative and positive terminals of the same battery! This completes the circuit and could result in large spark and could possibly cause a figure, a dangerous electrical shock, and other hazards.

60 | P a g e
Figure 41 (http://www.sunwindproducts.com)
Shown above in figure 8 is an example of how to measure the voltage of the
battery, be sure to connect the red and black terminals to their correct
locations on the battery and into the multimeter

61 | P a g e
3.2 Wiring the Batteries
3.2.1 Parallel Connection:
3.2.1.1 Use this to connect two series together by connecting
the negative and positive terminals together as shown below
at the top and bottom of figure 9.
3.2.2 Series Connection
3.2.2.1.1 Use this to connect batteries together in series by
connecting the positive terminals of one battery to the
negative thermal of the other. Example is in figure 9
below in the middle wires with red and black ends.
Figure 42: (http://www.sunwindproducts.com)
**Take caution when wiring the batteries**

62 | P a g e
Figure 43 Figure 44
4. Circuit Breakers:
4.1 A Circuit breaker, as shown above in figure 10(many) and 11 (one), is
a device designed to open and close a circuit by nonautomatic means
and to open the circuit automatically on a predetermined overcurrent
without damage to itself when properly applied within its rating. ((NEC))
4.2 To open and close a circuit breaker; flip the switch down to close,
as they are automatically on the closed (on) position unless
something causes them to trip (move to open circuit position).
4.3 To turn them on, simply flip the switch to the up position, a sign
indicating the on and off position will normally be displayed above
and below the switch just in case the on and off positions have been
reversed.

63 | P a g e
Figure 45: two outback inverters (Outbackpower.com)
5. Inverters
5.1 These inverters are set to be on all the time, the only way to turn
them off is to turn off the two main breakers, pointed to in figure 12
above, that take power from the battery.
5.2 To cut off the power from the inverters to the loads; turn off the
AC breakers located in the AC service panel, which has the (8) AC
breakers, and also has (4) other (bigger) AC GFCI breakers.
**Refer to page 6 of the installation manual for more detailed description of the DC side of the inverter and to page 7 for the AC.
Inverter DC Breakers

64 | P a g e
Figure 46: outback charge controllers: (Outbackpower.com)
6. Charge Controllers
6.1 How to cut off power from the array
6.1.1 Turn the two breakers off that are located on the left side of
the main inverter DC breakers.
6.2 How to turn them on/off
6.2.1 To turn off: press and hold the power button
6.2.2 To turn on: press the power button
7. Trouble Shooting

65 | P a g e
7.1 Common System Faults
7.1.1 These are some of the most common system faults
Blown Fuses
Tripped Breakers
Bad Connections
7.2 Check these before any further actions
Has the weather been cloudy for several days? If so, system may need
recharging
Check the Array for shading, clean if dirty
Check system for any loose connections
Check all fuses and circuit breakers to make sure non of them have tipped
7.3 The lights do not turn on
Check batteries
Check inverter
Check circuit breaker (AC)
Check inverter status
7.4 Trouble Shooting Wiring Problems Using a Multimeter
Measuring AC and DC voltage
Measuring AC and DC current
Check the polarity of DC voltage
Be sure to acquaint yourself with the volt-ohm-milliamp (VOM) meter. Refer to the
operator’s manual for proper use of this meter

66 | P a g e
7.5 Measuring Voltage
7.5.1 Set the meter to measure DC voltage if measuring voltage/current
at any point in the circuit prior to the inverter. Set it to AC voltage
if measuring at any point in the circuit after the inverter.
7.5.2 Set the range indicator to appropriate scale, if not sure, set it to
the highest scale
7.5.3 Plug the black test lead into the common (-) jack and plug red test
lead into the (+) jack as shown in figure 15 below.
Figure 47: using a multimeter: (http://www.ehow.co.uk)

67 | P a g e
7.6. Troubling Shooting Specific Problems
7.6.1. Problem: Load is inoperative
Possible cause Solutions
Fuse is blown or the circuit breaker tripped
Check fuses and replace if found faulty. Check and reset circuit breaker if found to have tripped
Circuit open because of break in wire or there is a loose connection
Check for continuity of circuit through the load
Appliance has overheat protection Wait for appliance to cool down and reset its thermal protection
7.6.2 Battery over/ under charging Possible cause Solutions
Controller is not receiver proper battery voltage
Check connections to and from the battery Check battery temperature Check voltage/current from charge controller to battery displayed in the mate
Batteries are too hot Inspect battery sensor, check for any wire damage Cut off the power to batteries from charge controller and let them cool for a while
7.6.3 Charge Controller not operating properly
Possible cause Solutions
Controller is not receiver proper battery voltage
Check connections to and from the battery Check battery temperature Check voltage/current from charge controller to battery displayed in the mate

68 | P a g e
Batteries are too hot Inspect battery sensor, check for any wire damage Cut off the power to batteries from charge controller and let them cool for a while
7.6.4 Array Breakers Blows
Possible cause Solutions
Current through circuit exceeds breaker rating
Let breakers be off for a while, this might be caused by an exceptionally Turn them on again after an hour or two

69 | P a g e
Appendix C: Other Documentation This section shows an updated schedule and budget for the project as well as details on the responsibilities of each team member.
Appendix C.1. Schedule The updated schedule for the second semester of the Senior Design Project is shown below in Table 16.
Table 16: Project Schedule
Date Assignment Priority
February 15th 2011 Ability to Communicate with MATE
using LabVIEW Program Complete
February 25th 2011 Finalize all Lighting Designs and
Photometric Layouts Complete
March 1st 2011 Finalize all Structural Designs Complete March 1st 2011 Finalize Comprehensive Safety Plan Complete
March 22nd 2011 Complete Skid Construction Complete March 24th 2011 Critical Design Review Complete March 24th 2011 Critical Design Presentation Class Requirement
March 29th 2011 Upscale system to include additional Solar Panels Medium
April 14h 2011 Diagnostics Program Complete High April 28th 2011 Full Working Scaled System High April 28th 2011 Project Deliverables Complete High May 6th 2011 Final Design Report Class Requirement May 6th 2011 Spring Engineering Open House Class Requirement

70 | P a g e
Appendix C.2. Budget An updated budget for the project is shown below in Table 17.
Table 17: Project Budget
Item Price
RWL-2-1-x4-3L32-HP $437.85
EML-4-1x4-4L54 $338.24
Light Switch $23.00
$799.09
FlexPower 2-22 $5,599.95
Remote Temperature Sensor $34.94
FlexMax 60 Charge Controller
$530.00
Breaker Panel $169.95
5 Piece Outlet Adapter $9.99
Standard Outlet $3.00
Conduits $22.00
14 Gauge Wire $14.00
TSM 230 PA05 Solar Panels $311.84
Combiner Box $126.22
6 Gauge Transmission Wires $0.00
AGM Batteries $8.93
4/0 Battery Cable $190.00
2/0 Battery Cables $48.00
MATE $222.22
HUB 10 $281.38
FLEXnet DC $275.15
RS232 to USB Cable $21.99
LabVIEW $0.00
Laptop $0.00
80 Amp DC Breaker $23.00
120 Amp AC Breaker $38.00
Ground Fault Protector $113.78
Terminal Bus Bar $19.00
Flexware Surge Protector $193.73
14 USS Gauge Sheet Metal $267.88
3/4" Steel Square Tubing $328.53
1.0" Steel Square Tubing $596.07
Swivel Wheel Plate Caster $54.30
Rigid Wheel Plate Caster $44.06
Douglas Fir Green Lumber $19.28
Zinc Plated Steel Crown Bolt $5.58
Zinc Plated Steel Crown Bolt $5.98
Total $10,377.84

71 | P a g e
Appendix C.3. Personnel Power Delivery Subsystem (Emmett Perl)
Integration of all electrical components into the final system Programming of the charge controller and inverter for a 48 Volt system Wiring of the battery bank (2 parallel connections of 2 batteries) Connection from the output of the inverter to the AC service panel Wiring of standard type D outlet for the system Wiring of light switches/motion sensors wired to control lights Programming of LabVIEW to sort data from OutBack MATE Design of LabVIEW front panel for power flow program
Mechanical Engineering Subsystem (Enrique Rayon)
Installation of entire prototype system (responsible for integration of all subsystems) Wiring from solar panel location (Loma Hall roof) to demonstration location in Loma
311. Received permission from Dr. Malicky and Dr. McGarry to utilize Loma 311 along with the preexisting wiring from the Wind Turbine on the roof of Loma. Loma 311 will serve as our work room and demonstration room from now until the end of the semester.
Skid design and construction
After careful consideration and discussion with Dr. McGarry, Dr. Lord and Dr. Pateros the mechanical engineering subsystem deliverable was decided to be an electrical skid. Specifically the subsystem development will involve the design for the skid that will house all the major components of the prototype system excluding the solar panels and combiner box. The skid will house the inverter, charge controller, batteries, diagnostic components (hub, mate, RTS sensor), and lighting fixtures. The skid will have to be a mobile unit that takes into consideration the overheating of electrical equipment in close proximity (thermal readings of all electrical components may be required). In addition the skid will accommodate the wiring/integration needs of the equipment. One of the fundamental design goals of the skid is aesthetics, namely the presentation of all the system components in an organized and easily identifiable manner.
Diagnostic Subsystem (Michael Rios)
Use LabVIEW to extract data from the OutBack MATE. Visual display of system data in both a graphical and text format that can be easily
interpreted and understood by someone with no electrical or engineering experience (i.e. a ten year old)
Battery health and gauge as well as system power flow display. Instructions for system debugging in the presence of a system error. Error and failure simulations

72 | P a g e
All interfacing with the customer must be clear and meaningful. The customer needs to be able to quickly, effectively and easily troubleshoot the system failure(s) and or error(s). Ideally the system will diagnose individual component failures (i.e. solar panels and batteries). This may be accomplished with a “smart” system or with a protocol in place that directs the customer to use a Voltmeter or other instrument to test an isolated area.
Electrical Safety and Maintenance Subsystem (Mou Riiny)
Electrical Safety
All electrical safety codes will be done according to the NEC Conduits will be used to safeguard equipment contact with live wires Warning labels will be used where appropriate All electrical controls will be housed in a safe, lockable room All those who will be maintaining the system will be trained on electrical safety, a
manual will be developed to communicate basic electrical safety information Ground fault circuit interrupter (GFCI) will be used where there is a lot of human contact
Maintenance
Maintenance for all equipment will be written in a manual School administrators will be trained on how to maintain the system Equipment that requires more maintenance will be emphasized in manual and training Open line of communication will be kept between school administrators and team
members Extra equipment will be brought in for future replacement if deemed necessary
The deliverable for the safety and maintenance subsystem is training guides/manuals. The goal is to inform the customer in a clear, concise, effective manner. Guides, manuals, presentations, etc. may be used to communicate any necessary information critical to safety and or maintenance. The guides/manuals/presentations will capture a majority if not all of the points listed above under Electrical Safety and Maintenance.