elder economic security standard™ index for california,...
TRANSCRIPT
ElderEconomicSecurityStandard™IndexforCalifornia,2011
MethodologyReportJune2013
Prepared by: D. Imelda Padilla‐Frausto, MPH Steven P. Wallace, Ph.D. In collaboration with Insight Center for Community Economic Development Oakland, CA Based on the methodology originally developed by: Laura Henze Russell and Ellen A. Bruce, Gerontology Institute, John W. McCormack Graduate School of Policy Studies, University of Massachusetts Boston with Wider Opportunities for Women, Washington, DC

The Elder Economic Security Initiative™ project in California, which this report is part of, is led by the Insight Center for Community Economic Development, Oakland, California, with the guidance of a statewide steering committee. The California project is part of a national initiative led by Wider Opportunities for Women (WOW), Washington, DC, which holds the trademarks to Elder Economic Security Standard Index, Elder Economic Security Initiative project, and Elder Index. The national methodology was developed by the Gerontology Institute at UMass‐Boston and WOW. The UCLA Center for Health Policy Research refined the methodology and applied it to California. Funding and support for the 2011 California Elder Index update has been provided by The California Wellness Foundation. For funding information of previous years see: http://www.healthpolicy.ucla.edu/elder_index10sept.aspx
www.insightcced.org www.wowonline.org
The views expressed in this report are those of the authors and do not necessarily represent the UCLA Center for Health Policy Research or the Regents of the University of California. Copyright 2011, The Regents of the University of California. All Rights Reserved. The UCLA Center for Health Policy Research is affiliated with the UCLA School of Public Health and the UCLA School of Public Affairs. Visit the center’s website at http://healthpolicy.ucla.edu
This report and supporting materials are available at http://healthpolicy.ucla.edu/elder‐index2011

TableofContents
INTRODUCTION ........................................................................................................................................................... 1
COST COMPONENTS OF THE CALIFORNIA ELDER INDEX ...................................................................................... 1
HOUSING ..................................................................................................................................................... 2 Owner Costs ......................................................................................................................................... 3 Renter costs .......................................................................................................................................... 6
FOOD .......................................................................................................................................................... 6 HEALTH CARE ............................................................................................................................................... 8 TRANSPORTATION ....................................................................................................................................... 11 OTHER COSTS ............................................................................................................................................. 12 DATA SOURCES & METHODS SUMMARY ......................................................................................................... 14
ADDITIONAL INFORMATION ................................................................................................................................... 15
NATIONAL DATA COMPARISON ...................................................................................................................... 15 NATIONAL COMPARISON .............................................................................................................................. 16 BACKGROUND/HISTORY OF THE NATIONAL INITIATIVE ....................................................................................... 17 ABOUT THE LEAD ORGANIZATIONS ................................................................................................................. 18 AUTHOR INFORMATION................................................................................................................................ 18 FUNDING ................................................................................................................................................... 19 SUGGESTED CITATION .................................................................................................................................. 19

UCLA Center for Health Policy Research ● 1
Introduction The Elder Economic Security Standard™ Index (Elder Index) is a measure of income adequacy for older adults. The Elder Index benchmarks basic costs of living for elder households. It illustrates how costs of living vary by county and are based on the characteristics of elder households: household size, homeownership type or renter and health status. The costs include housing, food, health care (based in part on the availability of Medicare Advantage plans in their county), transportation, and miscellaneous costs. The costs are for the basic needs of elder households; they are based on market costs and do not assume any subsidies.
The Elder Index was originally developed by Wider Opportunities for Women in collaboration with the Gerontology Institute at the University of Massachusetts Boston. After being launched in Massachusetts, the Insight Center for Community Economic Development in Oakland launched the Elder Index in California. They partnered with the UCLA Center for Health Policy Research to adapt the Elder Index for the circumstances in California and to calculate the Elder Index amounts and determine the number of older adults who fall below those amounts.
The 2007 Elder Index was released in February 20081, with the data on the number of older Californians with incomes below the 2007 Elder Index released in February 2009.2 The 2009 Elder Index was released in September 2010.3 This current methodology report details the procedures used to calculate the 2011 Elder Index amounts for California. It continues to follow the national methodology4, with sanctioned modifications that better represent California’s circumstances.
CostComponentsoftheCaliforniaElderIndexOne of the strengths of the Elder Economic Security Standard Index is that it is based on the actual costs of housing, medical care, food and transportation.5 Economic measures like the Elder Index more accurately meet legislative staffs’ stated data and information needs and can be used to inform policy decisions that address issues with economic insecurity.6 The following
1 For the 2007 Elder Index, see http://www.healthpolicy.ucla.edu/elder_index08feb.aspx 2 For the number of older adults with incomes below 2007 Elder Index, see http://www.healthpolicy.ucla.edu/elder_index09feb.aspx 3 For the 2009 Elder Index, see http://www.healthpolicy.ucla.edu/elder_index10sept.aspx 4 For the national methodology, see http://www.wowonline.org/ourprograms/eesi/eess.asp 5 For a discussion of how the Elder Index is a better measure of income adequacy than the Federal Poverty Guideline in California, see Wallace SP, Padilla‐Frausto, DI, Smith, SE. Older Adults Need Twice the Federal Poverty Level to Make Ends Meet in California. Los Angeles: UCLA Center for Health Policy Research, 2010. Available at: http://www.healthpolicy.ucla.edu/elder_index10sept.html. For information on how the Elder Index is being used in California see http://www.insightcced.org. 6 The California Legislature was surveyed about their economic data and information needs. For the results and discussion of the survey findings, see Padilla‐Frausto DI, Wallace SP. The Federal Poverty Level Does Not Meet Data Needs of the California Legislature. Los Angeles: UCLA Center for Health Policy Research, 2012. Available at: http://www.healthpolicy.ucla.edu/pubs/Publication.aspx?pubID=550 .
UCLA Center for Health Policy Research ● 2
sections describe how each of the major cost components is anchored to data on the costs for older adults in California.
Three years of data are used to calculate a three‐year moving average for three of the five cost components: housing, food, and transportation. The health care component consists of actual costs for Medigap and Medicare in 2011 and a three‐year moving average for out‐of‐pocket expenses. The data sources for housing, food, transportation and out‐of‐pocket healthcare expenses are population based surveys. We use a three‐year moving average in the 2011 estimates after examining the precision of the estimates from the population based data sources as well as the volatility of some measures such as food and transportation. The three year average provides a larger sample over three years, which allows for more precise cost estimates at the county level as well as more stability in the data when costs rapidly increase then decrease, as often occurs with fuel costs and has occurred with housing costs in 2009. The U.S. Census bureau has similarly opted for a multi‐year moving average for its calculations of the new supplemental poverty measure.7 When 2009‐2011 data were not available, the most recent data was used and then inflated to the June 2011 value using Consumer Price Index data.
HousingHousing costs are determined by a number of factors, the most significant of which have been incorporated in the calculations for the housing component. They include housing tenure (renter, owner with a mortgage, owner without a mortgage), county of residence, and housing‐related costs such as heat, utilities, insurance, property taxes, and condo assessment fees. The Elder Index assumes that the housing costs are the same for an older person living alone or with a spouse.
Some items that are not explicitly included in the housing component for any housing type are implicitly included in the “miscellaneous” category. For instance, property taxes are explicitly included in homeowner costs. In California, property taxes are capped at about 1% of the assessed value when the property is purchased, with no more than a 2% annual increase subsequently in the assessed value that is taxed. For long‐time homeowners, such as many older persons, this results in significant savings.8 Other costs that are implicitly included in the miscellaneous category are home repairs, telephone, and some taxes such as sales tax.
Home repairs and telephone service are both included under housing costs in the Consumer Expenditure Survey (CEX), however, we do not use the CEX for our calculations because the comparatively small sample size of the CEX does not allow for county‐level estimates. In addition, home repairs are episodic costs that are not available in the data we use and are likely to vary widely. Furthermore, California had a “lifeline” telephone rate in 2011 designed for low‐
7 See Observations from the Interagency Technical Working Group on Developing a Supplemental Poverty Measure. March 2010. http://www.census.gov/hhes/www/poverty/SPM_TWGObservations.pdf 8 California State Board of Equalization. California Property Tax, An Overview. Pub 29. 2009. http://www.boe.ca.gov/proptaxes/pdf/pub29.pdf

UCLA Center for Health Policy Research ● 3
income residents with incomes (single or couple) of under $25,100 per year, which provided basic telephone service at a cost between $2.91 and $3.66 per month in all counties.9
OwnerCostsBetween 2009 and 2011, approximately 32% of all low‐income10 older adults in California owned their homes free and clear (no mortgage) and 23% owned but were still paying a mortgage. Because of the significant proportion of older adults who pay a mortgage, we present data on both ownership types.
The 2011 California Elder Index calculated owner costs using data from the 2009‐2011 American Community Survey (ACS).11 This is a large survey conducted by the U.S. Census Bureau that is designed to replace the “long form” of the decennial census. The data were obtained from http://usa.ipums.org/usa/, a university‐based data archive that allows users to subset the exceptionally large dataset into areas (e.g. California), populations (e.g. age 65 and over), and specific variables to create smaller and easier to use datasets. For each respondent, information on the following costs (variable name in parenthesis) are available in the dataset:
age of respondent (age),
location of respondent residence (stateicp, puma),
owner versus renter (ownershpd),
presence and amount of a primary mortgage (mortgage, mortamt1),
presence and amount of a secondary mortgage (mortgag2, mortamt2),
utilities costs (costelec, costgas, costwatr, costfuel),
taxes and insurance (taxincl, insincl, propinsr, proptx99),
other ownership fees (condofee, moblhome),
the number of households that each respondent represents is provided by a “weight” variable (hhwt)12
Some data was reported as annual amounts and so were divided by 12 to calculate monthly costs. Taxes were reported in ranges, not exact amounts, so the midpoint of each range was used in the calculations. Once all variables were converted into continuous variables of dollars per month, the housing variables were all added together to create a “total owner costs” variable.
The dataset was subset to only include those aged 65 and over in California. In order to get data by county, a county variable was created using the Census Bureau’s sampling unit called
9 For rates on measured local telephone service, see types of discounts available for California lifeline at http://www.cpuc.ca.gov/PUC/Telco/Public+Programs/ults.htm 10 Low‐income is under 200% of the federal poverty level; data on housing tenure from the 2009‐11 American Community Survey. 11 Steven Ruggles, J. Trent Alexander, Katie Genadek, Ronald Goeken, Matthew B. Schroeder, and Matthew Sobek. Integrated Public Use Microdata Series: Version 5.0 [Machine‐readable database]. Minneapolis: University of Minnesota, 2009. 12 To use household weights, duplicate household id (serial) were removed to create a household level dataset.

UCLA Center for Health Policy Research ● 4
PUMAs, which were the smallest unit available on the ACS public use file. Both an ASCII file provided by IPUMS as well as maps of California by PUMA were used to categorize PUMAs into counties. The Census Bureau combined smaller counties into single PUMAs since each PUMA includes a minimum sample size and smaller counties did not have large enough populations. In general, counties are aggregated until the total population size exceeds 100,000 residents to create a PUMA. For the 2007 and 2009 Elder Indices, there is a single value for owner costs for the following clustered counties:
(1) Del Norte, Lassen, Modoc, Siskiyou (2) Colusa, Glenn, Tehama, Trinity (3) Nevada, Plumas, Sierra (4) Sutter, Yuba (5) Monterey, San Benito (6) Alpine, Amador, Calaveras, Inyo, Mariposa, Mono, Tuolumne (7) Lake, Mendocino In the 2011 Elder Index update, separate estimates for housing costs were calculated for each of the small counties using Census tables from American Fact Finder and Census data from the American Community Survey. All other large counties have owner data for the individual county. Counties with large populations contain multiple PUMAs, which were combined to form the county. Because of the exceptionally large size of Los Angeles County, and the presence of two AAAs in the county, we divided the county into Los Angeles City and the rest of Los Angeles County. We refer to both the county clusters of small counties noted above, as well as the split LA City‐County, generically as “counties.”
For housing costs in large counties, separate estimates were obtained for homeowners with a mortgage and for homeowners without a mortgage. From the ACS PUMS we calculated the median owner costs for older adults (with and without mortgage separately) in the 233 PUMAs in the state including the 7 clustered counties mentioned above. To determine homeownership status, the ACS data variables “mortgage” and “mortgag2” were used; if both variables indicated no current mortgage, we classified the owner as “own free and clear.” Others with first or second mortgages of any amount are classified as “with a mortgage or loan”.13 The median housing costs by county for the two ownership categories were calculated using SAS.
For housing costs in small counties, separate estimates were obtained for homeowners with a mortgage and for homeowners without a mortgage for each small county. The U.S. Census American Community Survey (ASC) does not provide individual country identifiers in their public use microdata for geographies under 100,000 population. For confidentiality reasons, they combine small counties until the 100,000 threshold is reached. This lowest geographical unit is called a PUMA, which can contain several small counties. To identify the median older adult owner housing costs for those small counties (e.g. Alpine County with a total county population of 1,200 persons) we needed to estimate the housing cost differences between the counties. Using Census tables that does contain county‐level cost data for all ages (not for older
13 This gives the same result as using the Census recoded variable, “ownershipd.”

UCLA Center for Health Policy Research ● 5
adults only) we calculated a county‐to‐PUMA ratio for the median housing cost for all ages. We then applied that ratio to the PUMA‐level median housing costs for adults age 65 and over for each small county. When multiple counties are combined in the ACS public use data, the median owner costs were calculated as follows:
1. Two datasets were used:
a. The three year 2009‐2011 public use microdata sample (PUMS) of the American
Community Survey (used above to calculate the median owner costs for older
adults for all counties including the clustered small counties. The data for the
clustered small counties are used in step 5 below.)
b. The five year 2007‐2011 ACS published tables in American Factfinder of the ACS
(used to calculate the county‐to‐PUMA ratio owner costs for all ages)
http://factfinder2.census.gov/faces/nav/jsf/pages/searchresults.xhtml?refresh=t
2. From American Factfinder (AFF) median owner costs were obtained for all ages at the
PUMA‐level.14
a. Table B25088 for Median owner costs for ALL ages
i. Variable HD01_VD03 for median owner costs with a mortgage for all ages
ii. Variable HD01_VD04 for median owner costs without a mortgage for all
ages
3. Median owner costs for all ages were also obtained from AFF for all of the small
counties at the county‐level.15
a. Table B25088 for Median owner costs for ALL ages
i. Variable HD01_VD03 for median owner costs with a mortgage for all ages
ii. Variable HD01_VD04 for median owner costs without a mortgage for all
ages
4. For each county in a county cluster, the individual county costs for all ages in that
particular cluster (numerator) were divided by the PUMA‐level costs (denominator) in
that cluster to calculate a county‐to‐PUMA ratio. For example, from the AFF tables, the
median housing cost for a homeowner among all age groups in Alpine was $2,357 at the
county‐level and $1,855 at the PUMA‐level, therefore the county‐to‐PUMA ratio for
Alpine is 1.27 ($2,357/$1,855).
5. To estimate county‐level housing costs for older adults, the median owner costs for
older adults for each of the seven clustered county amounts calculated from the ACS
PUMS was multiplied by the county‐to‐PUMA proportion for each county in that cluster.
Building on the previous example, the median owner costs for older adults in the
clustered counties that include Alpine was $1,524 (from ACS PUMS). This amount was
14 To get PUMA level data for each table: Go to AFF website click on “Geographies”, select the “Name” tab, select “Summary Level” data and scroll down and click on 795 ‐ Public Use Microdata Area (PUMA) , under “Geography Name” heading select the state you want. Close that window. Then enter Table ID in “Narrow your search”. 15 To get county‐level data for each table: Go to AFF website click on “Geographies”, select “County”, select “California” and then select one of the small counties. Repeat for each small county.

UCLA Center for Health Policy Research ● 6
multiplied by the county‐to‐PUMA proportion of 1.27 resulting in an estimated housing
cost of $1,936 for older adults in Alpine.
RentercostsOver two‐fifths (42%) of older adults with low‐incomes in California rent, according to the 2009‐11 ACS. The U.S. Department of Housing and Urban Development (HUD) publishes annual fair market rent (FMR) estimates for all ages for all counties, but not by subcounty areas (e.g. LA City versus LA County).16 The Los Angeles City Housing Department uses the County FMR, so the LA County data is used for both the City and County. The fair market rent for a one‐bedroom apartment was used for the housing cost component for both singles and couples. The FMR measures rental costs at the 40th percentile in each county, together with utilities that are not otherwise included in the rent. The FMR does not include telephone service (see discussion above on housing costs).
FoodThe Elder Economic Security Standard Index food cost component includes only food consumed at home and is based on the U.S. Department of Agriculture’s (USDA) Low‐Cost Food Plan. This food plan is designed to provide a low cost, nutritionally adequate diet for persons based on their age and gender. It was designed to reflect food consumption at the 25th‐50th percentile of average food expenditures nationally.17 The USDA publishes monthly estimates for the country as a whole (without regional variation) and has separate values for an individual child, adult male, and adult female categorized by certain age groups, as well as adult families of two and families of four persons. Three years of data (2009, 2010 and 2011) were used to calculate a moving average for the 2011 Elder Index. Three separate values for all years were used to calculate the food component. For June 2009 through 2011, the three values used were ‐ individual male aged 71 and over, individual female aged 71 and over, and family of two aged 51 to 70 years. For 2009 through 2011, there were two older adult age groups: ages 51‐70 and ages 71 and over. We used the food plan for the 71 and over age group because it provided a more conservative amount between the two older adult age groups. In June 2011 for males 51‐70 years, the low‐cost monthly food plan was $215.10, which was $2.00 more than for males 71 and over. For females 51‐70, the low‐cost monthly food plan was $192.50, which was $1.60 more than for females 71 and over.18
The published USDA food plan amounts are uniform across the whole country. To obtain California‐weighted monthly food costs for individual elders (who are a mix of men and women), the Low‐Cost Food Plan monthly amount for individual males aged 71 and over was averaged with the monthly amount for individual females aged 71 and over. The numbers were weighted to reflect the gender distribution in California, which is 45% male and 55% female, based on the gender distribution for adults ages 65 and over in the 2009‐2011 American
16 http://www.huduser.org/datasets/fmr.html 17 USDA, The Low‐Cost, Moderate‐Cost, and Liberal Food Plans: 2003 Administrative Report. At http://www.cnpp.usda.gov/Publications/FoodPlans/MiscPubs/FoodPlans2003AdminReport.pdf 18 USDA, Cost of Food at Home. http://www.cnpp.usda.gov/USDAFoodCost‐Home.htm

UCLA Center for Health Policy Research ● 7
Community Survey. The USDA calculations assume that people live in households of four people and can benefit from economies of scale in purchasing and preparing food. Therefore, when we calculate the values for elders living alone we have to increase the per person costs by 20%. For example, a single year calculation for individuals in 2011 is: $213.10 = monthly amount using individual male 71+ using USDA Low‐Cost Food Plan $190.90 = monthly amount for individual female 71+ using USDA Low‐Cost Food Plan ($213.10)(.45) + ($190.90)(.55) = $200.89 * 1.2 = $241 Similar calculations were done for the other two years (2009 and 2010). A single year calculation for an elder couple, for example, was $448 in 2011 can also be obtained from the USDA Low‐Cost Food Plan for a family of two aged 51 to 70 years.18 The elder couple amount do not need to be weighted to the gender distribution for California since it includes both men and women equally, nor for economies of scale since the USDA already included the family‐size adjustment in their published costs for couples. Similar amounts were obtained for the other two years (2009 and 2010).
Each year’s food cost calculations were then adjusted for regional variations for the corresponding year. Data on regional variations in the cost of food (i.e. grocery items in Section 2 Index) was obtained using the ACCRA Cost of Living Index for 2009, 2010 and 2011 for the 10 California Metropolitan Statistical Areas (MSAs) covered by their published data.19 Only MSAs with published data for at least two of the three years were used. The food cost data for all MSAs were obtained by WOW from ACCRA, and the California data was provided to the UCLA Center for Health Policy Research. We used those values to determine the relative costs of food in the surveyed counties compared to the national average. An example of the data can be found at http://cgi.money.cnn.com/tools/costofliving/costofliving.html and http://www.bankrate.com/brm/movecalc.asp. The separate ratios for Riverside, Palm Springs, and San Bernardino, were averaged together since all three are in the same MSA and have overlapping purchasing areas. For example, the counties and their costs for 2011 relative to the national average (in parentheses) were: Alameda/Contra Costa (114%), Fresno (110%), Kern (107%), Los Angeles (108%), Orange (108%), Riverside/San Bernardino (109%), Sacramento/Placer/Yolo (110%), San Diego (107%), San Francisco/San Mateo (116%), and Santa Clara (115%).
The ratio for each MSA was multiplied by the national USDA Low‐Cost Food Plan amount for individuals described above ($241 for example in 2011) and by the amount for elder couple ($448 for example in 2011). For the other 43 counties we adjust the food cost data by the lowest amount, that of Kern County for 2009 and 2011 and Orange County in 2010. The decision to raise all other counties above the national average cost was based on the fact that (1) all measured counties in the state had above average costs and (2) research has consistently shown that rural areas, which comprise the majority of the remaining areas, have food costs as
19 For a summary of the ACCRA methods, see http://www.coli.org/Method.asp and for detailed methodology see, http://www.coli.org/surveyforms/colimanual.pdf .

UCLA Center for Health Policy Research ● 8
high as or higher than urban areas.20 This resulted in the lowest food cost counties in 2011, for example, being $257 for individuals and $478 for couples per month. After each year’s low‐cost food plan was adjusted by ACCRA, inflation adjustment were used to bring the 2009 and 2010 food costs to 2011 values using the June 2011 CPI data for food from the U.S. Bureau of Labor Statistics.21 Finally, after regional adjustments and cost inflations were calculated for each year and each county, the average cost for the three years was calculated to come up with a three‐year moving average for each county.
Note: The national methodology no longer uses the ACCRA data for adjusting food costs since there are not enough data points in some states. Since California is a large state with diverse costs and many ACCRA regions, the California Elder Index continues to adjust food costs to account for regional variations.
Validation Note: Since the ACCRA data is designed to represent a “management” level lifestyle,19 a sensitivity analysis was conducted for the 2007 report to see if the relative cost of food between cities in the ACCRA index varied substantially from relative costs using the USDA Low‐Cost Food Plan market basket. The ACCRA food plan contains a somewhat different mix of products than the USDA standard, such as more steak and less ground beef. We mapped the USDA selection of items and quantities onto the ACCRA purchase prices for the appropriate categories. The actual price data was obtained directly from ACCRA for the California MSAs. Several items in the ACCRA market basket were not used, such as T‐bone steak, Crisco, potato chips, Kleenex, and Cascade. Where items in the USDA market basket were not available in the ACCRA data, the quantity of that item was added to the most similar item. We then calculated the relative costs between counties for the ACCRA food total and the USDA low‐cost food plan shadow food total. Overall, the between‐city comparisons using the two methods differed by only a few percent and there was no consistent bias. Therefore, we used the unmodified ACCRA calculations for weighting county food costs to enhance its ability to be replicated and applied nationally.
HealthCare Total out‐of‐pocket health care costs for elders include premiums, deductibles, co‐payments, and other out‐of‐pocket expenses for services not covered by health insurance. Since these are actual spending costs for the year, we use data for 2011 only. For calculating the California Elder Index, we assume the elder has enrolled in Medicare, is either in an HMO (Medicare Advantage) or has purchased a private Medicare supplemental Medigap policy, and is enrolled in the Medicare prescription drug benefit (Part D). Nationally, total out‐of‐pocket costs vary by
20 Phillip R. Kaufman, James M. MacDonald, Steve M. Lutz, and David M. Smallwood. 1997. Do the Poor Pay More for Food? Item Selection and Price Differences Affect Low‐Income Household Food Costs. Agricultural Economics Report No. (AER759). U.S. Department of Agriculture. http://www.ers.usda.gov/Publications/AER759/ 21 Series ID: CUUR0400SAF11 from http://www.bls.gov/data/home.htm (“create customized tables, multiple screen,” not seasonally adjusted, West urban, current series, SAF Food at home, monthly)

UCLA Center for Health Policy Research ● 9
the health status of the older person, so we examine spending by health status (i.e. in good health vs. fair/poor or excellent/very good health).22
Enrolling in Medicare entails a number of costs. Part A (hospitalization) has no monthly premiums but does charge a deductible and potential copayments (deductibles and copayments are included in the out‐of‐pocket component, described below). Medicare Part B (physician care) requires a monthly premium in 2011 of $115.40, which is the same throughout the country.23 Part B also has deductibles and copayments, which are included in the out‐of‐pocket spending below.
The vast majority of older Medicare recipients are in HMOs or purchase private supplemental insurance to limit their liability for deductibles, copayments, and some uncovered services.24 For the Elder Index, we include the price of either a Medicare Advantage plan, OR the price of a Part B supplemental Medigap policy plus a Part D policy.
The premium amounts from the Kaiser Senior‐Advantage Plan were used since Kaiser accounts for 45% of all Medicare Advantage enrollments in California ‐‐ 786,000 of 1,749,000 enrollees25 and using a single plan standardizes the benefit package across counties. The costs for coverage by county were obtained from the Kaiser website for Northern and Southern California (the Medicare Compare website does not provide county specific rates for Kaiser).26 The costs of a Kaiser Medicare Advantage plan in 2011 varied from a low of $0 (in Los Angeles, Orange, Riverside, San Bernardino, San Diego, and Ventura Counties) to high of $99/month (in Marin and San Mateo Counties).
The costs from the Kaiser Senior‐Advantage Plan that includes prescription drugs was used for counties with over 20% of its Medicare population enrolled in a Medicare Advantage plan during the mid‐year June 2011. This information was verified from the MA State/County Penetration Reports.27. Those counties accounted for 98% of all Medicare Advantage enrollees in the state.28 In other counties, even though Medicare HMOs market various products, the low take up rates of Medicare HMOs indicate that services are not sufficiently available.
In counties with low Medicare Advantage presence we assume seniors purchase a Medigap policy. For the Medigap policy cost we use the AARP monthly Medigap rates since AARP is
22 Federal Interagency Forum on Aging‐Related Statistics. Older Americans 2012: Key Indicators of Well‐Being. www.agingstats.gov 23 Medicare and You, 2011. Centers for Medicare and Medicaid, at http://www.medicare.gov/publications 24 Over 85% of older adults nationally have some type of supplemental health insurance in addition to Medicare. See National Center for Health Statistics. Health, United States, 2009. Hyattsville, MD: 2009. Table 141. 25 Enrollment data for June 2011 located at: http://www.cms.gov/Research‐Statistics‐Data‐and‐Systems/Statistics‐Trends‐and‐Reports/MCRAdvPartDEnrolData/Monthly‐MA‐Enrollment‐by‐State‐County‐Contract.html 26https://prospectivemembers.kaiserpermanente.org/kpweb/medicare/detailpage.do?bodyContainer=/htmlapp/feature/211medicare/ca_download_ekit.html 27 County penetration reports located at: http://www.cms.hhs.gov/MCRAdvPartDEnrolData/MASCPen/list.asp 28 Counties using Medicare Advantage rate include Alameda, Amador, Contra Costa, El Dorado, Fresno, Kern, Los Angeles, Madera, Marin, Napa, Orange, Placer, Riverside, Sacramento, San Bernardino, San Diego, San Francisco, San Joaquin, San Mateo, Santa Clara, Solano, Sonoma, Stanislaus, Ventura, and Yolo. For comparision purposes, we also list Medigap rates for those counties, even though we do not use them in the calculations.

UCLA Center for Health Policy Research ● 10
available nationally, is community‐rated (meaning all seniors in a county pay the same rate, regardless of their age), and is among the largest providers of Medicare supplemental policies.
We obtained the 2011 AARP rates for Plan C directly from United Healthcare, the underwriter of AARP’s Medi‐gap plans. The rate for Plan C was used because it is the most commonly sold AARP plan. It covers hospital, nursing home, and physician deductibles and copayments. AARP plan premiums do not vary by age, but they do have a discount for persons who enroll soon after they qualify for Medicare. The rate used does not reflect this discount; we used the Tier I costs provided by United Healthcare. Costs were mostly $180.40/month, with eighteen counties having higher rates.
We also used AARP rates to calculate monthly costs for Part D prescription drug policies in those counties where we priced Medigap policies. AARP plans were selected because they are available nationally and AARP is the largest provider of Part D benefits in California and nationally. We obtained the Part D rate for the 2011 prescription drug plan from United Healthcare. All of the basic plan rates are the same for all counties in California and the 2011 AARP MedicareRx Plan of $40.10 per month was used.
Finally, out‐of‐pocket expenses were calculated at the national level since there is no statistically significant regional variation in the available data. Data are from the U.S. DHHS, Agency for Health Care Research and Quality (AHRQ), 2008, 2009 and 2010 Medical Expenditure Panel Survey, on‐line data query system.29 We used three years of available data (2008‐2010) to calculate a three‐year moving average. Using the interactive data system for each year, we obtained the median out‐of‐pocket costs for persons age 65 and over without Medicaid. The variable AGE is used to select records for those ages 65 and over only. The variable MCDEV07 (MCDEV08 and MCDEV09) =2 is used to select records for those “without Medicaid” during each year. The variable name for “out‐of‐pocket costs” is TOTSLF07 (TOTSLOF08, TOTSLF09), which is the total amount paid by self/family. Costs are given by perceived health status, which is captured in a variable name HEALTH. We recode HEALTH to group those who reported excellent or good health together and those who reported good or fair health together. After selecting records for those age 65 and over without Medicaid, the “advanced” descriptive statistics option is used to obtain the median out‐of‐pocket costs with TOTSLFO7 used as the analysis variable and HEALTH used as the classification variable.
Costs for each year are inflated to June 2011 using the CPI‐U Medical Care for the Western US. Months used for the adjustments are from July of each year to June 2011.30 Finally, a three‐year average is calculated using the adjusted costs for the three years. Data presented in the Elder Index summary tables are for “good” health, which represents about one‐third of seniors. About 46% of seniors report “excellent or very good health” and report out‐of‐pocket costs that are $181 per year less, while the 22% of seniors who report “fair or poor health” report median costs of $205 per year more.
29 http://www.meps.ahrq.gov/mepsweb/data_stats/MEPSnetHC.jsp 30 Series ID: CUUR0400SAM from http://www.bls.gov/data/home.htm (“create customized tables, multiple screen,” not seasonally adjusted, West urban, current series, SAM medical care, monthly)
UCLA Center for Health Policy Research ● 11
Note: The national methodology does not include a Medicare Advantage option because of the significantly lower Medicare Advantage penetration in most other states.
Transportation Transportation costs use automobile costs since they account for 93% of all transportation costs for older adults in the 2011 U.S. Consumer Expenditure Survey.31 The best data available is from the National Household Transportation Survey (NHTS) of 2009 that provides information for a sample of persons on the total miles driven per year. By excluding air travel and calculating median travel we intend to represent the costs of local travel.
For older persons living alone (variable name NUMADLT=1), we took the person file and calculated median annual miles driven for those with any miles driven (variable name YEARMILE) and recoded and imputed midpoints when only a range of miles driven was available (variable name YEARMIL2) for California residents (variable name HHSTATE=’CA’) age 65 and over. The weight variable used for older adults living alone was WTPERFIN.
For older persons in two‐person households (variable name NUMADLT=2) we created a household dataset. We used the person file to sum the household miles (YEARMILE) and recoded and imputed midpoints when necessary (YEARMIL2). We then merged the household file by household id (HOUSEID). Since households were being created, we used the household weight for two‐person household (WTHHFIN). We used SPSS explore command to calculate the median annual miles driven for all households with any miles driven.
The rationale for the different populations in the calculations is that elderly living alone have transportation needs, whether or not they drive. For those without a car or not driving, assigning them a $0 value fails to include any transportation needs for them. Thus, the median for elders living alone who have driving miles is more likely to reflect actual transportation needs. For couples, however, we assume that those reporting no driving miles obtain their transportation by accompanying a driving spouse. To the extent that the driving spouse increases their mileage to accommodate the nondriving spouse, total transportation needs are reflected best when considering both members of the couple household. The final calculations found older persons living alone with any miles had a median of 5,000 driving miles per year, while all individuals (with and without miles) in two adult households had a cumulative median of 7,000 miles. The dataset was downloaded from the National Household Transportation Survey website and SPSS was used to process the data.32
The average miles driven is multiplied by the Internal Revenue Service allowable per mile cost for each of the three years ($.55/mile) as of Jan 2009, ($.50/mile) as of Jan 2010, and ($.51) for the first six‐months of 2011 and ($.555) for the last six months of 2011 for an average of ($.533) for 2011 to arrive at a total annual cost estimate for each year.33 The cost estimates for 2009
31 Consumer Expenditure Survey, 2011 http://www.bls.gov/cex/2011/Standard/age.pdf 32 National Household Transportation Survey, http://nhts.ornl.gov/index.shtml 33 IRS Standard Mileage Rate for 2011, http://www.irs.gov/newsroom/http://www.irs.gov/uac/IRS‐Announces‐2011‐Standard‐Mileage‐Rates article/0,,id=216048,00.html

UCLA Center for Health Policy Research ● 12
and 2010 were inflated to June 2011 using the CPI‐U Transportation for the Western US. 34 Finally, an average was calculated using the inflated costs for the 2009, 2010, and 2011 annual cost estimates and then divided by 12 to come up with a monthly three‐year average.
Note: If the data cannot be run directly, the data are available using an on‐line data query system from the National Household Transportation Survey website.35 This system, however, only provides mean values, which overstate driving patterns due to a small number of elder drivers with high mileage.
OtherCosts The U.S. Bureau of Labor Statistic’s Consumer Expenditure Survey (CEX) http://www.bls.gov/cex/ contains a number of other categories that account for a small proportion each of spending by older adults, all of which are intended to be covered by our “miscellaneous costs.” These include apparel, household furnishings and appliances, housekeeping supplies, entertainment, and “other costs” (including books, education, insurance payments, tithing and other miscellaneous spending). There are also several other costs that the CEX places in one of our component categories (i.e. housing, food, transportation, or medical) that we have not included in those categories. Costs that we do not have direct data for, but that the CEX places in the component categories, we implicitly place instead in the “miscellaneous” category. These include home repairs and telephone. Because the California Elder Index is designed as a minimum standard, it does not include food consumption away from home, alcohol or tobacco, cable television service, or other discretionary expenses that are included in the CEX.
Some taxes are directly accounted for in our estimates (e.g. property taxes) while others are implicitly included in the other category. Payroll and income taxes are an important component of the “miscellaneous” category in the CEX. After exemptions and deductions, the effective federal income tax rate is at or near zero in 2011for most elders with incomes under the California Elder Index level. Because we assume the elder was retired there are no payroll taxes. State incomes taxes affect few seniors with incomes under the Elder Index, and those taxes are implicitly included in the “miscellaneous” category. California does not tax social security benefits, but does not follow federal exemptions for pension income. In 2011 a single older person with income under $20,252 was not required to file a state tax return, and the six tax brackets are graduated starting at 1%.36 California sales taxes are implicitly included in our estimates of consumption costs. Sales taxes range from 8.25‐10.25%, but are not assessed on food, medicines, services, and a variety of other purchases.37 This means that a limited amount of the consumption in the Elder Index is subject to sales taxes in California.
34 Series ID : CUUR0400SAT1 from http://www.bls.gov/data/home.htm (“create customized tables, multiple screen,” not seasonally adjusted, West urban, current series, SAT1 private transportation, monthly) 35 http://nhts.ornl.gov/index.shtml 36 California Franchise Tax Board. 2011 California Tax Rates and Exemptions. https://www.ftb.ca.gov/forms/2011_California_Tax_Rates_and_Exemptions.shtml 37 California State Board of Equalization. Sales and Use Taxes: Exemptions and Exclusions. Pub 61. http://www.boe.ca.gov/pdf/pub61.pdf; http://www.boe.ca.gov/sutax/pdf/Archive_Rates‐4‐10.pdf

UCLA Center for Health Policy Research ● 13
In the CEX for older adults, roughly 20% of total spending is for costs other than housing, food, transportation, and medical. To be conservative, we calculate the other costs to be 20% of the calculated (housing+food+transportation+medical; not total) costs. Since these miscellaneous costs are not likely to vary dramatically by housing type, but the costs of housing do vary dramatically between owners with and without mortgages, we use the calculated costs for owners without mortgages and apply the 20% to that category, then use the owner without mortgage miscellaneous value for all housing types in each county.
UCLA Center for Health Policy Research ● 14
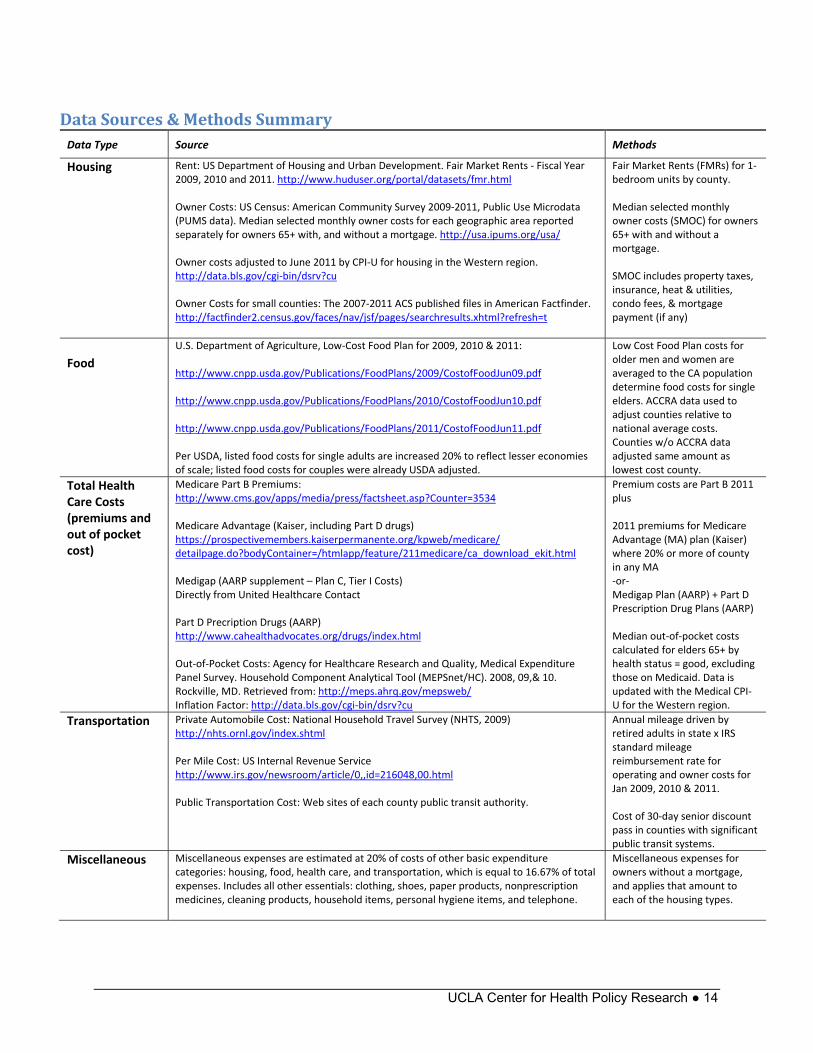
DataSources&MethodsSummary Data Type Source Methods
Housing Rent: US Department of Housing and Urban Development. Fair Market Rents ‐ Fiscal Year 2009, 2010 and 2011. http://www.huduser.org/portal/datasets/fmr.html Owner Costs: US Census: American Community Survey 2009‐2011, Public Use Microdata (PUMS data). Median selected monthly owner costs for each geographic area reported separately for owners 65+ with, and without a mortgage. http://usa.ipums.org/usa/ Owner costs adjusted to June 2011 by CPI‐U for housing in the Western region. http://data.bls.gov/cgi‐bin/dsrv?cu Owner Costs for small counties: The 2007‐2011 ACS published files in American Factfinder. http://factfinder2.census.gov/faces/nav/jsf/pages/searchresults.xhtml?refresh=t
Fair Market Rents (FMRs) for 1‐bedroom units by county. Median selected monthly owner costs (SMOC) for owners 65+ with and without a mortgage. SMOC includes property taxes, insurance, heat & utilities, condo fees, & mortgage payment (if any)
Food
U.S. Department of Agriculture, Low‐Cost Food Plan for 2009, 2010 & 2011: http://www.cnpp.usda.gov/Publications/FoodPlans/2009/CostofFoodJun09.pdf http://www.cnpp.usda.gov/Publications/FoodPlans/2010/CostofFoodJun10.pdf http://www.cnpp.usda.gov/Publications/FoodPlans/2011/CostofFoodJun11.pdf Per USDA, listed food costs for single adults are increased 20% to reflect lesser economies of scale; listed food costs for couples were already USDA adjusted.
Low Cost Food Plan costs for older men and women are averaged to the CA population determine food costs for single elders. ACCRA data used to adjust counties relative to national average costs. Counties w/o ACCRA data adjusted same amount as lowest cost county.
Total Health Care Costs (premiums and out of pocket cost)
Medicare Part B Premiums: http://www.cms.gov/apps/media/press/factsheet.asp?Counter=3534 Medicare Advantage (Kaiser, including Part D drugs) https://prospectivemembers.kaiserpermanente.org/kpweb/medicare/ detailpage.do?bodyContainer=/htmlapp/feature/211medicare/ca_download_ekit.html Medigap (AARP supplement – Plan C, Tier I Costs) Directly from United Healthcare Contact Part D Precription Drugs (AARP) http://www.cahealthadvocates.org/drugs/index.html Out‐of‐Pocket Costs: Agency for Healthcare Research and Quality, Medical Expenditure Panel Survey. Household Component Analytical Tool (MEPSnet/HC). 2008, 09,& 10. Rockville, MD. Retrieved from: http://meps.ahrq.gov/mepsweb/ Inflation Factor: http://data.bls.gov/cgi‐bin/dsrv?cu
Premium costs are Part B 2011plus 2011 premiums for Medicare Advantage (MA) plan (Kaiser) where 20% or more of county in any MA ‐or‐ Medigap Plan (AARP) + Part D Prescription Drug Plans (AARP) Median out‐of‐pocket costs calculated for elders 65+ by health status = good, excluding those on Medicaid. Data is updated with the Medical CPI‐U for the Western region.
Transportation
Private Automobile Cost: National Household Travel Survey (NHTS, 2009) http://nhts.ornl.gov/index.shtml Per Mile Cost: US Internal Revenue Service http://www.irs.gov/newsroom/article/0,,id=216048,00.html Public Transportation Cost: Web sites of each county public transit authority.
Annual mileage driven by retired adults in state x IRS standard mileage reimbursement rate for operating and owner costs for Jan 2009, 2010 & 2011. Cost of 30‐day senior discount pass in counties with significant public transit systems.
Miscellaneous Miscellaneous expenses are estimated at 20% of costs of other basic expenditure categories: housing, food, health care, and transportation, which is equal to 16.67% of total expenses. Includes all other essentials: clothing, shoes, paper products, nonprescription medicines, cleaning products, household items, personal hygiene items, and telephone.
Miscellaneous expenses for owners without a mortgage, and applies that amount to each of the housing types.
UCLA Center for Health Policy Research ● 15
AdditionalInformation
Nationaldatacomparison The U.S. Bureau of Labor Statistics conducts an annual survey of consumption that can be analyzed by age and income. A report by the Congressional Research Service analyzed the 2005 Consumer Expenditure Survey (CEX) for consumer units (similar to a family) headed by an older adult (age 65 and over) of different income levels.38 At the national level (Exhibit 1), couples in the lowest income category (under $30,000 per year) had median spending of $23,616. Of that spending, 30.8% went to housing and 17.5% was spent on food (both in and outside the home). Unmarried older men and women nationally both had substantially lower median spending, with a larger fraction of their incomes going to housing.
The California Elder Economic Security Standard Index (Elder Index) varies by county. The 2011 Elder Index for the statewide average is presented in Figure 2 for renters in good health. Similar to the national data on actual spending, the California Elder Index for a couple is about 40% higher than for a single older adult. In both the national data on actual expenditures of lower income elders and the California Elder Index, renting couples spend a smaller proportion of their income on housing than single older adults (since singles and couples live in similarly sized units), while couples spend a higher proportion than singles on food and health care. The consistent spending pattern between the Elder Index for an average county in California with national spending data on lower income older adults supports the validity of the methods used in calculating the California Elder Index.
The original Elder Economic Security Standard Index national methodology, and links to other states’ programs, can be found at http://www.wowonline.org/ourprograms/eesi/ and http://www.mccormack.umb.edu/centers/gerontologyinstitute/Projects.php#EESS .
38 Congressional Research Service. Consumer Spending by Older Americans, 1985 to 2005. Report RL34185. September 24, 2007. http://www.opencrs.com/document/RL34185

UCLA Center for Health Policy Research ● 16
NationalComparison Exhibit 1: Spending by persons age 65 and over, income < $30,000, U.S. 2005
30.8% 36.5% 41.6%
17.5% 11.7%9.0%
16.7% 11.6% 13.3%
11.7% 17.0%16.4%
23.3% 23.2% 19.7%
Couples ($23,616) Unmarried men ($16,448) Unmarried women
($15,080)
Housing Food Health Care Transportation Other
Source: Congressional Research Service, Consumer Spending by Older Americans, 1985 – 2005. Data from Consumer Expenditure Survey, September 2007
Exhibit 2: California Elder Index, Renter in Good Health, Statewide Average, 2011
Source: UCLA Center for Health Policy Research calculation for the 2011 California Elder Index Note:Dollar value for national data is average spending for consumer units with spending under $30,000 per year; for California data it is the value of the Elder Index.
31.7%44.5%
17.6%
13.2%
24.5%17.2%
12.3% 12.3%
13.9% 12.8%
Couples ($32,688)
Unmarried ($23,316)
Housing Food Health Care Transportation Other

UCLA Center for Health Policy Research ● 17
Background/HistoryoftheNationalInitiative The national Elder Economic Security Initiative™ (EESI) program at Wider Opportunities for Women (WOW) is a multi‐year project that offers a conceptual framework which includes concrete tools to shape public policies and programs to promote the economic well being of older adults, whether or not they have the capacity to be fully self‐reliant or are in need of certain public supports to age in place with dignity. The EESI program combines coalition building, research, education, and advocacy at the community, state, and national level. With initial support from the Retirement Research Foundation, WOW partnered with five states, California, Illinois, Massachusetts, Pennsylvania, and Wisconsin, to launch the national EESI. Additional support from The Atlantic Philanthropies has allowed the effort to expand to 13 states, with a goal of as many as 20. The project will eventually produce a national database with information on all 50 states and the District of Columbia.
Undergirding the EESI program is the Elder Economic Security Standard™ Index (Elder Index), a new tool for use by policy makers, older adults, program providers, leaders in the aging advocacy community and the public at large. Developed by the Gerontology Institute at the University of Massachusetts Boston and WOW, the Elder Index is a measure of income that older adults in good health require to maintain their independence in the community and meet their basic daily costs of living, including affordable and appropriate housing and health care. The development and use of the Elder Index promotes a measure of income that respects the autonomy goals of older adults, rather than a measure of what we all struggle to avoid ‐ poverty.
The information developed through the Elder Index helps us understand that many older adults who are not poor, as defined by the standard federal poverty level guideline, still do not have enough income to meet their basic needs. The Elder Index can be used to answer the questions such as: How much income – or combination of personal income and public programs – is needed by older adults living on fixed incomes to cover today’s rising living costs? What is the impact of public programs, such as Medicare, Medicaid, or housing assistance on meeting an elder’s basic needs?
The EESI program is guided by a National Advisory Board, which has been a resource in reviewing the design of the EESI program and considering the selection of measures and data sets for the Elder Index to ensure they are replicable and consistent. The National Advisory Board has also helped guide the strategy for maximizing the role of state EESI partners, and ensuring that a broad range of aging and caregiver organizations are included in the state coalitions being formed. State partners include: Building Economic Security for All at the Insight Center for Community Economic Development in California, Connecticut Permanent Commission on the Status of Women, The Shawnee Alliance for Seniors and the Health and Medicine Policy Research Group in Illinois, Massachusetts Association of Older Americans, Inc., Elder Law of Michigan, Inc., Minnesota Women’s Consortium, New Jersey Foundation for Aging, New Mexico Aging and Long‐Term Services Department, New York Statewide Senior Action Council Inc., Pathways PA in Pennsylvania, Washington Association of Area Agencies on Aging (W4A), West Virginia Center on Budget & Policy, and the Wisconsin Women’s Network.

UCLA Center for Health Policy Research ● 18
The California Elder Economic Security Initiative (Cal‐EESI) is led by the Insight Center for Community Economic Development (formerly NEDLC), in coordination with the national effort, led by Wider Opportunities for Women. Using the Elder Index, Cal‐EESI provides education, advocacy and outreach to policymakers, advocates, foundations and direct service providers. Cal‐EESI is powered by a broad‐based coalition of policymakers, advocates, researchers, direct service providers and public agencies, seniors, non‐profits, grant‐makers, and senior membership organizations. A statewide steering committee guides the overall direction of the initiative and identifies policy priorities—based on Elder Index data—to help close the gap between elders’ income and the high cost of living in California. Local steering committees across the state use the Elder Index data to educate local leaders and improve programs and policies for older adults.
Abouttheleadorganizations The UCLA Center for Health Policy Research is one of the nation's leading health policy research centers and the premier source of health policy information for California. Established in 1994, it is based in the School of Public Health and affiliated with the School of Public Affairs. The UCLA Center for Health Policy Research improves the public’s health by advancing health policy through research, public service, community partnership, and education. www.healthpolicy.ucla.edu The Insight Center for Community Economic Development is a nonprofit national research, consulting and legal organization dedicated to building economic health and opportunity in vulnerable communities. Founded in 1969, it works in collaboration with foundations, nonprofits, educational institutions, government and businesses to develop, strengthen and promote programs and public policy that * Lead to good jobs—jobs that pay enough to support a family, offer benefits and the opportunity to advance; * Strengthen early care and education systems so that children can thrive and parents can work or go to school; * Enable people and communities to build financial and educational assets. www.insightcced.org Wider Opportunities for Women (WOW) is a nonprofit organization that works nationally and in its home community of Washington, DC to build pathways to economic independence for America's families, women, and girls. WOW has a distinctive history in changing the landscape of women and work. For more than 40 years, WOW has helped women learn to earn, with programs emphasizing literacy, technical and nontraditional skills, the welfare‐to‐work transition, career development, and retirement security. WOW leads the National Women's Workforce Network, which is comprised of organizations committed to increasing women and girls' access to well‐paid work, the Family Economic Self‐Sufficiency Project (FESS), and the Elder Economic Security Initiative (EESI). www.wowonline.org
AuthorInformationD. Imelda Padilla‐Frausto, MPH, is a graduate student researcher at the UCLA Center for Health Policy Research and a doctoral student at the UCLA Fielding School of Public Health. Steven P. Wallace, PhD, is associate director of the UCLA Center for Health Policy Research and professor and chair at the UCLA Fielding School of Public Health.

UCLA Center for Health Policy Research ● 19
FundingFunding for this report was provided by The California Wellness Foundation.
SuggestedcitationPadilla‐Frausto DI, Wallace, SP. Elder Economic Security Standard Index for California, 2011, Methodology Report. Los Angeles: UCLA Center for Health Policy Research, June 2013.