el toro water district urban water management plan … · el toro water district - urban water...
TRANSCRIPT
El Toro Water District
Urban Water Management Plan Update 2005
Prepared by: Ergun Bakall
Consulting Civil Engineer
December 2005

El Toro Water District - Urban Water Management Plan Update December 2005
______________________________________________________________________________ Ergun Bakall Consulting Civil Engineer El Toro Water District
2
Table of Contents
List of Tables ................................................................................................................................. 4 List of Figures................................................................................................................................ 5 1.0 INTRODUCTION................................................................................................................... 6
1.1 Urban Water Management Planning Act..........................................................................6 1.1.1 Senate Bills 610 and 221 of 2001 ...................................................................................6 1.1.2 Requirements of SB610 ..................................................................................................6 1.1.3 Requirements of SB 221 .................................................................................................8 1.1.4 Summary of Changes in the Act Since 2000 ..................................................................8
1.2 Coordination with Other Agencies...................................................................................10 1.2.1 Public Community Involvement ...................................................................................11 1.2.2 Department of Water Resource Role and Guidance .....................................................11 1.2.3 Organization of the ETWD UWMP .............................................................................11
1.3 Resource Maximization/Import Minimization Plan.......................................................12 1.3.1 Integrated Regional Water Management Plan ..............................................................12 1.3.2 Water Use Efficiency Program .....................................................................................13
2.0 SERVICE AREA INFORMATION.................................................................................... 15 2.1 Background ........................................................................................................................15
2.1.1 General Location and Topography ...............................................................................15 2.2 Current and Projected Population...................................................................................15
2.2.1 Land Use .......................................................................................................................17 2.2.2 Future Land Use............................................................................................................17 2.2.3 Climate and Rainfall .....................................................................................................21
2.3 Water Supplies ...................................................................................................................22 2.3.1 Imported Water .............................................................................................................22 2.3.2 Groundwater .................................................................................................................23 2.3.3 Recycled Water.............................................................................................................24
2.4 Reliability of Supply ..........................................................................................................25 2.5 Transfer and Exchange Opportunities ............................................................................33 2.6 Water Use by Customer Type...........................................................................................34
2.6.1 System Losses...............................................................................................................36 2.6.2 Sales to Other Agencies ................................................................................................36
2.7 Demand Management Measures ......................................................................................37 2.7.1 BMP Activity Reports (2000 through 2004) ................................................................37 2.7.2 BMP Coverage Report (2000 through 2004)................................................................37
2.8 Evaluation of DMMs not implemented............................................................................37 2.9 Planned Water Supply Projects and Programs ..............................................................38 2.10 Development of Desalinated Water................................................................................39 2.11 Current and Projected Supply Includes Wholesale Water..........................................40
3.0 DETERMINATION OF DMM IMPLEMENTATION .................................................... 42

El Toro Water District - Urban Water Management Plan Update December 2005
______________________________________________________________________________ Ergun Bakall Consulting Civil Engineer El Toro Water District
3
4.0 WATER SHORTAGE CONTINGENCY PLAN .............................................................. 42 4.1 Imported Water Shortages................................................................................................42
4.1.1 Stages of Drought Action..............................................................................................42 4.1.2 ETWD Emergency Water Conservation Ordinance .....................................................49
4.2 Estimate of Minimum Water Supply for Next Three Years..........................................49 4.3 Catastrophic Supply Interruption Plan...........................................................................49 4.4 Water Use Prohibitions .....................................................................................................54 4.5 Penalties for Excessive Use................................................................................................56 4.6 Impacts on Revenues and Expenditures ..........................................................................56
5.0 RECYCLED WATER PLAN .............................................................................................. 57 5.1 Wastewater System............................................................................................................57 5.2 Recycled Water System .....................................................................................................57 5.3 Barriers to Expansion of Recycled Water Uses ..............................................................59
6.0 WATER QUALITY IMPACTS ON RELIABILITY........................................................ 60 6.1 MWD Water Quality Issues..............................................................................................60
6.1.1 Total Dissolved Solids Management ............................................................................60 6.1.2 Perchlorate Management ..............................................................................................61 6.1.3 Total Organic Carbon and Bromide Management........................................................61 6.1.4 Other Contaminants of Concern ...................................................................................62 6.1.5 Water Quality Protection Programs ..............................................................................62 6.1.6 Imported Water Quality Impacts on Supply Reliability ...............................................62
7.0 WATER SERVICE RELIABILITY................................................................................... 63 8.0 UWMP ADOPTION AND IMPLEMENTATION............................................................ 70
8.1 UWMP Adoption Process..................................................................................................70 8.2 Review the Implementation of Water Conservation and Water Recycling Programs in 2000 Plan.............................................................................................................70
8.2.1 Comparison of 2000 Planned Water Conservation Programs with 2005 Actual Programs ................................................................................................................................70 8.1.2 Comparison of 2000 projected Recycled Water Use with 2005 Actual Use................70
9.0 APPENDIX 9.1 Appendix A: List of References 9.2 Appendix B: BMP Activity Reports 9.3 Appendix C: BMP Coverage Reports 9.4 Appendix D: Cross Reference of ETWD UWMP v. DWR Tables 9.5 Appendix E: Emergency Water Conservation Ordinance 9.6 Appendix E: Public Hearing Comments and Responses
El Toro Water District - Urban Water Management Plan Update December 2005
______________________________________________________________________________ Ergun Bakall Consulting Civil Engineer El Toro Water District
4
List of Tables Table No. Page No. Table 1 Coordination with Other Agencies ...................................................................................10 Table 2 Population- Current and Projected....................................................................................15 Table 3 Land Uses .........................................................................................................................17 Table 4 Climate..............................................................................................................................21 Table 5 Imported and Recycled Water Supply Sources ................................................................22 Table 6 Historical Recycled Water Production .............................................................................24 Table 7 Current and Planned Water Supplies ................................................................................24 Table 8 Future Water Demands .....................................................................................................25 Table 9 MWD Multiple-Dry Year Supply Capability and Projected Demands ............................27 Table 10 MWD Single-Dry Year Supply Capability and Projected Demands..............................28 Table 11 MWD Average Year Supply Capability and Projected Demands..................................29 Table 12 Basis of Water Year Data ...............................................................................................31 Table 13 Supply Reliability ...........................................................................................................32 Table 14 Factors Resulting in Inconsistencies in Supply ..............................................................33 Table 15 Water Use by Customer Type.........................................................................................35 Table 16 Total Water Use ..............................................................................................................36 Table 17 Future Water Supply Projects .........................................................................................38 Table 18 Opportunities for Desalinated Water ..............................................................................40 Table 19 ETWD Demand Projections Supplied to Wholesaler.....................................................40 Table 20 Wholesaler Identified & Quantified Existing and planned Sources of Water ................41 Table 21 Water Wholesale Reliability...........................................................................................41 Table 22 MWD Water Surplus & Drought Management Plan......................................................47 Table 23 Three-Year Estimate of Minimum Water Supply in Multiple-Dry Years......................49 Table 24 ETWD Sustainable Outage Durations ............................................................................51 Table 25 ETWD Curtailment Requirements..................................................................................53 Table 26 Water Use Prohibitions...................................................................................................54 Table 27 Mandatory Prohibitions ..................................................................................................55 Table 28 Penalties and Charges Table ...........................................................................................56 Table 29 Wastewater Collection and Treatment............................................................................57 Table 30 Disposal of Wastewater ..................................................................................................58 Table 31 Recycled Water Uses ......................................................................................................58 Table 32 Projected Normal Water Supply .....................................................................................63 Table 33 Projected Normal Water Demand...................................................................................63 Table 34 Projected Supply and Demand Comparison ...................................................................64 Table 35 Projected Single-Dry Year Water Supply.......................................................................64 Table 36 Projected Single-Dry Year Water Demand ....................................................................64 Table 37 Projected Single-Dry Year Water Supply and Demand Comparison.............................64 Table 38 Projected Supply during Multiple-Dry Year Period Ending 2010 .................................65 Table 39 Projected Demand during Multiple-Dry Year Period Ending 2010 ...............................65

El Toro Water District - Urban Water Management Plan Update December 2005
______________________________________________________________________________ Ergun Bakall Consulting Civil Engineer El Toro Water District
5
List of Tables (continued) Table No. Page No. Table 40 Projected Supply and Demand Comparison during Multiple-Dry Year
Period Ending 2010.........................................................................................................65 Table 41 Projected Supply during Multiple-Dry Year Period Ending 2015 .................................66 Table 42 Projected Demand during Multiple-Dry Year Period Ending 2015 ...............................66 Table 43 Projected Supply and Demand Comparison during Multiple-Dry Year
Period Ending 2015.........................................................................................................66 Table 44 Projected Supply during Multiple-Dry Year Period Ending 2020 .................................67 Table 45 Projected Demand during Multiple-Dry Year Period Ending 2020 ...............................67 Table 46 Projected Supply and Demand Comparison during Multiple-Dry Year Period Ending 2020.........................................................................................................67 Table 47 Projected Supply during Multiple-Dry Year Period Ending 2025 .................................68 Table 48 Projected Demand during Multiple-Dry Year Period Ending 2025 ...............................68 Table 49 Projected Supply and Demand Comparison during Multiple-Dry Year Period Ending 2025.........................................................................................................68 Table 50 Projected Supply during Multiple-Dry Year Period Ending 2030 .................................69 Table 51 Projected Demand during Multiple-Dry Year Period Ending 2030 ...............................69 Table 52 Projected Supply and Demand Comparison during Multiple-Dry Year Period Ending 2030.........................................................................................................69
List of Figures Figure 1 ETWD Service Area Boundary Map...............................................................................16 Figure 2 Resource Stages, Anticipated Actions, and Supply Declarations ...................................48

El Toro Water District - Urban Water Management Plan Update December 2005
______________________________________________________________________________ Ergun Bakall Consulting Civil Engineer El Toro Water District
6
1.0 INTRODUCTION
1.1 Urban Water Management Planning Act This report has been prepared in response to Water Code Sections 10610 through 10656 of the Urban Water Management Planning Act (Act), which were added by Statute 1983, Chapter 1009, and became effective on January 1, 1984. This Act, which was adopted by the legislature through Assembly Bill (AB) Number 797, requires that "every urban water supplier providing water for municipal purposes to more than 3,000 customers or supplying more than 3,000 acre-feet of water annually prepare and adopt, in accordance with prescribed requirements, an urban water management plan." The Act requires urban water suppliers to prepare plans that describe and evaluate reasonable and practical efficient water uses, recycling, and conservation activities. These plans must be filed with the California Department of Water Resources (DWR) every five years. The current Urban Water Management Plan is due to DWR by December 31, 2005. Since its passage in 1983, several amendments have been added to the Act, the most recent coming in 2004. Some of the amendments provided for additional emphasis on metering, drought contingency planning, and water recycling. Also new since 2000 is AB 901, which provides new requirements for addressing water quality. Specifically, Urban Water Management Plans must now include information relating to:
• The quality of existing sources over the 20-year planning horizon; and
• The manner in which water quality affects water management strategies and supply.
1.1.1 Senate Bills 610 and 221 of 2001 In 2001 the state legislature passed two bills that amended state law to require that counties and cities should consider information relating to the availability of water to supply certain new large proposed developments. This information is required to be included in the administrative record of the approval process for such development projects. SB 610 requires the information to be provided to local governments for inclusion into environmental documents for projects that are subject to the California Environmental Quality Act. SB 221 requires that city or county approval of certain residential subdivisions must include written verification that sufficient water supply is available to serve that subdivision. Both of these statutes identify the adopted local Urban Water Management Plan (UWMP) as an important source document to be used to fulfill these requirements. The UWMP is also identified as an important source to be considered when local agencies are updating their General Plans. Under this legislation, the cities and counties that are considering a proposed development application must ask the local water agencies to present the required water supply information. The water agency must provide the information within 90 days of the request. The information required is outlined below.
1.1.2 Requirements of SB610 This legislation requires that cities and counties address in environmental documentation for an applicable development project the sufficiency of the projected water supply. Specifically, SB 610 requires that applicable projects subject to CEQA and supplied with water from a public

El Toro Water District - Urban Water Management Plan Update December 2005
______________________________________________________________________________ Ergun Bakall Consulting Civil Engineer El Toro Water District
7
water system receive a “water supply assessment” from the water service provider on the adequacy of available supplies over a 20-year projection. SB 610 also makes changes to the Urban Water Management Planning Act to:
• Require additional information if groundwater is identified as a source, including a copy of any groundwater management plan, a copy of the adjudication order or decree for adjudicated basins, and if non-adjudicated, whether the basin has been identified as overdrafted; and
• Require a description of specific water supply projects and implementation schedules to meet projected demands over the 20-year planning horizon.
• The new requirements for water supply assessments (under Water. Code §§ 10910-10915) allow compliance by incorporating by reference information from the most recent Urban Water Management Plan, provided the project’s water demand was included in that plan.
The water supply assessment must consider supplies under three hydrologic conditions: normal, single-dry and multiple dry years. The information considered must include water received in prior years from existing water supply entitlements or service contracts. In addition to the reporting of these data, supporting documentation should be provided, including written contracts, a water agency program to finance the planned deliveries, any permits required for delivery infrastructure and regulatory approval for diversion or conveyance of water. Where the water agency identifies a new source of water, other agencies that also have rights to the same source of water should be identified. Where the sources of water include groundwater, additional information about the groundwater source must be included, as follows: • A description of the groundwater basin, including: - for adjudicated basins a copy of the order or decree and a description of the amount of water
that can be legally withdrawn from the basin. - for non-adjudicated basins, information must be provided as to whether the basin is
overdrafted or projected to be overdrafted in the most current DWR bulletin and a detailed description of the responsible party’s efforts to eliminate the long-term overdraft condition.
• A detailed description and analysis of the amount and location of groundwater pumped by water supplier for the past five years from any groundwater basin from which the proposed project will be supplied.
• A detailed description and analysis of the amount and location of groundwater that is
projected to be withdrawn from the basin. • An analysis of the sufficiency of the groundwater to meet the projected water demand
associated with the proposed project. Where current water sources are not sufficient, the water agency must provide its plans for acquiring additional water supplies. Suggested components that could be included in the plans

El Toro Water District - Urban Water Management Plan Update December 2005
______________________________________________________________________________ Ergun Bakall Consulting Civil Engineer El Toro Water District
8
are cost estimates, a description of permits required, and estimated time frames to supply acquisition.
1.1.3 Requirements of SB 221 This legislation prohibits approval of subdivisions consisting of more than 500 dwelling units unless there is verification of sufficient water supplies for the project over a 20-year projection. This requirement also applies to increases of 10 percent or more of service connections for public water systems with less than 500 service connections. The written verification must include the following information:
• Historical record for at least 20 years;
• Urban Water Shortage Contingency Analysis;
• Supply reduction for “specific water use sector” during times of shortage; and
• Amount of water that can be reasonably relied upon from specified supply projects.
These requirements for written verifications (under Gov. Code § 66473.7) do not directly affect the requirements under the Urban Water Management Plan Act. However, the written verification must be based on substantial evidence, and SB 221 expressly provides that substantial evidence may include the most recent Urban Water Management Plan. Therefore, a water supplier may include the requirements under SB 221 in its Urban Water Management Plan as a means of satisfying the substantial evidence requirement.
1.1.4 Summary of Changes in the Act Since 2000 As a result of the above legislation and some additional legislative changes, the following are changes in the Urban Water Management Planning Act that have occurred from 2000 to the present:
• New legislative findings concerning water quality (Water Code § 10610.2, subds. (a)(4) – (a)(9), (b));
• A new requirement to describe water management tools that maximize local resources and minimize imported water supplies (§ 10620, subd. (f));
• A new requirement to notify all cities and counties within the service area that a plan or plan amendment is being prepared (§ 10620, subd. (b));
• A new requirement for additional information on groundwater where groundwater is identified as an existing or planned water source (§ 10631, subd. (b));
• Revised listing of water demand management measures to be described (CUWCC members may still elect to submit their conservation annual reports to meet this requirement) (§ 10631, subd. (f)(1));
• A new requirement to describe specific water supply projects and implementation schedules to meet projected demands over the 20-year planning horizon (§ 10631, subd. (h));

El Toro Water District - Urban Water Management Plan Update December 2005
______________________________________________________________________________ Ergun Bakall Consulting Civil Engineer El Toro Water District
9
• A new requirement for data sharing between contracting water suppliers (i.e., wholesale, intermediate, and retail agencies) and a provision allowing suppliers to rely on information provided by a wholesale agency (§ 10631, subd. (j));
• A new provision allowing DWR to consider a water supplier’s achievements and implementation plans for water conservation when evaluating applications for grants and loans (§ 10631.5);
• A new requirement to describe quantities of recycled water (§ 10633, subds. (b), (g));
• A new requirement to describe water quality over the 20-year planning horizon (§ 10634);
• A new requirement to notify all cities and counties within the service area of the time and place of the public hearing on plan adoption (§ 10642);
• A new requirement to file the plan or plan amendment with all cities and counties within the service area (§ 10644, subd. (a));
• For a water supplier that does not comply with the Urban Water Management Planning Act, a new requirement that DWR make that supplier ineligible to receive Prop 204 or Prop 13 funding (§ 10656); and
• A new provision allowing DWR to consider a water supplier’s compliance with the plan requirements in determining the eligibility of receiving any funds from DWR-administered programs (§ 10657).

El Toro Water District - Urban Water Management Plan Update December 2005
______________________________________________________________________________ Ergun Bakall Consulting Civil Engineer El Toro Water District
10
1.2 Coordination with Other Agencies Recognizing that close coordination among other relevant public agencies is the key to the success of its Urban Water Management Plan (UWMP), El Toro Water District (ETWD) worked closely with other entities to develop and update this planning document. Table 1 documents the name of the agencies with which ETWD coordinated information for developing its UWMP.
Table 1 Coordination with Appropriate Agencies
Agency
MWDOC
SOCWA City of Aliso Viejo
City of Mission Viejo
City of Laguna
Hills
City of Laguna Wood
.
City of Lake
Forest
Participated in development of the plan
X
X
X
X
X
X
X
Commented on the draft
X
Attended public meetings
Was contacted for assistance
X
X
X
X
X
X
X
Was sent a copy of the draft plan
X
X
X
X
X
X
X
Was sent a notice of intention to adopt
X
X
X
X
X
X
X
General Plans are source documents for water suppliers as they assess their own water resource needs. When completed, an UWMP also serves as a source document for cities and counties as they prepare their General Plans. General Plans and UWMPs may be linked, as their accuracy and usefulness are interdependent.
To meet the requirement set forth by Water Code section 10631 (k), ETWD notified the Municipal Water District of Orange County (MWDOC) of the amount of water ETWD wishes to purchase over the next 25 years. ETWD also contacted South Orange County Wastewater Agency (SOCWA) for wastewater and recycled water related issues.

El Toro Water District - Urban Water Management Plan Update December 2005
______________________________________________________________________________ Ergun Bakall Consulting Civil Engineer El Toro Water District
11
1.2.1 Public Community Involvement According to California Water Code Section 10642, “each urban water supplier shall encourage the active involvement of diverse social, cultural, and economic elements of the population within the service area prior to and during the preparation of the plan.”
To generate interest and encourage the public’s participation in the planning process and to actively seek input ETWD discussed the UWMP Update 2005 at a Community Advisory Group meeting on June 2, 2005. This meeting was in addition to the Public Hearing held on the draft Plan, which was held on November 22, 2005. ETWD also outlined the objectives and schedule for the Plan preparation and for Public Input in the September 2005 issue of its quarterly newsletter. Finally, the draft UWMP was also made available for public review on the ETWD website at www.etwd.com.
1.2.2 Department of Water Resource Role and Guidance California Department of Water Resources (DWR) staff reviews and determines the completeness of individual Urban Water Management Plans pursuant to the Urban Water Management Planning Act. Agencies subject to the Act must have adopted a complete UWMP that meets the requirements of the law and submit it to DWR to be eligible for drought assistance or to receive funds through the Department. Results of the DWR review are provided to urban water suppliers through written correspondence. If necessary, water agencies with plans that do not meet DWR standards may wish to use the comments within the review letter to revise their UWMP for re-submittal. DWR provides a Legislative Report to the California Legislature one year after UWMPs are due, detailing the status and any outstanding elements of the UWMPs. DWR also prepares reports and provides data for any legislative hearings held to consider the effectiveness and/or completeness of the UWMPs in question.
DWR provides technical assistance to urban water suppliers to help them meet the requirements of the Act. DWR has provided guidance materials to aid water suppliers in developing year 2005 UWMPs. These materials are intended both to help water districts comply with the law and to help DWR staff review submitted plans for regulatory compliance. Guidance materials consist of a series of worksheets and check lists detailing acceptable responses to the requirements set forth in the Urban Water Management Planning Act. ETWD has used the guidance material in the development of this Plan.
1.2.3 Organization of the ETWD UWMP This document is divided into nine (9) sections.
1. Section 1 - Introduction. The introduction explains the purpose of the Plan and the development of the plan.
2. Section 2 - Service Area Information. . This section describes ETWD as an agency and its service area, addresses current and projected water supplies available to ETWD and assesses the reliability of its water supplies.
3. Section 3 - Determination of DMM Implementation.
4. Section 4 - Water Shortage Contingency Plan.

El Toro Water District - Urban Water Management Plan Update December 2005
______________________________________________________________________________ Ergun Bakall Consulting Civil Engineer El Toro Water District
12
5. Section 5 - Recycled Water Plan. Describes the wastewater management and water recycling in the ETWD service area.
6. Section 6 - Water Quality Impacts on Reliability. Describes the water quality issues that exist in the ETWD service area and addresses their impact on the reliability of providing water service.
7. Section 7 - Water Service Reliability. Discusses reliability of water service to ETWD costumers and compares demand to supplies for normal, single-dry, and multiple-dry year scenarios.
8. Section 8 - UWMP Adoption and Implementation. Illustrates the adoption and implementation of the Plan.
9. Section 9 - Appendix
1.3 Resource Maximization/Import Minimization Plan ETWD is committed to identifying ways of maximizing the area’s existing water resources.
1.3.1 Integrated Regional Water Management Plan In an effort to minimize its dependency on imported supplies ETWD has taken a proactive stance and participated in the Integrated Regional Water Management Planning along with MWDOC and other Orange County water agencies. Recognizing the sustainable future of the MWDOC service area depends upon the successful management of local and imported water supplies, MWDOC has been working with the County of Orange (lead) and the 24 cities and special districts serving the water and wastewater needs of Orange County over the years to develop and integrate regional strategies that address, raise community awareness and coordinate numerous and varied projects that:
• Protect communities from drought • Enhance local water supply and system reliability • Ensure continued water security • Optimize watershed and coastal resources • Improve water quality throughout the watersheds • Safeguard habitat.
In addition, these projects, which are based on a watershed approach, include one or more of the following water management elements:
• Programs for water supply reliability, water conservation and water use efficiency
• Storm water capture, storage, treatment and management • Removal of invasive non-native plants • Creation and enhancement of wetlands, and the acquisition,
protection, and restoration of open space and watershed lands • Non-point source pollution reduction, management, and
monitoring

El Toro Water District - Urban Water Management Plan Update December 2005
______________________________________________________________________________ Ergun Bakall Consulting Civil Engineer El Toro Water District
13
• Groundwater recharge and management projects • Water banking, water exchange, water reclamation, desalting, and
other treatment technologies • Planning and implementation of multipurpose flood control
programs that protect property; improve water quality, storm water capture and percolation; and protect or improve wildlife habitat
• Watershed management planning and implementation • Demonstration projects to develop new drinking water treatment
and distribution methods. In August 2004, this diverse group came together as a single unit to create stronger regional partnerships and connectivity, to maximize the efficiency of their efforts, and to identify funding opportunities and apply for competitive grants. Specifically, the South Orange County Integrated Regional Water Management (SOCIRWM) Group provides a framework for coordinating planning activities and projects related to water management and watershed protection that have been studied and funded, or are in need of funding, and integrating them into a water management plan with multiple regional benefits. To date nearly 100 short- and long-term projects have been identified and prioritized based on the overall benefit they provide the south county region and their readiness for implementation.
1.3.2 Water Use Efficiency Program California's water is a valuable and limited natural resource. There is a continuing need to conserve and efficiently utilize existing water supplies. Interest in water use efficiency (conservation) has been heightened by the continued growing need for water throughout California. The growth in water demand will continue due to the projected increase in population, along with increases in commercial and industrial activity. Water use efficiency and demand management programs will help to stretch existing water supplies to meet these growing needs. ETWD recognizes water use efficiency as an integral component of the current and future water resource strategy. Along with recycled water, and imported water, water use efficiency is recognized as a low-cost source of new supply for the District. ETWD demonstrated its commitment to water use efficiency by voluntarily signing the Memorandum of Understanding Regarding Urban Water Conservation in California (MOU). The California Urban Water Conservation Council (CUWCC) was formed through adoption of this MOU and is considered the “keeper” of the fourteen Best Management Practices (BMPs), with the authority to add, change, or remove BMPs. The CUWCC also monitors BMP implementation of the MOU. As a signatory to the Urban MOU, ETWD has committed to a good-faith-effort to implement all cost-effective BMPs.

El Toro Water District - Urban Water Management Plan Update December 2005
______________________________________________________________________________ Ergun Bakall Consulting Civil Engineer El Toro Water District
14
Relative to urban water supply and management in general, the term "Best Management Practices" refers to policies, programs, rules, regulations and ordinances, and the use of devices, equipment, and facilities that, over the long term, have been generally justified and accepted by the industry as providing a "reliable" reduction in water demand. These methodologies and technologies are both technically and economically reasonable, are not environmentally or socially unacceptable, and their practice is not otherwise unreasonable for most water suppliers to carry out. The 14 BMPs include technologies and methodologies that have been sufficiently documented in multiple demonstration projects that result in more efficient water use and conservation. ETWD has instituted various water conservation plans over the past decade in an effort to decrease present and future water demands. ETWD has regularly filed BMP Activity Reports. A copy of the 2003-2004 Report as is included in the Appendix B.

El Toro Water District - Urban Water Management Plan Update December 2005
______________________________________________________________________________ Ergun Bakall Consulting Civil Engineer El Toro Water District
15
2.0 SERVICE AREA INFORMATION
2.1 Background The ETWD, located within the southern portion of the County of Orange, was formed in 1960 under provisions of California Water District Law, Division 13 of the Water Code of the State of California, commencing with Section 34000 for the purpose of providing water supply for the service area. The District is governed by a publicly elected Board of Directors. Today, the District has grown to approximately 5,350 acres and provides water and sewer service to over 50,000 customers. The District is almost entirely developed and encompasses all of the City of Laguna Woods and portions of four other cities: Lake Forest, Aliso Viejo, Laguna Hills and Mission Viejo. The El Toro Water District Service Area Map may be found on Figure 1.
2.1.1 General Location and Topography The ETWD service area ranges in elevation between 230 feet above sea level at its lowest point to 904 feet at its highest. In general, elevations increase from west to east. Interstate 5 bisects the District from north to south, with the higher elevations located on the east side. The District is bordered by the Irvine Ranch Water District (IRWD) to the north, the Laguna Beach County Water District (LBCWD) to the west, the Moulton Niguel Water District (MNWD) to the west and south, and the Santa Margarita Water District (SMWD) to the south and east. The District also shares a small border with the Trabuco Canyon Water District (TCWD) in the northern part of the District. ETWD adopted its most recent UWMP, in accordance with Section 10610 et seq. of the California Water Code, in December, 20001.
2.2 Current and Projected Population and Demand The service area of the District is fully developed. Any new development or re-development will have a very minor impact on population expected to be served by ETWD in the future. Table 2 below shows current and future (projected) population through 2030.
Table 2
Population - Current and Projected
2005 2010 2015 2020 2025 2030 Service Area Population 50,700 51,000 51,300 51,500 51,800 52,100
1Due to the number and size of documents referenced or incorporated by reference herein, if not attached, they are
available at the offices of the District. A list of documents referenced in this UWMP is attached as Appendix “A.”

PKW
Y.
I - 5 FREEWAY
LAKE FOREST DR.
DE
CARLOTA
LA
RAILROAD
LAGUNA HILLS
LAGUNA WOODS
ALISO VIEJO
LAKE FOREST D
R.
PKWY.
ALISO CREEK RD. ALISO VIEJO
HWY. 241
EL T
ORORAILROAD
RAILROAD
MO
ULTO
N
I - 5 FREEWAY
LAKE FOREST DR.
EL T
ORO R
D.
DE
VALENCIA
ELTORO RD.
MOULTON
PK
WY
CARLOTAD
EVALEN
CIA
DE LA
AVE.
PASEO
EL TORO
RD.
I - 5 FREEWAYBLVD.
RIDGE ROUTE
EL
PASE
O
I - 5 FREEWAY
MUIRLANDS
JERONIMO
AVE.
TRABUCO
RAILROAD
LA PAZ RD.
SANTA
LAKE FOREST
LAGUNA HILLS
MISSION VIEJOLAGUNA HILLS
LAGUNA WOODS
ALISO VIEJO
TORO RD.EL TORO RD.
MARGARITALAKE FOREST
LAKE FOREST D
R.
MUIRLANDS
JERO
NIM
O
ALICIA
PKW
Y.
ALICIA
PKWY.
CABOT RD
.
BLVD.
ALISO CREEK RD. ALISO VIEJO
ALISO C
REEK
ALIS
O
CREEK
MISSION VIEJO
LAKE FOREST
MISSION VIEJO
EL TORO
RD.
RD.
TRABUCO RD.
HWY. 241
MAR
GU
ERIT
EP
KW
Y.
EL T
ORORD.
RD.
El Toro Water DistrictService Area Boundary Map
GIS
CITY LEGEND
MISSION VIEJO
LAKE FOREST
LAGUNA HILLS
LAGUNA WOODS
ALISO VIEJO
PKWY.
RD.
LAGUNA WOODS
El Toro Water District - Urban Water Management Plan Update December 2005
______________________________________________________________________________ Ergun Bakall Consulting Civil Engineer El Toro Water District
17
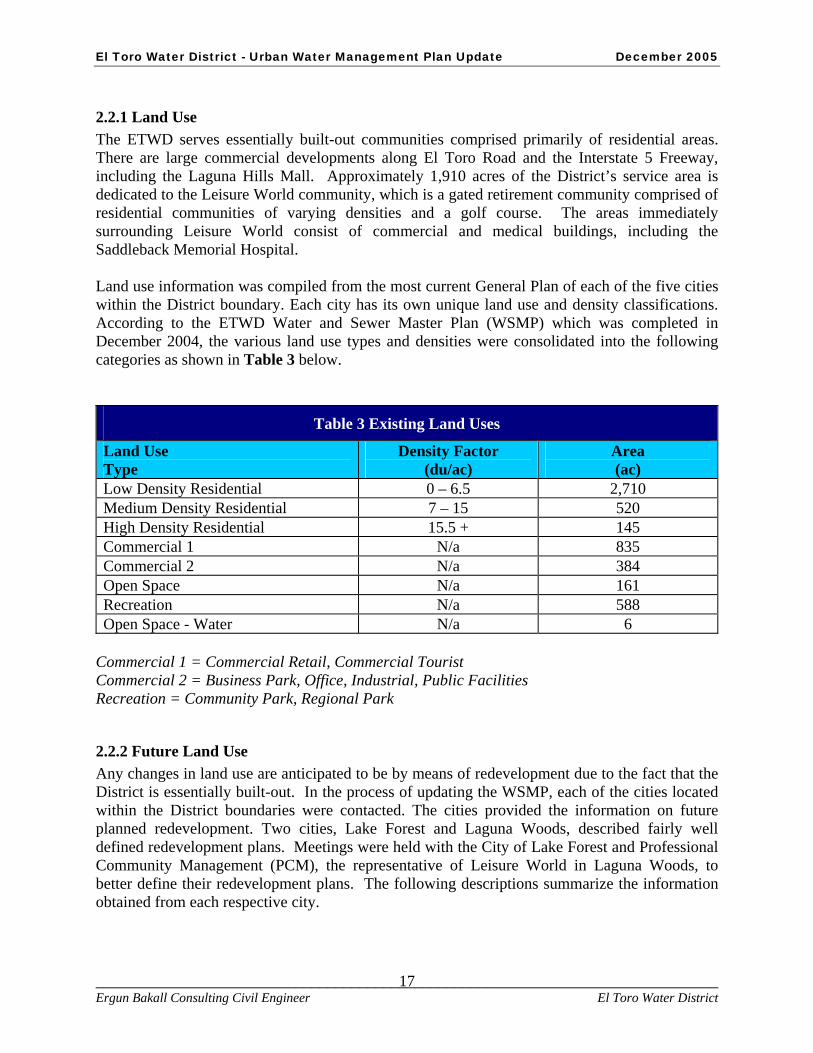
2.2.1 Land Use The ETWD serves essentially built-out communities comprised primarily of residential areas. There are large commercial developments along El Toro Road and the Interstate 5 Freeway, including the Laguna Hills Mall. Approximately 1,910 acres of the District’s service area is dedicated to the Leisure World community, which is a gated retirement community comprised of residential communities of varying densities and a golf course. The areas immediately surrounding Leisure World consist of commercial and medical buildings, including the Saddleback Memorial Hospital. Land use information was compiled from the most current General Plan of each of the five cities within the District boundary. Each city has its own unique land use and density classifications. According to the ETWD Water and Sewer Master Plan (WSMP) which was completed in December 2004, the various land use types and densities were consolidated into the following categories as shown in Table 3 below.
Table 3 Existing Land Uses
Land Use Type
Density Factor (du/ac)
Area (ac)
Low Density Residential 0 – 6.5 2,710 Medium Density Residential 7 – 15 520 High Density Residential 15.5 + 145 Commercial 1 N/a 835 Commercial 2 N/a 384 Open Space N/a 161 Recreation N/a 588 Open Space - Water N/a 6
Commercial 1 = Commercial Retail, Commercial Tourist Commercial 2 = Business Park, Office, Industrial, Public Facilities Recreation = Community Park, Regional Park
2.2.2 Future Land Use Any changes in land use are anticipated to be by means of redevelopment due to the fact that the District is essentially built-out. In the process of updating the WSMP, each of the cities located within the District boundaries were contacted. The cities provided the information on future planned redevelopment. Two cities, Lake Forest and Laguna Woods, described fairly well defined redevelopment plans. Meetings were held with the City of Lake Forest and Professional Community Management (PCM), the representative of Leisure World in Laguna Woods, to better define their redevelopment plans. The following descriptions summarize the information obtained from each respective city.

El Toro Water District - Urban Water Management Plan Update December 2005
______________________________________________________________________________ Ergun Bakall Consulting Civil Engineer El Toro Water District
18
City of Aliso Viejo Mr. Clint Sherrod, the City Planning Director, stated that the City has plans to redevelop a 234-acre area piece of land within the District’s southern boundary. The planned area of redevelopment is located north of Glenwood Drive, between Aliso Creek Road and Cedarbrook. The redevelopment area covers a total of 234 acres; however the portion that lies within the District’s boundary is primarily the golf course. It is not anticipated that these proposed redevelopments will impact the District’s water or sewer system since they do not lie within the District’s service boundary.
City of Mission Viejo Mr. Chuck Wilson, the Director of Community Development for the City of Mission Viejo, stated that the only section of Mission Viejo within the ETWD boundary is a parcel of land referred to as ‘Aegean Hills.’ Mr. Wilson commented that the area is currently fully developed with residential and commercial land uses. There are no plans to redevelop this land in the near future. This area is currently at its ultimate build-out condition and potential redevelopment should not impact the water demands or wastewater generation.
City of Laguna Hills Mr. Vern Jones, the City Planning Director, explained the redevelopment issues associated with an area known as the Urban Village. The Urban Village is identified as the area surrounding the Laguna Hills Mall and Saddleback Hospital and covers nearly 240 acres. Currently, there are over 2 million square feet of retail, medical, and professional office uses, and 756 residential dwelling units. Some goals for the Urban Village are to establish a more pedestrian-oriented environment and to make it feel more like a “Downtown” environment, by creating a Main Street that connects with a new Civic Center. Development in the Urban Village will be restricted by vehicle “trip budget” limits set forth in the General Plan and may not exceed the following quantities:
Retail: 183,000 square feet
Hotel: 250 rooms
Residential: 200 dwelling units
Medical/General Office: 138,000/380,000 square feet
There is some flexibility in the development which may allow retail users to occupy more land if fewer offices are established, or vice-versa, provided the vehicle “trip budget” is not surpassed. Development of the Urban Village will result in additional water demands and wastewater generation which will impact the District’s system.
City of Laguna Woods Laguna Woods is the only city that lies entirely within the District. Mr. Lauren Barr, the Community Development Director for the City, identified that Leisure World is planning several redevelopment projects. Jerry Storage, a representative of PCM, property manager for Leisure World, further described the proposed redevelopment project.

El Toro Water District - Urban Water Management Plan Update December 2005
______________________________________________________________________________ Ergun Bakall Consulting Civil Engineer El Toro Water District
19
Ten parcels within Leisure World are scheduled for redevelopment. Land area is approximately 100 acres and is limited by traffic trips. All but two of the parcels are currently open space. Parcel 4 is currently a commercial property that will be redeveloped as an Equestrian Center. The open space will be redeveloped into commercial and residential properties. Approximately 184 additional dwelling units are anticipated. Approximately 512,000 additional square feet of commercial property may be added.
This proposed redevelopment project would increase both the water and sewer demands impacting the District’s system.
City of Lake Forest Ms. Kathy Graham, the Deputy Executive Director for the City, and Ms. Jacqueline Maraya, a Redevelopment Management Analyst for the City, cited four specific areas that are currently planned or being considered for redevelopment: • The Arbor-El Toro Road Redevelopment. • Jeronimo Industrial Area Redevelopment. • Saddleback Ranch Apartments Redevelopment. • Conversion of mobile home parks to master planned communities.
The El Toro Road Commercial Corridor Revitalization and Revision Plan is currently under construction. This design consists of redeveloping the road right-of-way along approximately one mile of El Toro Road starting at Interstate 5 and continuing east to the intersection at Muirlands Boulevard. This project, known as The Arbor, will add to the existing landscaping in the road right-of-way and adjacent commercial properties. This project will slightly increase the projected water demand and have no impact on the projected wastewater generation. Due to the current low occupancy of the commercial buildings in the area, the distribution and collection systems will see an increase in actual demand. However these water projections will only increase slightly.
The existing land near the intersection of Jeronimo Road and El Toro Road includes industrial properties that the City envisions eventually redeveloping to better fit in with nearby themes. No specific plans for redevelopment are currently underway. The area impacted is approximately 33 acres. The City speculates that redevelopment could include a transit station, commercial properties and residential land use. It is anticipated that this project will increase the District’s domestic water demand and wastewater generation. The Saddleback Ranch Apartments are located off of Los Alisos Boulevard. Possible redevelopment in that area would add 244 dwelling units on 7 acres of land that are currently not developed. No specific plans are underway for the apartments at this time however this project would increase the water demand and wastewater generation in the District and are accounted for in this report.

El Toro Water District - Urban Water Management Plan Update December 2005
______________________________________________________________________________ Ergun Bakall Consulting Civil Engineer El Toro Water District
20
Land Use Summary The future redevelopment projects identified by the cities will result in an increased water demand. The expected average day increase in water demand is 529 GPM or 855 AFY according to the ETWD Water Master Plan dated December 2004.

El Toro Water District - Urban Water Management Plan Update December 2005
______________________________________________________________________________ Ergun Bakall Consulting Civil Engineer El Toro Water District
21
2.2.3 Climate and Rainfall The National Oceanographic and Atmospheric Administration (NOAA) does not provide historical climate data for the service area of ETWD but it does provide it for Tustin- Irvine Ranch, California (049087) which is in close proximity and very similar to ETWD Service Area as far as climate and rainfall is concerned. Therefore the data for Tustin- Irvine Ranch, California (049087) is utilized. Table 4 below shows climate data for ETWD service area.
Table 4 Climate
January February March April May June Standard Average ETo 2.18 2.49 3.67 4.71 5.18 5.87 Average Rainfall 2.53 2.73 2.21 1.01 0.26 0.07 Average Max. Temp. 67.0 68.1 69.4 72.9 75.2 79.0 Average Min. Temp. 40.5 42.4 44.3 47.7 52.2 55.8
Table 4 (continued)
Climate July August Sept. October Nov. Dec. Annual
Average ETo 6.29 6.17 4.57 3.66 2.59 2.25 49.63 Average Rainfall 0.01 0.08 0.27 0.36 1.32 2.25 12.82 Average Max. Temp. 84.0 85.5 84.7 79.7 73.9 68.2 75.6 Average Min. Temp. 59.2 59.5 57.0 51.9 44.4 40.7 49.6
* Period of Record: 12/1/1927 to 6/30/2003

El Toro Water District - Urban Water Management Plan Update December 2005
______________________________________________________________________________ Ergun Bakall Consulting Civil Engineer El Toro Water District
22
2.3 Water Supplies This section addresses current and projected water supplies available to ETWD. The District has a modern water system, which dates back to 1960. Imported water from Metropolitan Water District of Southern California (MWD) through MWDOC is the major source of water supply to the District. The water system provides reliable water service to over 50,700 residents within its service area.
2.3.1 Imported Water ETWD is a member agency of MWDOC which is a member agency of MWD. ETWD has a number of service connection agreements with MWDOC. These agreements entitle the District to receive water from available MWD sources via the regional distribution system located in Orange County. MWDOC delivers water from MWD in the amount requested by ETWD, subject to capacity limitations of the service connections and the capacity limits of ETWD in the Feeder. ETWD has three service connections to the Allen-McColloch pipeline (AMP) and one service connection to the Joint Regional Water Supply System (JRWSS) which is directly supplied from the East Orange County Feeder No.2 (EOCF No.2) operated by MWD. The District’s imported water supply sources and their flow capacities are shown on the following Table 5:
Table 5
Imported and Recycled Water Supply Sources
Source Connection Designation
Total Allocated Feeder Capacity
Capacity of Connection
MWD CFS** CFS** OC-76 20 OC-77 20
Allen-McColloch Pipeline
OC-80 26.3*
20 East Orange County
Feeder No. 2 2.0
Total Imported (MWD) Capacity 28.3cfs or 20490 AF/Year
Recycled Water Supplies 575 AF/Yr***
* For determining the total capacity, either the total feeder capacity or the connection capacity, whichever is less, were utilized. ** CFS = Cubic-Feet per Second *** Current recycled water supplies are 375 AF/Yr and the projected recycled supplies will be 575 AF/Yr

El Toro Water District - Urban Water Management Plan Update December 2005
______________________________________________________________________________ Ergun Bakall Consulting Civil Engineer El Toro Water District
23
Although pipeline capacity rights do not guarantee the availability of water, per se, they do guarantee the ability to convey water when it is available from MWD sources to ETWD distribution system and, therefore, operate in tandem with water entitlements and/or contracts to receive supplemental water for purposes of demonstrating not only water supply reliability, but also physical delivery system reliability. All imported water supplies assumed in this document are available to ETWD from existing infrastructure. MWD has prepared its “Regional Urban Water Management Plan”, dated December 2005 for its service area. MWDOC also has prepared and adopted its “Regional Urban Water Management Plan”, dated December 2005, for its service area, which is inclusive of and consistent with the District’s base supply and demand projections addressed herein. Pursuant to Water Code Section 10631(k), ETWD is relying upon water supply information provided by the wholesale agencies, MWD and MWDOC in fulfilling informational requirements addressed in this UWMP Update. Allen-McColloch Pipeline The AMP is the primary source of domestic water in which the District owns specified capacity rights for the delivery of water. MWD owns and operates the AMP. The District’s AMP capacity ownership, expressed as rate of flow, is 26.3 cubic feet per second (cfs) or 19,040 acre-feet per year. The Agreement for Sale and Purchase of Allen-McColloch Pipeline (MWD Agreement No. 4623) among MWD, MWDOC, MWDOC Water Facilities Corporation and certain other identified participants, including the District, dated July 1, 1994 (the AMP Sale Agreement) requires MWD, among other things, to meet the District’s requests for water deliveries (subject to the availability of water from MWD). The AMP Sale Agreement further requires MWD to augment/increase capacity necessary to meet ETWD projected ultimate service area water demands and other undeveloped lands within the District. East Orange County Feeder No. 2 The East Orange County Feeder No. 2 (“EOCF No. 2”) is a pipeline jointly owned by several local agencies and MWD, which operates it. ETWD has 2 cfs, or 1450 acre-feet per year, of capacity rights in the JRWSS which is directly supplied from the EOCF No.2 operated by MWD.
2.3.2 Groundwater Due to its underlying geology ETWD does not have any groundwater resources.

El Toro Water District - Urban Water Management Plan Update December 2005
______________________________________________________________________________ Ergun Bakall Consulting Civil Engineer El Toro Water District
24
2.3.3 Recycled Water ETWD has produced recycled water for Treatment Plant and Landscape irrigation use for many years from its Water Recycling Plant (WRP).
Table 6 shows historical recycled water production records below:
Table 6
Historical Recycled Water Production - AF
Calendar Year
Treatment Plant Use
Landscape Use
Total Usage
1996 50 368 418 1997 69 383 451 1998 166 280 446 1999 226 366 593 2000 352 319 671 2001 415 281 696 2002 354 314 668 2003 386 286 672 2004 428 306 734
Existing connections to the AMP pipeline and to JRWSS enable ETWD to purchase the imported water in quantities as shown in the Table 7 below. Table 7 also shows current and future recycled water supply. It should be noted that the projected recycled water use defined in Table 7 is significantly less than the historical demand defined in Table 6. In 2005 ETWD reduced the amount of recycled water used for process water at the ETWD Water Recycling Plant. The expected average annual recycled water demand was reduced from 700 acre-feet to 375 acre-feet. A proposed recycled water project is projected to increase that demand to 575 acre-feet in 2010.
Table 7 Current and Planned Water Supplies - AFY
Water Supply Sources 2005 2010 2015 2020 2025 2030
Water purchase capacity from:
MWDOC 11,016 10,984 11,153 11,323 11,493 11,645
Recycled Water (projected use) 430 575 575 575 575 575
Total 11,446 11,559 11,728 11,898 12,068 12,220

El Toro Water District - Urban Water Management Plan Update December 2005
______________________________________________________________________________ Ergun Bakall Consulting Civil Engineer El Toro Water District
25
Table 8 shown below shows the projected water demands including the imported and locally produced recycled on the ETWD system. These demands were derived using the redevelopment demand data defined in the ETWD Water and Sewer Master Plan (WSMP). The WSMP analysis projects potential additional water demands of 850 acre-feet per year as the result of redevelopment in the ETWD service area. Using the ETWD budget baseline of 11,000 acre-feet the future demands are estimated to be 11,850 acre-feet per year. Due to the uncertain timeline of the potential redevelopment projects, this additional demand was evenly distributed over the 25 year planning horizon. A potential recycled water project would reduce the domestic/import demand by 200 acre-feet to 11,650 acre-feet per year and increase the projected recycled water use by the same amount from the planning estimate of 375 acre-feet per year to the ultimate projected use of 575 acre-feet per year. This data was provided to MWDOC for use in evaluating the overall regional supply. In order to maintain consistency with the regional analysis, MWDOC modified the ETWD demand figures to reflect fiscal year data rather than calendar year data.
Table 8
Future Water Demands - AFY
Water Supply Sources 2005 2010 2015 2020 2025 2030
Water purchased from:
ETWD Projected Demand Data 11,000 10,970 11,140 11,310 11,480 11,650
MWDOC/MWD Demand Data 11,016 10,984 11,153 11,323 11,493 11,645
Recycled Water (projected use) 430 575 575 575 575 575
Total 11,446 11,559 11,728 11,898 12,068 12,220
2.4 Reliability of Supply With the exception of recycled water, ETWD is entirely dependent on imported water from MWD to meet its demands. Therefore reference is made to the MWD Regional UWMP for the reliability of MWD water supplies and its vulnerability to seasonal or climatic shortages. To evaluate supply reliability, MWD developed a computer model named IRPSIM. This model uses 70 years of historical hydrology (from 1922 to 1991) to develop estimates of water surplus and shortage over the 25-year planning horizon. The output from these model runs enables staff to analyze the extent to which a particular supply option can add to the region’s supply reliability and determine the need for additional supplies. It also helps to determine the appropriate targets for core and flexible supplies. Core water supplies provide a certain amount of water in every year, regardless of whether surplus supplies already exist. Examples of core supplies include recycled water projects, safe yield groundwater production, and Colorado River Aqueduct (CRA) base supplies. They provide the advantage of greater certainty with respect to the supply yield and cost. The disadvantage of core supplies is that if they are developed solely to meet infrequent dry year supply needs, they can be redundant in surplus years, thus resulting in higher costs. Flexible

El Toro Water District - Urban Water Management Plan Update December 2005
______________________________________________________________________________ Ergun Bakall Consulting Civil Engineer El Toro Water District
26
water supplies provide supply only when needed (such as a dry year) and do not result in increased amounts of surplus water during years of plentiful supply. Examples of flexible supplies include voluntary water transfers and storage. Flexible supplies tend to be more cost-effective than core supplies, especially in light of the high degree of variability of Metropolitan’s existing supplies, but their supply yield may be less certain. Developing a resource strategy that balances both cost and risk requires a combination of core and flexible supplies. For imported water supply reliability MWD defines its water years with different historical hydrologies. According to its draft Regional Urban Water Management Plan (May 2005), based on the IRPSIM model, MWD defines its multiple dry years as 1990-1992 and the single-dry year as 1977. Table 9 summarizes results from IRPSIM model studies performed to test the supply reliability of the MWD adopted resource mix. The IRPSIM results show the region’s ability to respond in future years under a repeat of the 1990-92 hydrologies (assumed to be the driest in the last 70 years), that is, in the case of multiple - dry years. This shows that the region can provide reliable water supplies under a series of multiple dry years. Table 10 shows a similar analysis using the historic hydrology of 1977, the single driest hydrologic year to date, and Table 11 reports the expected situation on average over all of the historic hydrologies.

El Toro Water District - Urban Water Management Plan Update December 2005
______________________________________________________________________________ Ergun Bakall Consulting Civil Engineer El Toro Water District
27
The IRPSIM analyses of the Integrated Resources Plan (IRP) Update report show that Metropolitan can maintain reliable supplies under the conditions that have existed in past dry periods throughout the period 2005 through 2030.
Table 9 MWD Multiple Dry-year Supply Capability1 & Projected Demands
AF/Yr 2010 2015 2020 2025 2030
Current Supplies Colorado River2 722,000 699,000 699,000 699,000 699,000 California Aqueduct3 912,000 912,000 912,000 912,000 912,000 In-Basin Storage 482,000 480,000 463,000 449,000 449,000 Supplies Under Development
Colorado River Aqueduct 95,000 460,000 400,000 400,000 400,000 California Aqueduct 330,000 215,000 299,000 299,000 299,000 In-Basin Storage 78,000 103,000 103,000 103,000 103,000 Transfers to Other Agencies 0 (35,000) (35,000) (35,000) (35,000) MWD Supply Capability 2,619,000 2,834,000 2,841,000 2,827,000 2,827,000
MWD Supply Capability w/ CRA Maximum of 1.25 MAF4
2,619,000 2,776,000 2,741,000 2,719,000 2,719,000
Firm Demands on MWD5,6 2,376,000 2,389,000 2,317,000 2,454,000 2,587,000
Potential Reserve & Replenishment Supplies
243,000 377,000 424,000 265,000 132,000
1 Represents supply capability for resource programs under listed year type. 2 Colorado River Aqueduct includes water management program supplies conveyed by the aqueduct 3 California Aqueduct includes Central Valley transfers and storage program supplies conveyed by the aqueduct 4 Maximum CRA deliveries limited to 1.25 MAF including SDCWA/IID Transfer supplies and Coachella and All-American Canals lining supplies. 5 Based on SCAG 2004 RTP, SANDAG 2030 forecasts, projections of member agency existing and contracted active conservation and local supplies, remaining regional targets for active conservation and local supplies, SDCWA/IID Transfer supplies and Coachella and All-American Canals lining supplies. 6 Includes projected firm sales plus 70% of projected IAWP agricultural sales

El Toro Water District - Urban Water Management Plan Update December 2005
______________________________________________________________________________ Ergun Bakall Consulting Civil Engineer El Toro Water District
28
Table 10 summarizes results from IRPSIM model studies performed to test the supply reliability of the adopted resource mix in a similar analysis using the historic hydrology of 1977, the single driest hydrologic year to date.
Table 10 MWD Single Dry-year Supply Capability1 & Projected Demands
AF/Yr 2010 2015 2020 2025 2030
Current Supplies Colorado River2 722,000 699,000 699,000 699,000 699,000 California Aqueduct3 777,000 777,000 777,000 777,000 777,000 In-Basin Storage 840,000 838,000 808,000 784,000 784,000 Supplies Under Development
Colorado River Aqueduct 95,000 460,000 400,000 400,000 400,000 California Aqueduct 330,000 215,000 299,000 299,000 299,000 In-Basin Storage 78,000 103,000 103,000 103,000 103,000 Transfers to Other Agencies 0 (35,000) (35,000) (35,000) (35,000) MWD Supply Capability 2,842,000 3,101,000 3,102,000 3,078,000 3,078,000
MWD Supply Capability w/ CRA Maximum of 1.25 MAF4
2,842,000 3,033,000 3,002,000 2,970,000 2,970,000
Firm Demands on MWD5,6 2,293,000 2,301,000 2,234,000 2,363,000 2,489,000
Potential Reserve & Replenishment Supplies
549,000 732,000 768,000 607,000 481,000
1 Represents supply capability for resource programs under listed year type. 2 Colorado River Aqueduct includes water management program supplies conveyed by the aqueduct 3 California Aqueduct includes Central Valley transfers and storage program supplies conveyed by the aqueduct 4 Maximum CRA deliveries limited to 1.25 MAF including SDCWA/IID Transfer supplies and Coachella and All-American Canals lining supplies. 5 Based on SCAG 2004 RTP, SANDAG 2030 forecasts, projections of member agency existing and contracted active conservation and local supplies, remaining regional targets for active conservation and local supplies, SDCWA/IID Transfer supplies and Coachella and All-American Canals lining supplies. 6 Includes projected firm sales plus 70% of projected IAWP agricultural sales

El Toro Water District - Urban Water Management Plan Update December 2005
______________________________________________________________________________ Ergun Bakall Consulting Civil Engineer El Toro Water District
29
Table 11 summarizes results from IRPSIM model studies performed to test the supply reliability of the adopted resource mix in a similar analysis of expected situation on average over all of the historic hydrologies.
Table 11 MWD Average Year Supply Capability1 & Projected Demands
AF/Yr 2010 2015 2020 2025 2030
Current Supplies Colorado River2 711000 678,000 677,000 677,000 677,000 California Aqueduct3 1,772,000 1,772,000 1,772,000 1,772,000 1,772,000 In-Basin Storage 0 0 0 0 0 Supplies Under Development
Colorado River Aqueduct 0 0 0 0 0 California Aqueduct 185,000 185,000 185,000 185,000 185,000 In-Basin Storage 0 0 0 0 0 Transfers to Other Agencies 0 (35,000) (35,000) (35,000) (35,000) MWD Supply Capability 2,668,000 2,600,000 2,654,000 2,654,000 2,654,000
MWD Supply Capability w/ CRA Maximum of 1.25 MAF4
2,668,000 2,600,000 2,654,000 2,654,000 2,654,000
Firm Demands on MWD5,6 2,040,000 2,053,000 1,989,000 2,115,000 2,249,000
Potential Reserve & Replenishment Supplies
628,000 547,000 665,000 539,000 405,000
1 Represents supply capability for resource programs under listed year type. 2 Colorado River Aqueduct includes water management program supplies conveyed by the aqueduct 3 California Aqueduct includes Central Valley transfers and storage program supplies conveyed by the aqueduct 4 Maximum CRA deliveries limited to 1.25 MAF including SDCWA/IID Transfer supplies and Coachella and All-American Canals lining supplies. 5 Based on SCAG 2004 RTP, SANDAG 2030 forecasts, projections of member agency existing and contracted active conservation and local supplies, remaining regional targets for active conservation and local supplies, SDCWA/IID Transfer supplies and Coachella and All-American Canals lining supplies. 6 Includes projected firm sales plus 70% of projected IAWP agricultural sales Table 13 compares the water supplies and the demands on the District and is meant to demonstrate the reliability of ETWD water system based on existing infrastructure currently in place for the system. The supply information presented relies on the availability of imported supplies as documented above in the MWD reliability assessment and is based on the District’s connected capacity to the MWD/MWDOC importation system. Therefore, the imported water supplies are assumed to be equal to the physical ability of the District’s importation system.

El Toro Water District - Urban Water Management Plan Update December 2005
______________________________________________________________________________ Ergun Bakall Consulting Civil Engineer El Toro Water District
30
This does not necessarily mean that the amount of imported supply shown on the Tables will be available from MWD at all times. However, MWD as the imported supplier has the capability to provide more then the aggregate of all import demands on its system as demonstrated in Table 9 through Table 11 above. Therefore, as long as MWD has enough supplies ETWD has the capability to purchase up to the imported supply figures shown. This analysis assumes MWD will be able to supply the imported demand under all hydrologic conditions as shown on Tables 9, 10 and 11. As a result, the water year, or the imported water demand, is defined by the net difference of total retail demand less local supplies. In a dry year, the retail demand usually increases due to dry and hot weather. In the case of ETWD, the local production of recycled water is likely to remain stable. The greater the net difference between retail demand and local supplies the more critical it is for the District to depend on imported supply to meet its demand. The MWD supply reliability analysis defined in Tables 9, 10 and 11 is based on MWD derived hydrological data. The single-dry year is defined as a repeat of the 1977 hydrology and the multiple-dry years is a repeat of the 1990-92 hydrologies. On the other hand, the evaluation of imported water demands, as described in Table 13, is based on the MWDOC derived hydrological data. The Normal Year is the Average of Historical Hydrology from 1922 to 2004; Year 1961 is the Single-Dry Year and Years 1959 through 1961 are the Multiple Dry Water Years. MWDOC has developed a water balance computer model. Employing the model all three variables, retail demand, local supplies, and imported supplies, were simulated using 83 historical hydrologies from 1922 to 2004. The average of all the 83 simulated trials was used to represent a normal condition. Of the 83 years, the hydrologic condition of 1961 yields the highest demand for imported supply, and therefore 1961 is defined as the single-dry year in the MWDOC service area. Similarly, the historical sequence of 1959 to 1961 yields the highest demand in three-year sequence for imported supply, and is therefore defined as the multiple-dry years in the MWDOC service area. Since it is assumed that ETWD is typical of the MWDOC service area, the findings are considered applicable to the District’s service area for determining critical demand years even though the ETWD did not exist in 1959. The MWDOC analysis was used, therefore, to develop Single Dry Year and Multiple Dry Years imported water demand data for each of the five-year milestones in the planning period. This analysis uses the projected Normal Year demand described in Table 8, the development of additional local supplies and the above described hydrology to define the ultimate imported water demand in each condition and in each period.

El Toro Water District - Urban Water Management Plan Update December 2005
______________________________________________________________________________ Ergun Bakall Consulting Civil Engineer El Toro Water District
31
Table 12 shows the basis of water year utilized for demand purposes in the Table 13:
Table 12 Basis of Water Year Data
Water Year Type
Average Water Year Average of Historical Hydrology from 1922 to 2004
Single-Dry Water Year 1961 Multiple-Dry Water Years 1959 1960 1961
Table 13 illustrates the supply reliability of ETWD and compares demands and supplies. Local supplies consist of groundwater and recycled water. MWD and MWDOC have indicated there is adequate supply to meet the projected ETWD demands through 2030. The imported supply figures in Table 13 are therefore equivalent to the projected demands.

El Toro Water District - Urban Water Management Plan Update December 2005
______________________________________________________________________________ Ergun Bakall Consulting Civil Engineer El Toro Water District
32
Table 13 Supply Reliability - AF Year
2010 Normal Single Multiple Dry Water Years Water Year Dry Year Year 1 Year 2 Year 3 Recycled Water Demand 575 575 575 575 575 Recycled Water Supply 575 575 575 575 575 Imported Water Demand 10,984 11,625 11,757 11,399 11,625 Imported Water Supply 10,984 11,625 11,757 11,399 11,625 Demand as % of Normal 105.8% 107.0% 103.8% 105.8% 2015 Normal Single Multiple Dry Water Years Water Year Dry Year Year 1 Year 2 Year 3) Recycled Water Demand 575 575 575 575 575 Recycled Water Supply 575 575 575 575 575 Imported Water Demand 11,153 11,804 11,867 11,552 11,804 Imported Water Supply 11,153 11,804 11,867 11,552 11,804 Demand as % of Normal 105.8% 106.4% 103.6% 105.8% 2020 Normal Single Multiple Dry Water Years
Water Year Dry Year Year 1 Year 2 Year 3) Recycled Water Demand 575 575 575 575 575 Recycled Water Supply 575 575 575 575 575 Imported Water Demand 11,323 11,984 12,048 11,728 11,984 Imported Water Supply 11,323 11,984 12,048 11,728 11,984 Demand as % of Normal 105.8% 106.4% 103.6% 105.8% 2025 Normal Single Multiple Dry Water Years
Water Year Dry Year Year 1 Year 2 Year 3) Recycled Water Demand 575 575 575 575 575 Recycled Water Supply 575 575 575 575 575 Imported Water Demand 11,493 12,163 12,229 11,904 12,163 Imported Water Supply 11,493 12,163 12,229 11,904 12,163 Demand as % of Normal 105.8% 106.4% 103.6% 105.8% 2030 Normal Single Multiple Dry Water Years
Water Year Dry Year Year 1 Year 2 Year 3 Recycled Water Demand 575 575 575 575 575 Recycled Water Supply 575 575 575 575 575 Imported Water Demand 11,645 12,323 12,410 12,081 12,323 Imported Water Supply 11,645 12,323 12,410 12,081 12,323 Demand as % of Normal 105.8% 106.6% 103.7% 105.8%

El Toro Water District - Urban Water Management Plan Update December 2005
______________________________________________________________________________ Ergun Bakall Consulting Civil Engineer El Toro Water District
33
Reliability of a supply will often be impacted by climatic variation. To analyze the changes of reliability due to climate, this UWMP relies, for critical demand determination, on the established hydrologic conditions defined by the climatic variation of the MWDOC region. Therefore, the average water year, the single dry water year, and the multiple dry water years in MWDOC are based on the MWDOC analysis described above and as shown on Table 13. ETWD relies on import supplies provided by MWD thorough MWDOC. Various factors that may have impact on the reliability of MWD supplies are addressed by MWD in its Regional UWMP. Through prudent planning and integrated resource implementation MWD has reduced the inconsistencies associated with supply reliability. However remote, legal and environmental water quality issues may have impacts on MWD supplies. It is felt however climatic factors would probably have more impact then the others mentioned.
Table 14 Factors resulting in inconsistency of supply
Name of supply Legal Environmental Water Quality Climatic
MWD (MWDOC) x x x X
2.5 Transfer and Exchange Opportunities MWD currently has a tiered unbundled rate structure. Tier 2 of this rate structure increases the cost of supply to a member agency in order to provide a price signal that encourages development of alternative supply sources. One alternative source of supply may be a transfer or exchange of water with a different agency. The CALFED program has helped to develop an effective market for water transactions in the Bay-Delta region. This market is demonstrated by the water purchases made by the Environmental Water Account (EWA) and MWD in recent years. MWDOC and its member agencies plan to take advantage of selected transfer or exchange opportunities in the future. These opportunities can help ensure supply reliability in dry years and avoid the higher Tier 2 cost of supply from MWD. The continued development of a market for water transactions under CALFED will only increase the likelihood of MWDOC participation in this market when appropriate opportunities arise. MWDOC is in the process of developing long-term relationships with water suppliers in Northern California. These relationships may lead to transfer agreements in the near future. One example of this is the South Feather Water and Power Agency (SFWPA). MWDOC has discussed a potential transfer of water from SFWPA through the State Water Project and MWD distribution system into the MWDOC service area. This transfer would solidify MWDOC dry-year supplies while also helping to reduce dry-year costs. Initial discussions indicate this transfer could be in the range of 10,000 acre-feet per year.

El Toro Water District - Urban Water Management Plan Update December 2005
______________________________________________________________________________ Ergun Bakall Consulting Civil Engineer El Toro Water District
34
MWDOC will continue to help its member agencies in developing these opportunities and ensure their successes. In fulfilling this role, MWDOC will look to help its member agencies navigate the operational and administrative issues of wheeling water through MWD water distribution system.
ETWD relies on the efforts of MWD as well as MWDOC to pursue transfer or exchange opportunities. As such there is currently no individual effort by ETWD.
2.6 Water Use by Customer Type The District has approximately 10,104 customer connections to its potable water distribution system. All connections are metered. The following Table 15 shows the amount of actual and projected water usage by sectors on a calendar year basis from 2000 to 2025. Water use sectors within the District include: single family residential, multi-family residential and non-residential consisting of commercial, industrial, governmental and landscape irrigation demands. The District does not provide water for agricultural use with the exception of water used by commercial nursery operations. Water demands for nursery operations are included in the non-residential sector. Section 10631 (e) (1) of Water Code requires quantification, to the extent records are available, of past and current water use, over the same five-year increments described in subdivision (a) of the same code, and of projected water use, identifying the uses among water use sectors. ETWD does not provide any sales to agriculture, other agencies, saline water intrusion barriers, groundwater recharge, or conjunctive use. The District keeps records of single family, multi-family, commercial, industrial and landscape irrigation use along with recycled water use.

El Toro Water District - Urban Water Management Plan Update December 2005
______________________________________________________________________________ Ergun Bakall Consulting Civil Engineer El Toro Water District
35
Table 15 below illustrates the number of accounts for such use and the current and projected deliveries to those accounts.
Table 15
Water Use by Customer Type
1999-2000 2005 2010
metered metered metered
Water Use Sectors Number of Accounts*
Deliveries AFY
Number of accounts
Deliveries AFY
Number of accounts
Deliveries AFY
Single family 6,726 3,354 5,676 2,686 5,864 2,921
Multi-family 1,560 3,560 2,609 3,739 2,624 3,979
Commercial 921 1,288 869 1,182 915 1,318
Industrial 0 0 0 0 0 0
Institutional/gov 20 84 23 66 23 70
Landscape 871 3,145 865 2,413 826 2,355
Recycled 1 376 1 430 40 575 Unaccounted for System losses 255 341
Total 10,098 11,807 10,043 10,771 10,292 11,559 * The 1999-2000 assumptions classified certain developments as single family residences that have been re-classified as multi-family residences in the 2005 UWMP.
Table 15 Water Use by Customer Type (continued)
2015 2020 2025
metered metered Metered
Water Use Sectors Number of accounts
Deliveries AFY
Number of accounts
Deliveries AFY
Number of Accounts
Deliveries AFY
Single family 6,051 3,001 6,239 3,080 6,426 3,159
Multi-family 2,639 4,002 2,654 4,024 2,669 4,047
Commercial 962 1,384 1,008 1,451 1,055 1,518
Industrial 0 0 0 0 0 0
Institutional/gov 23 70 23 70 23 70
Landscape 826 2,356 826 2,357 826 2,359
Recycled 40 575 40 575 40 575 Unaccounted for System losses 340 340 340
Total 10,541 11,728 10,790 11,898 11,039 12,068

El Toro Water District - Urban Water Management Plan Update December 2005
______________________________________________________________________________ Ergun Bakall Consulting Civil Engineer El Toro Water District
36
Table 15 Water Use by Customer Type (continued)
2030 - opt
metered
Water Use Sectors Number of accounts Deliveries AFY
Single family 6,614 3,238
Multi-family 2,864 4,070
Commercial 1,101 1,585
Industrial 0 0
Institutional/gov 23 70
Landscape 826 2,360
Recycled 40 575
Unaccounted for System losses 322
Total 10,288 12,220
2.6.1 System Losses System losses occur due to leaks, hydrant flushing, un-accounted for usage and miscellaneous other losses. ETWD system losses amount to about 3 % of the total demand.
2.6.2 Sales to Other Agencies ETWD does not sell water to other agencies except in case of emergencies. Table 16 below is the sum of water use by customer categories, sales to other agencies (which is none) and additional water uses. Totals include recycled water use as well as unaccounted for system losses. Unaccounted for system losses and recycled water use were included in Table 15 above thereby negating the need for an additional table (that is Table 14 of the DWR Guidelines).
Table 16 Total Water Use - AF Year
1999-2000 2005 2010 2015 2020 2025 2030
Water Use 12,474 11,446 11,559 11,728 11,898 12,068 12,220

El Toro Water District - Urban Water Management Plan Update December 2005
______________________________________________________________________________ Ergun Bakall Consulting Civil Engineer El Toro Water District
37
2.7 Demand Management Measures The Urban Water Management Planning Act describes two distinct methods for providing information related to Demand Management Measures (DMMs) and meeting the requirements of Water Code Section 10631 (f) and (g): (i) Members of the CUWCC may submit annual BMP Activity Reports; or (ii) water suppliers who are not members or choose not to submit annual BMP Activity Reports must submit information about their programs, including current activities, scheduled activities, methods of evaluation, savings, and costs. As an active reporting member of the CUWCC, ETWD has included its BMP Activity Reports as Section 2.7.1 and BMP Coverage Reports as Section 2.7.2 of this Plan. The five most recent annual BMP Activity Reports are included in this Plan (2000 through 2004), along with BMP Coverage Reports as a measure of implementation over time.
2.7.1 BMP Activity Reports (2000 through 2004) The California Urban Water Conservation Council Annual Best Management Practice Activity Reports for 2000 through 2004 are provided as Appendix B in this report.
2.7.2 BMP Coverage Report (2000 through 2004) The California Urban Water Conservation Council Best Management Practice Coverage Report for 2000 through 2004 is provided as Appendix C in this report.
2.8 Evaluation of DMMs not implemented ETWD as a member of the CUWCC and a signatory to the MOU is committed to the implementation of the BMPs that make practical and economic sense in its service are. According to its CUWCC Coverage Reports the District is complying with 9 of the 14 BMPs. The following addresses the remaining 5 BMPs:
• BMP 01: Water Survey Programs for Single-Family and Multi-Family Residential Customers. ETWD has completed the survey program for single-family residences. The District, in conjunction with MWDOC, has determined the survey program for multi-family residences to be cost prohibitive relative to the projected conservation gains.
• BMP 03: System Water Audits, Leak Detection and Repair
The coverage report indicates ETWD has not met the coverage requirements for this BMP. However, ETWD’s unaccounted for water, or water loss factor, is approximately 3% which fully complies with the coverage requirement. The CUWCC coverage staff has indicated the coverage report shows the District is not meeting the requirements of BMP 03 only because ETWD has not submitted the prescreening audit documentation on an annual basis. ETWD will submit said documentation annually in the future.

El Toro Water District - Urban Water Management Plan Update December 2005
______________________________________________________________________________ Ergun Bakall Consulting Civil Engineer El Toro Water District
38
• BMP 05: Large Landscape Conservation Programs and Incentives: ETWD is currently in the process of implementing this BMP.
• BMP 09: Conservation Programs for CII Accounts
ETWD has met the requirement for ranking consumption by commercial, industrial and institutional accounts, with the understanding that the District has no industrial accounts. The District has not conducted surveys but will continue to work with MWDOC to assess the cost effectiveness of CII surveys.
• BMP 13: Water Waste Prohibition
ETWD staff is evaluating language for a future water waste prohibition ordinance for consideration by the District Board of Directors.
2.9 Planned Water Supply Projects and Programs The El Toro Water District Water Recycling Plant (WRP) operated by ETWD has a maximum monthly influent capacity of 6 MGD. Wastewater is currently treated to a secondary level. On average (in 2005), 4.7 MGD or 5,250 AF/Yr of secondary treated effluent is disposed via the SOCWA Effluent Transmission Main to the Aliso Creek Ocean Outfall and 0.4 MGD or 430 AF/Yr of effluent is treated to a secondary level followed by screening and disinfection and is sent to the recycled water distribution system. ETWD has applied for grants under Prop.50 Chapter 8 to construct a 5.0 MGD Advanced Wastewater Treatment Facility for production and distribution of recycled water at the plant. It is contemplated that the tertiary effluent would be sold to IRWD, used within the ETWD service area and sold to MNWD for seasonal use.
Table 17
Future Recycled Water Supply Projects – AFY
2010-2030
Project Name Start Date
Projected Comp.
Completion Date
NormalYield*
Single- Dry*
Multiple Dry-
Year*
Multiple Dry-
Year *
Multiple Dry-
Year *
WRP Recycled Water Project TBD 2009-10 200 200 200 200 200
* The WRP Recycled Water Project will generate an annual yield of approximately 4,300 acre-feet per year. It is estimated that approximately 200 acre-feet per year will be distributed to ETWD irrigation customers. The balance of the project yield will be sold to Irvine Ranch Water District and Moulton Niguel Water District.

El Toro Water District - Urban Water Management Plan Update December 2005
______________________________________________________________________________ Ergun Bakall Consulting Civil Engineer El Toro Water District
39
2.10 Development of Desalinated Water Until recently, seawater desalination has been considered uneconomical to be included in the water supply mix. However, recent breakthroughs in membrane technology and plant siting strategies have helped reduce desalination costs, warranting consideration among alternative resource options. However, the implementation of large-scale seawater desalination plants faces considerable challenges. These challenges include high capital and operation costs for power and membrane replacement, availability of funding measures and grants, addressing environmental issues and addressing the requirements of permitting organizations, such as the Coastal Commission. These issues require additional research and investigation. MWDOC has been in the process of studying the feasibility of ocean desalination on behalf of its member agencies. MWDOC is reviewing and assessing treatment technologies, pretreatment alternatives, and brine disposal issues, and identifying and evaluating resource issues such as permitting, and the regulatory approvals (including CEQA) associated with the delivery of desalinated seawater to regional and local distribution system. MWDOC is also assisting its member agencies in joint development of legislative strategies to seek funding in the form of grant and/or loans, and to inform decision-makers of the role of seawater desalination in the region’s future water supplies. Observing the strategies and outcomes of other agency programs (such as that in Tampa Bay, Florida) to gain insights into seawater desalination implementation and cost issues is also being undertaken. In Orange County, there are three proposed ocean desalination projects that could serve MWDOC and its member agencies with additional water supply. These are the Poseidon Resources proposed Huntington Beach Seawater Desalination Project, the joint SDCWA and MWDOC proposed Regional San Onofre Seawater Desalination Project, and the MWDOC proposed Dana Point Ocean Desalination Project. Poseidon Resources Corporation Proposed Project. The Poseidon Resources proposed Seawater Desalination Project would be co-located within the AES Generation Power Plant in Huntington Beach. It is being planned to provide 50 MGD of desalinated supply for distribution into coastal and south Orange County. Currently, the project remains in the environmental review and permitting phase. At this time, there are no current agreements with water agencies in Orange County for purchase of the product water. Joint San Diego/Orange County Proposed Regional San Onofre Project. The joint San Diego County Water Authority (SDCWA) and MWDOC proposed Regional San Onofre Seawater Desalination Project is currently being investigated to determine project feasibility. The project size is yet to be determined, but a large facility is being investigated (50 to 150 MGD). This project’s time frame has been estimated by SDCWA for implementation in 2020.

El Toro Water District - Urban Water Management Plan Update December 2005
______________________________________________________________________________ Ergun Bakall Consulting Civil Engineer El Toro Water District
40
MWDOC Proposed Dana Point Ocean Desalination Project. MWDOC is currently investigating the feasibility of an ocean desalination plant in Dana Point, in the vicinity of San Juan Creek. This project would provide both system reliability as well as providing supply reliability to the area and MWDOC service area. MWDOC commissioned a preliminary feasibility study of the project in 2000. That study suggested that the site appeared feasible for a desalination project and a 25 MGD project was recommended for this location. Therefore Table 18 shows opportunities for desalinated water on a regional basis (MWDOC service area) and not for ETWD specifically. ETWD has not, on its own, attempted to investigate seawater desalination due to economic and physical impediments.
Table 18
Opportunities for desalinated water
Sources of Water Check if yes Ocean Water x Brackish ocean water x Brackish groundwater
2.11 Current and Projected Supply Includes Wholesale Water
Water Code section 10631 (k) requires urban water suppliers that rely upon a wholesale agency for a source of water, to provide the wholesale agency with water use projections from that agency for that source of water in five-year increments to 20 years or as far as data is available. ETWD therefore has provided MWDOC, its wholesale provider, projections of future water demands. The wholesale agency, MWDOC has provided information to MWD for inclusion in the MWD plan. MWD has identified and quantified the existing and planned sources of water for its total service area. MWD has declared that it is more then capable of supplying normal, single dry-year and multi-dry year demands of all its member agencies for the next 25 years. However, due to its unique circumstances, neither MWD, nor MWDOC will identify water available to each urban water supplier in case of a shortage situation. According Government Code Section 350, in case of a shortage MWD and MWDOC will deliver water based on the need. (Please see Section 4.1 for more detailed discussion. ETWD regularly provides projection of future water demand to MWDOC. The demand figures in the following Table 19 were provided to MWDOC in preparation of the District’s as well as the MWDOC UWMP.
Table 19 ETWD Demand Projections Provided to Wholesale Suppliers - AFY
Wholesaler 2010 2015 2020 2025 2030 - opt MWDOC 10,984 11,153 11,323 11,493 11,645
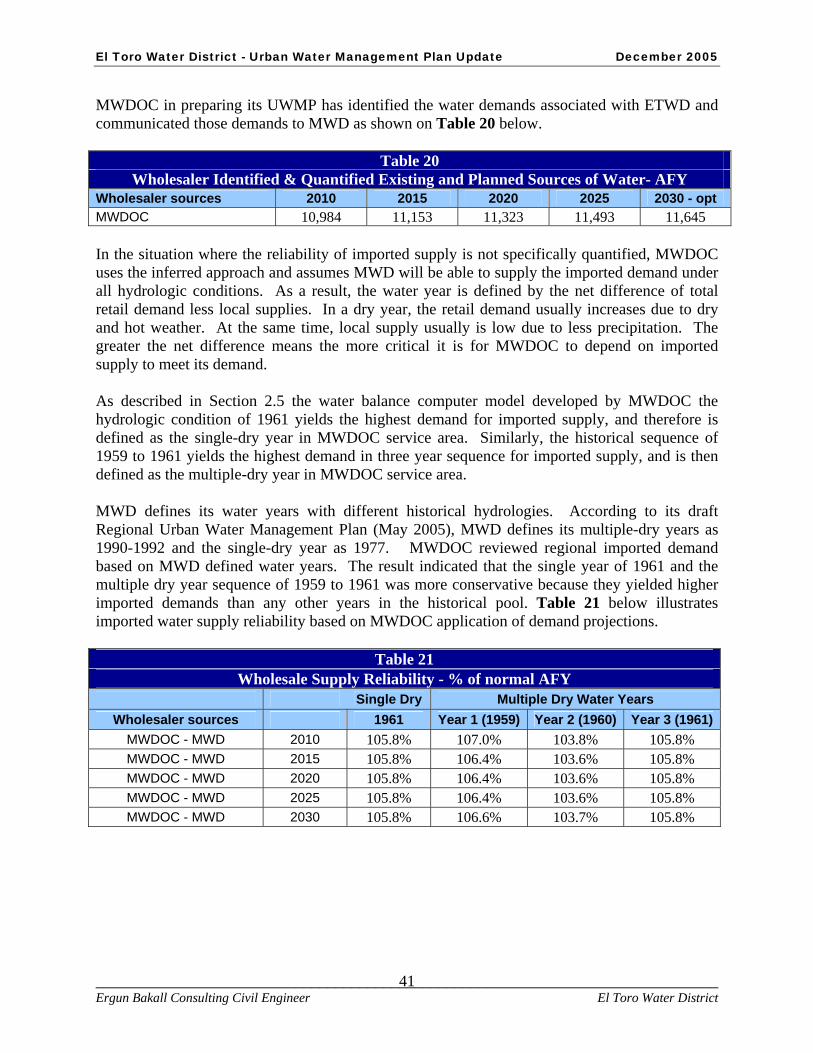
El Toro Water District - Urban Water Management Plan Update December 2005
______________________________________________________________________________ Ergun Bakall Consulting Civil Engineer El Toro Water District
41
MWDOC in preparing its UWMP has identified the water demands associated with ETWD and communicated those demands to MWD as shown on Table 20 below.
Table 20 Wholesaler Identified & Quantified Existing and Planned Sources of Water- AFY
Wholesaler sources 2010 2015 2020 2025 2030 - opt MWDOC 10,984 11,153 11,323 11,493 11,645 In the situation where the reliability of imported supply is not specifically quantified, MWDOC uses the inferred approach and assumes MWD will be able to supply the imported demand under all hydrologic conditions. As a result, the water year is defined by the net difference of total retail demand less local supplies. In a dry year, the retail demand usually increases due to dry and hot weather. At the same time, local supply usually is low due to less precipitation. The greater the net difference means the more critical it is for MWDOC to depend on imported supply to meet its demand. As described in Section 2.5 the water balance computer model developed by MWDOC the hydrologic condition of 1961 yields the highest demand for imported supply, and therefore is defined as the single-dry year in MWDOC service area. Similarly, the historical sequence of 1959 to 1961 yields the highest demand in three year sequence for imported supply, and is then defined as the multiple-dry year in MWDOC service area. MWD defines its water years with different historical hydrologies. According to its draft Regional Urban Water Management Plan (May 2005), MWD defines its multiple-dry years as 1990-1992 and the single-dry year as 1977. MWDOC reviewed regional imported demand based on MWD defined water years. The result indicated that the single year of 1961 and the multiple dry year sequence of 1959 to 1961 was more conservative because they yielded higher imported demands than any other years in the historical pool. Table 21 below illustrates imported water supply reliability based on MWDOC application of demand projections.
Table 21 Wholesale Supply Reliability - % of normal AFY
Single Dry Multiple Dry Water Years Wholesaler sources 1961 Year 1 (1959) Year 2 (1960) Year 3 (1961)
MWDOC - MWD 2010 105.8% 107.0% 103.8% 105.8% MWDOC - MWD 2015 105.8% 106.4% 103.6% 105.8% MWDOC - MWD 2020 105.8% 106.4% 103.6% 105.8% MWDOC - MWD 2025 105.8% 106.4% 103.6% 105.8% MWDOC - MWD 2030 105.8% 106.6% 103.7% 105.8%

El Toro Water District - Urban Water Management Plan Update December 2005
______________________________________________________________________________ Ergun Bakall Consulting Civil Engineer El Toro Water District
42
3.0 DETERMINATION OF DMM IMPLEMENTATION Water Code section 10631.5 states that the DWR shall take into consideration whether the urban water supplier is implementing or scheduled for implementation, the water demand management activities that the urban water supplier identified in its urban water management plan, pursuant to Section 10631, in evaluating applications for grants and loans made available pursuant to Section 79163. The Act allows an urban water supplier who is signatory to the MOU by the CUWCC to submit to the department copies of its annual reports and other relevant documents to assist the department in determining whether the urban water supplier is implementing or scheduling the implementation of water demand management activities. ETWD recognizes the importance of water conservation and has made water use efficiency an integral part of water use planning. The District also has implemented and actively participates in many water conservation activities. An Emergency Water Conservation Ordinance was adopted by the ETWD Board of Directors in 1991 as Ordinance No. 1991-01. The District is a Member Agency of the CUWCC and signatory to the Best Management Practices MOU. ETWD actively participates in most of the Best Management Practices (BMPs) as outlined in the Memorandum of Understanding in cooperation with the MWDOC and other retail agencies. The most recent BMP Activity Report submitted to CUWCC for years 2003-2004 are included in Appendix B.
4.0 WATER SHORTAGE CONTINGENCY PLAN
4.1 Imported Water Shortages As a wholesaler of imported water to ETWD, it is the responsibility of MWDOC to manage its supplies during times of shortage. During shortages, MWDOC manages its water supply to ensure it meets the demands of its member (retail) water agencies. In turn, retail water agencies must manage their local supplies and supplies they receive from MWDOC utilizing various mechanisms to ensure the reliability of their supply.
4.1.1 Stages of Drought Action While MWDOC has broad powers to allocate or prohibit uses of water upon the declaration of a Water Shortage Emergency by its Board, MWDOC has not acted to directly mandate how water is used by its member (retail) water agencies in the past. However, MWDOC is responsible for how imported water will be allocated to each member agency, which will then determine specific stages of shortage actions in accordance with the situation at hand. During past shortages, MWDOC has adopted Board Resolutions urging its retail agencies to develop and implement water shortage plans; calling upon each agency to adopt and enforce regulations prohibiting the waste of water; and implementing an allocation plan for available imported water consistent with reductions, incentives and penalties imposed on MWDOC by the MWD.
El Toro Water District - Urban Water Management Plan Update December 2005
______________________________________________________________________________ Ergun Bakall Consulting Civil Engineer El Toro Water District
43
MWDOC receives its imported water from MWD. MWD has a Water Surplus and Drought Management Plan (WSDM Plan) for the management of its imported water. The WSDM Plan has identified seven stages of water shortages caused by dry years and drought, with each one getting significantly more severe (see Table 22). It is anticipated that water shortages would have to be extremely severe for MWD to implement the action listed for Stage 7, which is to allocate its imported water supplies to its member agencies. For example, even with significant reductions in Colorado River water supplies and a repeat of the 1987-1992 drought on the State Water Project, MWD did meet all retail water needs of its member agencies by implementing the stages one through six of the WSDM Plan until 2030 (MWD Integrated Resources Plan Update, 2004). 4.1.2 MWD Water Shortage and Drought Management Plan The MWD Board of Directors adopted the WSDM Plan in April of 1999. The plan provides policy guidance for management of regional water supplies to achieve the reliability goals of MWD’s Integrated Resources Plan (IRP). Through effective management of its water supply, MWD fully expects to be 100 percent reliable in meeting all non-discounted, non-interruptible demands throughout the next ten years. Unlike the previous shortage management plans, the WSDM Plan recognizes the link between surpluses and shortages, and it integrates planned operational actions with respect to both conditions. The WSDM Plan continues MWD’s commitment to the regional planning approaches initiated in the IRP. WSDM Plan Development MWD and its member agencies jointly developed the WSDM Plan during 1998 and 1999. This planning effort included more than a dozen half-day and full-day workshops and more than three dozen meetings of MWD and member agency staff. The result of the planning effort is a consensus plan addressing a broad range of regional water management actions and strategies. WSDM Plan Principles and Goals The guiding principle of the WSDM Plan is to manage MWD water resources and management programs to maximize management of wet year supplies and minimize adverse impacts of water shortages to retail customers. From this guiding principle come the following supporting principles: • Encourage efficient water use and economical local resource programs. • Coordinate operations with member agencies to make as much surplus water as possible
available for use in dry years. • Pursue innovative transfer and banking programs to secure more imported water for use in
dry years. • Increase public awareness about water supply issues.
The WSDM plan also declared that, should mandatory import water allocations be necessary, those allocations would be calculated on the basis of need, as opposed to any type of historical

El Toro Water District - Urban Water Management Plan Update December 2005
______________________________________________________________________________ Ergun Bakall Consulting Civil Engineer El Toro Water District
44
purchases. The WSDM plan contains the following considerations that would go into an equitable allocation of imported water: • Impact on retail consumers and regional economy • Investments in local resources, including recycling and conservation • Population growth • Changes and/or losses in local supplies • Participation in MWD Non-firm (interruptible) programs • Investment in MWD facilities Ensuring Regional Reliability As a result of the investments made in conservation, water recycling, storage, and supply, MWD has identified a resource management plan that should result in 100 percent reliability for non-discounted non-interruptible demands through 2030. A key element of the strategy is to store surplus supplies during wet periods for use during drought periods. The WSDM Plan guides the operations of these resources to ensure short- and long-term regional reliability. It identifies the expected sequence of resource management actions MWD will execute during surpluses and shortages to minimize the probability of severe shortages and eliminate the possibility of extreme shortages and shortage allocations. Surplus and Shortage Stages The WSDM Plan distinguishes between Surpluses, Shortages, Severe Shortages, and Extreme Shortages. Within the WSDM Plan, these terms have specific meanings relating to MWD capability to deliver water to its customers. Surplus: MWD can meet full-service and interruptible program demands, and it can deliver water to local, regional and out-of-region storage. Shortage: MWD can meet full-service demands and partially meet or fully meet interruptible demands, using stored water or water transfers as necessary. Severe Shortage: MWD can meet full-service demands only by using stored water, transfers, and possibly calling for extraordinary conservation. In a Severe Shortage, MWD may have to curtail Interim Agricultural Water Program deliveries. Extreme Shortage: MWD must allocate available supply to full-service customers. The WSDM Plan also defines five surplus management stages and seven shortage management stages to guide resource management activities. These stages are not defined merely by shortfalls in imported water supply, but also by the water balances in MWD storage programs. Thus, a ten percent shortfall in imported supplies could be a stage one shortage if storage levels are high. If storage levels are already depleted, the same shortfall in imported supplies could potentially be defined as a more severe shortage. Each year, MWD evaluates the level of supplies available and existing levels of water in storage to determine the appropriate management stage for that year. Each stage is associated with specific resource management

El Toro Water District - Urban Water Management Plan Update December 2005
______________________________________________________________________________ Ergun Bakall Consulting Civil Engineer El Toro Water District
45
actions designed to (1) avoid an Extreme Shortage to the maximum extent possible and (2) minimize adverse impacts to retail customers should an Extreme Shortage occur. The current sequencing outlined in the WSDM Plan reflects anticipated responses based on detailed modeling of MWD existing and expected resource mix. Storage Actions by Surplus Stage MWD’s supply situation is considered to be in surplus as long as net annual deliveries can be made to water storage programs. Deliveries for storage in the Diamond Valley Lake and in the SWP terminal reservoirs continue through each surplus stage, provided that there is available storage capacity. Withdrawals from Diamond Valley Lake for regulatory purposes or to meet seasonal demands may occur in any stage. Deliveries to other storage facilities may be interrupted, depending on the amount of the surplus. The following section discusses the management actions to be taken under various levels of surplus, ranked from the smallest to the largest amount of surplus. Surplus Stage 1. MWD may curtail or temporarily suspend (1) deliveries to regional groundwater basins under the Conjunctive Use and Cyclic Storage programs; (2) deliveries to Semitropic and Arvin-Edison groundwater storage programs; (3) deliveries of SWP carryover water to SWP reservoirs; and (4) contractual groundwater storage deliveries. Surplus Stage 2. MWD may curtail or temporarily suspend (1) deliveries to regional groundwater basins under the Conjunctive Use and Cyclic Storage programs; (2) deliveries to Semitropic and Arvin-Edison groundwater storage programs; and (3) deliveries of SWP carryover water to SWP reservoirs. Surplus Stage 3. MWD may curtail or temporarily suspend (1) deliveries to regional groundwater basins under the Conjunctive Use and Cyclic Storage programs; and (2) deliveries to Semitropic and Arvin-Edison groundwater storage programs. Surplus Stage 4. MWD may curtail or temporarily suspend deliveries under the Conjunctive Use and Cyclic Storage programs. Surplus Stage 5. MWD will make deliveries to all available in-region and out-of-region storage resources, including deliveries under the Conjunctive Use and Cyclic Storage programs. Shortage Actions by Shortage Stage When MWD must make net withdrawals from storage to meet demands, it is considered to be in a shortage condition. Under most of these stages, it is still able to meet all end-use demands for water. The following summaries describe water management actions to be taken under each of the seven shortage stages. Shortage Stage 1. MWD may make withdrawals from Diamond Valley Lake. Shortage Stage 2. MWD will continue Shortage Stage 1 actions and may draw from out-of-region groundwater storage.

El Toro Water District - Urban Water Management Plan Update December 2005
______________________________________________________________________________ Ergun Bakall Consulting Civil Engineer El Toro Water District
46
Shortage Stage 3. MWD will continue Shortage Stage 2 actions and may curtail or temporarily suspend deliveries to Long Term Seasonal and Replenishment Programs in accordance with their discounted rates. Shortage Stage 4. MWD will continue Shortage Stage 3 actions and may draw from conjunctive use groundwater storage (such as the North Las Posas program) and the SWP terminal reservoirs. Shortage Stage 5. MWD will continue Shortage Stage 4 actions. The MWD Board of Directors may call for extraordinary conservation through a coordinated outreach effort and may curtail Interim Agricultural Water Program deliveries in accordance with their discounted rates. In the event of a call for extraordinary conservation, the MWD Drought Program Officer will coordinate public information activities with member agencies and monitor the effectiveness of ongoing conservation programs. The Drought Program Officer will implement monthly reporting on conservation program activities and progress and will provide quarterly estimates of conservation water savings. Shortage Stage 6. MWD will continue Shortage Stage 5 actions and may exercise any and all water supply option contracts and/or buy water on the open market either for consumptive use or for delivery to regional storage facilities for use during the shortage. Shortage Stage 7. MWD will discontinue deliveries to regional storage facilities, except on a regulatory or seasonal basis, continue extraordinary conservation efforts, and develop a plan to allocate available supply fairly and efficiently to full-service customers. The allocation plan will be based on the Board-adopted principles for allocation listed previously. MWD intends to enforce these allocations using rate surcharges. Under the current WSDM Plan, the surcharges will be set at a minimum of $175 per AF for any deliveries exceeding a member agency’s allotment. Any deliveries exceeding 102% of the allotment will be assessed a surcharge equal to three times MWD full-service rate. Although the WSDM Plan did not specify the exact formula for how imported water would be allocated in Stage 7, it did include some principles for allocation. The MWD Board adopted the WSDM Plan and principles for imported water allocation in 1999.

El Toro Water District - Urban Water Management Plan Update December 2005
______________________________________________________________________________ Ergun Bakall Consulting Civil Engineer El Toro Water District
47
Table 22 summarizes the water supply shortage stages and the actions to be undertaken under those conditions.
Table 22 MWD Water Surplus & Drought Management Plan
Water Supply Shortage Stages and Conditions
Stage No. Actions
1 Withdraw stored water from Diamond Valley Lake
2 Stage 1 plus draw from out of region groundwater storage
3 Stage 2 plus curtail/temporary suspend deliveries to local groundwater and surface storage replenishment in accordance with their discounted rates
4 Stage 3 plus draw from local Conjunctive Use Groundwater Programs & SWP terminus reservoirs
5 Stage 4 plus extraordinary conservation through coordinated outreach and curtail Interim Agricultural Water Program deliveries in accordance with discounted rates
6 Stage 5 plus exercise water transfer option contracts and/or buy water on open market for consumptive use or for delivery to regional storage facilities
7 Stage 6 plus allocation of imported water to member agencies based adopted principles of fairness and need

El Toro Water District - Urban Water Management Plan Update December 2005
______________________________________________________________________________ Ergun Bakall Consulting Civil Engineer El Toro Water District
48
Figure 1 below graphically illustrates resource stages, anticipated actions and supply declarations under the WSDM Plan.
Figure 1 Resource Stages, Anticipated Actions, and Supply Declarations
While MWDOC has broad powers to allocate or prohibit uses of water upon the declaration of a Water Shortage Emergency by its Board, MWDOC has not acted to directly mandate how water is used by its member (retail) water agencies in the past. However, MWDOC is responsible for how imported water will be allocated to each member agency, which will then determine specific stages of shortage actions in accordance with situation at hand. During past shortages, MWDOC has adopted Board Resolutions urging its retail agencies to develop and implement water shortage plans; calling upon each agency to adopt and enforce regulations prohibiting the waste of water; and implementing an allocation plan for available imported water consistent with reductions, incentives and penalties imposed on MWDOC by MWD. MWDOC would use the same principles as identified in the WSDM Plan for the allocation of imported water to its member (retail) water agencies, subject to any locally developed principles or adjustments found to be relevant and adopted by the MWDOC Board. The stages of imported water management during a drought would give MWDOC sufficient time to work with its retail water agencies to develop an equitable formula for the allocation of imported water supplies
Surplus Stages Shortage Stages
Surplus ShortageSevere
ShortageExtremeShortage
5 4 3 2 1 Actions 1 2 3 4 5 6 7Make Cyclic Deliveries
Fill Semitropic, Arvin-EdisonStore supplies in SWP Carryover
Fill Contractual GWFill Monterey Res.
Fill EastsideConduct Public Affairs Program
Take from EastsideTake from Semitropic, Arvin-Ed.Cut LTS and Replen. Deliveries
Take from Contractual GWTake from Monterey Res.
Call for Extraordinary ConservationReduce IAWP DeliveriesCall Options Contracts
Buy Spot WaterImplement Allocation Plan
Potential Simultaneous Actions

El Toro Water District - Urban Water Management Plan Update December 2005
______________________________________________________________________________ Ergun Bakall Consulting Civil Engineer El Toro Water District
49
4.1.2 ETWD Emergency Water Conservation Ordinance An Emergency Water Conservation Ordinance was adopted by the ETWD Board of Directors in 1991 as Ordinance No. 1991-01. A copy of the Ordinance is attached in Appendix D.
4.2 Estimate of Minimum Water Supply for Next Three Years MWD has declared 100 % reliability for full service through the year 2010. The MWD Regional UWMP documents the demand-supply balance in multiple dry years, single dry year and average year as shown in Section 2.5 herein. Therefore ETWD anticipates the ability to meet its water demand through the next three years. ETWD has determined maximum water demands for each of the next three-years, 2006-2008. Table 26 compares demands under normal conditions and under a hypothetical repeat of the historical driest three-year period defined by the MWDOC hydrological analysis. During multiple dry years retail demands increase, resulting in the use of increased imported supplies from MWD. MWD is expected to meet all retail consumption during a three-year dry period of 2006-2008 based on the three-driest years on record. The draft MWD 2005 Regional UWMP indicates that MWD can provide 100% of the supply demanded by its member agencies until 2030.
Table 23 below compares the total supplies available to ETWD with the projected total demand for normal as well as multiple dry year scenarios for years 2006 through 2008. The table reflects MWD and MWDOC’s position that there is adequate supply to meet the projected ETWD demands.
Table 23 Three-Year Estimated Minimum Water Supply - AFY
Normal Multiple Dry Year Source
2006 2007 2008 2006 2007 2008 Local Supplies 375 375 375 375 375 375 Imported Supply 10,995 10,995 10,995 11,757 11,416 11,626 Total Supply Capability 11,370 11,370 11,370 12,132 11,791 12,001 Total Demand 11,370 11,370 11,370 12,132 11,791 12,001
4.3 Catastrophic Supply Interruption Plan From a regional perspective, Orange County and all of Southern California is heavily dependent upon imported water supplies from MWD. Imported water is conveyed through the SWP and CRA, which travel hundreds of miles to reach urban Southern California, and specifically to reach Orange County. Additionally, this water is distributed to customers through an intricate network of pipes and water mains that are susceptible to damage from earthquakes and other disasters. Regional storage for Southern California and Orange County is provided by MWD to mitigate an outage of either the SWP or CRA. The recently completed Diamond Valley Lake is an 800,000 acre-foot reservoir, of which about 400,000 acre-feet of water is reserved for catastrophic emergencies. In fact, protection from catastrophic events such as earthquakes was a major reason for the construction of Diamond Valley Lake.

El Toro Water District - Urban Water Management Plan Update December 2005
______________________________________________________________________________ Ergun Bakall Consulting Civil Engineer El Toro Water District
50
In 1983, the Orange County water community developed a Water Supply Emergency Preparedness Plan to respond effectively to disasters impacting the regional water distribution system. The collective efforts of these agencies resulted in the formation of the Water Emergency Response Organization of Orange County (WEROC) to coordinate emergency response on behalf of all Orange County water agencies, develop an emergency plan to respond to disasters, and conduct disaster training exercises for the Orange County water community. WEROC is unique in its ability to provide a single point of contact for representation of all water utilities in Orange County during a disaster. This representation is to the county, state, and federal disaster coordination agencies. Within the Orange County Operational Area, WEROC is the recognized contact for emergency disaster response for the water community. For more details on WEROC, please refer to MWDOC Regional UWMP.
ETWD relies on imported water for approximately 95% of its supply. In the event of a supply interruption in the importation facilities, the District’s, as well as most of South Orange County’s, customers would be greatly impacted. In December of 1999, the AMP unexpectedly ruptured, immediately eliminating a major source of supply to South Orange County. MWD was able to repair the pipeline and restore regular operations within seven days. It was fortunate that this pipeline failure occurred during the winter in a relatively accessible location. A more difficult pipeline repair or a major failure at the Diemer Filtration Plant could result in an interruption in import supply of greater than seven days. The MWD Administrative Policy requires its member agencies be able to withstand planned supply shutdowns of at least seven days between the months of October and April. This policy is designed to facilitate MWD’s ability to conduct scheduled maintenance of the supply and treatment systems. The 1999 AMP failure made it quite apparent that the agencies in South Orange County that depend on the import supply must plan for unexpected supply interruptions during potential peak demand conditions.
The customers of ETWD are fortunate that its forefathers had the foresight to invest in a major potable water storage facility. The District’s R-6 Reservoir was constructed in 1967 with a capacity of 233 million gallons. The facility was expanded in 2002 to 275 million gallons. After selling portion of its capacity to Santa Margarita Water District and Moulton Niguel Water District ETWD still has 124.5 million gallons of storage capacity in the R-6 Reservoir.
ETWD has conducted extensive analyses to assess the ability to withstand unanticipated import supply interruptions. These analyses have considered scenarios ranging from a short term winter outage to a long term supply shutdown under max month summer conditions.
The first component of this analysis was to identify demands under different seasonal conditions. Research of District billing records over the last five years, (July, 1999 – June, 2004), was conducted to establish average annual, winter and summer demand data. Summer demand was derived from the monthly data by averaging the consumption in the months of June through October. Likewise, winter demand was derived by averaging the consumption in the months of December through April. A review of purchased water records was conducted to verify max month demands.
The storage capacity contained in the R-6 Reservoir represents bulk of the District’s emergency storage. The District operates 5 tank type reservoirs with a combined 12 million gallons of storage capacity. These reservoirs, however, are operational reservoirs that are unlikely to be full in the event of an emergency. For purposes of this analysis, the capacity of these reservoirs

El Toro Water District - Urban Water Management Plan Update December 2005
______________________________________________________________________________ Ergun Bakall Consulting Civil Engineer El Toro Water District
51
was not considered as emergency storage. It is also unlikely that the R-6 Reservoir would be at its high water level of 630.3 at the onset of an emergency. Recognizing the importance of the storage in the R-6 Reservoir the District severely limits the band in which the reservoir may be operated. For purposes of this analysis it is assumed that the reservoir will be at elevation 629. At that elevation the reservoir contains 265.8 million gallons of which ETWD owns 119.9 million gallons.
Quantification of the demand scenarios and the available storage capacity makes it possible to quantify the number of days the District can survive a supply interruption under the various seasonal demand scenarios.
Table 24 defines the outage duration the District can accommodate with the existing storage volume and no mandatory or voluntary curtailment or conservation.
Table 24
ETWD Sustainable Outage Durations
Demand Condition Demand Storage Volume Outage Duration
Average Annual 9.72 MGD 119.9 mg 12.3 days
Average Summer 12.29 MGD 119.9 mg 9.8 days
Average Winter 7.35 MGD 119.9 mg 16.3 days
Max Month 16.16 MGD 119.9 mg 7.4 days
While ETWD is well positioned to accommodate the short term supply interruptions, the analysis must also consider its ability to withstand the type of long term outage that major or multiple pipeline failures or a Diemer Filtration Plant shutdown would engender.
The means by which ETWD would extend the time that it can withstand a supply outage would include both passive and direct demand curtailment. Passive curtailment assumes that the District’s customers will enact voluntary conservation measures based on their knowledge of an on-going incident or crisis. A major shutdown will undoubtedly be accompanied by MWDOC and/or MWD press releases and extensive media coverage. During the 1999 AMP failure, word was spread quickly to the general population of the need for conservation until the pipeline could be repaired restoring normal service to the South Orange County region.
Direct curtailment will involve a measured response to the crisis by ETWD. This response may range from contacting large irrigators and requesting conservation to physically discontinuing service to irrigation customers and conducting widespread public outreach efforts to encourage conservation in the residential community.
Conservation requirements necessary to accommodate various shutdown durations are defined in Table 25. These requirements are broken down into two categories. The dedicated irrigation demand is that irrigation which is served by dedicated irrigation meters. By virtue of these dedicated services, it is possible to isolate the irrigation demand and define the curtailment

El Toro Water District - Urban Water Management Plan Update December 2005
______________________________________________________________________________ Ergun Bakall Consulting Civil Engineer El Toro Water District
52
objectives specific to the irrigation consumption. It is also possible to physically discontinue service to these meters in an emergency condition. The “Other” demand is all demand exclusive of dedicated irrigation. ETWD has much less control over this demand and will rely on voluntary compliance to achieve conservation objectives.
In the cases where conservation is necessary it is assumed that conservation will take place in an accelerating fashion. It is not reasonable to assume that the ultimate conservation requirements can be achieved on the first day of a supply shutdown. Each scenario assumes conservation beginning on day one and increasing each day until the ultimate conservation objective is reached. The demand and conservation assumptions take into account ETWD’s ability to quickly and directly communicate with the large irrigators. In the extreme cases the assumptions also take into account the potential need for ETWD to physically discontinue service to irrigation customers in order to achieve conservation requirements. ETWD has developed detailed demand schedules for each of the scenarios defining the daily curtailment objectives. These schedules will enable the District to track the implementation and success of conservation measures.
As the R-6 Reservoir level falls, ETWD will be able to determine if demands have been appropriately reduced commensurate with the emergency condition. ETWD has never experienced a supply interruption more severe than the 1999 Winter AMP failure. The conservation projections defined in this analysis have never been put to the test. During the course of an emergency supply interruption, if demands are greater than those defined in the appropriate schedule, ETWD will need to take immediate steps to further reduce consumption.
7-Day Shutdown: ETWD can withstand a 7-day shutdown at any time with no curtailment.
10-Day Shutdown: ETWD can withstand a 10-day shutdown with no curtailment in all but maximum month conditions. Under the conservative maximum month demand scenario the District would need to cut back on use to simulate average summer demands in order to accommodate a ten day supply interruption. Table 25 indicates this would entail curtailment of dedicated irrigation demand by 40% to a level consistent with average summer demand. All other demands would need to be reduced by 24% resulting in a total reduction of 29%. Considering the conservative nature of the maximum month demand assumptions and the realistically achievable conservation assumptions, ETWD will not have any problem withstanding a 10-day supply interruption.
14-Day Shutdown: The 14 day shutdown analysis indicates no conservation is required in winter demand conditions. In order to accommodate the 14-day shutdown under any other demand condition, demands must be reduced to levels consistent with winter demands. For annual average and summer conditions this will require a 50% reduction in irrigation demand and a 10% - 25% reduction in all other consumption. The maximum month scenario will require all dedicated irrigation be discontinued and that other consumption be decreased by 40%. These are aggressive projections that will require diligent effort by ETWD and high levels of cooperation by its customers.
20-Day Shutdown: The 20-day shutdown contemplates AMP failures in multiple locations or a failure of the Diemer Plant that requires an extended outage in order to facilitate a repair. This scenario represents an extreme emergency necessitating emergency measures. The curtailment scenarios in this dire scenario assume demands will be reduced to 80% of average winter demand. By definition, this requires a 20% reduction in the winter demand scenario. As shown

El Toro Water District - Urban Water Management Plan Update December 2005
______________________________________________________________________________ Ergun Bakall Consulting Civil Engineer El Toro Water District
53
in Table 25 the average annual, average summer and maximum month conditions will require consumption reductions of 60% - 100% for irrigation and 32% - 55% for all other demands. Achieving conservation of this extreme magnitude will likely require ETWD physically discontinue service to the dedicated irrigation meters and conduct extensive public outreach to encourage major conservation on the part of the residential and commercial community. Shutdowns exceeding 20 days would require even greater levels of conservation.
Table 25
ETWD Demand Curtailment Requirements
Scenario Dedicated
Irrigation
Other
Demand
Total
Demand
Demand
Assumptions
7 - Day
No Curtailment Required
10 - Day
Average Winter No Curtailment Required
Average Annual No Curtailment Required
Average Summer No Curtailment Required 9.8 Days
Max Month 40% 24% 29% Average Summer
14 - Day
Average Winter No Curtailment Required
Average Annual 50% 10% 21% Winter
Average Summer 50% 25% 33% Winter
Max Month 100% 40% 60% Winter
20 Day / Extended Outage
Average Winter 20% 20% 20% 80% Winter
Average Annual 60% 32% 39% 80% Winter
Average Summer 90% 37% 54% 80% Winter
Max Month 100% 55% 70% 80% Winter

El Toro Water District - Urban Water Management Plan Update December 2005
______________________________________________________________________________ Ergun Bakall Consulting Civil Engineer El Toro Water District
54
4.4 Water Use Prohibitions Table 26 summarizes water supply shortage stages and conditions as well as the rationing stages as defined in the ETWD Emergency Water Conservation Ordinance – Ordinance No. 1991-1.
Table 26 Water Supply Shortage Stages and Conditions
Rationing Stages
Phase No. Water Supply Conditions % Shortage
Phase I Imported supplies may be reduced 0
Phase II Imported supplies likely to be reduced – ETWD Board declaration 5-10
Phase III ETWD will incur water shortages 10-15
Phase IV ETWD will incur water shortages 15-20
Phase V ETWD will incur water shortages 20-25
Phase VI ETWD will incur water shortages 25-35

El Toro Water District - Urban Water Management Plan Update December 2005
______________________________________________________________________________ Ergun Bakall Consulting Civil Engineer El Toro Water District
55
Table 27 provides examples of mandatory prohibitions for different stages of shortages as defined in the ETWD Emergency Water Conservation Ordinance – Ordinance No. 1991-1.
Table 27 Mandatory Prohibitions
Examples of Prohibitions Phase When
Prohibition Becomes Mandatory
Using potable water for street washing Phase II
Residential and Commercial landscape irrigation only every third day Phase II
Golf Course and Nursery irrigation only every other day Phase II
All uses restricted to 95% of prior year usage Phase II
Residential and Commercial landscape irrigation only twice per week Phase III
Golf Course and Nursery irrigation only every third day Phase III
All uses restricted to 90% of prior year usage Phase III
Residential and Commercial landscape irrigation only once per week Phase IV
Nursery irrigation only twice per week Phase IV
Golf Course fairways shall not be irrigated. Other areas only twice per week Phase IV
All uses restricted to 85% of prior year usage Phase IV
Residential and Commercial landscape irrigation only every 10 days Phase V
Nursery irrigation only once per week Phase V
Golf Course fairways shall not be irrigated. Other areas only once per week Phase V
Public area irrigation to require ETWD irrigation permit Phase V
Installation of new landscape is prohibited Phase V
Use of construction water to require ETWD permit Phase V
All uses restricted to 80% of prior year Phase V
All uses restricted to 70% of prior year Phase VI
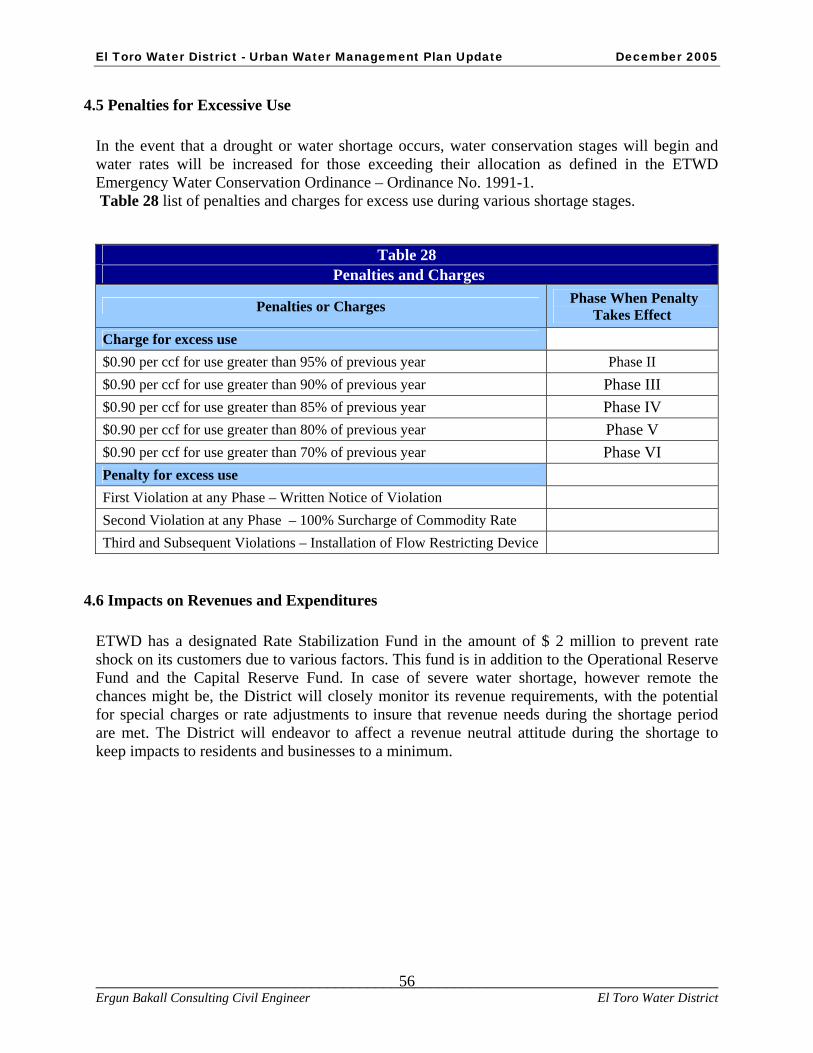
El Toro Water District - Urban Water Management Plan Update December 2005
______________________________________________________________________________ Ergun Bakall Consulting Civil Engineer El Toro Water District
56
4.5 Penalties for Excessive Use In the event that a drought or water shortage occurs, water conservation stages will begin and water rates will be increased for those exceeding their allocation as defined in the ETWD Emergency Water Conservation Ordinance – Ordinance No. 1991-1. Table 28 list of penalties and charges for excess use during various shortage stages.
Table 28 Penalties and Charges
Penalties or Charges Phase When Penalty Takes Effect
Charge for excess use $0.90 per ccf for use greater than 95% of previous year Phase II $0.90 per ccf for use greater than 90% of previous year Phase III $0.90 per ccf for use greater than 85% of previous year Phase IV $0.90 per ccf for use greater than 80% of previous year Phase V $0.90 per ccf for use greater than 70% of previous year Phase VI Penalty for excess use First Violation at any Phase – Written Notice of Violation Second Violation at any Phase – 100% Surcharge of Commodity Rate Third and Subsequent Violations – Installation of Flow Restricting Device
4.6 Impacts on Revenues and Expenditures ETWD has a designated Rate Stabilization Fund in the amount of $ 2 million to prevent rate shock on its customers due to various factors. This fund is in addition to the Operational Reserve Fund and the Capital Reserve Fund. In case of severe water shortage, however remote the chances might be, the District will closely monitor its revenue requirements, with the potential for special charges or rate adjustments to insure that revenue needs during the shortage period are met. The District will endeavor to affect a revenue neutral attitude during the shortage to keep impacts to residents and businesses to a minimum.
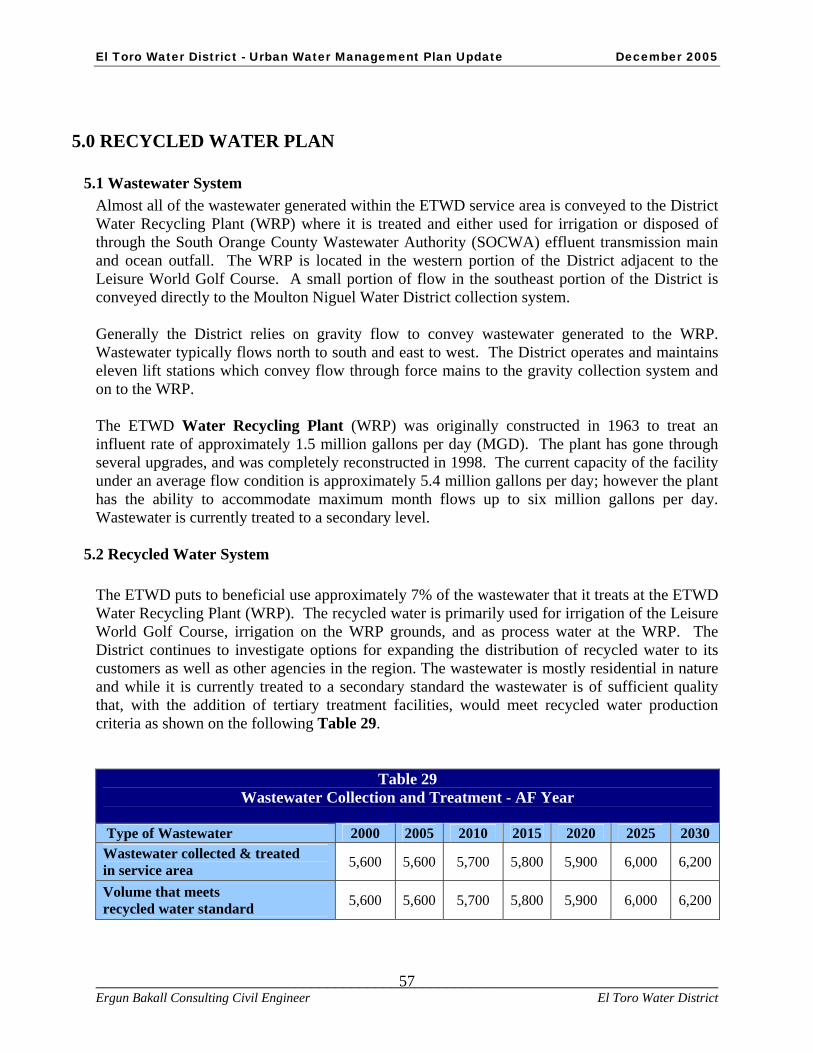
El Toro Water District - Urban Water Management Plan Update December 2005
______________________________________________________________________________ Ergun Bakall Consulting Civil Engineer El Toro Water District
57
5.0 RECYCLED WATER PLAN
5.1 Wastewater System Almost all of the wastewater generated within the ETWD service area is conveyed to the District Water Recycling Plant (WRP) where it is treated and either used for irrigation or disposed of through the South Orange County Wastewater Authority (SOCWA) effluent transmission main and ocean outfall. The WRP is located in the western portion of the District adjacent to the Leisure World Golf Course. A small portion of flow in the southeast portion of the District is conveyed directly to the Moulton Niguel Water District collection system. Generally the District relies on gravity flow to convey wastewater generated to the WRP. Wastewater typically flows north to south and east to west. The District operates and maintains eleven lift stations which convey flow through force mains to the gravity collection system and on to the WRP. The ETWD Water Recycling Plant (WRP) was originally constructed in 1963 to treat an influent rate of approximately 1.5 million gallons per day (MGD). The plant has gone through several upgrades, and was completely reconstructed in 1998. The current capacity of the facility under an average flow condition is approximately 5.4 million gallons per day; however the plant has the ability to accommodate maximum month flows up to six million gallons per day. Wastewater is currently treated to a secondary level.
5.2 Recycled Water System The ETWD puts to beneficial use approximately 7% of the wastewater that it treats at the ETWD Water Recycling Plant (WRP). The recycled water is primarily used for irrigation of the Leisure World Golf Course, irrigation on the WRP grounds, and as process water at the WRP. The District continues to investigate options for expanding the distribution of recycled water to its customers as well as other agencies in the region. The wastewater is mostly residential in nature and while it is currently treated to a secondary standard the wastewater is of sufficient quality that, with the addition of tertiary treatment facilities, would meet recycled water production criteria as shown on the following Table 29.
Table 29 Wastewater Collection and Treatment - AF Year
Type of Wastewater 2000 2005 2010 2015 2020 2025 2030 Wastewater collected & treated in service area 5,600 5,600 5,700 5,800 5,900 6,000 6,200
Volume that meets recycled water standard 5,600 5,600 5,700 5,800 5,900 6,000 6,200
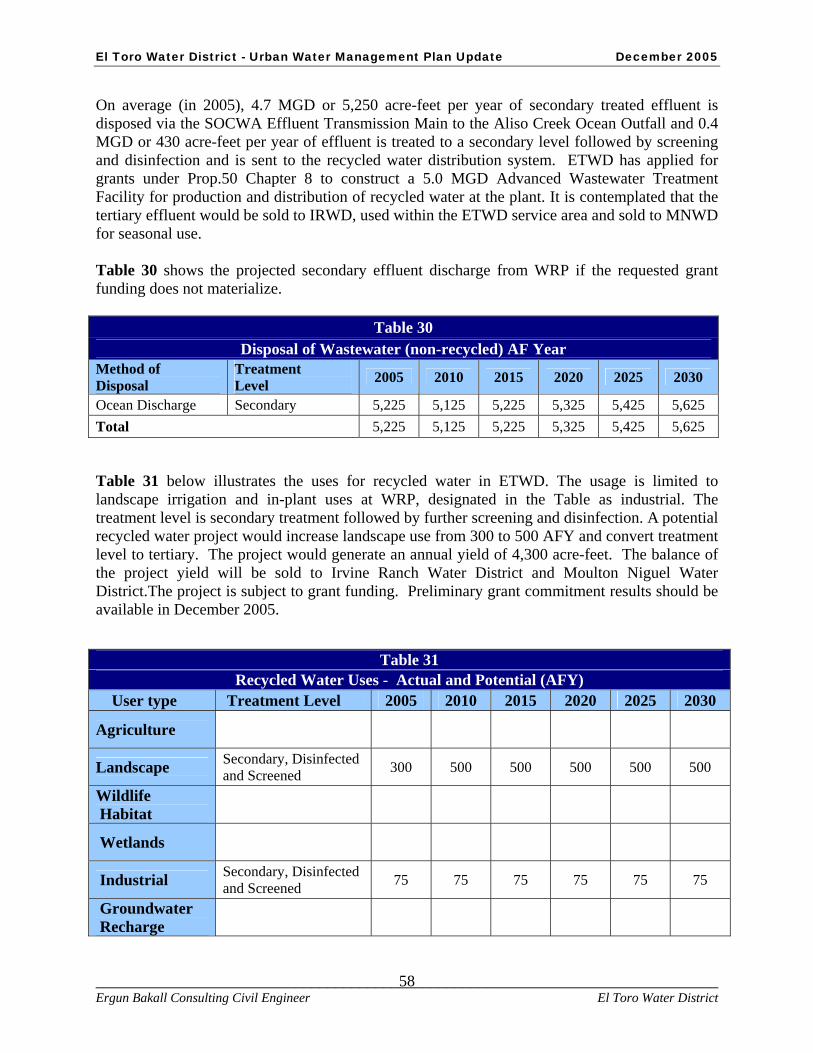
El Toro Water District - Urban Water Management Plan Update December 2005
______________________________________________________________________________ Ergun Bakall Consulting Civil Engineer El Toro Water District
58
On average (in 2005), 4.7 MGD or 5,250 acre-feet per year of secondary treated effluent is disposed via the SOCWA Effluent Transmission Main to the Aliso Creek Ocean Outfall and 0.4 MGD or 430 acre-feet per year of effluent is treated to a secondary level followed by screening and disinfection and is sent to the recycled water distribution system. ETWD has applied for grants under Prop.50 Chapter 8 to construct a 5.0 MGD Advanced Wastewater Treatment Facility for production and distribution of recycled water at the plant. It is contemplated that the tertiary effluent would be sold to IRWD, used within the ETWD service area and sold to MNWD for seasonal use. Table 30 shows the projected secondary effluent discharge from WRP if the requested grant funding does not materialize.
Table 30 Disposal of Wastewater (non-recycled) AF Year
Method of Disposal
Treatment Level 2005 2010 2015 2020 2025 2030
Ocean Discharge Secondary 5,225 5,125 5,225 5,325 5,425 5,625 Total 5,225 5,125 5,225 5,325 5,425 5,625 Table 31 below illustrates the uses for recycled water in ETWD. The usage is limited to landscape irrigation and in-plant uses at WRP, designated in the Table as industrial. The treatment level is secondary treatment followed by further screening and disinfection. A potential recycled water project would increase landscape use from 300 to 500 AFY and convert treatment level to tertiary. The project would generate an annual yield of 4,300 acre-feet. The balance of the project yield will be sold to Irvine Ranch Water District and Moulton Niguel Water District.The project is subject to grant funding. Preliminary grant commitment results should be available in December 2005.
Table 31 Recycled Water Uses - Actual and Potential (AFY)
User type Treatment Level 2005 2010 2015 2020 2025 2030
Agriculture
Landscape Secondary, Disinfected and Screened 300 500 500 500 500 500
Wildlife Habitat
Wetlands
Industrial Secondary, Disinfected and Screened 75 75 75 75 75 75
Groundwater Recharge

El Toro Water District - Urban Water Management Plan Update December 2005
______________________________________________________________________________ Ergun Bakall Consulting Civil Engineer El Toro Water District
59
5.3 Barriers to Expansion of Recycled Water Uses Barriers to expanding recycling water systems vary depending on the agencies unique constraints. The ability to serve end users must take into account the size of end users, the type of water use, proximity to existing recycled water systems, and willingness to use recycled water. An underlying theme limiting expansion of the recycled water systems in ETWD’s service area is the significant capital costs. As expansion of existing recycled water systems continues, the cost tends to increase for each new connection as most of the recycled water systems already serve those end users where capital and operation and maintenance costs are the lowest. The area within the District is built out, thus any expansion of the recycled water distribution system would result in extensive work beneath existing roadways. The District’s recycled water master plan study indicates future potential recycled water demand of up to 2,500 AFY and the extensive cost associated with expansion of the recycled water system beyond its current size. As mentioned in Section 5.2 above ETWD is considering building a regional facility to produce recycled water with the intent of distributing this water within its own service area as well as selling recycled water to other agencies that have unmet demands.

El Toro Water District - Urban Water Management Plan Update December 2005
______________________________________________________________________________ Ergun Bakall Consulting Civil Engineer El Toro Water District
60
6.0 WATER QUALITY IMPACTS ON RELIABILITY ETWD obtains all of its water supply through MWDOC, from MWD. MWD has two primary sources of water, the State Water Project (SWP) and the Colorado River Aqueduct (CRA). For most of Orange County, imported water is served as a blend of both sources with the proportions of the blend dependent upon the year to year availability of CRA and SWP water. Colorado River water tends to be higher in Total Dissolved Solids (TDS) and lower in dissolved organics. State Project water usually has a lower TDS but higher organic material, which can lead to formation of disinfection byproducts (DBPs). MWD recognizes the impacts of water quality on its member agencies and has embraced water quality planning in its Integrated Resources Plan (IRP) and monitoring efforts to address water quality issues. Planning efforts have identified management strategies that allow flexibility in operations to improve water quality and source protection while maintaining reliability. MWD water quality staff conducts both required monitoring and monitoring for constituents of concern.
6.1 MWD Water Quality Issues
6.1.1 Total Dissolved Solids Management High TDS levels in imported water delivered by MWD water leads to increased TDS levels in wastewater, resulting in reduced potential for recycled water usage. In many areas recycled water with high TDS content does not meet Regional Water Quality Control Board (RWQCB) standards. To manage TDS in imported water deliveries MWD has established an operational policy. The objective is to deliver imported water to each MWD member agency at a TDS of 500 mg/l or less whenever feasible.
Colorado River Aqueduct CRA water has high TDS levels, averaging 650 mg/L during normal water years. TDS levels are dependent upon precipitation in the Colorado River Basin. During drought years salinity levels increase and during years with above normal precipitation salinity levels decline as naturally occurring salt concentrations decline. In times of extreme droughts, salinity levels could exceed 900 mg/L. A long term salinity management strategy is in place at the state and federal level for the Colorado River Basin. Funds are appropriated annually to help fund salinity mitigation and reduction projects throughout the watershed.
State Water Project SWP TDS levels are significantly lower than CRA water, averaging 250 mg/L for water delivered via the East Branch of the SWP and 325 mg/L for the West Branch deliveries. West Branch deliveries have higher TDS levels as a result of salt loading in local streams, operational issues, and evaporation losses at Pyramid and Castaic Lakes. TDS levels and available supply vary based on hydrologic conditions in the Sacramento-San Joaquin watersheds, introduction of saline non project waters by upstream parties, as well as saline intrusion in the Sacramento San Joaquin Bay Delta. Variations of TDS levels over short periods of time are attributed to seasonal and tidal flow patterns presenting a unique challenge in trying to achieve the 500 mg/L TDS objective. During periods when TDS levels are high at the SWP intake facilities and in the Colorado River it may not be possible to meet MWD salinity objectives and maintain water

El Toro Water District - Urban Water Management Plan Update December 2005
______________________________________________________________________________ Ergun Bakall Consulting Civil Engineer El Toro Water District
61
supply reliability. The MWD Board has adopted a statement of needs “to meet 500 mg/L salinity-by-blending objective in a cost-effective manner while minimizing resource losses and ensuring the viability of recycling and groundwater management programs.”
Management Actions MWD has taken numerous actions to reduce TDS concentrations in its water supplies. For more detailed discussion of the management actions please refer to the MWDOC UWMP.
6.1.2 Perchlorate Management Perchlorate has been detected at low levels in the CRA water supply, but not in the SWP water supply. An exceedance level for perchlorate has not been adopted at this time by DHS. However, DHS has adopted a notification level of 6 µg/L, requiring agencies to inform their governing bodies. Notification of customers and the potential health risks is also recommended. DHS recommends non-utilization of sources with perchlorate levels greater than 60 micro-grams per liter (µg/L). Perchlorate primarily interferes with the production of hormones for normal growth and development in the thyroid gland. Further research on the health effects of perchlorate is pending.
The MWD began monitoring for perchlorate in June 1997 after it was detected in the Colorado River and the Lake Mead outlet at Hoover Dam. The sampling process was able to isolate the source to the Las Vegas Wash and its potential source in Henderson, Nevada. A quarterly monitoring program for Lake Mead was initiated in August 1997, followed by monthly monitoring of the CRA. The Nevada Department of Environmental Protection manages a remediation project in Henderson area. Since inception the amount of perchlorate entering the Colorado River has been reduced from 900 pounds per day in 1997 to less than 150 pounds per day as of December 2004.
Management Actions In 2002, MWD adopted a Perchlorate Action Plan. Through its Perchlorate Action Plan, MWD has taken a proactive approach toward addressing a potential water quality issue and ensuring minimal or no water supply losses associated with perchlorate. For more detailed discussion of the management actions please refer to the MWDOC UWMP.
6.1.3 Total Organic Carbon and Bromide Management Treatment of SWP water supplies containing high levels of total organic carbon (TOC) and bromide with disinfectants, such as chlorine, creates disinfection byproducts (DBPs) linked to specific cancer types. CRA water does not have high levels of TOC and bromide. TOC and bromide in the Delta region of the SWP are of a significant concern to MWD as concentration levels increase as Delta water is impacted by agricultural drainage and seawater intrusion. In 1998, the USEPA adopted more stringent regulations for DBPs that took effect in 2002. Even more stringent regulations are expected to be proposed in 2005. Management Actions The MWD Board adopted a Statement of Needs for the CALFED Bay-Delta Program in 1999 stating that MWD requires a safe drinking water supply for compliance with existing and future regulatory requirements. The CALFED Program has developed numerous conceptual actions to improve Bay/Delta water, however MWD asked CALFED to adopt water quality improvement

El Toro Water District - Urban Water Management Plan Update December 2005
______________________________________________________________________________ Ergun Bakall Consulting Civil Engineer El Toro Water District
62
milestones. These milestones are necessary to assure that MWD and its member agencies will be able to comply with pending water quality regulations.
The MWD Board has committed to install ozone treatment processes at its two treatment plants that solely treat SWP water to avoid the production of DBPs through chlorination. In addition to the concern of DBPs, some studies have linked negative reproductive and developmental effects to chlorinated water. The other three treatment plants that receive a combination of SWP and CRA water utilize blending to reduce levels of DBPs below regulatory requirements. By 2010 MWD plans on installing ozonation facilities at the remainder of its treatment facilities removing the percentage of SWP water that requires blending.
6.1.4 Other Contaminants of Concern MWD has identified various other contaminants of concern to MWD water supply sources. These include MTBE, Arsenic, Uranium as well as emerging contaminants. For detailed discussion of these please refer to MWDOC UWMP.
6.1.5 Water Quality Protection Programs MWD participates in multiple programs to improve water quality supplies. These programs include:
Watershed Sanitary Surveys, Source Water Assessment, support of DWR policies and programs improving the quality of deliveries to MWD, support of the Sacramento River Watershed Program, water quality exchange partnerships and implementation of additional security measures.
6.1.6 Imported Water Quality Impacts on Supply Reliability Through management strategies and in coordination with its member agencies, MWD is able provide member agencies supply options that allow local agencies to meet regulatory standards. Currently known and foreseeable water quality issues are already incorporated into existing management strategies and the reliability of MWD supplies for the next 25 years. However, unforeseeable water quality issues could potentially impact MWD supply reliability

El Toro Water District - Urban Water Management Plan Update December 2005
______________________________________________________________________________ Ergun Bakall Consulting Civil Engineer El Toro Water District
63
7.0 WATER SERVICE RELIABILITY Water Code Section 10635 (a) requires every urban water supplier to include, as part of its urban water management plan, an assessment of the reliability of its water service to its customers during normal, dry, and multiple dry water years. This water supply and demand assessment shall compare the total water supply sources available to the water supplier with the total projected water use over the next 20 years, in five-year increments, for a normal water year, a single dry water year, and multiple dry water years. Accordingly the water service reliability assessment was prepared based upon the information compiled pursuant to Section 10631, including available data from state, regional or local agency population projections within the service area of ETWD. The ETWD 2005 UWMP Update shall be provided to the Cities of Aliso Viejo, Mission Viejo, Laguna Hills, Laguna Woods and Lake Forest as well as the County of Orange upon its completion and adoption and no later than 60 days after the submission to the Department of Water Resources. Projected normal water supply to projected normal water use is compared in the following Table 32 thorough Table 34 below. ETWD has entitlements and/or written contracts to receive imported (potable) water from MWD via the regional distribution system located in Orange County. Although pipeline capacity rights do not guarantee the availability of water, per se, they do guarantee the ability to convey water when it is available to the MWD distribution system. All imported water supplies assumed in this section are available to the District from existing water transmission facilities.
Table 32 Projected Normal Water Supply - AF Year
(from Table 7) 2010 2015 2020 2025 2030 Supply 11,559 11,728 11,898 12,068 12,220 % of year 2005 101% 102% 104% 105% 107%
Table 33 Projected Normal Water Demand - AF Year
(from table 8) 2010 2015 2020 2025 2030 - opt Demand 11,559 11,728 11,898 12,068 12,220
% of year 2005 101% 102% 104% 105% 107%

El Toro Water District - Urban Water Management Plan Update December 2005
______________________________________________________________________________ Ergun Bakall Consulting Civil Engineer El Toro Water District
64
Table 34 Projected Supply and Demand Comparison - AF Year
2010 2015 2020 2025 2030
Supply totals 11,559 11,728 11,898 12,068 12,220
Demand totals 11,559 11,728 11,898 12,068 12,220
Difference 0 0 0 0 0 Difference as % of Supply 0.0% 0.0% 0.0% 0.0% 0.0%
Difference as % of Demand 0.0% 0.0% 0.0% 0.0% 0.0%
Projected single-dry year water supply to projected single-dry year water use is compared in the following Table 35 thorough Table 37.
Table 35 Projected single dry year Water Supply - AF Year
(from Table 7) 2010 2015 2020 2025 2030 Local Supply 575 575 575 575 575 Imported Supply 11,625 11,804 11,984 12,163 12,323 Supply Totals 12,200 12,379 12,559 12,738 12,898 % of projected normal 105.5% 105.6% 105.6% 105.6% 105.5%
Table 36 Projected single dry year Water Demand - AF Year
2010 2015 2020 2025 2030
Demand 12,200 12,379 12,559 12,738 12,898
% of projected normal 105.5% 105.6% 105.6% 105.6% 105.5%
Table 37 Projected single dry year Supply and Demand Comparison - AF Year
2010 2015 2020 2025 2030 Supply totals 12,200 12,379 12,559 12,738 12,898 Demand totals 12,200 12,379 12,559 12,738 12,898 Difference 0 0 0 0 0 Difference as % of Supply 0.0% 0.0% 0.0% 0.0% 0.0% Difference as % of Demand 0.0% 0.0% 0.0% 0.0% 0.0%

El Toro Water District - Urban Water Management Plan Update December 2005
______________________________________________________________________________ Ergun Bakall Consulting Civil Engineer El Toro Water District
65
Projected multiple-dry year water supplies to projected multiple-dry year water use are compared in the following Table 38 thorough Table 52 for each 5-year period during the next 25-year period:
Table 38 Projected Supply during Multiple Dry year period Ending in 2010 – AF Year
Supply 2008 2009 2010 Normal Local Supply 375 487 575 Imported Supply 10,995 10,975 10,984 Supply Totals 11,370 11,462 11,559 Multiple Dry Year Local Supply 375 487 575 Imported Supply 11,757 11,399 11,625 Supply Totals 12,132 11,886 12,200 % of projected normal 106.7% 103.7% 105.5%
Table 39 Projected demand multiple dry year period ending in 2010 – AF Year
Demand 2008 2009 2010 Normal 11,370 11,462 11,559 Multiple Dry Year 12,132 11,886 12,200 % of projected normal 106.7% 103.7% 105.5%
Table 40 Projected Supply and Demand Comparison during multiple dry year period
Ending in 2010 –AFY 2008 2009 2010 Supply totals 12,132 11,886 12,200 Demand totals 12,132 11,886 12,200 Difference 0 0 0 Difference as % of Supply 0.0% 0.0% 0.0% Difference as % of Demand 0.0% 0.0% 0.0%

El Toro Water District - Urban Water Management Plan Update December 2005
______________________________________________________________________________ Ergun Bakall Consulting Civil Engineer El Toro Water District
66
Table 41
Table 41 Projected supply during multiple dry year period ending in 2015 – AFY
Supply 2013 2014 2015 Normal Local Supply 575 575 575 Imported Supply 11.086 11,119 11,153 Supply Totals 11,661 11,694 11,728 Multiple Dry Year Local Supply 575 575 575 Imported Supply 11,867 11,552 11,804 Supply Totals 12,442 12,127 12,379 % of projected normal 106.7% 103.7% 105.5%
Table 42 Projected demand multiple dry year period ending in 2015 – AFY
Demand 2013 2014 2015 Normal 11,661 11,694 11,728 Multiple Dry Year 12,442 12,127 12,379 % of projected normal 106.7% 103.7% 105.5%
Table 43 Projected Supply and Demand Comparison during multiple dry year period
ending in 2015- AFY 2013 2014 2015 Supply totals 12,442 12,127 12,379 Demand totals 12,442 12,127 12,379 Difference 0 0 0 Difference as % of Supply 0.0% 0.0% 0.0% Difference as % of Demand 0.0% 0.0% 0.0%

El Toro Water District - Urban Water Management Plan Update December 2005
______________________________________________________________________________ Ergun Bakall Consulting Civil Engineer El Toro Water District
67
Table 44 Projected supply during multiple dry year period ending in 2020 - AFY
Supply 2018 2019 2020 Normal Local Supply 575 575 575 Imported Supply 11,255 11,289 11,323 Supply Totals 11,830 11,864 11,898 Multiple Dry Year Local Supply 575 575 575 Imported Supply 12,048 11,728 11,984 Supply Totals 12,623 12,303 12,559 % of projected normal 106.7% 103.7% 105.6%
Table 45 Projected demand multiple dry year period ending in 2020 - AFY
Demand 2018 2019 2020 Normal 11,830 11,864 11,898
Multiple Dry Year 12,623 12,303 12,559 % of projected normal 106.7% 103.7% 105.5%
Table 46 Projected Supply and Demand Comparison during multiple dry year period
ending in 2020- AFY 2018 2019 2020 Supply totals 12,623 12,303 12,559 Demand totals 12,623 12,303 12,559 Difference 0 0 0 Difference as % of Supply 0.0% 0.0% 0.0% Difference as % of Demand 0.0% 0.0% 0.0%
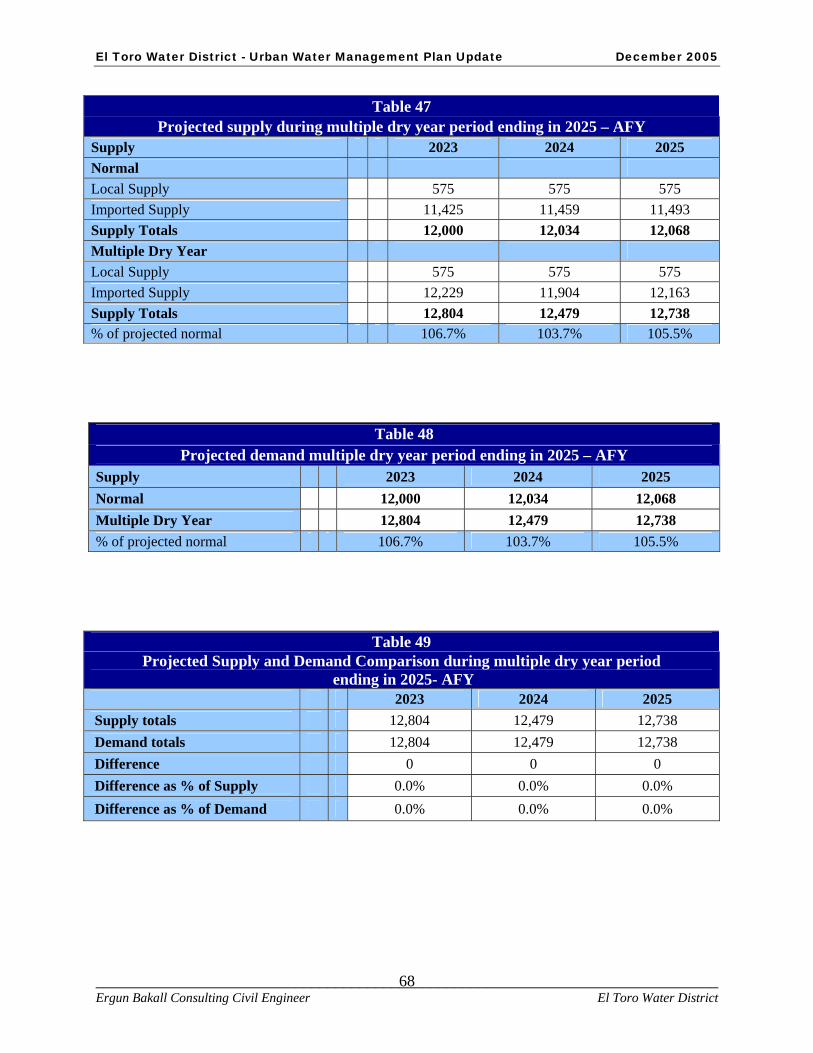
El Toro Water District - Urban Water Management Plan Update December 2005
______________________________________________________________________________ Ergun Bakall Consulting Civil Engineer El Toro Water District
68
Table 47 Projected supply during multiple dry year period ending in 2025 – AFY
Supply 2023 2024 2025 Normal Local Supply 575 575 575 Imported Supply 11,425 11,459 11,493 Supply Totals 12,000 12,034 12,068 Multiple Dry Year Local Supply 575 575 575 Imported Supply 12,229 11,904 12,163 Supply Totals 12,804 12,479 12,738 % of projected normal 106.7% 103.7% 105.5%
Table 48 Projected demand multiple dry year period ending in 2025 – AFY
Supply 2023 2024 2025 Normal 12,000 12,034 12,068 Multiple Dry Year 12,804 12,479 12,738 % of projected normal 106.7% 103.7% 105.5%
Table 49 Projected Supply and Demand Comparison during multiple dry year period
ending in 2025- AFY 2023 2024 2025 Supply totals 12,804 12,479 12,738 Demand totals 12,804 12,479 12,738 Difference 0 0 0 Difference as % of Supply 0.0% 0.0% 0.0% Difference as % of Demand 0.0% 0.0% 0.0%

El Toro Water District - Urban Water Management Plan Update December 2005
______________________________________________________________________________ Ergun Bakall Consulting Civil Engineer El Toro Water District
69
Table 50 Projected supply during multiple dry year period ending in 2030 - AFY
Supply 2028 2029 2030 Normal Local Supply 575 575 575 Imported Supply 11,595 11,629 11,645 Supply Totals 12,170 12,204 12,220 Multiple Dry Year Local Supply 575 575 575 Imported Supply 12,410 12,081 12,323 Supply Totals 12,985 12,656 12,898 % of projected normal 106.7% 103.7% 105.5%
Table 51 Projected demand multiple dry year period ending in 2030 - AFY
Supply 2028 2029 2030 Normal 12,170 12,204 12,220 Multiple Dry Year 12,985 12,656 12,898 % of projected normal 106.7% 103.7% 105.5%
Table 52 Projected Supply and Demand Comparison during multiple dry year period
ending in 2030- AFY 2028 2029 2030 Supply totals 12,985 12,656 12,898 Demand totals 12,985 12,656 12,898 Difference 0 0 0 Difference as % of Supply 0.0% 0.0% 0.0% Difference as % of Demand 0.0% 0.0% 0.0%

El Toro Water District - Urban Water Management Plan Update December 2005
______________________________________________________________________________ Ergun Bakall Consulting Civil Engineer El Toro Water District
70
8.0 UWMP ADOPTION AND IMPLEMENTATION
8.1 UWMP Adoption Process ETWD consulted with and obtained comments from the five cities to which it provides water service as well the County Planning Department prior to and after the release of the Draft UWMP Update. The Draft plan was made available for public review and inspection at the offices of the District as well as the local Public Libraries. The draft UWMP was also made available on the ETWD website at www.etwd.com. A Public hearing was held at the District Offices by the Board of Directors of the District on November 22, 2005. Prior to the hearing, notice of the time and place was published pursuant to Section 6066 of the Government Code. The comments received from the Public Hearing were addressed as appropriate in the Plan. (See Appendix E) The Board of Directors adopted the Urban Water Management Plan Update 2005 during a regularly scheduled meeting on November 22, 2005. The Plan is available for public review at the District Offices.
8.2 Review the Implementation of Water Conservation and Water Recycling Programs in 2000 Plan
As required by California Water Code, implementation of the Water Conservation and Water Recycling Programs to date is summarized and compared to those as planned in its 2000 Urban Water Management Plan (UWMP).
8.2.1 Comparison of 2000 Planned Water Conservation Programs with 2005 Actual Programs As a signatory to the Memorandum of Understanding regarding urban water use efficiency, ETWD is committed to the implementation of BMP based water use efficiency programs. For specific achievements that ETWD accomplished in conservation program, please see the BMP Activity Reports contained in Appendix B of this report.
8.1.2 Comparison of 2000 projected Recycled Water Use with 2005 Actual Use The current recycled water use projection for 2005 for the ETWD service area is 174 acre feet less than previously forecasted in the 2000 UWMP. Current 2005 forecasts indicate that approximately 430 acre-feet of recycled water will be consumed by these user types, while the 2000 UWMP forecasted 604 acre-feet of recycled water use in 2005.

El Toro Water District - Urban Water Management Plan Update December 2005
___________________________________________________________________________________ Ergun Bakall Consulting Civil Engineer El Toro Water District
SECTION 9
APPENDICES

El Toro Water District - Urban Water Management Plan Update December 2005
___________________________________________________________________________________ Ergun Bakall Consulting Civil Engineer El Toro Water District
9.1 Appendix A: List of References 1- “Guidebook to Assist Water Suppliers in the Preparation of a 2005 Urban Water Management Plan” by California Department of Water Resources 2-Metropolitan Water District of Southern California – Regional Urban Water Management Plan – December – 2005 3- Municipal Water District of Orange County - Regional Urban Water Management Plan December – 2005 4- El Toro Water District – Water and Sewer Master Plan – December – 2004 5- NOAA Climate Data – Official Web Site

El Toro Water District - Urban Water Management Plan Update December 2005
___________________________________________________________________________________ Ergun Bakall Consulting Civil Engineer El Toro Water District
9.2 Appendix B: BMP Activity Reports
A. Number of RESIDENTIAL Water Use Surveys by Year
Year No. Single- Family Surveys
No. Multi- Family Surveys
1991 1992 1993 1994 0 0 1995 0 0 1996 0 0 1997 269 0 1998 281 0 Total 550 0
B. Number of LANDSCAPE Surveys Completed by Year
Year Surveys
Receiving Follow-up
Surveys Not Receiving Follow-up
1991 1992 1993 1994 0 0 1995 0 0 1996 0 0 1997 0 0 1998 0 0 Total 0 0
C. Number of CII Surveys Completed by Year
Year Commercial Industrial Institutional Follow-Up No Follow-Up Follow-Up No Follow-Up Follow-Up No Follow-Up
1991 1992 1993 1994 0 0 0 0 0 0 1995 0 0 0 0 0 0 1996 2 0 0 0 0 4 1997 0 0 0 0 0 0 1998 0 0 0 0 0 0 Total 2 0 0 0 0 4

El Toro Water District - Urban Water Management Plan Update December 2005
___________________________________________________________________________________ Ergun Bakall Consulting Civil Engineer El Toro Water District
D. Estimated WATER SAVINGS (AF/Yr) from CII Programs by Year Year Site Verified Site Not Verified 1991 1992 1993 1994 0 0 1995 0 0 1996 0 14.7 1997 0 0 1998 0 0 Total 0 14 E. (Part I) Historical CII Ultra-Low-Flush Toilet Installations by CII Sector
by Year
Year Auto Food Health Hotel Manuf'g Membership Multi-Use
1991 1992 1993 1994 0 0 0 0 0 0 0 1995 0 0 0 0 0 0 0 1996 0 0 0 0 0 0 0 1997 0 0 0 0 0 0 0 1998 0 0 0 0 0 0 0 Total 0 0 0 0 0 0 0
E. (Part II) Historical CII Ultra-Low-Flush Toilet Installations by CII Sector
by Year Year Office Religious Restaurant Retail School Wholesale Unknown 1991 1992 1993 1994 0 0 0 0 0 0 0 1995 0 0 0 0 0 0 0 1996 0 0 0 0 0 0 0 1997 0 0 0 0 0 0 0 1998 0 0 0 0 0 0 0 Total 0 0 0 0 0 0 0

El Toro Water District - Urban Water Management Plan Update December 2005
___________________________________________________________________________________ Ergun Bakall Consulting Civil Engineer El Toro Water District
F. Number of Residential ULFT Rebates / Installations by Year:
Year Single-Family Multi-Family 1991 1992 1993 1994 273 3 1995 562 331 1996 483 28 1997 391 287 1998 310 579 Total 2019 1228

El Toro Water District - Urban Water Management Plan Update December 2005
___________________________________________________________________________________ Ergun Bakall Consulting Civil Engineer El Toro Water District
9.3 Appendix C: BMP Coverage Reports BMP 01 Coverage: Water Survey Programs for Single-Family and Multi-Family Residential Customers Reporting Unit: El Toro Water District MOU Exhibit 1 Coverage Requirement Agency indicated "at least as effective as" implementation during report period? No
A Reporting Unit (RU) must meet three conditions to satisfy strict compliance for BMP 1. Condition 1: Adopt survey targeting and marketing strategy on time Condition 2: Offer surveys to 20% of SF accounts and 20% of MF units during report period Condition 3: Be on track to survey 15% of SF accounts and 15% of MF units within 10 years of implementation start date.
Test for Condition 1
Latest El Toro Water District to Implement Targeting/Marketing Program:
1999
Single-Family
Multi-Family
Year El Toro Water District Reported Implementing Targeting/Marketing Program: 1997
El Toro Water District Met Targeting/Marketing Coverage Requirement: YES NO
Test for Condition 2
Single-
Family Multi-Family
Latest Year Survey Program to Start: 1998 Residential Survey
Offers (%)
Reporting Period: 03-04 Survey Offers > 20% NO NO

El Toro Water District - Urban Water Management Plan Update December 2005
___________________________________________________________________________________ Ergun Bakall Consulting Civil Engineer El Toro Water District
Test for Condition 3
Completed Residential Surveys
Single Family Multi-Family Total Completed Surveys through 2004 633 Credit for Surveys Completed Prior to Implementation of Reporting Database 550
Total + Credit 1,183
Residential Accounts in Base Year 5,675 2,610 El Toro Water District Survey Coverage as % of Base Year Residential Accounts 20.85%
Coverage Requirement by Year 7 of Implementation per Exhibit 1 7.90% 7.90%
El Toro Water District on Schedule to Meet 10-Year Coverage Requirement YES NO

El Toro Water District - Urban Water Management Plan Update December 2005
___________________________________________________________________________________ Ergun Bakall Consulting Civil Engineer El Toro Water District
BMP 02 Coverage: Residential Plumbing Retrofit Reporting Unit: El Toro Water District MOU Exhibit 1 Coverage Requirement No exemption request filed Agency indicated "at least as effective as" implementation during report period?
No
An agency must meet one of three conditions to satisfy strict compliance for BMP 2.
Condition 1: The agency has demonstrated that 75% of SF accounts and 75% of MF units constructed prior to 1992 are fitted with low-flow showerheads. Condition 2: An enforceable ordinance requiring the replacement of high-flow showerheads and other water use fixtures with their low-flow counterparts is in place for the agency's service area. Condition 3: The agency has distributed or directly installed low-flow showerheads and other low-flow plumbing devices to not less than 10% of single-family accounts and 10% of multi-family units constructed prior to 1992 during the reporting period.
Test for Condition 1
Single-Family Multi-Family
Report Year Report Period Reported Saturation Saturation > 75%? Reported
Saturation Saturation >
75%? 1999 99-00 60.00% NO 65.00% NO 2000 99-00 60.00% NO 65.00% NO 2001 01-02 68.00% NO 60.00% NO 2002 01-02 68.00% NO 60.00% NO 2003 03-04 91.70% YES 79.90% YES 2004 03-04 100.00% YES 86.60% YES

El Toro Water District - Urban Water Management Plan Update December 2005
___________________________________________________________________________________ Ergun Bakall Consulting Civil Engineer El Toro Water District
Test for Condition 2
Report Year Report Period El Toro Water District has ordinance requiring showerhead retrofit?
1999 99-00 NO 2000 99-00 NO 2001 01-02 NO 2002 01-02 NO 2003 03-04 NO 2004 03-04 NO
Test for Condition 3
Reporting Period: 03-04
1992 SF Accounts
Num. Showerheads Distributed to SF Accounts Single-Family Coverage
Ratio SF Coverage Ratio >
10% 7,664 700 9.1% NO
1992 MF Accounts
Num. Showerheads Distributed to MF Accounts Multi-Family Coverage
Ratio MF Coverage Ratio >
10% 16,879 NO

El Toro Water District - Urban Water Management Plan Update December 2005
___________________________________________________________________________________ Ergun Bakall Consulting Civil Engineer El Toro Water District
BMP 03 Coverage: System Water Audits, Leak Detection and Repair Reporting Unit: El Toro Water District MOU Exhibit 1 Coverage Requirement No exemption request filed Agency indicated "at least as effective as" implementation during report period?
No
An agency must meet one of two conditions to be in compliance with BMP 3:
Condition 1: Perform a prescreening audit. If the result is equal to or greater than 0.9 nothing more needs be done. Condition 2: Perform a prescreening audit. If the result is less than 0.9, perform a full audit in accordance with AWWA's Manual of Water Supply Practices, Water Audits, and Leak Detection.
Test for Conditions 1 and 2
Report Year Report
Period Pre-Screen Completed
Pre-Screen Result
Full Audit Indicated
Full Audit Completed
1999 99-00 NO NO 2000 99-00 NO NO 2001 01-02 NO NO 2002 01-02 NO NO 2003 03-04 NO NO
2004 03-04 YES 97.6% No NO

El Toro Water District - Urban Water Management Plan Update December 2005
___________________________________________________________________________________ Ergun Bakall Consulting Civil Engineer El Toro Water District
BMP 04 Coverage: Metering with Commodity Rates for all New Connections and Retrofit of Existing Reporting Unit: El Toro Water District MOU Exhibit 1 Coverage Requirement Agency indicated "at least as effective as" implementation during report period? No
An agency must be on track to retrofit 100% of its unmetered accounts within 10 years to be in compliance with BMP 4.
Test for Compliance
Total Meter Retrofits Reported through 2004 No. of Unmetered Accounts in Base Year Meter Retrofit Coverage as % of Base Year Unmetered Accounts Coverage Requirement by Year 6 of Implementation per Exhibit 1 42.0% RU on Schedule to meet 10 Year Coverage Requirement YES

El Toro Water District - Urban Water Management Plan Update December 2005
___________________________________________________________________________________ Ergun Bakall Consulting Civil Engineer El Toro Water District
BMP 05 Coverage: Large Landscape Conservation Programs and Incentives Reporting Unit: El Toro Water District MOU Exhibit 1 Coverage Requirement No exemption request filed Agency indicated "at least as effective as" implementation during report period?
No
An agency must meet three conditions to comply with BMP 5.
Condition 1: Develop water budgets for 90% of its dedicated landscape meter accounts within four years of the date implementation is to start. Condition 2: (a) Offer landscape surveys to at least 20% of its CII accounts with mixed use meters each report cycle and be on track to survey at least 15% of its CII accounts with mixed use meters within 10 years of the date implementation is to start OR (b) Implement a dedicated landscape meter retrofit program for CII accounts with mixed use meters or assign landscape budgets to mixed use meters. Condition 3: Implement and maintain customer incentive program(s) for irrigation equipment retrofits.
Test for Condition 1
Year Report Period
BMP 5 Implementation
Year No. of Irrigation Meter Accounts
No. of Irrigation Accounts with
Budgets Budget
Coverage Ratio
90% Coverage Met by Year 4
1999 99-00 1 871 NA 2000 99-00 2 871 NA 2001 01-02 3 878 NA 2002 01-02 4 878 No 2003 03-04 5 852 82 9.6% No 2004 03-04 6 838 79 9.4% No
Test for Condition 2a (survey offers)
Select Reporting Period: 03-04 Large Landscape Survey Offers as % of Mixed Use Meter CII Accounts
Survey Offers Equal or Exceed 20% Coverage Requirement NO

El Toro Water District - Urban Water Management Plan Update December 2005
___________________________________________________________________________________ Ergun Bakall Consulting Civil Engineer El Toro Water District
Test for Condition 2a (surveys completed)
Total Completed Landscape Surveys Reported through
Credit for Surveys Completed Prior to Implementation of Reporting Database
Total + Credit CII Accounts in Base Year 788 RU Survey Coverage as a % of Base Year CII Accounts
Coverage Requirement by Year of Implementation per Exhibit 1 6.3%
RU on Schedule to Meet 10 Year Coverage Requirement NO
Test for Condition 2b (mixed use budget or meter retrofit program)
Report Year Report Period BMP 5 Implementation Year Agency has mix-use
budget program No. of mixed-use budgets
1999 99-00 1 NO 2000 99-00 2 YES 2001 01-02 3 NO 2002 01-02 4 NO 2003 03-04 5 YES 1 2004 03-04 6 YES 1
Report Year Report Period BMP 4 Implementation Year No. of mixed use CII accounts
No. of mixed use CII accounts fitted with irrig.
meters 1999 99-00 1 125 1 2000 99-00 2 125 2001 01-02 3 125 2002 01-02 4 125 2003 03-04 5 125 2004 03-04 6 125

El Toro Water District - Urban Water Management Plan Update December 2005
___________________________________________________________________________________ Ergun Bakall Consulting Civil Engineer El Toro Water District
Test for Condition 3
Report Year
Report Period
BMP 5 Implementation Year
RU offers financial incentives?
No. of Loans
Total Amt. Loans
1999 99-00 1 YES 2000 99-00 2 YES 2001 01-02 3 NO 2002 01-02 4 NO 2003 03-04 5 YES 2004 03-04 6 YES Report Year
Report Period No. of Grants Total Amt. Grants No. of
rebates Total Amt. Rebates
1999 99-00 2000 99-00 2001 01-02 2002 01-02 2003 03-04 2004 03-04 1 3,211

El Toro Water District - Urban Water Management Plan Update December 2005
___________________________________________________________________________________ Ergun Bakall Consulting Civil Engineer El Toro Water District
BMP 06 Coverage: High-Efficiency Washing Machine Rebate Programs Reporting Unit: El Toro Water District MOU Exhibit 1 Coverage Requirement No exemption request filed Agency indicated "at least as effective as" implementation during report period?
No
An agency must meet one condition to comply with BMP 6.
Condition 1: Offer a cost-effective financial incentive for high-efficiency washers if one or more energy service providers in service area offer financial incentives for high-efficiency washers.
Test for Condition 1
Year Report
Period BMP 6 Implementation
Year Rebate Offered by
ESP? Rebate Offered by
RU? Rebate Amount
1999 99-00 1 YES NO 110.00 2000 99-00 2 YES NO 110.00 2001 01-02 3 YES NO 2002 01-02 4 YES YES 100.00 2003 03-04 5 YES YES 100.00 2004 03-04 6 YES YES 100.00
Year Report Period
BMP 6 Implementation Year
No. Rebates Awarded Coverage Met?
1999 99-00 1 NO 2000 99-00 2 NO 2001 01-02 3 NO 2002 01-02 4 21 YES 2003 03-04 5 88 YES 2004 03-04 6 108 YES
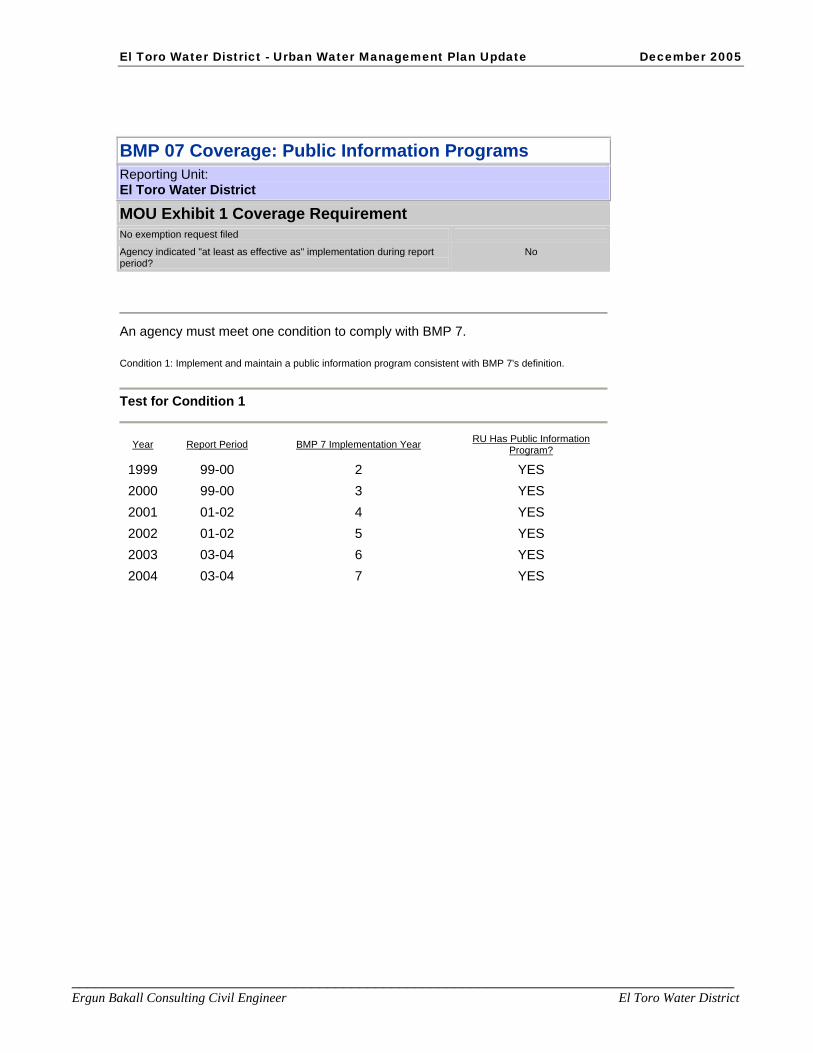
El Toro Water District - Urban Water Management Plan Update December 2005
___________________________________________________________________________________ Ergun Bakall Consulting Civil Engineer El Toro Water District
BMP 07 Coverage: Public Information Programs Reporting Unit: El Toro Water District MOU Exhibit 1 Coverage Requirement No exemption request filed Agency indicated "at least as effective as" implementation during report period?
No
An agency must meet one condition to comply with BMP 7.
Condition 1: Implement and maintain a public information program consistent with BMP 7's definition.
Test for Condition 1
Year Report Period BMP 7 Implementation Year RU Has Public Information
Program? 1999 99-00 2 YES 2000 99-00 3 YES 2001 01-02 4 YES 2002 01-02 5 YES 2003 03-04 6 YES 2004 03-04 7 YES

El Toro Water District - Urban Water Management Plan Update December 2005
___________________________________________________________________________________ Ergun Bakall Consulting Civil Engineer El Toro Water District
BMP 08 Coverage: School Education Programs Reporting Unit: El Toro Water District MOU Exhibit 1 Coverage Requirement No exemption request filed Agency indicated "at least as effective as" implementation during report period?
No
An agency must meet one condition to comply with BMP 8.
Condition 1: Implement and maintain a school education program consistent with BMP 8's definition.
Test for Condition 1
Year Report Period BMP 8 Implementation Year RU Has School Education
Program? 1999 99-00 2 YES 2000 99-00 3 YES 2001 01-02 4 YES 2002 01-02 5 YES 2003 03-04 6 YES 2004 03-04 7 YES

El Toro Water District - Urban Water Management Plan Update December 2005
___________________________________________________________________________________ Ergun Bakall Consulting Civil Engineer El Toro Water District
BMP 09 Coverage: Conservation Programs for CII Accounts Reporting Unit: El Toro Water District MOU Exhibit 1 Coverage Requirement No exemption request filed Agency indicated "at least as effective as" implementation during report period? No
An agency must meet three conditions to comply with BMP 9.
Condition 1: Agency has identified and ranked by use commercial, industrial, and institutional accounts. Condition 2(a): Agency is on track to survey 10% of commercial accounts, 10% of industrial accounts, and 10% of institutional accounts within 10 years of date implementation to commence. OR Condition 2(b): Agency is on track to reduce CII water use by an amount equal to 10% of baseline use within 10 years of date implementation to commence. OR Condition 2(c): Agency is on track to meet the combined target as described in Exhibit 1 BMP 9 documentation.
Test for Condition 1
Year Report Period BMP 9 Implementation Year Ranked Com.
Use Ranked Ind.
Use Ranked Inst.
Use 1999 99-00 1 YES NO YES 2000 99-00 2 YES NO YES 2001 01-02 3 YES NO YES 2002 01-02 4 YES NO YES 2003 03-04 5 YES NO YES 2004 03-04 6 YES NO YES

El Toro Water District - Urban Water Management Plan Update December 2005
___________________________________________________________________________________ Ergun Bakall Consulting Civil Engineer El Toro Water District
Test for Condition 2a
Commercial Industrial Institutional Total Completed Surveys Reported through 2004
Credit for Surveys Completed Prior to Implementation of Reporting Databases
2 2
Total + Credit 2 2 CII Accounts in Base Year 768 20 RU Survey Coverage as % of Base Year CII Accounts 0.3% 10.0%
Coverage Requirement by Year 6 of Implementation per Exhibit 1 4.2% 4.2% 4.2%
RU on Schedule to Meet 10 Year Coverage Requirement NO NO YES
Test for Condition 2a
Year Report Period
BMP 9 Implementation
Year Performance
Target Savings (AF/yr)
Performance Target Savings
Coverage
Performance Target Savings
Coverage Requirement
Coverage Requirement
Met
1999 99-00 1 0.5% NO 2000 99-00 2 2 0.2% 1.0% NO 2001 01-02 3 1.7% NO 2002 01-02 4 2.4% NO 2003 03-04 5 2 0.2% 3.3% NO 2004 03-04 6 4 0.3% 4.2% NO
Test for Condition 2c
Total BMP 9 Surveys + Credit 4 BMP 9 Survey Coverage 0.5% BMP 9 Performance Target Coverage 0.3% BMP 9 Survey + Performance Target Coverage 0.8%
Combined Coverage Equals or Exceeds Coverage Requirement?
NO

El Toro Water District - Urban Water Management Plan Update December 2005
___________________________________________________________________________________ Ergun Bakall Consulting Civil Engineer El Toro Water District
BMP 11 Coverage: Conservation Pricing Reporting Unit: El Toro Water District MOU Exhibit 1 Coverage Requirement No exemption request filed Agency indicated "at least as effective as" implementation during report period?
No
An agency must meet one condition to comply with BMP 11.
Agency shall maintain rate structure consistent with BMP 11's definition of conservation pricing. Implementation methods shall be at least as effective as eliminating non-conserving pricing and adopting conserving pricing. For signatories supplying both water and sewer service, this BMP applies to pricing of both water and sewer service. Signatories that supply water but not sewer service shall make good faith efforts to work with sewer agencies so that those sewer agencies adopt conservation pricing for sewer service.
a) Non-conserving pricing provides no incentives to customers to reduce use. Such pricing is characterized by one or more of the following components: rates in which the unit price decreases as the quantity used increases (declining block rates);rates that involve charging customers a fixed amount per billing cycle regardless of the quantity used; pricing in which the typical bill is determined by high fixed charges and low commodity charges.
b) Conservation pricing provides incentives to customers to reduce average or peak use, or both. Such pricing includes: rates designed to recover the cost of providing service; and billing for water and sewer service based on metered water use. Conservation pricing is also characterized by one or more of the following components: rates in which the unit rate is constant regardless of the quantity used (uniform rates) or increases as the quantity used increases (increasing block rates); seasonal rates or excess-use surcharges to reduce peak demands during summer months; rates based upon the longrun marginal cost or the cost of adding the next unit of capacity to the system.
Test for Condition 1
Year Report Period RU Employed Non Conserving Rate
Structure RU Meets BMP 11 Coverage
Requirement 1999 99-00 NO YES 2000 99-00 NO YES 2001 01-02 NO YES 2002 01-02 NO YES 2003 03-04 NO YES 2004 03-04 YES NO

El Toro Water District - Urban Water Management Plan Update December 2005
___________________________________________________________________________________ Ergun Bakall Consulting Civil Engineer El Toro Water District
BMP 12 Coverage: Conservation Coordinator Reporting Unit: El Toro Water District MOU Exhibit 1 Coverage Requirement No exemption request filed Agency indicated "at least as effective as" implementation during report period? No
Agency shall staff and maintain the position of conservation coordinator and provide support staff as necessary.
Test for Compliance
Report Year Report Period Conservation Coordinator Position Staffed? Total Staff on Team (incl.
CC) 1999 99-00 YES 1 2000 99-00 YES 1 2001 01-02 YES 1 2002 01-02 YES 1 2003 03-04 YES 1 2004 03-04 YES 1

El Toro Water District - Urban Water Management Plan Update December 2005
___________________________________________________________________________________ Ergun Bakall Consulting Civil Engineer El Toro Water District
BMP 13 Coverage: Water Waste Prohibition Reporting Unit: El Toro Water District MOU Exhibit 1 Coverage Requirement No exemption request filed Agency indicated "at least as effective as" implementation during report period?
No
An agency must meet one condition to comply with BMP 13.
Implementation methods shall be enacting and enforcing measures prohibiting gutter flooding, single pass cooling systems in new connections, non-recirculating systems in all new conveyer car wash and commercial laundry systems, and non-recycling decorative water fountains.
Test for Condition 1
Agency or service area prohibits:
Year Gutter Flooding
Single-Pass Cooling Systems
Single-Pass Car
Wash Single-Pass
Laundry Single-Pass Fountains Other
RU has ordinance that meets coverage
requirement
1999 yes no no no yes no NO 2000 yes no no no yes no NO 2001 yes no no no yes no NO 2002 yes no no no yes no NO 2003 yes no no no yes no NO 2004 yes no no no yes no NO

El Toro Water District - Urban Water Management Plan Update December 2005
___________________________________________________________________________________ Ergun Bakall Consulting Civil Engineer El Toro Water District
9.4 Appendix D: Cross Reference of ETWD UWMP v. DWR Tables ETWD UWMP Table No. DWR Guideline Table No. Table 1 Coordination with Other Agencies .........................................................................1 Table 2 Population- Current and Projected..........................................................................2 Table 3 Land Uses ...........................................................................................................NA Table 4 Climate....................................................................................................................3 Table 5 Imported and Recycled Water Supply Sources ......................................................4 Table 6 Historical Recycled Water Production ...............................................................NA Table 7 Current and Planned Water Supplies ..................................................................NA Table 8 Future Water Demands .......................................................................................NA Table 9 MWD Multiple-Dry Year Supply Capability and Projected Demands ..............NA Table 10 MWD Single-Dry Year Supply Capability and Projected Demands................NA Table 11 MWD Average Year Supply Capability and Projected Demands....................NA Table 12 Supply Reliability .................................................................................................8 Table 13 Basis of Water Year Data .....................................................................................9 Table 14 Factors Resulting in Inconsistencies in Supply ..................................................22 Table 15 Water Use by Customer Type.............................................................................12 Table 16 Total Water Use ..................................................................................................15 Table 17 Future Water Supply Projects .............................................................................17 Table 18 Opportunities for Desalinated Water ..................................................................18 Table 19 ETWD Demand Projections Supplied to Wholesaler.........................................19 Table 20 Wholesaler Identified & Quantified Existing and Planned Sources of Water....20 Table 21 Water Wholesale Reliability...............................................................................21 Table 22 MWD Water Surplus & Drought Management Plan........................................NA Table 23 Three-Year Estimate of Minimum Water Supply in Multiple-Dry Years..........24 Table 24 ETWD Sustainable Outage Durations ................................................................25 Table 25 ETWD Demand Curtailment Requirements .......................................................25 Table 26 Water Use Prohibitions.......................................................................................23 Table 27 Mandatory Prohibitions ......................................................................................26 Table 28 Penalties and Charges .........................................................................................28 Table 29 Wastewater Collection and Treatment................................................................33 Table 30 Disposal of Wastewater ......................................................................................34 Table 31 Recycled Water Uses ..........................................................................................35 Table 32 Projected Normal Water Supply .........................................................................40 Table 33 Projected Normal Water Demand.......................................................................41 Table 34 Projected Supply and Demand Comparison .......................................................42 Table 35 Projected Single-Dry Year Water Supply...........................................................43 Table 36 Projected Single-Dry Year Water Demand ........................................................44 Table 37 Projected Single-Dry Year Water Supply and Demand Comparison.................45 Table 38 Projected Supply during Multiple-Dry Year Period Ending 2010 .....................46 Table 39 Projected Demand during Multiple-Dry Year Period Ending 2010 ...................47 Table 40 Projected Supply and Demand Comparison during Multiple-Dry Year
Period Ending 2010.............................................................................................48 Table 41 Projected Supply during Multiple-Dry Year Period Ending 2015 .....................49

El Toro Water District - Urban Water Management Plan Update December 2005
___________________________________________________________________________________ Ergun Bakall Consulting Civil Engineer El Toro Water District
Table 42 Projected Demand during Multiple-Dry Year Period Ending 2015 ...................50 Table 43 Projected Supply and Demand Comparison during Multiple-Dry Year Period Ending 2015.............................................................................................51 Table 44 Projected Supply during Multiple-Dry Year Period Ending 2020 .....................52 Table 45 Projected Demand during Multiple-Dry Year Period Ending 2020 ...................53 Table 46 Projected Supply and Demand Comparison during Multiple-Dry Year Period Ending 2020.............................................................................................54 Table 47 Projected Supply during Multiple-Dry Year Period Ending 2025 .....................55 Table 48 Projected Demand during Multiple-Dry Year Period Ending 2025 ...................56 Table 49 Projected Supply and Demand Comparison during Multiple-Dry Year Period Ending 2025.............................................................................................57 Table 50 Projected Supply during Multiple-Dry Year Period Ending 2030 .....................58 Table 51Projected Demand during Multiple-Dry Year Period Ending 2030 ....................59 Table 52 Projected Supply and Demand Comparison during Multiple-Dry Year
Period Ending 2030.............................................................................................60

El Toro Water District - Urban Water Management Plan Update December 2005
___________________________________________________________________________________ Ergun Bakall Consulting Civil Engineer El Toro Water District
9.5 Appendix E: Emergency Water Conservation Ordinance


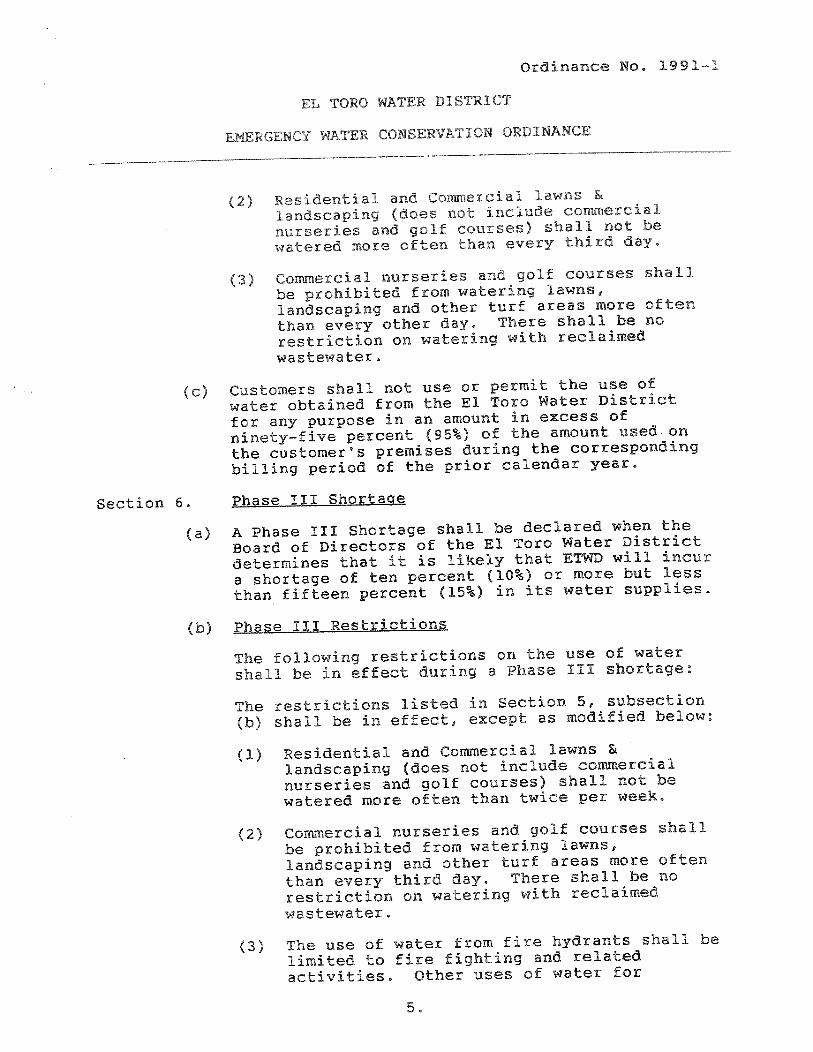


El Toro Water District - Urban Water Management Plan Update December 2005
___________________________________________________________________________________ Ergun Bakall Consulting Civil Engineer El Toro Water District
9.6 Appendix E: Public Hearing Comments and Responses A public hearing was held on November 22, 2005 to receive comments relative to the El Toro Water District Urban Water Management Plan. The District received no comments at the subject public hearing. The District received a letter from the City of Lake Forest with comments regarding the Urban Water Management Plan on November 17, 2005. A copy of said letter follows. The City’s comments have been incorporated into the UWMP.
