el paso county · el paso county. prepared by: f. marie hall institute for rural and community...
TRANSCRIPT
Community Health Assessment
El Paso County Prepared by:
F. Marie Hall Institute for Rural and Community Health Texas Tech University Health Sciences Center, and the Department of Political Science—Angelo State University
Principal Investigator:
Billy U. Philips, Jr., Ph.D., M.P.H.
West Texas AHEC Director: Becky Conditt, M.I.S.
Senior Analyst:
Jim Conditt

Demography and Population
Population El Paso County estimate population 820,790 Population Rank Among Texas’ 254 Counties 6 Population per Square Mile 790.6 Area in Square Miles 1,012.69 Ethnicity % of County White persons 92.8% Black persons 3.6% American Indian/Alaskan 1.0% Asian 1.2% Two + Races 1.2% Hispanic/Latino 81.4% White Not Hispanic 13.7%

Gender % in County Female 51.4% Male 48.6% Age % of County <05 Years 8.1% <18 Years 29.7% 18-64 Years 60.0% 65+ Years 10.3% Source: www.census.gov
While the median age for Texas was 34.00 years in 2010, the El Paso County area had a median age of 31.00 according to the 2010 Census.
Population Gender The gender distribution of an area can provide additional insight into the region's overall distribution in the population by male and female. Of the area's population, 387,876 were male which represents 48.4 percent and 412,771 were female which represents 51.6 percent. This compares to the statewide percentage of 49.6 percent for male and 50.4 percent for female. Special Age Groups and Gender Youth and Older Workers: Other age cohorts may be of special interest for Workforce Development Board's summer youth programs and older worker programs. The El Paso County region has 131,640 persons age 15-24 representing 16.4 percent of the population. This compares with 14.7 percent statewide. For the potential older age cohort, 124,842 persons or 15.6 percent are 55 or over in the El Paso County region based on the 2010 Census. This compares to 20.7 percent statewide. Ages 25-44: If the population cohort 45 and over is higher than the state average, this suggests a stable, mature population comprised of mainly "empty-nesters," retirees and the aged. When the 25-44 age cohort is higher than the state average, this is a healthy economic situation since this group contains the greatest share of the labor force. Decreases over time in this group, especially when similar changes are not occurring statewide, can be an indication that people are moving out of an area they consider to be a poor labor market. In El Paso County the total number in the age groups of 25 to 44, was 166,820 or 20.8 percent. This compares to a statewide percentage of 42.5 percent based on the 2010 Census. Ages 18 and Older: For the population generally considered in the ages to participate in the labor market, the total population who were 18 years and over totaled 18,279,737 in Texas which represented
72.7 percent of the total population. In this study area, the total persons in this age group was 559,834 or 69.9 percent of the total population. Within this age group in Texas the number of males in 2010 who were 18 years and over represented 8,962,031 persons or 35.6 percent of the total population while females age 18 years and over represented 9,317,706 or 37.1 percent. In the El Paso County area, males 18 and over represented 265,171 or 33.1 percent in comparison and females totaled to 294,663 or 36.8 percent. Veteran Status: According to the U.S. Bureau of Census, the area had 453,912 persons in the population age 18 years and older in the year 2000. Of that number, 52,878 or 11.6 percent responded as being a civilian veteran, compared to 11.8 percent statewide. A "civilian veteran" is a person 18 years old or over who has served (even for a short time), but is not now serving, on active duty in the U.S. Army, Navy, Air Force, Marine Corps, or the Coast Guard, or who served in the U.S. Merchant Marine during World War II. People who served in the National Guard or military Reserves are classified as veterans only if they were ever called or ordered to active duty, not counting the 4-6 months for initial training or yearly summer camps. Disability Status: From the 2000 Census, data on Disability Status were derived when respondents reported long-lasting conditions: (a) blindness, deafness, or a severe vision or hearing impairment, (sensory disability) and (b) a condition that substantially limits one or more basic physical activities such as walking, climbing stairs, reaching, lifting, or carrying (physical disability). Disability status was also derived if the individuals in the working age range of 21 to 64 years had a physical, mental, or emotional condition lasting 6 months or more that made it difficult to perform certain activities such as: (a) learning, remembering, or concentrating (mental disability); (b) dressing, bathing, or getting around inside the home (self-care disability); (c) going outside the home alone to shop or visit a doctor's office (going outside the home disability); and (d) working at a job or business (employment disability). It was reported in the 2000 Census that the area had an estimated 189,036 persons residing there between the ages of 5 to 20 years of age with approximately 13,876 or 7.3 percent with a disability. In Texas, the percent with disabilities in this same age bracket was 7.9 percent. In the working age population group - ages 21 to 64 years, the area had approximately 350,492 persons, of which 77,460 were categorized to be in a disability status. This represented 22.1 percent compared to 19.9 percent in the state overall. For those persons in this age group that had a disability, approximately 39,969 or 51.6 percent were employed. For those who had no disability, an estimated 176,925 or 64.8 percent were employed. For the retirement age group of 65 years of age and older, 65,002 persons resided of which 31,209 were disabled. The percent of this age group with a disabled status was 48.0 percent and this compared to 44.8 percent in Texas overall. Ages 65 and Older: For the population who are considered to be at the age of retirement or older - 65 years and older, the total number of persons in Texas was 2,601,886 or 10.3 percent of the total population in 2010. This region had a total of 82,223 or 10.3 percent in this older age group. In the same age group of 65 years and over, males in Texas represented 1,135,664 or 4.5 percent of the total population and females totaled to 1,466,222 or 5.8 percent, while in this study area, males totaled to
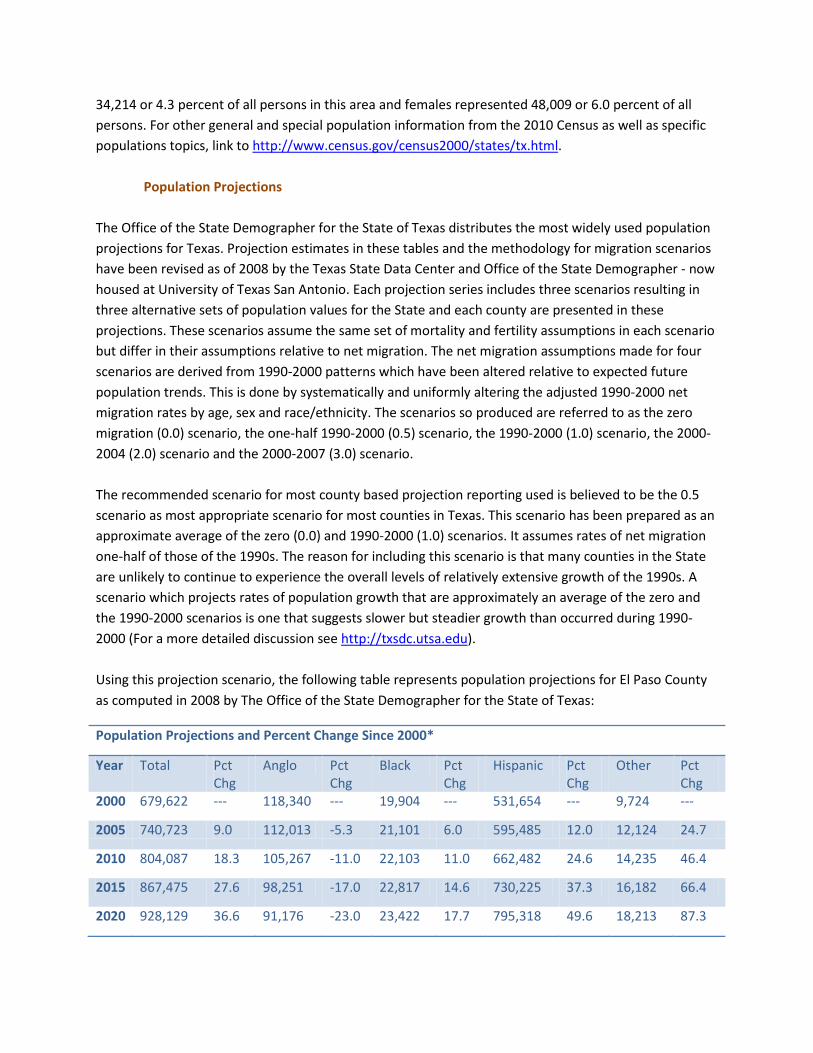
34,214 or 4.3 percent of all persons in this area and females represented 48,009 or 6.0 percent of all persons. For other general and special population information from the 2010 Census as well as specific populations topics, link to http://www.census.gov/census2000/states/tx.html. Population Projections The Office of the State Demographer for the State of Texas distributes the most widely used population projections for Texas. Projection estimates in these tables and the methodology for migration scenarios have been revised as of 2008 by the Texas State Data Center and Office of the State Demographer - now housed at University of Texas San Antonio. Each projection series includes three scenarios resulting in three alternative sets of population values for the State and each county are presented in these projections. These scenarios assume the same set of mortality and fertility assumptions in each scenario but differ in their assumptions relative to net migration. The net migration assumptions made for four scenarios are derived from 1990-2000 patterns which have been altered relative to expected future population trends. This is done by systematically and uniformly altering the adjusted 1990-2000 net migration rates by age, sex and race/ethnicity. The scenarios so produced are referred to as the zero migration (0.0) scenario, the one-half 1990-2000 (0.5) scenario, the 1990-2000 (1.0) scenario, the 2000-2004 (2.0) scenario and the 2000-2007 (3.0) scenario. The recommended scenario for most county based projection reporting used is believed to be the 0.5 scenario as most appropriate scenario for most counties in Texas. This scenario has been prepared as an approximate average of the zero (0.0) and 1990-2000 (1.0) scenarios. It assumes rates of net migration one-half of those of the 1990s. The reason for including this scenario is that many counties in the State are unlikely to continue to experience the overall levels of relatively extensive growth of the 1990s. A scenario which projects rates of population growth that are approximately an average of the zero and the 1990-2000 scenarios is one that suggests slower but steadier growth than occurred during 1990-2000 (For a more detailed discussion see http://txsdc.utsa.edu). Using this projection scenario, the following table represents population projections for El Paso County as computed in 2008 by The Office of the State Demographer for the State of Texas:
Population Projections and Percent Change Since 2000*
Year Total Pct Chg
Anglo Pct Chg
Black Pct Chg
Hispanic Pct Chg
Other Pct Chg
2000 679,622 --- 118,340 --- 19,904 --- 531,654 --- 9,724 ---
2005 740,723 9.0 112,013 -5.3 21,101 6.0 595,485 12.0 12,124 24.7
2010 804,087 18.3 105,267 -11.0 22,103 11.0 662,482 24.6 14,235 46.4
2015 867,475 27.6 98,251 -17.0 22,817 14.6 730,225 37.3 16,182 66.4
2020 928,129 36.6 91,176 -23.0 23,422 17.7 795,318 49.6 18,213 87.3
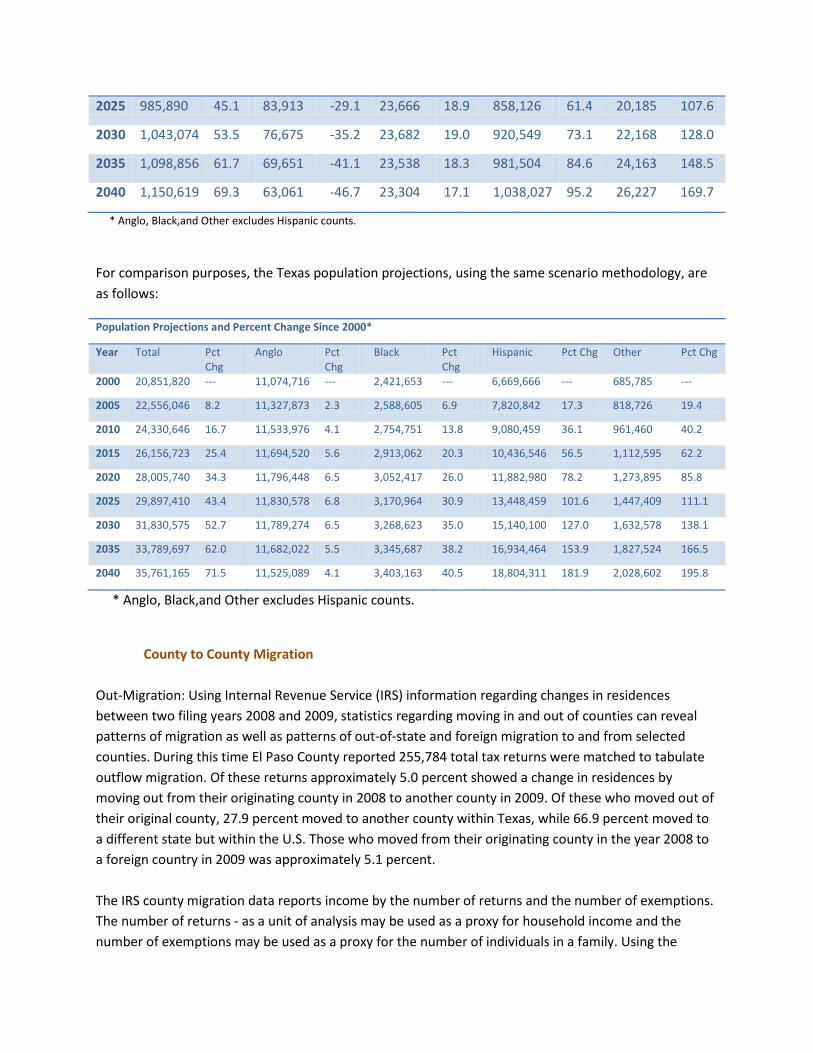
2025 985,890 45.1 83,913 -29.1 23,666 18.9 858,126 61.4 20,185 107.6
2030 1,043,074 53.5 76,675 -35.2 23,682 19.0 920,549 73.1 22,168 128.0
2035 1,098,856 61.7 69,651 -41.1 23,538 18.3 981,504 84.6 24,163 148.5
2040 1,150,619 69.3 63,061 -46.7 23,304 17.1 1,038,027 95.2 26,227 169.7
* Anglo, Black,and Other excludes Hispanic counts.
For comparison purposes, the Texas population projections, using the same scenario methodology, are as follows:
Population Projections and Percent Change Since 2000*
Year Total Pct Chg
Anglo Pct Chg
Black Pct Chg
Hispanic Pct Chg Other Pct Chg
2000 20,851,820 --- 11,074,716 --- 2,421,653 --- 6,669,666 --- 685,785 ---
2005 22,556,046 8.2 11,327,873 2.3 2,588,605 6.9 7,820,842 17.3 818,726 19.4
2010 24,330,646 16.7 11,533,976 4.1 2,754,751 13.8 9,080,459 36.1 961,460 40.2
2015 26,156,723 25.4 11,694,520 5.6 2,913,062 20.3 10,436,546 56.5 1,112,595 62.2
2020 28,005,740 34.3 11,796,448 6.5 3,052,417 26.0 11,882,980 78.2 1,273,895 85.8
2025 29,897,410 43.4 11,830,578 6.8 3,170,964 30.9 13,448,459 101.6 1,447,409 111.1
2030 31,830,575 52.7 11,789,274 6.5 3,268,623 35.0 15,140,100 127.0 1,632,578 138.1
2035 33,789,697 62.0 11,682,022 5.5 3,345,687 38.2 16,934,464 153.9 1,827,524 166.5
2040 35,761,165 71.5 11,525,089 4.1 3,403,163 40.5 18,804,311 181.9 2,028,602 195.8
* Anglo, Black,and Other excludes Hispanic counts.
County to County Migration Out-Migration: Using Internal Revenue Service (IRS) information regarding changes in residences between two filing years 2008 and 2009, statistics regarding moving in and out of counties can reveal patterns of migration as well as patterns of out-of-state and foreign migration to and from selected counties. During this time El Paso County reported 255,784 total tax returns were matched to tabulate outflow migration. Of these returns approximately 5.0 percent showed a change in residences by moving out from their originating county in 2008 to another county in 2009. Of these who moved out of their original county, 27.9 percent moved to another county within Texas, while 66.9 percent moved to a different state but within the U.S. Those who moved from their originating county in the year 2008 to a foreign country in 2009 was approximately 5.1 percent. The IRS county migration data reports income by the number of returns and the number of exemptions. The number of returns - as a unit of analysis may be used as a proxy for household income and the number of exemptions may be used as a proxy for the number of individuals in a family. Using the

number of returns for household income, the El Paso County overall has an average household earnings of $38,506. Of those households which remained in the same area, an average reported non-migrating household income of $38,514 during the period 2008 to 2009. Total income earned by 12,684 households leaving the region was $486,488,000 which represents an average income of $38,354. The top 5 counties showing the most households and their average income leaving El Paso County to other counties during 2008 to 2009 were:
County and State Households Moving Out
Average Income Moving Out
Dona Ana County, NM 866 $34,655
Foreign - Outside U.S. 650 $35,672
Bexar County, TX 570 $35,895
Maricopa County, AZ 534 $30,464
Harris County, TX 296 $45,652
In-Migration: During the period 2008 to 2009, there were approximately 265,821 total tax returns were matched to calculate inflow migration. Of these returns approximately 5.3 percent showed a change in residences by moving in from their originating county in 2008 to a county in the study area in 2009. Of these who moved into the study area from another county, 18.6 percent moved from other counties in Texas, while 73.0 percent moved from a county in a different state but within the U.S. Those who moved into the study area during the 2008-2009 period from a foreign country was approximately 8.4 percent.
Using the number of returns as a proxy for household income, the El Paso County overall has an average household earnings of $38,309. Of those households which remained in the same area, had an average reported non-migrating household income of $38,514 during the period 2008 to 2009. Total income earned by 14,178 households entering the region was $491,638,000 which represents an average income of $34,676. The top 5 counties showing the most households and their average income migrating into El Paso County from other counties during 2008 to 2009 were:
County and State Households Moving In
Average Income Moving In
Foreign - Outside U.S. 1,108 $31,961
Dona Ana County, NM 843 $27,497
Los Angeles County, CA 410 $28,366
Bexar County, TX 341 $32,965
Change in Aggregated Earnings: Gains and losses of residential earnings and buying power due to a migration can be reflected in observed differences in aggregate dollars entering and leaving an area. County to county migration information from the IRS shows a net change for the El Paso County region of $5,150,000.00. A positive value represents an increase in earnings for an area and a negative value represents a loss of income during the 2008 - 2009 period. Vital Statistics: According to the Texas Department of State Health Services for vital statistics for the year 2004, the El Paso County area had a total of 14,414 live births which represents a live birth rate of 20.2 births for every 1,000 persons in the study area compared to a statewide rate of 17.0 births per 1,000 persons in the population. The area had a total of 4,143 deaths representing a rate of 5.8 for every 1,000 persons compared to a statewide rate of 6.8.
Employment Civilian Labor Force (CLF): The most recent civilian labor force estimates from TWC for Texas statewide in June 2012 is 12,723,470 which is an increase in the labor force of 224,495 persons since June 2011. This represents a 1.8 percent change in Texas during this time period. These estimates are not seasonally adjusted. El Paso County had a civilian labor force of 332,024 for June 2012 which was a change of 5,939 in CLF since June 2011. This change represented an increase of 1.8 percent for the study area. For another glimpse into TWC/LMI's Texas and County information, link to: http://www.tracer2.com/cgi/dataanalysis/AreaSelection.asp?tableName=Labforce. Economic Diversification: Relative to the Texas economy, the LMCI economic diversification index measures the degree to which a county economy is diversified. Significant concentrations of employment in only one or two industrial sectors makes an area less diversified and more susceptible to widespread economic decline should a key sector suffer a significant loss. While economic diversification or a balanced distribution of employment across all major industry sectors, is generally desirable, in some cases, especially where a region is exploiting a comparative advantage (such as access to raw materials, access to transportation routes, etc.) a statistically diverse economy does not necessarily correlate with higher growth. Of the three levels of diversification ranging from below average, average and above average, El Paso County had an economic base which is of average diversity. Employment By Major Industry Sector: The most recent employment data from TWC by major industrial sector for El Paso County compared to Texas are shown below in a table for two years. The Department of Labor calls these major categories "Super Sectors". One advantage in reviewing employment changes at broad industrial levels is that it allows for a unique snapshot of major differences in the total employment for a selected study area when compared to any larger statewide trend. When
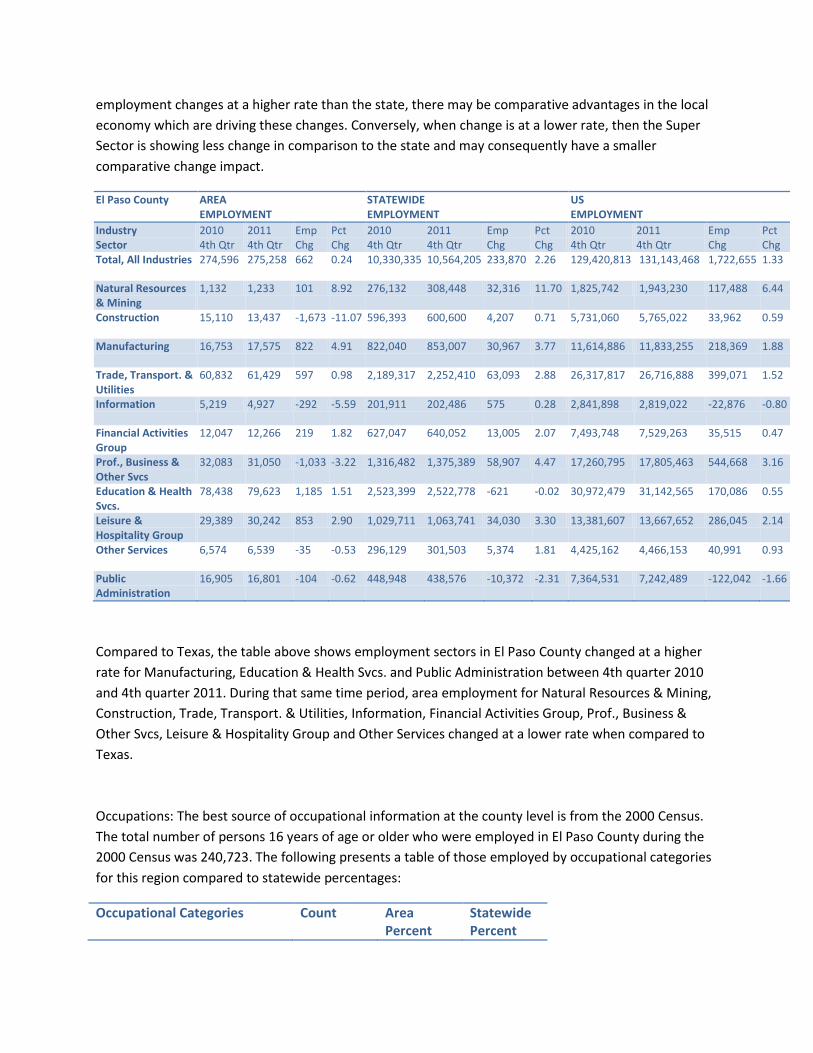
employment changes at a higher rate than the state, there may be comparative advantages in the local economy which are driving these changes. Conversely, when change is at a lower rate, then the Super Sector is showing less change in comparison to the state and may consequently have a smaller comparative change impact.
El Paso County AREA EMPLOYMENT
STATEWIDE EMPLOYMENT
US EMPLOYMENT
Industry Sector
2010 4th Qtr
2011 4th Qtr
Emp Chg
Pct Chg
2010 4th Qtr
2011 4th Qtr
Emp Chg
Pct Chg
2010 4th Qtr
2011 4th Qtr
Emp Chg
Pct Chg
Total, All Industries 274,596 275,258 662 0.24 10,330,335 10,564,205 233,870 2.26 129,420,813 131,143,468 1,722,655 1.33
Natural Resources & Mining
1,132 1,233 101 8.92 276,132 308,448 32,316 11.70 1,825,742 1,943,230 117,488 6.44
Construction 15,110 13,437 -1,673 -11.07 596,393 600,600 4,207 0.71 5,731,060 5,765,022 33,962 0.59
Manufacturing 16,753 17,575 822 4.91 822,040 853,007 30,967 3.77 11,614,886 11,833,255 218,369 1.88
Trade, Transport. & Utilities
60,832 61,429 597 0.98 2,189,317 2,252,410 63,093 2.88 26,317,817 26,716,888 399,071 1.52
Information 5,219 4,927 -292 -5.59 201,911 202,486 575 0.28 2,841,898 2,819,022 -22,876 -0.80
Financial Activities Group
12,047 12,266 219 1.82 627,047 640,052 13,005 2.07 7,493,748 7,529,263 35,515 0.47
Prof., Business & Other Svcs
32,083 31,050 -1,033 -3.22 1,316,482 1,375,389 58,907 4.47 17,260,795 17,805,463 544,668 3.16
Education & Health Svcs.
78,438 79,623 1,185 1.51 2,523,399 2,522,778 -621 -0.02 30,972,479 31,142,565 170,086 0.55
Leisure & Hospitality Group
29,389 30,242 853 2.90 1,029,711 1,063,741 34,030 3.30 13,381,607 13,667,652 286,045 2.14
Other Services 6,574 6,539 -35 -0.53 296,129 301,503 5,374 1.81 4,425,162 4,466,153 40,991 0.93
Public Administration
16,905 16,801 -104 -0.62 448,948 438,576 -10,372 -2.31 7,364,531 7,242,489 -122,042 -1.66
Compared to Texas, the table above shows employment sectors in El Paso County changed at a higher rate for Manufacturing, Education & Health Svcs. and Public Administration between 4th quarter 2010 and 4th quarter 2011. During that same time period, area employment for Natural Resources & Mining, Construction, Trade, Transport. & Utilities, Information, Financial Activities Group, Prof., Business & Other Svcs, Leisure & Hospitality Group and Other Services changed at a lower rate when compared to Texas. Occupations: The best source of occupational information at the county level is from the 2000 Census. The total number of persons 16 years of age or older who were employed in El Paso County during the 2000 Census was 240,723. The following presents a table of those employed by occupational categories for this region compared to statewide percentages:
Occupational Categories Count Area Percent
Statewide Percent

Mgmt., Professional Occs. 70,168 29.1 33.3
Service Occupations 40,747 16.9 14.6
Sales and Office Occupations 67,617 28.1 27.2
Farming/Fishing/Forestry Occs. 863 0.4 0.7
Constr., Extraction Occs. 20,839 8.7 10.9
Production, Transport. Occs. 40,489 16.8 13.2
Class of Worker: Another way to view the types of workers in an area's labor force is by class of worker. According to the 2000 Census, the area had 177,826 employees who were private wage and salary workers representing 73.9 percent of all workers. The region had another 48,254 persons who were government workers or 20.0 percent, 13,915 who were self-employed workers or 5.8 percent and 728 who were unpaid family workers representing 0.3 percent. This compares to the Texas statewide distribution of 78.0 percent for private wage and salary workers, 14.6 percent for government workers, 7.1 percent for self-employed, and 0.3 percent for unpaid family workers. Unemployment: According to TWC unemployment figures for June 2012 El Paso County had an unemployment estimate of 33,677 persons which represents a rate of 10.1 compared to a Texas statewide unemployment rate of 7.6 for the same month. For the study area these estimates represent a decrease from June 2011 unemployment rate of 11.2 percent. The Texas statewide unemployment rate was 8.6 for June 2011. For the latest unemployment rates, see TWC's LMI website - Unemployment Rates (LAUS): http://www.tracer2.com/cgi/dataanalysis/AreaSelection.asp?tableName=Labforce and for a description of methodology link to: http://www.tracer2.com/article.asp?ARTICLEID=148. Reporting Establishments: The TWC indicates 13,958 business reporting units operating in El Paso County in the fourth quarter of 2011 with an average of 19.72 workers per unit. Average firm size makes a difference for job hunting and job development strategy because larger firms tend to have better defined ports of entry and in-house training capabilities. Although definitions vary greatly, small business can be defined as less than 50 workers and medium sized is 250 or less. The Texas average is 17.97 workers per unit. Regions with higher than average number of workers per unit tend to be dominated economically by a few very large employers. Commuting to Work: Commuting to work for workers 16 years and over has a number of implications for transportation and municipal services study. El Paso County had a total of 185,573 or 75.9 percent who drove their car to work alone, 39,606 or 16.2 percent who car pooled, 5,437 or 2.2 percent used public transportation, 5,337 or 2.2 percent who walked to work, 3,261 or 1.3 percent of regional workers who used other means to work, and 5,250 or 2.1 percent who worked at home. These methods of commuting to work compare to the Texas statewide results by: car alone (77.7%), car pool (14.5%), public transportation (1.9%), walked (1.9%), other means (1.3%), and worked at home (2.8%). The
average travel time to work in minutes was 22.70 for the region as compared to an overall statewide average of 25.4 minutes. Employers by Employee Size Class: Employer contact information and employee size ranges are collected and updated by the Analyst Resource Center – Employer Database - InfoGroup/Government Division. The most current release is a product called the Employer Database 2012 2nd Edition. This product shows that the area had approximately 5,261 establishments which employed 10 or more employees. Of these employers, approximately 0.2 percent employed over 1000 employees. 0.6 percent employed between approximately 500 and 999 employees, 8.0 percent employed between approximately 100 and 499 employees, 11.3 percent employed between 50 and 99 employees, 29.4 percent employed between 20 and 49 employees, and 50.7 percent employed between approximately 10 and 19 employees. Top 10 Manufacturers for the El Paso County Region
• A O Smith Corp • Autotronic Controls Corp • Coca-cola Enterprises Inc • Delphi Packard Electrical • Eaton Corp Power & Control • Helen Of Troy Ltd • International Garment Proc • Raytheon Co • Ready One Industries • Toro Co
Income Personal Income: According to the most recent data released by the BEA 2005, El Paso County's total personal income, excluding farm, was $16,754,038,000 which represented an increase of $1,041,014,000 when compared to the 2004 total personal income, excluding farm, of $ 15,713,024,000. For Statewide personal income, the total of $686,943,289,000 for 2004 and $741,099,703,000 for the year 2004, shows an increase of $54,156,414,000. This indicates that El Paso County has a personal income showing a rate change of 6.6 percent compared to the statewide income at a rate change of 7.9 percent for the same period. Income from all government and government enterprises for the area was a total of $3,887,767,000 for the year 2005. This was an increase of 7.6 percent from the 2004 figure of $3,614,428,000. Texas statewide had an increase of 5.7 percent for government income. Military income, excluding federal civilian income, for 2005 was $1,003,021,000 compared to $873,957,000 in 2004 for the study area. This was an increase of 14.8 percent compared to a statewide change of no change percent for the same period. For further information link to: http://www.bea.gov/bea/regional/reis.

Per Capita Income: Total personal income is a widely used measure of regional economic health while per capita income is generally used to compare the relative well-being of residents across areas (not accounting for differences in area cost of living). The per capita personal income for 2005 was $23,256 in El Paso County while Texas statewide had a per capita income of $32,460. For more information on this data, please go to http://www.bea.gov/bea/regional/reis. Government Transfer Payments: The El Paso County region received over $3,358,300,000 in transfer of payments in FY2005 which reflected a $4,657 per capita transfer payment compared to the Texas per capita payment of $4,194. Transfer payments includes the total amount of government allocations to people who qualify for income assistance. This consists largely of supplemental security income payments, family assistance, general assistance payments, food stamp payments, and other assistance payments, including emergency assistance. For more information on this data, please go to http://www.bea.gov/bea/regional/reis. Residence Adjustment: Some areas function as major employment centers and others serve as "bedroom communities". This means that residents may work in one region but live, pay taxes and spend most of their income in their resident region. The degree to which a regional area serves as a bedroom community can be measured by a "residence adjustment" to the area personal income. The residence adjustment in the El Paso County region was $-579,368 in 2005. By 2006 the adjustment represented a decrease to $-604,402. A negative number implies that workers commute into the region to earn income but do not reside there. Growth over time of negative residence adjustments generally implies an eroding tax base for the region. Similarly, a positive figure implies that on balance the region exports jobs and income to residents of other regions. For more information on this data, please go to http://www.bea.gov/bea/regional/reis. Average Weekly Wage: TWC reported an average weekly wage during 4th quarter 2010 for all covered wages and salaried employment in the El Paso County region to be $689.69. Average weekly wages for 4th quarter 2011 was $674.05, a decrease of -2.3 percent. This is compared to a decrease of -0.4 percent statewide for the same period of time. The Texas statewide average weekly wage in the 4th quarter of 2010 was $972.70. These wage data are the result of the reported quarterly wages and salaries paid by employers divided by 13 weeks. For the most current information, link to: http://www.tracer2.com/cgi/dataanalysis/AreaSelection.asp?tableName=Industry UI Benefits: The region had $41,967,518 in Unemployment Insurance benefits paid during calendar year 2008. In the El Paso County region, the average duration before exhausting regular UI benefits in calendar year 2008 was approximately 13.5 weeks, while the statewide average duration before exhausting regular UI benefits in calendar year 2008 was approximately 13.4 weeks. The most likely interpretation of longer duration times is greater difficulty finding a job. Therefore, duration can serve as a good barometer for local general economic conditions. The average weekly benefits payment for Regular UI in 2008 was $267.84 for the El Paso County region compared to $307.5 in Texas statewide. Personal Income by Place of Residence: Personal income by place of residence, based on the 2000

Bureau of Economic Analysis (BEA) estimates was roughly $60,198 for the El Paso County region. This compares to $78,626 statewide. This figure is much higher than the per capita income level because it includes all wage earners living within a single household. Also, income data from BEA will be different than income data from other agencies due to that fact the BEA includes other sources of income such as farm wages, dividends, interest, rent and transfer payments. For more information on this data, please go to http://www.bea.gov/bea/regional/reis. Poverty Population: The U.S. Department of Census estimated a 2002 poverty population for the El Paso County region for people of all ages at 178,326 persons. That figure represents 25.7 percent of the non-institutional population compared to a Texas percentage of 15.4 percent for people of all ages. The estimated number of people under the age of 18 in the study area in poverty was 68,064 in 1999. This figure was 9.0 percent of all people under 18 in the study area compared to Texas statewide which was 6.0 percent of all people under 18 as estimated in 1999. According to the 2000 Census, the number of families living below poverty status in 1999 were 34,264 which was 20.5 percent of all families in the study area. This compared to 12.0 percent of all families statewide living in poverty status in 1999. The total number of individuals living below poverty status was 158,722 in 1999 which was 19.8 percent of all individuals in the study area. This compared to 12.4 percent of all individuals living below poverty status statewide. For the most recent Poverty information, see: http://www.census.gov/hhes/www/saipe/county.html . Gross Retail Sales: Income can be viewed in several ways and under different definitions. Per capita income tends to have a direct relationship with the growth of gross sales and most service sector industries in an area. Gross sales for the region estimated by the Texas Comptroller of Public Accounts were $2,523,471,552 in the 4th quarter 2010 which represented an increase of 1.9 percent to $2,571,802,534.00 by the 4th quarter 2011. The statewide change for the same period was an increase of 4.9 percent in gross sales. The total number of reporting outlets for the same period was 8,028 in the 4th quarter 2010 and 7,268 in the 4th quarter 2011. This region had a decrease of -9.5 percent in the study area compared to the statewide change for the same period of a decrease of -4.3 percent. For the most recent Gross Retail Sales information, please see: http://www.window.state.tx.us/taxinfo/sales/.
Socioeconomic Indicators
County State Per Capita Personal Income $16,768 $24,870 Median Household Income $36,333 $49,646 Source: www.census.gov Unemployment Rate 9.5% 8.2% Average Monthly TANF Recipients 6,850 104,693 (Temporary Assistance to Needy Families) Average Monthly SNAP Recipients 155,364 2,819,469 (Supplemental Nutrition Assistance Program)

Unduplicated Medicaid Clients 224,868 4,762,787 Average Monthly CHIP Enrollment 20,941 466,242 #County %County #State %State Without Health Insurance <18 47,458 19.9% 1,375,714 19.5% <65 216,352 33.0% 5,765,126 26.8%
#County %County #State %State Persons Living Below Poverty Level 174,651 23.7% 4,143,077 17.1%
Source: http://www.dshs.state.tx.us/chs/
Housing Household Units and Size: The total number of housing units in 2000 in El Paso County according the Census was 210,022 with an average household size of 3.2 persons. The average household size for Texas was 2.7 persons for the same period. Home ownership rates for this area was 63.6 percent compared to Texas statewide which had a rate of 63.8 percent. While in Texas statewide the percent of households with persons under 18 years of age in 2000 was 40.9 percent, this study area had a percent of 51.3. The percent of households with persons 65 years of age or older was 19.9 percent in Texas statewide while 23.1 percent of El Paso County had households with individuals 65 years of age and older. Types of Structures: While Texas had approximately 63.4 percent of the housing units in the category of one detached structures in 2000 according to the census, the study area had approximately 63.1 percent. Mobile homes in the area made up 7.3 percent when compared to a statewide percentage of 9.0 percent. More recently built housing structures in the area shows new development has taken place in the region. The total number of new housing structures built between 1995 and March 2000 was 27,149 or 12.1 percent in El Paso County compared to 13.2 percent statewide. Owner and Renter Occupied: According to the 2000 Census, the percent of owner-occupied units with a value of $100,000 or greater in El Paso County was 19.0 percent compared to 36.7 percent for the state. The percent of renter-occupied units with rent values of $500 per month or greater was 40.6 percent as compared to the Texas percentage of 60.4 percent. The median home value in El Paso County according to the 2000 census was $69,600.00 compared to a statewide median value of $82,500.00. Median rent for the area was $468.00 compared to $574.00 for the state. For this area, the total number of renter-occupied housing units was 76,398 which represented 36.4 percent of all occupied housing units in 2000. This compares to a Texas statewide percentage of 36.2 percent for the same period.
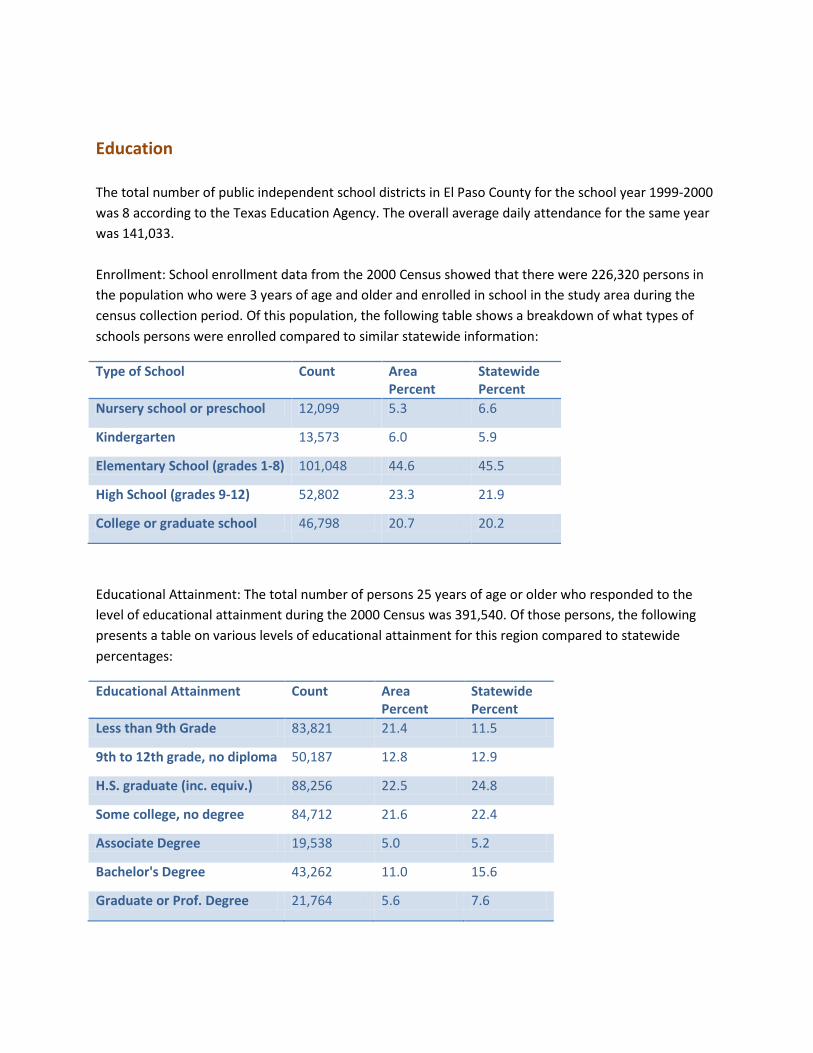
Education The total number of public independent school districts in El Paso County for the school year 1999-2000 was 8 according to the Texas Education Agency. The overall average daily attendance for the same year was 141,033. Enrollment: School enrollment data from the 2000 Census showed that there were 226,320 persons in the population who were 3 years of age and older and enrolled in school in the study area during the census collection period. Of this population, the following table shows a breakdown of what types of schools persons were enrolled compared to similar statewide information:
Type of School Count Area Percent
Statewide Percent
Nursery school or preschool 12,099 5.3 6.6
Kindergarten 13,573 6.0 5.9
Elementary School (grades 1-8) 101,048 44.6 45.5
High School (grades 9-12) 52,802 23.3 21.9
College or graduate school 46,798 20.7 20.2
Educational Attainment: The total number of persons 25 years of age or older who responded to the level of educational attainment during the 2000 Census was 391,540. Of those persons, the following presents a table on various levels of educational attainment for this region compared to statewide percentages:
Educational Attainment Count Area Percent
Statewide Percent
Less than 9th Grade 83,821 21.4 11.5
9th to 12th grade, no diploma 50,187 12.8 12.9
H.S. graduate (inc. equiv.) 88,256 22.5 24.8
Some college, no degree 84,712 21.6 22.4
Associate Degree 19,538 5.0 5.2
Bachelor's Degree 43,262 11.0 15.6
Graduate or Prof. Degree 21,764 5.6 7.6

Another useful grouping of these statistics shows that the percent of high school graduates or higher was 65.8 percent for the area compared to 75.7 percent for Texas. Also, the percent with bachelor's degree or higher was 16.6 percent as compared to 23.2 percent for Texas. Dropout and Attrition Rates: Information from the Texas Education Agency on student dropouts from public schools for 2004-2005 shows that 916 students, grades 7-12, dropped out of school in this study area. This represents a dropout rate of 1.18 percent as compared to a Texas statewide percentage of 0.90 percent of all students who dropped out during this period. Attrition rates are often viewed as measures of the percentage of students that begin high school but do not graduate with a diploma. It is arguably a more reasonable way to view dropouts from an economic viewpoint. One way to view educational progress in a region is to estimate the number of persons who persist to high school graduation as opposed to standard dropout statistics. Attrition rates are calculated by the Intercultural Development Research Association (IDRA). IDRA conducts research and development activities; creates, implements and administers innovative education programs; and provides teacher, administrator, and parent training and technical assistance. The attrition rates for El Paso County during the period 2004-2005 by race and ethnicity were 36 percent for all students, 33 percent for Blacks, 18 percent for Whites, and 38 percent for Hispanics. In order to review the latest Secondary Schools Enrollment and Dropouts information posted on the Texas Education Agency, link to: http://www.tea.state.tx.us/research/.
Health Health Facilities - The number of acute and psychiatric care hospitals in El Paso County as of October 2007 was 14, with an average total beds capacity of approximately 157.5 compared to a statewide ratio of 123.1 beds per hospital according to statistical reports from the Texas Department of State Health Services. Link to http://www.dshs.state.tx.us for more data reporting on health care facilities. The Texas State Board of Pharmacy data for October 2007 shows there are 136 licensed pharmacies in the study area. The total number of licensed pharmacies statewide is 5,919. For additional information on Texas Pharmacies, link to the Texas State Board of Pharmacy at http://www.tsbp.state.tx.us/index.htm. Health Practitioners - According to the Texas Department of State Health Services October 2007 report, there were 1,105 direct patient care and primary care physicians who practiced in the region. The ratio of total persons to each physician in the area was 674.8 residents per each physician. This compares to a statewide ratio of 460.5 persons for each physician in Texas. Another way of reporting these figures is by showing the number of physicians as a ratio per 100,000 residents. In this study area, the ratio in direct patient care was 913.7 as compared to the statewide ratio of 638.3 in direct patient care physicians per 100,000 population as of 2007. The ratio of physicians in primary care was 2,142.6 compared to a statewide ratio of 1,472.0 physicians in primary care per 100,000 persons in the population statewide.

Link to http://www.dshs.state.tx.us for more data. The study area had a total of 3,803 registered nurses (RN) working in the study area, representing a ratio of 196.1 persons for each RN in the area. The statewide ratio was 152.2 persons for each RN in the state. For the same time period, the ratio of RNs per 100,000 population was 509.9 compared to 657.0 per 100,000 statewide. Link to http://www.dshs.state.tx.us for more data. The number of licensed vocational nurses (LVN) who practiced in the area was 1,044 representing a ratio of 714.2 persons per each LVN in the area. This compared to 363.8 persons per each LVN statewide. The ratio of LVNs per 100,000 population was 140.0 compared to 274.9 per 100,000 population statewide. See http://www.dshs.state.tx.us for a wider variety of Health Professionals and related information. The Texas Department of State Health Services information for October 2007 also reports that there were 159 dentists in the study area, with a ratio of 4,689.4 persons for each dentist in the area. The ratio of dentists per 100,000 residents was 21.3. By comparison, there was a statewide ratio of 42.8 dentists per 100,000 residents, with a total of 10,151 dentists statewide. See http://www.dshs.state.tx.us for a wider variety of Health Professionals and related information. According to data from the Texas Department of State Health Services for October 2007, there were 1,373 licensed Emergency Medical Technicians, or EMTs, for the study area; a ratio of 184.1 licensed EMTs per 100,000 residents. The statewide ratio was 218.0 EMTs per 100,000 residents, with a total of 51,718 EMTs statewide. See http://www.dshs.state.tx.us for a wider variety of Health Professionals and related information. Also, according to the October 2007 report from the Texas Department of State Health Services, there were 347 pharmacists in this area, which is a ratio of 2,148.7 persons for each pharmacist. Texas has 18,138 pharmacists statewide, or a ratio of 1,308.2 persons for each pharmacist in the area. The ratio of pharmacists per 100,000 residents was 46.5 compared to 76.4 per 100,000 residents statewide. See http://www.dshs.state.tx.us for a wider variety of Health Professionals and related information. The Texas Department of State Health Services information for October 2007 shows that for the study area there were 28 occupational therapists; a ratio of 26,628.9 persons for each occupational therapist. The statewide ratio was 11,072.6 persons for each occupational therapist, with a total of 2,143 occupational therapists statewide. The ratio of occupational therapists per 100,000 residents was 3.8 compared to 9.0 statewide. See http://www.dshs.state.tx.us for a wider variety of Health Professionals and related information.

Medical & Health Services Employment*
Area Statewide
2010 4th Qtr
2011 4th Qtr
Pct Change
2010 4th Qtr
2011 4th Qtr
Pct Change
36,814 38,624 4.92% 1,296,997 1,330,301 2.57%
* Includes: Public and Private Hospitals, Medical/Health Offices; Home Health, Nursing, Elderly Residential facilities; Individual/Family, Emergency & Other Relief Svcs., Vocational Rehab. Svcs. [NAICS: 6211,6212-19,6221-23,6231-33,6239,6241-43] Due to confidentiality, employment for small areas may be suppressed and reported as zero.
Health Statistics - Some of the leading causes of mortality in Texas include malignant neoplasms or cancer, heart disease, and chronic lower respiratory disease. From information gathered by Texas Department of State Health Services for 2004, the study area had a total of 912 reported deaths from malignant neoplasm cancer. On a statewide level, Texas had 33,836 reported deaths from malignant neoplasm cancer. Texas Department of State Health Services reports that for 2004 there were 989 deaths from heart disease, and 162 deaths from lower respiratory disease in the selected study area. By contrast, Texas statewide had 40,091 deaths from heart disease and 7,387 deaths from chronic lower respiratory disease. See http://www.dshs.state.tx.us for a wider variety of Texas health, disease and related information. Several state agencies collect statistics on health status indicators that can be used to assess the strengths or weaknesses of public health in a local area or community. For this study area, the Texas Department of State Health Services reported for August 2004 there were 56 infant deaths, as compared with a statewide rate of 2,398. See http://www.dshs.state.tx.us for a wider variety of Texas health, disease and related information. The Texas Department of State Health Services reported that for August 2003 there were 939 total teen pregnancies in this area. There were different teen pregnancy rates in the study area depending on race, with 9 for Black teens, 899 for Hispanic teens and 31 for White teens. Statewide rates for teenage pregnancy were 19,730 for total teenage pregnancies, with 3,003 for Black teens, 12,693 for Hispanic teens and 4,034 for White teens. See http://www.dshs.state.tx.us for a wider variety of Texas health, disease and related information. In the Health and Human Services 2003 Data Book, figures show that the number of children under 19 in this area whom were not covered by health insurance is 3,976, which is 9.1% of the reported population in that age group. The number of uninsured children statewide is 885,999, or 7.1% of the reported population for children under 19. For more information, or to view or download the entire data book, see http://www.hhsc.state.tx.us. Source: www.texasindustryprofiles.com
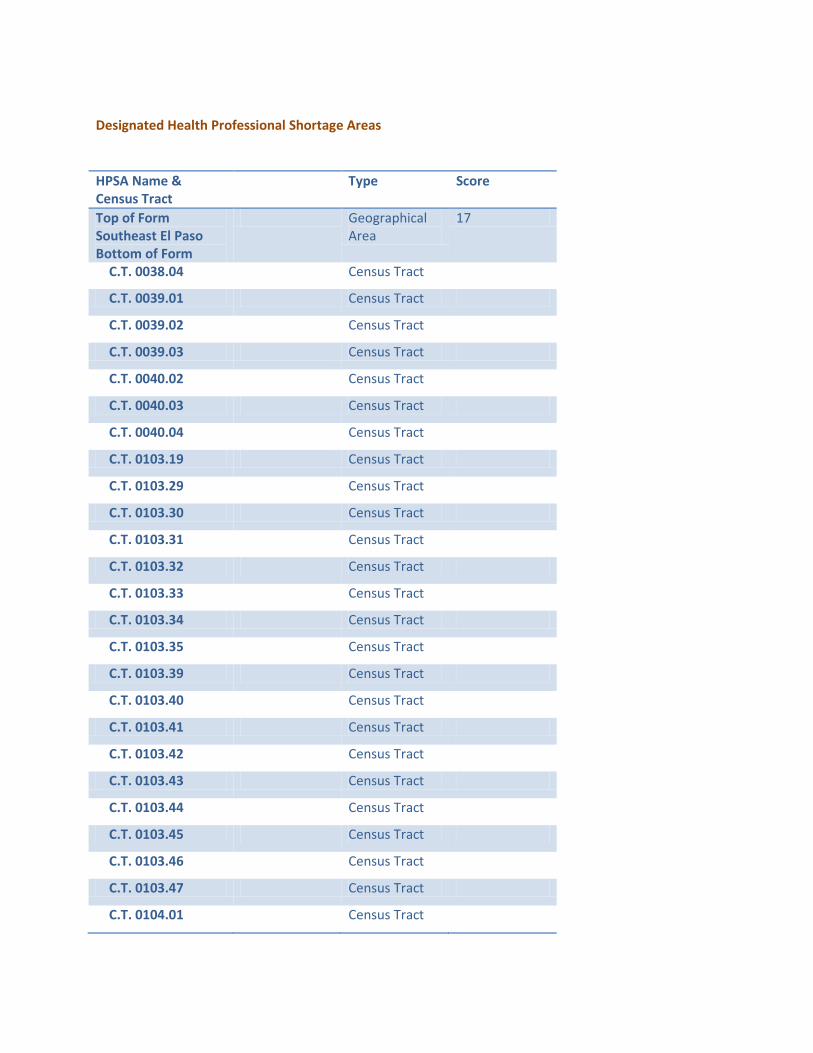
Designated Health Professional Shortage Areas
HPSA Name & Census Tract
Type Score
Top of Form Southeast El Paso Bottom of Form
Geographical Area
17
C.T. 0038.04 Census Tract
C.T. 0039.01 Census Tract
C.T. 0039.02 Census Tract
C.T. 0039.03 Census Tract
C.T. 0040.02 Census Tract
C.T. 0040.03 Census Tract
C.T. 0040.04 Census Tract
C.T. 0103.19 Census Tract
C.T. 0103.29 Census Tract
C.T. 0103.30 Census Tract
C.T. 0103.31 Census Tract
C.T. 0103.32 Census Tract
C.T. 0103.33 Census Tract
C.T. 0103.34 Census Tract
C.T. 0103.35 Census Tract
C.T. 0103.39 Census Tract
C.T. 0103.40 Census Tract
C.T. 0103.41 Census Tract
C.T. 0103.42 Census Tract
C.T. 0103.43 Census Tract
C.T. 0103.44 Census Tract
C.T. 0103.45 Census Tract
C.T. 0103.46 Census Tract
C.T. 0103.47 Census Tract
C.T. 0104.01 Census Tract
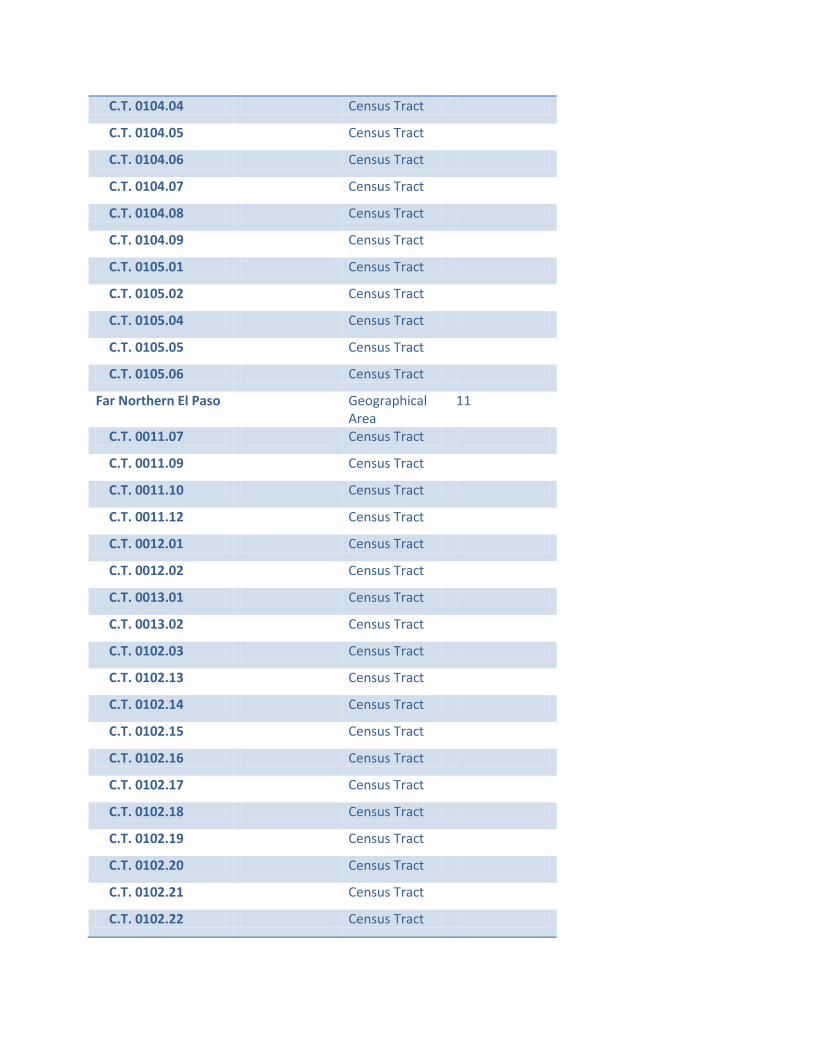
C.T. 0104.04 Census Tract
C.T. 0104.05 Census Tract
C.T. 0104.06 Census Tract
C.T. 0104.07 Census Tract
C.T. 0104.08 Census Tract
C.T. 0104.09 Census Tract
C.T. 0105.01 Census Tract
C.T. 0105.02 Census Tract
C.T. 0105.04 Census Tract
C.T. 0105.05 Census Tract
C.T. 0105.06 Census Tract
Far Northern El Paso Geographical Area
11
C.T. 0011.07 Census Tract
C.T. 0011.09 Census Tract
C.T. 0011.10 Census Tract
C.T. 0011.12 Census Tract
C.T. 0012.01 Census Tract
C.T. 0012.02 Census Tract
C.T. 0013.01 Census Tract
C.T. 0013.02 Census Tract
C.T. 0102.03 Census Tract
C.T. 0102.13 Census Tract
C.T. 0102.14 Census Tract
C.T. 0102.15 Census Tract
C.T. 0102.16 Census Tract
C.T. 0102.17 Census Tract
C.T. 0102.18 Census Tract
C.T. 0102.19 Census Tract
C.T. 0102.20 Census Tract
C.T. 0102.21 Census Tract
C.T. 0102.22 Census Tract

Centro De Salud Familiar
Comprehensive Health Center
12
Centro San Vicente Health Center
Comprehensive Health Center
19
Immigration and Customs Enforcement - El Paso
Correctional Facility
12
Federal Correctional Institution - La Tuna
Correctional Facility
18
Project Vida Health Center
Comprehensive Health Center
7
Lower Valley - El Paso
Geographical Area
10
C.T. 0010.01 Census Tract
C.T. 0010.02 Census Tract
C.T. 0024.00 Census Tract
C.T. 0025.00 Census Tract
C.T. 0026.00 Census Tract
C.T. 0030.00 Census Tract
C.T. 0031.00 Census Tract
C.T. 0032.00 Census Tract
C.T. 0033.00 Census Tract
C.T. 0034.02 Census Tract
C.T. 0034.03 Census Tract
C.T. 0035.01 Census Tract
C.T. 0035.02 Census Tract
C.T. 0036.01 Census Tract
C.T. 0036.02 Census Tract
C.T. 0037.01 Census Tract
C.T. 0037.02 Census Tract
C.T. 0038.01 Census Tract
C.T. 0038.03 Census Tract
C.T. 0041.03 Census Tract
C.T. 0041.04 Census Tract
C.T. 0041.05 Census Tract

C.T. 0041.06 Census Tract
C.T. 0041.07 Census Tract
C.T. 0042.01 Census Tract
C.T. 0042.02 Census Tract
C.T. 9800.00 Census Tract
West Central Geographical Area
12
C.T. 0001.01 Census Tract
C.T. 0001.07 Census Tract
C.T. 0001.08 Census Tract
C.T. 0001.09 Census Tract
C.T. 0001.10 Census Tract
C.T. 0001.12 Census Tract
C.T. 0002.04 Census Tract
C.T. 0002.05 Census Tract
C.T. 0002.06 Census Tract
C.T. 0002.07 Census Tract
C.T. 0002.08 Census Tract
C.T. 0003.01 Census Tract
C.T. 0003.02 Census Tract
C.T. 0004.03 Census Tract
C.T. 0004.04 Census Tract
Ysleta Del Sur Pueblo Native American Tribal Population
0
Thomason Primary Care Center
Rural Health Clinic
3
El Paso North Geographical Area
14
C.T. 0001.01 Census Tract
C.T. 0001.07 Census Tract
C.T. 0001.08 Census Tract
C.T. 0001.09 Census Tract
C.T. 0001.10 Census Tract
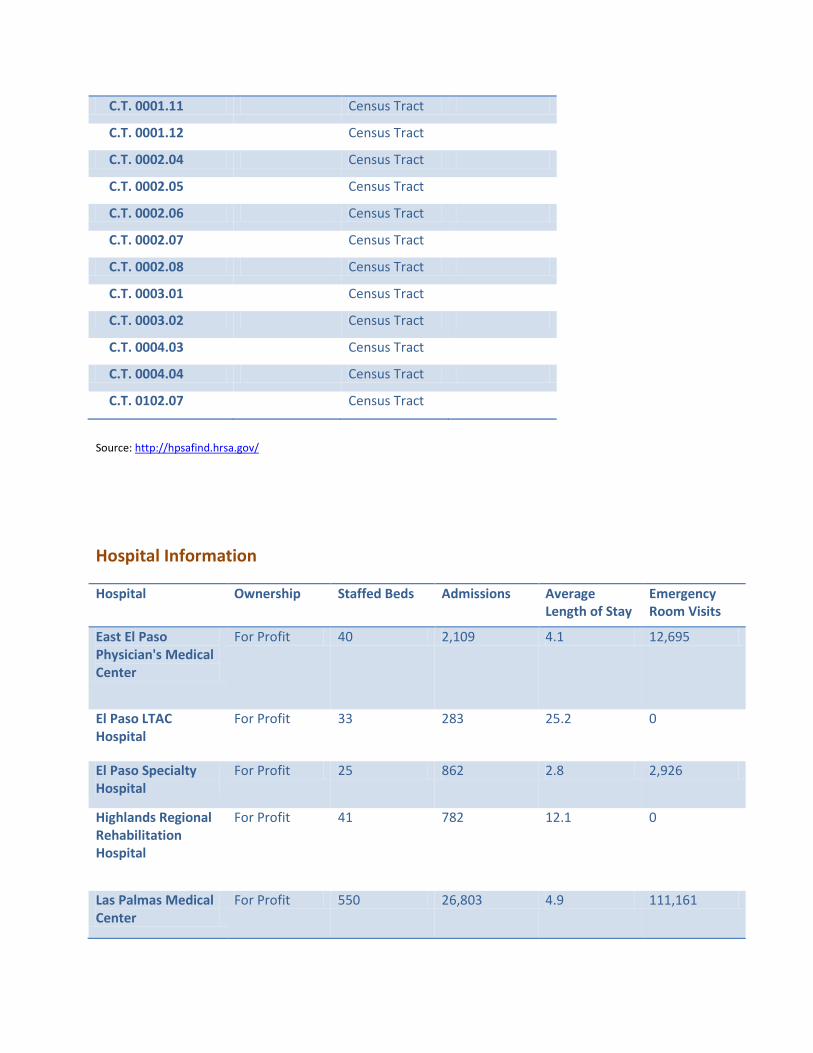
C.T. 0001.11 Census Tract
C.T. 0001.12 Census Tract
C.T. 0002.04 Census Tract
C.T. 0002.05 Census Tract
C.T. 0002.06 Census Tract
C.T. 0002.07 Census Tract
C.T. 0002.08 Census Tract
C.T. 0003.01 Census Tract
C.T. 0003.02 Census Tract
C.T. 0004.03 Census Tract
C.T. 0004.04 Census Tract
C.T. 0102.07 Census Tract
Source: http://hpsafind.hrsa.gov/
Hospital Information
Hospital Ownership Staffed Beds Admissions Average Length of Stay
Emergency Room Visits
East El Paso Physician's Medical Center
For Profit 40 2,109 4.1 12,695
El Paso LTAC Hospital
For Profit 33 283 25.2 0
El Paso Specialty Hospital
For Profit 25 862 2.8 2,926
Highlands Regional Rehabilitation Hospital
For Profit 41 782 12.1 0
Las Palmas Medical Center
For Profit 550 26,803 4.9 111,161
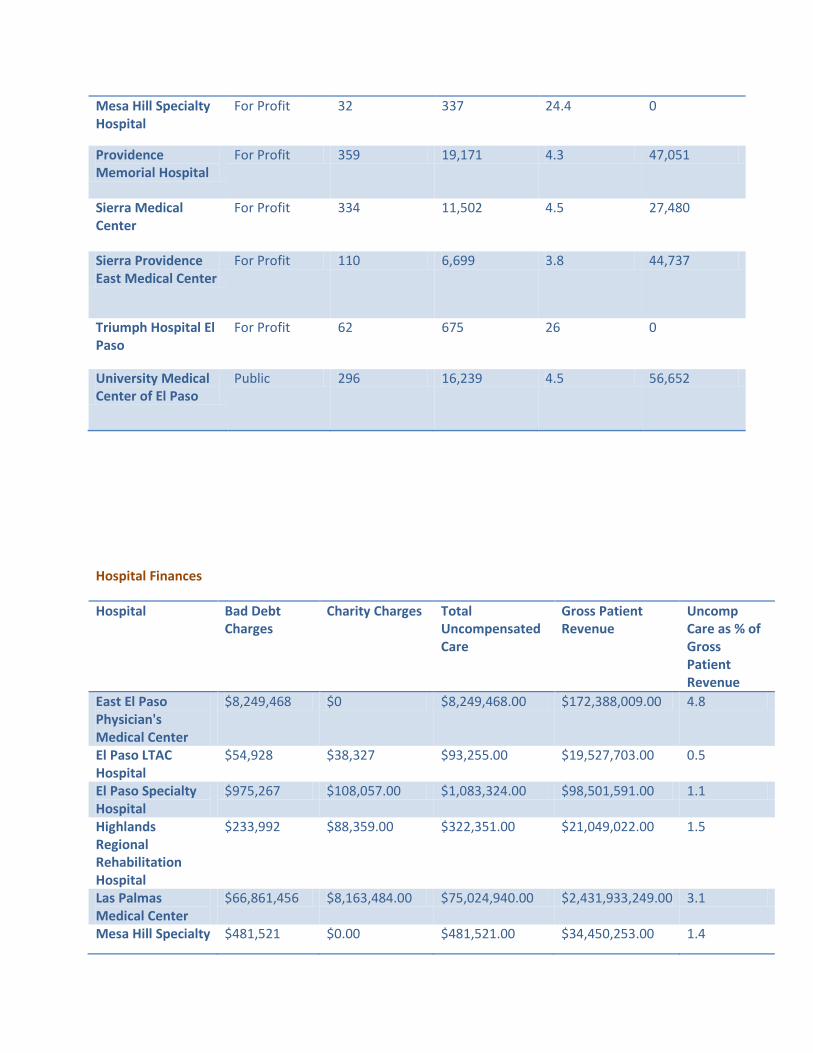
Mesa Hill Specialty Hospital
For Profit 32 337 24.4 0
Providence Memorial Hospital
For Profit 359 19,171 4.3 47,051
Sierra Medical Center
For Profit 334 11,502 4.5 27,480
Sierra Providence East Medical Center
For Profit 110 6,699 3.8 44,737
Triumph Hospital El Paso
For Profit 62 675 26 0
University Medical Center of El Paso
Public 296 16,239 4.5 56,652
Hospital Finances
Hospital Bad Debt Charges
Charity Charges Total Uncompensated Care
Gross Patient Revenue
Uncomp Care as % of Gross Patient Revenue
East El Paso Physician's Medical Center
$8,249,468 $0 $8,249,468.00 $172,388,009.00 4.8
El Paso LTAC Hospital
$54,928 $38,327 $93,255.00 $19,527,703.00 0.5
El Paso Specialty Hospital
$975,267 $108,057.00 $1,083,324.00 $98,501,591.00 1.1
Highlands Regional Rehabilitation Hospital
$233,992 $88,359.00 $322,351.00 $21,049,022.00 1.5
Las Palmas Medical Center
$66,861,456 $8,163,484.00 $75,024,940.00 $2,431,933,249.00 3.1
Mesa Hill Specialty $481,521 $0.00 $481,521.00 $34,450,253.00 1.4

Hospital
Providence Memorial Hospital
$21,739,217 $12,262,371.00 $34,001,588.00 $1,553,821,445.00 2.2
Sierra Medical Center
$13,776,646 $2,278,508.00 $16,055,154.00 $1,077,381,607.00 1.5
Sierra Providence East Medical Center
$17,599,955 $10,199,428.00 $27,799,383.00 $603,723,100.00 4.6
Triumph Hospital El Paso
$328,922 $0.00 $328,922.00 $87,917,536.00 0.4
University Medical Center of El Paso
$110,835,676 $185,330,310.00 $296,165,986.00 $712,637,332.00 41.6
Source: 2010 Cooperative DSHS/AHA/THA Annual Survey of Hospitals and Hospital tracking Database
Health Indicators
El Paso County
Error Margin
National Benchmark*
Texas Trend Rank (of 221)
Health Outcomes 45
Mortality 16
Premature death 6,083 5,893-6,274 5,466 7,186
Morbidity 162
Poor or fair health 26% 24-28% 10% 19%
Poor physical health days 4.2 3.8-4.5 2.6 3.6
Poor mental health days 3.2 3.0-3.5 2.3 3.3
Low birthweight 8.5% 8.4-8.7% 6.0% 8.2%
Health Factors 111
Health Behaviors 8
Adult smoking 16% 15-18% 14% 19%
Adult obesity 24% 21-27% 25% 29%
Physical inactivity 22% 19-25% 21% 25%
Excessive drinking 17% 15-18% 8% 16%
Motor vehicle crash death rate 13 12-14 12 17
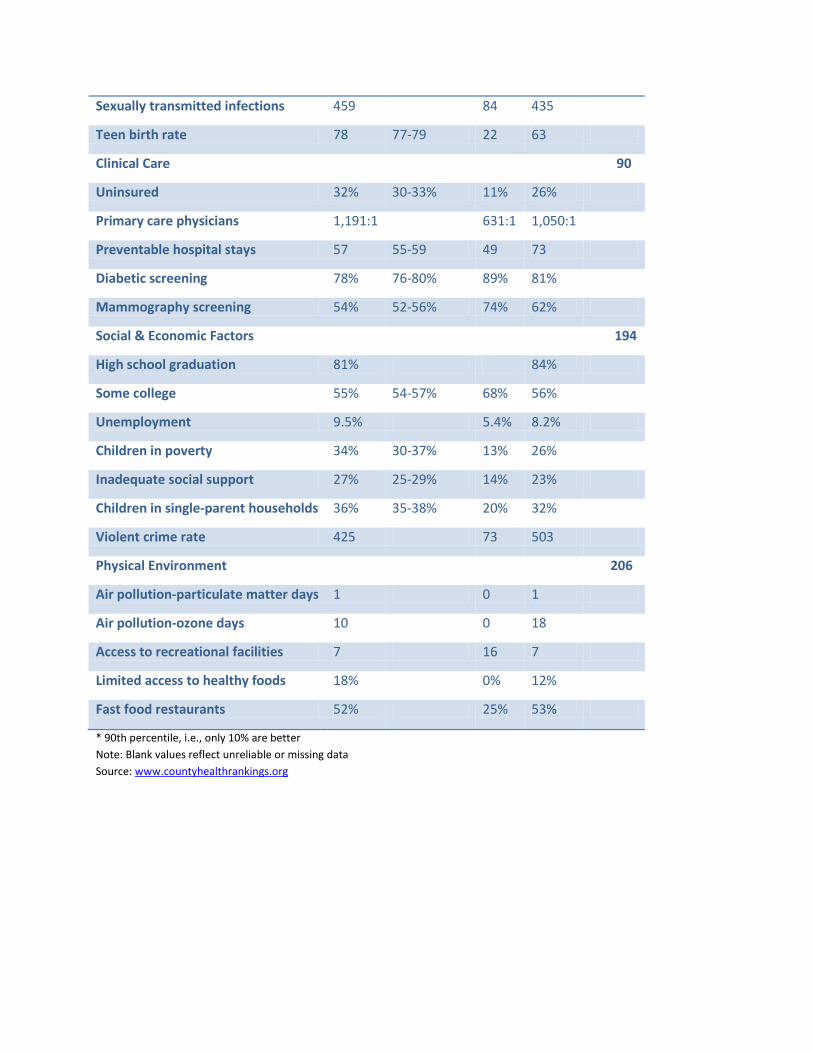
Sexually transmitted infections 459 84 435
Teen birth rate 78 77-79 22 63
Clinical Care 90
Uninsured 32% 30-33% 11% 26%
Primary care physicians 1,191:1 631:1 1,050:1
Preventable hospital stays 57 55-59 49 73
Diabetic screening 78% 76-80% 89% 81%
Mammography screening 54% 52-56% 74% 62%
Social & Economic Factors 194
High school graduation 81% 84%
Some college 55% 54-57% 68% 56%
Unemployment 9.5% 5.4% 8.2%
Children in poverty 34% 30-37% 13% 26%
Inadequate social support 27% 25-29% 14% 23%
Children in single-parent households 36% 35-38% 20% 32%
Violent crime rate 425 73 503
Physical Environment 206
Air pollution-particulate matter days 1 0 1
Air pollution-ozone days 10 0 18
Access to recreational facilities 7 16 7
Limited access to healthy foods 18% 0% 12%
Fast food restaurants 52% 25% 53%
* 90th percentile, i.e., only 10% are better Note: Blank values reflect unreliable or missing data Source: www.countyhealthrankings.org

Community Health Needs Assessment Index Data Sources
Texas Health and Human Services Commission, Research and Statistics: Online: http://www.hhsc.state.tx.us/research/index.html.
Texas Department of Family and Protective Services, 2010 Annual Report and Data Book: Online: http://www.dfps.state.tx.us/About/Data_Books_and_Annual_Reports/default.asp.
US Census Bureau, 2006-2010 American Community Survey 5-Year Estimates: Online, American FactFinder: http://factfinder2.census.gov/faces/nav/jsf/pages/index.xhtml.
US Census Bureau, Small Area Health Insurance Estimates, 2009 Health Insurance Coverage Status for Counties and States, Interactive Tables: Online: http://www.census.gov/did/www/sahie/data/2009/tables.html.
Texas Department of State Health Services, Center for Health Statistics: Online: http://www.dshs.state.tx.us/chs/datalist.shtm.
Texas Department of Public Safety, Crime in Texas, The Texas Crime Report for 2010: Online: http://www.txdps.state.tx.us/administration/crime_records/pages/crimestatistics.htm.
For more information or if there are additional questions not answered by this Community Health Needs Assessment, please contact:
Jim Conditt Texas Tech University Health Sciences Center F. Marie Hall Institute for Rural and Community Health 3601 4th Street M.S. 6232 Lubbock, Texas 79430 806-743-1338 [email protected]