ekonomikos augimo veiksmŲ programa - tid · web viewpublic ownership of land, transport...
TRANSCRIPT

Operational Programme for Economic Growthfor 2007–2013
15th July 2007, Vilnius,

TABLE OF CONTENT
1. analysis of current socio-economic situation and of development prospects in lithuania 5
1.1. GENERAL OVERVIEW OF THE LITHUANIAN ECONOMY/ PRODUCTION SECTOR...........51.2. RESEARCH AND DEVELOPMENT. INNOVATIONS 291.3. DEVELOPMENT OF INFORMATION SOCIETY 391.4. TRANSPORT NETWORK 431.5. ENERGY SUPPLY NETWORKS 541.6. SWOT ANALYSIS 59
2. OPERATIONAL PROGRAMME STRATEGY 622.1. VISIONS AND OBJECTIVES 622.2. PRIORITY 1: RESEARCH AND DEVELOPMENT FOR COMPETITIVENESS AND GROWTH OF THE ECONOMY 712.3. PRIORITY 2: INCREASING BUSINESS PRODUCTIVITY AND IMPROVING ENVIRONMENT FOR BUSINESS 762.4. PRIORITY 3: INFORMATION SOCIETY FOR ALL 822.5. PRIORITY 4: BASIC ECONOMIC INFRASTRUCTURE 872.6. PRIORITY 5: DEVELOPMENT OF TRANS-EUROPEAN TRANSPORT NETWORKS 92
2.7. PRIORITY 6: TECHNICAL ASSISTANCE FOR THE IMPLEMENTATION OF THE OPERATIONAL PROGRAMME ON ECONOMY GROWTH...............................................................................................................95
2.8. CORRESPONDENCE TO HORIZONTAL THEMES AND THEIR IMPLEMENTATION 98
3. FINANCIAL PLAN 1014. QUANTIFICATION OF OBJECTIVES 1025. PREPARATION OF THE OPERATIONAL PROGRAMME 112
5.1. PARTNERSHIP 1125.2. EX-ANTE EVALUATION 1145.3. STRATEGIC ENVIRONMENTAL IMPACT ASSESSMENT 116
6. IMPLEMENTING PROVISIONS 119
ANNEX I. BREAKDOWN OF EXPENDITURE BY CATEGORIES..........................................................134
ANNEX II. INDICATIVE LIST OF MAJOR PROJECTS.....................................................................................136
ANNEX III. FINANCIAL FLOWS........................................................................................................................137
ANNEX IV. EX-ANTE RECOMMENDATIONS – OPERATIONAL PROGRAMME ON ECONOMIC GROWTH............................................................................................................................................138
ANNEX V. COMPATIBILITY OF ASSISTANCE WITH OTHER OPERATIONAL PROGRAMMES AND OTHER EU FINANCIAL INSTRUMENTS.............................................................................................152
ANNEX VI. STATE AID CLAUSE.......................................................................................................................158
ANNEX VII. PUBLIC PROCUREMENT...................................................................................................................159
ANNEX VIII. REGIONS FOR ECONOMIC CHANGE INITIATIVE...................................................................160
ANNEX IX. COOPERATION WITH THE BALTIC SEA COUNTRIES...............................................................161
ANNEX X. RECOMMENDATIONS ON STRATEGIC ENVIRONMENTAL IMPACT ASSESSMENT OF OPERATIONAL PROGRAMMES IMPLEMENTING THE LITHUANIAN STRATEGY FOR THE USE OF EUROPEAN UNION STRUCTURAL ASSISTANCE FOR 2007–2013.......................................................................162
2

LIST OF FIGURES
Figure 1. Labour productivity by sectors of the economy in 2002–2005, LTL/hour......................7Figure 2. Structure of value added created by industries in 2005, %..............................................7Figure 3. Labour productivity in sectors of manufacturing industry by countries in 2003, EUR’0008………………………………………………………………………………………....8Figure 4. Structure of products sold by high and medium-high technology industries...................9Figure 5. Structure of products sold by low and semi-low technology industries...........................9Figure 6. Investment share of GDP in 2005, %.............................................................................10Figure 7. Share of investments by businesses in GDP in 2005, %................................................11Figure 8. Goods exports and exports of goods of Lithuanian origin in 2000–2005, LTL m. .....12Figure 9. Structure of products sold by main industries in 2005 (preliminary data provided by the Department of Statistics), ..........................................................................................................14Figure 10. Structure of exports of goods of Lithuanian origin by goods chapters, 2005..............14Figure 11. Annual volumes of FDI in Lithuania, LTL m..............................................................18Figure 12. Annual FDI per capita in the new EU Member States, EUR .....................................18Figure 13. Share of GDP created by SMEs in 2001–2004, %.......................................................22Figure 14. Structure of active SMEs according to type of economic activity as of the end of 2001–2004, % ...............................................................................................................................23Figure 15. Infrastructure of public services for business...............................................................26Figure 16. Ratio between expenditure for RD and GDP in Lithuania, ..................................31Figure 17. Expenditure for R&D by financing sources in Lithuania in 2004. .............................33Figure 18. Innovation businesses by types of economic activities in 2002–2004, % ...................34Figure 19. Cooperation partners of innovative businesses............................................................35Figure 20. Factors hindering innovations, of total number of businesses according to high importance ...........................................................................................................................36Figure 21. Volumes of cargo carriage by rail in Lithuania in 2000–2005.....................................48Figure 22. Dynamics of passenger carriage volumes at Lithuanian airports in 1993–2005..........50Figure 23. Number of 110 kV transformer substations in the transmission network, by age......53Figure 24. Share of natural gas in the EU primary energy balance in 2004..................................55Figure 25. Administration scheme of the Operational Programme on Economy Growth…...…118
3

LIST OF TABLES
Table 1. Growth of GDP in Lithuania in 2001–2005......................................................................5Table 2. Comparison of GDP per capita by counties......................................................................6Table 3. Ratings of Lithuanian’s competitiveness factors in the European context......................15Table 4. Methodologies for determining competitive strength/weakness of Lithuania................15Table 5. Air emissions of pollutants..............................................................................................16Table 6. Energy consumption intensity in Lithuania.....................................................................17Table 7. FDI per capita by Lithuanian counties.............................................................................18Table 8. Annual demand for industrial lots for greenfield investments.......................................20Table 9. Employment of residents according to employment statistics, 2004–2005....................27Table 10. Key discrepancies between Lithuania and the EU average...........................................28Table 11. Participation of Lithuanian institutions in the EU Sixth Framework Programme for Research and Technological Development, 2002–2006 I half-year..............................................37Table 12. Main discrepancies between Lithuania and the EU average.........................................37Table 13. Discrepancies between Lithuania and the EU in the area of information society.........42Table 14. Lithuanian transport network.........................................................................................44Table 15. Share of gravel roads in the total Lithuanian road network...........................................45Table 16. Discrepancies between Lithuania and the EU in the transport sector...........................52Table 17. Discrepancies between Lithuania and the EU in the energy sector...............................57Table 18. SWOT analysis .............................................................................................................58Table 19. Breakdown of assistance by years and funds, EUR million..........................................99Table 20. Breakdown of assistance by priorities, EUR million.....................................................99
4

1. ANALYSIS OF CURRENT SOCIO-ECONOMIC SITUATION AND OF DEVELOPMENT PROSPECTS IN LITHUANIA
1.1. GENERAL OVERVIEW OF THE LITHUANIAN ECONOMY/ PRODUCTION SECTOR
Main statements: The rates of growth of Lithuanian economy are sufficiently high; however, the growth has
been caused by the opening of new European markets and high domestic consumption and borrowing rates. Therefore, if no internal sources for increasing competitiveness are sought, the growth may slow down.
Low and medium-low technology sectors prevail in the Lithuanian economy; value added created by them is low, which prevents the country from reaching high competitive positions in the global markets.
Although technological renovation in the economy has been on the rise, its rates are considerably lower than those of dynamically developing states and/or states of similar size, therefore, Lithuanian economy is characterized by low productivity in all sectors including those which sufficiently good growth performance.
Lithuania as an open economy with a small domestic market has insufficient levels of export of Lithuanian goods.
The rates of attraction of direct foreign investments is very low, while accrued FDI per capita is the lowest among European countries.
Information and communications technologies infrastructure is being developed, however, the development is not even throughout the country. Insufficient availability of public services into the electronic environment prevents optimization of business processes.
There are almost no strategic investors whose business strategy in Lithuania is based on investments in the development of intellectual capital rather than lower operating costs.
The infrastructure of public services for business is in the initial stage of development. The intensity of provision and quality of services to businesses are insufficient.
Clusterisation and partnership networks are underdeveloped. Industry is the sector of the Lithuanian economy characterized by highest energy-
consumption rates.
General economic situation in Lithuania and analysis of key economic sectors
Compared to the economy of the European Union, Lithuanian economy is rapidly growing. In 2001–2005 the growth of Lithuania’s GDP was 7.6% on average – one of the highest among the EU Member States
5

Table 1. Growth of GDP in Lithuania in 2001–2005.2001 2002 2003 2004 2005
Growth in Lithuania’s GDP, % (at comparative prices of 2000)
6,4 6,8 10,5 7,0 7,5
Source: Department of Statistics under the Government of the Republic of Lithuania.
Macroeconomic environment in Lithuania is considered to be stable. In 2004, Lithuania’s macroeconomic stability index accounted for 90.4% of the EU-15 index1. Stable macroeconomic situation results in relatively high international competitiveness ratings, however, this in substance is a pre-condition for rather than a factor of competitiveness. Stable macroeconomic position is a pre-condition for the emergence and growth of competitiveness, therefore, it must be maintained. However, macroeconomic environment is not a specific factor of competitiveness, i.e. it does not by itself increase businesses’ ability to compete under rapidly changing conditions2.
Despite rapid growth in 2004 Lithuania’s GDP per capita was as low as 48% of the EU average. Furthermore, according to economists3, in 2006–2008 GDP growth will slow down due to various factors such as cyclic character of economic development, forecast growth in interest rates, and “cooling” of the domestic market. The present rapid economic growth can be explained by significant falling behind European countries in terms of development, therefore, the growth arises from natural and unavoidable integration processes.
An analysis of GDP/cap. by counties for 2000–2004 shows that there are considerable discrepancies in economic development of Lithuanian counties and such discrepancies are not diminishing (see Table 2). The ratio between the highest (Vilnius county) and the lowest (Tauragė county) GDP/cap. has grown in 2000–2003 from 2.16 to 2.65 and a slight decrease was observed only in 2004, when the ratio was 2.62. During the entire period from 2000 till 2004, only two counties (Vilnius and Klaipėda) exceeded the national average of GDP/cap., while in other counties this value was lower (and in Tauragė and Marijampolė counties much lower) than the national average. Deviations from the average are marked and are still increasing. In 2000, GDP/cap. in Vilnius county exceeded the national average by 33.4%, while in Tauragė county it accounted for just 61.7% of the average. In 2004, GDP/cap. in Vilnius county was already 44.3% above national average, while in Tauragė county in 2004 DGP/cap. it still accounted for only 55% of the average.
Table 2. GDP per capita by counties GDP per capita, LTL’000 Compared to national average, %
2000 2001 2002 2003 2004 2000 2001 2002 2003 2004
National average 13,1 13,9 15 16,4 18,2 100 100 100 100 100
Alytus county 10,7 11,2 11,6 11,9 12,9 81,9 80,2 77,1 72,5 71,1
Kaunas county 12,6 13,7 14,1 15,8 17,5 95,9 97,9 94,2 96,1 96,1
Klaipėda county 14,8 15,4 16,2 17,5 18,7 112,7 110,3 108,5 106,5 102,9
Marijampolė county 9,6 9,4 9,9 11,3 11,8 73,2 67,7 66,4 68,6 65,1
Panevėžys county 11,8 12,4 13 13,7 15,4 90,4 89 86,6 83,1 84,5
Šiauliai county 10,2 10,4 11,1 12,4 13,7 77,5 74,4 74,1 75,2 75,6
Tauragė county 8,1 8,5 8,7 8,9 10 61,7 60,8 57,9 54,1 55
Telšiai county 11,2 12,1 12,5 13,9 16,2 85,3 86,7 83,4 84,6 89,3
Utena county 11,1 11,6 12,4 14 15,1 84,5 83,4 82,6 85,1 83,2
1 In 2004 the value of the EU-15 macroeconomic stability index was 4.93, Lithuania’s index - 4.46. Source: The Global Competitiveness Report, 2004 according to the Comprehensive Study of Sources (Factors) of Growth and Competitiveness of the Lithuanian Economy, Vilnius, 2006, p. 9.2 Comprehensive Study of Sources (Factors) of Growth and Competitiveness of the Lithuanian Economy, Vilnius, 2006, p. 253, 247.3 AB SEB Vilniaus Bankas. Lithuanian Macroeconomic Overview, 4 (24), March 2006.
6

Vilnius county 17,5 19 21,5 23,6 26,2 133,4 136,3 143,3 143,4 144,3Source: Department of Statistics under the Government of the Republic of Lithuania.
Labour productivity is steadily increasing in Lithuania, however, the rate of growth is insufficient: in 2004 the overall labour productivity in the country accounted for only 41.7% of the labour productivity (GDP created by the economy per working hour) of the old EU Member States4. According to this indicator Lithuania is above only its closest neighbours Latvia and Estonia, however, it lags behind other new EU Member States: Czech Republic (49,9%), Poland (47,6%), Slovenia (66%) and Slovakia (52.8%). Further economic growth is threatened by insufficient changes in overall labour productivity during recent years5 (2.6% growth in 2004, 3% in 2005) and by the slowdown or even decrease in labour productivity in certain sectors (see Fig. 1).
Figure 1. Labour productivity by sectors of the economy in 2002–2005, LTL/hour
Source: Calculated according to data provided by Department of Statistics under the Government of the Republic of Lithuania.
Manufacturing industry is the most important sector of Lithuanian economy in terms of creation of value added (see Fig. 2) and it accounts for the largest share of the country’s export: 60% of its products are exported.
4 EUROSTAT, Labour productivity per hour worked.5 Average value added created by a worker during 1 hour.
0
10
20
30
40
50
60
70
80
90
100
Manufacturing industry
Supply of power,gas and water
Building Domest.trade Transport,warehousing
Commu-nications
Financialintermediation
Real estate etc.
Labo
ur p
rodu
ctiv
ity, L
TL/h
our
2002 2003 2004 2005
7

Figure 2. Structure of value added created by industries in 2005,
Source: Department of Statistics under the Government of the Republic of Lithuania.
However, the rate of growth in labour productivity in the manufacturing industry has decreased in recent years, which shows the need for the modernization of industry and investment into new technologies. In addition, productivity of Lithuanian industry is still considerably lagging behind the EU Member States: according to EUROSTAT, in 2003 the ratio between the value added and the number of workers in the manufacturing industry was approx. 7 times lower than the EU-25 average. According to the same source, Lithuania’s productivity indicator is 7–9 times lower than those of United Kingdom and Germany and approx. 2 times than those of Estonia and Czech Republic even in wood processing industry, where the advantages of Lithuanian enterprises are traditionally recognized (see Fig. 3).
Manufacturing industry
22%
Education5%
Agriculture6%
Public administration and defence
5%
Health and social work
3%Mining
1%Real estate
ad other activities10%
Power, gas and water supply
4%Construction
8%Domestic trade
18%Hotels and restaurants
2%
Transport, warehousing
10%
Financialintermediation
3%Communications
3%
8

Figure 3. Labour productivity in sectors of manufacturing industry by countries in 2003, by countries, EUR’000
Source: EUROSTAT.
Unsatisfactory labour productivity rates are partially determined by a small share of the product created by high and medium-high technology sectors6 in the country’s industry as a whole.
According to the Lithuanian Department of Statistics, in 2005 the product created by high and medium-high technology sectors accounted for just 16.1% of the industrial products sold (see Figures below). Another reason for low labour productivity is low value added created by traditional sectors accounting for the largest part of the Lithuanian economy.
6 According to NAC classification defined by EUROSTAT and OECD. This term is used further in this document:High and medium-high technology sectors: medicines industry, production of medical chemical products and botanical products (24.4), production of chemicals and chemical industry products (24 except 24.4), production of office equipment and computers (30), production of radio, television and communications equipment and devices (32), production of medical, high-precision and optical devices and clocks of various types (33); production of other electric machinery and equipment not elsewhere classified (31), production of motor vehicles, trailers and semi-trailers (34), production of railway and tramway locomotives and rolling stock (35.2), production of aircraft and spaceships (35.30), production of motorcycles and bicycles (35.4), production of other transport equipment not classsified elsewhere (35.5), production of other machinery and equipment not elsewhere classified (29), also the knowledge-intensive high-technology service sectors: post and telecommunications (64), computers and related activities (72), research and development (73).
020406080
100120140160
Wood and wood
productsindustry
Furniture industry Textile industry Chemicals industry
Machine building
Belgium Denmark G.Britain Germany Czech R. Estonia Latvia Poland Lithuania
Labour productivity, thousands E
UR
9

Figure 4. Structure of products sold by high and medium-high technology industries (share in total sales: 16.1%).
Source: Department of Statistics under the Government of the Republic of Lithuania, 2005
Figure 5. Structure of products sold by low and medium-low technology industries (share in total sales: 83.9%).
Source: Department of Statistics under the Government of the Republic of Lithuania, 2005
In Lithuania the largest part of value added is created by the service sector, however, the growth in labour productivity and in value added per worker of the service sector is unsatisfactory as in this sector the introduction of process- and technology-related innovations is quite complicated, while highly-qualified labour force is the main factor of productivity.
In macroeconomic terms, material investments or investments in the formation of capital base is the main precondition for long-term growth of the economy. This, in part, reflects a traditional view that growth in productivity is related to the increase in the share of capital-intensive business sectors/businesses, which results in a higher GDP per capita.
According to EUROSTAT, in 2005 the share of investments in the formation of capital base of GDP in Lithuania was 22.3%, exceeding the average of the old EU Member States (19.8%). However, this value was lower than those of most new Member States (see Fig. 6), with the value of China, which is marked by increasing competitiveness and influence in the global economy, being as high as 45.6% in 2004.
Office equipment and computer
industry 0.1
Radio, TV and comm.equipment industry
, 2.6
Chemicals
industry 5.6
Motor vehicles, trailers and s.trailers industry
0.4
Medical, precision and optical devices industry
0.8
Other transport equipment industryį
1.9Machinery and equipment 2.4
Electrical machinery and equipment industry
2.3
Foodstuffs and beverages industry
17.5 Refined oil products industry
30.3
Other (less than 4%), 17.2
Rubber and plastic articles industry
4.0
Furniture industry and other production not elsewhere classified
4.4
Sewing of clothing, hide industry
4.9
Wood and wood products industry
(except furniture) 5.7
10

Figure 6. Investment share of GDP in 2005, %
0 5 10 15 20 25 30 35
Belgija
Čekija
Danija
Vokietija
Estija
Latvija
Lietuva
Lenkija
Didžioji Britanija
Vengrija
Slovėnija
Slovakija
% nuo BVP
Source: EUROSTAT.
Concerns are aroused by the fact that in Lithuania the majority of capital formation costs, which are of particular importance in order to achieve higher productivity and competitiveness of industries, are formed of investments into buildings, engineering structures and land (68% in 2005) rather than of productive investments in equipment and machinery (32% in 2005)7.
Furthermore, according to EUROSTAT, in 2004 the share of Lithuanian business investments in the national GDP structure exceeded the average of the old EU Member States (Lithuania 18.5%, EU-15 average 17.1%) to a lesser extent that the share of total investments in GDP and was lower than that of most new EU Member States (see Fig. 7).
7 Department of Statistics under the RL Government, www.std.lt. 11

Figure 7. Share of investments by businesses in GDP in 2005, %
0 5 10 15 20 25 30
Belgija
Čekija
Danija
Vokietija
Estija
Latvija
Lietuva
Lenkija
Didžioji Britanija
Vengrija
Slovėnija
Slovakija
% nuo BVP
Source: EUROSTAT.
Although at present knowledge and innovations are considered to be the main driver of economic growth and are in the centre of growth strategies adopted by most developed countries, Lithuania is a country of transitional economy and medium income, therefore, the importance of capital base formation as a productivity growth factor should not be underestimated; it must be coordinated with the qualifications improvement and creation of knowledge in target areas in order to achieve long-term economic growth.
International trade is of great significance for Lithuania as a state with a small domestic market. Although growth trends prevail in the export of goods and services (in 2005 there was a 26.9% growth in both types of export), however, lately the share of re-export has been increasing: last year re-export volume increased by more than 40% and accounted for more than 1/5 of total export volumes. The increase in the exportation in products of Lithuanian origin was more moderate last year – by nearly 23% (LTL 25.6 billion in 2005); mineral products (whose value was increased by leaps of oil product prices) excluded – by just 16% (LTL 16.76 m) (see Fig. 8).
12

Figure 8. Goods exports and exports of goods of Lithuanian origin in 2000–2005, LTL m
Source: Department of Statistics under the Government of the Republic of Lithuania.
Production of Lithuanian industries is increasingly aimed at foreign markets. In 2005, export sales accounted for 60,1% of products sold by the mining, quarry and manufacturing industry (or 52,6 % excluding sales of refined oil products). Industries producing foodstuffs and beverages, construction materials and ceramic products target mainly the domestic market.
The structure of products sold by individual industries is shown in Fig. 9.
0
5000
10000
15000
20000
25000
30000
35000
2000 2001 2002 2003 2004 2005
Goods export Export of goods of Lithuanian originExport of goods of Lithuanian origin excl. mineral products
13

Figure 9. Structure of products sold by main industries in 2005 (preliminary data provided by the Department of Statistics),
Source: Overview of Economic and Social Condition of the Economy of the Republic of Lithuania in 2005
Manufacture and mining and quarryingManufacture of food products and beveragesManufacture of textilesManufacture of wearing apparel; dressing and dyeing of furManufacture of wood products Manufacture of pulp, paper and paper product industryManufacture of refined petroleum productsManufacture of chemicals and chemical productsManufacture of other non metallic materialManufacture of machinery and equipmentManufacture of electrical machinery and apparatusManufacture of radio, television and communication apparatusManufacture of rubber and plastic products
An analysis of exports by classes of goods (Fig. 10) shows that mineral products, machinery and electric equipment, textiles and textile articles, vehicles and equipment, and products of chemical and allied industries accounted for the largest part of Lithuanian exports in 2005.
14

Figure 10. Structure of exports of goods of Lithuanian origin by goods chapters, 2005, %
Source: Department of Statistics under the Government of the Republic of Lithuania.
As economic growth of Lithuania largely depends on the development of export, promotion of export-oriented business is essential. Furthermore, more rapid growth of re-export of investment goods compared to that of import of the same goods testifies to insufficient increase in the domestic demand for such goods and confirms the aforesaid statement about insufficient investment into productivity-increasing measures.
Evaluation of International Competitiveness of Lithuanian Economy
Labour, capital, knowledge and entrepreneurship are the factors of economic growth. The level of development of these factors as well as their use in economic activities determines, on its turn, the main condition of the country’s sustainable growth – competitiveness of the national economy on international scale. Competitiveness is always related to productivity, however, whereas productivity shows the position of the economy in the short term, competitiveness shows it in the long term. Competitiveness and productivity of Lithuanian business are relatively low and insufficient compared with performance of European undertakings.
Furthermore, it has been established that8 competitive advantages of most businesses, which are “statistically” classified as high-value-added sector businesses, are based not on knowledge and innovations but on relatively lower operating costs, i.e. lower wages and cheaper raw materials compared to the old EU Member States or basic technologies introduced in previous years. In particular, this can be said about traditional industries whose competitiveness has traditionally been based on low labour cost.
As the main factor of competitiveness – cheap qualified labour force (in terms of productivity) – has been exhausted for Lithuania, the national economy loses the basis for long-term growth, in particular taking account of the growth of the Asian economies and increasing competitiveness of Asian industries on an international scale. This issue concerns the EU economy as a whole, not only Lithuania, however, it is and will be most painful for the Lithuanian economy as it is dominated by traditional industries with low value added.8 Comprehensive Study of Sources (Factors) of Growth and Competitiveness of the Lithuanian Economy, Vilnius, 2006, p. 257.
34,6
6,8
10,28,9
2,6
36,9
V. Mineral products
VI. Chemicals industry
XI. Textiles and textile articles
XVI. Machinery and mechanical equipment
XVII. Vehicles
Other products
15

According to the Global Competitiveness Report published by the World Economic Forum, in 2001–2005 Lithuania’s rating of growth in competitiveness was between 36 and 43 (the number of countries participating in the surveys is increasing every year). In 2001, Lithuania was 43 among 75 participating countries, in 2002 – 39 (among 80), in 2003 – 40 (among 102), in 2004 – 36 (among 104), and in 2005 Lithuania descended to the 43rd position again (among 117 countries of the world, although only 2 new EU member states demonstrated better performance than Lithuania).
Three factors of competitiveness should be identified within the framework of the Operational Programme on Economic Growth: “2. Technology Level: Innovation and Dissemination of Technologies”, “7. Sophistication of Businesses” (both of them having unsatisfactory indicators) and “6. Domestic Competition and Formation of Clusters” (see Table 3).
Table 3. Ratings of Lithuanian’s competitiveness factors in the European context.Lithuania’s position on Europe Strong Neutral Weak
1 Macroeconomic environment 8 3 10
2Technological level: innovations and spread of technologies 0 4 17
3Human resources: education, health care and labour productivity 3 4 4
4 Public infrastructure 0 1 75 Public administration institutions 1 5 216 Domestic competition and clusterisation 1 6 47 Sophistication of businesses 2 9 138 Environmental protection 0 4 5
Note: Each indicator of relevant factor is assessed in comparison with indicators of the 29 European countries within the range (Strong-Neutral-Weak). The number of indicators within each category is presented in the Table.Source: Comprehensive Study of Sources (Factors) of Growth and Competitiveness of the Lithuanian Economy. Vilnius, 2006, p. 123.
Each factor of competitiveness presented in Table 3 above has been assessed using relevant indicators. For example, 21 indicators have been used for the competitiveness factor “Macroeconomic Environment” (probability of recession, influence of terrorism upon business, sophistication of financial market, strength of banks etc.). Lithuania’s relative position among the 29 European states (25 EU Member States and 4 EEA states – Switzerland, Norway, Israel and Iceland) has been estimated according to each of these indicators, rating it as “strong”, “neutral” or “weak” in accordance with the methodology presented in Table 4 below.
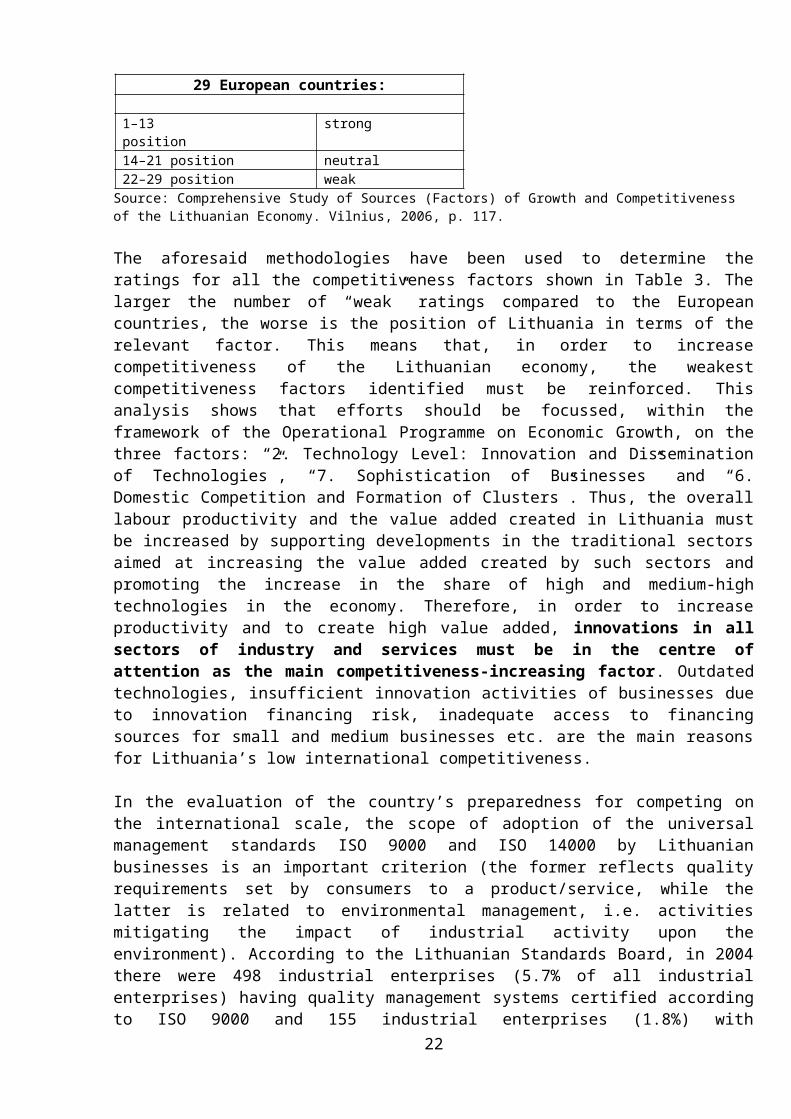
Table 4. Methodologies for determining competitive strength/weakness of Lithuania
Lithuania’s position in the ratings of 29 European countries:
1–13 position strong 14–21 position neutral22–29 position weak
Source: Comprehensive Study of Sources (Factors) of Growth and Competitiveness of the Lithuanian Economy. Vilnius, 2006, p. 117.
The aforesaid methodologies have been used to determine the ratings for all the competitiveness factors shown in Table 3. The larger the number of “weak” ratings compared to the European countries, the worse is the position of Lithuania in terms of the relevant factor. This means that, in order to increase competitiveness of the Lithuanian economy, the weakest competitiveness factors identified must be reinforced. This analysis shows that efforts should be focussed, within the
16

framework of the Operational Programme on Economic Growth, on the three factors: “2. Technology Level: Innovation and Dissemination of Technologies”, “7. Sophistication of Businesses” and “6. Domestic Competition and Formation of Clusters”. Thus, the overall labour productivity and the value added created in Lithuania must be increased by supporting developments in the traditional sectors aimed at increasing the value added created by such sectors and promoting the increase in the share of high and medium-high technologies in the economy. Therefore, in order to increase productivity and to create high value added, innovations in all sectors of industry and services must be in the centre of attention as the main competitiveness-increasing factor. Outdated technologies, insufficient innovation activities of businesses due to innovation financing risk, inadequate access to financing sources for small and medium businesses etc. are the main reasons for Lithuania’s low international competitiveness.
In the evaluation of the country’s preparedness for competing on the international scale, the scope of adoption of the universal management standards ISO 9000 and ISO 14000 by Lithuanian businesses is an important criterion (the former reflects quality requirements set by consumers to a product/service, while the latter is related to environmental management, i.e. activities mitigating the impact of industrial activity upon the environment). According to the Lithuanian Standards Board, in 2004 there were 498 industrial enterprises (5.7% of all industrial enterprises) having quality management systems certified according to ISO 9000 and 155 industrial enterprises (1.8%) with environmental management systems certified according to ISO 14001 in place. Lithuania, just like other new EU Member States, lags behind the old Member States according to the number of ISO 9000 certificates issued. In this respect, only Hungary and Slovenia stand out – these countries are active participants in the international technological networks.
The insufficient spread of quality control mechanisms in Lithuania9 shows both Lithuanian businesses’ poor preparedness for international competition and limited potential for increasing production efficiency (the importance of the aforesaid quality control mechanisms for the increasing of products’ competitiveness and efficiency has been internationally recognised). Lack of guarantees for product quality and of quality control mechanisms shows that there is no strong basis for innovativeness at businesses.
During the period 2000–2004, only in 2001 emissions of pollutants into the air had noticeably decreased in absolute terms (see Table 5); in this period industrial emissions into the air increased 1.62 times (from 56,200 t in 2000 to 91,200 t in 2004). In general, emissions into the air have been reduced by 16% during the past decade, however, in industry they increased by 40% in the same period. There have been positive trends in the ratio between the pollutant emissions into the air and the GDP. In 1995 this ratio was 20.4 t/GDP LTL m; during the decade it decreased nearly 3 times – to 7 t/ GDP LTL m.
Table 5. Air emissions of pollutantsThou. Tons1995 2000 2001 2002 2003 2004
Total emissions 522 445,6 414 417,2 423,6 438,7T / LTL m GDP 20,4 9,7 8,5 8 7,4 7Industry 65 56,2 62,9 64,1 80,1 91,2Energy 176 191,3 186,9 182,5 170,5 162,6Transport 281 198,1 164,2 170,6 173 184,9Source: Department of Statistics under the Government of the Republic of Lithuania.
9 Comprehensive Study of Sources (Factors) of Growth and Competitiveness of the Lithuanian Economy. Vilnius, 2006.
17

Industry remains the most energy-intensive sector of the economy (see Table 6). The energy intensity of industry has decreased 2.2 times over the past decade. In the service sector, the decrease has been insignificant during 2000–2004 (1.09 times), however, since 1995 energy intensity has halved both in this sector and in the economy as a whole.
Table 6. Energy consumption intensity in Lithuania Tons of oil equivalent (TOE) / million LTL of GDP1995 2000 2001 2002 2003 2004
Overall 122,4 79,5 77,5 75,2 69,8 68,1Agriculture 59,7 27,7 29,4 29,6 25,8 26,5Industry 104 58,8 52,5 54,3 49,2 47,1Construction 16,9 15 12,9 12,6 11,3 11Transport 28 23 23,6 22,9 21,2 21,8Services 31,5 16,4 15,7 15,2 15,2 15Households 44,2 29,3 28,1 26,4 24 22,2Source: Department of Statistics under the Government of the Republic of Lithuania.
The dynamics of energy consumption and energy intensity in Lithuania is in line with the average EU trends: there has been an increase in final energy consumption (according to EUROSTAT, a 10.9% growth in EU-25 in 1995–2004), while energy intensity is decreasing (according to EUROSTAT, a 9.3% decrease in EU-25 in 1995–2004).
Foreign Direct Investments
Many EU Member States place emphasis upon the improvement of investment environment in order to increase competitiveness on international scale as foreign direct investment (FDI) is one of the most important factors creating favourable conditions for technological progress and economic growth. FDI is an important source of formation of capital base and competences, therefore, attracting FDI, in particular in knowledge-intensive or technological breakthrough areas, is essential to Lithuania if it wishes to secure long-term economic growth and re-orientate business toward creation of higher value added. Lithuania has accumulated research potential in certain strategic areas that are competitive on the international scale, therefore, this forms a basis for the attraction of strategic investments to knowledge-intensive sectors even from the USA or Asian countries. In this way the European Union’s competitiveness and attractiveness for investors would be promoted.
Different indexes are used to compare FDI volumes and effectiveness on international scale. UNCTAD (United Nations Conference on Trade and Development) investment indexes such as the Inward FDI Performance Index and the Inward FDI Potential Index are among the most widely used. Lithuania’s performance as measured by these FDI indexes has been positive in the past decade. According to the Inward FDI Performance Index, Lithuania has risen from the 78 th position in the UNCTAD rating in 1990–1992 to the 55th position in 2001–2003. According to the Inward FDI Potential Index, in 1990–1992 Lithuania was in the 70th position and in 2003–2004 – in the 47th
position.
However, recent trends in attracting FDI to the Lithuanian economy are not satisfactory:
firstly, there is no explicit increasing trend in the recent years’ annual FDI volumes: a comparison of the annual FDI volumes shows marked fluctuations (see Fig. 11);
secondly, according to the comparative FDI indicators Lithuania significantly lags behind some new EU Member States such as the Czech Republic, Estonia and Hungary (see Fig. 12).
18

Figure 11. Annual volumes of FDI in Lithuania, LTL m
1394,8 1361,3
2338,7
1750,9
1085,21324,6
2521,9
515,6
2493,2
0
500
1000
1500
2000
2500
3000
1996 1997 1998 1999 2000 2001 2002 2003 2004
Source: Calculated according to data provided by the Department of Statistics under the Government of the Republic of Lithuania.
Figure 12. Annual FDI per capita in the new EU Member States, EUR
Source: EUROSTAT.
Differences in FDI by counties testify to economic discrepancies among Lithuania’s regions (see Table 7): the lower the level of development of a region, the lesser the region’s attractiveness to foreign investors. In Vilnius County, FDI per capita was LTL 11,721 at the beginning of 2005, exceeding the national average by more than 2 times.
Table 7. FDI per capita by Lithuanian countiesFDI per cap. at year beginning, LTL Compared with national average, %
2001 2002 2003 2004 2005 2001 2002 2003 2004 2005
National average 2678 3068 3808 3976 4727 100 100 100 100 100
Alytus county 1162 784 758 1026 933 43,4 25,6 19,9 25,8 19,7
Kaunas county 1725 1874 2260 2675 2751 64,4 61,1 59,3 67,3 58,2
Klaipėda county 2966 3363 3547 4038 4561 110,8 109,6 93,1 101,6 96,5
Marijampolė county 142 325 392 419 604 5,3 10,6 10,3 10,5 12,8
Panevėžys county 1271 1515 1545 2299 2491 47,5 49,4 40,6 57,8 52,7
Šiauliai county 419 449 488 514 537 15,6 14,6 12,8 12,9 11,4
Tauragė county 160 146 109 170 163 6 4,8 2,9 4,3 3,4
Telšiai county 478 95 3102 4311 6619 17,8 3,1 81,5 108,4 140
Utena county 586 1109 1831 1390 1120 21,9 36,1 48,1 35 23,7
Vilnius county 7032 8232 10010 9581 11721 262,6 268,3 262,9 241 248Source: Department of Statistics under the Government of the Republic of Lithuania.
0200400600800
10001200140016001800
Czech R.Estonia Latvia LithuaniaPoland Hungary Slovenia Slovakia
EUR
19

Foreign investors’ behaviour has been changing, and not to Lithuania’s benefit: recently, there has been a trend for directing spare capital and business to those countries which have high domestic market capacity and good prospects for the purchasing power increases (China, India, Brazil, (partly) Russia)10. Cheap qualified labour force – the main competitive advantage of Lithuania – is no longer a chief motive for selecting investment locations. Furthermore, as wages have been increasing at a higher rate than labour productivity, Lithuania will not be able to make use of this advantage in the nearest future. Therefore, Lithuania has to search for and develop other competitive advantages such as qualified labour force, availability of new specialists trained under new specialised curricula, flexibility and effectiveness of local small and medium-size enterprises (hereinafter referred to as SME), service quality and availability of scientific potential – all of which can determine Lithuania’s competitive advantage in the eyes of foreign investors.
Lithuania’s opportunities in the competition for foreign investments are diminished, among other things, by such circumstances as too detailed regulation of labour market relations, lack of territories earmarked for investment attraction (investment areas), underdeveloped business support infrastructure and overall business environment, too bureaucratic and complicated procedures for the acquisition of land and issue of building permits etc. In particular, potential investors often encounter in Lithuania such obstacles as incomplete restitution procedure in respect of land lots, fragmentation of lots where a land lot of acceptable size consists of several lots owned by different persons, unclear procedure for the transfer of public land to municipal ownership, lack of opportunities for investors to acquire land in a way other than auction, limited opportunities for land disposal by municipalities etc.
In 2004 alone, 36 foreign companies were looking for an opportunity to invest and failed to invest through the lack of satisfactory conditions. Almost LTL 1.4 billion were not invested and over 4,800 jobs were not created11.
Attraction of investments (both local and foreign) is largely limited by the nearly total lack of fully prepared investment areas with infrastructure. According to the findings of an analysis of the demand for industrial lots in Lithuania (2005)12, the area of territories prepared for investment totalled 13.4 ha, mainly around the capital Vilnius. The estimated annual demand for industrial parks with complete infrastructure, suitable for investment, amounts to 98 ha13. Four regions account for the majority of the demand: Vilnius (35 ha/year), Kaunas and Šiauliai (15 ha/year each) and Klaipėda (10 ha/each).
If conditions for meeting this demand are not created, FDI that are a potential source of growth and competitiveness of the Lithuanian economy will leave Lithuania aside. Therefore, in order to create most favourable conditions for foreign capital investment, first of all the establishment of industrial parks with complete or partial infrastructure must be promoted. However, FDI attraction factors are not limited to the establishment of physical infrastructure – they are related to the overall business environment, qualifications of businesses and labour, and favourable conditions for research and development. Focus should also be placed on the investment attraction policy pursued by the public authorities (both central and local), which should be aimed, first of all, at attracting 10 AB SEB Vilniaus Bankas. Lithuanian Macroeconomic Overview, 4 (24), March 2006.11 According to the Lithuanian Economic Development Agency.12 Project on Assistance to Greenfield Investment in Lithuania, Technical Report No. 2 “Forecast of Industrial Lots Demand in Lithuania”, ECORYS Nederland BV, 2005.13 Ibid
Table 8. Annual demand for industrial lots for greenfield investments Region Demand, haAlytus 3Kaunas 15Klaipėda 10Marijampolė 4Panevėžys 5Šiauliai 15Tauragė 2Telšiai 6Utena 3Vilnius 35Lithuania total 98Source: Project on Assistance to Greenfield Investment in Lithuania, Technical Report No. 2 “Forecast of Industrial Lots Demand in Lithuania”, ECORYS Nederland BV, 2005.
20

high and medium-high technologies and at support for technology transfer, taking local business structures, employee qualifications and prevailing industries into consideration. Account must be taken of the fact that favourable business environment enhances the impact of FDI upon the economy and promotes the spillover effect.
Overview of Joint Business Activities
A qualitatively new role of cluster and network formations – alliances is one of the four key elements of the “new rules of game” in international competition.
Lithuania is not in a position to achieve international competitiveness in all the industries. It has neither resources nor competences for this purpose. Therefore, it is important to select the correct basis for competitiveness. It is also clear that it is difficult for individual market players (irrespective of whether they are representatives of business, research or public administration) to achieve the quality required by the new economy. The key to achieving this is partner networks, clusters and other forms of joint activities as only such structures generate the synergy effect, each interest group realises its objectives in the most effective way, and a relative advantage is created.
Names for groups of businesses and organisations as well as their specific features vary from country to country (clusters, industrial regions, local business systems, competence networks etc.). However, they have common characteristic – joint efforts to derive maximum benefit through cooperation and competition both outside and inside the group. The efficiency of the group as well of the macro system (the industry, the region, and the state) depends on the number of efficient entities forming the group as well as on the efficiency of each of them. An effective cluster functioning on partnership basis contains flows of knowledge exchange, which are intensive due to both internal and external competition and which stimulate innovations and competitive advantage and economic growth of such group.
During the past few years a number of different studies on the formation of clusters in Lithuania have been carried out.
Clusterisation processes have been most active in the wood and furniture industry; there are certain initiatives in clothing, machine and food production industry.
Machinery and apparatus industry is characterised by perhaps the greatest degree of fragmentation: the range of articles produced by the enterprises is very wide. From the standpoint of clusterisation, it is both an advantage and deficiency. At present it is too early to assert that this industry has features characteristic of clusters. One may see a lot of cooperation links between enterprises of the same sub-branch and between different sub-branches, however, in most cases the relations are not stable and mainly involve mutual supplies; the degree of partners’ involvement in joint activities is low. A competence cluster for mechatronic solutions is the most tangible potential cluster, in the establishment of which a number of enterprises and research organisations are interested.
Wood-processing and furniture industry is fully mature for an informed and targeted clusterisation. A number of micro-clusters can be identified in this industry. By its nature, wood-processing and furniture industry is favourable for the formation of regional clusters. The sector has been developing rapidly, however, closer cooperation with mechatronics and information and telecommunications (ITC) business would result in speedier modernisation of production.
Despite unfavourable international developments, textile and clothing industry has a potential of remaining an important part of the Lithuanian economy. Deep and, at the same time, horizontal clusterisation is one of the key conditions for survival and further growth for most enterprises of this industry for which clothing is final product of operations. As the Lithuanian textile and clothing industry is quite fragmented, there is a number of enterprises whose operations are not related or
21
little related to the production of clothing; operations of some of the enterprises have been quite successful. A lot of embryonic cluster developments can be observed, however, often even the enterprises themselves do not notice the depth of and opportunities provided by the relations and, therefore, do not make use of potential benefits.
The Integrated Study into the Sources (Factors) of Growth and Competitiveness of the Lithuanian Economy conducted at the beginning of 2006 identifies several main reasons why establishment of clusters in Lithuania is slow:
- lack of trust among clustered entities;
- discrepancies in the technology and management level of different businesses. This is important in order to create a sustainable chain of value creation, with quality services provided / operations performed by individual actors;
- underdeveloped business information systems. The present systems are of low quality; they are rarely used or not known at all by businesses. Also, there is a lack of quality information relations among businesses in the same sector except for information about related areas of activities, markets etc.;
- lack of competencies and experience in working with partners. Management of clusters, networks, cooperation ties and virtual business systems differs from usual management. At present Lithuanian enterprises and organisations have a very limited number of people with such competences;
- lack of entrepreneurship. Entrepreneurship is understood as an activity by an entity – a business, research organisation, state institution etc. – whereby high objectives are consciously adopted and there exist capabilities to pool resources of the entity with those of other stakeholders in order to attain the objectives in an innovative manner;
- ineffectiveness of professional and branch associations. Associative structures are an important element forming the core of a cluster. If it is absent, management and promotion of processes become more difficult;
- ineffectiveness of innovation system. Innovativeness is one of distinctive features of clusters. Innovative processes are determined by the structure of the cluster and the logic of joint activities. However, there is also a reverse dependence: an environment favourable for innovations is required for the establishment of innovative clusters. Lithuania has almost all components of the national system of innovations in place for the moment; however, the system itself has received critical evaluation and is not effective. The operation of the innovation business programme has also been ineffective; relations between research organisations and businesses are insufficient.
The aforesaid reasons show that integrated measures should be used to promote clusterisation processes, such as strengthening of relationship between businesses and research organisations, formation of innovation-friendly environment, creation of conditions for the transfer of partnership experience, support for different joint activity initiatives, and building of businesses’ capacities to use the existing competences and knowledge and to manage business processes effectively.
The Role of SMEs in the Lithuanian Economy
Small and medium-sized enterprises prevail in Lithuania just as in most other states. In 2000–2004 the share of SMEs in the total number of active enterprises was stable and amounted to 99.4% on average. At the end of 2004, micro-enterprises (less than 10 employees) accounted for 75.9% of all active SMEs (75.5% of all active enterprises). The role of SMEs in the Lithuanian economy has been increasing: SMEs create an increasingly larger share of GDP; in 2004 this share accounted for 69.1% of GDP (59.3% in 2001).
22

Figure 13. Share of GDP created by SMEs in 2001–2004, %
Source: Department of Statistics under the Government of the Republic of Lithuania, 2005
An analysis of SMEs distribution by economic activities in 2004 shows (see Fig. 14) that most of them operated in the trade sector (38.1% of all SMEs); services sector in on the second place (24.8%). In 2004 15.11% of all SMEs operated in the industrial sector. In 2001–2004 the share of industrial enterprises in the total number of SMEs was stable and was 15.6% on average, whereas in 2004 compared to 2001 the share of SMEs providing services increased by 1.6 percentage point and accounted for 24.8% of all SMEs.
Figure 14. Structure of active SMEs according to type of economic activity as of the end of 2001–2004, %
Source: Department of Statistics under the Government of the Republic of Lithuania, 2005
Trade – Industry – Services – Construction – Other activities
The role of SMEs in the national economy has been increasing due to changes on the labour market and the impact of globalisation upon competitiveness of industries, especially the role of those SMEs that are small, flexible, easily transformable, niche-order-oriented, service-oriented, and can make operational changes quickly and adapt to the dynamic environment. Therefore, it is important to implement measures to improve business environment, aimed at the establishment of SMEs and increase of competition. To meet SMEs needs, special awareness-increasing, consulting, business incubation etc. measures should be developed and access to different financing sources should be improved.
Access to Finance for Businesses
23

Ensuring appropriate and timely financing both in the initial and further phases of operation is one of the main challenges in business.
Lithuanian businesses’ requirement for external financing has been growing along with the quite speedy economic growth. According to the findings of a survey14, about 50.5% of the country’s businesses approach national financing institutions for business financing; small enterprises account for about 49% of them. Service firms are most active in this respect, although industrial enterprises are also quite active in seeking additional financing for business. Financing is mainly required for investments in equipment; followed by investments in other tangible assets; taking over of accounts receivable; and acquisition of raw materials and stocks. Investments in innovations are on the fifth place. Businesses mainly use services provided by banks and financial lease companies. According to survey results, in the future businesses intend to continue to approach mainly banks.
The Lithuanian financial market is well developed, however, investors and credit institutions are reluctant to finance venture projects, especially those undertaken by new businesses. The need for external credits caused by rapid economic growth and the credit institutions’ attempts to minimise loan portfolio administration costs have resulted in a situation where credit institutions give priority to large and medium businesses with historical operations and applying for large loans; although a gradual reversal in this trend is observed. Furthermore, financing of innovations and early development phases using debt instruments is not widely used due to quite high risks. The problem also lies on the demand side, i.e. unpreparedness of small business for bank financing, lack of collateral and information on financing instruments.
To promote the financing of innovations and early development phases using debt instruments, State guarantee institution Plc “Investment and Business Guarantees” (UAB “Investicijų ir Verslo Garantijos” – INVEGA) was established in 2001 by resolution of the Government. The company provides guarantees to banks for loans to SMEs and is responsible for the administration of partial payment of interest on such loans.
Nevertheless, other state-supported SME financing instruments actively offered by the European Commission are used very passively or not used at all, e. g. provision of small loans (microcredits) to start-ups is not active, venture capital foundations do not actively finance new innovative projects proposed by businesses.
In the European Union a lot of attention is devoted to microcredits as this is both – an important instrument to increase entrepreneurship and economic growth and a tool to resolve employment problems of certain social strata. This is particularly relevant to enterprises established by former unemployed, women or young people. Lithuanian credit institutions are not active enough in making microcredits to start-ups. Among commercial banks, only Šiaulių Bankas AB has been offering a special microcrediting service, i.e. credits ranging from EUR 1,500 to 30,000 to SMEs from the funds of the European Bank for Reconstruction and Development. In the middle of 2006, Šiaulių Bankas, Medicinos Bankas UAB and DnB NORD Bankas AB started giving microcredits up to EUR 25,000 (or equivalent) from public funds, first of all to microbusinesses. Other commercial banks operating in Lithuania also showed active interest and participated in the selection procedure, however, the public funds available were not sufficient to meet the requirement – which may be up to LTL 100 m per annum – in full. In addition, credit unions also make small loans to their members.
The Lithuanian venture capital market is still underdeveloped, whereas in the European Union venture capital foundations are widely used to finance businesses. The amount of such foundations established in the EU since 1980 exceeds EUR 200 billion. In Lithuania the amount of venture capital invested in the decade from 1 January 1995 till 1 January 2005 totalled LTL 1.4 billion; 166 investment projects were implemented. During the past decade, Lithuania’s annual venture capital investments per 1 million population were 5 times smaller than the EU average; the number of
14 Research work on Measures to Improve Financing Opportunities for Small and Medium Business (2004).24

businesses that had attracted venture capital investments (per 1 million population) was 4 smaller than the EU average15.
The country’s venture capital market is lagging behind the EU Member States mainly in the area of providing funding to innovation projects and start-up businesses. Promoters of venture projects first of all encounter a lack of seed capital – many excellent business ideas are not capable of attracting such capital16. In Lithuania, venture capital for the start-up and development of innovative business in the past decade accounted for just 19% of the EU average. 15% of the venture capital was used to finance starting up businesses; 19% - for ICT. The average venture capital amount per investment is quite large and amounts to LTL 8.2 m.
Lithuania’s venture capital market, particularly in terms of financing of innovative businesses and start-ups, is underdeveloped both due to supply and demand problems. Risk capital foundations tend to invest in companies with a history of operations rather than start-ups; they also prefer large investments with the probability of higher return-on-investment. The problem of information asymmetry remains – investors lack information on innovative projects and operations of start-ups. Whereas the problem on the demand side arises due to deficiencies of preparation of venture investment projects, lack of information on financing instruments and opportunities, and lack of financing instruments. Therefore, in order to minimise problems related to access to finance, integrated actions to consistently and systematically form the supply and the demand are required.
Ratings of the Lithuanian Business Environment and Business Competitiveness
According to the results of an analysis of 145 countries made by the World Bank and the International Finance Corporation (Doing Business in 2005)17, Lithuania is among the top 20 countries of the world with the most favourable business environment. However, it should be noted that this relatively high rating has been mainly determined by macroeconomic indicators.
Ratings of Lithuanian business activities are not so favourable. Lithuania lags behind the EU Member States according to level of entrepreneurship: in 2004, the indicator of the number of businesses/self-employed persons per 1,000 population was 42.8 compared to the EU average of 55. According to the Business Competitiveness Index18 that assesses the quality of management and strategies of businesses as well as the national environment for the adoption of business decisions, Lithuania’s rating for 2005 was as low as 41 (during the year it fell down from 36), falling behind most EU Member States except for Poland (42 position), Malta (46) and Latvia (48).
The main problems of the Lithuanian business environment and the businesses’ activities, in particular innovation activities, are related to the:lack of working capital and insufficient access to finance (in particular venture capital financing) by businesses, in particular SMEs;underdevelopment of public services and related infrastructure necessary for the establishment of enterprises and business development;insufficient scope of attraction of FDI;insufficient promotion of joint activity forms (clusters, partnerships etc.).
Services to Business and Related Infrastructure
15 Analytical Work on the Investment Portfolio of Venture Capital Funds in Lithuania, 2004.16 Beniušytė, J. Rizikos kapitalo fondų investicinis portfelis Lietuvoje, http://www.std.lt/uploads/apzvalga/L061-069.pdf17 The report Doing Business in 2005 does not take account of such EU-25 states as Luxembourg, Cyprus and Malta, therefore, information on EU-22 is further used.18 The Global Competitiveness Report 2005-2006.- Hampshire: Palgrave Macmillian, 2005.- ISBN: 1-4039-9844-2.
25

The European Commission recognises19 that the EU is not using its entrepreneurship potential in full and the rates of establishment of new businesses are too low. In Lithuania the level of entrepreneurship is very low too (at the beginning of 2005, 16 active SMEs (excluding self-employed) per 1,000 population). Lack of knowledge and fear of starting a business are among the factors affecting entrepreneurship. Furthermore, it is noted that the growth of existing enterprises can be dampened both by increased competitive pressures and by such market deficiencies as limited financing opportunities and inability to conduct integrated research and innovation activities, participate in networks and supply chains. In most EU documents on SME policies, increasing of public awareness, development of business consulting and similar services as well as improving quality of and access to such services is recognised as reasonable and proper instruments for increasing entrepreneurship. Development of high-quality public services to business focussed on the elimination of market deficiencies is a precondition for ensuring a speedier growth of SME sector and competitiveness in Lithuania. As the infrastructure of public services for business is young, Lithuania should assume best foreign practices in the area of public services for business as well as instruments that have proved to be useful in order to promote entrepreneurship and reduce the aforesaid market deficiencies.
The infrastructure of public services for business in Lithuania primarily includes non-profit organisations of different types such as business information centres, business incubators, technological business incubators, science and technology parks and innovation and technology centres established with the participation of state/municipal authorities and agencies performing functions related to economic development, promotion of business and development of technologies and innovation.
In 2005, there were 42 business information centres, 7 business incubators (including 1 technological business incubator)20, 6 science and technology parks21, 2 innovation centres etc.
19 Commission Communication Implementing the Community Lisbon Programme Modern SME Policy for Growth and Employment, KOM (2005) 551, 2005.10.11.20 Regional business incubator of Kaunas Technological University (formed in 1998), Alytus business incubator (1998), Vilnija businesss incubator (1998), Telšiai county business incubator (1998); Šiauliai business incubator (1999); Kazlų Rūda business incubator (2000); Ignalina NPP business incubator (2002). 21 Science and technology park (formed in 1993), Kaunas high and information technology park (2002), Šiaurės Miestelis technology park (2003), Klaipėda science and technology park (2002), Visoriai IT park (2002) , Šiauliai University science and technology park (2002). Technology parks currently under formation include TECHNOPOLIS in Kaunas, BIOPOLIS in Vilnius as well as Saulėtekio Slėnis (Vilnius).

Figure 15. Infrastructure of public services for business
The formation of the infrastructure for public services’ has started not long ago; most of the entities are in the early phase of formation. Lately attention has been focussed on the development of the entities’ physical infrastructure and the reinforcement of their technical facilities. Although the infrastructure and technical facilities’ development phase has not ended as yet, shortcomings in terms of the content, quality and accessibility of services provided by the entities are becoming increasingly apparent, therefore, investments are required in this area, in particular in the adopting of best practices from foreign states. It may be difficult to attain the set objectives in the area of growth in entrepreneurship without making use of this factor in full. In addition, it is important to improve the content and to increase the scope of services for existing businesses seeking competitiveness and growth opportunities.
As regards public infrastructure for business, based on experience of the EU Member States, the Nordic countries in particular, the creative sector should be separated out due to specific infrastructure required for its development22. In promoting entrepreneurship, for Lithuania it is important to develop the creative business sector, mainly micro- and small businesses that flexibly use the national cultural traditions and human creative potential; the sector covers architectural, design, fine art, stage art and other trades creating products and services representing the Lithuanian content. According to the Department of Statistics to the Government of the Republic of Lithuania, in 2002 the creative sector accounted for 2% of GDP, generating an income of LTL 2.1 billion (LTL 2.4 billion including state grants). Income by creative businesses has increased by almost 10% during a year (including state grants). For comparison purposes one may point out that in the United Kingdom creative businesses account for over 5% of GDP23. Promotion of creative businesses is an important measure to increase the value added created in the service sector, innovativeness of businesses, and residents’ entrepreneurship.
22 Public institution VšĮ Menų Spaustuvė has started activities in Vilnius; in the nearest future, another 4 specialised creative centres (incubators) will be developed in Vilnius, Kaunas, Klaipėda and Šiauliai. 23 M. Starkevičiūtė, Kūrybinių ekonominių veiklų indėlio į Lietuvos ekonomiką įvertinimas [Evaluation of the Input of Creative Economic Activities into the Lithuanian Economy], 2003, Vilnius.
Science and technology parks Business incubators Innovation centres Business information centres

Equal Opportunities in Business
The share of women remains smaller than the share of men in the total number of employers and self-employed persons. In 2004, women accounted for 38.3% and in 2005 – for 37.7% of the employers and self-employed persons (see Table 9). In 2005, only 10.7% (2004 – 11.8%) of all women in employment were employers or self-employed persons, while the majority of women were employees (85.4 % in 2005 and 83.8% in 2004).
Table 9. Employment of residents according to employment statistics, 2004–2005 2004 2005 Total, thou. By gender, % Total, thou. By gender, %Women Men Women Men Women Men Women Men
Total 702,5 733,8 48,9 51,1 723 750,9 49,1 50,9Employees 588,8 580,8 50,3 49,7 617,3 606,7 50,4 49,6Employers and self-employed persons
82,9 133,8 38,3 61,7 77,7 128,6 37,7 62,3
Family members 30,8 19,1 61,7 38,3 28 15,5 64,4 35,6Source: Department of Statistics under the Government of the Republic of Lithuania
The share of women managers in the total number of managers has markedly increased over the past 5 years: from just 29.2% in 2000 to 43% in QII of 2005.
Women are actively using the public services for business. According to the findings of the survey of 48 business information centres and business incubators carried out by the Lithuanian Small and Medium-Size Business Development Agency, women accounted for the larger part (60% on average) of the customers at almost all entities. According to EUROSTAT, in QII of 2005 the share of women managers in Lithuania exceeded the EU-25 average
Structural Funds Assistance in 2004–2006
The implementation of Lithuania’s Single Programming Document for 2004–2006 (SPD) has shown active interest of businesses in the EU Structural Funds (SF) assistance. In 2004–2005, 413 project applications under the SPD measure “Direct Support for Business” were received. The total amount required for the projects under the applications (LTL 1.25 billion) was 16 times larger than the amount available to the Ministry of Economy of the Republic of Lithuania for contracts for 2004–2005. During this period, 26 assistance agreements totalling LTL 198.9 were concluded, including 4 agreements with start-ups.
Projects on modernisation of businesses and innovations accounted for the majority of the projects (57%), while projects on research and development and on formation of relationship between industrial entities/businesses and research organisations accounted for just 17% of all the applications filed in 2004–2006. In the first half of 2006, 51 modernisation and innovation projects and 8 R&D and cooperation projects were underway.
In 2004–2006, the demand of SF financing for infrastructure and service-for-business projects was relatively high: 131 applications were submitted. 38% of applications intended for the improvement of the SMEs support system despite the fact that no new entities were established in the networks of services for business, while the existing entities were implementing projects under the services-for-business programme and other projects financed from the national budget and other sources. The

number of applications for other activities under the SPD measure “Improvement of Business Environment” was numerous as well: 17 applications for the formation of industrial zones and promotion of green field investments, 17 for science and technology parks, 12 for the improvement of the image of Lithuanian products and services, and 29 applications by associated business structures. It should be noted that in 2006 associated business structure were very active in the filing of applications (22% of the applications in 2006). It is expected that, in the course of implementation of these projects, services will be provided to over 14 thousand SMEs and support will be provided for the formation of 6 industrial zones and 4 science and technology park.
Comparison of DiscrepanciesTable 10. Key discrepancies between Lithuania and the EU average
Indicator of discrepancy Year Lithuania EU average
Evaluation
Labour productivity per hour compared with EU-15 average, %
2004 41,7 100 Large discrepancy
Entrepreneurship rate, number of businesses and self-employed persons (under business licences or registered individual business) per thou. population
2004 42,8 55 Medium discrepancy
Accumulated FDI per capita, LTL 2004 4 727 24 378 Large discrepancy
Annual venture capital investments per 1,000,000 population, LTL m
2004 74,5*** 233,5 Large discrepancy
*** Calculated according to the data provided in J. Beniušytė’s article “Investment Portfolio of Risk Capital Funds in Lithuania” (source: Beniušytė, J. Rizikos kapitalo fondų investicinis portfelis Lietuvoje. http://www.std.lt/uploads/apzvalga/L061-069.pdf ) (in 2004, venture capital investments amounted to LTL 256 m in Lithuania) and the Department of Statistics (average annual population number in Lithuania was 3.435 m).

1.2. RESEARCH AND DEVELOPMENT. INNOVATIONS
Main statements: Competitiveness of Lithuanian businesses is relatively low and insufficient, which is largely due
to insufficient innovation activities. According to international innovativeness ratings Lithuania is considerably below the EU-15 average, being in the lowest position among the new EU Member States.
The level of investment in research and development is low in Lithuania, in particular in terms of Lithuanian businesses’ investments in R&D.
Lithuania’s public sector’s expenditure for research is close to the EU average, however, both subjects and results of research conducted by universities and institutes do not match business needs; results suitable for commercialisation are lacking.
Research facilities do not meet modern standards; insufficient capacities limit the performance results and effectiveness of research.
Most investments made by businesses do not result in long-term advantages or technological dominance in the market.
Underdevelopment of the system of financial support instruments, in particular for SMEs and higher-risk projects.
International Rating of Lithuania’s Innovativeness
According to the summary innovation index (SII) published in the European Commission’s document “European Innovation Scoreboard 2005”24, the highest innovation score was assigned to Sweden (0.72) and the lowest to Turkey (0.06). Lithuania’s innovation performance has been rated as 0.27. According to its score Lithuania is as low as on the 24th position among 33 countries, with the Czech Republic, Poland, Slovakia, Latvia and some others behind it. Lithuania’s score is markedly below the EU-25 average and, the more so, from the average indicator of EU-15 (0.42 and 0.46 respectively).
Lithuania’s lag compared to the EU innovation leaders is mainly due to the low level of investments in research and development (R&D). Furthermore, it should be noted that Lithuania occupies the lowest positions among European countries according to such innovativeness-related indicators as overall technological level, number of patents, number of the Internet users and PCs, and licensing of foreign technologies. According to the Network Readiness Index annually calculated by the World Economic Forum, in 2004–2005 Lithuania lagged behind most EU Member States except for Latvia, Poland and Slovakia, occupying the 43rd position among 102 states of the world (EU-25 average: 29th position).
Most innovation performance indicators of Lithuanian businesses are lower than the EU-25 average. For example, in 2004 Lithuanian businesses’ expenditure for innovations accounted for 81% of the EU-25 average (Lithuania is on the 12th position according to this indicator) and less than one-third (31%) of Lithuanian businesses have implemented non-technological innovations, which accounts for just 63% of the EU-25 average (16th position according to this indicator).
The number of researchers working in Lithuania’s business sector is very small. According to the Department of Statistics to the Government of the Republic of Lithuania, in 2004 the number was 58925, including only 103 persons with a degree. Compared with the total number of researchers in
24 European Innovation Scoreboard 2005: Comparative analysis of Innovation Performance. The summary innovation index (SII) is obtained by recalculating 18 most popular statistical indicators used to compare innovation status in different countries. According to the methodology of calculation of the index, the lowest possible evaluation for EU-25 group is 0 and the highest - 1 score.25 Number of employees working for the main employer.

the country, researchers working at businesses account for only 6.7%. According to this indicator Lithuania is at the bottom of the EU Member States ratings.
It is only one innovation performance indicator according to which Lithuania stands out positively among the EU Member States – cooperation by the country’s businesses in innovation activities as Lithuania is characterised by active interaction and cooperation among businesses in this area). According to this indicator Lithuania is on the 4th position among EU-25, exceeding the EU-25 average by as much as 34%.
The first innovation support instruments in the form of subsidies were introduced, in a very limited scope, relatively recently – in 1999 (only LTL 89,000 was allotted for this purpose in 1999). At the same time the formation of public infrastructure of services for business (a network of entities) was started.
According to the findings of a survey carried out in 200526, only 10.1% of innovation businesses received financial support from public authorities in 2002–2004 (in the form of tax credits or concessions, grants, subsidised loans or loan guarantees). 6% of innovation businesses received funding from the state budget, while 4.4% from the EU assistance programmes. The survey has established that almost one half of the businesses (47.7%) received useful information for new innovation project from internal sources, 29.2% from customers and consumers, and 26.9% from equipment or materials suppliers. Many businesses received information on innovations from fairs and exhibitions (18.4%) and from competitors or other enterprises in the market (12.9%). Only 2.9% of businesses received the information from state research institutes, universities or other higher schools.
The findings of the survey initiated by the PHARE 2001 Economic and Social Cohesion Twinning Project on Innovation Capacities in 2004 are relevant in this context: it has been established that nearly 90% of Lithuanian businesses still lack information on innovations. Nearly 83% of the respondents answered that they were not knowledgeable about the writing of an innovation project to obtain the EU funding.
Investment in Research and Development and Innovations in Lithuania
In recent years expenditure for research has been increasing in Lithuania both in absolute and relative terms. In 2004 the expenditure amounted to LTL 472.7 m, accounting for 0.76% of the GDP. However the scope of funding of research in Lithuania is much smaller than in the EU (EU-25) on average27 and is among the smallest both among all the EU Member States and the new Member States.
26 Development of Innovations. Department of Statistics under RL Government, 2006.27 According to EIS (European Innovation Scoreboard) 2005 Database, in 2003 EU-25 countries alloted on average 1.95 of GDP as public investments in research (in both public and business sector), Lithuania - 0.68 of GDP.

Figure 16. Ratio between expenditure for RD and GDP in Lithuania,
Source: Department of Statistics under the Government of the Republic of Lithuania.
Insufficient R&D funding results in quite poor performance indicators for R&D and innovation activities, e. g.:compared to the EU average (per 1 million population), the number of Lithuanian publications in the journals on the list of the Institute of Scientific Information is four times smaller28;Lithuania has a relatively small number of inventions or technological solutions to be patented: in 2002 the total number of patent applications per 1,000,000 population was just 2.6 in terms of applications to the European Patent Office and 0.5 to the US Patent and Trademark Office, whereas the EU-25 average was 133.6 and 71.3 respectively29; the indicator of high-technology patent applications per 1,000,000 population submitted by Lithuanian inventors to the European Patent Office was 1.3 in 2002 and to the US Patent and Trademark Office – zero, while the EU-25 average was 26 and 9.4 respectively30.
Public Financing of R&D
As regards public sector expenditure for R&D, Lithuania’s indicators are not very different from the EU average: according to EIS 2005, in 2003 public financing of R&D in the EU-25 states accounted for 0.69% of GDP on average, in Lithuania – 0.54%. According to the Lithuanian Department of Statistics to the Government of the Republic of Lithuania, in 2004 the funding allotted for R&D by the public sector, i.e. the authorities and higher educational establishments, accounted for 0.48 % of GDP.
Nevertheless the efficiency of use of the public sector funds for R&D in Lithuania is low. Although considerable research potential has been accumulated in individual areas (such as biotechnologies, lasers, electronics etc.), its realisation is not satisfactory. One of the main reasons for this is insufficiently close cooperation among research organisations, universities and economic entities in conducting research and developing new products and technologies for the market.
The matching of the themes of research with the business needs is poor; results suitable for commercialisation are lacking. At present only 7% of public funding are received by Lithuanian higher educational establishments and research organisations on tender basis; the remaining part of
28 Comprehensive Study of Sources (Factors) of Growth and Competitiveness of the Lithuanian Economy, Vilnius, 2006, p. 161.29 EIS (European Innovation Scoreboard) 2005 Database.30 European Innovation Scoreboard 2005: Comparative analysis of Innovation Performance.
0,480,55 0,53
0,6
0,07
0,190,11 0,14 0,16
0,590,67 0,66 0,67
0,76
0,52
00,10,20,30,40,50,60,70,8
2000 2001 2002 2003 2004
Public sectorBusiness sector Total
GD
P %

funding is almost not related to their performance results and is allotted according to such criteria as the number of students and/or staff, curricula indicators etc. Therefore, one of the most important tasks in this area is to increase the relevance of public research for business and to encourage activity of researchers and investigators in developing and testing of new products and technologies jointly with businesses. With this aim in view, is it especially important to support joint R&D projects implemented by businesses and research organisations, at the same time encouraging business investments in R&D as well as more active involvement of researchers and investigators in the economic development processes.
The issue of research facilities remains important for research in Lithuania. With few exceptions, public research facilities are worn out and insufficient. Even though Lithuania has a relatively high human potential of research, the lack of modern research equipment restricts the range and scope of research subjects and hinders the increase in research efficiency. Direct financing of the research facilities, which is not based on actual needs of businesses, i.e. on the opportunities for putting the research results into practice, is ineffective and does not contribute to economic growth to sufficient extent. Therefore, it is important to support, on competitive basis, the establishment and development of joint research centres, whose activities would be aimed at results suitable for commercialisation, first of all in the R&D areas in which private business groups/clusters are ready to invest as well as in the technological breakthrough areas identified by the State. This should be done within the framework of both public and private research organisations and universities.
Given the present condition of research facilities in Lithuania, the quality of higher education provided by Lithuanian establishments is doubtful; the Operational Programme on Human Resources Development, under which researchers’ and investigators’ scientific activities during the study process (on Levels I, II and III) are funded, should be aimed at the improvement of the quality of education in order to increase competences of researchers and investigators. University education should be aimed at the training of specialists required by businesses taking account of the potential technological breakthrough areas identified by the State. Without modern facilities, it is particularly difficult to train high-qualifications specialists in natural sciences and engineering31. Therefore, within the framework of the Operational Programme on Cohesion Promotion, the facilities for the training of highly-qualified specialists necessary for business should be strengthened as part of financing of the educational, study and research establishments’ infrastructure.
Business Investment in R&D and Innovation
The level of business investments in R&D is still low in Lithuania compared with investments in the EU-25 countries. According to EIS 2005, R&D financing by businesses in the EU-25 countries accounted for 1.26% of the country’s GDP on average, whereas in Lithuania – only for 0.14% (Lithuania was 22nd among the EU-25). It is also important to note that only 6.7% of all the researchers of Lithuania work at businesses, which is the lowest indicator among the EU Member States (EU-15: approx. 50%).
A comparison of public sector and private sector funding for R&D in Lithuania in 2004 shows that public sector investments are more than 3 times larger in scope than business investments (both costs of in-house R&D and costs of acquisition of such works) (see Fig. 17).
31 Comprehensive Study of Sources (Factors) of Growth and Competitiveness of the Lithuanian Economy, Vilnius, 2006, p. 165.

Figure 17. Expenditure for R&D by financing sources in Lithuania in 2004, %
Source: Department of Statistics under the Government of the Republic of Lithuania.
At the same time it should be noted that the level of business investments in R&D was largely determined by the structure of the Lithuanian business sector; businesses that can be characterised as high and medium-high technology businesses with the highest potential for consumption of research results account for a relatively small part of the sector. According to the Department of Statistics, the share of value added created by high and medium-high technology sectors accounted for 17.1% of the value added created by the manufacturing industry in 2004.
Nevertheless, investments in research and development play an important role in traditional industries and services. Furthermore, R&D is an important, but not the only source of knowledge used by businesses in developing innovations and providing them top the market.
The innovation performance of Lithuania’s businesses shows that they have poor capacities to create strategic innovations with a high value-added generating potential32:most innovations are aimed at suppliers or market changes and such innovations do not give a business long-term advantages or technological domination in certain markets;the number of business conducting strategic innovation activities is very small, which is directly related to underdeveloped R&D activities in business and industry. Such innovations are important first of all because they spread (both in terms of technologies and processes) to innovation activities of other entities. The presence of strategic innovation businesses determines the formation of innovation clusters that create high value added for the national economy. According to EIS 2005, the share of such businesses was very small in Lithuania (1%).
The number of businesses developing innovations based on modification of technologies is very small in Lithuania too. Such innovation activities are based on modification of existing products or processes without research. Businesses applying knowledge created by others in order to effectively service their target markets fall into this group. According to EIS 2005, such businesses accounted for just 4% of the total number of businesses in Lithuania.
According to EIS 2005, types of innovation activities relatively prevailing in Lithuania were continued innovations and adapted innovations – such activities were conducted by 11% of businesses respectively.
A comparison of Lithuanian businesses’ innovation activities with other EU Member States shows that strategic innovations is the area in which Lithuania’s lag is the greatest.
32 Comprehensive Study of Sources (Factors) of Growth and Competitiveness of the Lithuanian Economy, Vilnius, 2006, p. 149.
Public funds 63,1%
Higher education sector funding
6,0%
Private not-for-profitsector funding 0.3%
Foreign funding 10,7%
Business funds19,9%

A survey conducted in 200633 has shown that in 2002–2004 innovation activities in Lithuania34 were conducted by 23.4% of all businesses of the country. About 45% of all employed persons worked in businesses engaged in innovation activities. Turnover of such entities accounted for more than one half of the total business turnover (2002 – 59.5, 2004 – 56.9 of total turnover), which shows that such businesses are very important for the economy. Furthermore, it should be noted that small businesses (from 10 to 49 employees) accounted for more than one half of innovation businesses35.
The largest number of innovation businesses is found in the financial intermediation sector; the number of innovation businesses in the mining and manufacturing industry is also large (see Fig. 18).
Figure 18. Innovation businesses by types of economic activities in 2002–2004, %
Source: Development of Innovative Activities. Department of Statistics under the Government of the Republic of Lithuania, 2006.
According to the findings of the aforesaid survey, 16.7% of the businesses were introducing production process innovations36 and 13.9% – product innovations37. Part of the innovation businesses (8.4) were engaged in both product and process innovations.
While implementing innovations most businesses acquired new equipment (85.5% of all innovation businesses) and trained their employees (55.5%). 26.2% of innovation businesses carried out in-house R&D works and 15.6% of the businesses acquired R&D services externally. More than one half of the innovation businesses (53.3%) maintained cooperation links with other entities or 33 Development of Innovations. Department of Statistics under the RL Government, 2006.34 Innovation activities mean the acquisition of research, technological, designing and other equipment or technologies and introduction of such equipment/technologies and new methods of production organisation in order to produce technologically new or improved products (goods/services) and to improve processes as well as the conducting of research and development works provided that their are intended for the development of the business’ activities and/or employment of innovation in the form of product or technological process. Innovation activities cover the period from the emergence of the idea until the final result. 35 Innovation business means a business that has introduced in its activities new or significantly improved products and/or technological processes. 36 Technological processs innovation meas the employment of new and improved production methods (on market level or on a business level) by using new equipment or new methods of production organisation.37 Product innovation includes goods and services which differ considerably, by certain properties or applications, from goods/services earlier produced/provided in the market (by a business). As distinct from process innovations they are sold directly to customers.
23,4
34,031,2 29,7
19,3 17,9 16,4
52,7
29,8
0
10
20
30
40
50
60
Total Mining and quarries
Manufacturingindustry
Electricity, water and gas supply
Construction Trade Transport,warehousing and distant comm.
Financialintermediation
Other businessactivities

organisations in their innovation activities, however, only 8.7% of them carried out joint innovation projects with universities and higher educational establishments and divisions thereof (see Fig. 19), which confirms the above statement about poor cooperation among businesses and research organisations. Cooperation takes place mainly within the country (92.2% of the businesses that had taken part in cooperation activities stated that their partners were domestic organisations), however, international cooperation is quite active (European countries as partners were mentioned by almost one-half of the businesses (47.5%), while other countries – by 21.8%).
Figure 19. Partners of innovative businesses
Source: Development of Innovative Activities. Department of Statistics under the Government of the Republic of Lithuania, 2006.
Given the innovation performance of the country’s businesses and taking account of the fact that the majority of industrial enterprises (76.6%) are not engaged in any innovation activity, there is a need to actively promote creative innovation activities (by increasing the share of businesses conducting strategic innovation activity) and dissemination of innovations (technology transfer). It should be noted that the prevalence of adapted innovations is a natural phenomenon, which is necessary for Lithuania in this phase of transition to a developed economy when experience of developed countries in the field of technologies and techniques is adopted.
To promote creative innovation activities, human resources in R&D must be improved both quantitatively and qualitatively (the aim of Human Resources Development Operational Programme), cooperation of businesses and research institutions in joint innovation activities must be strengthened (establishment of joint research centres of businesses and research organisations and other initiatives are to be supported), establishment and reinforcement of technical facilities for the businesses’ R&D must be supported thus promoting business R&D.
Dissemination of innovations developed by others is furthered by the high indicator of inter-business cooperation in innovation area (34% above the EU average) and the functioning of the public infrastructure for business support and the innovation support network (innovation and

technology centres, science and technology parks, technology incubators etc., the activities of which must be encouraged in order to improve service quality and increase efficiency). To promote implementation of innovations created elsewhere in Lithuanian industries, support must be provided to the businesses’ investments, both those related to technology transfer/adoption and to the preparation for the production of innovative products and market expansion.
In the aforesaid survey, lack of financing (lack of own funds or external financing, too high innovation cost) was indicated by many businesses (37.3% of all enterprises) as one of the main obstacles to innovations; 25.8% of the businesses mentioned market factors and 18.4% – lack of information, qualified personnel or partners in innovation activities (see Fig. 20).
Figure 20. Factors hindering innovations, of total number of businesses according to high importance
Source: Development of Innovative Activities. Department of Statistics under the Government of the Republic of Lithuania, 2006.
24,8
15,5
23,4
10,7
3,9
4,2
7,8
21,1
10,8
29,8
18,3
24,2
12,8
4,4
6,2
10,6
23,1
11,4
20,7
13,6
23,3
9,1
3,6
2,7
5,7
19,8
10,5
0 5 10 15 20 25 30 35
Lack of funds in your business or group of businesses
Lack of financing from other sources
Too high cost of innovations (high innovation costs)
Lack of qualified personnel
Lack of information about technologies
Lack of information about markets
Difficulties in the search for innovation partners
Recognized firms dominate the market
Low consumer demandfor innovation goods/services
Services
Production
Total

It should be pointed out that, the smaller the business and the more significant the innovation, the greater the difficulties in coping with such market deficiencies without external help. Furthermore, Lithuania lacks technical facilities both for business R&D and for the introduction of innovations. Most businesses use old facilities and are not strong enough financially to assume an innovation risk higher than that related to core activities. Therefore, even those businesses that have new ideas are not in a position to realise them and to increase their competitiveness by putting innovations into practice as considerable investments must be made in testing, newly-developed products production, and production using new technologies acquired.
Participation in the EU Research Area
Lithuania was active enough in participating in the European Communities VI Research and Development Framework Programme (1,467 applications were filed in the period from 2002 till 1 June 2006), however, applications by SMEs accounted for just 16% of all applications (applications by large businesses 1%, associations 4%) (see Table 11). It should be noted that the application success indicator in this programme is about 20%, therefore, it is expedient to encourage Lithuanian businesses’ and organisations’ participation in the EU 7th Framework Programme for Research, Technological Development and Demonstration by compensating them for preliminary project costs and project preparation costs.
Table 11. Participation of Lithuanian institutions in the EU Sixth Framework Programme for Research and Technological Development, 2002–2006 I half-year
Applications % Eligible % Funded %Total 1467 100 511 100 295 100including:SMEs 234 16 89 17 44 15Large companies
10 1 4 1 2 1
Associations 55 4 14 3 9 3Share of applications
35 20
Source: International Science and Technology Development Programmes Agency
By participating in EUREKA, businesses have an opportunity to develop products that are competitive on an international scale. Both businesses and educational establishments participate actively in the programme: as of 1 June 2006, 55 Lithuanian organisations including 21 businesses, 21 universities and 6 institutes were participating in 24 projects.
It should be noted that the aforesaid issues related to R&D and technical facilities as well as solution of such issues are directly related to the opportunities for Lithuanian businesses, research organizations and universities to successfully join the EU research area as equal partners.
Development Discrepancies
Table 12. Main discrepancies between Lithuania and the EU average Discrepancy indicator Year Lithuania EU-25
averageEvaluation
Innovation index (SII), scores 2005 0,27 0,42 Large discrepancy

Number of patent applications filed to European Patent Office, per 1,000,000 population
2002 2,6 * 133,6 * Very large discrepancy
Expenditure for RD, of GDP 2005*** 0,76 1,9** Large discrepancy Public expenditure for RD, of GDP 2004 0,6 0,69* Small discrepancy Business expenditure for RD, of GDP 2004 0,16 1,26* Very large
discrepancy
* EIS 2005 Database.** EUROSTAT*** Provisional data. www.stat.gov.lt
1.3. DEVELOPMENT OF INFORMATION SOCIETY
Main statements: Increasingly more attention is devoted to information society development processes in
Lithuania. Formation of favourable legal environment and initiation of key projects in this area speeds up the implementation and use of information and communications technologies (ICT), creates conditions for the development of directly related processes.
Low general level of ICT use in the country is one of the main problems: only a very small part of population are using technologies, therefore, it is important to develop electronic services and electronic infrastructure, improve residents’ competences and create conditions for the development of e-business so that people would be able to receive better services from public and private sectors by using ICT and to make use of other information sources.
One of the greatest threats, which also arises on the global scale, is the emergence of new type of social divide due to unequal opportunities for the use of ICT. In order to reduce this threat more attention should be devoted to underprivileged elderly people, low-income persons and residents of smaller towns and villages.
A favourable trend is that more and more computers are sold in Lithuania, while largest cities of Lithuania are characterised by quite well-developed ICT infrastructure. There are many mobile telephone communication users in Lithuania.
Lithuania as a small country can be flexible in adapting to global trends taking account of rapidly changing circumstances as processes of development of the information society are very dynamic.
ICT infrastructure and its utilisation
Uniform development of advanced electronic infrastructure is a precondition for the use of ICT and abundant electronic content by Lithuanian residents and for successful development of business and increase of competitiveness by businesses. The regulatory environment in Lithuania’s communications sector is stimulating competition in this market: the Law on Telecommunication which entered into force since 1st January 2003 fully liberalised Lithuania‘s telecommunications market, and Law on Electronic Communications (which replaced the Law on Telecommunication since 1st May 2004) sets that regulation of electronic communications activities shall be based on the principles of effective management and use of limited resources, technological neutrality, functional equivalence, proportionality, minimal necessary regulation, legal certainty in a dynamic market, economic development, ensuring effective competition, consumer rights protection, objectivity of regulatory criteria, conditions and procedures, transparency and non-discrimination.
Lithuania can boast very high mobile communication growth rates: according to the European Commission, Lithuania’s indicator of mobile communication penetration in October 2005 was the second in the EU after Luxembourg (117 subscribers per 100 population) and the penetration has

been increasing most rapidly among all the EU Member States during the past two years; the number of mobile Internet users has grown in Lithuania 97 times during 3 years.
In order to ensure high-quality data transmission at high speed, development of advanced electronic services and creation of multimedia-based content, the development of broadband Internet is very important. Although the use of broadband Internet has been growing very fast in Lithuania (according to the Communications Regulatory Authority, it has grown by as much as 81.4% since 2004), only a small part of residents are using it at present (nearly 7 broadband Internet subscribers per 100 population as of the end of 2005). In 2005, the Government of the Republic of Lithuania approved the Strategy for the Development of Lithuania’s Broadband Communication Infrastructure for 2005-2010, aiming to create conditions for public administration institutions, agencies and persons to receive a broadband communication access, encourage competition in the market of the Internet access provision by using state and private capital investments, induce national social and economic growth, and reduce digital divide of the population within country’s territory. However, the competition in Lithuania’s broadband communications market exists only in areas of significant concentration of population (in cities of Lithuania, especially in Vilnius), while in rural areas, no competition nor satisfactory level of infrastructure exist. According to the studies, 99 % of population in cities in Lithuania have technical possibilities to connect to broadband infrastructure, while in rural areas of the country, only 16 % of population have such possibilities. In rural areas, there are no commercial initiatives of investment into broadband infrastructure because of small number of potential users, scattered settlements, and very long expected payback period for necessary huge investments. That is why “white areas” in rural parts of Lithuania exist, and digital divide between urban and rural areas in sector of broadband Internet communications increases. In order to fight this digital divide and to stimulate development of broadband infrastructure in rural areas of Lithuania, which are not commercially attractive, a project co-financed by EU structural funds in the 2004-2006 programming period is being implemented; this project will create basic broadband infrastructure connecting rural townships (only where such infrastructure is not available or where owners of existing infrastructure are not able to provide broadband services) and open access to this infrastructure for all private operators will be guaranteed (principles of open access and technological neutrality will be respected). It is expected that this project will stimulate development of broadband infrastructure in Lithuania, although it is only the first step combating problems of digital divide, and further initiatives of public and private sectors will be necessary.
Existing gaps between the IT users and no-users in terms of age, geography and income gives rise to a problem of digital divide. Although the scope of use of computers and the Internet is growing very rapidly in Lithuania, the issue of the Internet access remains unresolved. According to the Department of Statistics to the Government of the Republic of Lithuania, in 2005, 29% of households had a PC (in 2004: 25%, which means an increase by 4 points) and 14.4% of the households had the Internet access at home (an increase by 4 points during the year). Acquisition of computer equipment and the use of the Internet depends on household income: in 2005, 76% of households with income over LTL 1,500 had PCs and 51.4% of them were using the Internet; for the group of households with income up to LTL, the figures are 3.9% and 1.8% respectively.
In 2005, nearly 47% of Lithuania’s residents aged 16–74 were using a computer and 34% – the Internet. The majority of computer users are young people (computers are used by 89% of people aged 16–24 and only 4% of people aged 65–74). The divide in terms of IT use remains in the geographical respect as well (i.e. between urban and rural dwellers): in 2005, 36% of urban households (in the five largest cities – as much as 42%) and 14% of rural households had computers; 20% of urban households and only 4% of rural households had access to the Internet at home.
Lithuanian businesses are characterised by relatively high computer and Internet usage rates: according to the Department of Statistics, in 2005 computers were used by 91% and the Internet

was used by 85.2% of manufacturing industry and service sector businesses having 10 and more employees; 45.4% of them used DSL technologies for the Internet access.
For the time being, while the home Internet is available to only a small share of residents, initiatives for establishing public Internet access centres play an important role. Projects financed both by private sector and the public sector (the state budget of the Republic of Lithuania and EU PHARE) have been implemented in Lithuania. At present there are over 700 public Internet access centres; establishment of 400 more centres is anticipated on completion of a project funded by the EU SF assistance for 2004–2006. Furthermore, public libraries provide a free Internet service to their readers.
Electronic Content. Electronic Services and Their Use
Electronic content consistently developed along with the ICT infrastructure is an important precondition for the residents’ motivation to become active ICT users thus eliminating the digital divide. A consistent and timely electronic inclusion policy is required to ensure that residents can securely, conveniently and simply use new technologies (e.g. by implementing Lithuanian interfaces and safe content measures) to implement relevant digital content in the Lithuanian language. As the rate of mobile communication penetration is high, the digital content solutions should be adapted both to the Internet and mobile equipment. In addition, development of the digital content must take into account the need for solutions ensuring dissemination of the Lithuanian language and culture and the survival of the national feature in the multilingual digital environment.
When appropriately used ICT can become a tool enabling citizens to learn more about the authorities’ decisions pertaining to their life and to participate in the preparation thereof as well as to express their opinions and ideas, develop discussions and present argumentation in the environment where traditional border, distance and time barriers have no meaning. Now electronic democracy is mainly related to interactive consulting and voting, which allows citizens to express opinions on relevant issues; however, a wider range of technological solutions is possible depending on the demand, which is determined by the level of political culture in the society.
ICT enables a speedier, more convenient and simple provision of public services. The level of transfer of the basic public services to the electronic environment in Lithuania was 64% in 2005 (50% in 2004). Services for business are transferred to the Internet at a faster rate compared to those intended for residents: 76% of services for business and 56% of services for residents have been transferred to the Internet as of 2005 (in 2004 – 60% and 44% respectively). The following electronic public services are characterised by the highest level of development in Lithuania: filing of residents’ income and property returns, employment services, search for information in public libraries, social insurance contributions, customs declarations and provision of statistics. However, the transfer into electronic environment of the public health services, which are among the most relevant to residents, has been too slow: in 2005, only 25.4% of health care establishments had their websites, 9% provided online consulting, and only 3.7% indicated that they were providing an online registration service.
It should be noted that Lithuania lacks a developed transport information infrastructure, while its segments in place do not conform to the standard of the EU transport information infrastructure. Traffic control and travel security do not meet the growing needs of traffic participants; no ICT (intelligent transport system) services are provided to travellers in Lithuania as distinct from other EU Member States. ICT should also be implemented in solving the issues of rational use of natural resources, reduction of environmental pollution, reasonable urbanisation, effective control of emergencies in case of a threat to the environment or human health etc.

The rate of use of electronic public services is still not high: 15% of Lithuanian residents were using such services in 2005. The rate of use of the services by businesses is increasing: in 2005, 66% of businesses received information from state authorities via the Internet (62.2% in 2004); 68.4% downloaded different forms from state authorities websites; 50.9% filled in forms online and returned them to state authorities. In general, ICT are becoming a convenient tool for businesses: in 2005, 40.8% of entities in the manufacturing industry and services had their websites, 14.6% purchased and 5.8% sold goods and services via the Internet, and 7.6% were using the electronic public procurement system. Successful implementation of ICT in all processes increases efficiency and productivity of businesses as well as their competitiveness.
Provision of public services online has to be convenient. Surveys show that residents wish to receive all public services, e. g. related to retirement, on one-stop-shop basis. Business entities would also prefer receiving all the services necessary, e. g. for the building of a new structure, on the same basis. At present public registers and information systems of state authorities depend on the interoperability of their organisational and information modules, technological platforms used and individual technological interfaces. Modernisation of the infrastructure of public registers and information systems must be centred around uniform development strategies and practices and a uniform standardised interface that would allow creating a single information infrastructure underlying the provision of public services on one-stop-shop basis. Integrated provision of services requires interoperability of the systems of state authorities and other entities providing public services.
ICT can be used effectively when there is trust in them. Different security problems pose an important obstacle to the development of electronic services, electronic trade and many other important areas based on ICT development. In 2005 as much as 58% of Lithuania’s residents indicated that they were encountering computer viruses (34% in 2004), 49% – spam emails (26% in 2004), and 9% – hacking (9% in 2004). In order to create an attractive electronic environment, ICT users require security tools as well as detailed information on using them.
Residents’ Competences in ICT
People’s knowledge, qualifications and ability to use ICT are very important in an information society. According to the Ministry of Education and Science of the Republic of Lithuania, only about 0.5% of Lithuania’s residents hold ECDL certificates proving their computer skills. On the other hand, a large part of citizens say that they have good computer skills (48.6% of the population rate their computer competences as good, one third (36%) as weak, and 15% recognise that they have no computer skills). The level of capabilities to use ICT depend, to a large extent, on the place of residence (the share of rural dwellers rating their computer skills as good is much smaller than that of urban population) and on age (Lithuanian residents of older age rarely rate their skills as good, while people aged 18–25 give highest ratings). In order to avoid the threat of digital divide, both interest in and wish to learn to use ICT must be increased in certain resident groups.
State-of-the-art technologies open wide learning and teaching opportunities. In an information society, not the teaching subjects but the abilities and motivation of learners to continue learning are most important. Development of online learning, by forming conditions for lifelong learning, contributes to the improvement of people’s competencies and ability to changing social conditions and market effects.
Development of an information society increases the demand for competent specialists in information technologies and services as well as in consultants. Investments into renovation or development should be accompanied by improvement of specialists’ information and technology skills so that the implemented systems and networks are used effectively.

Future Trends
It is anticipated that the main problems hindering the development of information society in Lithuania (such as low general rate of ICT use, insufficient people’s competences in ICT, digital divide, relatively low rates of usage of public e-services and e-trade etc.) will be resolved by developing the ICT infrastructure in rural areas, speeding up of the transfer of public services into the electronic medium and implementing solutions promoting the development of e-democracy, ensuring interoperability of state registers and information systems, resolving the ICT security problems, increasing residents’ motivation, capabilities and skills, and pursuing the electronic inclusion policy. Dynamic processes of information society will open increasingly wider opportunities for Lithuania’s residents, irrespective of their place of residence, age and income, to quickly and conveniently receive public and private services, exchange information and communicate; for businesses – to optimise business processes, to increase productivity and competitiveness; for public sector institutions – to provide services according to customers’ expectations and wishes.
Table 13. Discrepancies between Lithuania and the EU in the area of information societyDiscrepancy indicator Year Lithuania EU average Evaluation of
discrepancyRegular Internet users, 2005 30* 43** Medium
discrepancyHouseholds having access to the Internet,
2005 14* 48** Large discrepancy
Level of on-line availability of basic public services,
2004 59* 65** Medium discrepancy
Businesses receiving orders online,
2005 6* 12** Large
Businesses making purchases online,
2005 13* 26** Medium discrepancy
Businesses having installed security tools in their computer equipment,
2005 58* 70** Medium discrepancy
Households using broadband connection,
2005 12* 23** Medium discrepancy
Number of public mobile communications subscribers per 100 population
2005 117* 92** None
Number of computers with Internet access per 100 pupils
2004 4* 9** Large discrepancy
Source: *Department of Statistics under the Government of the Republic of Lithuania** EUROSTAT data
1.4. TRANSPORT NETWORK
Main statements:
The number of traffic accidents is increasing while Lithuania lags behind Western European states in terms of the number of traffic safety measures and the rate of their implementation.
The intensity of traffic, in particular heavy transport, is increasing (especially on interstate roads), therefore, asphalt-concrete covering of roads not fit for heavy traffic flows is degrading.
As road infrastructure development works are carried out, the differences between the condition of Lithuania’s main roads and the remaining roads are deepening.

Technical and technological parameters of railway infrastructure do not allow full meeting of the increasing demand for cargo carriage and ensuring appropriate quality of passenger service.
Underdevelopment of infrastructure connections with the EU Member States and third countries do not allow full utilisation of transit opportunities and development of multimodal transport.
Insufficient capacities of airport and flight control infrastructure given the rapidly growing demand for air transport services.
Due to underdevelopment of infrastructure of Klaipėda Seaport and related transport infrastructure (railway hub in the seaport, access roads and railways to/from the seaport) Lithuania is not using the available transport, transit and sea tourism potential in full.
Underdeveloped infrastructure of internal waterways restricts the development of recreational, passenger and cargo navigation.
Lack of public logistic centres hinder effective interaction among modes of transport in the development of multimodal transportation services.
Lithuania, just as other countries with developing economies, has an objective to ensure rapid growth of the national economy and increase of competitiveness. Through the allocation of public investments the national economy development policy strives for maximum economic growth in the short term. Improvement of transport infrastructure if one of the key priorities of such investment. The mission of Lithuania’s transport system is to ensure sustainable mobility for the members of the society and transportation of goods to maintain the dynamic development of the economy and to increase Lithuania’s competitive capacity in global markets. The Long-Term Strategy of Development of the Lithuanian Economy by 2015 provides for a rapid growth of the economy by 2010 and for the annual GDP growth by 7% on average; the demand for transport services will increase along with this.
Transport remains a rapidly developing industry that ensures effective functioning of the domestic market, provision of foreign trade and transit services, passenger service and development of tourism. The share of transport sector in the GDP was 9.6% in 2005 (LTL 6.2 billion), which is by 19% more than in 2004, while the number of people engaged in the sector accounted for 5.3% of all employed people in the country. The share of GDP falling to the transport sector exceeds the EU average nearly two times. Furthermore, constantly increasing volumes of transport services’ export demonstrate the role of the transport sector in the country’s economic growth: in 2005, these volumes exceeded LTL 4.4 billion (a 17% growth compared to 2004).
Lithuania’ joining the EU has resulted in changes in the macroeconomic environment. This has improved conditions for competition, development of business contacts and speedier development of both passenger and cargo transport. Sustainable and efficient transport operations is both a service creating high value added and a precondition for the successful development of other branches of the economy and quality of life.
Two international transport corridors cross the territory of Lithuania:
1) Corridor I: North-South (Via Baltica road and railway line Tallinn-Riga-Kaunas-Warsaw), IA (Riga-Šiauliai-Tauragė-Kaliningrad).
2) Corridor IX: East-West: IXB (Kiev-Minsk-Kaunas-Klaipėda) ir IXD (Kaunas-Kaliningrad).
After the start of real processes of EU integration Lithuania has actively joined TINA network processes launched in 1996–1999 on the initiative of the European Commission and at the beginning of 2002, just like other candidate countries, submitted proposals for the TEN-T extension to Central European countries on the basis of TINA network. All the transport network components proposed by Lithuania have been included in the TEN-T network (1617 km of main roads, 1100 km of railways, Klaipėda State Seaport, and Vilnius, Kaunas and Palanga airports). On 29 April 2004 the European Parliament and the Council approved a list of 30 priority transport projects, out of

which Rail Baltica axis and sea motorways projects are most important for both Lithuania’s economy and people.
The formation of a modern north-south transport axis on the basis of the Pan-European Transport Corridor I Warsaw-Kaunas-Riga-Tallinn, which will connect the Baltic States with Poland, will enable Lithuanian residents and businesses to conveniently and quickly reach cultural, tourism and business centres of other EU Member States.
Another project of particular relevance to Lithuania is the modernisation and development of the West – East transport axis as well as its smooth inclusion in the Danish, Swedish, German and other EU Member States’ networks through the sea motorways to be developed in the Baltic Sea.
In order to ensure sustainable growth and increasing citizens’ welfare in Europe, the High Level Group “Wider Europe for Transport” formed on the initiative of the European Commission in 2004 identified the major transnational transport axes with neighbouring countries and regions. These axes are considered to be the main connections between the EU and third countries, promoting wider economic cooperation. In this context the Lithuanian transport sector must be adequately prepared to make use of its capacities as the 5 key transport axes identified by the Commission include axes very important for Lithuania, i.e. the development of Sea motorways and the Northern axis, which contains a link Klaipėda/Kaliningrad – Vilnius – Minsk – Moscow. This link has very good prospects in terms of attracting transit cargoes from China and other Eastern and Central Asian countries through the Klaipėda Seaport.
Table 14. Lithuanian transport network Total length of transport
networkIncluding TEN-T
Length of roads, km 79 314 km 1 617 kmincluding: national significance 21 328 km
local significance 57 986 kmLength of railways, km 1 771 km 1 100 km
including: not electrified 1 649 kmelectrified 122 km
Length of inland waterways 902 km 278 kmSeaports Klaipėda State SeaportAirports 3 international airports (Vilnius, Kaunas and Palanga)
Source: Department of Statistics under the Government of the Republic of Lithuania
Increasing traffic intensity unavoidably requires faster development and modernisation of transport infrastructure, which means larger investments. In developing a modern transport system meeting the EU standards and criteria, the key priority is the rehabilitation and modernisation of those transport infrastructure objects that form an integral part of TEN-T. Furthermore, the Lithuanian transport network is an important component of the Baltic Sea Region’s transport system, which is rapidly developing and aims to become an important link in the formation and development of the Euro-Asian transport flows.
Another not less significant priority is to improve road, railway, water and multimodal transport infrastructure of national and regional significance in order to better meet the growing mobility needs of the society, promote development of business and tourism, and increase competitiveness of the economy.
New transport activities and services are launched in the county centres that have achieved a higher level of development (Vilnius, Kaunas, Klaipėda, Šiauliai, Panevėžys), the capital Vilnius in particular; at the same time, gaps between counties in terms of the share of GDP created are widening. On the other hand, underdevelopment of transport communications and related

infrastructure of regional centres prevent residents of surrounding districts to properly use the services and infrastructure of the regional centres.
Road Transport
Road infrastructure is one of the key factors determining efficiency of transport operations and having vital significance for the country’s socio-economic development as in Lithuania over 50% of all cargoes and nearly 98% of all passengers are carried by road.
The length of Lithuanian roads of state significance totals 21,328 km including truck roads 1,750 km, national roads 4,947 km, regional roads 14,630 km; improved covering (asphalt concrete, cement concrete) 12,903 km (60.5%), gravel roads 8,415 km (39.5%). Approximately 80% of haulage falls on roads of state significance. In addition, Lithuania has a dense network of local roads totalling nearly 58,000 km (84% of them have no asphalt covering). Local authorities are responsible for the maintenance and development of the local roads.
Over 1.78 m road vehicles were registered in Lithuania as of 2005. Since 1990 the road vehicle fleet has grown 2.1 times, while traffic loading has increased by 119% on average. Improvement of road evenness, which had been observed during several years, stopped despite investments in international road and this arouses serious concerns. The reason is obvious – intensity of international cargo transport has grown 3.4 times in the period from 1993 till 2005, while its negative impact upon road covering has increased 6 times.
Daily traffic intensity at certain sections of main roads already exceeds 25,000 vehicles. Driving speed has increased, traffic structure has changed, and both vehicle weight and axle loads have increased. Coverings of many main and country roads fail to bear such increased loads. As the number of vehicles has increased considerably, traffic jams occur both in the cities and in access areas. In this regard, the situation in Vilnius is particularly problematic. There are no main road connecting TEN-T elements with the capital. In order to prevent growing transit traffic through the city centre it is paramount to continue building the connecting roads E28, E85, and E272.
Forecasts show that by 2013 haulage volumes should increase by ~50–60% compared to 2004; similar trends are expected in the sector of passenger carriage by road. It is forecast that traffic intensity will grow rapidly and will increase by more than 40% in the period from 2005 to 2013.
Before Lithuania joined the EU the maximum allowable axle load for the main roads was increased from 10 to 11.5 tons. However, the largest part of the road network of national significance (main and country roads) still does not meet the load requirement 11.5 t/axle; their strength has diminished by 13% in the period from 1992 to 2005 and most roads are worn out. The wearing of roads of national significance has been speedier during the past decade as funds allocated to them are not sufficient for their restoration.
To ensure that road surface in the road sections that are being rehabilitated serves the period estimated in the project, much more expensive technologies, new materials, thicker layers and stronger base are to be used. With simplification of border control and intensifying ties among the EU Member States, heavy traffic on Lithuania’s roads of international significance will increase, which will be accompanied by increased impact upon the road covering.
Technical parameters of the Lithuanian road network do not meet the needs created by increasing traffic flows and are far below the EU transport infrastructure’s standards (see Table 15).
In the development of regional infrastructure, the main lines of work include paving of gravel roads, improvement of traffic conditions, and implementation of environmental measures. This is aimed at improving district residents’ communication with county centres as well as agricultural, business, industrial, administrative, culture and tourism centres.
Table 15. Share of gravel roads in the total Lithuanian road network

Roads Total length of
Lithuanian road network
including
Gravel roads Share, %
Roads total 79 314 km 56 842 km 72 of state significance 21 328 km 8 415 km 39,5
local roads and streets 57 986 km 48 427 km 84Source: Department of Statistics under the Government of the Republic of Lithuania
Most gravel roads cross settlements or connect them. On such roads vehicles raise dust and make noise, which worsens living conditions for residents and produce a negative impact upon the environment. Regions on the periphery of the country lack high-quality and well-maintained roads as well as access to business, recreation and other facilities, which is a hindrance to investments, whereas considering Lithuania’s natural resources, rural tourism, for example, is one of the most promising alternative trades in rural areas and a way to create new jobs. Such road sections must be asphalted in order to improve communication between settlements and aforesaid centres, to improve the condition of the environment, to simplify road maintenance, to reduce road and vehicle maintenance costs, and to shorten travelling time. This would encourage economic development and reduce socio-economic differences between regions. Good condition of transport infrastructure will help attract investments to smaller settlements and towns and will ensure mobility for both urban and rural dwellers thus contributing to the lowering of unemployment rates in rural areas.
The number of traffic accidents in which people perish or are injured is increasing in Lithuania with every year. In 2005 the number of people killed in accidents per 1,000,000 population was the largest among all the EU Member States: in that year, 773 people were killed and 8,497 were injured, which is two times more than the EU average. One may state that attempts to reduce these figures fail not just because of insufficiently effective control over and improper behaviour of traffic participants. An environment safe for all participants in traffic, based on effective engineering facilities of traffic safety, has not yet been created in Lithuania.
In Lithuania there are about 250 sections with high accident rates (“black spots”). 75–80% of deaths fall to rural areas and out-of-town roads where high speed is permitted. In 2002–2005 more efforts were put forth in the traffic safety area: approx. 160 km of barriers were erected, 117 km of paths/pavements for cyclists and pedestrians were built, lighting fixtures were installed in road sections totalling 14 km etc., with LTL 75 m allotted for this purpose (including approx. LTL 35 m received as the EU assistance). However, this is not enough. In order to substantially increase traffic safety up to Western standards, much more has to be invested in the installation of traffic safety measures. Intersections at the entrance to cities and towns should be reconstructed into ring and streetlight-controlled intersections, multi-level intersections and crossings built, roads within and at the settlements lighted, pedestrian and bicycle paths built, other traffic safety measures implemented, including more effective control over technical condition of vehicles.
The main trends can be summarised as follows:
traffic (heavy transport in particular) loading is rapidly increasing, especially on trunk roads of international significance and national roads;
the number of traffic accidents is increasing, whereas Lithuania is lagging behind Western European states in terms of the number of traffic safety measures and the rates of implementation thereof;
asphalt concrete coverings not adapted to heavy transport flows are rapidly degrading;
as road infrastructure development works advance, discrepancies in the technical standard between Lithuania’s main roads and other roads are become increasingly apparent.
Railway Transport

The total length of Lithuanian railway lines is 1771 km, including 1,386 km of single-track and 383 km of double-track sections. The largest part of the lines (1,749 km) are 1520 mm track and only 22 km are 1435 mm track railways.
Corridor I runs from the south to the north: from Mockava at the Polish-Lithuanian border through Kaunas and Joniškis up to the Lithuanian-Latvian border. The corridor has branch A extending from Radviliškis through Pagėgiai up to the border with the Kaliningrad region. Corridor IXB extends in the eastern-western direction, dividing into two branches in Lithuania: IXB – from Kena at the Lithuanian-Belarus border up to the Klaipėda Seaport, and IXD – from Kaišiadorys through Kaunas up to the border with Kaliningrad region.
Technical condition of the main railway lines determines Lithuanian railway operators’ capacity for carrying cargoes and passengers, in particular via international routes. At present most intensive train flows are observed in Branches IXB and IXD, therefore, efforts are focussed at rehabilitation and modernisation of this corridor. Train traffic in Corridor I (in particular in its section from the Polish border to Branch IXD) is not very heavy due to different track width of Lithuanian and Polish railways (1520 mm and 1435 mm) as well as due to poor condition of infrastructure.
The Lithuanian railway transport sector, just as that of most other Central and Eastern European countries, is quite backward from technical, economic and technological point of view compared to modern and interrelated railway systems of the EU Member States. Design speed of the main lines is 120 km/h, however, in most sections of the network the speed is limited to 100 km/h or even to 80 km/h or less because railway lines are worn out and require an overhaul; most signalling equipment is outdated and does not meet EU standards; most bridges were built 50 and more years ago and do not comply with modern standards in terms of load. As carriage volumes and train weights are increasing, rehabilitation of the bridges is necessary (up to 100 bridges in the trans-European network must be rehabilitated). A large part of telecommunications and information systems require updating as their present level does not meet modern standards. Some of the telephone communication systems in operation were implemented in 1971, while the train radio communication system in 1977. Furthermore, the system for managing emergency and crisis situations in the railways must be renovated by acquiring necessary mechanisms and equipment.
Connecting lines of the Lithuanian railways are not less important as they extend the national railway network and ensure trains’ access to most important national centres of industry; they are very significant in order to effectively use the country’s railway capacities and ensure that the regions benefit from the opportunities provided by the main lines.
In 2005, 6.7 m passengers were carried by Lithuanian railway lines including 5.7 m – by local routes. The share of railways in the total passenger carriage volumes accounted for only 1.5%. The scope of passenger carriage by rail decreased by more than 3 times over the past 15 years; at present the situation in the passenger carriage sector has stabilised.
The main reasons for the decrease in passenger carriage volume are that the requirements for speed and comfort grow along with increasing living standards and the number of cars in the country is rapidly increasing due to increased needs and relatively well-developed road infrastructure. Whereas characteristics of Lithuanian railways’ infrastructure and outdated, in all respects, rolling stock do not allow increasing the sped of passenger trains. The condition of the passenger rolling stock is particularly poor (average wear and tear of the passenger rolling stock in operation is 63.6%), therefore, the level of comfort is low, while repairs, fuel etc. costs are high.
As a result passenger carriage by train has become in Lithuania non-competitive compared to other modes of transport, first of all road transport. In order to restore and increase the volumes of passenger carriage by train, a number of measures must be implemented, the most important among them being the increase in the train speed and improvement of service quality, with a competitive price of carriage maintained.

In 2005, 49.3 m t of cargoes were carried by Lithuanian railways. The volumes have been increasing since 2002; compared to 2001 they have increased by 69%.
Figure 21. Volumes of cargo carriage by rail in Lithuania in 2000–2005
Source: Department of Statistics under the Government of the Republic of Lithuania
In 2005 the volumes of cargo carriage by rail accounted for 45% of the total cargo carriage in the Lithuanian market. Cargo flows are concentrated in the Eastern-Western direction: Corridor IXB and IXD toward the Klaipėda Seaport and the Kaliningrad Region.
Rapid economic growth of Lithuania and other countries carrying their cargoes through the territory of Lithuania by transit is the main underlying reason for the increase in rail cargo volumes. Improvement of the carriage conditions is an important factor in the increasing of cargo volumes, therefore, further investments in the national railway network to substantially improve its technical and technological parameters are indispensable.
Current rates of modernisation of railway infrastructure and renovation of rolling stock are slow through the lack of funding and create no conditions for the development of railway services so as to meet the forecast market demand.
In order to make full use of the potential of the Lithuanian railway transport sector (i.e. to ensure competitiveness of Lithuanian Railways company and to achieve the planned passenger and cargo carriage volumes), conditions for carriage services must be improved substantially and both line capacity and traffic safety must be ensured along with the increase in carriage volume. Passenger train speed up to 160 km/h and cargo train speed up to 120 km/h must be achieved in branches IXB and IXD, with the axle load being 25 t and train mass 6,000 t. At cargo train speed of 120 km/h traffic safety must be ensured in sections of Corridor I and the main connecting lines; technical conditions of other lines must be maintained and gradually improved.
Substantial improvement of the railway line between Lithuania and Poland while implementing Phase 1 of the Rail Baltica project as part of TEN-T has been identified as a priority.
Considering current trends and expert forecasts, the efforts of development of Lithuanian railways could result in the cargo carriage volumes amounting to 60 m t in 2013 (including 40 m t of transit cargoes from third countries). The cargo carriage scope can be further increased by successful actions by economic entities competitively operating in the Lithuanian railway sector.
Passenger carriage flows have stabilised after a marked decrease during the past few years. However, there are no clear indications that the number of passengers will start growing without making major changes. Increase in the numbers of passengers travelling in Lithuania by rail is

possible upon implementation of a set of interrelated measures including investments in the public railway structure and passenger carriage facilities as well as state policy measures in the public transport sector (optimisation of public transport routes, system of discounts etc.). Experience of railway companies of many European states shows that there is an opportunity for carrying majority of passengers by rail. It is expected that by 2013 passenger carriage by rail in Lithuania may account for up to 5% of total passenger carriage by public transport, reaching approx. 20 m passengers per year.
Water Transport
Klaipėda Seaport plays a strategic role in the Lithuanian economy. Its positive development has direct impact upon the development of both Klaipėda region and the Lithuanian economy and people’s welfare. Klaipėda Seaport creates 4.5% of the GDP; Klaipėda city – 44.3%, and Klaipėda region – 37.2%.
In 2005 cargo handling volumes at Klaipėda Seaport amounted to 21.8 m t, which is by 7.6% more than in 2004. Būtingė Oil Terminal included, the volume totals 27.9 t in 2005. Klaipėda Seaport is very favourably located for the development of transit carriage as it is a northernmost ice-free seaport in the Baltic Sea, connected by shortest sea routes with the ports of Northern Europe and Scandinavia and by land transport routes – with the main production and trading centres of CIS; this is one of the ports of the eastern shore of the Baltic Sea located nearest the point of entry to this sea. The seaport occupies 415 ha of land and 623 ha of internal basin; the depth of the entrance canal is 14.5 m, which allows Klaipėda Seaport to accept ships with the draft of up to 13 m. The quayage for mooring purposes is 18 km.
Quite extensive port infrastructure modernisation has been taking place during recent years, however, some part of the infrastructure is still not up to modern standards. More than 4.6 km of the quays have been reconstructed and the entrance canal has been dredged but Klaipėda Seaport is still not as deep as some of its competitors. Considering the global tendency toward using vessels of larger capacity this reduces the overall competitiveness of the seaport.
To modernise the seaport’s infrastructure, its interaction with the road and railway networks – which from an integral part of the multimodal transport corridors of TEN-T – must be extended and improved. At present about 70% of the cargoes handled by Klaipėda Seaport are transported by rail and are delivered by a railway line which is also used for passenger trains (via Šiauliai, Giruliai and Klaipėda railway stations). Development and modernisation of railways to/from Klaipėda Seaport would increase the port’s capacity, speed up the delivery of cargoes, and, considering the increase in cargo flows in the future, reduce the risk of emergencies and environmental pollution.
The infrastructure of Klaipėda Seaport is not adapted to passenger service, which hinders development of sea tourism in Lithuania. Upon opening of a cruise terminal in 2003, 59 cruise ships called at Klaipėda Seaport (by 53% more than in 2003); Lithuania was visited by over 24,000 cruise ship tourists (by 64% more than in 2003). Inadequate quality of service and the absence of a special passenger terminal prevent Klaipėda from increasing passenger flows rapidly. A passenger and cargo ferry terminal must be built in Klaipėda Seaport for passenger service and sea tourism development purposes.
It is forecast that Klaipėda Seaport operations will grow at the rate of 3–5% per annum in the period 2007–2013, i.e. up to 28–30 m t in 2013, however, this will depend on the course of development of Klaipėda Seaport and related transport infrastructure. Multimodal cargoes and passenger service are the areas with best prospects. This would markedly increase transit opportunities for Klaipėda and create additional preconditions for the development of international trade.
Lithuania does not meet the European Union’s requirement to establish shelter points for small ships on the seashore at 50 km intervals. For this purpose Šventoji State Seaport was established by

resolution of the Government Concerning the Establishment of Šventoji State Seaport, Approval of the Port Regulations, Allocation of Land and Basin Area to the Port, and Granting of the Trust Right (No. 1469 of 22-11-2004). Reconstruction works must be carried out at this seaport.
Multimodal (Ro-Ro and container) cargo terminals are concentrated in the southern part of the port. As cargo flows grow, more and more vehicles arrive to terminals located in the southern part of the port. Current condition of roads is not fir for intense traffic of heavy vehicles, as a result of which road covering is destroyed, traffic jams are created and the risk of accidents arises, and air pollution and noise increase.
Capacity and safety of the roads leading to the terminals in the southern part of the port must be increased, which would stimulate interaction between different modes of transport in this part of TEN-T network and connection between short-distance navigation lines and Klaipėda – Vilnius highway would be improved.
The number of small ships and boats is rapidly increasing in the port and the existing quays cannot accommodate all of them. Furthermore, as ship traffic in the waterway intensifies, sailing in boats becomes dangerous, i.e. boat piers are in an unsafe place in Klaipėda Seaport and must be transferred to the southern part of the seaport.
Lithuania has 902 km of inland waterways but only 280 km are used for cargo and passenger carriage. The Kaunas-Klaipėda section of the Nemunas River and the waterway along the Curonian Lagoon have been assigned numbers E41 and E70 of the UN inland waterways routes.
Inland waterway transport is economical, ecological and safe compared with other modes of transport, however, low technical standards of infrastructure, seasonal navigation and low depths limit the opportunities for carrying cargoes from Klaipėda to Kaunas and by other routes as well as for the proper development of water tourism and recreational and passenger navigation within the country’s inland waterways network.
Development of an integrated inland waterways system would create conditions for recreational, passenger and cargo navigation, which, on its turn, would encourage development of individual regions and creation of new jobs, contribute to the development of rural tourism and trade, and would facilitate communication between localities.
Air Transport
Lithuania’s air transport sector is rapidly developing. In 1995–2003 the average annual rate of growth in the air passenger flows was 9%, i.e. the growth rate doubled that in the developed countries of the world. After Lithuania joined the European Union, the average growth was as high as 36%. In 2005 Lithuanian airports serviced 1.45 m passengers.
Figure 22. Dynamics of passenger carriage volumes at Lithuanian airports in 1993–2005

Source: Reports by Airports to the Ministry of Transport and Communications
The civil aviation system of the Republic of Lithuania consists of three international airports: Vilnius, Kaunas and Palanga, and a state enterprise providing air traffic control and air navigation services (“Oro Navigacija”). Through the lack of funds the development of the airport infrastructure has not been uniform, with only the most necessary works carried out, however, by this, compliance with the mandatory aviation safety and flight security standards was ensured. As passenger flows are rapidly increasing and regulation of aviation safety and flight security has become stricter, further development of the airports is hindered by certain elements of the airport infrastructure.
Vilnius airport is the largest in Lithuania, however, it is of average size compared to regional airports of West Europe. The length of its runway is 2,500 m and the width is 50 m. Maximum annual airport capacity is up to 2,000,000 passengers and 20,000 t of cargoes. Although over LTL 160 m were invested in the modernisation of Vilnius airport during 15 years, the airport infrastructure may be not capable of servicing the forecast passenger flows already in the nearest future.
The length of Kaunas international airport’s runway is 3,250 m and the width is 45 m. Its design capacity is 400,000 passengers and 20,000 t of cargoes per year. In 2005 the airport serviced 77,000 passengers and handled 4,307 t of cargoes; over 200,000 passengers are planned for 2006. Rapid development of Kaunas airport is related to the Kaunas free economic area, the Kaunas multimodal transport terminal and active operation of low-price and charter-flight airlines. If passenger flows will increase rapidly the infrastructure can be incapable of providing high-quality service. Most structures and facilities related to ensuring flight safety are outdated in all respects.
The length of Palanga airport’s runway is 2,000 m and the width is 40 m. Its design capacity is 200,000 passengers and 2,000 t of cargoes per year. In 2005 the airport serviced 94,000 passengers. The airport is a strong regional airport whose operations are focussed on passenger service in order to promote development of resort services and tourism and to meet business needs of Klaipėda region. Due to its runway dimensions the airport may service aircraft with the capacity of maximum 50 seats, otherwise flight security may be endangered.
State Enterprise Oro Navigacija provides services that are essential to air transport. The number of flights services by the enterprise has increased by 12.2% in 2005 compared to 2004, reaching 122,181. The majority of them are transit flights (83,223 or 68% of all flights) and their number has increased by 9.3%. The number of outgoing and incoming flights has increased considerably: the annual change was nearly 24%.
Weaknesses of the Lithuanian civil aviation are related to the lack of technical facilities at the airports. Vilnius international airport as the main airport in the country lacks behind its counterparts
0
200000
400000
600000
800000
1000000
1200000
1400000
1600000
Pas
sen
gers
International Vilnius airport 300000 353288 355638 370537 410879 461989 480708 521529 584171 634991 719850 994161 1281872
Kaunas airport 48063 67496 36950 33301 35085 25798 25685 19102 19549 20343 20207 27120 77311
International Palanga airport 11962 17828 24358 27931 33035 38239 37611 44316 45660 45971 46666 75658 94013
1993 1994 1995 1996 1997 1998 1999 2000 2001 2002 2003 2004 2005
360025438612 416946 431769 478999
526026649380
584947544004701305
786723
1096939
1453196

in the capitals of the EU Member States due to the lack of conditions for passenger service and underdeveloped infrastructure necessary to service transit flows of passengers and cargoes.
In order to improve passenger and cargo services and to meet the rapidly growing demand for air passengers and cargo carriage, infrastructure of the airports and air traffic services must be improved and its capacity increased; the range of services must be developed, flight security and aviation safety facilities modernised, and competitiveness of airports in the liberalised market increased.
It is expected that in 2007–2013 the average rates of growth in the number of air transport passengers will be 3–4% per annum in most West European countries. More rapid annual growth rates are forecast for Lithuania, i.e. 10–11%. This can be explained by a number of reasons. Firstly, further development of the Lithuanian economy will take place and it is expected that during the next 10 years it will be more rapid than in the old EU Member States. Secondly, the common business infrastructure will be developed (including air transport). Thirdly, Lithuania’s air transport market is not saturated, the demand is growing, while alternative modes of transport will not be capable of competing with the air transport in providing long-distance carriage services. It is forecast that in 2013 Vilnius international airport will service 2–2.3 m passengers; Kaunas – 0.4–0.5 m, and Palanga – 0.3–0.4 m.
Logistics Centres
Constantly increasing cargo flows on the main roads of international significance and modernisation of existing infrastructure form a basis for the establishment of public logistics centres. At present no such centre exists in Lithuania. Due to high land price and the necessity to invest heavily in transport infrastructure, private transport firms tend to create small logistics centres focussed on a single mode of transport (mainly road transport) and providing a limited scope of services. There is no adequate interaction among such centres.
Public logistics centres at the main transport corridors would enable the integration of road and rail transport, and in some cases also air and water transport services. This would increase cargo mobility and efficiency of use of vehicles, improve the quality of cargo carriage and customs services, mitigate the negative impact of transport upon the environment, and enable an effective cooperation among businesses engaged in different activities. Public ownership of land, transport infrastructure and communication networks would provide a long-term guarantee to business and increase its competitiveness.
Lithuania still has no established structures that would act as catalysers of multimodal transport and planners of relevant infrastructure, therefore, establishment of multimodal transport support and logistics competence centres should be promoted.
Discrepancies in Development
Table 16. Discrepancies between Lithuania and the EU in the transport sectorDiscrepancy indicator Unit of measure Year Lithuania EU average Evaluation of
discrepancy
1. Cargo turnover Ton-km/per capita/per year 2004 6983 4773 Medium
2. Passenger turnover Passenger km/per capita/per year 2003 1165 2870 Large
3. Road density km/km² 2003 1,3 1,5 Small
4. Number of cars No. per 1000 population 2003 365 465 Medium

Discrepancy indicator Unit of measure Year Lithuania EU average Evaluation of discrepancy
5. Electrification of railway lines % of total line length 2003 7,0 50,0 Very large
6. Density of railway lines km/1000 km² 2003 27 50,0 Large 7. Number of casualties in traffic accidents
No. of casualties per 100,000 population 2004 21,2 9,5 Very large
Source: EUROSTAT

1.5. ENERGY SUPPLY NETWORKS
Main statements:
The Lithuanian national energy supply networks and systems substantially meet current customer needs, however, majority of equipment are outdated in all respects and do not meet modern standards of security and reliability of supply as well as technical and environmental parameters necessary for work in the EU electricity and natural gas markets and for ensuring appropriate competitive opportunities. Natural gas is supplied from a single source (Russia), therefore, projects aimed at increasing reliability and safety of energy supply must be implemented. Energy supply networks and systems must be modernised by applying state-of-the-art technological solutions aimed at increasing the security and reliability of energy supply and by improving opportunities for fuel diversification and power generation at co-generation plants.
The dynamics of energy consumption and of energy consumption intensity indicators in Lithuania is in line with the average EU trends: final energy consumption is increasing (according to EUROSTAT, a 10.9% growth in EU-25 in 1995–2004), while intensity of energy consumption is decreasing (according to EUROSTAT, a 9.3% decrease in EU-25 in 1995–2004).
The system power transmission networks in Lithuania consist of 330 kV and 110 kV power supply lines and transformer substations. At present the length of the main 330 kW transmission lines amounts to 1,660 km; the length of 110 kW - 5,010 km. The 330 kV and 110 kV lines connect all the power stations with the main network nodes and consumption centres.
Technical condition of the main components of the transmission system is essential for the reliable and safe operation of the power system. Approx. 60% of transmission and distribution equipment are older than 20 years, while approx. 17% of substations are older than 30 years (Fig. 23). The equipment does not meet modern energy supply reliability and safety standards. The probability of emergencies and interruption of energy supply to customers is high; this is directly related to the quality of production process and competitiveness of industrial customers. Therefore, more TS should be rehabilitated in order to comply with the supply reliability and safety standards which are becoming higher. The rehabilitation of installations must involve advanced technologies as a precondition for integration into the EU’s single electricity market.
Figure 23. Number of 110 kV transformer substations in the transmission network, by age
Number of 110 kV TS of the transmission network, by age
0
20
40
60
80
100
120
140
0-20 20-40 40-60
TS age
TS number

Absence of power connections with Poland and the Nordic countries, necessary for the integration into the West European or the Nordic power systems, is a substantial deficiency of the existing system networks. Without connections with the aforesaid power systems, the Lithuanian power system, just as those of other Baltic States, is isolated from the EU power system and market.
The majority of the transmission network development works was carried out in the 60'ies and 70'ies of the 20th century. The Lithuanian power system was planned and developed taking account of the needs and conditions of the then North-West power system, therefore, now the development of the Lithuanian power system must be based on enhancement of independence through the reinforcement and modernisation of the domestic 330 kV network. It is expected that the overall demand in the Lithuanian power system will grow, resulting in increasing power network loads. This will require additional investments in the development of the system network and construction of 330 kW power transmission lines.
There is a trend toward concentration of loads near the largest cities, which may create the need to construct new transformer substations, whereas there will remain spare capacities at existing TSs in the regions.
As land prices are growing and potential building sites in the cities should be used as effectively as possible, the need for replacement of overhead lines with cables in urban areas will increase. This requires heavy investments in the reconstruction of existing power networks and systems.
The development of energy networks and systems must ensure the safety and reliability of power supply and form technical and environmental preconditions for Lithuania’s integration into the EU electricity markets and compliance with the provisions of the EU acquis.
Power Distribution Networks and Systems
Reliability and safety of power supply largely depend on the condition and development of domestic power distribution networks.
The majority of distribution network equipment are overhead and cable power lines and transformer substations with voltage lower than 110 kV. In Lithuania power distribution networks are controlled by two companies. They own nearly 400 transformer substations, over 32,000 transformer stations, and approx. 120,000 km of overhead and cable power lines. Power distribution licences have also been issued to five other companies, however, they control local networks, mainly within their own territories.
The age of installations at 45% of the 35–110 kV transformer substations exceeds their economic lifetime (30 years), the installations are worn out. The majority of breakdowns occur at 10 kV installations and the number of breakdowns is increasing. All the 35 kV overhead lines have been constructed on reinforced concrete and metal supports. 25% of these lines are older than 45 years, which exceeds the economic lifetime. With the aging of the lines, the need for repairing reinforced-concrete supports, foundations, lightning protection ropes and isolators increases every year. Reinforced concrete masts have been used for almost all the 0.4–10 kV overhead lines. Over 50% of these lines are older than 30 years, which the is the economic lifetime for such lines.
As the lifetime of these installations is nearing end, the risk of breakdowns and emergencies at transformer substations is increasing; at the same time, reliability and safety of power distribution become lower. Difficulties are encountered in undertaking response actions in case of breakdowns and emergencies as equipment of old generation is no longer commercially available and problems of replacement arise. In the course of modernisation of individual parts of the power network and introduction of innovations, there is problem of compatibility of old electrical equipment and with new-generation technologies; the efficiency of newly-employed technologies decreases and
56

opportunities provided by them are not fully utilised. Therefore, it is necessary to substantially modernise the old transformer substations by applying new technologies and thus increasing the reliability of the power distribution service.
With the increase in loads at customer sites, existing installations of distribution networks do not ensure appropriate voltage levels, which requires building of new transformer substations and shortening of low-voltage lines. Overhead lines are to be replaced with cable lines, which is expedient from the point of view of economy, environmental protection and supply reliability.
Local control centres are responsible for the monitoring and operative control of the power distribution network. Part of such centres are equipped with SCADA automated data collection and transmission systems, which improve the network operative control considerably. To improve reliability of the power distribution network and to increase effectiveness of control, control modernisation projects should be implemented in all the control centres in the nearest future.
Effective control of the power distribution network and efficient use of available resources requires a single information system for the entire power network, covering individual components of the distribution network, related geographical information and reports on failures in the installations. The implementation of such a system would speed up emergency response actions (in particular in case of major emergencies) by ensuring dynamic and optimal distribution of the resources available for the elimination of failures.
In order to create conditions for the development of the electric power market and to prepare for the integration into the EU electricity markets, automated power consumption accounting and power demand forecasting systems should be implemented. If required funding is raised, in 2007–2013 the automated accounting systems could be implemented to cover accounting for all the consumption by non-domestic customers.
Natural Gas Networks and Systems
In 2005, 3.05 billion m3 of imported gas was consumed in Lithuania. In 2004, natural gas accounted for 25.7% in the country’s structure of primary energy. As shown by Fig. 24, this is close to the EU average.
Figure 24. Share of natural gas in the EU primary energy balance in 2004
Source: EUROGAS
Lithuania has no natural gas resources of its own. All the gas is imported from the Russian Federation. The Lithuanian natural gas system is connected with the gas systems of Belarus, Latvia and the Kaliningrad Region of the Russian Federation, however, there are no direct connections with the West European gas networks. As there is no gas supply alternative, the sole gas supplier can increase prices on the unilateral basis, thus influencing competitiveness of the Lithuanian industries – gas customers.
57

Lietuvos Dujos AB, the largest gas company in Lithuania, holds a licence to engage in transmission and distribution operations. It operates 1,800 km of mains and 6,600 km of distribution pipelines, a compressor station, 61 gas distribution stations, and 2 border accounting stations. The value of the entire gas system exceeds LTL 2 billion. Six other companies are licensed to carry out gas distribution operations but their networks account for a small share of the gas distribution operations.
Natural gas consumption in Lithuania is not and will not be limited by technical feasibility of gas supply from Russia. However, a problem of reliability of supply exists as part of the mains are outdated and the transmission pressure is already restricted. Therefore, renovation of the mains and increasing of the gas pipelines capacity is required. In the future, increase in the consumption of natural gas can be limited by low reliability of supply. In order to avoid this Lithuania must expand and modernise its gas transmission networks and systems, in particular in West Lithuania, create preconditions for the integration of the Baltic States’ market, and construct in the territory of Lithuania or the Baltic States a storage facility and/or a liquefied natural gas acceptance terminal.
From both technological and environmental standpoint, natural gas is the most efficient organic fuel, the global stocks of which (including gas fields in Russia) are huge. Natural gas is a promising organic fuel type for the Lithuanian market in the short and medium term. This is confirmed by a constantly increasing numbers of customers and of those wishing to become gas customers. Business conditions are much better and quality of life is improving in the gasified areas. However, development of the gas system, in particular to the outlying towns and settlements, is not always cost effective. Assistance from the EU funds would be very useful in this field.
District Heating Networks and Systems
District heating (hereinafter referred to as DH) systems operate in all towns of Lithuania. The wear-out rate of the systems is high, therefore, when the ambient air temperature is low and close to the design heating temperature established for the region (-20-23C), there is a high probability that the old pipelines will fail to bear high pressure and temperature parameters and some component of the DH system will break down. In order to reduce the risk of emergencies and to increase the reliability of energy supply, heavy investments in the DH modernisation and employment of advanced efficient technologies are required.
About 50% of all heat customers in Lithuania are connected to DH systems; this includes multi-apartment buildings, public and commercial buildings, part of industrial enterprises and private houses.
The Republic of Lithuania Law on Heat establishes that local authorities are responsible for the management of heat facilities according to special heat facilities plans approved by municipal councils. About 70% of Lithuanian municipalities have approved such plans according to which heat customer zones have been established and the types of energy and/or fuel to be used for heat generation in such zones have been identified.
In 2005 there were 56 DH companies in Lithuania with the overall annual heat sales totalling over 5 GWh. It is estimated that all the companies provided 10.1 TWh of heat in 2005. The final total demand for centrally-supplied heat amounted to 8.1 TWh. Natural gas accounts for the largest part of the total amount of fuel used for the generation of heat energy (over 80%), while the share of biofuel has increased up to 11%. The total length of heat supply pipelines was approx. 2,500 km, which is a bit less than in 2004 as group heat substations and hot water supply networks were abandoned. Losses in the heat supply networks amounted to 2 TWh or 19.6% in 2005. The heat supply systems are being modernised by installing new automated heat substations in the buildings, with the hot water prepared in heat exchangers. Old pipelines are being replaced with new ones in
58

order to ensure reliable and safe supply of heat. Advanced technologies are employed in the pipeline replacement process; trenchless pipe-laying techniques are applied.
Development of the heat facilities in municipal territories will be conducted according to the Municipal heat plans providing for the combining of the DH with autonomous heat generation in order to benefit from the advantages of both methods. Fixed costs of DH are high, therefore, this method of heat supply is efficient only provided that the heat customer density is high; in the territories meeting the latter condition, modernisation, rehabilitation or replacement of DH networks as well as their development by connecting new customers is cost effective. If DH modernisation rates are slow either due to low degree of energy supply reliability or to economic factors, part of customers may disconnect from the existing systems. This would have a negative impact upon the remaining customers as the heat price would increase upon decrease in consumption and the fixed costs remaining stable; this, in turn, would have a negative influence upon business and competitiveness of enterprises.
The DH systems form a technical basis for the potential of generating power and heat in the same production process. Furthermore, boiler houses and power plants generating energy for DH networks may use different types of fuel including renewable energy sources thus maintaining a higher level of safety and reliability of energy supply, including from the standpoint of fuel diversification. Therefore, DH systems must be preserved and developed.
Discrepancies in Development
Table 17. Discrepancies between Lithuania and the EU in the energy sector
Discrepancy indicator Year Lithuania EU averageEvaluation
of discrepancy
Overall energy dependence1, % 2005 57.7* 50.5** Small
Energy dependence on natural gas2, % 2005 100.0* 54.5**2 Large
Electricity generation per capita, kWh 2005 2338* 5800** LargeSource: *Department of Statistics under the Government of the Republic of Lithuania** EUROSTAT data
Notes: 1 Upon closure of the Unit 2 of Ignalina NPP in 2010, Lithuania’s energy dependence will grow up to 85 as, statistically, in calculations of this indicator nuclear energy is presented as local energy irrespective of the fact that nuclear fuel is imported. 2 Data for 2004.
59

1.6. SWOT ANALYSIS
This section summarises an analysis of present situation and future trends according to internal factors (strengths and weaknesses) and external factors (opportunities and threats). It is proposed that certain weaknesses and threats should be eliminated and strengths and opportunities should be made use of.
Table 18. SWOT analysisStrengths Stable macroeconomic environment.Rapid economic growth in recent years, increase in exports and development of new economic relations with the EU Member States.Relatively large share of residents with higher or high educational attainment and share of persons graduating from science and engineering studies (aged 20–29).Public infrastructure of services for business and innovation support network in place.Accumulated research potential in certain areas.Well-developed ICT infrastructure in the largest cities, wide use of public mobile telephone communication, developed network of public Internet access points.Geographical position of the country favourable to export.Ice-free Klaipėda seaport with modern cargo terminals.Developed electricity and natural gas networks.Planning of municipal heat facilities creating preconditions for the preservation and modernisation of district heating systems and for increasing safety and reliability of energy supply.WeaknessesSmall domestic market.Quite low exports of goods of local origin compared to developed states of the same size.Insufficient investments in the formation of the capital base and investments in equipment, which are especially productive.Low productivity of the economy.Low innovativeness rates at Lithuanian businesses; very low rate of business investments in RD and small number of researchers working in business; small RD and innovation capacities of businesses.Small share of value added created by high and medium-high technology sectors in the value added created by the manufacturing industry.Lack of cooperation between science and business; poor and worn-out research facilities.Underdeveloped environment for the dissemination of knowledge and research results; insufficient intensity and quality of public services to businesses and persons wishing to start up a business; insufficient opportunities for SMEs to use financing sources.Low level of DFI; few/no strategic investors whose activities would be based in the development of intellectual capital rather than lower operating costs.Insufficient number and area of investment zones for green field investments.High labour force emigration rates cause labour force deficit in the economy.Large and not diminishing discrepancies among economic development of Lithuanian counties.Low general ICT use rates among residents; advantages of information society are not sufficiently used in certain social groups.Lack of digital information and data in the Lithuanian language necessary for science, education and everyday people’s life.Low technical standard of transport infrastructure of all types, in particular of regional significance; large share of gravel roads; high accident rates in the country’s roads.Poor communication through Poland with other EU Member States.Shortage of by-pass roads in the largest cities, streets not adapted to intensive traffic; insufficient rates of implementation of engineering means for traffic safety.
Infrastructure capacities of airports do not meet the growing demand (on the part of passengers and airlines).Weak interaction among individual modes of transport. Infrastructure of Klaipėda port not adapted to passenger service and development of sea tourism. Insufficient infrastructure of internal waterways and seashore infrastructure.Lack of electric power connections with Western European or Nordic power systems.Insufficient technical quality standard of power and gas transmission and distribution networks in order to integrate into the single EU power and gas markets.High dependence upon energy and other basic resources of Russia. Lithuania receives gas from the sole supplier – Russia and there is no supply alternative.Insufficient safety and reliability of the district heating system.OpportunitiesInvestments in improvement of labour productivity, innovations and high-quality services for business as well as increasing share of industries with high value added would ensure increase in competitiveness of the economy and consistent economic growth.Use of FDI and technology transfer by acquiring patent rights, licences, research, commercial or production experience or unpatented know-how created in other countries would increase competitiveness and productivity of Lithuanian businesses. It is necessary to achieve that at least several strategic multinational investors and their research centres would transfer their operations to Lithuania; they could become nuclei of clusters and users of local intellectual potential. Involvement of businesses in clusters would also increase their competitiveness.Development of RD potential, reinforcing ties with the economy and international integration would be a significant contribution to the development of the high-technology sector and progress in knowledge economy.Increase in the scope of joint projects with the EU businesses and research organisations would enable better use of the EU’s financial and intellectual resources and adoption of experience in dissemination of innovations.Increasing internationalisation of businesses and transfer of non-productive operations to the East would make value chains more rational and increase productivity of the economy. Development of creative businesses would create conditions for better use of creative potential of people working for Lithuanian culture.Development of knowledge economy by making ICT use a basis for economic development and transferring public services to electronic environment; fostering and dissemination of culture and Lithuanian language, increasing international competitiveness of the economy.Substantial improvement of transport services by ensuring efficient connections with the transport networks of neighbouring states and implementing the Rail Baltic project.Establishment of modern logistics centres and their integration into the network of logistics centres of the Baltic Sea Region; support for multimodal transport and formation of competence centres.Promoting regional cohesion, uniform economic development and reducing development discrepancies through the development of national and local transport networks and improving communication among Lithuania’s regions.Development of transit, trade and tourism by developing infrastructure of air, water and land transport systems.Ensuring traffic safety and increasing capacity of streets and roads by modernising infrastructure and traffic control systems.Development of international transport axes North-South and West-East and reaching technical parameters of trans-European networks; establishment in the transport services market of the Baltic Sea Region and continental Europe.Integration into the EU single market for gas and electricity to speed up the process of development of electricity and gas markets in Lithuania.Making use of the existing potential of power generation, increasing reliability and safety of energy supply, reduction of energy supply losses and better use of the transit position of Lithuania through the modernisation of energy supply networks.Threats
61

Increasing cost of labour and labour shortage, rising prices for energy resources, low innovativeness and low productivity of business may result in the decrease of Lithuania’s competitiveness.Increasing competitiveness of Asian states.Increasing resident’s exclusion in terms of ICT use.Traffic jams in the largest cities and access roads thereto, delayed adaptation of public transport to new allocation of means of production and changes in territorial planning.Incompatibility of national interests in developing EU common-interest trans-European networks; growing competition on the part of the neighbouring countries’ transport infrastructure objects.Along with the growing transport intensity and failure to allot sufficient funding for road renovation and maintenance, the number of accidents on Lithuanian roads may increase. Increasing social exclusion of people living in small towns and villages as a result of poor communication.Through the lack of investments Lithuanian railways may become uncompetitive in the cargo and passenger carriage market and may limit operations of Klaipėda port.Loss of status as a sea transport and transit state in case of failure to implement development and modernisation of Klaipėda seaport infrastructure and related transport infrastructure.High vulnerability of energy supply to Lithuania; impossibility to forecast Russia’s and Byelorussia’s influence due to low level of development of market relations in the energy systems of these countries and pricing deformations.Priority given by heat supply enterprises to heat generation in boilers compared to heat generation at co-generation plants.
62

2. OPERATIONAL PROGRAMME STRATEGY
2.1. VISIONS AND OBJECTIVES
Vision
The National Programme on the Implementation of Lisbon Strategy states the goal of the economic strategy: to reduce the gap between the country’s economic development level and the EU Member States’ average. The Lithuanian Strategy for the Use of EU Structural Assistance for 2007–2013 is based on a strategic vision that by 2015 Lithuania will achieve the level of socio-economic development of some of the old Member States. In order to gain the key objective and to implement the vision defined in the Lithuanian Strategy for the Use of EU Structural Assistance for 2007–2013, the strategic objective of the Operational Programme on Economic Growth is as follows: to speed up economic growth in the long term in order to reduce the development discrepancy between Lithuania and the EU average.
In recent years, high economic growth rates in Lithuania were largely determined by growing domestic consumption and by gradual increase of productivity in traditional Lithuanian industries that are gaining international markets. A rapid economic growth in the long term may only be achieved by gaining, reinforcing and maintaining international competitiveness of the economy. International competitiveness may be achieved firstly, by high productivity of sectors of the economy and, secondly, by changing structure of the economy, with sectors creating and employing high technologies forming an increasingly larger part of it. Competitive economics in Europe is directly based on business innovations in the area of new processes and unique products aimed at reaching higher productivity levels. However, Lithuanian economy is still dominated by sectors characterised by low value added and labour-intensive technologies and building their competitive advantage on lower wages and other relatively cheaper operating costs rather than on knowledge and innovations. The present structure of the economy and industry is very sensitive to rising prices for raw materials, labour and fuel, which means that, despite recent growth in sales volumes, businesses remain vulnerable in the medium and long term. Shortage of labour and increase in its cost caused by economic migration also contributes to diminishing competitiveness of the country’s businesses and hinders development of export, which has already been made difficult due to competition on the part of cheaper products from Asia. Whereas volumes of export of knowledge-intensive services that are less dependent upon growing raw materials and fuel prices remain very small.
Considering the present economic situation in Lithuania the State should put forth targeted efforts to change the structure of the Lithuanian economy, with a focus on the development of high and medium-high technology sector and on the strengthening of traditional sectors creating high value added. Innovations of all types and creation and dissemination of new knowledge are the main factors of productivity and welfare growth in the environment of global competition. However, a transition to higher value added is not simple in Lithuania – it is hindered by lack of entrepreneurship, low activity and efficiency of research and development, low productivity of technologies and equipment used by businesses, almost complete inoperation of the innovation promotion system, and limited opportunities for businesses to raise financing from external sources for high-risk investments in innovations. These problems must be resolved in a comprehensive way: the key factor here is an effective cooperation between business and research, which now is in the focus of attention throughout Europe. Business investments in R&D and innovations must be supported and efficiency of R&D activities by the public sector must be increased by promoting public and private partnerships. However, it is also important to invest in the improvement of the business support and innovation promotion system, speeding up of cluster formation processes (not

limited to hi-tech areas), and improvement of financial environment. In this way conditions for a more active commercialisation of knowledge and technology transfer would be created.
Low productivity is one of the main weaknesses of the Lithuanian economy, resulting in low competitiveness on international scale. All types of innovations (either of strategic nature, or based on modifications or adaptations of existing technologies or techniques) produce an impact upon growth in productivity. Strategic innovations are considered to be the key driver of the economy in the long term, however, for a transitional economy striving to catch up with more developed states, modification- and adaptation-based innovations and technology transfer play an important role. It should be stresses that adaptation-based innovations should form a basis for the growth of strategic innovations as sufficiently high basic technological level is required for the development and employment of strategic innovations. Therefore, in the environment of increasing competition the significance of foreign direct investments as a source speeding up the attraction of new technologies, modern management methods and other resources relevant to economic modernisation is growing. Whereas the number of multinational corporations operating in Lithuania is small, there are almost no strategic investors whose strategies would be based on investments in the development of intellectual capital rather than on the use of cheaper local resources; Lithuania is the last on the list of EU Member States according to accumulated FDI per capita.
Taking account of the present trends of economic globalisation, the key long-term factors of competitiveness for Lithuania include the qualified labour force (in broad terms, including also scientists and researchers), effective lifelong learning system, critical amount of knowledge and the potential of creation of such knowledge in the economy. Attraction of investments in the priority areas is largely dependent upon the level and scope of these factors in the international context.
Although the investment climate in Lithuania is relatively favourable, insufficient level of FDI is mainly determined by the lack of industrial greenfield lots with developed infrastructure. However, in order to attract to Lithuania at least few strategic investors – potential cores of clusters and consumers of local intellectual potential – integrated measures must be implemented combining all the operational programmes: invest in the training of highly-qualified specialists and researchers and establish/strengthen high-competence R&D centres that have accumulated relatively high competences and that operate in the priority R&D or technological breakthrough areas. Targeted investments in selected priority science- or knowledge intensive areas and an effective marketing of Lithuanian research-technological potential, aimed at multinational companies operating in relevant areas, would help to attract to Lithuania high and medium-high technology companies with their research centres. At the same time measures should be implemented to improve the image of conditions for business in Lithuania.
Finally, a basis for improvement of competitiveness of the Lithuanian economy in the world would be provided by an effective environment for the economic infrastructure, ensuring mobility and communication/cooperation between businesses and the public at large. The EU Structural Funds’ assistance and the national funding must be targeted to the formation of the environment favourable for long-term development, which would ensure continuous high-quality employment for Lithuanian people. Considering the advantages given to the country by its geographical position, attention should be focussed on the development of a sustainable transport infrastructure network meeting the mobility needs and forming favourable conditions for transit. A multimodal transport system meeting the standards of the old EU Member States by its technical parameters, safety level and quality of service must be created in Lithuania by 2015. Through effective interaction with the neighbouring states’ transport systems, it would enable businesses to successfully advance their operations and Lithuanian residents – to conveniently reach the main tourist, culture and business centres of Lithuania and Europe within minimal time. The Lithuanian
64

transport sector will become an important part of the transport system of the Baltic Sea Region and will effectively serve both Lithuanian and EU interests by providing high-quality services.
Safe and reliable energy infrastructure is one of the key preconditions for the growth in the national economy’s competitiveness. Modern and well-developed energy infrastructure is an important factor determining successful work of most businesses and increasing socio-economic attractiveness of individual regions. Given Lithuania’s dependence upon a sole energy supplier, ensuring reliable and safe energy supply to Lithuanian residents is particularly important.
Finally, well-developed and universally accessible information and communications technologies (ICT) infrastructure is an important factor forming a basis for the planned economic changes as it would enable a quick and cheap dissemination of information and the use of information for business and for the provision of public/private services.
Vision for the period by 2015:
Uninterrupted rapid growth of the national economy and high international competitiveness in the long-term, to be ensured by:
High productivity of sectors of the economy and changing structure of the economy, with sectors generating high value added and basing their competitiveness upon knowledge and innovations;
Favourable business environment that promotes innovations and effective economic infrastructure creating best conditions for rapid economic development.
The Operational Programme on Economic Growth, which is in line with Priority 2 (“Competitive Economy”) of the Lithuanian Strategy for the Use of EU Structural Assistance for 2007–2013, will be based on comprehensive and complementing measures aimed at developing an integrated factor of competitive advantage on an international scale. The success of these actions will determine the rates of growth in competitiveness of the country’s businesses, wages, and national welfare as a whole. Ex ante expert proposals were taken into account in the formulation of the objectives.
The main objectives of the Operational Programme on Economic Growth are as follows:
1. Increase the share of high value added businesses
2. Increase business productivity especially by creating favourable environment for innovations and SMEs
3. Increase efficiency of economic infrastructure.
These objectives are in line with the priorities identified in the Cohesion Policy Guidelines for 2007–2013:
promote innovations, entrepreneurship and the growth of knowledge-based economy by developing research and development capacities including ICT (Guideline 4.2: Knowledge and innovations for economic growth);
increase attractiveness of the Member States, regions and cities by improving access to them by ensuring appropriate quality and level of service and by preserving their environmental potential (Guideline 4.1: Europe and its regions – a more attractive place for investments and work).
65

The objectives of the Operational Programme are also in line with the priority in the microeconomic area “Promote competitiveness of Lithuanian businesses” of the National Programme on the Implementation of Lisbon Strategy for 2005–2008), in particular, the following objectives of the aforesaid priority:
Objective 1 “Create conditions for businesses to make use of the outputs of R&D in the public sector and to invest in R&D by developing the public sector R&D capacities”;
Objective 2 “Maximise the number of businesses competitive on international scale and achieve that the share of GDP created by industry and related business structures are close to the indicators of the EU Member States”;
Objective 3 “Create a society based on knowledge and state-of-the-art technologies; and
Objective 6 “Connect Lithuanian energy networks with the Western European networks and improve transport infrastructure of international and local significance.
2.1.1. Objective 1 of the Operational Programme: Increase the share of high value added businesses
To ensure stable further growth of the country’s economy, both overall modernisation of the economy by increasing productivity in all sectors and restructuring of the economy by increasing the share of high and medium-high technologies are important. More active development of R&D and investments in this area will help change the structure of the sectors in the desired direction.
In order to increase business investments in R&D and to create conditions for businesses to use the outcomes of R&D in the public sector, the aforesaid programme provides for the development of R&D capacities and potential in the public sector, promotion of R&D projects implement by private sector (including joint projects with research organisations/universities), and support for public-private partnership by supporting the commissioning of R&D works by businesses to educational and study establishments including universities.
In order to achieve the set targets Lithuania must apply an integrated strategy covering the priorities of higher education, national research programmes and creation of scientific knowledge in priority or technological breakthrough areas identified by means of studies, by hiring international experts etc. as well as active support for businesses in creating in-house knowledge or in commercialising knowledge created at educational establishments, the adoption of innovative technologies from foreign countries, the support for small and medium-size businesses and the promotion of residents’ entrepreneurship. It is important to note that the State should avoid direct influence over behaviour of businesses in selecting specific R&D areas. The innovations and business initiatives promoted and supported should be mainly those that contribute to the achievement of objectives of the Operational Programme for Economic Growth – growth in competitiveness of the economy and labour productivity, with the priority given to the adoption and employment of world-level technologies and techniques contributing to the increase in labour productivity and value added and commercialisation of knowledge created in Lithuania. Effective cooperation is only possible if all the parties are interested and have achieved a certain level enabling the possibility of points of interest.
In order to make putting research results into practice more active, attention should be focussed on ensuring closer cooperation between business and research. Investments should be aimed at a comprehensive resolution of cooperation problems and involvement of all the stakeholders. Therefore, support under the priority “R&D for competitiveness and growth of the economy” of the Operational Programme for Economic Growth should be used to promote joint R&D by businesses and research organisations and establishment of new spin-off or technological firms, in particular those aimed at the implementation of clusterisation or industry development strategies, including the establishment and strengthening of the required technical facilities. The emerging technological
66

platforms will contribute to the formulation of development strategies for individual industries ensuring the industries’ competitiveness in the long term, when, as a result of cooperation, integrated development strategies for the industries (involving both actions to build human resources in certain areas and specific lines of research) will be formulated.
Cooperation between business and research must be focussed on the commercialisation of knowledge created by research organisations and the carrying out of applied research based on business needs. Therefore, business interests and expected commercial benefits form a basis for such cooperation. In funding projects of this type, attention will be focussed on the financially expressed business interest, strategic prospects of commercialisation of research, and creation of value added. To achieve these objectives, it is important to support, on competition or programme basis, the establishment and development of high-competence R&D centres whose activities are aimed at the search for outputs for commercialisation, in particular in those R&D areas in which private company groups or clusters in certain industries are ready to invest as well as in the areas of technological breakthrough identified by the State. This will be done on the basis of both private research organisations and universities. Also, support for joint R&D activities by business and research organisations as well as innovation projects implemented by businesses is important in this area.
Development of high-competence R&D centres in Lithuania is important both for the attraction of international investments by high and medium-high technology companies and for the maintaining of high-level research competences in the fields of long-term research of strategic significance. Cooperation between such centres and businesses would be a priority, however, not a mandatory condition of support.
As stated in the National Programme for the Implementation of the Lisbon Strategy and other strategic documents, Lithuania intends to renew priority R&D areas and the high-technology programme and to formulate new national programmes on R&D priorities. However, in order to increase efficiency of the public R&D sector as well as its matching with business needs, other changes are required as well. For example, Programme on the Implementation of Long-Term R&D Strategy, Phase 2, aims at improving the methodologies for the identification of public funds requirement and allocation of such funds to educational and study establishments, supplementing the model of basic financing for research by financing on tender basis, etc. Some measures aimed at changing R&D structure and activities may be financed under the priority “Building of Administrative Capacities and Increasing Efficiency of Public Administration” of the Human Resources Development Programme.
Changes in the structure of the economy are strongly influenced by multinational companies and their decisions on the development of business in certain areas of the world depending on economic conditions and international situation. Therefore it is necessary to achieve compatibility between measures provided for under the priority “Increasing productivity of business and improvement of conditions for business”, such as development of infrastructure of industrial parks, the measures concerning the establishment and development of research-technology parks under the priority “R&D for competitiveness and growth of business”, and the human resources support measures under the Operational Programme on Development of Knowledge Society as this is a precondition for the development of high and medium-high technology business in Lithuanian by multinationals, which should encourage changes in Lithuania’s sectoral structure.
67
Investment and support of the R&D area would enable to achieve the aim of the Operational Program to increase the share of businesses creating high value added and would be implemented through 1st priority of the program “Research and development for competitiveness and growth of the economy”
2.1.2. Objective 2 of the Operational Programme: Increase Business Productivity Especially by Creating Favourable Environment for Innovations and SMEs
International competitiveness of a country directly depends on labour productivity and businesses’ ability to create high value added, which, in its turn, is determined by the businesses’ ability to create and commercialise innovations, to offer specific products tailored to customer needs and extra services, winning the market by speed and quality, and by physical and financial opportunities for the development and establishment of businesses.
According to the World Bank and the International Finance Corporation, Lithuania is among the top 20 countries of the world with the most favourable business environment, which has been determined mainly by stable macroeconomic environment. However, assessments of business activities are not favourable: according to business competitiveness and the number of new companies formed as a result of splitting from educational establishments Lithuania is far below the EU average. This is due to inactive business innovations, high risk of innovation financing and lack of flexible instruments of financial support for business (e.g. microcredits or risk capital funds), sometimes – regulatory issues (e.g. in case of protection of intellectual property).
Although an objective of converting Lithuania’s economy into an economy based on strategic innovations has been identified as an objective of the Lithuanian economic development strategy, a transitional phase is required for the transfer of foreign technological and managerial experience through the application of adaptation-based innovations. Therefore, in order to speed up restructuring of the economy, the State should promote both material and immaterial investments related to the technology transfer, preparedness to produce articles that are new in the Lithuanian context, and expansion to foreign markets, in particular, promoting cooperation of businesses (clusterisation) and employment of production processes and technologies with the higher value added potential. Economic development based on strategic innovations of international scale is only possible only upon achieving sufficiently high level of development of industry and services; such level should be achieved by promoting adaptation-based innovations in the transitional period, at the same time building R&D capacities as a precondition for strategic innovations in the economy.
The infrastructure of public services for business, which forms an important part for the transfer of research outputs to business, is in place but is in the early stage of development. The intensity of provision of the services to businesses is inadequate and specialised services (quality management, certification, innovation, technology transfer etc.) are underdeveloped. The development of the business support infrastructure favourable for the spread of innovations and promotion of entrepreneurship, with a particular focus on the development of special high-quality services (related to business start up and development, technology transfer, innovations, energy efficiency etc.) is highly important. In the environment of global competition, clusterisation is very important for competitiveness of business on international scale, therefore, a lot of attention will be devoted, under the priority “Increasing productivity of business and improvement of conditions for business”, to joint initiatives of businesses, i.e. to activities related to the establishment of clusters.
It is also important to comprehensively promote entrepreneurship of natural persons, especially young people, and start-up businesses. Therefore, to achieve regional spread and effective cooperation on municipal level, part of the investments will be earmarked for entrepreneurship-promotion programmes initiated by local authorities. To encourage businesses’ growth and expansion to international markets, businesses will be encouraged to implement projects on internationalisation of operations, creating opportunities for the businesses to make use of higher-level subsidised services in the preparation and implementation of internationalisation strategies and
68

other services aimed at increasing competitiveness. In the course of development of different measures of financial support to businesses, better access to financing sources must be ensured, especially to entities starting up business or introducing innovations. Furthermore, better access to financing sources will be ensured for SMEs operating in traditional sectors to encourage them to implement energy efficiency measures.
Global trends and advanced technologies cause structural changes in the economy; new areas of business emerge. The development of creative business currently in the focus of attention in Europe could enable the use of Lithuanian cultural potential as well as people’s creative potential in the development of competitive products and services representing the Lithuanian content, therefore, investments under the Operational Programme for Economic Growth should also be earmarked for the development of infrastructure necessary for the development of creative businesses (creative business incubators).
Considering the global tendency for outsourcing and the small share of high and medium-high technologies in Lithuania, attracting foreign direct investments that would enable the adoption of advanced technologies and modern management knowledge is very important for Lithuania. In particular, attraction of knowledge-intensive multinational companies with their research centres would contribute to technological development. Lithuania competes for such investors with both other CEE countries and with Asian and Latin American countries and the USA. Selection of location for investment depends on many factors such as favourable investment environment, highly-qualified labour force, strong national research centres, well-equipped industrial parks etc. Strategic investors can become a focus of innovation clusters in the area of knowledge-intensive technologies, providing a strong support for local producers and service providers as well as helping them joint international supply chains. Favourable business environment encouraging local enterprises and foreign investors to cooperate must be created in order to realise such opportunities.
Naturally, the main factor influencing multinationals’ decisions on location of investments is the comparative advantage of the location over other alternatives in terms of expected profit. Therefore, strategic understanding of the value chain in a specific industry and its global trends is important in the process of attraction of strategic investments and planning of marketing measures. Comprehensiveness and timeliness of actions must be ensured, therefore, the formulation of investment attraction strategies by state and local authorities as well as implementation of the strategic measures must be supported.
The aim of the Operational Programme for Economic Growth is to increase business productivity level by setting up favourable conditions for innovations and SME’s would be implemented under the 2nd priority “Increasing business productivity and improving environment for business”.
2.1.3 Objective 3 of the Operational Programme: Increase efficiency of economic infrastructure
Investments in the development of the physical economic infrastructure in line with the principle of sustainable development, just as investments in human capital, form an integral part of building international competitiveness of the economy. Effective economic infrastructure together with the overall business climate and regulatory environment form a strong basis for stable socio-economic development in the long term.
Favourable geographic location is one of the factors promoting Lithuania’s competitiveness on international scale. To take advantage of this strength and to encourage Eastern-Western transit and trade through Lithuania, investments in the transport infrastructure of local, national and international significance are required. Transport network forms part of the European single market artery and is a driver of competitiveness of markets as well as one of the most important t preconditions to improve quality of life for the society. The main priorities of development of both
69

European and Lithuanian transport sectors include the development of an effective, flexible and safe transport system encouraging integration of the national markets, development of the national economy, and socio-economic attractiveness of the country’s regions ensuring mobility necessary for people’s work, studies and leisure.
The transport network of national and local significance ensuring access to markets and economic relations between areas must be constantly developed along with changes in the national economy. The conditions of roads with constantly increasing traffic intensity, the coverage of which no longer protects the road structure from loads and atmospheric effects is the poorest. Roads with gravel or worn-out asphalt covering account for the largest part of Lithuania’s regional and local networks. Investments into the regional road infrastructure would enable the implementation of traffic safety improving measures and reduction of the negative impact upon the environment. Construction of the engineering infrastructure for traffic safety would diminish the rate of road accidents, the number of victims as well as losses incurred by the country’s economy and residents. Asphalting of gravel roads and rehabilitation of individual sections of the regional road network could improve communication conditions for outlying regions; more favourable conditions would be created for investment, cooperation of businesses, and labour mobility.
As carriage volumes are increasing, conditions for domestic rail transport must be improved and capacity of connecting railway lines must be increased at the same time improving traffic safety; therefore, regional railway lines must be modernised and transportation services and quality of service improved thus providing for an opportunity to increase the share of domestic rail carriage in the total transportation volumes. To attract more tourists to Lithuania, to promote rural tourism and development of agriculture and fishery, both recreational and tourist transport infrastructure must be extended and modernised; sea tourism and recreational navigation should be promoted by developing port and internal waterways infrastructure as well by increasing its safety.
Due to underdevelopment of the public passenger transport network Lithuania is considerably below the EU average according to passenger turnover. In the new EU Member States, modernisation and development of main transport infrastructure lines, in particular those which form part of the trans-European network (TEN-T), has significant influence over development of individual regions, promoting their integration both into the EU internal market and global economy. Therefore, it is important to modernise and develop, in a coordinated way, the infrastructure of TEN-T network (roads, railways, sea and airports) in order to achieve sustainable development of different modes of transport as well as their interaction with the Member States’ and third countries’ transport systems. Under the influence of globalisation processes conditions will be created for the formation of multimodal transport and other business centres (clusters) near modern transport mains. Therefore, multimodal transport infrastructure should be developed and interoperability and establishment of public logistics centres promoted. Connection of Klaipėda State Seaport with the ports of Nordic and other European countries would significantly improve competitiveness of the Lithuanian economy on an international scale. To increase passenger turnover and quality of service, particular attention should be paid for modernisation of international airports.
Establishment and development of a modern North-South transport link (Tallinn–Riga–Kaunas–Warsaw) connecting the Baltic States and Poland could meet the increasing needs of the EU Member States in terms of trade and services. The key priority is to create conditions necessary for the interoperability with the EU railways network within the framework of the Rail Baltica project. Modernisation of the Via Baltic highway is to be continued. Rehabilitation of the infrastructure of the West-East transport axis, which already service intensive vehicle flows, is also an important priority for Lithuania. An effective transport link in the rapidly developing transport network of the Baltic Sea Region will be formed for the purpose of development of transport in the EU’s internal market and between Europe and Asia.
70

To increase competitiveness of the Lithuanian economy, the Operational Programme for Economic Growth provides for measures to implement trans-European projects meeting convergence criteria and to form an integrated regional transport network effectively interacting with the EU network. High-value transport infrastructure project of international significance could be financed from the Cohesion Fund (priority “Development of trans-European transport networks”), while the EU SF funds (priority “Basic economic infrastructure”) would be used to improve national and regional transport infrastructure (railways, water transport facilities, roads connecting Lithuanian regions with the main industrial, business and administrative centres).
Effective, safe and reliable energy infrastructure is one of the main preconditions for the growth of the national economy, with the power, gas and district heating supply networks and systems forming the core of the infrastructure. A SWOT analysis has shown that Lithuania lacks both own natural resources and opportunities for provision with cheap resources, while the main weakness is high dependence upon energy resources received from one source. Furthermore, gas and power networks have no direct links with the Western European and Nordic energy systems. The closure of Ignalina nuclear power plant has negative environmental and socio-economic consequences; at the same time, there arises a need for connection to Western European energy networks. As Lithuanian power and gas markets are separated from the common power and gas markets of the EU, energy price mechanisms cannot be fully operative and customers actually cannot chose an energy supplier, although legal preconditions for this exist.
Considering current situation Lithuania must take advantage of its geographical location which is very favourable for the transit of energy flows and integrate its energy systems into the Nordic and/or Western European energy systems. This would speed up the process of formation of power and natural gas markets both in the Baltic States and in the EU as a whole. In 2007–2013, projects on the development and modernisation of power and natural gas transmission and distribution networks and systems, funded under the priority “Basic economic infrastructure”, would create a technical and environmental feasibility for the power and gas markets’ integration into the EU markets and markedly increase the safety and reliability of power supply both on the national scale and for individual regions and final consumers.
In Lithuania the generation, supply and consumption of power are not efficient enough and high energy-intensity prevails. Furthermore, the potential of renewable and local energy sources is not used to full extent. Investments in the modernisation and development of district heating networks and systems would create pre-conditions for the reduction of energy losses, quality of service would be improved, and the potential of co-generation plants and renewable sources (biofuel in particular) would be better utilised; at the same time, environmental pollution would be reduced.
Investments funded by SF assistance in the increased efficiency and development of energy networks through the introduction of advanced technologies would reduce energy prices and produce a positive impact upon the import/export balance in the country as the majority of fuel is imported. A well-developed, efficient and reliable energy infrastructure would create a favourable climate for the establishment and development of new businesses. Modernisation and development of energy networks will also contribute to the improvement of quality of life and increased cohesion; investment attractiveness of small towns and regional centres of Lithuanian would increase and development of socio-economic infrastructure will be encouraged.
Development of a knowledge-based competitive economy is inseparable from the development of information society. Growth in the use of IT forms a precondition for the development of R&D, innovations and expansion of services for business. In order to enable all people in Lithuania to use information and communications technologies (ICT), to create and use rich electronic content, to create conditions favourable for business competitiveness, even ICT infrastructure throughout the country is required. The National Programme for the Implementation of the Lisbon Strategy emphasises the need, in the area of ICT use, to create conditions for an increase in people’s competences and social cohesion, to use IT to modernise public administration, and promote the
71

economy based on knowledge, innovations, scientific results and IT. Analogous objectives have been established in the Strategy for the Development of Information Society in Lithuania, which also identifies the need to, through the use of opportunities provided by ICT, foster and disseminate Lithuanian culture, promote creativeness and cultural diversity in the society, and ensure that Lithuanian cultural heritage and the Lithuanian language are preserved in the world.
A SWOT analysis has shown that ICT infrastructure is well developed in the largest cities of Lithuania, there are many public mobile telephone communication subscribers, however, and there exists an important problem – low general level of use of ICT in the country. Only a small group of residents use technologies, therefore, there is a need to develop electronic services and electronic infrastructure, to improve people’s competences and to create conditions for the development of electronic business so that residents of the country using ICT can quickly and conveniently receive improved services from the public administration and private sectors and use other information sources.
To increase the number of Lithuanian residents using ICT, to reduce digital divide and to promote an economy based on state-of-the-art technologies, the Operational Programme on Economic Growth should devote a lot of attention to the development of electronic infrastructure (broadband Internet connection, interoperability, e-security) and electronic content and public electronic services (increase efficiency of public administration institutions, provide health, learning and public procurement services, develop e-democracy processes). Business cooperation must be promoted by providing opportunities to conclude online transactions, establishing virtual business information and consulting centres and multimedia software (including open source) and hardware environment, and developing special infrastructure necessary for businesses to advance activities and increase competitiveness.
The aspects of this aim of the operational programme related to development of information society will be implemented under the priority “Information society for all” of this operational programme.
2.2. PRIORITY 1: RESEARCH AND DEVELOPMENT FOR COMPETITIVENESS AND GROWTH OF THE ECONOMY
Objectives of the Priority
Objectives to be attained under this priority are as follows:
1. Reinforce public and private R&D facilities.
2. Increase efficiency of R&D by the public sector as well as its accessibility to businesses.
3. Intensify R&D by the private sector.
4. Improve the environment for the R&D dissemination, promote cooperation between business and research in R&D area.
The overall success in the attainment of these objectives will be demonstrated by the growth in expenditure for R&D, in particular in the private sector where the indicator was very small in 2003 – only 0.14% of GDP.
The priority will contribute to the attainment of Objective 1 “Increase the share of business with high value added” of the Operational Programme.
In addition, this priority contributes to the objectives identified under other priorities:
72

- under Priority “Increase in business productivity and improvement of business environment” of the Operational Programme on Economic Growth: it is planned to support entrepreneurship and the provision of services increasing business viability, better access to financing sources and innovations and productivity increasing measures implemented by businesses in order to increase long-term competitiveness of businesses;
- under the “Information Society" Priority of the Operational Programme on Economic Growth: it is planned to finance the development of the IS and computer network of educational and study institutions;
- under the Priority “Development of health, educational, labour market and social infrastructure” of the Operational Programme on Cohesion Promotion, the development of higher education and study infrastructure will be supported;
- under the Priority “Building Capacities of Researchers and Scientists” of the Human Resources Development Programme funded by ESF, quantity and quality of human resources for R&D will be increased as well as mobility of such human resources will be promoted.
Description of the Priority
Competitiveness of the economy on an international scale and economic growth are directly related to public and business investments in high-quality R&D. However, in Lithuania at present both capacities and infrastructure of R&D (in both public and private sectors) are in an unsatisfactory state, while research as a knowledge-intensive service is obscure to most businesses of the local industry and other sectors. Low innovativeness of the Lithuanian economy is mainly caused by insufficient investments in R&D, in particular in the private sector, relatively small share of high and medium-high technologies in the economy, low rates of formation of new technology businesses and businesses splitting from universities, research organisations or researcher groups, very small number of researchers employed by businesses, low efficiency of R&D by the public sector, insufficient focus of researchers’ on the needs of the economy, insufficiently close cooperation between business and research in the area of R&D and other factors. Furthermore, outdated R&D facilities are not attractive for the country’s scientists, in particular for young people to continue work in Lithuania, hinder attraction of scientists with highest qualifications from other EU Member States (including Lithuanians working abroad) as well as of international high-tech companies and research centres. Development of knowledge society as well as production and services sectors creating high added value and receptive to knowledge also causes the need to improve the quality of studies and science. The National Lisbon Strategy implementation program consolidates the pursuit for increasing efficiency of high education and improving the supply of the highest qualification specialists. However, the majority of research show that the study system is developed not regarding the needs of knowledge society properly, students greatly lack practical knowledge and preparation to compete in labour market. One of the essential problems, which will be aimed to be solved under this priority and which is characteristic not only to Lithuania but of Europe as a whole (as noted in the Community strategic guidelines), is incapacity to transform knowledge and results of experiment development into commercially applicable results and processes.
Decisive measures must be taken to resolve such issues and to substantially change the situation in both public and private sectors so that closer cooperation between business and research is encouraged.
Public R&D facilities, which is one of the key components of the environment favourable for knowledge-intensive business, will be strengthened by funding the development/renovation of the R&D infrastructure and acquisition of modern research equipment. In order to provide such support in a concentrated manner, national (comprehensive) R&D programmes will play an important role,
73

while the list of supported R&D areas will be limited and drawn up with the help of international experts as necessary. In this way, investments under this priority will be concentrated on those high-competence centres and networks which carry out R&D in the areas meeting current or future economic development needs best. That will allow to avoid dispersion of limited investments and achieve a higher efficiency of investments.
Public R&D infrastructure will provide a basis both for strategic and applied research having direct positive impact upon competitiveness of the economy. This is the main aim of its development but it could also be related to the development of studies in the cases where research centres will use the existing facilities also for the training or skills improvement of researchers (persons engaged in master, doctoral etc. studies) as equipment and facilities are required both for conducting of modern research and for the training and skills improvement of high-competence researchers in line with the needs of business and the State.
Direct support for research organisations may result in the establishment and development of individual research entities, which will compete among themselves but whose loading will be not sufficient. Therefore, taking account of conclusions of ex-ante evaluation, it would be more expedient to finance joint research centres whose facilities would serve the purposes of projects implemented by several organisations and would be focussed on specific, new and innovative areas, which, as shown by other countries’ practice, is an output of creative synthesis of science and practice.
Measures under this priority will support research conducted by public research organisations and universities that are expected to produce positive impact upon and are relevant to business development and economic growth (in the short or long term). Furthermore, such research will be funded, first of all, within the framework of the aforesaid national (comprehensive) R&D programmes or in the number of other areas identified, as a rule, by international experts. Finally, one of the aims of rendering such support will be to encourage return of researchers that have left Lithuania and attract researchers from other countries by creating for them more favourable conditions of work in Lithuania, thus complementing initiatives under the Operational Programme on Human Resources Development in the area of building researchers’ capacities.
A teaching and learning environment meeting the highest standards is to be created by modernising the universities‘ infrastructure for studies. Priority research and study areas related to R&D as identified in relevant programmes will be in the focus of attention. These investments will be in line with the reorganisation of the higher educational establishments’ network and other objectives identified in the Lithuanian Higher Education System Development Plan for 2006–2010.
To build R&D capacities and innovation potential of the private sector, direct support has been planned for businesses investing in their own R&D facilities designed for the creation of innovative products and for R&D carried out by businesses, in particular in partnership with universities or research organisations. In addition, preparatory phases of R&D – carrying out of feasibility studies, patentability analyses etc. – will be supported. To encourage Lithuanian researchers to join the EU research area and to raise the standards of research conducted in Lithuania, support will be provided for preparations to participate in the EU 7th Framework Programme and Eureka to create opportunities to implement projects on the development of products and processes based on state-of-the-art technologies and able to compete in global markets.
In order to build private sector’s capacities to commercialise outputs created as a result of the aforesaid investments and to activate the dialogue between research and business, the priority also provides for very important measures to improve the environment for the spread of knowledge and technologies and to encourage establishment of new technology businesses. Through integration of research, technical-innovative, technological and industrial capacities for joint activities, science and technology parks, technological incubators and innovation/technology centres will be developed; they must become main sites for the dissemination of information on the importance of
74

R&D and innovations for long-term competitiveness of businesses and for the growing demand and supply for/of R&D. In order to effectively use the R&D potential accumulated in the public sector, attention should be focussed on the promotion of establishment of new technology businesses and businesses splitting from universities (“spin-offs”), research organisations or researcher groups by providing integrated subsidised incubation, start-up financing and other services. These measures are to be implemented in the neighbourhood of research organisations and/or universities or in close cooperation with them as well by adopting best foreign practice.
Considering the benefit of partnership between businesses and research organisations as well as the importance of external incentives to joint different types of partnership, joint initiatives of enterprises and research organisations are to be promoted. Investments will be earmarked for the support of activities related to the formation of clusters in the identified technological “breakthrough” areas. It is foreseen to support both management and investments of clusters: development of a common information systems for the cluster; maintaining of the cluster’s image – advertising publications, conferences etc.; initiatives on the development of research and innovations; attraction of a foreign investor important for the formation of the cluster core and improvement of investment conditions; other measures reflecting the main objectives of clusterisation initiatives, with the priority given to the striving to become a part of international clusters. Moreover, training of personnel of the businesses forming the cluster could be financed from European Social Fund.
Along with financing on tender basis and targeted financing, this Priority will support a limited number of national (comprehensive) R&D programmes covering actions attributable to different sections and planned by different funds and operational programmes – from training of researchers, improvement of study infrastructure to the strengthening of R&D facilities, support for R&D activities etc. Furthermore, support is planned for integrated studies and research and business centres (valleys) programmes the aim of which is to concentrate investments on a limited number of integrated centres (for example, knowledge-economy centres at Saulėtekio or Visorių localities that are now under formation), with the funding allotted to relevant components of such programmes falling within the scope of this priority. In addition, exclusive research centres, where strategic research of the top international level will be carried out, will be supported.
Investments made under the Priority in both private and public R&D facilities and other areas, jointly with measures to promote researchers’ mobility between public and private sectors as provided for in the Operational Programme on Development of Human Resources will contribute to the resolution of a problem common to both public and private sector: research currently conducted by state institutes and other public research organisations are not sufficiently focussed on the needs of the economy. Investments under this Priority complement, in a consistent manner, measures under the Operational Programme on Development of Human Resources aimed at improving quality and increasing quantity of R&D human resources with the common purpose in view – to reinforce R&D capacities of Lithuania.
To ensure uniform understanding of the R&D notion, which is very important for the generation of the flow of relevant high-quality projects and for the reduction of risk of deformation of competition in allotting of funding for projects, universally accepted terms will be used as defined in Frascati38 and other manuals.
Compatibility with Other Measures Co-funded by the EU
Regulations of the EU Structural Funds state that attention should be focussed on ensuring complementarity and compatibility with other Community policy initiatives, in particular, the 7th Joint Research and Development Programme and the Joint Programme on Competitiveness and 38 The Measurement of Scientific and Technological Activities: Standard Practice for Surveys of Research and Experimental Development, Frascati Manual, OECD, 2002.
75

Innovations. Community strategic guidelines recommend that the EU SF assistance should be concentrated on high-competence centres and networks and utilised for the implementation of national programmes.
It is expected that, by establishing and reinforcing R&D facilities and supporting implementation of R&D projects, R&D capacities will be increased in Lithuania up to the level enabling Lithuanian businesses, research organisations and universities to participate in the European research activities, in particular, the European Community 7th Research, Development and Demonstration Framework Programme (2007–2013), first of all in its specific Cooperation Programme (e.g. joint research) and Capacities Programme (e.g. research designed for SMEs). Furthermore, businesses and research organisations will be encouraged to implement joint projects under the Framework Programme by allotting financing to preparatory works (e.g., preparation of an application). Under this Priority, businesses, research organisations and universities participating in Eureka projects will be supported.
Information on demarcation lines regarding compatibility of investments foreseen under this priority with assistance planned under other Operational programmes and priorities as well as under programmes financed by the EAFRD and EFF is provided in the Annex V “Compatibility of assistance with other operational programmes and other EU financial instruments”.
Cross-subsidization and general subsidies
Implementing this priority cross-subsidization allowing to subsidize activities supported by ESF may be used. Cross-subsidization must meet the following criteria:
1. Activities subsidized by ESF must be implemented as a constituent of the actions implemented under a certain priority;
2. Activities subsidized by ESF must be necessary for successful achievement of the aims and results of subsidized actions.
While implementing this priority, it is planned to apply schemes of general subsidies.
Estimated Expenditure Breakdown by CategoriesBreakdown of expenditure by priority themes
Code Name Financial share (EUR)01 R&TD activities in research centres 74.327.186
02
R&TD infrastructure (including the enterprise itself, equipment and high-speed computer networks connecting scientific research centres) and centres of a certain technological competence 241.562.993
03
Technology transfer and improvements to cooperation networks between small and medium-sized businesses (SMEs), between these businesses and universities, post-secondary education establishments of all kinds, regional authorities, research centres and scientific and technological polls (scientific and technological parks, technopoles, etc.) 124.567.553
04
Assistance to R&TD, particularly in SMEs (including access to R&TD services in research centres) 70.487.695
07 Investment in firms directly linked to research and 128.156.812
76

innovation (innovative technologies, establishment of new firms by universities, existing R&TD centres and firms, etc.)
09Other measures to stimulate research and innovation and entrepreneurship in SMEs 38.447.043
TOTAL 677.549.282Breakdown of expenditure by financing method
Code Name Financial share (EUR)01 Non-repayable aid 677.549.282
TOTAL 677.549.282Breakdown of expenditure by types of areas
Code Name Financial share (EUR)00 N/a 677.549.282
TOTAL 677.549.282
2.3. PRIORITY 2: INCREASING BUSINESS PRODUCTIVITY AND IMPROVING ENVIRONMENT FOR BUSINESS
Objectives of the Priority
The Priority has the following objectives:
1) increase business productivity;2) increase viability of businesses and promote entrepreneurship;3) improve access to financing sources for SMEs;4) adapt public territories for investment attraction purposes.
The overall attainment of the objectives under this Priority will be assessed by the scope of changes in labour productivity in the Lithuanian economic sectors as compared with the EU-25 average and by the growth in FDI. It is expected that upon implementation of the Operational Programme labour productivity in Lithuania will reach 65% of the EU-15 average (in 2004, productivity per hour accounted for 41.7% of the EU-15 average), while volumes of mining, quarry and manufacturing industry products (excluding production of refined oil products) sold on foreign markets will account for 65% of total production volumes of these industries.
The Priority will contribute to the attainment of the first objective of the Operational Programme, “Increase business productivity especially by creating favourable environment for innovations and SMEs”.
Description of the Priority
Increasing of productivity of businesses
Labour productivity rate is one of the most important indicators of economic progress and international competitiveness, which directly depends upon the level of equipment and technologies used for production and the level of management and organisation/efficiency of other processes. Even in those industries where advantages of Lithuanian businesses have been traditionally receiving favourable evaluation, labour productivity is 8–10 times lower than at British, Danish or German undertakings and about 2 times lower than at Latvian, Estonian, Czech or Polish undertakings. Therefore, in longer economic perspective it is important to ensure much higher rates of increasing of labour productivity in industry and services in order to reduce development
77

discrepancies between Lithuania and EU Member States. This can be done by supporting traditional industries and attempting to gradually diversify the structure of the economy toward more knowledge-intensive areas. Considering rapid changes caused by globalisation, increase in labour productivity is only possible by constantly introducing product and process innovations and using new knowledge and qualified labour force with the aim to ensure long-term economic growth as the main goal.
The Priority provides for three kinds of actions aimed directly at increasing labour productivity in business including support for investments in new production equipment and technologies; support for the implementation of IT management systems/solutions at businesses; support for the acquisition of services related to the introduction of advanced management methods, internationalisation of operations and energy audit at industrial enterprises, in particular at businesses within traditional industries.
Support for investments in new production equipment and technologies is aimed, first of all, at encouraging projects whose objective is to markedly increase labour productivity and export volumes by a business as well as projects aimed at launching production of new (at least in Lithuania) products or provision of production services. Lithuanian businesses will be encouraged to enter global markets, with a priority to products of Lithuanian origin produced by higher value added industries and to integration of such products into higher levels of value chains maintained by the world’s leading companies, or to the process of becoming independent players by Lithuanian businesses belonging to traditional sectors in order to form and manage their own value chains on an international scale. In order to ensure creation of higher value added, in particular by traditional industries, more attention will be devoted to projects on implementation of development strategy for an industry or a cluster. Projects discussed and formed within clusters, clearly based on market demand and providing for opening opportunities in international markets, will create preconditions for the formulation of relevant development priorities and identification of strategies. Thus resources will be concentrated in cluster priorities and will contribute to the increasing of competitiveness of a sector or several sectors.
In order to encourage positive changes in business efficiency to ensure growth in the competitiveness of businesses and improvement of quality of service, implementation of models optimising business processes based on the use of IT infrastructure (e-commerce, customer relations management, supply chain management, internal resources management etc.) will be supported.
Along with support for investments, SMEs will be assisted in acquiring special consulting services aimed at increasing competitiveness. To ensure growth in labour productivity it is very important to raise the overall management level at businesses as well as application of advanced management methods such as ISO, EFQM etc. quality management methods, flexible production (Lean, Toyota etc.) and process optimisation (Goldrat system etc.) systems or advanced management systems (such as Six Sigma). Moreover, improvement of managerial level in business entities will be stimulated by supporting modern personnel management systems, which will be financed by European Social Fund under Operational Programme on Human Resources Development. Businesses that even haven’t heard of and do understand the importance of advanced management methods for improvement of the business’ operations are not willing to allot additional financial resources for such tools, therefore, businesses should be encouraged to acquire them as a precondition for increasing labour productivity.
To promote SMEs growth and active participation in the single market as well successful entry into international markets, activities aimed at internationalisation of SMEs operations will be supported under this priority. Support for the acquisition of services assisting SMEs to formulate and implement an internationalisation strategy will be rendered. In addition, provision of other services designed for the assessment of product/service development phases and opportunities for introducing innovations in specific phases.
78

Based on proposals set out in the ex-ante evaluation, criteria will be set in order to minimise risk of distortions of competition and difficulties in assistance administration in the process of rendering direct assistance to businesses. At the same time, innovative assistance rendering methods such as repayable subsidies, interest subsidies, loan guarantees etc. will be introduced.
Furthermore, given that in the long term Lithuania aims to become an economy with higher value added and to change the sectoral structure so that it is dominated by high and semi-high technology business, one must take into account that such sectors are highly dynamic and characterised by increased business risk. Therefore, measures to promote business will be aimed to achieving a balance between traditional stable business sectors (in the short term) and new sectors with increased risk (in the long term).
Under the measure intended for the increase in labour productivity by promoting investments in means of production identified in this priority, a LTL 3 million ceiling will be established for the amount of assistance per project (in case of larger investment, the project‘s relevance to economic growth will be considered by an expert group formed specifically for this purpose), with at least 70% of funding under the measure allotted for SMEs.
Improving SMEs access to financing sources
Limited opportunities for obtaining external financing is one of the key problems encountered by SMEs. This is particularly relevant to start-ups and enterprises having high growth potential but requiring venture investments. Furthermore, for start-ups an opportunity to receive small-scale loans – microcredits is very important. This objective of the Priority is aimed at improving conditions for start-ups and SMEs with good growth prospects to obtain necessary funding. For this purpose measures to improve access to risk capital (in particular, seed capital and early-phase capital) for SMEs have been identified. Promotion of such financial instruments as microcredits for start-ups and smallest enterprises is also planned; such instruments contribute to the resolution of issues of individual social groups (such as women, youth etc.). The priority also includes support for the provision of guarantees and partial financing for loan interest thus creating more favourable conditions to borrow for the start or development of venture/innovation business.
It is anticipated that the use of aforesaid financial instruments will considerably improve SME financing opportunities, while increased access to venture capital will encourage realisation of innovative business ideas, establishment of new technology businesses, and development of the high and medium-high technology sector.
JEREMIE initiative is analysed in detail in close cooperation with European Investment Fund while designing the implementation scheme of financial instruments.
Promoting viability of business and entrepreneurship
Apart from other factors, success of business depends on access to information, consulting, training and other services. SMEs usually are not in a position to pay the full price for consulting and training services, therefore the State should provide them both financial and organisational support to ensure that they have necessary capacities, knowledge and motivation. In order to create favourable conditions for the establishment of new businesses, support will be provided to projects on establishment and development of public institutions providing services to business in the locations where there is a strong business development potential (there are high or higher educational establishments training specialists that are capable of creating products and services of higher value added or engage in professional creative activities; potential interaction between businesses and research organisations; market development opportunities, concentration of solvent
79

customers etc.), however, starting of new businesses is restricted by high rental fees, there are no supply of services to assist the start or development of business etc.
Furthermore, in order to ensure that public services to business are provided efficiently and in line with its needs, support will be provided both to starting entrepreneurs – basic services concerning establishment and starting of business, and to higher-quality services – quality management, certification, basic information on importance of innovations, opportunities to adopt/transfer technologies, IT and other competence areas according to the specific nature of the business. Provision of these services will be financed from European Social Fund under the Operational Programme on Human Resources Development for 2007-2013.
In addition, support from this priority will be provided to such special services as market assessment, analysis of business condition and prospects enabling a timely transfer of resources to a new business with better prospects, identification of business development and diversification opportunities etc. Taking account of special needs of target groups (women, youth, disabled persons), provision of services to such groups should be financed, with a focus on adoption of best foreign practice where possible and expedient.
Business support infrastructure will be developed under this priority while training initiatives will be financed from the Operational Programme on Human Resources Development for 2007-2013 (European Social Fund).
Considering socio-economic regional discrepancies in Lithuania (both among and within regions), which are still present and slowly diminishing and taking account of specific needs of promoting entrepreneurship in different areas, entrepreneurship promoting programmes launched by municipalities will be promoted (including organisation of seminars, training, consulting, conferences, fairs and exhibitions, dissemination of business information, support for the creation of new jobs and establishment of new businesses etc.).
To increase labour productivity and entrepreneurship and improve entrepreneurship culture, support is planned for specific, qualitatively new or experimental programmes aimed at promoting the introduction of the principle of socially responsible business, development of cultural industries, increase in productivity of certain target groups, growth in economic security of business, integrated resolution of competitiveness problems relevant to certain sector or industry etc.
In the environment of developing IT, it is important to promote understanding of the benefits of introduction of IT-based modules optimising production and not only provide direct support for businesses implementing such modules. Therefore, it is planned to support projects on the development of e-business at SMEs: information about opportunities for linking business processes with the Internet or IT; dissemination of know-how for SME, ensuring security of online business operations, transfer of know-how on the development of effective e-business models and adapt them to business etc.
In order to increase competitiveness of the Lithuanian economic sectors it is necessary to intensify knowledge exchange, promote innovation activities by businesses and make use of potential competitive advantages of business groups; businesses will be encouraged to joint into partnerships of different type by supporting establishment and development of clusters, technology platforms and similar initiatives. Based on examples of successful launching of clusterisation processes in foreign countries it is planned, by differentiating support methods and scopes, support different stages of clusterisation process such as drawing up of cluster maps; clusterisation feasibility studies; seminars and training on different aspects of cluster and network formation and functioning; preparation of a strategy and a programme for cluster formation and operation; consulting on the cluster formation process; identification of strengths and opportunities for the cluster and the businesses forming the cluster that can be useful to other businesses and organisations.
80

In order to achieve faster growth in competitiveness of industry it is important to exactly identify factors limiting growth of industries and to work consistently in the set directions. In order to determine and explain the reasons for business development problems or too slow increase in business productivity, to find potential solutions for eliminating development obstacles, and to comprehensively evaluate political, economic, social and technological factors important for business development, periodic competitiveness assessments will be prepared for individual sectors/industries according to methodologies elaborated specifically for this purpose. In this way both opportunities and challenges for the industries would be assessed on a systematic basis and later target support mechanisms will be formed to eliminate reasons preventing the increase in competitiveness of industries or business groups (with the state aid schemes, priority investment areas, the need for amending legal regulation and areas for reducing administrative burden established).
Adapting of public territories for the attraction of investments
In general, dynamics of FDI in recent years in Lithuania is positive, however, by FDI indicators Lithuania lags behind both old and new EU Member States. Insufficient level of investments in the country has been caused, first of all, by the lack of industrial land plots with developed infrastructure. Considering the high existing and forecast need for industrial plots for greenfield investment, the objective “Adapt public areas for the attraction of investments” has been formulated. As the lack of industrial plots prevails, other factors hindering FDI have not been explicitly identified as problematic ones, however, they are not less significant: appropriate marketing, accessibility of qualified labour force, mobility etc. It is important to note that Lithuania is interested both in the increase in the scope of FDI and in the FDI quality of and economic impact. In order to achieve higher growth rates and increased competitiveness it is important to increase investments in the area of high and medium-high technologies and the adoption of technologies and managerial skills by Lithuanian businesses is speeded up. In order to attract investments strategically important for the changes in the structure of the Lithuanian economy, support for the establishment of regional parks will be provided: investments will be earmarked for industrial parks with fully or partially complete infrastructure and for the support for investment promotion activities. Other measures in the area of improving the image of Lithuanian business environment will also be used to attract investments. Investments will be used to cover marketing costs related to the improvement of such image and the dissemination of opportunities for FDI, in particular on an international scale. The formulation of the strategy for investment attraction to be undertaken by state and local authorities as well as measures to implement the strategy will be funded.
Measures under this Priority are related to measures under other Operational Programmes. Measures aimed at promoting eco-innovations will complement energy generation and efficiency measures under the Operational Programme for Cohesion Promotion, which focuses on environmental protection. Measures to improve business environment formulated under this Priority (e.g. allotment of areas intended for investment) will be complemented by measures aimed at matching supply and demand of labour (in particular qualified labour) provided for under Priority 1 “Quality Employment and Social Inclusion” of the Operation Programme on Human Resources Development; Priority 3 “Building Researchers’ Capacities” aimed at increasing human resources’ capacities in the RD area both in quantitative and qualitative terms; and measures of Priority 4 intended for increasing the quality of regulation of economic activities, reduce administrative burden upon business and improve administrative environment for business. Such integrated efforts to improve business environment should attract investments vital for the economy.
To achieve uniform understanding of innovations, which is essential in generating a flow of eligible high-quality projects, and to reduce the risk of competition deformations in allocating support for
81

projects, universally accepted terms as used in Oslo39 and other manuals will be applied. In order to avoid the risk of distortion of the market and negative consequences to competition, support to the projects implemented jointly with enterprises will be provided regarding the requirements for state support of the Community’s legal acts depending on the nature of the projects and subsidized expenses. Respective provisions will be followed while supporting projects which provide the benefit (support) to enterprises in the form of services and financial engineering measures. Preliminary list of state support schemes and ERDF’s funds planned to be allotted are presented in the appendix “Indicative list of state support schemes”.
Compatibility with Other EU-supported Measures
By supporting the development of infrastructure for promotion of innovations, activities of the Euro-info centres supported under the EC Framework Programme on Competitiveness and Innovations (2007–2013) will be complemented, while measures under this Priority aimed at improving access to financing sources will contribute to the assistance to investors and provision of guarantees under the aforesaid programme.
Information on demarcation lines regarding compatibility of investments foreseen under this priority with assistance planned under other Operational programmes and priorities as well as under programmes financed by the EAFRD and EFF is provided in the Annex V “Compatibility of assistance with other operational programmes and other EU financial instruments”.
Estimated Expenditure Breakdown by CategoriesBreakdown of expenditure by priority themes
Code Name Financial share (EUR)05 Advanced support services for firms and groups of firms 39.284.21508 Other investments in firms 184.866.894
09Other measures to stimulate research and innovation and entrepreneurship in SMEs 196.421.075
68 Support for self-employment and start-ups 41.595.051TOTAL 462.167.235Breakdown of expenditure by financing method
Code Name Financial share (EUR)01 Non-repayable aid 261.124.48802 Aid (loan, interest subsidy, guarantees) 97.055.11903 Venture capital 25.419.19804 Other forms of finance 78.568.430
TOTAL 462.167.235Breakdown of expenditure by type of area Code Name Financial share (EUR)
00 N/a 462.167.235TOTAL 462.167.235
39 Proposed guidelines for collecting and interpreting technological innovation data. Oslo Manual, OECD and European Commission, 1997.

2.4. PRIORITY 3: INFORMATION SOCIETY FOR ALL
Objectives of the Priority
This Priority seeks to reduce digital divide caused by geographic and economic conditions and to stimulate information society processes via implementation of the following objectives:
develop electronic solutions to increase efficiency of public sector institutions and to enforce e-business initiatives in the country;
establish an even, secure electronic networks infrastructure of the country.
Description of the Priority
Development of an information society is a complex process influencing both everyday life of the country’s residents and life of the State as a whole. Information society development is related to substantial political, social, economic and cultural changes of life in a country: by changing usual ways of action, it changes everyday activities of residents, businesses, public administration institutions and non-governmental organisations.
Based on an analysis of current situation the following key problems can be identified:
1. Low general level of ICT use among residents compared to the EU indicators.2. Elderly people, rural dwellers and low-income persons do not use the opportunities provided
by information society.3. Low degree of availability and mutual integration of public electronic services (in particular
in health care) and intellectual transport and management services.4. Lack of digital information and data in the Lithuanian language.
Globally, public strategies in the area of development of information society are implemented, either directly or indirectly, in three directions: development of e-infrastructure, creating e-content and e-services, and building e-capacities. Well-developed ICT infrastructure is an important precondition enabling people to make use of opportunities provided by information society. However, such infrastructure may lose significance if e-content and e-services meeting the needs of businesses and citizens are not created and provided, or if businesses and citizens will have no knowledge or capacities to use them. Only a uniform development of the aforesaid directions can create an advanced information society, i.e. a society which is educated and is learning continuously and the members of which act on the basis of information, knowledge and opportunities provided by advanced IT. Therefore, in order to increase the number of Lithuanian people using ICT, reduce digital divide, and promote the economy based on the advanced technologies, efforts should be focussed on the development of e-infrastructure, e-content and public e-services.
Public e-services for residents and businesses will be implemented in order to increase efficiency of public administration bodies and to provide health, learning and public procurement services. Solutions aimed at promoting e-democracy processes will be implemented. By the development of e-content, the scope of Lithuanian online content is to be increased by digitalising and disseminating the Lithuanian cultural heritage and enabling Lithuanian residents to use ICT with Lithuanian interfaces. These lines of development should contribute to reduction of digital divide by ensuring that technologies are easy to use and are adapted to disabled people.
In the course of infrastructure development, favourable conditions will be created for the provision of public services after interoperability of public information sources (registers and IS) is achieved. As service provision systems become more open, systems’ security must be ensured; underdevelopment of communications infrastructure in the country creates the need for investments in broadband connection last-mile solutions.

The spread of technologies will contribute to the development of economic infrastructure; interaction among businesses, in particular SMEs, will be promoted, which, in its turn, will encourage development of the regions and social cohesion. Effective public services and content development will result in a huge potential for economic growth and emergence of new activities. The works to be implemented will create favourable conditions for Lithuanian residents to make better use of advantages provided by information society and to improve skills and compete in the labour market more successfully.
The investment areas planned under this Priority have been harmonised with the EU and Lithuanian strategic documents regulating the implementation of EU cohesion policies in 2007–2013 and the development of information society. The Priority is in line with Objective 3 “Promote information society for all” of the priority “Knowledge and innovations for economic growth” under the Community Strategic Guidelines “Cohesion Policy Supporting Economic Growth and Jobs” (2007–2013) and has been harmonised with the Commission Communication “i2010 – Information society of Europe to Promote Growth and Employment”. As information society is a horizontal area, the Priority will contribute to the attainment of all the objectives identified under the Lithuanian Strategy for the Use of EU Structural Assistance for 2007–2013.
The National Programme Implementing the Lisbon Strategy emphasises the necessity to create conditions, in the area of use of ICT, for the increase in residents’ competences and social cohesion, modernisation of public administration through the use of IT, and promote the economy based on knowledge, innovations, research results and IT. Analogous objectives have been established in the Lithuanian Information Society Development Strategy, which also points out to the need to use the ICT advantages, foster and disseminate Lithuanian culture, encourage creativeness and cultural diversity in the society, and ensure the preservation of the Lithuanian cultural heritage and the Lithuanian language.
Compatibility with Other EU-supported Measures
Investment areas supported under the priority “Information society for all”, in particular development of ICT infrastructure in rural areas, will create favourable conditions to attain the identified rural development objectives and to improve quality of life in rural areas of the country by promoting diversification of economic activities, increasing entrepreneurship and improving infrastructure. The investment areas of this priority should also create conditions for reducing shore regions’ dependence upon fishing, and measures applied would have a positive effect on the development of the fisheries sector and coastal areas.
The priority “Information society for all” is closely related to the multi-annual Community programme eContenplus (2005–2008), the purpose of which is to make the Community’s digital content more accessible, convenient and suitable for use to facilitate the creation and dissemination of information on Community level in the areas of public interest, and eTEN initiative encouraging the implementation of trans-European information society services in such fields as e-government, e-health etc. The investment areas supported by the priority “Information society for all” and related to the development of Lithuanian digital content will complement eContenplus and eTEN transnational initiatives.
It should be noted that projects on innovations and research in ICT supported by the 7th Framework Programme should also facilitate implementation of the priority “Information society for all”.
Information on demarcation lines regarding compatibility of investments foreseen under this priority with assistance planned under other Operational programmes and priorities is provided in the Annex V “Compatibility of assistance with other operational programmes and other EU financial instruments”.

Estimated Expenditure Breakdown by CategoriesBreakdown of expenditure by priority themes
Code Name Financial share (EUR)
10Communications infrastructure (including broadband) 43.215.638
11
ICT (access, security, compatibility, risk prevention, research, innovations, e-content etc.) 55.219.981
13Services and content to citizens (e-health, e-government, e-learning, e-inclusion etc.) 100.836.487
14
Services and content to SMEs (e-commerce, education and training, network development etc.) 40.814.769
TOTAL 240.086.875Breakdown of expenditure by financing method
Code Name Financial share (EUR)01 Grant 240.086.875
TOTAL 240.086.875Breakdown of expenditure by type of area
Code Name Financial share (EUR)00 N/a 240.086.875
TOTAL 240.086.875
Cross-financing
Cross-financing can be used while implementing this Priority, allowing to fund activities supported by ESF. Cross-financing must meet the following criteria:1. ESF financed activities, should be implemented as constituent part of the operation carried out under this priority;2. ESF financed activities should be necessary for the successful achievement of objectives and results of the operation under this priority.
Investment areas under the Priority
Action group 1: Development of e-services and e-content
E-government services: the aim is to develop a comprehensive model for the promotion of the use of ICT advantages and increasing ICT efficiency in the public sector by adapting e-services to the needs of businesses and citizens. In this area, support will be continued for projects on the implementation of public electronic services both on national and regional level.
E-health services: the aim is to reduce treatment and administration costs, provide distance health services, increase access to information and its sharing by health care establishments, ensure security of information. E-solutions for the making of entries in patients’ medical files and for developing medical research e-centres and patient health monitoring systems will be implemented.
85

Development of e-health services should increase the efficiency of the health care system thus improving quality of life for the country’s residents. Such projects should be mainly focussed on transferring preventive and consulting health services to the electronic environment.
E-learning services are aimed at developing the provision of distance learning services and implementation of a high-quality reliable system for the creation of learning content and for its delivery to learners thus ensuring wider learning opportunities and implementing strategic provisions of lifelong learning. For this purpose, learning content repositories must be created and public access to them must be ensured. Provision of e-learning services must become an independent learning area, complement other methods of learning and enable learners to receive learning, retraining and skills improvement services at convenient time and location. E-learning projects should be focused on the development of e-learning tools and transfer/adaptation of content.
E-public-procurement will be developed, with projects focussed on interactive electronic public procurement services. The projects must create value added in the fields of transparency of procurement procedures and of information flow management.
E-business is aimed at promoting cooperation among businesses by developing opportunities concluding online transactions, establishing virtual business information and consulting centres, and multimedia software (including open source) and hardware environment.
E-democracy: support for the development of electronic systems enabling citizens to express their opinion on different state or regional matters; development of tools enabling residents to learn more about decisions of the authorities pertaining to their life and make comments on draft legal acts, hold discussions, exchange opinions and vote; and of involving young people into their societal environment.
Lithuanian language and culture: development of digital information services by establishing full-text databases and interactive multimedia services on the basis of data and articles accumulated in state archives and other archives, museums and libraries. Systems for the management and search for content of libraries, museums and archives are to be developed and integrated online.
The use of ICT should also help ensure preservation of the Lithuanian language and its use in all areas of public life taking account of globalisation processes, EU integration, and development of global knowledge society.
Archives of research data: it is important to develop modern information infrastructure for science and digital systems of research outputs, providing distance access and search opportunities. Digital archives if empirical data, methodological and other research information (questionnaires, data encoding schemes, project reports, research papers, patents and other scientific outputs) will encourage secondary use of data in science and education and create opportunities for conducting reliable comparative research both in Lithuania and aboard.
Intelligent management systems: application of state of the art IT, geographical information systems (GIS), global positioning systems (GPS), GRID computing models is aimed at creating and developing intelligent management systems designed for such areas as transport (traffic control, passenger information, navigation, transport control and e-payment – defined as ITS by ISO), civil safety (emergency response services, ensuring safety, control of extreme situations), geodesy (management of horizontal and vertical basis), engineering communications and environment (environmental monitoring, territorial planning, environmental quality management) and on both national and municipal levels. Implementation of intelligent management systems will create
86

opportunities for using common information resources and sets of geographic data complying with the EU acquis and both international (ISO, OpenGIS) and EU standards. Through implementation of these projects, information society services for residents and businesses must be established, or a business infrastructure proving equal opportunities of use for all entities.
Digital Television. Solutions promoting development of digital TV in Lithuania will be developed. Faster implementation of digital TV in Lithuania would allow timely and smooth abandonment of analogue TV, reallocation of resources currently assigned to analogue TV and using them for the introduction of new technologies.
Action Group 2: Development of Infrastructure
Broadband electronic communication networks: the aim is to create, through the maximum use of existing or developed infrastructure, an electronic network infrastructure that would enable all public administration institutions as well as all SMEs and residents to use broadband Internet and digital TV at an affordable price and thus create conditions for the reduction of digital exclusion in the country. The broadband communications infrastructure will be developed only in rural (“white”) areas where no commercial initiatives in this sector exist, and will fully respect principles of open access and technological neutrality.
Compatibility: IS and registers managed by state institutions should be integrated striving for the use of a single standardised data interchange model by the IS of all the state institutions, while systems being developed would operate open standards. These investments would enable the provision of services to residents and business on one-stop-shop basis and data interchange among state institutions would be simplified.
Electronic security: tools should be developed to ensure reliable identification of persons in the IS and confirmation of authenticity and integrity of electronic documents. For this purpose, legally-valid electronic signature will be used to certify responsibility and a relevant certificate will confirm identity of the signatory. E-signature, its certificate, additional services such as electronic time-stamp, archives for long-term storage of documents etc. are indispensable components of a secure electronic environment.
Other tools to be developed include electronic communication and IS security measures, copyright security management systems, risk management systems, incident control systems, and tools of protection against undesirable and harmful Internet content. They must protect public IS providing e-services from external and internal impact, guarantee personal data protection, and ensure confidentiality, integrity and accessibility of information being managed.
87

2.5. PRIORITY 4: BASIC ECONOMIC INFRASTRUCTURE
2.5.1. Investment area: Energy Supply Networks
Tasks of the Action Group
Two main objectives have been set for the energy supply network development under this Priority:1. Provide technical feasibility and environmental preconditions for the integration of the Lithuanian electricity and gas markets into single electricity and gas markets of the EU;2. Increase reliability and safety of energy supply.
Description
Investments in the modernisation and development of power and gas networks will create technical and environmental preconditions for the integration of the Lithuanian power and gas markets into the EU single markets for gas and electricity. As now Lithuanian power and gas markets are isolated from the EU single gas and electricity markets, energy price setting mechanisms cannot be fully operative and customers cannot actually choose an energy supplier although there are legal conditions for this. If Lithuania wants to become a full-fledged member of the EU energy markets, firstly, Lithuania’s energy networks must be connected with the Western European and Nordic energy networks; due to huge scope of investments they will be largely financed from other sources; secondly, Lithuania must properly prepare its networks for the participation in the EU single gas and electricity markets – part of the SF assistance will be earmarked for this purpose. These investments will create preconditions for the elimination of a key deficiency identified by SWOT analysis, namely, absence of energy connections with the power and natural gas systems of Western European and Nordic countries. This, in its turn, will reduce the degree of one of the key threats – vulnerability of energy supply to Lithuania.
High energy losses are incurred in Lithuania’s energy networks and systems, in particular district heating systems. This, in its turn, has a negative impact upon final energy prices paid by customers, reducing competitiveness of Lithuanian industries. The utilisation of SF assistance will reduce power and heat energy transportation losses by 2–3 percentage points.
SF assistance investments in the modernisation and development of energy networks by introducing new technologies will contribute both to the lowering of energy prices and positive effect upon the import/export balance of the country as the majority of fuel is imported. At the same time, reliability and safety of supply will increase – this cannot be guaranteed by the present old technologies and equipment. One of the weaknesses identified in SWOT analysis, namely, insufficient degree of energy supply reliability, will be mitigated.
Investments in energy networks will be carried out exclusively within the Operational Programme on Economic Growth.
Investments in energy infrastructure will contribute to the creation of favourable conditions for business and innovations. A well-developed and reliable energy infrastructure will create a favourable climate for the formation of new enterprises and development of business.
Modernisation and development of energy networks will also contribute to higher quality of life and stronger cohesion. In small towns and regional centres of Lithuania, these processes will increase their attractiveness for investments and promote development of socio-economic infrastructure thus contributing to the implementation of the local and urban development priority. This will also help
88

achieve better quality of the environment as opportunities will be created for the use of less-polluting organic fuel (natural gas). Development of district heating systems and networks will enable a reduction of local pollution, wider and more efficient use of renewable fuel and efficient co-generation plants.
Compatibility with Other EU-supported Measures
As Lithuania seeks full integration with the EU single markets for energy, it has to connect its networks with the energy networks of Western European and Nordic countries. Part of the energy interconnection projects will be funded by the EU through the Ignalina NPP Closure Programme; other projects may be co-financed by companies participating in the projects. SF assistance funds will be earmarked for investments in Lithuanian energy transmission and distribution networks. These financing sources will be coordinated while implementing necessary investment projects, providing conditions for full integration into EU’s single electricity and gas markets.
Estimated Expenditure Breakdown by CategoriesBreakdown of expenditure by priority themes
Code Name Financial share (EUR)33 Electricity 44.007.77835 Natural gas 26.698.052
43Energy efficiency, co-generation, energy management 73.346.296
TOTAL 144.052.125Breakdown of expenditure by financing method
Code Name Financial share (EUR)01 Non-repayable aid 144.052.125
TOTAL 144.052.125Breakdown of expenditure by type of area
Code Name Financial share (EUR)00 N/a 144.052.125
TOTAL 144.052.125
Areas of investment
Neither power transmission nor power distribution networks are duly prepared for full integration into the EU’s single electricity and gas markets. Energy networks lack physical connections, i.e. power transmission connections with the EU electricity systems and gas pipelines that would enable gas supply from sources other than Russia; the structure of the national networks is not fit for energy exchange with the EU countries. Therefore, power and gas transmission and distribution networks and systems will be reinforced and modernised and new power transmission lines and transformer substations, strategic gas mains and compressor substations will be constructed. Such investments will enable Lithuanian power and gas markets to integrate into the EU single markets for energy. Construction of an underground natural gas storage and/or liquefied natural gas terminal in the territory of Lithuania/Baltic States will considerably increase the gas supply security.
At present gas systems do not cover the whole territory of Lithuania. Due to insufficient customer density it is not cost effective for the natural gas supplier to extend its distribution network.
89

Analogous situation is observed in the power sector where part of the outlying (remote) objects are not connected to the distribution network. To correct these market deficiencies investments in the power and gas distribution network development projects will be made.
To ensure safe and reliable supply of energy heavy investments are required in the modernisation of existing power, gas and, in particular, heat supply networks and systems. Old equipment are outdated in all respects, failures are frequent, and high energy losses are incurred. It is expected that safety and reliability will be markedly increased by the replacement of overhead electricity lines with cables and by employing new technologies in the modernisation and renovation of transformer substations and heat supply networks.
In order to improve quality and increase reliability of heat supply, heat supply pipelines of old construction will be replaced with modern and effective trenchless systems. Group heat substations will be abandoned and individual heat substations will be installed in all multi-apartment buildings and administrative buildings. As distances between heat supply sources and customers have become larger, qualitative regulation of heat supply has become ineffective and heat networks will be reorganised in order to shift to quantitative regulation.
To ensure reliable and stable operation of modern infrastructure of energy supply, automated data collection and transmission, energy accounting and energy demand forecasting systems will be implemented.
Underdevelopment of district heating systems is also a hindrance to the development of efficient co-generation plants in Lithuania. In order to create conditions for the increase in the share of power generated through an efficient co-generation process and/or for a more efficient use of existing heat generation facilities where sufficient customer density exists, district heating networks will be expanded.
2.5.2 Action Group 2: Transport Network
Objectives of the Action Group
Main objectives of the Action Group:
1. Implement engineering measures for traffic safety.2. Improve technical parameters of transport infrastructure of national and regional significance.3. Development of regional water transport infrastructure.
Description of the Action Group
Transport infrastructure plays an important role in the attainment of one of the key objectives of the EU: to reduce social and economic disparities among the regions. An effective network of transport infrastructure countervails an uneven distribution of economic potential among regions of the country, enables businesses to expand sales markets, and promotes labour force mobility and social cohesion.
Customer requirements for the standards of transport services and quality of infrastructure grow along with the growth of the national economy and living standards. Taking these changes into consideration, the national and local transport network must be constantly developed in order to ensure access to markets and appropriate economic ties among areas.
Modernisation and development of the regional transport infrastructure network will contribute considerably to the achievement of higher quality of business environment and more effective implementation of social cohesion objectives. Proper condition of transport infrastructure will help attract investments to settlements, small towns, municipalities and other administrative centres, ensure urban-rural mobility, and reduce unemployment rate. Within the framework of this Priority, conditions for communication between business centres and residential areas, reduction of infrastructure and vehicle maintenance costs, and shortening transportation times will be
90

consistently created. It is expected that, after improvement of technical parameters of transport infrastructure, both accident rates and negative environmental impact will be reduced considerably.
Modernisation of roads, railways, waterways and multimodal transport of both national and local significance infrastructure will undoubtedly promote development of business, local markets will be provided with products and local goods will be realised, local tourism and other services’ potential will be more effectively utilised, labour force mobility needs will be better met, and will positively influence upon the processes of reduction of regional economic development disparities.
Compatibility with Other EU-supported Measures
The projected actions are directly related to the provisions of the EU transport policy set out in the White Paper and other assistance instruments (Marco Polo, INTERREG etc.).
Information on demarcation lines regarding compatibility of investments foreseen under this priority with assistance planned under programmes financed by EAFRD and EFF is provided in the Annex V “Compatibility of assistance with other operational programmes and other EU financial instruments”.
Estimated Expenditure Breakdown by CategoriesBreakdown of expenditure by priority themes
Code Name Financial share (EUR)16 Railways 22.942.11918 Mobile rail assets 8.097.21822 National roads 229.773.24123 Regional (local) roads 49.592.52925 Urban transport 74.388.79330 Ports 52.103.840
31Inland waterways (regional and local) 5.808.874
TOTAL 442.706.615Breakdown of expenditure by financing method
Code Name Financial share (EUR)01 Non-repayable aid 442.706.615
TOTAL 442.706.615Breakdown of expenditure by type of area
Code Name Financial share (EUR)00 N/a 442.706.615
TOTAL 442.706.615
Areas of investment
1. Rehabilitation of bridges, crossings and intersections, building of pedestrian and bicycle paths and implementation of other traffic safety measures.
2. Paving of gravel roads, improvement of national, regional and local roads surface, increasing capacity of connecting railway lines, and improvement of quality of public services to passengers.
3. Development of infrastructure for local and regional navigation, improvement of passenger service capacities.
91

Roads. The number of road accidents in Lithuania is increasing along with the growth in the number of vehicles and in the traffic intensity. Compared to other European states, Lithuania’s accident rates are among the highest ones, therefore, much attention must be devoted to ensuring traffic safety. Investments in the regional road infrastructure will be earmarked for the implementation of traffic safety improvement measures and for the reduction of negative environmental impact. Therefore, intersections at the entrance to towns and settlements will be reconstructed into ring and streetlight-controlled intersections, multi-level intersections and crossings will be build, sections of roads lighted, technical condition of vehicles will be controlled more effectively and other traffic safety measures implemented. Implementation of engineering infrastructure for traffic safety will reduce accident rates, number of killed and injured in the roads, and losses incurred by the national economy.
Gravel roads or roads with worn-out asphalt covering account for the majority of Lithuanian roads. The worst technical condition is observed on those roads where traffic loading is constantly increasing and road surfaces fail to protect the road structure from traffic loads and atmospheric effects. On such roads vehicles raise dust and make noise, which worsens living conditions for residents and results a negative environmental impact. Paving of gravel roads and reconstruction of certain road sections will improve communication with outlying regions, environment for investments and cooperation among businesses will improve, and labour force mobility will increase.
Railways. As carriage volumes are increasing, conditions for the provision of railway services must be improved and capacity of connecting railway lines must be increased, with a due attention to traffic safety. Therefore, railway lines will be modernised by restoring top railway structures, bridges and overpasses and upgrading power supply, signalling, communications and telecommunications systems, a system for infrastructure diagnostics and an updated system for management of emergency and crisis situations on railways will be implemented.
Modernisation of railway lines will improve traffic safety and reliability of passenger carriage and create an opportunity for increasing the share of railway carriage in domestic carriage volumes. To improve transport services and their quality, railway stations and terminals will be reconstructed and other railway infrastructure objects renovated, new rolling stock, emergency response equipment and rail maintenance and repair machinery acquired.
Water transport. In order to create conditions for the development of offshore and inland waterways navigation, it is necessary to modernise regional infrastructure for water transport and to promote commercial, sea tourism and recreational navigation. For this purpose, Šventoji harbour that had functioned in interwar period will be restored; the harbour will be intended for yachts and small cruise ships, shoreline fishing vessels, ships of the Border Guard Service and ships ensuring safety of Būtingė Oil Terminal. In addition, inland waterway infrastructure will be improved in order to create better conditions for both cargo and passenger carriage by the Nemunas River. This will promote regular and recreational navigation and contribute to the development of agriculture, fishery and other sectors.
As the number of small ships and boats is increasing in Klaipėda Seaport and the traffic of sea vessels in the waterway is intensifying, navigation of small boats in the waterway is becoming dangerous, therefore such boats should be relocated to the southern part of the port. This should increase navigation safety and compliance with the ISPS standards will be ensured.
92

2.6. PRIORITY 5: DEVELOPMENT OF TRANS-EUROPEAN TRANSPORT NETWORKS
Objectives of the PriorityThis priority will be financed from the Cohesion Fund. Considering current situation of the Lithuanian transport system, economic growth and social needs, growing requirements for traffic safety and environmental protection, the following objectives for the development of transport in Lithuania have been set in accordance with the latest provisions of the EU transport policy and plans for the development of the common-interest EU transport infrastructure, also with the aim of ensuring continuity of current projects and programmes:1. Development of land transport infrastructure links with other EU Member States and third countries; adaptation of TEN-T to the growing traffic intensity.2. Better utilisation of the potential of the Klaipėda Seaport as the most important transit hub of the country; increase of the competitiveness of Klaipėda Seaport.3. Development of infrastructure capacities of the international airports.4. Reduction of accident rates and congestion in the TEN-T network.
Description of the Priority
In the new EU Member States, modernisation and development of main transport infrastructure lines, in particular those which form part of the trans-European network (TEN-T), play a significant role in the development of individual regions and contribute to their integration both into the EU single market and the global economy. Modern transport infrastructure creates new opportunities for the national market by creating new jobs and developing production and services.
TEN-T infrastructure (roads, railways, seaports and airports) will be modernised and developed in a comprehensive way in order to ensure sustainable development of different modes of transport as well as their interaction with the transport systems of the EU Member States and third countries.
Globalisation processes will influence the formation of multimodal transport centres and other business centres (clusters) at modern transport main lines.
The establishment and development of a modern North-South transport axis (Tallinn–Riga–Kaunas–Warsaw) connecting the Baltic States and Poland will meet the growing needs of trade and services of the EU Member States. The key priority in this area is to create necessary conditions for interoperability with the EU railway network through the implementation of the Rail Baltic project. Modernisation of Via Baltica highway will be continued.
Modernisation of the infrastructure of the West-East transport axis, which is already characterised by intensive transit flows, is also very important for Lithuania. Efforts will be put forth to form an effective transport link in the rapidly developing transport network of the Baltic Sea Region, which will also contribute to the development of transport flows of the EU internal market and between Europe and Asia.
To increase competitiveness of the Lithuanian economy, a modern transport infrastructure network will be created in line with the EU mobility needs, creating favourable conditions for economic development and social cohesion. Within the framework of implementation of this priority, multimodal transport infrastructure will be developed, interoperability and formation of logistics centres will be promoted, and new projects on the connection of Klaipėda Seaport with Nordic and other European countries by sea ways will be supported. Furthermore, conditions for communication by road and rail will be improved while ensuring compliance with international standards in terms of technical, technological, traffic safety and environmental parameters. Attention should also be focussed on the modernisation of international airports.

The modernisation of the Lithuanian transport system will be guided by the general guidelines for the development of TEN-T in order to ensure compatibility with the EU transport network and the Lithuanian section of TEN-T.
Compatibility with Other EU-supported Measures
The main provision of the EU White Paper is to focus the EU transport policy on the meeting of economic and social needs by improving traffic safety, ensuring high quality of service and modernising main transport infrastructure objects. The objectives identified in the TEN-T development guidelines and the Lisbon Strategy are in line with the main objectives of the transport infrastructure development for 2007–2013: modernisation of the transport infrastructure network meeting modern technical standards and satisfying the demand for goods and passenger transportation; promoting development of transit via Lithuania in the direction of main transport arteries; implementation traffic safety measures and reducing negative impact on the environment; improving interaction of transport modes (development of multimodal transport processes).
Objectives identified under the EU Marco Polo Programme aimed at improving environmental efficiency of the transport system and developing multimodal transport thus contributing to an effective and sustainable transport system are also related to the objectives of this strategy.
Estimated Expenditure Breakdown by CategoriesBreakdown of expenditure by priority themes
Code Name Financial share (EUR)
17 Railways (TEN-T) 535.359.806
21 Motorways (TEN-T) 232.609.10522 National roads 164.968.68327 Multimodal transport (TEN-T) 63.616.79629 Airports 48.066.02430 Ports 42.846.184
TOTAL 1.087.466.598Breakdown of expenditure by financing method
Code Name Financial share (EUR)01 Non-repayable aid 1.087.466.598
TOTAL 1.087.466.598Breakdown of expenditure by type of area
Code Name Financial share (EUR)00 N/a 1.087.466.598
TOTAL 1.087.466.598
Areas of Investment
1. Building of new lines, increasing capacity of infrastructure of other roads and railways of trans-European significance, improvement of technical parameters, and establishment of infrastructure necessary for the formation of public logistics centres.
2. Implementation of traffic safety infrastructure, building of by-pass roads around cities.
3. Dredging of the waterway for Klaipėda harbour, reconstruction and construction of quays, development of access roads and railways and passenger service infrastructure capacities.
94

4. Expansion of passenger terminals, implementation of new flight security and aviation safety measures, and formation of the passenger transit infrastructure.
Roads. Carriageways will be reinforced in the roads of trans-European significance due to increased traffic flows and axle loads, sufficient capacity of roads will be ensured, highway network will be improved and rehabilitated by building new by-pass roads, increasing the number of lanes, and implementing engineering infrastructure for traffic safety and environmental measures. Highway development works will include construction of multi-level intersections, safe crossings for pedestrians and cyclists, rehabilitation and development of connecting roads adjacent to highways, and construction of continuous barriers dividing the highway.
Railways. Present state of railway infrastructure and rolling stock hinders increase in carriage efficiency. In order to achieve higher train speed and increase traffic safety, technological, environmental and economic parameters of the railway system will be consistently improved using advanced technical solutions and technologies; railway lines of trans-European significance will be modernised and their capacity increased; signalling and telecommunications systems will be upgraded. To form a modern North-South transport axis, Rail Baltica – a railway line complying with the European standards will be built. Projection works of Rail Baltica route between the Poland-Lithuania border and the intersection of I and IX corridors are being implemented by using finances of the TEN-T fund. Finances of the Cohesion fund are planned for the construction of this stage in 2007-2013. The rest part of the Rail Baltica that stretches to Latvia border will be developed and modernized in the future.
Water transport. In order to increase capacity and competitiveness of Klaipėda Seaport, goods and passenger service infrastructure will be modernised, which will create conditions for increasing the flows of passengers and cargoes transported by Ro-Ro, Ro-PAX and passenger ships; the demand for services (such as hotels and restaurants) will grow, tourism services will become more viable and additional jobs will be created. Dredging works will be carried out, quays will be rehabilitated and constructed, and interaction between the seaport and rail/road transport will be improved. All measures shall be taken to ensure that the effects caused by the works on the environment, and in particular on the aquatic resources of the Baltic Sea and the Curonian Lagoon, will be minimised as much as possible. Capacity and safety of access roads will be improved and the negative environmental impact will be reduced.
Air transport. Infrastructure of Lithuania’s international airports does not ensure high quality of service for increasing passenger and cargo flows; no appropriate transit services are provided. In order to increase passenger and cargo service standards and to properly respond to the forecast growth in demand, the airport and air traffic control infrastructure will be improved, new flight security and aviation safety measures will be implemented, and competitiveness of airports will be increased. This would allow increasing limit capacity of the airports and to improve quality of service; provision of airport and traffic control services will comply with the latest flight security and aviation safety requirements.
Logistics centres. In order to make use of infrastructure capacities available in different modes of transport and to increase cargo multimodality and efficiency of carriage, public infrastructure for the establishment of modern logistics centres will be developed and integrated into the network of logistics centres in Europe and in the Baltic Sea Region. Conditions for the development of multimodal transport will be formed, additional jobs created, and business environment improved.
95

2.7. PRIORITY 6: TECHNICAL ASSISTANCE FOR THE IMPLEMENTATION OF THE OPERATIONAL PROGRAMME ON ECONOMY GROWTH
Priority description
A common national system for management and control of EU structural assistance will be created to administer all thematic operational programmes implementing the Lithuanian Strategy for Utilization of Structural Support for 2007–2013. The system will feature the common institutional structure and processes and procedures, which shall ensure compliance with sound financial management principles. The system is aimed to be as simple, transparent and understandable to applicants and controlling authorities as possible.
The Ministry of Finance shall be in charge of ensuring proper performance of the Managing Authority and Certifying Authority functions for the mentioned thematic operational programmes. A significant share of those functions will be executed by the same organisation, the Ministry of Finance, and financed by the special Operational Programme for Technical Assistance for 2007–2013, which is designed to support horizontal aspects of administration: they would include preparation, management, monitoring, evaluation and informational activities as well as activities intended for strengthening administrative capacity of utilization of the support of EU structural assistance. The special Operational Programme for Technical Assistance will render technical assistance to the activity related to more than one thematic action program, i.e. is not limited solely to implementation of one of the thematic action programs, of all institutions involved in implementation of the EU structural support. The activities will be such as preparation, management, supervision, assessment and information as well as activities designed to strengthen administrative skills related to using EU structural support.
The other part of functions of management and control authorities (especially that of the functions assigned to a managing authority by Council Regulation No. 1083/2006) will be delegated to other authorities: Ministries and Agencies. Besides, experience shows that the practical implementation of operational programmes is not limited only to the execution of functions provided for in EU regulations; therefore, it inevitably involves a wider range of Lithuanian public administrative institutions, which participate in planning, coordination and supervision of implementation of the programme, its priorities or projects.
This priority will be financed from the Cohesion Fund. The following tasks are pursued in order to implement the requirements of Council Regulation No. 1083/2006 to ensure quality of the implementation of operational programmes, to create an appropriate system for management and control of assistance, and to ensure its effective functioning, to ensure the compliance of the expenses declared to the European Commission for financing from funds of structural assistance, to bar the way to fraud, to detect and eliminate violations as well as in order to strengthen assistance management and control capacity in this priority:
To ensure the effective functioning of the system for management and control of the EU structural assistance received under the Convergence Objective in the course of the implementation of this Operational Programme on Economic Growth; To improve awareness of the potential beneficiaries, beneficiaries and partners about the assistance provided by the Operational Programme on Economic Growth and results of
96

its implementation, to perform evaluation activities of the Operational Programme on Economic Growth.
Effective functioning of the system for management and control in the course of the implementation of this Operational Programme on Economic Growth
As is provided for in the below description of the system for the implementation of this Operational Programme, in the course of its implementation, the Managing Authority, without delegating the responsibility for the attributed functions as required by Article 58(2) of the General Regulation, will delegate part of the functions and, in addition, will rely upon assistance from state authorities responsible for specific political areas. For instance, it is provided that the implementation of this Operational Programme will be participated by the Ministry of Economy, Ministry of Education and Science, Ministry of Transport and Communications, Information Society Development Committee under the Government of the Republic of Lithuania as well as the Lithuanian Business Support Agency, Transport Investments Directorate, Central Project Management Agency and “Investment and Business Guarantees” Ltd.
Thus, technical assistance to be provided under this priority will help institutions involved in the implementation of the Operational Programme on Economic Growth (the abovementioned and others) to carry out effectively and in a quality manner evaluation and selection actions, actions for supervision of the implementation of projects and compliance for financing from funds of structural assistance, identification and audit actions as well as other actions inseparably related to this Operational Programme.
Information to society about the assistance provided by the Operational Programme on Economic Growth and results of its implementation, performance of ongoing evaluation of the Operational Programme on Economic Growth.
It is important to emphasise that the technical support under this priority will be allocated not only to the administrative system itself, but also to the environment; first of all, to potential beneficiaries, beneficiaries and partners and the general public. In order to prepare and implement the Lithuanian Strategy for Utilisation of the EU Structural Assistance for 2007-2013 and projects meeting the goals and tasks of the Operational Programme on Economic Growth, the potential beneficiaries of projects of this Operational Programme should be constantly informed about those goals and tasks and understand well what types of projects are appropriate for financing from the funds of the Operational Programme on Economic Growth.
The general public should also be constantly informed about the intent, goals, implementation progress and results of the Operational Programme on Economic Growth in order to ensure that those are understood adequately.
Preparation and supervision of the implementation of the information to society and publicity strategy constitute an integral part of the aforementioned administrative system. However, this priority will also actively support the implementation of this strategy and action plan through specific actions related to the publicity of the Operational Programme on Economic Growth. For instance, targeted events – seminars, conferences, information days will be arranged, special reports in the mass media and means of information and publicity will be prepared and published, informational and good practice promotion publications will be issued; other actions facilitating assurance of publicity of the Operational Programme on Economic Growth will also be supported.
97

The evaluation of the Operational Programme on Economic Growth will be organised on the basis of the same principle: preparation of the evaluation plan, evaluation actions planning and coordination constitute an integral part of the aforementioned administrative system. However, alongside with that this priority will also support the evaluation activities related to the proper implementation of this programme, examining the degree of efficiency and effectiveness achieved, mostly on the basis of output and result indicators.
Compatibility with the Operational Programme for Technical Assistance
Activities related to management and control systems
The technical assistance will be provided under this priority to the activities of institutions involved in the implementation of the Operational Programme on Economic Growth related exclusively to the implementation of this Operational Programme.
In case the same institution will be involved in the implementation of more than one Operational Programme, its activities could be financed from the Technical Assistance Operational Programme.
Activities related to the publicity and evaluation
The publicity and evaluation activities related exceptionally to the Operational Programme on Economic Growth will be financed under this priority.
The publicity and evaluation activities related to more than one Operational Programmes will be financed from the Technical Assistance Operational Programme.
Estimated Expenditure Breakdown by CategoriesBreakdown of expenditure by priority themes
Code Name Financial share (EUR)
Technical assistance 85 Preparation, implementation, monitoring and inspection 35.859.83686 Studies and evaluation, information and publicity 8.964.959
TOTAL 44.824.795Breakdown of expenditure by financing method
Code Name 01 Grant 44.824.795
TOTAL 44.824.795Breakdown of expenditure by type of area
Code Name 00 N/a 44.824.795
TOTAL 44.824.795
98

2.8. CORRESPONDENCE TO HORIZONTAL THEMES AND THEIR IMPLEMENTATION
2.8.1 Development of Information Society
Increasing use of IT by businesses and households create a basis for the introduction of innovations in business. Within the framework of implementation of Priority 1 “Research and development for competitiveness and growth of the economy”, IT will be widely used in joint projects by businesses and research organizations. Higher degree of use of IT at business support organisations achieved through the implementation of Priority 2 “Increasing business productivity and improvement of environment for business” will make public R&D and innovation promotion services more effective and implement cooperation projects, in particular international projects. On the other hand, as a result of implementing the Operational Programme on Economic Growth along to the lines of promoting innovation and cooperation between business and research, by developing innovation-friendly infrastructure and by supporting projects on promoting innovations and entrepreneurship and on improvement of service quality and accessibility, the use of IT in business will grow considerably.
All action groups of the Information Society for All Priority are directly intended for the promotion of the information society development processes in the country.
While implementing measures identified under the area of investment “Energy supply networks” of the Priority “Basic Economic Infrastructure”, higher-level IT technologies will be employed and energy facilities will be modernised. Projects on the implementation of SCADA, automated electricity accounting systems and power demand forecasting systems will also contribute to the development of information society.
2.8.2 Equal Opportunities
Direct support for R&D and innovation projects will be rendered without violating the principle of equal opportunities.
Under the Priority “Favourable conditions for business and innovations”, women’s entrepreneurship will be encouraged by increasing quality of and accessibility to public services for business, implementing entrepreneurship promotion programmes and improving access to financing sources, in particular microcredits.
The Information Society for All Priority will form preconditions for the equal opportunities development in the country so that everybody can make use of the ICT advantages such as public electronic services, e-health services, intelligent transport system services, abundant digital content in the Lithuanian language, ICT infrastructure etc. The implementation of the Information Society for All Priority will be focussed on the main principles of the electronic inclusion policy so that ICT use is facilitated for all social groups.
2.8.3 Sustainable Development
Under the priority “Increasing business productivity and improving environment for business”, it is expected to reduce the share of energy-intensive and polluting industries by supporting development of high and medium-high technologies and encouraging businesses from traditional sectors to employ innovations and acquire new technologies. Eco-innovations employed by businesses will have a considerable positive impact upon sustainable development.
Formation of an environment favourable to business and innovations will indirectly influence sustainable development as development of less energy-intensive sectors will be promoted and businesses will be encouraged to employ energy saving and clean technologies.
99

Measures of the area of investment “Energy supply networks” of the Priority “Basic Economic Infrastructure” are in line with the long-term objective identified in the National Sustainable Development Strategy: “form a sustainable energy sector capable of competing in an open international energy market and providing all industries of Lithuania with energy in a reliable and safe manner; increase efficiency of energy generation and distribution”. Investment areas identified for 2007–2013 also conform to the following areas designed for the implementation of long- and medium-term objectives of the National Sustainable Strategy:
modernise and develop district heating systems, renovate heat supply networks, create conditions for heat producers to compete and for consumers to regulate heat consumption;
renovate the power supply infrastructure (modernise substations, partially renovate power transmission and distribution networks);
extent natural gas distribution networks;
prepare and launch long-term municipal heat facilities plans.
The Priority Information Society for All will directly contribute to the implementation of several priorities identified in the National Sustainable Development Strategy. Development of ICT infrastructure in rural areas, transfer of public services to electronic environment according to the principles of electronic inclusion policy will reduce socio-economic discrepancies both among regions and within regions and will contribute to the reduction of social exclusion. Digitalisation of cultural heritage will ensure preservation of cultural heritage and will improve its dissemination. Provision of e-health services will have a positive impact on people’s health, while intelligent management systems services will create conditions for the resolution of issues related to rational use of natural resources, reduction of environmental pollution, rational urbanisation and effective management of emergencies posing a threat to human health or the environment. For the implementation of the supported measures, which will be developed through employment of latest IT, GIS, global positioning (GPS, Galileo), GRID and other advanced systems and tools, national resources in the areas of science, technology, business and information society will be used, which should have a positive influence upon many industries and directly contribute to the country’s sustainable development.
Reconstruction and development of components of the regional transport network, implemented under the Action Group “Transport Network” of the Priority “Basic Economic Infrastructure” will help ensure traffic safety, reduce transport operation costs, improve technical parameters of infrastructure, reduce environmental pollution and noise levels and at the same time improve conditions for the functioning of local business and labour mobility.
Reconstruction and development of TEN network under the Operational Programme Priority “Development of trans-European transport networks” will help increase traffic safety, reduce transport operation costs and environmental pollution and noise levels.
In order to ensure better integration of this horizontal priority, sustainable development will be monitored on the basis of indicators established for the Operation Programme on Economy Growth (see chapter 4 "Quantification of Objectives"). Sustainable development indicators will be evaluated and monitored by the Monitoring Committee. Integration of environmental issues will be also ensured during the decision-making process through establishment of environmental criteria for selection of projects.
As a rule and following the recommendation of the SEIA report all investment projects will be assessed in respect of impact on environment.
100

2.8.4 Regional Development
The Lithuanian Strategy for Regional Policy by 2013 identifies the priority line of regional policy for Lithuania: uniform territorial economic development of Lithuania, i.e. consistent and coordinated promotion of long-term economic development and increasing of competitiveness in regional centres surrounded by areas with low living standards so that such centres, having economic potential and infrastructure, would perform functions of regional growth centres, with their development increasing territorial social cohesion in the region and in Lithuania at the same time. The implementation tasks for the priority line of the Strategy as well as measures to carry out the tasks are to be realised by promoting development at 5 regional centres – Alytus, Marijampolė, Tauragė, Telšiai and Utena in the period by 2013.
The region of Ignalina Nuclear Power Plant should be separated out because negative social and economic consequences of decommissioning of NPP’s Units I and II are expected (Unit II will be decommissioned in 2009).
Implementation of the Operational Programme by providing direct support for investments, promoting and supporting technology transfer, innovation promotion infrastructure and services and the supply of public services for business, by improving access to different business financing sources and by developing public areas for investment will contribute to gradual diminishing of county development discrepancies, with the priority given to projects implemented in less developed regions and regional centres approved for development.
Within the framework of implementation of area of interventions “Energy supply Networks” under the Priority “Basic economic infrastructure” of the Operational Programme for Economic Growth”, the regional aspect may manifest itself in the area of district heating networks as district heating systems are substantially local. Renovation of district heating systems by shifting to advanced technologies would result in higher efficiency, higher reliability of heat supply and, at the same time, reduction of the heat energy price for customers. In addition, district heating systems can use different types of fuel, which means higher reliability of energy supply.
Development of natural gas distribution networks may produce a positive influence upon development of individual regions as much more favourable business conditions and better quality of life are ensured in regions with high gasification level.
Activities under the Information Society for All Priority such as development of ICT infrastructure in rural areas and provision of e-services on national and regional levels will reduce regional development discrepancies in terms of ICT and increase competitiveness and investment attractiveness of regions that presently lag behind other regions.
Activities implemented under the Priority “Basic economic infrastructure”, Action Group Transport Network, will improve communication with municipal centres for residents of outlying regions as well as communication between industrial, agricultural and service entities in both urban and rural regions. Modernisation of regional communication infrastructure will create favourable conditions for the development of SMEs and produce a positive impact upon economic development of regions.
Development of TEN-T under the Priority “Development of Trans-European Transport Networks” will improve communication among Lithuanian regions,, uniform development and reduction of discrepancies among regions will be promoted, business environment will improve and new jobs will be created.
101

3. FINANCIAL PLAN
Table 19. Breakdown of assistance by years and funds, EUR
Year ERDF Cohesion Fund Total2007 246.917.589 94.271.373 341.188.9622008 250.117.652 122.798.384 372.916.0362009 255.349.026 150.689.989 406.039.0152010 272.022.462 167.612.519 439.634.9812011 293.865.516 180.826.093 474.691.6092012 312.399.348 200.625.516 513.024.8642013 335.890.539 215.467.519 551.358.058
Total 1.966.562.132 1.132.291.393 3.098.853.525
Table 20. Breakdown of assistance by priorities, EUR
Priority Community financing
National public co-financing
National private co-financing
Total financing
Share of co-financing (%)
InformationEIB contribution
Other financing
1. R&D for competitiveness and growth of business 677.549.282 77.727.835 115.693.831 870.970.948 77,79 2. Increasing business productivity and improving environment for business 462.167.235 49.781.285 146.744.975 658.693.495 70,16 3. Information society for all 240.086.875 42.368.272 0 282.455.147 85,00 4. Basic economic infrastructure 586.758.740 78.124.697 77.566.529 742.449.966 79,03 5. Development of Trans-European transport networks 1.087.466.598 191.905.871 0 1.279.372.469 85,00 6. Technical assistance for the implementation of the operational programme on Economy Growth 44.824.795 7.910.258 0 52.735.053 85,00
TOTAL 3.098.853.525 447.818.218 340.005.335 3.886.677.078

4. QUANTIFICATION OF OBJECTIVES
A strong emphasis during the implementation of this Operational Programme will be placed on the on-going monitoring, which shall allow continuous estimation of the performance of the OP as well as enable take any corrective actions which may be required. For this purpose each objective of this operational programme has been quantified, wherever possible. Monitoring of its implementation will be based on the extensive and coherent system of monitoring indicators, which shall make the basis of the monitoring system as such.
Strategic context indicators
Below there are context indicators and their quantification. The latter, however, convey general objectives, consolidated in the National Lisbon Strategy Implementation Programme and other strategic documents and, thus, define the common strategic context for implementation of the operational programme. It is expected that implementation of this operational programme will positively contribute to the achievement of quantitative objectives established on impact level, that is it will have a positive influence on the strategic context indicators. However, only the ex-post evaluation (rather than ongoing monitoring) process can reveal a more detailed assessment of this contribution, since the implementation of the OP will not be the only factor contributing to their achievement.
The source of information for these strategic context indicators, unless provided otherwise, is the official statistics. The data shall be updated annually, and wherever necessary presented in the annual implementation reports of the OP.
Programme implementation indicators
Indicators presented below also include Programme implementation indicators (i.e., they measure exclusively the influence of the OP implementation). First, the core indicators are provided. The core indicators are chosen referring to the working document of the European Commission “Indicators for Monitoring and Evaluation” and taking into account the specifics and nature of the planned operations. The core indicators are based on the output and result level indicators provided below at the level of priority objectives, therefore their number is rather limited. Additionally, a number of output and results indicators indicated in the Annex I of the aforementioned working document are integrated into the system of programme indicators as appropriate. The idea behind the concentration of the supervision system towards the output and result indicators is that it is intended to confine to the indicators, the achievement of which will be determined only by projects implemented under a specific priority of the operational programme.
As a rule the main source of information for these indicators shall be the projects monitoring system, that is the reports provided by the projects which are financed by the OP. The monitoring data collection and processing is presented in more detail in the sections on “Monitoring of Implementation” and “Monitoring Indicators” in the chapter 6 (Implementation Provisions).
103

CORE INDICATORS AT PROGRAMME LEVEL
Indicator (unit of measure) Baseline Quantified objectives in 2015Private investments attracted (M EUR) 312* 735,5
New roads build and existing roads rehabilitated (km) 21328**Of which TEN 1617**
1165Of which TEN 315
New railroads build and existing railroads rehabilitated (km)
1771**Of which TEN 1100**
220Of which TEN 170
* 2004-2006 SF programming period (preliminary data because not all projects are not completed yet)** total length of roads and railroads of national significance
OBJECTIVE 1 OF THE OPERATIONAL PROGRAMME Increase the comparative share of high value added businesses
Strategic context indicatorsIndicator (unit of measure) Baseline situation (year) Quantified objectives in 2015
Total expenditure for RD as of GDP 0,76 (2005) 2,2 Number of researchers per 1.000 employed persons/share engaged in business (%) 5,12/6,6 (2004) 6,1/15 Number of applications filled with the European Patent Office per 1 million population 2,6 (2002) 30
PRIORITY 1: RESEARCH AND DEVELOPMENT FOR COMPETITIVENESS AND GROWTH OF THE ECONOMY
Core indicatorsIndicator (unit of measure) Baseline Quantified objectives in 2015
Private investments induced (M EUR) 42,2* 129,5Number of R&D projects 78* 260*2004-2006 SF programming period
Objective 1: Reinforce effectiveness and accessibility of public R&D facilitiesProgramme implementation indicators
Type Indicator (unit of measure) Baseline Quantified objectives in 2015
Data source
Results Private investments induced (M EUR) 33* 72,5 Project reportsCreated and operating centers of scientific research 49* 12 Project reports
Outputs Number of R&D base development projects 10*** 60 Contracts signed
104

* Source: Department of Statistics to the Government of the Republic of Lithuania ***R&D infrastructure projects financed under measure 1.5 of the Single Programming Document. Source: Central Project Management Agency.
Objective 2: Increase efficiency of R&D by the public sector as well as its accessibility to businesses Programme implementation indicators
Type Indicator (unit of measure) Baseline Quantified objectives in 2015
Data source
Results Number of jobs created in the sphere of R&D 5893 (2005) 650 Project reportsContracts signed between research institutions and SMEs -* 100 Project reports
Outputs Number of R&D projects (research activity) 26 (2007) 40 Contracts signed * study to be carried out
Objective 3: increase R&D intensity in private sectorProgramme implementation indicators
Type Indicator (unit of measure) Baseline Quantified objectives in 2015
Data source
Results Private investments induced (M EUR) 9,2* 57 Project reportsOutputs Number of R&D projects (R&D activity in enterprises) 42 (2006)* 120 Contracts signed
* 2004-2006 SF programming period
Objective 4: improve the environment for the R&D dissemination, promote cooperation between business and research in R&D areaProgramme implementation indicators
Type Indicator (unit of measure) Baseline Quantified objectives in 2015
Data source
Results Number of new technology based firms created* 4* 15 Project reportsOutputs Number of R&D and innovation environment improvement projects 11* 40 Contract signed
* 2004-2006 SF programming period
OBJECTIVE 2 OF THE OPERATIONAL PROGRAMMEIncrease business productivity especially by creating favourable environment for innovations and SMEs
Strategic context Indicator (unit of measure) Baseline situation (year) Quantified objectives in 2015
105

Exports of goods of Lithuanian origin except for refined petroleum products (sales of mining, quarry and manufacturing products, except for refined petroleum products, outside the Lithuanian market as a of total sales of relevant products) (percentage)
51,8 (2005) 60
Share of investments in the formation of capital base as of GDP 22,3 (2005) 30Labour productivity per working hour ( of EU-15 average) 41,7 (2004) 65
PRIORITY 2: INCREASING BUSINESS PRODUCTIVITY AND IMPROVING ENVIRONMENT FOR BUSINESS
Core indicatorsIndicator (unit of measure) Baseline Quantified objectives in 2015Private investments induced (M EUR) 269,8* 606* 2004-2006 SF programming period (preliminary data because not all projects are completed yet)
Objective 1: increase business productivityProgramme implementation indicators
Type Indicator (unit of measure) Baseline Quantified objectives in 2015
Data source
Results Private investments induced (M EUR) 98* 173 Project reportsOutputs Number of projects for increasing business productivity, including small and
medium enterprises projects51 (2006)** 300 out of them:
250 (SME)Contracts signed
* 2004-2006 SF programming period** only small and medium enterprises
Objective 2: increase viability of businesses and promote entrepreneurshipProgramme implementation indicators
Type Indicator (unit of measure) Baseline Quantified objectives in 2015
Data source
Results Number of active enterprises in EU funds supported incubators 20* 70 Project reports, surveysOutputs Number of business environment improvement projects, units 39 (2006) 120 Contracts signed
* In 2004-2006 programming period one incubator was supported in Šiauliai. 54 enterprises operate in this incubator.
Objective 3: improve access to financing sources for SMEsProgramme implementation indicators
Type Indicator (unit of measure) Baseline Quantified objectives in 2015
Data source
106

Results Private investments induced by financial engineering measures (M EUR) 55,8 (2006)* 289 Project reportsOutputs Number of enterprises supported by financial engineering measures 346 (2006)** 4300 Contracts signed
* loans provided with UAB „Investicijų ir verslo garantijos“ guarantee;** Number of enterprises receiving loan with UAB „Investicijų ir verslo garantijos“ guarantees.
Objective 4: adapt public territories for investment attraction purposesProgramme implementation indicators
Type Indicator (unit of measure) Baseline Quantified objectives in 2015
Data source
Results Private investments induced (M EUR) 116* 144 Project reportsOutputs Area of public territories prepared for investments, hectares 170* 400 Project reports
* 2004-2006 SF programming period (preliminary data because projects are not completed yet)
OBJECTIVE 3 OF THE OPERATIONAL PROGRAMMEIncrease efficiency of economic infrastructure
Strategic context indicatorsInformation societyIndicator (unit of measure) Baseline situation (year) Quantified objectives in 2015
Regular Internet users, percentage 30 (2005) 70Level of on-line availability of basic public services , percentage 65 (2005) 95Broadband Internet penetration rate, percentage 7 (2005) 50
Transport infrastructureIndicator (unit of measure) Baseline situation (year) Quantified objectives in 2015
Increase in Ro-Ro cargo flow in Klaipėda seaport (million tons) 3 (2005) 4,5Increase in volumes of cargo carriage by rail (million tons) 49,3 (2005) 60 Increase in passenger flow at airports (million passengers) 1,45 (2005) 2,61
Energy infrastructureIndicator (unit of measure) Baseline situation (year) Quantified objectives in 2015
Electricity energy transportation losses (%) 9,6 (2006) 7.6Heat energy transportation losses (%) 19,6 (2005) 16.6
107

Momentary Average Interruption Frequency index – MAIFI (%) 0,4 (2005) 0.38
PRIORITY 3: INFORMATION SOCIETY FOR ALL
Core indicatorIndicator (unit of measure) Baseline Quantified objectives in 2015Number of information society development projects 19* 51* In 2004-2006 programming period by EU structural assistance supported e-government and electronical infrastructure projects
Objective 1: develop electronic solutions to increase efficiency of public sector institutions and to enforce e-business initiatives in the countryProgramme implementation indicators
Type Indicator (unit of measure) Baseline Quantified objectives in 2015
Data source
Results Increase of the share of population visiting websites of public institutions, percentage points
15 (2005)* 40 A survey conducted by the request of ISDC* once per year
Increase of the share of business enterprises selling goods or services on-line, percentage points
15 (2005)*** 25 A survey conducted by the request of ISDC once per year
Outputs Number of supported interactive public e-services 24**** 100 Contracts signedNumber of supported projects dedicated to e-business development 0 10 Contracts signed
* Share of population visiting the websites of public institutions (%).** Information Society Development Committee under the Government of the Republic of Lithuania ***Share of business enterprises selling goods or services online (%).**** In 2004-2006 programming period creation of 24 public e-services was supported by EU structural funds.
Objective 2: Establish an even, secure electronic networks infrastructure of the countryProgramme implementation indicators
Type Indicator (unit of measure) Baseline Quantified objectives in 2015
Data source
Results Increase of the share of population having a possibility to become users of broadband network services, percentage points
72 (2005)* 23 A survey conducted by the request of ISDC**
Decrease of the share of Internet users who have encountered security problems on-line, percentage points
60 (2005)*** 20 A survey conducted by the request of ISDC* once per year
108

Outputs Number of small towns and villages connected to constructed broadband network
430 (2005) 770 Contracts signed
Number of supported projects related to security issues 2**** 10 Contracts signed* Share of population having a possibility to become users of broadband network services, percentage** Information Society Development Committee under the Government of the Republic of Lithuania *** Share of Internet users who have encountered security problems on-line, percentage ****In 2004-2006 programming period 2 security projects were supported by EU structural funds.
PRIORITY 4. BASIC ECONOMIC INFRASTRUCTURE, Action Group: Energy Supply Networks
Objective 1: provide technical feasibility and environmental preconditions for the integration of the Lithuanian electricity and gas markets into single electricity and gas markets of the EUProgramme implementation indicators
Type Indicator (unit of measure) Baseline Quantified objectives in 2015
Data source
Results Additional number of natural gas customers as a result of expanded network 540 720 (2006)* 60 000 Project reportsOutputs Number of gasified towns as a result of expanded network 1** 10 Project reports
* Total number of natural gas customers.** 2004-2006 SF programming period
Objective 2: increase reliability and safety of energy supplyProgramme implementation indicators
Type Indicator (unit of measure) Baseline Quantified objectives in 2015
Data source
Results Number of heat customers for whom reliability and quality of heat supply has improved
600 000 (2006)* 300 000 Project reports
Outputs District heating networks rehabilitated (km, conventional single pipes 100 mm in diameter) 7140 (2006)** 1800 Project reports
* Total number of central heating customers in the country** Total length (km.) of conventional heat pipes.
PRIORITY 4. BASIC ECONOMIC INFRASTRUCTURE, Action Group: Transport Network
Objective 1: Implement engineering measures for traffic safetyProgramme implementation indicators
Type Indicator (unit of measure) Baseline Quantified objectives in 2015 Data source
109

Results Number of eliminated “black spots”* 247(2005) 25 Evaluations, studies
Outputs Installed safe traffic and environmental measures in sections of increased risk of accidents, units 35** 35 Project reports
* Places were traffic accidents periodically happen** 2004-2006 programming period
Objective 2: Improve technical parameters of transport infrastructure of national and regional significanceProgramme implementation indicators
Type Indicator (unit of measure) Baseline Quantified objectives in 2015 Data source
Results Time saved transporting cargo using reconstructed rail infrastructure (m t h) -* 4 Evaluations, studiesOutputs New roads build and existing roads rehabilitated (km) 19.711** 850 Project reports
New railroads and railroads build and existing railroads rehabilitated (km) 671** 50 Project reports* study will be carried out to identify the baseline** total length of roads and railroads, except TEN-T
Objective 3: Development of regional water transport infrastructureProgramme implementation indicators
Type Indicator (unit of measure) Baseline Quantified objectives in 2015 Data source
Results Number of ships, which received service (annual average) -* 3000 Evaluations, studiesOutputs Number of wharf build and rehabilitated -* 2 Project reports
*study will be carried out to identify the baseline
PRIORITY 5: DEVELOPMENT OF TRANSEUROPEAN TRANSPORT NETWORKS
Objective 1: Development of land transport infrastructure links with other EU Member States and third countries; adaptation of TEN-T to the growing traffic intensity Programme implementation indicators
Type Indicator (unit of measure) Baseline Quantified objectives in 2015
Data source
Results Increase in quantity of transported cargo (million tons, per year) 110 (2005) 133 Evaluations, studies
Outputs Built and reconstructed roads of TEN-Tnetwork (km) 1617* 315 Project reportsBuilt and reconstructed rail of TEN-T network (km) 1100* 170 Project reports
* total length of roads and railroads of TEN-T network (km)
110

Objective 2: Better utilization of the potential of the Klaipėda Seaport as the most important transit hub of the country; increase of the competitiveness of Klaipėda Seaport Programme implementation indicators
Type Indicator (unit of measure) Baseline Quantified objectives in 2015
Data source
Results
Increase of number of cargo transported by Ro-Ro, Ro-PAX ships (million tons)
3 (2005) 1,5 Evaluations, studies
Increase of number of passengers transported by Ro-Ro, Ro-PAX ships (thousand passengers)
166 (2005) 83 Evaluations, studies
Outputs Number of bunders build and rehabilitated, (m) 17859* 775 Project reports* total length of bunders build (m)
Objective 3: Development of infrastructure capacities of Lithuania’s international airportsProgramme implementation indicators
Type Indicator (unit of measure) Baseline Quantified objectives in 2015 Data source
Results Additional number of passengers who received service (m passengers) 1,44 (2005) 1,16 Evaluations, studies
Outputs Number of implemented projects 5* 6 Project reports* 2004-2006 programming period
Objective 4: Reduction of accident rates and congestion in the TEN-T networkProgramme implementation indicators
Type Indicator (unit of measure) Baseline Quantified objectives in 2015
Data source
Results Time saved (million vehicles h) -* 18,4 Evaluations, studiesOutputs Roads build and reconstructed (km) 4** 24 Project reports
*study will be carried out to identify the baseline** 2004-2006 programming period
PRIORITY 6. TECHNICAL ASSISTANCE FOR the implementation of the Operational Programme ON ECONOMY GROWTH
Objective 1: To ensure the effective functioning of the system for management and control of the EU structural assistance received under the Convergence Objective in the course of the implementation of this Operational Programme for Economy Growth
111

Programme implementation indicatorsType Indicator (unit of measure) Initial situation Quantified objectives
in 2015Data source
Results Percentage of participants, who improved their qualification* and continue, working during one year with the implementation of the Operational Programme on Economy Growth
430** 90 % Surveys
Outputs Number of participants, working with the implementation of the Operational Programme on Economy Growth, who improved their qualification at least once during one year period.
430** 90 Surveys
* Participated in training courses at least once during one year period.** Number of civil servants and other public officials working with EU structural assistance of 2004-2006, excluding civil servants dealing with EAGGF and FIFG.
Objective 2: To improve awareness of the potential beneficiaries, beneficiaries and partners about the assistance provided by the Economy Growth Operational Programme and results of its implementation, to perform evaluation activities of the Economy Growth Operational Programme
Programme implementation indicatorsType Indicator (unit of measure) Initial situation Quantified objectives
in 2015Data source
Results Possible beneficiaries, who know about EU structural assistance for economy growth, in percentage
-* 75 Surveys
Outputs Number of implemented information initiatives (information campaigns, conferences, cycles of seminars, internet pages, etc.)
0 21 Project reports
* Survey will be carried out to identify the initial situation at the beginning of the programme implementation. According to the survey carried out in April 2007, 42% of applicants under SPD 2004-2006 know the activities supported by ERDF.
112

5. PREPARATION OF THE OPERATIONAL PROGRAMME
5.1. PARTNERSHIPIn accordance with resolution of the Government Concerning Formulation of Operational Programmes on the Implementation of the Lithuanian Strategy for the Use of EU Structural Assistance for 2007–2013 (No. 1351 of 14 December 2005), the following working groups were formed: Direct and Indirect Support for Research and Development and Innovations and Promotion of Investments (chaired by the Ministry of Economy); Information Society for All (chaired by the Information Society Development Committee under the Government of the Republic of Lithuania), Transport Network (chaired by the Ministry of Communication); and Energy Supply Networks (chaired by the Ministry of Economy). The ministries approached organisations of socio-economic partners inviting them to take part in the working groups to draft priorities. A number of organisations proposed their participation in the drafting of the Programmes.
Representatives of all the organisations that had expressed a wish to participate in working groups were included therein, with the personal composition of each working group approved by order of the Minister of Finance of the Republic of Lithuania Concerning Approval of Personal Composition of the Working Groups on the Drafting of the Operational Programmes (No. 1K-070 of 27 February 2006) as amended by order of the Minister of Finance No. 1K-151 of 6 April 2006.
The Ministry of Finance was responsible for the incorporation of the working groups’ inputs in the single text of the Operational Programme. Draft programmes and components thereof were considered by the commission charged with the responsibility for the drafting of the NSRF and the Operational Programmes.
All the Priorities were presented on the 29 June 2006 during the public discussion in which more than 200 various social and economic partners took part. Majority of the partners took part in the work of particular Working Parties in preparation of Operational Programmes, so the aim of the final public discussion was for all to look once again through and summarize the work results and to check the compatibility of the individual Operational Programmes and their Priorities.
After the public discussion the most important comments of the social and economic partners were taken into account, as well as the results of informal consultations with the European Commission (that took place on the April 9 and June 13), because the comments and suggestions for the overall Strategy had impact on the detailed content of the Operational Programmes.
Partnership in Preparing Descriptions of the two Priorities: Research and development for competitiveness and growth of the economy, and Increasing business productivity and improving environment for business
The working group consisted of 30 members, 65% of them representing state institutions (Ministries of Economy, Education and Science, Finance, Social Security and Labour, and Agriculture; Office of the Government of the Republic of Lithuania, Office of the President of the Republic of Lithuania etc.) and 35% – sectoral and national partner organisations (business structures – Lithuanian Confederation of Industrialists, Lithuanian Confederation of Business Industrialists, the Lithuanian Association of Chambers of Trade, Industry and Crafts etc.; Lithuanian Association of Laser and Light Science and Technologies; Knowledge Economy Forum etc.).
113

The functions and principles of organisation of work at the working group are defined in its regulations approved at the first meeting. The main function according to the regulations is to consider draft descriptions related to these priorities and make proposals, comments and recommendations. The regulations also define the members’ rights and responsibilities (participation in and initiation of meetings, consideration of materials presented, making proposals etc.), adoption of decisions (by mutual consent), resolution of urgent issues and holding of non-scheduled meetings.
The working group was chaired by the Ministry of Economy, which also performed functions of a secretariat. The meetings were documented by minutes, which were sent to members via email. 4 meetings were organised and the following issues were considered at them:
- guidelines for the drafting of the Ops for 2007-2013;
- drafting the description of current situation and SWOT analysis;
- structure, description etc. of priorities of the Operational Programmes.
In addition, the Ministry of Economy presented the draft NSRF (within the scope of its competence) at workshops/discussions at business information centres, where participants were afforded opportunities for expressing their comments and proposals.
Preparation of all the priorities of the Operational Programme on Economic Growth was based on the same legal framework and similar principles and according to the same schedule.
Partnership in Preparing Descriptions of the Priority Information Society for All
The work of the working group on Information Society was chaired and the functions of the secretariat were performed by the Information Society Development Committee (ISDC) under the Government. A number of organisations representing the information and communications technologies sector participated in the working group (Association “Infobalt”, Association “Knowledge Economy Forum”, Northtown Technology Park); the group also included representatives of the Union of Lithuanian, Doctors the National Martynas Mažvydas Library which also have interests in the ICT area (26 members in all).
Furthermore, in order to deepen cooperation with socio-economic partners, on 31 August 2006 ISDC held a seminar “Assistance of the European Union Structural Funds to Information Society in Lithuania: the Present and the Future Trends” to discuss the opportunities for using EU SF assistance in 2007–2013 as well as priorities and prospects. The seminar was attended by representatives of 83 associations, local authorities and businesses related to ICT.
Partnership in Preparing Descriptions of the Priority “Basic Economic Infrastructure” and “Development of Trans-European Networks”
The working group on energy supply networks chaired by the Ministry of Economy and the working group on transport network chaired by the Ministry of Transport and Communications prepared the information regarding the above mentioned priorities of the Operational Programme.
The working group on energy supply networks was formed taking account of specificity of relevant issues. Energy supply networks cover three areas: electricity, natural gas and district heating. To ensure optimal number of representatives and efficiency of the group, a representative of the Lithuanian Committee of the Global Energy Council was invited to represent all the areas on unbiased basis. Furthermore, energy issues are closely related to environmental protection and
114

public interest, therefore, the working group also includes a representative of the Coalition of Lithuanian Environmental Non-Government Organisations. Other members represent the stakeholders – ministries, the Government and the Presidential Office. Total number of the members: 13.
The working group has met twice to discuss inputs to the Operational Programme on Economic Growth. Although only two meetings were held due to intensive schedule, however, electronic mail was also used to agree on versions of the Programme and on the inputs (as provided for in the regulations of the group).
The Ministry of Transport and Communications chaired the working group on transport network in order to prepare the transport part of the programme. The working group had 39 standing members – representatives of the Presidential Office, the Government, the ministries (Finance, Economy, Environment, Internal Affairs, Foreign Affairs, Agriculture, and Education and Science), departments and subordinate institutions of the Ministry of Transport and Communications (Transport Investments Directorate, Lithuanian Road Administration, Klaipėda State Seaport Authority, Civil Aviation Administration, Inland Waterways Authority and Lithuanian Railways Company) and representatives of social, economic and regional partners (Lithuanian Association of Local Authorities, Lithuanian Confederation of Business Employers, LINAVA Association, Lithuanian Association of Sea Shipping Companies, Transport Institute under the Vilnius Gediminas Technical University, Transport and Road Research Institute, Lithuanian Roads Association, and the Coalition of Lithuanian Environmental Non-Governmental Organisations).
The working group held 4 meetings to discuss documents prepared by the secretariat, formulate comments and proposals, and propose areas for support. Taking account of these comments and proposals the secretariat prepared amendments for submission to members. Communication with the members took place via email. All the members were encouraged to share information with the social, economic and regional partners that were not members of the group.
To achieve this target the Ministry of Transport and Communications prepared and distributed to all the mayors and county governors materials on the EU assistance to the transport sector in 2004–2006 and the prospects for 2007–2013, urging to take an active part in the discussions within the framework preparing the Lithuanian 2007-2013 European Union Structural Assistance Operational Programmes and laying down guidelines for their funding. The mayors have showed interest by actively submitting their proposals to the working group.
In order to increase public awareness of the preparedness to use EU SF assistance in 2007-2013, the website of the Ministry of Transport and Communications was constantly updated with announcements about projected meetings of the working group on Transport Network, minutes of the meetings, and extracts of decisions adopted.
5.2. EX-ANTE EVALUATION
The ex-ante evaluation of the Lithuanian Structural Fund Programmes for the 2007-13 period was carried out between May 2006 and February 2007 by the Centre for Strategy and Evaluation Services (CSES) and UAB „Ekonominės konsultacijos ir tyrimai“ (EKT).
Ex-ante evaluation is a statutory requirement under the draft General Regulation on Structural Funds 2007-13 (Council Regulation (EC) No 1083/2006 of 11 July 2006).
Role of ex-ante
115

The main purpose of ex ante evaluation, as defined in European Commission guidelines, is twofold, namely to:
Optimise the allocation of structural fund resources Improve the quality of programming
Ex-ante evaluation should help improve the efficiency and effectiveness of structural funds and ensure added value and accountability for public money – both EU and national.
Methodological approachThe methodological approach adopted to carrying out these tasks involved a combination of desk and field research. With regard to the desk research element, ex-ante undertook the following tasks:
Reviewed lessons from previous experience (in particular the 2004-06 programmes) Reviewed and commented on the Operational Programme documents (a number of different versions were examined) Reviewed and commented on the proposed system of indicators Produced a series of Working Papers on key evaluation issues, together with an inception report Prepared interim and final reports in respect of each OP Prepared an overarching final evaluation report which included a common part as well as a summary of key findings in respect of the ex-ante evaluation of each OP.
Field research was also carried out. This involved bi-lateral discussions with key programme stakeholders (essentially –ministries) involved in drafting the OPs, as well as regular presentations to the ex-ante Steering Committee and Commission responsible for the preparation the Implementation of the Lithuanian Strategy for the Use of EU Structural Assistance for 2007–2013 and establishment of the operational programmes.
Regular seminars provided an opportunity for two-way interactive discussion on ex-ante findings.
Key evaluation tasksThe ex-ante evaluation team undertook the following specific tasks:
Analysis of the baseline assessment and SWOT outlined in the OP and checking that this reflects the actual situation (Working Paper 1) Examination and comments on whether the intervention logic was appropriate and whether proposed Priorities and sub-Priorities are an appropriate means of tackling the socio-economic development problems identified in the baseline (Working Paper 2) Review of the internal coherence of the strategy and of linkages between the strategy and Priorities identified (Working Paper 1) Review of the external coherence of the strategy and of individual priorities with the EU, national and regional policy frameworks (Working Paper 3) Advise on the indicator system and on the quantification of objectives i.e. target setting (Working Paper 4) Review and advise on proposed management and implementation arrangements (Working Paper 5) Ensuring that the horizontal themes were adequately taken into consideration in programme documentation (Working Paper 4 and 5)
Ex-ante evaluation and adherence to the partnership principleThe ex-ante evaluation process was participative and interactive. In particular, the partnership principle was adhered to in the following ways:
116

Held a series of bi-lateral meetings with Line Ministries to discuss the OPs in detail
Organised a number of seminars to discuss key elements of ex-ante e.g. the SWOT and baseline, monitoring and indicators, a seminar for regional stakeholders to address territorial/regional dimension.
Made presentations to the ex-ante Steering Group as well as to the Commission responsible for the Implementation of the Lithuanian Strategy for the Use of EU Structural Assistance for 2007–2013
The socio-economic partners also had the opportunity to contribute to ex-ante, in particular by attending the thematic working group meetings which received ex-ante working papers and feedback of relevance to their working group
Interested regional institutions and partners were involved (seminar for the interested regional institutions and partners, in which their role in the 2007-2013 period was discussed)
A large number of recommendations were made during the ex-ante evaluation process. These were discussed bi-laterally with Line Ministries.
Additionally, ex-ante attended a small number of meetings of the thematic working groups.
Ex-ante recommendationsThe Commission advocates that it should be made explicitly clear in programme documentation how ex-ante evaluation has contributed to the preparation and improvement of the OPs. A large number of recommendations were made during the ex-ante evaluation process. The main recommendations were summarised in each working paper and then also included (where still relevant given that the documents were works in progress) in the interim and final reports.
The ex-ante evaluation report in respect of each OP contains summary tables of key recommendations. Line Ministries were then asked to indicate recommendations that had and had not been taken into account (if the Ministry disagreed with the comment/ recommendations) and which will be addressed but have not yet been implemented.
The table on ex-ante recommendations and the way in which these have been taken into account is provided in Annex IV.
5.3. STRATEGIC ENVIRONMENTAL IMPACT ASSESSMENTThe strategic environmental impact assessment (SEIA) for the Operational Programme was made by a consortium of independent evaluators formed of Centre for Strategy & Evaluation Services LLP (CSES) and „Ekonominės Konsultacijos ir Tyrimai UAB along with the ex-antes evaluation. .
The SEIA requirements are set in Directive of the European Parliament and Council No. 2001/42/EC on the assessment of the effects of certain plans and programmes on the environment. In Lithuania the SEIA requirements are regulated by resolution of the Government of the Republic of Lithuania “Concerning Approval of the Procedure for the Assessment of the Effects of Plans and Programmes on the Environment“ (No. 967 of 18 August 2004) and order of the Minister of Environment “Concerning Approval of the Procedure for the Participation of the Public in the Assessment of the Effects of Plans and Programmes on the Environment and for the Notification of Subjects of Assessment and the EU Member States“ (No. D1-455 of 27 August 2004) and other legal acts related to the protection of the environment.
117

The objectives of SEIA are as follows:
determine, describe and assess potential material consequences upon the environment resulting from implementation of plans and programmes;
ensure that consultations with state and local authorities and the public at large are held and that results of the consultations and other publicity measures are taken into account;
ensure that information on potential material consequences upon the environment resulting from implementation of plans and programmes is available to organisers of preparation of programmes and that they take account of such information.
The evaluators followed strict evaluation procedures established in legal acts: first of all a document establishing the scope of SEIA was prepared and submitted for subjects of evaluation for consideration (i.e. state and local authorities responsible for environmental protection, health care, organisation of protection and management of protected areas and protection of cultural values). Prior to submitting the document to the subjects of evaluation this fact was published.
Upon examination of comments provided by the subjects of evaluation SEIA experts made corrections to the document establishing the scope of SEIA and prepared an evaluation report. SEIA experts took an active part in public discussions with stakeholders, experts preparing the programming document and other experts in the ex-antes evaluation project. As SEIA is a relatively new thing in Lithuania, drafting of the SEIA report was facilitated by information on the EU Member States‘ experience in this area and EC guidelines. The public was afforded an opportunity to get conversant with the SEIA report for the operational programmes (public announcement in the national press and website of the Ministry of Finance; public presentation of the draft SEIA report).
After public discussion the draft SEIA report was presented to SEIA subjects for agreement; the subjects examined the report and presented their conclusions within the scope of their competence. Taking account of the comments the SEIA experts made further improvements and in October 2006 the final SEIA report was submitted.
The main steps of the preparation of the SEIA report with more details are presented below:
1. Announcement about starting of the SEIA was published in national daily “Lietuvos rytas” and on internet page www.finmin.lt. on 4 July 2006.
2. On 5 July 2006 document on the scope of the SEIA submitted to the subjects of evaluation (line ministries, Office of Protected Territories under Ministry of Environment, 10 County Governors Administrations.
3. Comments received by 27 July 2006 were analysed in the meetings with aforementioned subjects of evaluation and the document on the scope of the SEIA was corrected accordingly.
4. On 1 August 2006 – starting of the preparation of the SEIA report. During drafting process experts were actively participating in the discussions with interested institutions.
5. On 24 August 2006 announcement was published in national daily “Lietuvos rytas” and on internet page www.finmin.lt as well as on internet pages of the County Governors Administrations on public discussion of the draft SEIA report .
6. Public discussion on the draft SEIA report take place on 22 September 2006. Participants did not provide any comments on the draft SEIA report.
7. On 25 September 2006 the draft SEIA report submitted to the aforementioned subjects of evaluation.
118

8. The subjects of evaluation provided their comments by 11 October 2006. Comments were analysed, the document on evaluation of comments were prepared and the draft SEIA report was amended accordingly.
9. The final SEIA report was submitted to the Ministry of Finance on 13 October 2006. Ministry of Finance published this report on the internet page www.finmin.lt.
119

6. IMPLEMENTING PROVISIONS
Coordination of planning, implementation, and harmonization of the actions funded in accordance with Lithuanian Strategy for the Use of EU Structural Assistance for 2007-2013 and Operational Programmes for its implementation with other financial instruments
It is necessary to ensure the coordination and coherence of activities among separate operational programs as well as between the operational programs and the Implementation of the Lithuanian Strategy for the Use of EU Structural Assistance for 2007-2013. Ministry of Finance (EU Cohesion policy and structural assistance coordination department), which was responsible for drafting of EU structural assistance programmes and development and supervision of management and control system in 2004-2006 period, and maintain this function for 2007–2013 period, will perform the functions of the Coordinator. The main responsibilities of coordinator will be:
- ensuring coordination and coherence of activities among separate operational programs as well as between the operation programs and the Implementation of the Lithuanian Strategy for the Use of EU Structural Assistance for 2007-2013, ensuring compatibility with operational programmes implementing European Territorial Cooperation Objective as well as with other EU financial instruments;
- monitoring the NSRF implementation and ensuring the coherence with National program for implementation of Lisbon strategy, ensuring consistency of the goals defined in the Implementation of the Lithuanian Strategy for the Use of EU Structural Assistance for 2007–2013 and operational programmes with the goals of other national strategic documents and EU policies;
- organisation and chairing the meetings of the Monitoring Committee.- development of the management and control system of EU structural assistance and
monitoring of its performance, establishment of main programs and projects administration principles, development of the EU structural funds management and control computerized information system (SFMIS) and transferring of the information to the European Commission via SFC 2007;
- organisation of elaboration of the ex-ante evaluation on the compliance of management and control system with provisions of Articles 58–62 of General Regulation. (pursuant to paragraphs 2 and 3 of Article 71 of General Regulation). To that end it is intended to procure services of independent auditors.
- preparation and submission to the European Commission the description of the EU structural assistance management and control system as laid down in Article 71 (1 paragraph) of the Council Regulation No 1083/2006 together with evaluation report foreseen under Article 71 (2 paragraph) of the same Regulation.
- preparation and approval of the Information strategy and action plan for the implementation of Information strategy, coordination of implementation of Strategy and action plan, establishment of Information coordination group for coordination of information activities.
- coordination and organization of evaluation activities, preparation of evaluation plan and coordinating its implementation, establishment of Evaluation coordination group for coordination of evaluation activities.
Institutions participating in implementation of operational programme
Two types of institutions will participate in the Operational programme implementation:
120

1) Public administration institutions, responsible for the strategy of a development of certain economy sectors will take active part in planning, co-ordination and selection of projects financed under the operational programme and implementing some functions as Intermediate body according to the Art. 59 (2) of the Council Regulation No. 1083/2006;
2) Institutions, designated according to the Art. 59 of the Council Regulation No 1083/2006: Managing authority and Agencies, performing delegated functions (Intermediate bodies), Certifying Authority and Audit Authority.
First type of institutions will be considered as and will organise the strategic investment planning and financial planning for activities, financed under the priority or part of priority of the operational program within the their competence, in particular these institutions are responsible for:
- proposing on project selection procedures (planning procedure or calls for proposals);- planning and initiating projects, preparing investment plans (considered as Intermediate
body function);- planning of calls for proposals and establishing the conditions for granting of the
assistance and evaluation criteria;- preparing state aid schemes where necessary; - planning of national co-financing;- making decisions on granting of the assistance (considered as Intermediate body
function);- participating in the work of the Single Monitoring Committee and Programme
Management Committee;- participating in evaluation of operational programmes in accordance with evaluation
plan;- participating in publicity activities in accordance with Information strategy.
As regards this operational programme, the responsible public administration institutions are:
Ministry of Education and Science and Ministry of Economy for the priority “Research and Development for Competitiveness and Growth of the Economy”.
Ministry of Economy for the priority “Increasing Business Productivity and Improving Environment for Business”.
Information Society Development Committee under the Government of the Republic of Lithuania for the priority “Information Society for All”.
Ministry of Transport and Communication and Ministry of Economy for the priority “Basic economic infrastructure”.
Ministry of Transport and Communications for the priority “Development of Trans-European Transport Networks”.
The Agencies will ensure that operations are selected for funding in accordance with the criteria applicable to the operational programme and that they comply with applicable Community and national rules for the whole of their implementation period.
121

Where relevant, and where the part of activities, financed under the certain priority, according to the national legislation belong to the competence of Municipalities, the separate financial allocations, broken down by counties (10 NUTS III regions in Lithuania), will be formed.
Regional Development Councils will perform the intermediate body functions only in respect of planning and pre-selection of projects. They will do a pre-selection based on selection criteria set up by the Monitoring Committee. The Agencies will ensure that operations are selected for funding in accordance with the criteria applicable to the operational programme and that they comply with applicable Community and national rules for the whole of their implementation period. The final decision on granting of the assistance will be made by the responsible public administration institution.
Following the recommendation of the SEIA report, the Ministry of Interior will inform all the County Governor Administrations and municipalities, that in accordance with goals, priorities, and objectives, identified in the Operational Programmes, the regional strategic documents should be revised.
In view of better co-ordination of actions in planning and implementing common objectives of the programme, it is anticipated to establish a Management Committee of the operational programme involving representatives of all institutions responsible for programme implementation (Coordinator, responsible ministries, Managing Authority as well as implementing agencies, Certifying Authority and Audit Authority).
Main objectives of the Management Committee are as follows: - to co-ordinate planning of actions financed under different priorities in view of their
compatibility and effective pursuance of objectives; - to supervise the process of implementation of priorities and measures of the operational
programme and to consider arising problems; to submit to the Monitoring Committee and to the Coordinator co-ordinated proposals on programme amendments, allocation or re-allocation of financial resources, improvement of administrative system, etc;
- to make proposals to the Coordinator concerning organization of evaluations foreseen in Article 48 (3) of the General Regulation.
- To make proposals to the Coordinator concerning implementation of the action plan of Information strategy.
The Ministry of Finance shall ensure execution of functions of Managing and Certifying authorities. The Ministry of Finance shall also be responsible for receiving the payments made by the European Commission and for making payments to the beneficiaries. The principle of separation of functions will be ensured by assigning the functions of these institutions to different departments of the Ministry of Finance as provided below in this chapter.
Managing authority
The managing authority of the Operational Programme on Economy Growth shall be responsible for managing and implementing the operational programme in accordance with the principle of sound financial management, and in particular for functions specified in Article 60 of Council Regulation (EC) No 1083/2006 (General Regulation).
Within the Ministry of Finance the Managing Authority functions will be performed by the Operational Programmes Management Department.
122

Upon implementation of the Operational Programme on Economic Growth part of functions of the Managing Authority will be delegated in accordance with provisions of Article 59(2) of General Regulation to the following institutions (intermediate bodies):
In the Priority “Research and Development for Competitiveness and Growth of the Economy” – Central Project Management Agency and Lithuanian Business Support Agency.
In the Priority “Increasing Business Productivity and Improving Environment for Business” – Lithuanian Business Support Agency and JSC “Investment and Business Guarantees”.
In the Priority “Information Society for All” – Central Project Management Agency.
In the priority “Basic economic infrastructure” – Transport Investment Directorate and Lithuanian Business Support Agency.
In the priority “Development of Trans-European Transport Networks” – Transport Investment Directorate.
In the priority “Technical assistance for the implementation of the operational programme on Economy Growth” – Central Project Management Agency.
These institutions will perform the following functions:- ensure that operations are selected for funding in accordance with the criteria applicable to
the operational programme and that they comply with applicable Community and national rules for the whole of their implementation period:
- verify that the co-financed products and services are delivered and that the expenditure declared by the beneficiaries for operations has actually been incurred and complies with Community and national rules; carry out verifications on-the-spot of individual operations;
- record and store information about implemented projects, register it in SFMIS, collect the data on implementation necessary for financial management, monitoring, verifications, audits and evaluation;
- ensure that beneficiaries maintain either a separate accounting system or an adequate accounting code for all transactions relating to the operation;
- ensure that all documents required to ensure an adequate audit trail are held in accordance with the requirements of Article 90 of the General Regulation;
- submit to the certifying authority all necessary information on the procedures and verifications carried out in relation to expenditure for the purpose of certification;
- submit to the Managing Authority information necessary for preparation of annual and final implementation reports of the operational programme;
- participate in publicity and information activities as laid down in Information Strategy and ensure that beneficiaries comply with information and publicity requirements laid down in Article 8 of Implementing Regulation No. 1828/2006.
Certifying Authority
The certifying authority of an operational programme shall be responsible in particular for functions specified in Article 61 of General Regulation.
123

Certifying Authority functions within the Ministry of Finance will be performed by the National Fund Department.
Audit authority
Audit authority shall be responsible for functions specified in Article 62 of General Regulation.
It is foreseen that Audit Authority functions will be performed by the National Audit Office.
Institution responsible for receiving the payments made by the European Commission and making payment to the beneficiaries
Within the Ministry of Finance the department responsible for receiving the payments made by the European Commission and making payment to the beneficiaries is State Treasury Department.
Administration scheme of the Operational Programme on Economy Growth
Public administration institutions –
intermediate bodies
Monitoring Committee
Management Committee
Government of the Republic of Lithuania
Final beneficiaries
Ministry of Finance
ManagingAuthority
OperationalProgramme
ManagementDepartment
Certifying Authority
National Fund
Department
European Commission
Institution receiving and
making payments
StateTreasury
Department
Central Project Management Agency
Lithuanian Business Development agency
Transport Investment Directorate
Regional development Councils
CoordinatorEU Cohesion
policy and structural assistance
coordination department
2007–2013 m. ES struktūrinės paramos administravimo schema
Audit Authority
National Audit Office
Ministry of Education and Science
Ministry of Economy
Ministry of Transport and Communications
Information Society Development Committee under Government of the
Republic of Lithuania
Implementing Agencies – intermediate bodies “Investment and Business Guarantees”
Ltd.
124

Monitoring of implementation
As endorsed by Article 66 of the General Regulation, Managing Authority and Monitoring Committee shall ensure high quality of the implemented operational programme.
General monitoring of the programme will be performed by Managing Authority, which will collect information from responsible institutions and the Structural Funds Management Information System (SFMIS). Other relevant institutions as well as representatives of social, economic and regional partners will also be involved in the monitoring of programme implementation through Monitoring Committee arrangements.
Following the thematic approach which was adhered to when drafting the operational programs, it is intended to establish a single Monitoring Committee for all the operational programmes. It is foreseen that about half of the Committee members will be representatives of regional, social economic and other partners.
The Monitoring Committee will be chaired by Coordinator. Its composition will be approved by the Government of the Republic of Lithuania. At its own initiative or at the request of the Monitoring Committee a representatives of the European Commission might participate in the work of the Monitoring Committee in an advisory capacity.
Monitoring Committee shall draw up its rules of procedure within the institutional, legal and financial framework of the Republic of Lithuania, and adopt them in agreement with the Managing Authority in order to exercise its mission in accordance with Article 65 of the General Regulation.
It is foreseen that Single Monitoring Committee can establish sub-committees to discuss more specific questions related to the implementation of certain OP. Such sub-committees could include additional social economic, regional and other partners to those participating in the Single Monitoring Committee.
Monitoring indicators
The preconditions for monitoring and evaluation of quality and success of the operational programme will consist of:
- financial indicators of the programme, which will form the basis for the evaluation of the speed of absorption of funds, implementation of the rule N+2/N+3 and the need to revise or specify the operational programme;
- physical indicators of the operational programme, according to which the level of success of implementation of the quantitative programme objectives will be established;
The system of indicators during the planning stage was established “from top to bottom” by using macroeconomic forecasts, conclusions of the ex-ante evaluation of operational programmes, the National Programme Implementing the Lisbon Strategy, other national strategic documents and long-term programmes. The indicators are chosen referring to the working document of the European Commission “Indicators for Monitoring and Evaluation”, taking into account the specifics and nature of the planned operations, the available datum-level data as well as mechanisms for collection of the existing data and sources of data.
125

Indicators applied in the NSRF will be based on the indicators used in operational programmes, therefore the progress of implementation of the NSRF will be monitored and measured at the same time.
During the implementation period financial and physical (result and output indicators) data will be collected “from bottom to top” by using the project level information. Where possible, the data will be provided by indicating involvement of men and women and the size of enterprises receiving assistance. Additionally, on the basis of core indicators identified in the Chapter 4 the information will be aggregated at the programme or priority level as specified in the core indicators tables (see chapter 4). Furthermore special attention will be given to collecting information on jobs created while implementing projects supported under this programme. Although targets are not systematically set across the Priorities, data on gross jobs created by this programme will be reported on an annual basis.
In line with the Article 37 of the General Regulation the indicators will be measured in relation to the baseline situation, therefore, where data are not available, the suitable context indicator is used as provided in chapter 4. Strategic context indicators provide the baseline situation related to the particular indicator and the predictable general situation at the end of the period when the particular indicator will be evaluated. Programme implementation indicators (including core indicators) are expressed as a change which will be achieved by implementing the Operational Programme at the end of the period. In some cases studies and evaluations for identification of the baselines will be carried out. Where necessary the data shall be also supplemented by the regular surveys and other direct data collection methods, which will be regularly initiated (at least annually) by the institution in charge of the specific priority (indicated as ‘surveys, evaluation’ in the indicator tables in the chapter 4) so that it is available for annual reporting on the OP.
Financial indicators (application of annual and general programme obligations, distribution of expenditure under intervention codes, established in Annex II of Implementing Regulation) will be forecasted on the basis of the data of project proposals. Implementation of forecasts will be monitored in accordance with the data provided in applications for payment and reports.
Monitoring indicators will be basically defined in the project application data, therefore each application shall contain the reference to result and output indicators predetermining the success of project implementation. Part of these indicators shall comply with the main result and output indicators of a relevant priority of the operational programme. Institutions responsible for implementation of specific priorities (Agencies) will continually collect the project related data on specified indicators.
If needed, the data sources can be supplemented by the research and external statistics data. The progress and results of the priority and the entire operational programme will be analysed on a yearly basis by elaborating the annual implementation report to be discussed in the meetings of the Monitoring Committee. This will provide for an opportunity for the Monitoring Committee to regularly review the progress of implementation of programme and priority objectives and to submit recommendations in terms of further programme implementation.
Context indicators also will be reviewed and updated annually, the information about it will be provided in the annual implementation report.
The mechanism on implementation of horizontal priorities (equal opportunities, information society, regional development and sustainable development) will be based on four working groups
126

(one group for each horizontal theme) chaired by the Coordinator as defined in chapter 6 (Implementing provisions). The working groups will consist of relevant institutions involved in the implementation of the Operational Programmes as well as of social economic and regional partners. The working groups will analyse the implementation of horizontal themes in the context of operational programmes and, if necessary, will make recommendations to Coordinator concerning strengthening horizontal aspects in implementation of operational programmes. Working groups will provide information on implementation of horizontal priorities for Annual implementation reports of Operational Programmes and for Strategic Report referred in Article 29 (2) of General Regulation.
The implementation of horizontal priorities will be monitored on the basis of indicators provided in chapter 4 (Quantification of objectives).
The data on indicators will be entered, accumulated and processed in the SFMIS, which will facilitate the generation of forecasts and reports; the data will also be provided to the computer system for management of the Structural Funds of the European Commission (SFC2007).
As regards possibility to use cross-financing flexibility foreseen in Article 34 (2) of the General Regulation, the following criteria will be applied:
1. ESF type activities, financed from the relevant priority, should be implemented as constituent part of the operation carried out under this priority;
2. ESF type activities taken under the operation should be necessary for the successful achievement of objectives and results of the operation.
The use of the cross-financing will be monitored within the programming period to ensure that the ceiling for such activities is not exceeded and to avoid any risk of double-financing. This information will be included in Annual Implementation Reports.
It is foreseen to use cross-financing flexibility under priorities 1 and 3 of this Operational Programme.
Evaluation
The common goal of evaluation within the EU Cohesion Policy is to improve the quality, efficiency and coherency of the EU Structural Funds and the strategy of operational programmes and their implementation so as to increase the value added of interventions financed by the EU Funds. Evaluation of the EU structural assistance is an important integral part of the decision-making process used for the improvement of management of the EU financed programmes.
In accordance with Council Regulation (EC) No. 1083/2006, laying down general provisions on EU structural assistance, evaluation shall be carried out before the programming period (ex ante evaluation), during the programming period (ongoing evaluation) and upon its completion (ex-post evaluation).
For the Member States, receiving EU structural assistance under the Convergence objective, ex ante evaluation of operational programmes is obligatory. In Lithuania the ex-ante evaluation of operational programmes is organised by recruiting independent experts that carry out ex ante evaluation simultaneously for all operational programmes.
127

Following the requirements laid down in the Regulation, during the programming period, the Member State shall carry out evaluation linked to the monitoring of an operational programme, primarily in cases where:
1. The monitoring reveals a significant departure from the goals initially set;2. Proposals are made to the European Commission for the revision of the operational
programme.
Ongoing evaluation will be carried out during the entire period of the implementation of the operational programme, by analysing and evaluating the progress made towards achieving the targets and result indicators, by establishing the efficiency and effectiveness of the use of investments. Evaluations shall be initiated upon the need, having identified the problems related to the implementation of the programme or the part of the programme or where collection of additional data during the evaluation is required. In accordance with the provisions of the Regulation, evaluations will be carried out when substantial deviations from the goals initially set will be identified.
Establishment of such a departure is essentially a qualitative decision, which will be based on the best quantitative monitoring data available. The main criteria to be taken into account are: a) achievement of physical output and/or result indicator (i.e., what share of the goals initially set in the operational programme for 2015 is already achieved); b) share of programme’s funds contracted (from total funds available); c) share of funds disbursed (from total funds available). The decision will also take into account other criteria such as a phase of implementation (e.g., it is normally expected that at initial phases achievement of physical output and/or result indicator will lag), area of investment, type of support granted and other.
The computerised monitoring system shall provide information on the three main criteria. Based on them and other criteria, the Programme Management Committee regularly make an assessment and establish for every objective of priority axis in a operational programme whether there is a significant departure from the goals initially set. If the significant departure is established, the Managing Authority will initiate an evaluation of an operational nature.
Evaluation of operations carried out on a regular basis will allow timely preparation of evaluation results and their submission to the European Commission along with the proposals for substantial revision of operational programmes.
Besides, upon the need, evaluations of strategic nature, covering strategic importance areas under the programme or several programmes, shall be carried out, during which the impact of EU structural assistance will be evaluated in terms of achievement of national and Community goals. In meeting strategic needs, evaluations, covering strategically important topics such as: R&D, innovations, improvement of business environment, informational society, transport infrastructure, energy networks, will be of relevancy.
During the 2007–2013 programming period the Coordinator will be responsible for coordination and organisation of evaluation of operational programmes. The Coordinator has prepared the EU Structural Assistance Evaluation Plan for 2007–2013 (hereinafter referred to as the Evaluation Plan), which contains the analysis of national evaluation needs during the 2007–2013 programming period, the established EU structural assistance evaluation goals, objectives as well as organisation and management of the EU structural assistance evaluation during the 2007–2013 programming period.
128

Annual plans drawn up based on the proposals by the Managing Authority, responsible ministries, Management Committees and Monitoring Committee, will be prepared for the implementation of the Evaluation Plan.
Annual Plans will envisage specific topics, scopes of evaluation and evaluation capacities building projects, institutions responsible for project implementation and project implementation dates.
Usually, evaluations will be carried out externally, by procuring the services of independent experts; however, it is also planned that certain running evaluations of operations shall be carried out by the Coordinator.
Aiming at efficient coordination of evaluation, it is planned to form an EU Structural Assistance Evaluation Coordination Group, which would consist of: the Coordinator, the Managing Authority, responsible ministries and representatives from other responsible institutions. Representatives of the European Commission, social and economic partners and evaluation experts would also be invited to the meetings of the Evaluation Coordination Group. The Evaluation Coordination Group will consider annual evaluation plans and information on their implementation, consider evaluation reports and implementation of evaluation recommendations.
Information on evaluation results will be provided to the Monitoring Committee, the European Commission, other responsible institutions. Also, evaluation reports will be available to all stakeholders and general public.
Information and Publicity
Participation in the use of EU structural assistance is the process of national significance, where active involvement by the public and the implementation of the partnership principle are the obligatory preconditions for its acceptability and success.
Moreover, transparency of the use of EU structural assistance and the simplicity and clarity of the functioning of the EU structural assistance management system, including transparency of project selection and evaluation are the main principles for successful use of EU structural assistance.
During the new EU structural assistance programming period of 2007–2013 it is essential to expand the scope of information activity, as the subject of information and publicity activities as well as discussion topics have become much more complicated.
Information and Publicity Strategy
During the programming period of 2007–2013 it is envisaged that the Ministry of Finance will carry out functions of the EU Structural Assistance Co-ordinator that also include the preparation of the Strategy for Information about Lithuania’s EU Structural Assistance for 2007-2013, Possibilities Granted by Operational Programmes and Implementation Results (hereinafter referred to as the Information Strategy) and the Communication Plan for the Implementation of the Information Strategy.
The Information Strategy will be drafted following the Commission Regulation No. 1828/2006, which contains detailed guidelines for dissemination of information on EU Structural Funds, their
129

assistance and impact, how and what information should be provided to potential beneficiaries, beneficiaries and the public.
The preparation process of the draft Information Strategy will be organised by the EU Cohesion Policy and Structural Assistance Co-ordination Department also invoking assistance of external experts (public relations and marketing agencies), and Managing Authority, which will ensure dissemination of information to potential beneficiaries. The Information Strategy will cover all three operational programmes and define goals and objectives, establish information levels, target groups, information measures. It will also describe information administrative structure and functions, monitoring and financing of the information activity.
The Information Strategy and communication plan will ensure dissemination of information to potential beneficiaries, beneficiaries and the public.
It is planned that no less than 15 persons will be responsible for implementation of the Information and Publicity Strategy and communication action plan. Public relations and Marketing companies will be widely involved in this activity also.
General Objectives of Information
To disseminate information on Lithuania’s EU structural assistance for 2007-2013; To help creating conditions for an efficient use of the funds from the EU structural assistance; Ensure transparency of the use of funds from EU structural assistance.
In order to implement the objectives set in the Lithuanian 2007-2013 Strategy for the Use of EU Structural Assistance, a complex information on EU structural policy, its implementation in Europe and Lithuania, the idea of Lithuania on 2007-2013 EU structural assistance and its administration mechanism, the course of implementation and results will be provided to potential beneficiaries, beneficiaries and the public. The information activity will shape the opinion of potential beneficiaries, beneficiaries and the public on the positive impact of EU structural assistance on the Lithuanian economy.
In order to disseminate integrated information about the progress and results of attaining the strategic objectives laid down in the Lithuanian 2007-2013 Strategy for the use of EU Structural Assistance and operational programmes major events will be organized: launch of Operational Programmes, presenting their results to the public. Conferences, seminars, fairs will be used to provide general information on the content and objectives of EU structural policy and on the possibilities of submitting projects for EU structural assistance to project targets groups, or programme partners (professional associations, social and economic partners, media representatives), also capacity building seminars for individuals working in the field of publicity and information. Website www.esparama.lt will be widely used as complex information tool for internal and external information users as website carry huge quantities of information and enable interaction and on-line accessibility to all Internet users.
Different kind of printing material (publications-documents, programmes, reports, manuals, guides, case-studies-examples of completed projects) will be designed to be presented to the
130

potential beneficiaries, beneficiaries, public and other target groups. This communications tool will serve to ensure maximum transparency for the programme implementation and results.
In order to implement the objectives set in the Operational Programme, the potential beneficiaries, beneficiaries and partners will be provided with information on the Operational Programme, its goals, priorities, measures, the course and results of implementation of the objectives set. The information activity will shape the positive opinion of the potential beneficiaries, beneficiaries and partners on the impact of the implementation of goals and objectives set in the Operational Programme on the Lithuanian economy.
Information and Publicity Activities of Project Executors
Agencies and final beneficiaries will be responsible for dissemination of information at this level. Agencies will collect information about the projects: how the objectives set under the project are implemented, generalise project results achieved and ensure their dissemination. Agencies will also consult beneficiaries on application of information measures and monitor how these measures are being implemented.
The project executor will implement publicity measures under the project following the requirements set in the Information Rules. These Rules will include information measure requirements set in the Commission Regulation No. 1828/2006, and national rules will also be established. The Managing Authority will ensure, that final beneficiaries are informed about the rules and follow the rules during the projects implementation.
Evaluation of Information and Publicity Actions
As the quality of the implemented information actions directly determines the number of applicants, the quality of the projects under preparation, public opinion, regular monitoring and evaluation of these actions is of great significance.
Evaluation measures for information activity results:1. opinion surveys of potential beneficiaries, beneficiaries, partners and public opinion surveys, establishing the change in the level of awareness of EU structural assistance;2. monitoring and analysis of information on EU structural assistance and its use provided in the mass media;3. statistics on the number of visitors of EU Structural Funds websites, the number of the open documents and enquiries on websites and their content analysis, the subscription number;4. surveys of participants of the events organised.
Financial Flows
Hereinafter the main procedures that would help to ensure transparency of financial flows in implementation of this operational programme are presented. It is noteworthy that the system described herein is common to the entire EU structural assistance administered under the Convergence Objective; therefore, it would be equally applied to all operational programmes under the aforementioned Objective. The following two substantial aspects of the financial flow system may be singled out: a) co-financing of actions by EU structural assistance and national funds; b) the cycle of movement of EU funds to final beneficiaries.
131

The national co-financing of EU structural assistance will be ensured from the resources of the State budget, extra budgetary Funds (e.g., the Employment Fund), municipal budgets, and final beneficiaries’ own funds. Taking into consideration the possibility envisaged in the Regulation, private funds will comprise a part of national co-financing.
The potential of the national co-financing of EU structural assistance will be ensured by the integrated planning of EU structural assistance in the State budget. As a rule, the funds from EU structural assistance designated for allocation to a particular economic sector will be included into the annual budget of a relevant appropriation manager (usually – a relevant ministry), responsible for co-ordination of the state policy in this area, by integrating these funds into strategic budget programmes of the appropriation manager as an individual subprogramme. Besides, the planning of public capital investment, co-financed from EU structural assistance funds, will be closely related to the overall planning of public capital investment based on the Public Investment Programme.
The European Commission will transfer EU structural assistance funds to a separate bank account opened specially for each fund with the Bank of Lithuania and administered by the State Treasury Department of the Ministry of Finance. These funds will be transferred to final beneficiaries through the Government Budgeting, Accounting and Payment System (GBAPS). Final beneficiaries will submit payment applications to the agencies that will verify the eligibility of expenditure declared by the final beneficiaries to be financed from EU structural assistance funds, following the procedure established by the Managing Authority. After setting the amounts specified in payment applications eligible for financing from EU structural assistance funds, the agencies will prepare the requests for payment (RfPs) for the amounts set to be proceeded in GBAPS and will transfer them for a relevant budget subprogramme, under which expenditure from EU structural assistance is planned, through the system to their appropriation managers. After preparation of the RfP in GBAPS, the process of verification and certification of the RfP will take place following the general procedure for payment of the State budget funds.
After receipt of a proper RfP for a particular State budget subprogramme, under which expenditure of EU structural assistance is planned, proceeded by the appropriation manager, the Ministry of Finance will transfer the amount of EU structural assistance funds specified in the RfP from a separate bank account opened specially for each fund with the Bank of Lithuania and administered by the State Treasury Department directly to the final beneficiary.
Thus, transparency of the cycle of movement of EU funds down to final beneficiaries shall be ensured by the mentioned several key measures:
After EU structural assistance is integrated into the State budget, during its payment the general control measures for payment of the State budget funds shall be applied;
EU funds, using GBAPS, will be transferred directly to final beneficiaries, thus enhancing the performance of the audit trail principle, also allowing to implement the principle laid down in the Regulation, stating that EU funds have to reach the final beneficiary as soon as possible, in a more effective manner;
The system will ensure that in all cases EU funds for final beneficiaries will be transferred only after verification and certification of amounts eligible for financing from EU structural assistance funds by the procedure established by the Managing Authority.
GBAPS will also ensure that all interest accrued on EU structural assistance transferred to Lithuania in advance will be designated for the implementation of this operational programme as public national co-financing.
132

Flowchart of financial flows is presented in the Annex III.
Data Collection and Transmission via Electronic Communications Means
Pursuant to the procedure established in paragraph 3 of Article 66 of the General Regulation, the Commission and the Member States shall exchange the data via electronic media in accordance with the implementation rules adopted by the Commission.
In view of accumulation, summarising and presenting the data of the ERDF, ESF and Cohesion funds, Lithuania shall use a single Structural Funds Monitoring Information System (SFMIS), which will ensure that all the data, necessary for financial management, monitoring, supervision, audit and evaluation are collected and secured as required by the General and Implementation Regulations. The above data will also be accumulated and secured in hard copies.
Each project will have its unique reference code related to information and operations related to project implementation. The code will be provided upon the registration of the project in the SFIMS. The system will be related to the information State Budget Accounting and Payment System (VBAMS), which will be used for disbursement of payments to final beneficiaries.
SFIMS will be efficiently adjusted to the needs for administration of funds of ERDF, ESF and Cohesion Fund with reference to the specifics of various Structural Funds. SFMIS will provide a possibility to monitor the operational data and financial information on:
- implementation of separate projects, financed from Structural Funds and Cohesion Fund;- progress of implementation of separate operational programmes;- general progress for implementation of the assistance under the Convergence Objective; - detected violations, verifications and audit.
SFMIS will facilitate implementation of the following functions: 1. Management: placement of the data on financial plans and indicators of operational
programmes into computer system, forecasts and monitoring of financial plans and indicators, supervision of obligations and execution of payment plans, control of the N+2/N+3 rule.
2. Administration: project registration, administration of agreements, forecasts on projects implementation and supervision of their execution, registration of verification results, control of eligibility of expenditure and payment. This functions also includes the provision of accumulated data enabling for an easy identification of project implementation problems, related to terms, payments etc.
3. Accountability: provision of information on progress of projects, elaboration of summaries for reports, provision of information on the expenditure, collection of information necessary for execution of control, audit, ex-ante evaluation, mid-term evaluation and ex-post evaluation, submission of reports to the Commission via electronic media (for audit purposes, pursuant to the requirements of Regulation (EC) No 1083/2006)
SFMIS will assist all the related institutions, involved in the system for management and control of assistance to receive sufficient information to be used for justification of accounting records and sums submitted by these institutions to higher level with a view to ensuring the appropriate audit trail.
133

SFMIS will be developed by the Coordinator in co-operation with other institutions (responsible ministries, managing authority, implementing agencies, certifying and audit authorities). It is envisaged that data placement will commence in 2007, and submission of reports of a defined form and via electronic media to the Commission will start on 1 July 2007.
This system will ensure the data transmission between Managing Authority and the European Commission (as endorsed by Article 60 (c) of Regulation (EC) No 1083/2006).
It is foreseen that the data from the SFMIS to the single fund management system of the Community (SFC 2007) will be transmitted automatically. Request for access rights will be centralised and sent to the Commission via Member State Liaison – official of Information Technologies Department of the Ministry of Finance.
Coordination Mechanisms with Other EU Financial Instruments
Coordination of EU structural assistance with other EU financial instruments will be ensured through the number of coordination mechanisms.
First, coordination will be ensured through the Single Monitoring Committee involving the representatives of all the relevant institutions. The Monitoring Committee will ensure coordination through making decisions on selection criteria. As regards coordination with EAFRD and EFF, the representative of the Coordinator will take part in the Monitoring Committees of the EAFRD and EFF financed Operational Programmes, while representative of the Ministry of Agriculture, responsible for implementation of EAFRD and EFF, will participate in the Single Monitoring Committee for Operational Programmes financed by Structural Funds and Cohesion Fund.
Second, compatibility of the EU structural assistance with other EU financial instruments is one of the main functions of the Coordinator, which will analyse the implementation of the Operational Programmes in the context of implementation of other national strategic documents and programmes financed by other EU financial instruments. If necessary, the Coordinator can create working groups to manage actual problems.
Finally, coordination issues will be discussed in the Management Committees created for each Operational Programme. The Management Committees will consist of the representatives of line ministries and implementing agencies involved in the implementation of actual Operational Programme. Though the primary purpose of this Committee is ensuring internal compatibility of implementation of the Operational Programme, if necessary, it also will discuss questions related to the implementation of other financial instruments, especially EAFRD and EFF, as far as they are related with implementation of the Operational Programme.
If necessary, the EU initiatives – Jeremie (financial engineering in providing support for small- and medium-sized enterprises), Jaspers (support in applying public-private partnership when drawing up big infrastructure projects), Jessica (urban development) – the opportunities provided by the European Investment Bank and other EU financial institutions will be made use of.
134

ANNEXES
ANNEX I. BREAKDOWN OF EXPENDITURE BY CATEGORIES
OPERATIONAL PROGRAMME ON ECONOMIC GROWTH – breakdown of expenditure by categories
Breakdown of expenditure by priority themes
Code Title
Financial proportion (EUR)
01 R&TD activities in research centres 74.327.186
02
RTD infrastructure (including enterprise itself, equipment and high-speed computer network, connecting research centers) and centers competent in a particular technology 241.562.993
03
Technology transfer and improvement of cooperation network among small and medium-sized enterprises (SME), small enterprises and other enterprises and universities, all kinds of higher education institutions, regional administrative institutions, research centers and science and technology poles (science and technology parks, techno-poles etc.) 124.567.553
04Support to R&D, first of all to SME (including possibility to use R&D services in the research centers) 70.487.695
05 Quality services to businesses or groups thereof 39.284.215
07
Investments in businesses directly related to RTD and innovations (innovative technologies, founding new companies at the universities, existing R&D centers and companies, etc.) 128.156.812
08 Other investments into businesses 184.866.894
09Other investments to promote RD, innovations and entrepreneurship 234.868.118
10 Communications infrastructure (including broadband) 43.215.638
11
Information and communications technologies (access, security, compatibility, risk prevention, research, innovations, e-content etc.) 55.219.981
13Services and content to citizens (e-health, e-government, e-learning, e-inclusion etc.) 100.836.487
14Services and content to SMEs (e-commerce, education and training, networking etc.) 40.814.769
16 Railways 22.942.11917 Railways (TEN-T) 535.359.80618 Mobile vail assets 8.097.21821 Motorways (TEN-T) 232.609.10522 National roads 394.741.92423 Regional/local roads 49.592.52925 Urban transport 74.388.79327 Multimodal transport (TEN-T) 63.616.79629 Airports 48.066.02430 Ports 94.950.024
135

31 Inland waterways 5.808.87433 Power 44.007.77835 Natural gas 26.698.05243 Energy efficiency, co-generation, energy management 73.346.29668 Support for self-employment and business start-up 41.595.05185 Preparation, implementation, monitoring and inspection 35.859.83686 Studies and evaluation, information and publicity 8.964.959TOTAL 3.098.853.525
Breakdown of expenditure by financing method
Code Title
Financial proportion (EUR)
01 Non-repayable aid 2.897.810.77802 Aid (loan, interest subsidy, guarantees) 97.055.11903 Venture capital (participation, risk capital fund) 25.419.19804 Other forms of finance 78.568.430TOTAL 3.098.853.525
Distribution of expenditure by types of territoriesCode Title Financial
proportion (EUR)00 Not applied 2.858.766.65001 City 196.871.237
05Rural areas (excluding mountains, islands, and rarely or extremely rarely populated areas) 43.215.638
TOTAL 3.098.853.525
136

ANNEX II. INDICATIVE LIST OF MAJOR PROJECTS
Preliminary, the following transport projects of transeuropean significance of big value (with a project value more than 50 million Euros) are planned to be implemented during 2007 – 2013:
Project EU Structural Support Fund responsible for general financing of the project
Preliminary value of the projects (million Euros)
Development of Trans European Network Road E67 (Via Baltica)
Cohesion Fund 95.6
Upgrading of the Vilnius – Kaunas railway section of IXB Transport Corridor for a speed of 160 km
Cohesion Fund 175.6
Upgrading of alarm equipment of the Vilnius – Kaunas railway section of IXB Transport Corridor
Cohesion Fund 57.2
Design and construction of the railway Rail Baltica
Cohesion Fund 127.5
Development of rural area information technology broadband network RAIN
European Regional Development Fund
72
137

ANNEX III. FINANCIAL FLOWS

Beneficiaries
Bank of Lithuania
European Commission
State Treasury Department of the Ministry of Finance
Certifying Authority National Fund Department of the Ministry of Finance
Main State Treasury account
ERDF account
ESF account
Cohesion Fund account
Implementing agencies –intermediate bodies
Payment claims, documents for justification of expenditure
Responsible public administration institutions – intermediate bodies
Payment application to responsible ministry for fund transfer
Payment request to State Treasury Department
Fund transfers
Transfers of EU structural assistance
Bank payment order to transfer EU structural assistance and national cofinancing
Information about fund transfer
Information about fund transfer
Applications for payment
Transfers of national cofinancing
Documents Fund transfers
Information about received payments from EC
Managing Authority(Operational Programmes Management Department of the Ministry of Finance)Delegating tasks
of verification of the eligibility of expenditure to implementing agencies
Information on the procedures and verifications carried out in relation to expenditure
Verification of the eligibility of expenditure
Information about supplied payment declarations
Certified statements of expenditure
Verification of the eligibility of expenditure
Audit Authority
Information on carried out audits
139

ANNEX IV. EX-ANTE RECOMMENDATIONS – OPERATIONAL PROGRAMME ON ECONOMIC GROWTH
In the table below we outline final recommendations made by ex-ante on the version of the Economic Growth OP. These highlight ways in which programme documentation could still potentially be improved.
We have categorised actions taken using the following key:
Key: SymbolYes √√Yes, to some extent √No N
Final recommendations
No.. Recommendations Taken/not taken into account
Comments
1 In social and economic situation analysis it was observed that the economic growth of Lithuania has been attained not only by cheap resources and the rescheduling of markets. After managing the macroeconomic situation, the economic growth was strongly influenced by high domestic consumption and borrowing rates. This once more strengthen the opinion that for the maintenance of the rapid growth it is necessary to encourage the competitiveness of businesses, first of all by increasing labour productivity.
√√
2 It is important to pay attention to the fact that in addition to the domination of low technologies in Lithuania and bad situation with R&D and innovations, it should be noticed that so called traditional sectors of industry (timber and food industry) in respect of labour productivity stand far behind from other EU countries. If we want to increase the labour productivity indicators and to attain the level of some of EU-15 countries, we have to improve the situation of productivity in those sectors of industry that have big influence to the GDP structure.
√√
3 We advice to mark in the SWOT analysis that the public sector in Lithuania is weakening partially due to the emigration of the personnel and due to the poor implementation of reforms in this
N Education and health care systems are not supported under this Operational Programme.
140

sphere, especially in health care and education systems.
4 Besides that Lithuania is losing the rivalry for foreign capital indraught, we would note, that the other phenomenon is also noticed in recent years – the flight of capital from Lithuania when industrialists in Lithuania instead of investing and reinvesting in Lithuania choose other EU countries, including neighbouring countries and the new EU member states.
√ This is described in situation analysis
5 Reshuffle the priorities: bring business productivity objectives which would help to improve the indicators of labour productivity in short-term to the first economic growth priority. In the second place to stress R&D and business orientation to high-technology sector – that would help to improve productivity indicators in long-term. Priorities were not reshuffled but in the second priority of economic growth the problem of low business productivity was sufficiently emphasized and the incentive to increase this productivity was foreseen.
√ The objectives of the programme are formulated /stated in consideration of the recommendations of the experts.
6 To minimize direct assistance to businesses as much as possible avoiding competitive distortions at the same time understanding that the state intervention has to be implemented through the measures of business environment but not directly allocating the budget resources to particular business subjects. In allocating the direct assistance to businesses we recommend to link this assistance to the capacities of the firms designed for export markets thus avoiding possible competitive distortions in the internal market. At the same time it would help to improve the Lithuanian export indicators, which for such size country as Lithuania is could be better.
√ Investments supporting growth of export amounts is foreseen in the page No 73. Furthermore, this will be addressed in setting selection criteria.
7 Having purpose to achieve that businesses would start the innovations in their activity at first it is important to strengthen R&D infrastructure. It would be a jumping-off base for developing of science searching and engineering activity. At the same time we recommend that R&D objects would be integrated but not separately departmental belonging only to one organization. United/joint science searching centers where specialized training of specialists could be organized, studies of investigative engineering done and results of which could be used for development of at least several business sectors would be more effective and at the same time would persist in long-term after the end of EU assistance.
√√
8 We recommend paying attention to the increased risk of absorption √ In the past period very limited assistance for investments in R&D sector
141

of funds. Currently R&D activity is not sufficiently developed especially in the private sector in respect of very limited number of firms investing in R&D and main priority sectors such as biotechnology and laser and comparatively limited number of firms which specializes in these spheres all over the country. Besides, the priorities of country’s investments in R&D are not defined yet notwithstanding that some preparatory works for designing R&D programmes of the country are already done.
and technological base was provided. However firms put in applications actively and contracts for the whole sum of assistance provided were made. In the new period in R&D sector new measures are foreseen both for soft and hard projects. It is also foreseen a wider list of suitable applicants and partners.In February 2007 the Government of Lithuania has confirmed the priority areas in R&D sector. In respect of the priority areas, it is planned to prepare national programmes in scientific research sector (the programme of the career of researchers, Joint national integrated programme, Joint national scientific research and research and business cooperation programme). It is planned to prepare the programmes till July, 2007 in accordance with the order of the Minister of Education and Science).
9 Having in mind the programming period of seven years, one should additionally argument how it is expected to absorb grown LTL 442 m of investment to firms/businesses in R&D sector when in the past period there was a need for LTL 60 m.
√ In the past period very limited assistance for investments in R&D sector and technological base was provided. However firms put in applications actively and contracts for the whole sum of assistance provided were made. In the new period in R&D sector new measures are foreseen both for soft and hard projects. It is also foreseen a wider list of suitable applicants and partners.
10 We would mention these most important indicators of the strategic context: the indicators of export, labour productivity, investments, level of public electronic services, total R&D expenditure and number of researches in business.
√√
11 Specific indicators of programme implementation would be: number of established and developed parks/zones, private investments attracted, number of integrated technological business, research and study centres (poles, valleys etc.) established, number of scientific research centers established and working and other indicators appropriate to specific activity groups.
√√
In the following tables, we highlight recommendations made by ex-ante during the process of evaluating the Economy Growth OP and then provide an assessment of whether or not these have been taken into account or not to date. It should be noted that only the main recommendations are included since ex-ante has made large numbers of recommendations during the ex-ante process as programme documentation has evolved.
142

The evaluation of present situation and SWOT analysis No. Recommendations Taken/not
taken into account
Comments
1 Statements that are provided as main in separate chapters are negotiable or are not so important that could be included in the main statements.
N Recommendation is not clear, which statements in the opinion of evaluators are not important.
2 Some of the indicators could be additional or replaced by the others, which better reflect the explanatory statements. Some of the statements are too simple and reflect too little the peculiarity of the situation.
√ Indicators are revised according to the comments of the European Commission.
3 Conclusion about low level of entrepreneurship and the role of small and medium business in Lithuania could be supplemented by statistics about individuals working individually and working with a patent/ license?
√√
4 Despite the fact that small and medium enterprises in Lithuania make about 60% of the GDP labour productivity of small and medium business is smaller than of big enterprises.
√√
5 The main purpose of the development of small and medium business is the reduction of unemployment and the increase of occupation. In the long term in pursuance of development of economy of Lithuania and better position of competitiveness in world markets, important objectives of the increase of productivity which are better achieved not through small and medium business but through big companies and the change of the structure of economy sector. Objectives of the promotion of productivity have to be ascribed to secondary objectives.
√√
6 When the public infrastructure of the services for business is analyzed attention is paid to small and medium enterprises and the increase of the level of entrepreneurship. Coming back to our previously mentioned comment if low productivity level is mentioned as the main problem of Lithuanian economy then practically public infrastructure of services for business is not described in the analysis of the situation. If small and medium business can use public infrastructure of services which was mentioned here, then the other (rest) business confront with very limited infrastructure of public services. Such public institutions have very small resources and pursue narrow and often doubling functions. As compared with other EU countries such quality of public services infrastructure in Lithuania, in our opinion, is very
√ The infrastructure of public service for business is described in the situation analysis of the OP. Small and medium enterprises are not emphasized in the description that’s why it is unclear why the conclusion that big enterprises will not have the possibility to use some kind of service is made. Moreover the objective of the measures of business environment is to decrease the existing defects of the market – information accessibility for small and medium enterprises, etc. It is generally accepted that such defects of the market are not a problem for big enterprises and not aggravate their activity.
143

low.
7 To main statements we also won‘t put these statements: “There are few international enterprises of domestic origin in Lithuania”, “Industry is the sector of the Lithuanian economy characterised by highest energy-consumption rates”. In global business world of nowadays the origin of an enterprise is not so important as the competitive ability and ability faster than competitors to employ the innovations. It is also natural and obvious that industry has highest energy consumption rates.
√ The statement „ There are few international enterprises of domestic origin in Lithuania” is removed from the main statements
8 Very little attention in situation analysis is paid to the situation of productiveness of the Lithuanian business and the expansion of exports. Despite the fact that Lithuanian economy is growing rapidly, this growth as it was noticed in this analysis is influenced by favourable markets and big domestic market consumption. These factors in our opinion are not sustainable in long term and in pursuance of better international competitive ability of Lithuania it is important to pay attention to business productivity. Moreover economic power of Lithuania as a small country is closely connected with business capability to increase the export and reclaim foreign markets.
√√
9 According to the data of EUROSTAT of 2003 value-added created relation to the number of employees in manufacturing in Lithuania is 7 times smaller than the average of EU-25. In wood industry this indicator is 8-10 times smaller than in Great Britain, Denmark or German and 2 times smaller than in Latvia, Estonia, Czech Republic and Poland.
√√
10 Export relation to GDP in Lithuania in 2005 was 58% while in the similar size states – Slovakia, Czech Republic, Netherlands or Malta – this indicator is 65-84%.
√√
11 We recommend comparing wages and their growth rates with the productivity or GDP calculating in current prices. Accordingly negotiable statement is that wages were growing faster than productivity. Moreover we recommend specifying the measurement of productivity which now is measured in PGS/h – it could be measured in EUR/h. In explaining the intensity of energy and the level of pollution we recommend to specify the measures – GNP current or constant prices. Is it compared in prices of 2000?
N There is no comparative data of EU level of the measurement of productivity in EUR/h. This problem was discussed with ex-ante evaluators.
12 The problems of current situation analysis (which will be solved in intervention measures of the priority “Information society for all”) √√
144

are not classified that’s why it is hard to understand which are the main and have to be solved in the first place and which require later activities.
13 The represented SWOT analysis is exhaustive enough and related to the statements and analysis of the text but our advice is to discuss the statements further and separate main statements from secondary which could not be involved in SWOT analysis. We recommend also starting the list of statements from the most important ones and further putting them accordingly to their importance.
√
14 These main Lithuanian economic strengths would be mentioned: stable macroeconomic situation, rapid economic growth in recent years, increasing consumption, development of enterprises, growth of export, establishment and development of new economic relations with EU countries, constantly renewable infrastructure, better than in other countries developed public mobile telephone connections.
√√
15 Such statements as “relatively large share of population having high or higher education…”, “accumulated research potential” in our opinion should be put near the opportunities not near strengths because they are weakly used in the economy that’s why they are not strengths.
N The problem is that human resources of high qualification including also research potential are not fully use because of not renewed material basis.
16 Statement „Planning of municipal heat facilities creating preconditions for the preservation and modernization of district heating systems and for increasing safety and reliability of energy supply” is in our opinion too particular to be incorporated in SWOT analysis.
N This statement is important in view of activities planned under priority 4
17 We would recommend shortening the list of weaknesses (some of them joining together) and also classifying starting with the most important ones:
low economy productivity, insufficient export dynamics, insufficient investment in process renovation in enterprises, low level of innovations and research implementation in enterprises, inability to attract investment in HMHT sectors, large-scale work-force emigration, causing lack of work-force in the economy and public sector weakening, energy economy dependence on a single provider from Russia, and absence of links with EU systems, etc.
√ Partially considered, statements were integrated: “Low innovativeness rates at Lithuanian businesses; very low rate of business investments in RD and small number of researchers working in business; small RD and innovation capacities of businesses.”
145

18 Respectively we recommend adjusting the opportunities and threats statements. We would mention the outflow of capital from Lithuania and the decrease of reinvestments in Lithuania, the weakening of public sector due to emigration.
N Not taken into account because only statements related to the objectives of the OP were intended to be included in the SWOT analysis.
Logic, objectives and internal compatibility
No. Recommendations Taken/not taken into account
Comments
1 In formulating the vision of Lithuania till 2015 the attention is paid to sound arguments that in recent years the growth of economy of Lithuania has depended mostly on increasing domestic consumption. But the rapid growth of economy in long term depends on the international competitiveness of the economy which in turn at first depends on high productivity of economy sectors and the appropriate structure of economy sectors when it is constituted of businesses using high and medium-high technologies. These statements are mentioned and emphasized in this programme appropriately, but in our opinion, accents should be changed.
√
2 Accents should be changed between “change of the structure of economy” and “increase of the productivity of all or existing sectors”.
√ Considered in formulating the objectives of the programme
3 Actual general modernization of the economy envisaging to increase the level of productivity starting from traditional sectors and envisaging that it is also important to change the structure of sectors of economy moving from low to high technology sectors.
√
4 We would recommend addressing direct assistance to research-technology parks and incubators, research and innovation centers, cooperation between science and business networks and technological platforms to the aim of encouraging the implementation of productivity increasing technologies to export orientated businesses and in supporting the implementation of innovative technologies.
√√
5 Due to the fact that the level of innovation in Lithuania is low enough we welcome the assistance directed to the increase of innovations and the interception of good practice from other European countries.
√√
146

6 The main objective of the economy of Lithuania is not the reduction of unemployment or establishment of workplace but conversely the increase of productivity and the establishment of qualified work places. These objectives are better achieved through big enterprises than through small firms. Measures stimulating entrepreneurship could be minimized and specifically in the first priority.
√ Recommendation is not clear because investments in the increase of productivity and measures for promoting of entrepreneurship are in the area of the second priority.
7 Important assumptions of productivity and at the same time encouraged the measure of business environment in our opinion is the increase of common management level in businesses and the use of the same progressive management models such as methods of quality of management, flexible production, increase of labour productivity and optimization of processes, the use of advanced control system. As shown in various comparisons of the level of management of our firms with analogous situation in other countries, the narrow and ephemeral imagination prevail in this sphere which could not be overcome today by the firms themselves. That is why the foresight of separate measures in these areas could fill this gap and at the same time make the assumptions for higher productivity.
√√
8 The success of the achievement of objectives of the first priority should be measured not by the indicator of the level of entrepreneurship (number of firms for one thousand of inhabitants) but by the indicator of productivity and other secondary indicators. DFI per inhabitant is a good indicator when we have in mind the industrial zones but more concrete indicators such as investments in industry zones could help us to avoid the separation of investment to foreign and local and avoid disputes that this way we withdraw the investments from other European countries.
√√
9 As we understand interventional measures proposed are directed to the infrastructure of R&D and activity in financing the base of science research institutions and strengthening the services that they provide. Generally it seems that one of the logical link of the priority is: “to strengthen research institutes and when they will have what to offer firms will employ innovations and technologies and accordingly the value-added of traditional sectors will increase and more firms using high technologies will emerge and also such sectors as pharmacy, manufacture of optical instruments or manufacture of radio, television or communication equipment will be established or strengthened. In agreeing with this statement we
√ Attention should be paid especially to the development of high (biotechnology, lasers, information technologies etc.) and medium-high technologies.
147

think that the strengthening of R&D infrastructure and activity mostly should improve innovativeness of traditional sectors what in our opinion is a very important priority.
10 From the other side change of the structure of economy sectors from low to high technologies and accordingly the establishment of production in area of high and medium-high technology sector is impossible without the training of specialists in this area (compatibility with priorities no. 1.1 and 1.3) and well developed R&D infrastructure. But the biggest influence to changes of sectors of economy is emerging from international corporations and their decisions to develop business in some territories of the world which depends on economic conditions and international conjuncture. That is why the compatibility with measures provided in the priority No. 2.2 such as the development of infrastructure for industrial parks, science technology parks and centers of innovation will create the conditions for international corporations to develop businesses of high and medium-high technologies.
√ The mentioned aspects are described in AP, p. 64. Attention should be paid to the fact that ex-ante assessors make a mistake putting science and technology parks in the priority No. 2.2. It is a part of the first priority “Research and development for competitiveness and growth of the economy”.
11 Actually we would encourage to direct more assistance to previously explored measures which in our opinion are “business environment” or “indirect” measures because support will be granted not directly to firms but to scientific institutions or to the scientific or research activity of the firm. Present directions of the first priority of the OP on Economic Growth are mostly directed to direct support for firms including support directly related to R&D and innovations. As the last period of ES assistance has shown market distortions and negative impact to competitiveness were not avoided in implementing the direct support. Moreover the administration of assistance was very complicated and slow.
√ The allocation of EU structural funds will be coordinated with the rules of state aid. Schemes of state aid which would regulate the grant of support for firms without the infringement of competition will be prepared. It would seek to guarantee that the gained benefit would overshadow the possible harm to competition. Attention should be paid that more than two thirds of support is foreseen for business environment (public sector).
12 In seeking to avoid distortion of competition in domestic market, the acquisition of new technologies could be filtered with the criterion of export, i.e. technologies which would allow creating production and services to export market could be supported. In the general analysis we pay attention that the development of Lithuanian economy depends upon the increase of export which is not sufficient now.
√√
13 Two groups of action are logically distinguished – the development of electronic services and content and the development of infrastructure accordingly to international practice. Also the attention is paid to scope of Lithuanian content what would enhance the possibilities for Lithuanian consumers to use ICT and
√√
148

at the same time to guarantee the preservation of Lithuanian culture.
14 Logically together with the held objectives of the strategy of the use of EU structural assistance and the objectives of competitive economy, the first objective of the priority could be the development of electronic services and content which could increase the productivity of economy. Measures of support in e-government and e-health services are welcome. It looks like it would be purposeful to reallocate the funds in such manner that the biggest amount of it would be directed to e-services and accordingly a smaller part to ICT infrastructure. At the same time it should be recognized that the development of the information society usually is implemented in a quite complex manner and almost at the same time implementing also content as well as measures of infrastructure, because the sector of ICT is developing very dynamically and very quickly.
√√
15 In granting direct support to science institutions individual science research bases could be established or developed which latter would compete with one another and their capacities will not be used sufficiently. That is why it is better to support joint science centers, bases of which would be useful to implementing of projects of several science institutions and which would orientate to specific, new and innovative areas which as the practice of other countries show are the result of the synthesis of traditional science and practice.
√√
Supervision and indicators
No. Recommendations Taken/not taken into account
Comments
1 There are slightly too many indicators and the number of them could be minimized. A lot of indicators make the analysis and the process of measurement difficult.
√√
2 Indicators could be rated according to their importance, in distinguishing the most important according to the aims and objectives and the secondary ones which accentuate the
√√
149

situation in specific areas. As the main indicators describing the growth of economy according to objectives we would recommend those which show the situation in increasing the productivity in business, in transiting to businesses of high value-added in long-term, in establishing the technologies which increase the innovation and productivity, in establishing the workplaces of high qualification.
3 Some of the indicators are old and not fully describing the situation because their measurement sometimes is hardly possible. For example indicators describing the situation of unemployment are old and the problem of unemployment for us has become reverse for us, i.e. the problem of the lack of workforce. Practically the emigration statistics and data of the level of entrepreneurship are also not reliable.
√√
4 It is important to compare Lithuania with countries of comparative size, such as neighbouring Latvia, Estonia and also with Czech Republic, Slovakia and at some points with Poland.
√
5 Some specific indicators, emphasising the situation in actual and narrow areas are needed. These indicators could be those which describe the workplaces of high qualification, the level of production of separate sectors, the dynamics of Lithuanian export, etc.
√ Separate sectors and the dynamics of export are described in the analysis of the situation of Lithuanian economy.
6 We would doubt data (GDP, direct foreign investment per capita) is necessary by Lithuanian counties if Lithuania is understood as one region of EU, moreover if separate direct activities (it is possible to find indirect) to minimize the economical disproportions of the regions are not foreseen in the second OP.
N Such data is useful because it illustrates the regional inequalities, which it is planned to reduce by establishing new industrial parks, which investors could establish.
7 We recommend putting the indicator of labour productivity in the first place, because the objective of the programme is to increase the productivity. Total labour productivity of the economy would be measured by the value-added of the sales with was generated by one worker in one working hour
√√
150

measuring in the standards of purchasing power or in percents in comparison with the average of the EU-15. In our opinion, the labour productivity is important here, but measured in manufacturing and calculated in EURO – the relation of value-added to the number of employees in Lithuania was 7 times smaller than in EU-25 (EUROSTAT data, 2003). The objective is to decrease this gap twice.
8 Share of goods and services of Lithuanian origin (except refined petroleum products) export of all the relative production sold, %.
√√
9 Share of investments to the main capital in GDP, %. We recommend to seek about 30% of the level of 2005 which was 22,3 %.
√√
10 We would recommend using the indicator of entrepreneurship as a secondary indicator, having in mind that the increase of productivity is not the first objective in the economy of Lithuania.
√√
11 We have already recommended in earlier documents to relate the proposed result indicator „investments attracted“ with the direct activities of the programme. I. e., if polluted territories are going to be reformed and prepared especially for investors then the indicator could be “investments attracted to reformed territories”.
√√
12 The proposed indicator of work places should be modified accenting “qualified work places” because in the absence of workforce which does not decrease in Lithuania, the number of workplaces could diminish but they could be better paid and more productive. One of the proposed indicator would be “the number of new qualified workplaces established” explaining that the workplace is such workplace which has 1,5 times bigger fund of wages than average statistics of that time.
N We don’t foresee such indicator at all. Experts were asked to give advice on how to measure it but there was no in practically useful advices.
13 Because in this programme assistance is foreseen for science technological parks and other institutions exercising similar
√√
151

function we think that an indicator measuring the activity of science parks and these institutions promoting the establishment and development of new firms of innovative nature is needed. Such activity would be measured by the number of new established firms functioning in science technological parks and by number of researches and scientists employed in these firms.
14 Because the objective of this programme is to change the structure of economy sectors that the share of sectors of high and medium-high technologies would increase, then in our opinion the prime indicator should be that one which would measure the change of this structure. Now the level is 16% of high and medium-high technologies sectors in manufacturing, in 2005 it could be changed into 22% having in mind that the annual growth of manufacturing is about 15%.
N In our opinion such indicator is inexpedient because measures for the development of only high and medium-high technologies are not intended. Traditional branches of assistance will grow together with the growth of the productivity of economy. That is why the proposed size of the indicator is poorly justified and hardly attainable.
15 In our opinion the sought number of applications to the European Patent Office could be minimized to 30 units because Lithuania does not have a tradition of such activity.
√√
16 The main objectives of the 3rd priority are to expand the services provided in electronic manner and increase the use of them and further develop the structure of ICT in aiming to decrease the digital disjuncture. Together with the first OP it would be expedient to improve the abilities of the population to use e-technologies.
√ In the description of the 3rd priority the connection with the 1st OP is foreseen in indicating that the abilities of population to use E-technologies will be increased in implementing priorities No 1 and 2 of the 1st OP. The first priority of the 1 OP will develop the computer literacy of the inhabitants including unemployed, employees of the public and business sector which are not in the sphere of the law of civil service. The computer literacy of civil servants will be developed according to the 4th priority of the 1OP.
17 Objectives held in the 4th priority to establish measures for traffic safety and in the 5th priority to decrease the accident rate. The results of the impact of such measures should be the change of the situation in the statistics of traffic accidents which could be measured and compared with other EU countries. E. g., the number of traffic accidents and the change of the difficulty of their outcome.
N The biggest part of traffic accidents (about 90 %) happens due to the fault of participants of the traffic and not due the absence of infrastructure or bad condition of it. That’s why it is very difficult to foresee the changes of the severity of results of traffic accidents or appropriate results of how much casualty there will be. The number of implemented measures will be counted in implementing the projects of road safety.
18 The doubts are about the use of the indicator of the increase of N The EU support foreseen will have little influence to the cargo loading
152

the flow of cargo transported by Ro-Ro at Klaipėda Seaport as this indicator to not reflect the potential of Klaipėda Seaport. As the result indicator the more expedient would be the general change in the cargo reloaded or the passengers served.
in the Klaipėda Seaport taking into account the fact that it is foreseen to develop the infrastructure of the passengers and load ferries terminals where Ro-RO and Ro-Pax ships would be served. That is why it will be possible to calculate exactly proposed indicator.
19 The main objectives of this priority include the actions of the development of the systems of electricity, heat and transport network. The system of indicators should include these areas of action coherently and the number of indicators should reflect the distribution of expenses according to the priority themes i.e. the bigger number of its assigning to the action group of traffic network.
√
20 The objective of the action group is to increase the security and reliability of the energy supply but the indicator is not foreseen. It could be measured by indicator of the frequency and the average duration of the interruption of energy supply for users.
√ The OP includes indicator on number of heat customers for whom reliability and quality of heat supply has improved.
21 In evaluating this advice the Ministry of Economy suggests to include the indicator of the decrease of the average not planed short interruption in distributive electric network per one user per one year (Momentary Average Interruption Frequency index – MAIFI) (%) and the indicator of the energy intensity.
The hardly acceptable indicator of 100 units of the modernized installations in the electricity transmission and distribution networks because the category of electricity installations is not clear. It would be advisable to distribute this indicator between transmission and distribution networks.
√√
153

ANNEX V. COMPATIBILITY OF ASSISTANCE WITH OTHER OPERATIONAL PROGRAMMES AND OTHER EU FINANCIAL INSTRUMENTS
PRIORITY/OBJECTIVE COMPATIBILITY WITH OTHER OPERATIONAL PROGRAMMES
COMPATIBILITY WITH OTHER EU FINANCIAL INSTRUMENTS
Priority 1: Research and Development for Competitiveness and Growth of the Economy
Support for:- activities of scientific research centres;- centres of sciences-business interaction;- the research of centres of excellence in state scientific institutions and universities in the fields of high and medium high technologies (by global grant schemes, including scientific equipment);- the researches of state scientific institutions and universities in the fields of high and medium high technologies;- centres, existing under public science and study institutions, implementing the functions of technology transfer.Only “hard” investments will be financed under this priority, while “soft” investments will be supported under priority 3 of Human Resources Development OP.
Human Resources Development Operational Programme (Priority 3. Increase of the capacity of researchers)- Support for scientists and other researchers (students) in the fields of scientific activity (by global grant schemes), studies, mobility: employment of researchers in public sector and in enterprises of high and medium high technologies, scientific internship of students, scholarships for PhD students, projects for development of regional and sectoral mobility (study visits), spread of R&D results, innovative capacity, management of intellectual property. Only “soft” investments will be financed under this priority, while “hard” investments will be supported under priority 1 of OP on Economy Growth.
7th framework programme:- transnational mobility and continuous upgrading of professional skills of scientists and researchers in EU scientific centres of excellence
EAFRD:- Measure „Vocational training and information actions“ (vocational training and information actions, including dissemination of scientific knowledge and innovative practices, for persons engaged in agricultural and forestry sectors).Demarcation criterion – range of activity: training in agriculture and forestry.
- Measure “Modernisation of agricultural holdings”, Activity “Investments into agricultural production and / or services to agricultural sector” (purchase of new agricultural machinery and equipment, computer hardware and software).Applicants: natural or legal person engaged in agricultural activity, science and education institutions, possessing experimental, demonstration, training and test farms and engaging in agricultural production. Demarcation criteria:range of activity: spreading of science and technology in agriculture.EFF:- Support for promotion of partnership of scientists and operators in the fisheries sector, pilot projects for
154

innovations in fisheries sector.Applicants: non-governmental organisations or public legal persons representing interests of fisheries sector.- Support for construction, extension, equipment and modernization of fish processing enterprises when seeking to produce or to market new fish products, applying new technologies or developing innovative production methods.Applicants: fish processing enterprises with less than 750 employees or with a turnover of less than EUR 200 m.
Priority 2: Increasing business productivity and improving environment for business
Objective 1: Increasing of productivity of businesses
- investments in new production equipment and technologies, e-business solutions, quality and production process management, etc. systems, energy audits in enterprises aiming to increase their productivity, improve quality of its activities, etc.Applicants: enterprises
Human Resources Development Operational Programme (Priority 1. High-quality employment and social inclusion)- Development of human resources in enterprises: Training and upgrading of the qualifications of workers, executives, personnel managers of enterprises (development of general and specific skills and competencies), creation and installation in enterprises of modern systems of personnel management correlated with actual training of managers and workers. Applicants: enterprises
EAFRD:- Measure “Modernisation of agricultural holdings” (support for the purchase of new agricultural machinery and equipment, computer hardware and software intended for the use of the project; development of holding’s infrastructure when it is related to agricultural production and/or processing and/or services for agriculture sector and preparation for marketing).Applicants:farmer or a legal entity engaged in agricultural production and/or services for agriculture sector and having registered his/her holding according to the national legal acts; cooperatives, science and education institutions, possessing experimental, demonstration, training and test farms and engaging in agricultural production.
-Measure “Processing of agricultural products and increasing of added value” (support for new equipment and machinery, including computer software). Applicants: micro-enterprises operating in urban area, small and medium-sized enterprises processing
155

and /or engaged in marketing of agricultural products and have been engaged in business for at least 2 previous years before entering the scheme; enterprises with employ 250 to 750 employees or with an annual turnover from EUR 50 million to EUR 200 million that process agricultural products and/or have been engaged in business for at least 2 previous years before entering the scheme; agricultural cooperatives.
Demarcation criteria - range of activity: investments in new production equipment and technologies in agriculture and production of agricultural products.
EFF:- Aquaculture: measures associated with the industrial investment in aquaculture.- support to founding, development, equipping, and modernizing of fish processing enterprises, aiming to produce and provide new fish products, apply new technologies, or develop progressive production methods. Applicants: fish processing enterprises that employ no less than 750 people, or with an annual turnover from EUR 200 m.
Objective 2: Increase viability of businesses and promote entrepreneurship
156

- infrastructure for business environment: development of business incubators and information centres in places not belonging to rural areas), etc.
- measures to improve business environment: creation of databases, market assessment, information dissemination for businesses: seminars, conferences, etc. cooperation of business associations or business information centers etc. with other relevant institutions and exchange of experience, etc.;
- projects for competitiveness growth: preparation, various sectorial and overall competitiveness studies, activities for improvement of Lithuanian business environment image, etc.
Human Resources Development Operational Programme (Priority 1. High-quality employment and social inclusion)- Training of people’s entrepreneurship skills in connection with establishment of business. Applicants: Business information centres, business incubators, non-governmental organizations.
Operational Programme for Promotion of Cohesion, 2 priority (Local and urban development, conservation of cultural heritage and nature and adaptation for tourism development)
- improvement of community urban infrastructure (Renovation and development of public leisure, sport and cultural, urban transport infrastructure important for business). Complex development projects exceeding 200 000 euros will be financed.Applicants: municipalities or their institutions
EAFRD:- Measure „Vocational training and information actions“ (vocational training and information actions, including dissemination of scientific knowledge and innovative practices, for persons engaged in agricultural and forestry sectors).Demarcation criterion – range of training: agriculture and forestry.- Measure “Use of advisory services“(advisory services for natural persons or a legal entities and forest owners engaged in agriculture and/or forestry. Advisory services on the statutory management requirements and the good agricultural and environmental practice, agri-environmental, bookkeeping, forestry issues).Demarcation criterion: advisory services in fields of agriculture and forestry.
Objective 3: improve access to financing sources for SMEs- financial engineering measures (micro credits, guarantees, risk capital funds)
EAFRD:Measure “Support for business creation and development” (support for establishment and development of micro-enterprises in rural areas).Demarcation criteria - type of support: investment support (the support is not refunded by applicant).
EFF:- Aquaculture: investments to construction, development and modernization of production equipments;- Processing and marketing of fishery products.
Priority 3. Information society for all
157

- distant learning: measures of informal education for all people of the country via internet (e-content will not be created)
- development of interactive eGovernment services (no less than 3th level of online sophistication) for citizens and business.
Human Resources Development Operational Programme (Priority 2. Lifelong learning)- distant learning (creation of e-content of informal learning and measures of formal learning).Applicants: providers of formal and informal education services.
Human Resources Development Operational Programme, 4 priority (Administrative capacity building and increase of efficiency of public administration)- distant learning and e-content: creation of training measures for civil servants.
Human Resources Development Operational Programme, 4 priority (Administrative capacity building and increase of efficiency of public administration)- development of information systems and databases of public administration institutions together with other measures such as improvement of legal environment, training, etc. Development of IT measures in such projects is oriented only to optimization of internal procedures of national and municipality institutions and/or provision of GOV-2-GOV electronic services.
Priority 4. Basic economic infrastructure
158

Building and reconstruction of regional roads (including paving of gravel roads) Applicants: municipalities
Investing in deepening of ports, construction and reconstruction of docks, improvement of interaction between ports and rail and road transport, development of inland waterways.
EAFRD:Measure „Modernisation of agricultural holdings“ (support for building farm roads)Demarcation criteria:- applicant: natural or legal person engaged in agricultural activity; - location of project implementation (farm area)..
EFF:Support for investments in existing public and private fishing ports, for reconstruction of landing sites and for investments in modernization and reconstruction of small fishing shelters.
Priority 6. Technical assistance for the implementation of the operational programme on Economy GrowthObjective 1: To ensure the effective functioning of the system for management and control of the EU structural assistance received under the Convergence Objective in the course of the implementation of this Operational Programme for Economy GrowthThe technical assistance will be provided under this priority to the activities of all institutions involved in the implementation of the Economy Growth Operational Programme related exclusively to the implementation of this Operational Programme.
Operational Programme for Technical AssistanceIn case the same institution will be involved in the implementation of more than one Operational Programmes, its activities could be financed from the Technical Assistance Operational Programme.
Objective 2: To improve awareness of the potential beneficiaries, beneficiaries and partners about the assistance provided by the Cohesion Promotion Operational Programme and results of its implementation, to perform evaluation activities of the Economy Growth Operational Programme
The publicity and evaluation activities related exceptionally to Economy Growth Operational Programme will be financed under this priority.
Operational Programme for Technical AssistanceThe publicity and evaluation activities related to more than one Operational Programmes will be financed from the Technical Assistance Operational Programme.
159

ANNEX VI. STATE AID CLAUSE
Any public support under this programme must comply with the procedural and material State aid rules applicable at the point of time when the public support is granted.
160

ANNEX VII. PUBLIC PROCUREMENT
Member state ensures that public procurement carried out implementing projects under this Programme complies with provisions of Directives 2004/17 /EC and 2004/18/EC or respective principles of the Treaty.
161

ANNEX VIII. REGIONS FOR ECONOMIC CHANGE INITIATIVE
The Coordinator (as referred in chapter 6) or Managing Authority may:
a) allow in the Monitoring Committee the presence of a representative (as an observer) of the network(s) participating in the Regions for Economic Change initiative to report on the progress of the network's activities related to the implementation of the Operational Programme on Economy Growth; b) foresee a point in the agenda of the Monitoring Committee to take note of the network's activities and to discuss relevant suggestions for the Operational Programme on Economy Growth.c) inform in the Annual Report on the implementation of the regional actions included in the Regions for Economic Change initiative and related to the implementation of the Operational Programme on Economy Growth.
162

ANNEX IX. COOPERATION WITH THE BALTIC SEA COUNTRIES
Given the size of the national market, where appropriate, co-operation with the other Baltic Sea countries will be sought in areas of common interest and where either economies of scale or the possibility to reach a critical mass might facilitate opportunities that would otherwise be more difficult to achieve individually.
163

ANNEX X. RECOMMENDATIONS ON STRATEGIC ENVIRONMENTAL IMPACT ASSESSMENT OF OPERATIONAL PROGRAMMES IMPLEMENTING THE LITHUANIAN STRATEGY FOR THE USE OF
EUROPEAN UNION STRUCTURAL ASSISTANCE FOR 2007–2013
No. Recommendation Taken into account/not taken into account
Comments
1. We propose to add provisions in the OPs which would obligate the County Governor’s Administrations and Municipalities to revise their strategic documents as soon as possible and to supplement them with the priorities, goals and objectives stated in the programming documents. This should be emphasized in the programming documents as Municipalities and County Governor’s Administrations play a major role in implementing the measures of environment protection and improving its state.
Taken into account The Ministry of Interior will inform all the County Governor Administrations and municipalities, that in accordance with goals, priorities, and objectives, identified in the Operational Programmes, the regional strategic documents should be revised.
2. In order to get the maximum benefit from the investments in environment protection, the environment conservation principle should be observed. This should be emphasized in the OPs, especially in the OP on Economic Growth. In this OP there should be more aspects/explanations/arguments concerning environment protection in determining the solutions significant for the economy of the country, i.e. to affirm that the combination of solutions which would not damage the quality of the environment is sought.
Taken into account All investment projects will be assessed in respect of impact on environment
3. Because of the fact that EU countries in the sphere of waste management are orientated towards the measures of waste prevention, recycling and biological decomposition of waste, which are cheaper and create more workplaces as compared with the dumping grounds and their burning, the question arises if the priorities of Lithuania in foreseeing the future investments are harmonized with the future policy of the EU. Therefore, it is essential to supplement the OP on Economic Growth with the tendencies of recycling and other means of management (for example, China is creating “waste recycling economy”, in some states of the USA there is a settled prohibition to scrap some sort of waste in dumping grounds and the recycling of them is encouraged; in Japan there are a lot of spheres of waste policy which are called “3R – reducing, reusing and recycling”). Due to the fact that Europe is seeking to become more competitive and dynamic, in the text of the OP there should emerge similar aspects generalizing the vision of environment protection.
Not taken into account Proposal of experts to define a separate waste management sphere under this OP is not acceptable, because the main goal of the Operation Programme on Economy Growth is increasing of competitiveness on various sectors of economy. As regards waste management measures, they are foreseen under Operational Programme on Promotion of Cohesion.
4. The analysis of the current social and economic state of environment requires much time to collect the data and to check its reliability. The data collection and processing is a problem not only in Lithuania but also in EU countries. In the part of monitoring the implementation of the OP we propose to emphasize the importance of monitoring the outcomes. Moreover, we propose that in the future in monitoring the after-effects for
Partly taken into account Monitoring arrangements are thoroughly described in chapter 6 (Implementing provisions).It is foreseen that Monitoring Committee will be involved in the monitoring of the horizontal
164

environment it would be possible to move to the indicators used by EU countries which are used to assess the progress of EU countries in environment protection (The European Environment, State and Outlook 2005) – 9 indicators and their two positions (fixed state and progress). We recommend establishing a group of independent experts who would work permanently in the sphere of improvement of the monitoring system and would coordinate this activity. The Environmental Protection Agency which now performs the monitoring of the environment in Lithuania should appear in the administration scheme of implementation of the OP.
priorities.
5. The aspects of the better use and increase in the competitive ability of Klaipėda Seaport should be better described in the OP on Economic Growth as the experts of Strategic Environmental Impact Assessment could not make conclusions due to the lack of information (they estimated only the possible outcomes for separate components of environment). We propose to explain which environmental problems could be solved at the national level by increasing the potential of Klaipėda Seaport.
Partly taken into account In order to increase the capacity and competitiveness of Klaipėda Seaport in 2007–2013 it is planned to establish an infrastructure of passengers and cargo terminal while increasing the safety and decreasing the negative impact on the environment ( the decrease of noise and exhaust gas). Moreover, it is planned to fix the access roads to multimodal cargo terminals in the southern part of the Seaport and to install a wharf for boats and small ships. In developing the Seaport in 2007–2013 it is not planned to implement the projects which would solve the environmental problems at the national level (for example, the establishment of useful infrastructure for the exportation of non-burnable waste to other countries). Estimating that currently there is no demand to export such waste , the loader companies in Klaipėda Seaport do not plan to establish useful superstructure for that but the infrastructure which depends upon the state could fully meet these demands.
6. Low interest of the public in the results of the report of Strategic Environmental Impact Assessment could have an impact on implementing the OPs, so in the text of the OPs there should be included the proposal that after the execution of the Strategic Environmental Impact Assessment it is essential to further inform the public.
Taken into account Information actions will be continued. In line with SEIA Directive, once the OPs are approved the consulted institutions and partners are informed on how
165

the SEIA recommendations are taken into account.
7. In the OPs we recommend to pay specific attention to the Regulation concerning the Registration, Evaluation, Authorization and Restriction of Chemicals (REACH) which took effect on the 1st of January, 2007. In the context of sustainable development this system will introduce a lot of innovations and could have an impact on the implementation of the objectives set in the OPs. The experience of EU countries shows that unemployment has significantly increased and it had an impact on the development of small and medium enterprises. This system is built on the principle that if there is no data about the chemical – there is no market. The danger for environment protection arises from the fact that waste does not fall under the sphere of regulation/control and could become an object of fraud (the stock for production could be named as waste and in this way procedural expenses could be avoided). Such threat is a danger for environment, public health and could distort the market – so have an impact on the competitiveness of the country.
Not taken into account The measures of the OP on Economic Growth designed for business are not orientated towards purposive sphere of chemicals, thus, the statement that enactment of the REACH regulation could have an impact on the implementation of the OP goals is not reasonable (there is no reasoning in other parts of the report of Strategic Environmental Impact Assessment). We think that the implementation of the OP will contribute to the development of the small and medium enterprises and employment so it will decrease some negative outcomes of the implementation of EU directives mentioned by the experts. Questions directly related to enactment of the system of REACH will be solved by using the funds of national programmes.
8. As the conclusions about the possible outcomes of implementation of the OP are evaluated and given in the tables (described) it is possible to make a conclusion that the biggest part of the objectives when implemented will improve the state of environment. As the total impact on environmental components is usually positive, we propose while setting the measures of implementation to pay attention to those environmental components which could be affected, i.e. while setting the measures of implementation to discuss it with all the interested parts if, for example, the public health or value of the real estate or preservation of landscape is a priority in implementing the objective.
Taken into account All investment projects will be assessed in respect of impact on environment Environmental institutions and partners will be participating in decision making on project selection criteria (Monitoring Committee)
9. The damage done to the environment in the past has a huge impact on the value/devaluation of the real estate. Most of the population and enterprises do not know that in buying or selling the real estate the burning problem is to get the information about the quality of the environment of the location. Such situation could have an impact on the foreign investments. Therefore, such environmental aspect could appear in the OP on Economic Growth.
Not taken into account The formulation of recommendation is not definite and there is no clearer and more comprehensive content which would be related to this recommendation in the Strategic Environmental Impact Assessment.
10. The development of community infrastructure should be related to the changes in municipality budget formation principles while integrating the state attitude (in the sphere of environment protection). The municipal
Taken into account Regional development plans should comply with the principle of sustainable development
166

environment protection funds should be orientated towards the co-financing of the objectives of the OPs. This attitude should be declared in the programming documents.
Furthermore, municipalities have special environment programmes, which could be used for co-financing.
11. Business centers which have a network in Lithuania should pay more attention to the environmental consultations. Small and medium businesses do not have potential and time to collect the information and adapt it to their business, therefore, they can miss the moment when their disregard for the environmental requirements decrease their competitiveness in the market. The specialists of the business centers should propose the businessmen about the questions of development while warning about the need for investments in the measures of environment protection.
Not taken into account In the OP on Economic Growth there is no detailed description of the work topics of business information centers. Business information centers together with partners plan their working strategy which is devoted to improvement of business conditions in regions and strengthening of business competitiveness while warranting the flow of actual information.
We think that the exclusion of one theme not mentioning other important themes for business is inexpedient.
167