eisriesenwelt – from laser scanning to photo-realistic...
TRANSCRIPT
513
Eisriesenwelt – From Laser Scanning to Photo-Realistic 3D Model of the Biggest Ice Cave on Earth
Jeannette MILIUS and Christin PETTERS
Abstract
Over the past years three-dimensional surveying and visualisation of large spatial objects have received significant attention, not only for scientific purposes but also for the areas of tourism and marketing. Terrestrial laser scanners provide dense point clouds with a huge amount of data. The paper focuses on the three-dimensional surveying and visualisation of a cave system which holds international importance as the biggest ice cave in the world, the Eisriesenwelt, also known as the World of the Ice Giants, near Werfen, Austria. Altogether 158 360° scans and more than 2000 texture images with approximately 27 Gigabyte of data were acquired. This paper points out the methods necessary to compute a realistic three-dimensional model with this vast amount of delivered points. The generation of an accurate and photo-realistic digital model is performed using different commercial software packages. It shows the workflow of the appropriate data preparation and analysis of the natural monument Eisriesenwelt. Thereby, the presented processing steps can be used for other surveying questions, especially as-built documentation of cultural heritage. The results comprehend, on the one hand, the large three-dimensional model and the calculated ice surface with threshold modulation and, on the other hand, the generated virtual fly-through through this ice cave.
Keywords: Terrestrial Laser Scanning, 3D Visualisation, Point Clouds, Ice Cave
1 Introduction
In times of global warming, the current dwindling of ice and permafrost areas in the European Alps have received increasing interest within the scientific community and in the public. An appropriate technique for the documentation of threatened natural monuments display terrestrial laser scanners (MAY et al. 2011). Scan data can be used for the represent-tation and analysis of such three-dimensional objects. Nowadays, especially purposes of visualisation, modeling and change monitoring of cultural heritage are of special interest. The dwindling and waxing of the perennial cave ice depends on different environmental parameters, e.g. the cave geometry, the outside climate and the lack or presence of snow that provides infiltration water during spring snowmelt (MAY et al. 2011).
Located at the western escarpment of the Tennengebirge Massif into the Salzach Valley, the Eisriesenwelt is undisputedly the rock cave with the largest ice coverage worldwide. With a total length of 42 kilometers, the ice cave comprehends an ice-filled part which is slightly more than 1000 meters long and extends over a vertical distance of 134 meters. In April 2010 under the guidance of Manfred Buchroithner, two teams consisting of four
Jekel, T., Car, A., Strobl, J. & Griesebner, G. (Eds.) (2012): GI_Forum 2012: Geovizualisation, Society and Learning. © Herbert Wichmann Verlag, VDE VERLAG GMBH, Berlin/Offenbach. ISBN 978-3-87907-521-8.
J. Milius and C. Petters 514
cartographers each surveyed the ice masses using two FARO Photon 120/20 terrestrial laser scanners sponsored by FARO Europe.
Terrestrial laser scanners that are working with the phase-measurement principle determine the distance to an object, whereupon the ranging instrument defines the phase shift of the emitted laser signal and the received signal after reflection. Additionally to the captured three-dimensional information of the measured surface of an object, TLSs collect intensity values that depend primarily on the reflectivity characteristics of the scanned object. Capturing the surface structures of an object using TLSs, results in digital point clouds. Laser scanning is one method, which has proved to be successful in dealing with ice surfaces (project AUSTRO ICE CAVES 2100, 2008). Using TLS data, the surface calcu-lations can be determined exactly. The ice surface of the ice cave Eisriesenwelt was not even roughly known. Previous estimates of the ice surface range from “around 10,000 square meters” to “30,000 square meters”. In order to provide a first measurement of the ice surface, and thus, a basis for further measurements, the giant ice cave was measured in April 2010. This measurement yielded the basis to answer how far the global warming influences the ice surfaces of the worldwide ice caves. A decrease of the ice surface in the ice caves would involve a dwindling of the touristic capital in the regions of such national monuments.
Within this paper the workflow from the data acquisition to the generation of a three-dimensional model is described. The first two parts outline some background information about the national monument Eisriesenwelt and describe the process of terrestrial laser scanning. In Section 4, a first estimation of the actual ice surface is given on the basis of a threshold modulation concerning the intensity values. Furthermore, the process of the generation of the three-dimensional model including the registration of the point cloud data, separation in diverse classes, creation of geometries as well as meshing of the surfaces and the filling of the holes in the mesh is described. Therefore suitable software packages were selected in order to handle such an extraordinary amount of data. Additionally, a simulated fly-through was created. The results of the generation of the huge three-dimensional model of the Eisriesenwelt and its utilization are discussed in Section 9.
2 Eisriesenwelt – The World of the Ice Giants
The Salzburger Land offers several caves which were formed during the Alpine orogeny. Of these cave systems only one holds international status for being the biggest ice cave of the world, the Eisriesenwelt, also known as the World of the Ice Giants, located near Werfen, Austria (figure 1). The cave system with the geographical coordinates of 47°29'54" N and 13°11'39" E (www.eisriesenwelt.at) is located 44 kilometers south of Salzburg at the western escarpment of the Tennengebirge Massif. The approx. 20 meter wide, funnel-shaped entrance of the Eisriesenwelt can be found in the west face of the Hochkogel Mountain (2.283 m) at an elevation of 1,641 meters above sea level. With a total length of 42 kilometers the World of Ice Giants is an extensive cave system with impressive ice formations, labyrinths and giant halls. Over a distance of more than one kilometer there exists permanent ice the extent of which is still to be studied in detail. For a long time the ice cave has not been explored due to a lack of interest in high-alpine natural phenomena as
Eisriesenwelt – From Laser Scanning to Photo-Realistic 3D Model 515
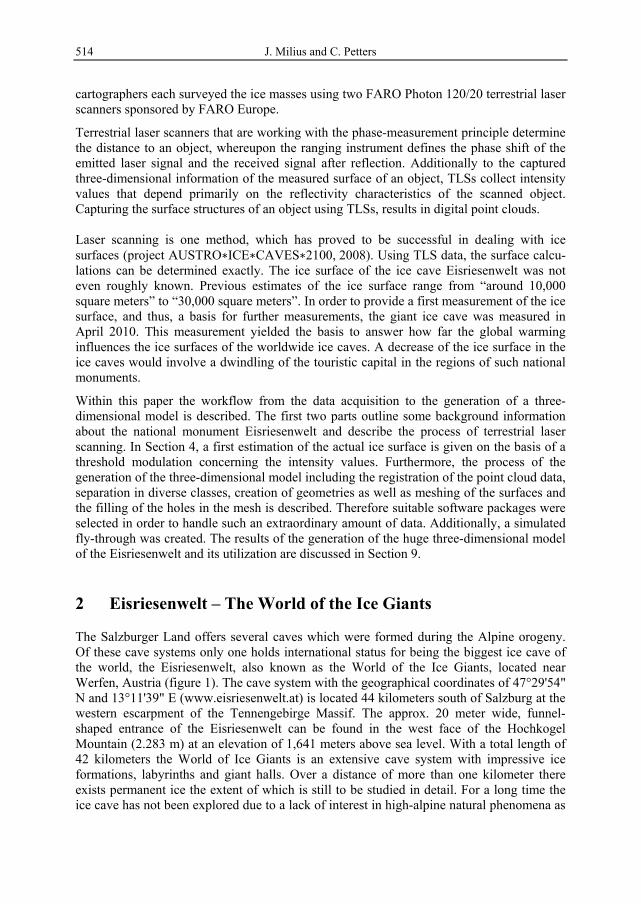
well as superstition. In October 1879 Anton von Posselt-Czorich entered the Eisriesenwelt ice cave. During the following 33 years apparently nobody investigated the ice cave until Alexander von Moerk studied a report by Posselt. Over the next few years, many expeditions were embarked to discover the remaining cave system. On 26th September 1920 the Eisriesenwelt opened for tourists. Today the world’s biggest ice cave opens its doors from May to October for about 150.000 tourists every year.
Fig. 1: The so-called “Posselthalle” from the bottom up (www.eisriesenwelt.at, accessed 30 July 2011)
The Federal Monument Office manifested the Eisriesenwelt a natural monument on 19th August 1929. The major economic potential of tourism and the driving factor for the preservation of the natural monument is the ice. But to this day, there exist no exact studies about the extension of the ice surface and the changes of the ice masses. As mentioned above, previous estimates of the ice surface reach from “around 10,000 square meters” to “30,000 square meters”. This indicates an alarming difference of 300 percent. Altogether, in times of global warming it is essential to determine the exact ice surface as a basis for further ice monitoring and in order to make statements about the increase or decrease of the ice surface and possible plans for the protection of this natural heritage. Terrestrial laser scanning represents a reliable and accurate method to calculate the ice surface.
3 Terrestrial Laser Scanning in the Ice Cave
On behalf of the executive board of the Eisriesenwelt GmbH, Werfen, Austria, the Institute for Cartography of the Dresden University of Technology, Germany, surveyed the Eisriesenwelt and documented its surface photographically. The aim of this campaign from 5th to 11th April 2010 was the generation of a photo-realistic three-dimensional cave model. A team consisting out of eight cartography students of the TU Dresden mapped the whole ice-filled part of the cave including several parts, which are not accessible to the public. Under the direction of Manfred Buchroithner the biggest ice cave of the world was measured in two teams with the help of two terrestrial laser scanners of the type Photon 120/20, which were donated by FARO Germany.
The laser of the FARO Photon 120/20 works in the near-infrared (NIR) spectrum at a wavelength of 785 nanometers and a laser power of 20 milliwatts. Prior to the field-campaign a physicist from FARO analysed the penetration depth of the laser beam into the ice. The laser scanner featured the same wavelength as the one used for the measurements inside the ice cave. The scanner uses the phase measurement method, whereupon the
J. Milius and C. Petters 516
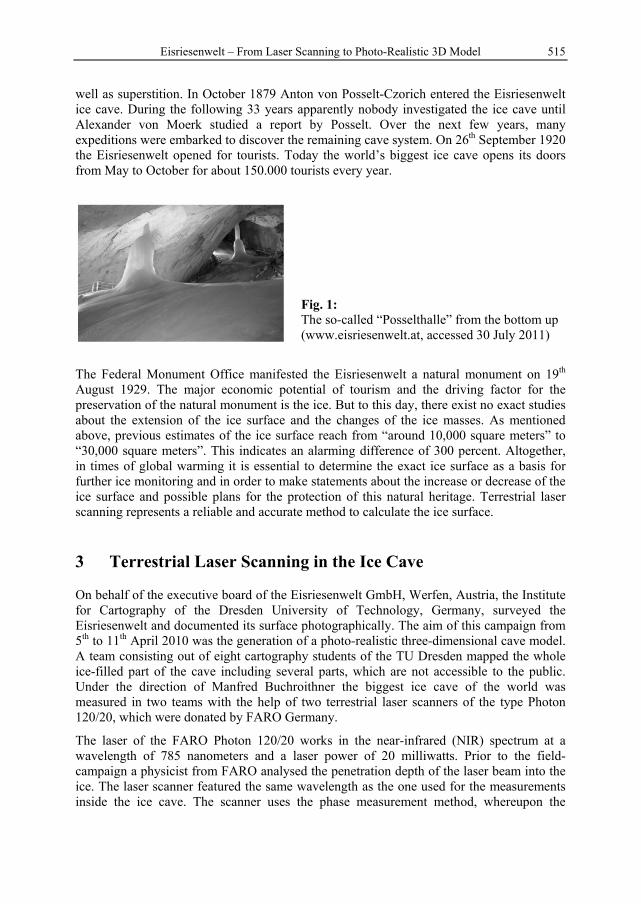
ranging instrument determines the phase shift of the emitted laser signal and the signal received after reflection (in PFEIFER & BRIESE (2007)) more applications and principles of laser scanning are explained). This allows a measurement distance between 0.6 meters and 120 meters. With a measuring speed of 244,000 points per second, which means one fourth of the optimum resolution, the entire surface structures of the ice-filled part of the Eisriesenwelt were scanned, resulting in digital point clouds with just a few millimeters of point spacing. In total point clouds from 158 scan stations were captured. Additionally to the recorded three-dimensional information of the measured surface of an object, the FARO Laser Scanner Photon 120/20 collects the intensity values, which depend primarily on the reflectivity of the scanned object and provide consequently radiometric information about the object (see figure 2).
Fig. 2: Scanned intensity image from laser scanner. The black part shows the ice and the white part the rock as well as the gangways.
Each surveying team consisted of 4 people. One team began measuring at the entrance of the cave at an altitude of 1.641 meters, while the other team started at the end of the ice-filled part of the cave. Besides the scanning process proper, the field work also involved the placement of targets, so-called reference spheres, in the areas of scan overlaps. These targets presented the basis for the registration of the point clouds using the FARO Scene software [see Chapter 5]. It was important to place the reference spheres within the range of sight of the actual and the adjacent scan stations. Because of many hidden corners and a height difference with more than 1400 steps, this was not always possible. For the same reason plenty of scan stations were necessary that were located very close to each other. Using crampons and ice axes on the ice surface the two teams placed both the reference spheres and the scanners. Prior to the actual cave surveying a set of highly accurate measurements to and from defined surveying points of the official Austrian Geodetic Network had to be accomplished using a tachymeter, in order to allow the attachment of the cave surveys to the Austrian Geodetic Network (Oesterreichisches Bundesmeldenetz). The 158 captured laser scans and more than 2000 gathered texture images resulted in a total amount of 27 gigabytes of data which had to be processed subsequently.
The new FARO Laser Scanner Focus3D has an integrated camera with a resolution of 70 megapixels, so that an additional camera mounted at the top of the laser scanner is not necessary any more. The weight of the laser scanner Photon 120/20 is 14.5 kilograms. In addition, a laptop, batteries and tripods did not make it any easier to transport the scanner between different scan positions under the harsh climatic working conditions, lots of steps and a slippery ground surface.
Eisriesenwelt – From Laser Scanning to Photo-Realistic 3D Model 517
4 First Estimations of the Ice Surface by Threshold Modulation
The collected data provided point clouds of diverse objects with special surface properties resulting in different intensities of the data. Besides its X, Y and Z values, within the .xyz data format of the captured laser scans the intensity of each pixel is listed. The signal of the laser scatters strongly on rough surfaces like rocks and returns relatively much information to the scanner. However, sending a laser beam onto smooth surfaces, e.g. ice, the total reflection arises, whereby the signal is diverted in the opposite direction of the scanner and no signal returns (Lambertian reflector). Weak signals are represented in low and strong signals in high intensity values. In this case ice is nearly black and the rock, which possess a strong reflection due to its roughness, relatively bright. The intensity values were numerically separated from each other using a threshold. According to the intensity values the relatively dark ice surface was defined by a threshold that describes the border to the rocky surface and counts all subjacent pixels under this threshold to an absolutely low intensity value. This was a tricky, delicate issue, because the ice surface was partially counted twice. Likewise, some parts of the ice are rough, because water is dripping into the cave and freezes unevenly. Therefore, high signals are returning back to the scanner. So, the case of total reflection is not given anymore. Frequently, based upon intensity values, the ice-filled part of the cave can be easily confused with rocks. An initial calculation resulted in an ice surface of the Eisriesenwelt of 27,890 square meters.
5 Registration of the Point Clouds
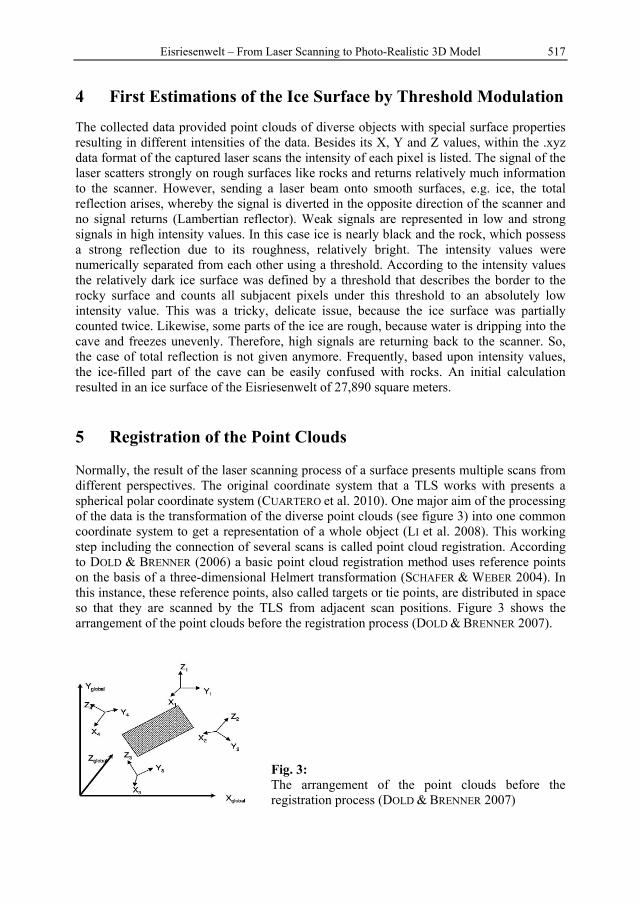
Normally, the result of the laser scanning process of a surface presents multiple scans from different perspectives. The original coordinate system that a TLS works with presents a spherical polar coordinate system (CUARTERO et al. 2010). One major aim of the processing of the data is the transformation of the diverse point clouds (see figure 3) into one common coordinate system to get a representation of a whole object (LI et al. 2008). This working step including the connection of several scans is called point cloud registration. According to DOLD & BRENNER (2006) a basic point cloud registration method uses reference points on the basis of a three-dimensional Helmert transformation (SCHAFER & WEBER 2004). In this instance, these reference points, also called targets or tie points, are distributed in space so that they are scanned by the TLS from adjacent scan positions. Figure 3 shows the arrangement of the point clouds before the registration process (DOLD & BRENNER 2007).
Fig. 3: The arrangement of the point clouds before the registration process (DOLD & BRENNER 2007)
J. Milius and C. Petters 518
The FARO Scene software from FARO Europe GmbH & Co. KG offers point cloud registration on the basis of reference points that can be either reference spheres or reference planes. A captured point cloud that was scanned with one fourth of the optimum resolution has a maximum size of 9,520 points in horizontal and 4,307 points in vertical direction. This results in 41 million points for one scan.
Using FARO Scene the captured point clouds with the format .fls (FARO laser scan) can be loaded. The first processing step comprehends the detection and allocation of the spheres and the labeling with an obvious name. Once the spheres have a distance to the scanner of less than 18 meters and a good visibility during the scanning process, this application automatically detects the spheres with great accuracy. The displayed colour of a sphere indicates how accurate the derived geometry of the spheres fits with the scanned reality. If the sphere appears green, it displays a difference between the object sphere and the reality smaller than 1 millimeter. A yellow sphere indicates a tension between 1 and 5 millimeters, and a red sphere of more than 5 millimeters.
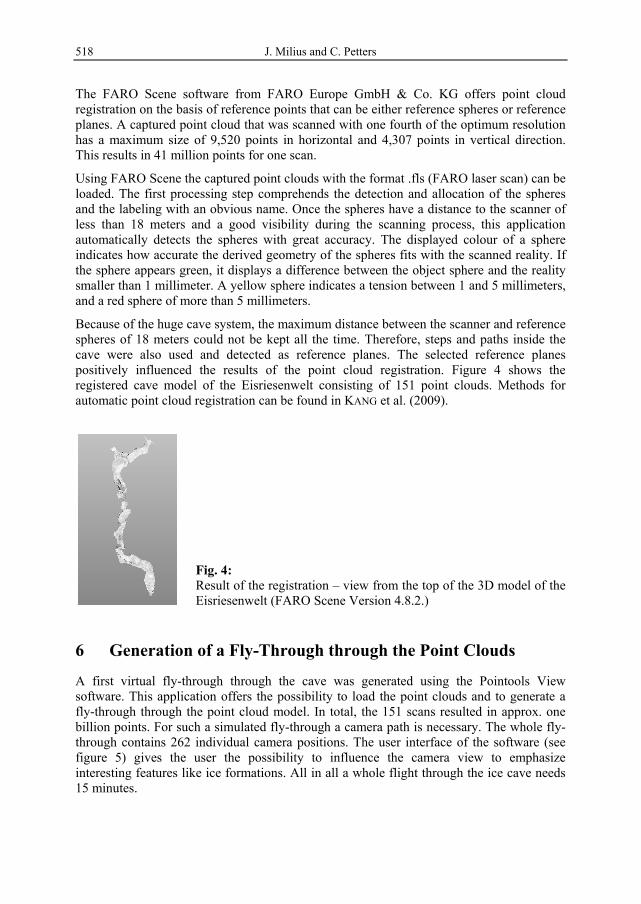
Because of the huge cave system, the maximum distance between the scanner and reference spheres of 18 meters could not be kept all the time. Therefore, steps and paths inside the cave were also used and detected as reference planes. The selected reference planes positively influenced the results of the point cloud registration. Figure 4 shows the registered cave model of the Eisriesenwelt consisting of 151 point clouds. Methods for automatic point cloud registration can be found in KANG et al. (2009).
Fig. 4: Result of the registration – view from the top of the 3D model of the Eisriesenwelt (FARO Scene Version 4.8.2.)
6 Generation of a Fly-Through through the Point Clouds
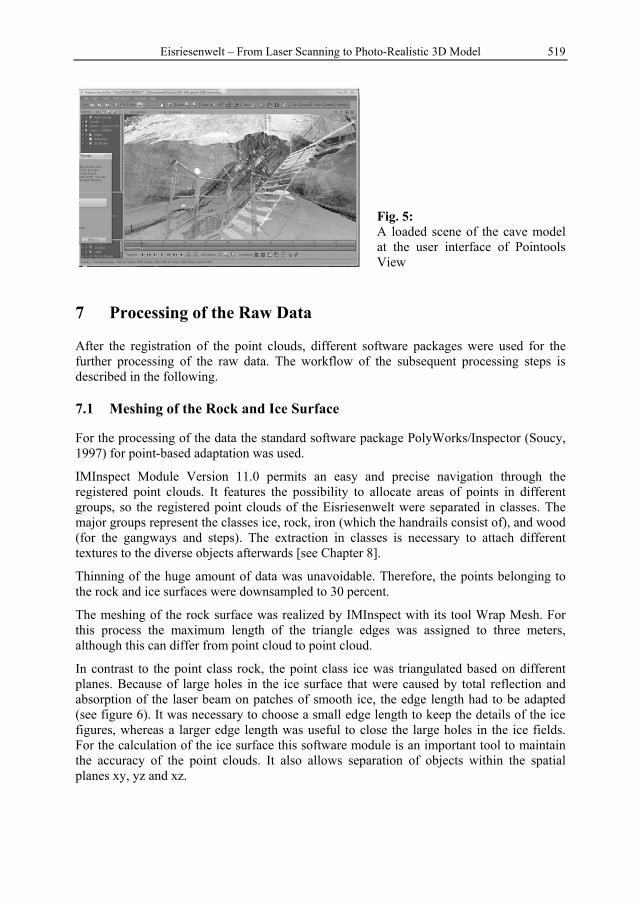
A first virtual fly-through through the cave was generated using the Pointools View software. This application offers the possibility to load the point clouds and to generate a fly-through through the point cloud model. In total, the 151 scans resulted in approx. one billion points. For such a simulated fly-through a camera path is necessary. The whole fly-through contains 262 individual camera positions. The user interface of the software (see figure 5) gives the user the possibility to influence the camera view to emphasize interesting features like ice formations. All in all a whole flight through the ice cave needs 15 minutes.
Eisriesenwelt – From Laser Scanning to Photo-Realistic 3D Model 519
Fig. 5: A loaded scene of the cave model at the user interface of Pointools View
7 Processing of the Raw Data
After the registration of the point clouds, different software packages were used for the further processing of the raw data. The workflow of the subsequent processing steps is described in the following.
7.1 Meshing of the Rock and Ice Surface
For the processing of the data the standard software package PolyWorks/Inspector (Soucy, 1997) for point-based adaptation was used.
IMInspect Module Version 11.0 permits an easy and precise navigation through the registered point clouds. It features the possibility to allocate areas of points in different groups, so the registered point clouds of the Eisriesenwelt were separated in classes. The major groups represent the classes ice, rock, iron (which the handrails consist of), and wood (for the gangways and steps). The extraction in classes is necessary to attach different textures to the diverse objects afterwards [see Chapter 8].
Thinning of the huge amount of data was unavoidable. Therefore, the points belonging to the rock and ice surfaces were downsampled to 30 percent.
The meshing of the rock surface was realized by IMInspect with its tool Wrap Mesh. For this process the maximum length of the triangle edges was assigned to three meters, although this can differ from point cloud to point cloud.
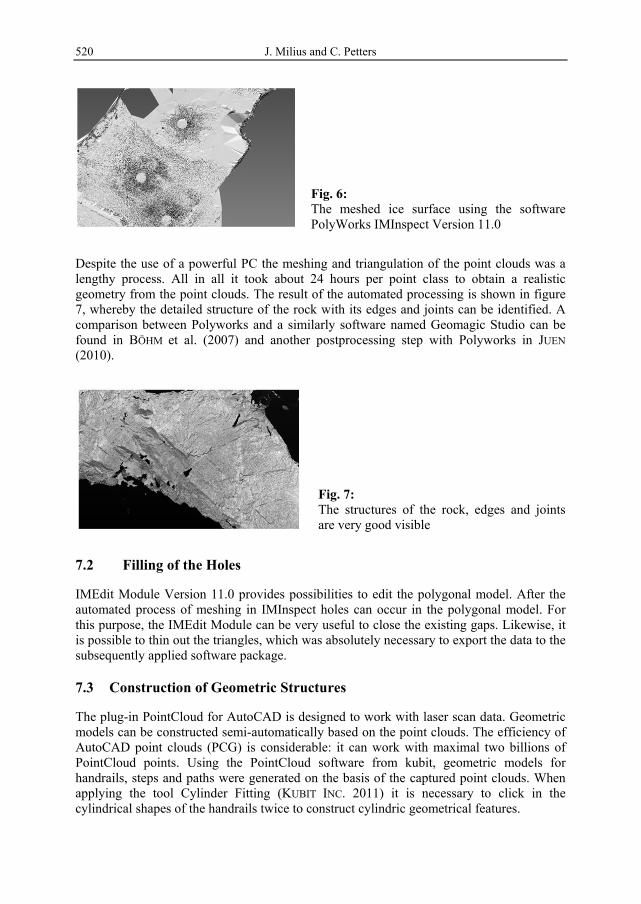
In contrast to the point class rock, the point class ice was triangulated based on different planes. Because of large holes in the ice surface that were caused by total reflection and absorption of the laser beam on patches of smooth ice, the edge length had to be adapted (see figure 6). It was necessary to choose a small edge length to keep the details of the ice figures, whereas a larger edge length was useful to close the large holes in the ice fields. For the calculation of the ice surface this software module is an important tool to maintain the accuracy of the point clouds. It also allows separation of objects within the spatial planes xy, yz and xz.
J. Milius and C. Petters 520
Fig. 6: The meshed ice surface using the software PolyWorks IMInspect Version 11.0
Despite the use of a powerful PC the meshing and triangulation of the point clouds was a lengthy process. All in all it took about 24 hours per point class to obtain a realistic geometry from the point clouds. The result of the automated processing is shown in figure 7, whereby the detailed structure of the rock with its edges and joints can be identified. A comparison between Polyworks and a similarly software named Geomagic Studio can be found in BÖHM et al. (2007) and another postprocessing step with Polyworks in JUEN
(2010).
Fig. 7: The structures of the rock, edges and joints are very good visible
7.2 Filling of the Holes
IMEdit Module Version 11.0 provides possibilities to edit the polygonal model. After the automated process of meshing in IMInspect holes can occur in the polygonal model. For this purpose, the IMEdit Module can be very useful to close the existing gaps. Likewise, it is possible to thin out the triangles, which was absolutely necessary to export the data to the subsequently applied software package.
7.3 Construction of Geometric Structures
The plug-in PointCloud for AutoCAD is designed to work with laser scan data. Geometric models can be constructed semi-automatically based on the point clouds. The efficiency of AutoCAD point clouds (PCG) is considerable: it can work with maximal two billions of PointCloud points. Using the PointCloud software from kubit, geometric models for handrails, steps and paths were generated on the basis of the captured point clouds. When applying the tool Cylinder Fitting (KUBIT INC. 2011) it is necessary to click in the cylindrical shapes of the handrails twice to construct cylindric geometrical features.
Eisriesenwelt – From Laser Scanning to Photo-Realistic 3D Model 521
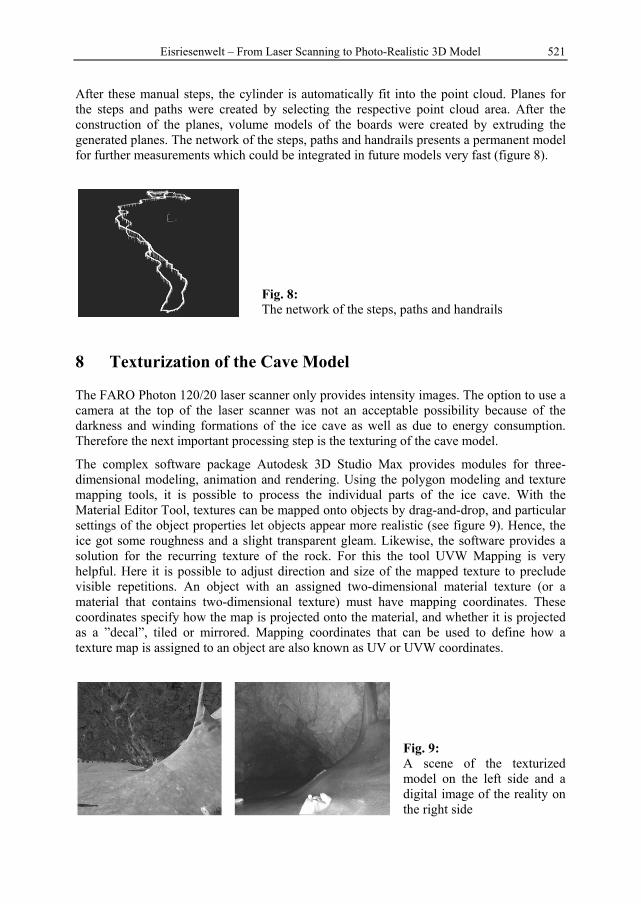
After these manual steps, the cylinder is automatically fit into the point cloud. Planes for the steps and paths were created by selecting the respective point cloud area. After the construction of the planes, volume models of the boards were created by extruding the generated planes. The network of the steps, paths and handrails presents a permanent model for further measurements which could be integrated in future models very fast (figure 8).
Fig. 8: The network of the steps, paths and handrails
8 Texturization of the Cave Model
The FARO Photon 120/20 laser scanner only provides intensity images. The option to use a camera at the top of the laser scanner was not an acceptable possibility because of the darkness and winding formations of the ice cave as well as due to energy consumption. Therefore the next important processing step is the texturing of the cave model.
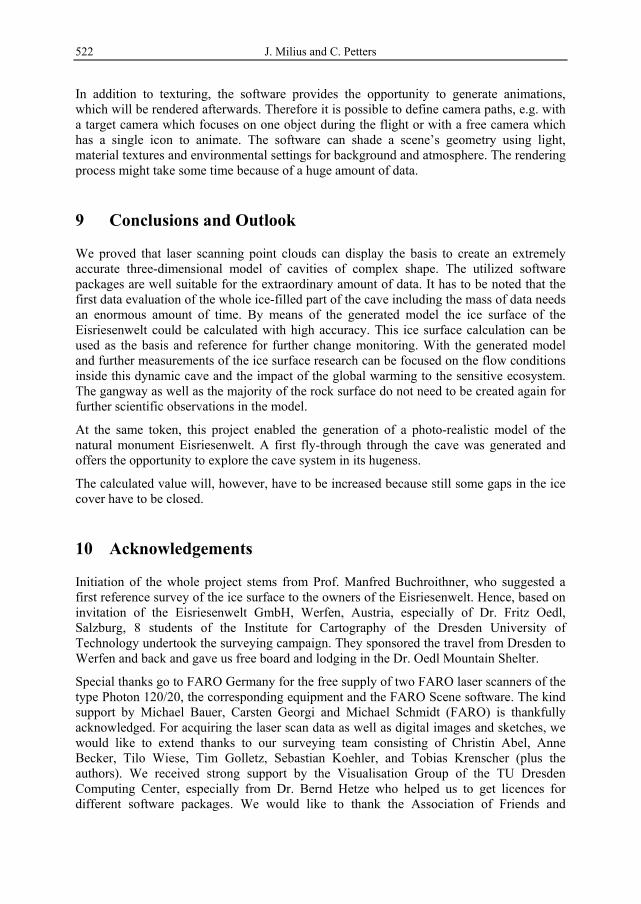
The complex software package Autodesk 3D Studio Max provides modules for three-dimensional modeling, animation and rendering. Using the polygon modeling and texture mapping tools, it is possible to process the individual parts of the ice cave. With the Material Editor Tool, textures can be mapped onto objects by drag-and-drop, and particular settings of the object properties let objects appear more realistic (see figure 9). Hence, the ice got some roughness and a slight transparent gleam. Likewise, the software provides a solution for the recurring texture of the rock. For this the tool UVW Mapping is very helpful. Here it is possible to adjust direction and size of the mapped texture to preclude visible repetitions. An object with an assigned two-dimensional material texture (or a material that contains two-dimensional texture) must have mapping coordinates. These coordinates specify how the map is projected onto the material, and whether it is projected as a ”decal”, tiled or mirrored. Mapping coordinates that can be used to define how a texture map is assigned to an object are also known as UV or UVW coordinates.
Fig. 9: A scene of the texturized model on the left side and a digital image of the reality on the right side
J. Milius and C. Petters 522
In addition to texturing, the software provides the opportunity to generate animations, which will be rendered afterwards. Therefore it is possible to define camera paths, e.g. with a target camera which focuses on one object during the flight or with a free camera which has a single icon to animate. The software can shade a scene’s geometry using light, material textures and environmental settings for background and atmosphere. The rendering process might take some time because of a huge amount of data.
9 Conclusions and Outlook
We proved that laser scanning point clouds can display the basis to create an extremely accurate three-dimensional model of cavities of complex shape. The utilized software packages are well suitable for the extraordinary amount of data. It has to be noted that the first data evaluation of the whole ice-filled part of the cave including the mass of data needs an enormous amount of time. By means of the generated model the ice surface of the Eisriesenwelt could be calculated with high accuracy. This ice surface calculation can be used as the basis and reference for further change monitoring. With the generated model and further measurements of the ice surface research can be focused on the flow conditions inside this dynamic cave and the impact of the global warming to the sensitive ecosystem. The gangway as well as the majority of the rock surface do not need to be created again for further scientific observations in the model.
At the same token, this project enabled the generation of a photo-realistic model of the natural monument Eisriesenwelt. A first fly-through through the cave was generated and offers the opportunity to explore the cave system in its hugeness.
The calculated value will, however, have to be increased because still some gaps in the ice cover have to be closed.
10 Acknowledgements
Initiation of the whole project stems from Prof. Manfred Buchroithner, who suggested a first reference survey of the ice surface to the owners of the Eisriesenwelt. Hence, based on invitation of the Eisriesenwelt GmbH, Werfen, Austria, especially of Dr. Fritz Oedl, Salzburg, 8 students of the Institute for Cartography of the Dresden University of Technology undertook the surveying campaign. They sponsored the travel from Dresden to Werfen and back and gave us free board and lodging in the Dr. Oedl Mountain Shelter.
Special thanks go to FARO Germany for the free supply of two FARO laser scanners of the type Photon 120/20, the corresponding equipment and the FARO Scene software. The kind support by Michael Bauer, Carsten Georgi and Michael Schmidt (FARO) is thankfully acknowledged. For acquiring the laser scan data as well as digital images and sketches, we would like to extend thanks to our surveying team consisting of Christin Abel, Anne Becker, Tilo Wiese, Tim Golletz, Sebastian Koehler, and Tobias Krenscher (plus the authors). We received strong support by the Visualisation Group of the TU Dresden Computing Center, especially from Dr. Bernd Hetze who helped us to get licences for different software packages. We would like to thank the Association of Friends and

Eisriesenwelt – From Laser Scanning to Photo-Realistic 3D Model 523
Sponsors of the TU Dresden e.V., which supported us financially. The University of Cooperative Education in Saxony/Germany provided us a workstation with the Pointools View software to generate a fly-through through the three-dimensional model. Last but not least we want to thank the following companies: kubit software company in Dresden for the provision of their PointCloud software; duwe 3d whose software package Polyworks IMInspect we used; Geomagic and Autodesk for the provision of student licenses for AutoCAD and Autodesk 3ds Max. Up-to-date information about the project can be found at: http:/www.visual-geodata3d.com.
References
BÖHM, J. & PATERAKI, M. (2007), From Point Samples to Surfaces – On Meshing and Alternatives. ISPRS Commission V Symposium 'Image Engineering and Vision Metrology', 50-55.
CUARTERO, A., JULIA, A., PABLO, G. R. & PEDRO, A. (2010), Error Analysis of Terrestrial Laser Scanning Data by Means of Spherical Statistics and 3D Graphs. Sensors 2010, (10), 10128-10145.
DOLD, C. & BRENNER, C. (2006), Registration of terrestrial laser scanning data using planar patches. Proc. Image Engineering and Vision Metrology, ISPRS Comm. V Symposium, IAPRS, Vol. 36 (5), September 2006, 78-83.
DOLD, C. & BRENNER, C. (2007), Verfahren zur Registrierung von 3D Punktwolken. 2. Hamburger Anwenderforum Terrestrisches Laserscanning.
JUEN, M. (2010), Laserscannermessung zur Bestimmung der Ablation im schuttbedeckten Teil des Hintereisferners. Insitut für Meterologie und Geophysik, Innsbruck, 34-50.
KANG, Z., LI, J., ZHANG, L., ZHAO, Q. & ZLATANOVA, S. (2009), Automatic Registration of Terrestrial Laser Scanning Point Clouds using Panoramic Reflectance Images. Sensors 2009 (9), 2621-2646.
KUBIT, INC. (2011), PointCloud 7.0 handbook, kubit, May 2011. LI, S., ISELE, J. & BRETTHAUER, G. (2008), Proposed Methodology for Generation of
Building Information Model with Laserscanning. Institute for Applied Computer Science, 138-144.
INNOVMETRIC SOFTWARE INC. (2011), PolyWorks Inspector – Referenzhandbuch Version 11.0 für Windows, 22. Februar 2011.
MAY, B., SPÖTL, C., WAGENBACH, D., DUBLYANSKY, Y. & LIEBL, J. (2011), First investigations of an ice core from Eisriesenwelt cave (Austria). The Cryosphere, 2011 (5), 81-93.
PFEIFER, N. & BRIESE, C. (2007), Laser Scanning – Principles and Applications. Vienna University of Technology Institute of Photogrammetry and Remote Sensing, Austria.
SOUCY, M. (1997), Inovmetric’s multiresolution modeling algorithms. In: SIGGRAPH ’97, Course Notes Multiresolution Surface Modeling, Los Angeles.
WEBSITE OF THE EISRIESENWELT WERFEN: www.eisriesenwelt.at (accessed 30 July 2011).