eirgrid evidence based environmental studies
TRANSCRIPT

EirGrid Evidence Based Environmental Studies
Study 1: EMF
Literature review of electromagnetic fields (EMF) and human health, and an evidence base of EMF measurements from the Irish Transmission System.


EirGrid Evidence Based Environmental Studies: EMF
Report prepared for EirGrid Plc. by RPS Group.
The following authors are gratefully acknowledged, Tom Dearing, Dr Andrew Buroni, and Daniel Smyth, all RPS Group, with external peer review from Dr Michael Repacholi.
July 2014
DISCLAIMER
RPS has used reasonable skill and care in completing this work and preparing this report, within the terms of its brief and contract and taking account of the resources devoted to it by agreement with the client. We disclaim any responsibility to the client andothers in respect of any matters outside the stated scope. The opinions and interpretations presented in this report represent our reasonable technical interpretation of the data made available to us. RPS accepts no responsibility for data provided by other bodies and no legal liability arising from the use by other persons of data or opinions contained in this report.
Except for the provision of professional services on a fee basis, RPS does not have a commercial arrangement with any other person or company involved in the interests that are the subject of this report.
COPYRIGHT © RPS
RPS retains copyright of the report but grants EirGrid an exclusive license for its use. RPS agrees to publication of the report in the public domain.
RPS 6-7 Lovers WalkBrightonBN1 6AHT: +44 (0) 1273 546800F: +44 (0) 1273 546801E: [email protected]: www.rpsgroup.com

i
Executive Summary
Project Background
EirGrid, the Transmission System Operator in Ireland, is in the process of implementing Grid25, its
strategy for how the Irish transmission network will be developed in the long term to meet the challenges
of increasing electricity demand and diversified generation sources. Developments under the Grid25
strategy will include upgrading existing high-voltage electricity transmission infrastructure and
construction of new infrastructure, such as overhead power lines and substations.
At an early stage of this process, EirGrid has commissioned a series of literature reviews and evidence-
based studies that examine the actual effects on people and the environment of the construction and
operation of existing high-voltage electricity transmission infrastructure, including 110 kV, 220 kV and 400
kV overhead lines, underground cables and substations.
The results of these studies will be used to inform the planning and design of transmission infrastructure
projects, ensuring that design guidelines for new transmission projects will be based upon robust data,
including the most effective measures to mitigate any negative impacts identified. The findings will also
enable the Environmental Impact Assessment (EIA) of such developments to focus the scope on the
most significant potential impacts, and base assessments upon a high standard of existing data.
This study addresses the potential human health impacts of electromagnetic fields (EMF), and is
presented in two parts: a literature review, and an evidence base of real-world EMF measurements.
Literature Review
A literature review has been conducted of the extremely low frequency (ELF) EMF health evidence base,
including the position of authoritative health protection bodies and emerging research. The review
complements measurements taken of EMF from high-voltage electricity transmission infrastructure in
Ireland, with the combined objective of informing future grid infrastructure planning and more effectively
addressing commonly raised community health concerns.
The review principally draws from extensive research collated within key documents from health
protection bodies. The literature review has benefited from the advice, peer review and gap analysis of Dr
Michael Repacholi, the inaugural chair of the International Commission on Non-Ionizing Radiation
Protection (ICNIRP) and former EMF Task Group leader for the World Health Organisation (WHO).
The review explores a range of possible health effects from ELF EMF on human health, where the core
documents developed by the International Agency for Research on Cancer (IARC) and WHO establish
that the evidence for an association between ELF EMF exposure and carcinogenic effects, particularly
leukaemia, is limited, and research does not rule in or out the possibility of a causal link. The evidence for
other potential health effects such as Alzheimer‟s, cardiovascular disease, and effects on the immune
system does not support a substantive link with ELF EMF.

ii
Extensive research has been conducted into the potential for health effects associated with ELF EMF; the 2007 WHO monograph alone draws upon around 1,000 published studies. While further research is considered desirable by WHO to investigate whether any causal mechanism underlies a possible correlation between ELF magnetic field exposure and childhood leukaemia, and whether the association is real or due to confounding factors, existing research has covered a wide breadth of topic areas, leaving limited avenues of emerging evidence.
Scientific research can provide evidence that something might be unsafe but cannot prove that no health effect occurs; the absence of an identified mechanism for causal effect does not in itself rule in or out the possibility of adverse health effects, but rather, has been a stimulus for ongoing research.
Existing public exposure guidelines from ICNIRP have been set based on established acute effects from EMF. They do not account for postulated possible long term health effects from extremely low frequency fields due to the uncertainty surrounding the evidence base, but do incorporate a significant reduction factor from the lowest threshold for established effects, to allow for uncertainty and for long-term exposure. It is considered appropriate by health protection bodies to remain within guidelines set to manage known health risks and where possible to further reduce unnecessary exposure.
Evidence Base
Measurements of EMF generated by a range of high-voltage electricity transmission infrastructure in Ireland have been undertaken during 2012-13. Infrastructure types measured comprised single and double circuit overhead lines at 110 kV, 220 kV and 400 kV, transformer substations at these voltages, and underground cables at 110 kV and 220 kV. Measurements were made at different times of day and year, at a series of distance intervals from each type of infrastructure. Measured magnetic field strength, which is directly dependent on the power load carried by the infrastructure item, has also been scaled to typical and high load conditions based on annual records of load for each infrastructure item measured.
The measurement results have been compared to health protection guidelines for public exposure to EMF developed by the ICNIRP, which are discussed along with the underpinning health evidence base in the literature review section.
The maximum magnetic field strength measured at all overhead lines, underground cables and substation perimeters surveyed was well below the ICNIRP public exposure reference level, set to protect public health. Based on the measured data, magnetic field strengths estimated for overhead power lines and underground cables using records of annual load are also well below the ICNIRP reference level to protect public health under typical (mean or median load) and high power load (95th percentile) conditions.
The maximum electric field strength measured at all overhead lines and substation perimeters surveyed was below the ICNIRP reference level to protect public health. Underground cables produce no electric field above ground. Although the maximum electric field strength measured from the highest-voltage

iii
overhead line (400 kV) is relatively close to the ICNIRP reference level, this reference level is set on a
highly conservative basis that ensures that the ICNIRP basic restriction for electric field exposure cannot
be exceeded by external field strengths below the reference level.
Magnetic field strength decreased rapidly with distance from overhead lines and underground cables, as
did electric field strength from overhead lines. Electric and magnetic field strength from substations at
their perimeter was minor in comparison to overhead lines and underground cables, and likely to be
influenced by nearby overhead lines or underground cables connecting to the substation.

Contents
Executive Summary ....................................................................................................... i
Project Background ........................................................................................................... i
Literature Review ............................................................................................................... i
Evidence Base ................................................................................................................... ii
Introduction .................................................................................................................... 1
1 Introduction to EMF ................................................................................................ 2
Electric Fields .................................................................................................................... 3
Magnetic Fields ................................................................................................................. 4
EMF and Health in Ireland ................................................................................................ 5
Literature Review ........................................................................................................... 7
2 EMF Literature Review Scope and Key Aims ....................................................... 8
3 Authoritative Health Literature ............................................................................ 10
Introduction ..................................................................................................................... 10
Methodology .................................................................................................................... 10
Mechanism of Action ...................................................................................................... 11
Cancer .............................................................................................................................. 11
Reproductive and Developmental Effects ..................................................................... 14
Cardiovascular Disease .................................................................................................. 15
Neurodegenerative Disorders ........................................................................................ 15
Immune System .............................................................................................................. 16
Genotoxic Effects ............................................................................................................ 16
Conclusion ...................................................................................................................... 17
4 Scientific Literature Post-2007 ............................................................................ 18
Introduction ..................................................................................................................... 18
Methodology .................................................................................................................... 18
Cancer .............................................................................................................................. 19

Cardiovascular Disease .................................................................................................. 22
Neurodegenerative Disorders ........................................................................................ 23
EMF Health Protection Guidelines ................................................................................. 24
Conclusion ...................................................................................................................... 27
Evidence Base ............................................................................................................. 29
5 EMF Evidence Based Study Scope and Key Aims ............................................ 30
6 Approach ............................................................................................................... 31
Site selection ................................................................................................................... 31
Survey times .................................................................................................................... 32
Measurement methods ................................................................................................... 33
Measurement variation ................................................................................................... 35
7 Magnetic Field Results ......................................................................................... 37
Results tables .................................................................................................................. 37
Results graphs ................................................................................................................ 45
Discussion ....................................................................................................................... 53
Annual load scaling ........................................................................................................ 54
Results consistency ....................................................................................................... 59
8 Electric field results .............................................................................................. 60
Results tables .................................................................................................................. 60
Results graphs ................................................................................................................ 67
Discussion ....................................................................................................................... 74
9 Conclusions .......................................................................................................... 75
Magnetic field .................................................................................................................. 75
Electric field ..................................................................................................................... 76
Public exposure .............................................................................................................. 76
Appendices .................................................................................................................. 77
References

Tables, Figures and Appendices
Tables Table 4.1: ICNIRP general public Basic Restriction and reference levels for electric and magnetic field
exposure at 50 Hz [5] [6] ............................................................................................................................ 24 Table 4.2: Magnetic Field Restriction Examples in Europe ........................................................................ 25 Table 6.1: Infrastructure elements and EMF measurement sites .............................................................. 32 Table 6.2: EMF measurement distances .................................................................................................... 34 Table 7.1: Measured magnetic field for 400 kV single circuit overhead line (double circuit tower) [see
Figure 7.1]................................................................................................................................................... 37 Table 7.2: Measured magnetic field for 400 kV single circuit overhead line (horizontal tower configuration)
[see Figure 7.2] ........................................................................................................................................... 38 Table 7.3: Measured magnetic field for 220 kV single circuit overhead line 1 [see Figure 7.3] ................. 38 Table 7.4: Measured magnetic field for 220 kV single circuit overhead line 2 [see Figure 7.4] ................. 39 Table 7.5: Measured magnetic field for 110 kV single circuit overhead line [see Figure 7.5] .................... 39 Table 7.6: Measured magnetic field for 220 kV double circuit overhead line circuit 1 [see Figure 7.6] ..... 40 Table 7.7: Measured magnetic field for 220 kV double circuit overhead line circuit 2 [see Figure 7.7] ..... 40 Table 7.8: Measured magnetic field for 110 kV double circuit overhead line circuit 1 [see Figure 7.8] ..... 41 Table 7.9: Measured magnetic field for 110 kV double circuit overhead line circuit 2 [see Figure 7.9] ..... 41 Table 7.10: Measured magnetic field for 110 kV double circuit overhead line 3* [see Figure 7.9] ............ 42 Table 7.11: Measured magnetic field for 220 kV single circuit underground cable [see Figure 7.10] ....... 42 Table 7.12: Measured magnetic field for 110 kV single circuit underground cable [see Figure 7.11] ....... 43 Table 7.13: Measured magnetic field for 400/220 kV substation [see Figure 7.12] ................................... 43 Table 7.14: Measured magnetic field for 220/110 kV substation [see Figure 7.13] ................................... 44 Table 7.15: Measured magnetic field for 110 kV substation [see Figure 7.14] .......................................... 44 Table 7.16: Annual load-scaled magnetic field for 400 kV single circuit overhead line (double circuit tower)
.................................................................................................................................................................... 55 Table 7.17: Annual load-scaled magnetic field for 400 kV single circuit overhead line (single circuit tower)
.................................................................................................................................................................... 55 Table 7.18: Annual load-scaled magnetic field for 220 kV single circuit overhead line 1 .......................... 56 Table 7.19: Annual load-scaled magnetic field for 220 kV single circuit overhead line 2 .......................... 56 Table 7.20: Annual load-scaled magnetic field for 110 kV single circuit overhead line ............................. 57 Table 7.21: Annual load-scaled magnetic field for 220 kV underground cable .......................................... 57 Table 7.22: Annual load-scaled magnetic field for 110 kV underground cable .......................................... 58 Table 8.1: Measured electric field for 400 kV single circuit overhead line (double circuit tower) [see Figure
8.1] .............................................................................................................................................................. 60 Table 8.2: Measured electric field for 400 kV single circuit overhead line (horizontal tower configuration)
[see Figure 8.2] ........................................................................................................................................... 61 Table 8.3: Measured electric field for 220 kV single circuit overhead line 1 [see Figure 8.3] .................... 61

Table 8.4: Measured electric field for 220 kV single circuit overhead line 2 [see Figure 8.4] .................... 62 Table 8.5: Measured electric field for 110 kV single circuit overhead line [see Figure 8.5] ....................... 62 Table 8.6: Measured electric field for 220 kV double circuit overhead line circuit 1 [see Figure 8.6] ........ 63 Table 8.7: Measured electric field for 220 kV double circuit overhead line circuit 2 [see Figure 8.7] ........ 63 Table 8.8: Measured electric field for 110 kV double circuit overhead line circuit 1 [see Figure 8.8] ........ 64 Table 8.9: Measured electric field for 110 kV double circuit overhead line circuit 2 [see Figure 8.9] ........ 64 Table 8.10: Measured electric field for 110 kV double circuit overhead line 3* [see Figure 8.9] ............... 65 Table 8.11: Measured electric field for 400/220 kV substation [see Figure 8.10] ...................................... 65 Table 8.12: Measured electric field for 220/110 kV substation [see Figure 8.11] ...................................... 66 Table 8.13: Measured electric field for 110 kV substation [see Figure 8.12] ............................................. 66 Table 9.1: Maximum measured magnetic field strength ............................................................................ 75 Table 9.2: Maximum magnetic field strength under annual typical and high loads.................................... 76 Table 9.3: Maximum measured electric field strength ................................................................................ 76
Figures Figure 1.1: The Electromagnetic Spectrum (adapted from [1]) .................................................................... 2 Figure 1.2: Electric field units ....................................................................................................................... 4 Figure 1.3: Magnetic field units .................................................................................................................... 4 Figure 7.1: Measured magnetic field plotted against distance for 400 kV single circuit overhead line
(double circuit tower) [see Table 7.1] ......................................................................................................... 45 Figure 7.2: Measured magnetic field plotted against distance for 400 kV single circuit overhead line
(horizontal tower configuration) [see Table 7.2] ......................................................................................... 46 Figure 7.3: Measured magnetic field plotted against distance for 220 kV single circuit overhead line 1 [see
Table 7.3] .................................................................................................................................................... 46 Figure 7.4: Measured magnetic field plotted against distance for 220 kV single circuit overhead line 2 [see
Table 7.4] .................................................................................................................................................... 47 Figure 7.5: Measured magnetic field plotted against distance for 110 kV single circuit overhead line [see
Table 7.5] .................................................................................................................................................... 47 Figure 7.6: Measured magnetic field plotted against distance for 220 kV double circuit overhead line
circuit 1 [see Table 7.6] .............................................................................................................................. 48 Figure 7.7: Measured magnetic field plotted against distance for 220 kV double circuit overhead line
circuit 2 [see Table 7.7] .............................................................................................................................. 48 Figure 7.8: Measured magnetic field plotted against distance for 110 kV double circuit overhead line
circuit 1 [see Table 7.8] .............................................................................................................................. 49 Figure 7.9: Measured magnetic field plotted against distance for 110 kV double circuit overhead line
circuit 2 [see Table 7.9 and Table 7.10] ..................................................................................................... 49 Figure 7.10: Measured magnetic field plotted against distance for 220 kV single circuit underground cable
[see Table 7.11] .......................................................................................................................................... 50 Figure 7.11: Measured magnetic field plotted against distance for 110 kV single circuit underground cable
[see Table 7.12] .......................................................................................................................................... 50

Figure 7.12: Measured magnetic field plotted against distance for 400/220 kV substation [see Table 7.13]
.................................................................................................................................................................... 51 Figure 7.13: Measured magnetic field plotted against distance for 220/110 kV substation [seeTable 7.14]
.................................................................................................................................................................... 51 Figure 7.14: Measured magnetic field plotted against distance for 110 kV substation [see Table 7.15] ... 52 Figure 8.1: Measured electric field plotted against distance for 400 kV single circuit overhead line (double
circuit tower) [see Table 8.1] ...................................................................................................................... 67 Figure 8.2: Measured electric field plotted against distance for 400 kV single circuit overhead line
(horizontal tower configuration) [see Table 8.2] ......................................................................................... 68 Figure 8.3: Measured electric field plotted against distance for 220 kV single circuit overhead line 1 [see
Table 8.3] .................................................................................................................................................... 68 Figure 8.4: Measured electric field plotted against distance for 220 kV single circuit overhead line 2 [see
Table 8.4] .................................................................................................................................................... 69 Figure 8.5: Measured electric field plotted against distance for 110 kV single circuit overhead line [see
Table 8.5] .................................................................................................................................................... 69 Figure 8.6: Measured electric field plotted against distance for 220 kV double circuit overhead line circuit
1 [see Table 8.6] ......................................................................................................................................... 70 Figure 8.7: Measured electric field plotted against distance for 220 kV double circuit overhead line circuit
2 [see Table 8.7] ......................................................................................................................................... 70 Figure 8.8: Measured electric field plotted against distance for 110 kV double circuit overhead line circuit
1 [see Table 8.8] ......................................................................................................................................... 71 Figure 8.9: Measured electric field plotted against distance for 110 kV double circuit overhead line circuit
2 [see Table 8.9 and Table 8.10] ................................................................................................................ 71 Figure 8.10: Measured electric field plotted against distance for 400/220 kV substation [see Table 8.11] 72 Figure 8.11: Measured electric field plotted against distance for 220/110 kV substation [see Table 8.12] 72 Figure 8.12: Measured electric field plotted against distance for 110 kV substation [see Table 8.13] ...... 73
Appendices Appendix A: Literature Search Appendix B: Measurement Locations Map Appendix C: Narda EHP-50D Calibration Documents

1
rpsgroup.com
Introduction

2
rpsgroup.com
1 Introduction to EMF
1.1 Electromagnetic fields and the electromagnetic forces they represent are a fundamental part of
the physical world. Electromagnetic forces are partly responsible for the cohesion of material
substances and they mediate all the processes of chemistry, including those of life itself. EMF
occur naturally within the human body (through nerve and muscle activity) and also arise from the
magnetic field created by the Earth and electric fields in the atmosphere.
1.2 The sources of EMF with which this study is concerned are power frequency EMF in the
frequency range below 100 kilohertz (kHz), i.e. the electric and magnetic fields produced
wherever electricity is generated, distributed, or used.
1.3 As a rule, at higher frequencies the electric and magnetic fields are coupled together but as the
frequency decreases, so the coupling decreases. At the frequency of 50 Hz used for electricity
transmission in Ireland the electric and magnetic fields act independently. 50 Hz power-frequency
EMF is sometimes referred to as extremely low frequency (ELF) EMF.
1.4 There are a number of man-made sources that generate electromagnetic fields: these include
electric appliances, TV, radio, mobile phones and power lines. EMF can be divided into different
bands, each having a range of frequencies that can interact in different ways with living
organisms. These bands include ultraviolet radiation, visible light, infra-red radiation, microwaves,
radiofrequency fields and extremely low frequency fields [1], all of which are classified as non-
ionising radiation. At extremely low frequencies, which include the power frequencies of 50 Hz
and 60 Hz, the electric and magnetic fields that produce electromagnetic fields are not coupled,
act independently of each other and have almost no radiated energy. Unlike higher-frequency
ionising radiation such as X-rays, ELF EMF does not have enough energy to break the bonds
that hold molecules together and is therefore non-ionising. Figure 1.1 outlines the
electromagnetic spectrum.
Figure 1.1: The Electromagnetic Spectrum (adapted from [1])
1.5 Ionising radiation occurs both naturally and from man-made sources. Natural sources include
radioactive minerals remaining from the formation of the earth and also cosmic radiation entering
the atmosphere from outer space. Man-made sources include the use of radioactive material in
medical settings for diagnosing and treating disease and industrial settings through radioactive
waste and the use of nuclear weapons [2]. Only the high frequency portion of the electromagnetic
spectrum (which includes X rays and gamma rays) has enough energy to produce ionisation.
Ionising Radiation
Extremely Low Frequency Radiofrequencies Optical Radiation
0 Hz 300 Hz 300 GHz 3 PHz Frequency
Wavelength 1000 km 1 mm 100 nm

3
rpsgroup.com
When ionising radiation interacts with an atom it can remove tightly bound electrons from the orbit
of an atom causing the atom to become charged and subsequently making it more reactive [3]. In
living tissue this can cause molecules within cells to be broken apart causing either cell death or
abnormal reproduction of the cell.
1.6 The EMF from power lines, electrical equipment and sunlight does not have enough energy to
cause ionisation. Ultraviolet (UV) radiation provides a good example of the physical interaction
between humans and non-ionising EMF, with UV radiation sitting just below X-rays (which are
ionising) in the frequency range. One source of UV radiation is sunlight, where exposure
stimulates vitamin D synthesis but prolonged exposure can also lead to skin damage and skin
cancer. The interaction and possible health outcomes for other bands of non-ionising EMF,
including ELF EMF, are not as clearly defined. However, it has been postulated that an
association could exist between ELF magnetic fields and a range of health effects including
cancer, cardiovascular disease and neurodegenerative disorders, thereby creating an impetus for
further health research to determine the possible link between ELF field exposure and health.
1.7 In a developed country such as Ireland, essentially the entirety of the population is exposed on a
daily basis to power-frequency EMF; any possibility of health risks therefore receives significant
attention because even a small health risk could potentially have large public-health
consequences, given the size of the exposed population.
1.8 High-voltage power transmission utilising overhead and underground cables is not the only
significant source of general public exposure to EMF. Low-voltage distribution circuits, household
wiring and electrical appliances are typically a major source of exposure, providing most cases of
higher exposure in a residential setting [4]. However, high-voltage transmission infrastructure can
continuously generate relatively strong fields in close proximity and so is of potential importance
for long-term exposure, albeit at lower field strengths in a residential setting given that both
electric and magnetic field strength decrease with distance from the source and that electric fields
are readily screened by most building materials.
Electric Fields
1.9 Electric fields are created in spaces between points at different voltages. Voltage (potential
difference) can be described as the pressure behind the flow of electricity, analogous to the
pressure of water in a hose.
1.10 Electricity in homes is at a voltage of 230 V but outside homes it is distributed at higher voltages,
from 10 kV up to 400 kV. The naturally occurring atmospheric electric field at ground level is
typically about 130 volts per metre (V/m) in fine weather and may rise to many thousands of volts
per metre during thunderstorms.
1.11 Generally, the higher the voltage, the greater the electric field strength. However, electric fields
are readily screened by most building materials and also by vegetation.

4
rpsgroup.com
1.12 Electric field strength is directly dependent on the power line voltage, with the strongest field
generated by the highest voltage power lines (400 kV). As with the magnetic field, the electric
field strength measured at 1 m above ground level is also affected by conductor height for
overhead lines. This is influenced by load and ambient temperature conditions, due to line sag
caused by thermal expansion of the conductor material. However, the electric field strength is not
as strongly dependent on load as the magnetic field strength. Figure 1.2 shows electric field
strength units and examples.
Figure 1.2: Electric field units
Magnetic Fields
1.13 Magnetic fields are produced by current, which is the flow of electricity. Current can be likened to
the volume of water flowing in a hose when the nozzle is open. Anything that uses or carries
mains electricity is potentially a source of power-frequency magnetic fields. The time-varying
magnetic field from alternating current (AC) electricity transmission is separate to the Earth‟s
natural (static) magnetic field, which varies between about 30 µT (microteslas) at the equator and
60 µT at the poles, being approximately 50 µT in Ireland. Figure 1.3 shows magnetic field
strength units and examples1.
Figure 1.3: Magnetic field units
1 Note that throughout the document, magnetic flux density B (in tesla) is referred to as „magnetic field strength‟, to reflect the
widespread colloquial usage (rather than magnetic field strength H in A.m-1). Reference levels and basic restriction equivalent
external field strengths in guideline exposure limits are for the B field, expressed in tesla.

5
rpsgroup.com
1.14 The strength of magnetic field generated by electrical equipment depends on the current carried
by it: the greater the current, the greater the magnetic field. However, the field strength
experienced at a given point depends on distance from the source and how the fields from
different sources interact. As such, magnetic fields exist around a wide range of sources and their
strength varies significantly within households, workplaces and the built and natural environment.
A feature common to all such magnetic fields is that their strength decreases rapidly as the
distance from the source increases.
Field Strength Calculation
1.15 Magnetic field strength B can be calculated using Ampère‟s law:
where µo is the permeability of free space (magnetic constant), I is the current and r is the
distance from the source (i.e. the conductor). The magnetic field strength from each source is a
vector quantity (it has magnitude and direction), and when fields of different orientations are
summed (e.g. for the three current-carrying phases and the earth of a single circuit power line),
the result would not typically be as great as the scalar sum of their maximum strength.
1.16 This means that the load balance between circuit phases can influence the overall field strength,
and can also be taken advantage of in double circuit power line designs (two circuits carried on a
single set of structures) where the orientation of the phases can be transposed, such that they
tend to have the greatest cancelling effect, reducing the resultant magnetic field strength. Broadly
speaking, the magnetic field strength from a single current-carrying wire is inversely proportional
to distance, while that from a single circuit power line is proportional to the inverse square of
distance, and that from a transposed double circuit design may fall with the cube of distance, due
to cancellation effects between the power phases. This means that the field strength decreases
rapidly as one moves away from the power line conductors.
1.17 The electric field strength E can be calculated using Gauss‟ law for a single conductor:
(although it is more complex to calculate for multiple charge-carrying wires), where λ is the
charge per unit length, εo is the permittivity of free space and r is the distance from the conductor
(as a cylinder). As with the magnetic field, electric field strength drops rapidly with distance from
the source.
EMF and Health in Ireland
1.18 The International Commission on Non-Ionizing Radiation (ICNIRP) has developed health
protection guidelines for public exposure to EMF. The 1998 ICNIRP guidelines [5] are widely
adopted within the EU under the terms of a 1999 EC Recommendation (1999/519/EC). The

6
rpsgroup.com
guidelines were updated in 2010 for time-varying fields [6]. The public health protection
guidelines are expressed in terms of the internal electric field or induced current density in
affected tissues of the body (“basic restrictions”), and in terms of measurable “reference levels” of
external magnetic or electric field strength. The reference levels are such that compliance with
them will ensure that the basic restrictions are not reached or exceeded.
1.19 The most recent published reference levels (2010) are 200 µT and 5 kV m-1 for magnetic and
electric field strength respectively, although at the present time, the standing EC recommendation
for their adoption (1999/519/EC) is based upon a more stringent former reference level (1998) of
100 µT for the magnetic field and the same reference level of 5 kV m-1 for the electric field.
1.20 Responsibility for managing potential health impacts of EMF presently lies with the Department of
the Environment, Community and Local Government in Ireland, although it is planned that this
remit will be transferred to the Radiological Protection Institute of Ireland (RPII), which is itself
being merged with the Environmental Protection Agency during 2013-14. In statements regarding
EMF and health, the department refers to compliance with ICNIRP guideline exposure limits,
although there is no specific transposition of the EC Recommendation (1999/519/EC) for
adoption of 1998 ICNIRP guidelines into Irish Government policy.
1.21 In 2007 the Department of Communications, Marine and Natural Resources (DCMNR, which
formerly held responsibility for EMF and health, and is now called the Department of
Communications, Energy and Natural Resources, DCENR) published a review [1] of possible
health effects from EMF, including consideration of the current evidence base and whether
precautionary measures would be appropriate for ELF EMF exposure. It suggests that a „prudent‟
precautionary approach would be valuable in addressing public perceptions of risk, although the
evidence of actual health risks from power line EMF is weak.
1.22 EirGrid cites the ICNIRP guidelines in its approach to safeguarding public health, and commits to
designing and operating the transmission network in Ireland in accordance with up-to-date
recommendations of expert and independent national bodies [7] [8]. EirGrid‟s strategy for route
planning typically aims to avoid populated areas (on the grounds of visual / residential amenity
impact), maintaining a minimum distance of 50 m from individual dwellings where feasible, and
this inherently offers mitigation of residential exposure to EMF.

7
rpsgroup.com
Literature Review

8
rpsgroup.com
2 EMF Literature Review Scope and Key Aims
2.1 In a developed country such as Ireland, the entire population will be likely to experience ELF EMF
of varying strengths on a regular and long-term basis. A large body of public health research has
been conducted, especially during the last three decades, to investigate the possibility of health
risks from ELF EMF.
2.2 A review of the research literature has been undertaken, with the aim of summarising the present
state of scientific knowledge regarding EMF and health, placing in the context of this the resultant
position of authoritative health-protection bodies. This will enable EMF from high-voltage
electricity grid infrastructure comprising the transmission system in Ireland to be viewed in the
light of internationally-adopted exposure guidelines and evidence that may exist for health risk at
particular field strengths.
2.3 Using computer models, it is possible to calculate the EMF that would be generated by overhead
power lines, underground cables or substations with a high degree of accuracy for a specific set
of conditions [9]. This requires that the current, voltage, and physical arrangement of the power
line (e.g. ground clearance, burial depth, spacing between phases) relative to the receptor are
known.
2.4 However, a key theme that has emerged in the public sphere of dialogue regarding EMF and
existing or proposed high-voltage electricity transmission infrastructure is that it is essential to
address public perceptions of health risk, in addition to managing actual risk. Perceived risk and
anxiety regarding health (or other effects) can itself induce stress that can lead to adverse health
outcomes [10].
2.5 This literature review aims to present the current scientific health evidence base, including the
position of authoritative health protection bodies and any newly emerging evidence, to aid public
understanding of the potential for health impacts from EMF. Allied to this, an extensive catalogue
of EMF measurements from operational grid infrastructure have been made, to provide evidence
of EMF strength under real-world conditions. The results are given in the Evidence Base section
of this study.
2.6 This review covers extremely low frequency EMF (in the range of >0 Hz to 100 kHz) associated
with power lines. Electric and magnetic fields exist wherever electricity is generated, transmitted
or distributed in power lines or cables. As noted, a wide body of literature exists regarding the
possible effects of ELF or „power-line frequency‟ EMF on human health. The majority of this
research investigates possible health effects associated with magnetic fields.
2.7 The report structure first gives an overview of the extensive literature reviews conducted by
national and international health protection bodies, providing an understanding of the subject
area and key health outcomes without unnecessary repetition of work already conducted. The
studies included within this authoritative evidence base are outlined in the following section of this
document. However, the milestone publication is taken to be the 2007 World Health Organisation

9
rpsgroup.com
(WHO) monograph on extremely low frequency fields, which provides the definitive review of the
scientific evidence base to that date.
2.8 A search of scientific literature presented by the wider scientific community post-2007 was
conducted in 2012, in order to determine how the current evidence base aligns with the position
held by authoritative groups and whether newly emerging evidence has changed the existing
consensus regarding risk from power-frequency EMF.
2.9 A further literature search focusing on epidemiological studies of childhood leukaemia published
in 2013-14 is also presented, as this had been the principal topic of interest for possible health
impacts identified in the review.
2.10 Finally, the concluding section considers any remaining uncertainties in the evidence regarding
ELF EMF and human health.

10
rpsgroup.com
3 Authoritative Health Literature
Introduction
3.1 There are a number of review documents available regarding the potential health effects of ELF
EMF, prepared by national and international health protection bodies. Particular regard has been
given to the 2007 WHO monograph and 2002 IARC monograph which cover a wide range of
topic areas and present the main body of evidence.
3.2 Extensive research including in-vitro, in-vivo and epidemiological studies has been conducted
regarding ELF EMF and health. A wide-ranging body of evidence has been established,
especially during the most intense period of research in the last three decades. Overall, the
documents referenced in this study draw from and build upon this extensive evidence base: the
WHO monograph alone references approximately 1,000 papers, demonstrating the breadth of
published evidence considered within these authoritative reviews.
Methodology
3.3 The following review in this chapter documents present the key body of evidence from advisory
health bodies and the remainder of this section provides an overview of the information contained
within these documents:
World Health Organisation (WHO, 2007) in Environmental Health Criteria Monograph 238:
Extremely Low Frequency Fields;
International Agency for Research on Cancer (IARC, 2002) monograph on static and ELF
EMF fields;
The UK Health Protection Agency Advisory Group on Non-ionising Radiation (HPA AGNIR,
2006);
International Commission on Non-Ionising Radiation Protection (ICNIRP, 1998, 2010), ELF
Guidelines;
UK Childhood Cancer Study (UKCCS Investigators, 2000, 2010);
Department of Communications, Marine and Natural Resources (DCMNR, 2007) report on
health effects of EMF;
Chief Scientific Advisor‟s review of recent investigations into health effects of EMF
exposure from power lines (O‟Sullivan, 2011); and
Scientific Committee on Emerging and Newly Identified Health Risks, Health Effects of
Exposure to EMF report (SCENHIR, 2009).
3.4 Chapter 4 focuses on peer-reviewed literature published after the comprehensive 2007 WHO
review, to provide an up-to-date summary of the evidence base focusing on emerging studies in
the key areas of interest.

11
rpsgroup.com
Mechanism of Action
3.5 The generic term „electromagnetic field‟ can be defined as a field of force generated by electrical
charges or magnetic fields. Power lines are a source of ELF EMF, but do not have enough
energy to cause ionisation in tissues that could result in direct cell damage. However, at very high
field strength (above international guidelines) ELF fields can induce electric fields and currents in
tissues that can result in involuntary nerve and muscle stimulation [1].
3.6 In 2007 WHO published a review of the scientific literature on the biological effects of exposure to
ELF EMF [11]. This is part of its series of Environmental Health Criteria monographs that assess
information on the relationship between exposure to environmental pollutants and human health.
3.7 The review considers frequencies in the range from >0 Hz to 100 kHz, with the majority of studies
considered focusing on power-frequency (50 or 60 Hz) magnetic fields. A number of biophysical
mechanisms have been postulated, with three possible key mechanisms identified at low field
strengths suggested, principally:
induced electric fields in neural networks whereby electric fields interfere with synaptic
transmissions;
an increased concentration of free radicals at low magnetic field strengths that are thought
to contribute to a number of disease states including neurodegenerative disorders; and
an increased detection of change in magnetic fields through magnetite crystals in
organisms.
3.8 The WHO report concludes that the three direct mechanisms outlined above do not seem to be
plausible causes of the potential for increased disease incidence at the exposure levels generally
encountered by people. The lower bound level for effects on neural network transmission is
thought to be 10-100 mV m-1 as electric fields below this cannot be discriminated by multicellular
organisms. It is suggested that power frequency field strengths lower than the geomagnetic field
strength of approximately 50 µT are unlikely to be of biological significance for the free radical
pairs mechanism. Furthermore the presence of trace quantities of magnetite crystals in humans
does not confer an ability to detect the geomagnetic field and therefore this is unlikely to have an
effect on human health. However, the absence of an identified mechanism cannot in itself rule in
or out the possibility of adverse health effects; rather, it has been a stimulus for ongoing research.
3.9 In addition to biophysical mechanisms, WHO reviewed the possible link between exposure to low
frequency EMF and an increased risk of cancer, cardiovascular disease, and neurodegenerative
disorders and also possible changes in neurobehaviour, the neuroendocrine system, the immune
system, reproduction and development. Each potential health pathway is summarised below.
Cancer
3.10 The possibility that exposure to ELF EMF leads to an increased risk of cancer has been widely
researched. In 2002 IARC classified ELF magnetic fields as „possibly carcinogenic to humans‟.

12
rpsgroup.com
However, this should to be set in context: „possibly carcinogenic‟ is the least probable of the three
categories used by IARC to indicate that an agent could be carcinogenic. To clarify, an example
of another well-known agent in the same category is coffee, which may increase the risk of
urinary bladder cancer, while at the same time be protective against bowel cancer.
3.11 The IARC monograph examines a range of studies on the carcinogenicity of ELF EMF including
cancer in adults, children and studies using experimental animals. It highlights two pooled
analyses, based on nine and fifteen studies respectively, that found a two-fold excess risk of
leukaemia at ELF magnetic field strengths above 0.4 µT and a 1.7-fold risk for exposure above
0.3 µT. However, similar conclusions could not be drawn for electric fields. This association may
in part be explained by selection bias where studies either receive a low response rate or use
historical data and subsequently assess a very low number of exposed subjects. The mechanism
of action is thought to be via ELF fields enhancing damage from other sources and interfering
with factors that play a role in late stage tumour development as opposed to causing direct
genetic damage [12]. In the same report IARC concludes that the carcinogenicity to humans of
static electric and magnetic fields and ELF electric fields is not classifiable.
3.12 The UK Childhood Cancer Study (UKCCS), a very extensive study of possible causes of
childhood cancers, found no association between measured power-frequency magnetic field
exposure and risk for any malignancy. The study also considered residential proximity to
electricity supply equipment, distances to high voltage lines, underground cables, substations and
distribution circuits, concluding that there was no evidence that proximity to electrical installations
in the UK is associated with increased risk of childhood leukaemia or any other cancer [13]. By
contrast, a further UK-based study conducted by the Childhood Cancer Research Group
(CCRG), often referred to as the „Draper study‟ (after former CCRG Director Gerald Draper),
initially found (in 2005) a statistically significant increase in relative childhood leukaemia risk for
children living within 200 m of a high-voltage (275 kV or 400 kV) power line, or a significant but
lower risk for those born within 200-600 m, compared with those living or born at >600 m distance
[14]. A further review of this data in 2010, which included calculation of magnetic field strength
(rather than relying on distance), found that the findings were consistent with a possible increase
in risk for exposure of >0.4 µT reported in other pooled analyses, although the number of cases
with that exposure level was too low for this finding to be statistically significant [15]. The
calculation of field strength showed that this level of exposure would extend to approximately 50
m from the power lines, undermining the apparent evidence of increased risk at a distance of up
to 600 m.
3.13 Whether ELF EMF presents a risk of cancer has been further considered in the 2007 DCENR
report stating that some epidemiological evidence indicates that where the average exposure
exceeds 0.3 µT to 0.4 µT the incidence of childhood leukaemia could double [1]. However, the
exposure of children in Europe to ELF magnetic fields is generally much lower than this,
averaging 0.025 µT to 0.07 µT. If the increased risk from exposure of 0.4 µT were real, it could
theoretically be responsible for approximately one case of childhood leukaemia in Ireland every

13
rpsgroup.com
two to five years [1] [16]. This would be equivalent to approximately 0.4% to 1.4% of childhood
leukaemia cases, based upon the typical incidence rate of 35-55 cases of childhood leukaemia
per year in Ireland [1].
3.14 Hypothetical effects with such a low frequency of occurrence would be very difficult to detect with
any reasonable level of certainty [16]. Furthermore, ICNIRP notes that the existing scientific
evidence base is too weak to establish that there is a causal relationship between prolonged
exposure to low frequency magnetic fields and an increased risk of childhood leukaemia or for
this evidence to form the basis of exposure guidelines [17].
3.15 The European Commission SCENIHR produced an update in 2009 to its 2007 opinion on the
health risks from EMF. In keeping with the IARC monograph, the SCENIHR evaluation of
scientific evidence concluded that ELF magnetic fields are a possible carcinogen and could
contribute to an increased risk of childhood leukaemia [18]. However, it is noted the studies on
which this conclusion has been based have weaknesses within their methodology such as low
participation numbers and the use of proximity to power lines to determine exposure as opposed
to magnetic field strength measurements. SCENIHR recognises the need for further research and
independent replication of studies in order to ensure robust results [18].
3.16 In contrast to the results for leukaemia, the IARC monograph found no consistent relationship in
studies for childhood brain tumours or cancers at sites linked with residential ELF EMF [12]. This
is consistent with the UKCCS pooled analysis of ten studies on ELF magnetic fields and
childhood brain tumours, which concludes that the results provide little evidence for an
association [13].
3.17 With regard to the residential exposure of adults, the IARC monograph concludes,
“Although there have been a considerable number of reports, a consistent association between
residential exposure and adult leukaemia and brain cancer has not been established. For breast
cancer and other cancers, the existing data are not adequate to test for an association with
exposure to electric or magnetic fields” [12] (page 333).
3.18 The 2007 WHO monograph established that the findings of studies published subsequent to the
IARC monograph considerably weakened the evidence for an association between ELF exposure
and breast cancer. The monograph also concludes that the evidence for other childhood cancers,
adult brain cancer and adult leukaemia remains inadequate [11].
3.19 Melatonin is a hormone secreted by the human body that influences a range of physiological
functions including sleep patterns, and may offer some protection against breast cancer
development. Hypotheses exist which suggest that EMF exposure could affect melatonin
production in the body, thereby influencing the risk of cancer. The IARC monograph highlights six
laboratory studies that have investigated the influence of magnetic field exposure on endocrine
functions in humans exposed to 50 Hz or 60 Hz magnetic fields. Overall, five of the six studies
reported no effects. One study found a possible delay and reduction in night-time melatonin

14
rpsgroup.com
concentrations; however, a number of concerns have been raised regarding the experimental
design and statistical analysis of this study [12].
3.20 In 2006 the UK HPA produced a report investigating whether EMF can affect the production or
action of melatonin and subsequently whether this alters the risk of breast cancer. The HPA
concluded that,
“Investigations using cells, animals and humans have not given consistent or convincing
evidence that EMF exposure affects melatonin production or action. However, there are
deficiencies in the existing research, which leave open the possibility of an effect” [19] (page
161).
The 2007 WHO monograph concluded that the evidence is sufficient to give confidence that ELF
magnetic fields do not cause breast cancer.
3.21 As reported in the IARC monograph, experiments exposing animals (rats and mice) to ELF
magnetic fields have been conducted but have proved to be inconclusive. Of the four long term
bioassays discussed in the IARC report, one found an increase in incidence of thyroid C-cell
tumours in male rats exposed to ELF magnetic fields at a range of flux densities tested, but failed
to demonstrate a dose-response relationship. Eleven multistage carcinogenesis studies
combining exposure to 7,12-dimethyl-benz(a)anthracene, a chemical which promotes tumour
formation, with 50 Hz or 60 Hz magnetic fields, were performed in three laboratories. One
laboratory reported significant increases in mammary tumour incidence at higher exposure levels.
The second laboratory conducted three studies to replicate these findings at the highest field
strengths but saw no enhancement of mammary tumorigenesis, while the third laboratory found
no change in tumour incidence.
3.22 Similarly the WHO monograph concluded that results from animal studies have not shown any
consistent increase in any type of cancer, including haematopoietic (tissues in which new blood
cells form), breast, brain and skin tumours. A number of studies examining ELF field effects on
chemically-induced mammary tumours in rats produced inconsistent results; in relation to animal
studies the WHO report concludes,
“overall there is no evidence that ELF exposure alone causes tumours. The evidence that ELF
field exposure can enhance tumour development in combination with carcinogens is inadequate”
[11] (page 322).
Reproductive and Developmental Effects
3.23 The IARC monograph also reviews studies that examine exposure during pregnancy to power
frequency electric and magnetic fields of 50 Hz or 60 Hz. However, the focus of these studies is
on the use of electric blankets and electrically heated beds which have been shown to increase
exposure to electric fields by 36% [12]. IARC concluded that there is little evidence to support an
association of exposure to ELF electric and magnetic fields with adverse reproductive outcomes.
The WHO monograph also investigated EMF exposure from electric blankets and heated beds,

15
rpsgroup.com
but in contrast to IARC, WHO suggests that some evidence exists that points to an increased risk
of miscarriage associated with ELF magnetic field exposure [11].
Cardiovascular Disease
3.24 The potential for an association between cardiac effects and ELF EMF exposure has been
related to heart rate variability and acute cardiovascular events. Studies relating exposure to 60
Hz magnetic fields with an increased incidence of cardiovascular disease and death have been
considered by both ICNIRP and IARC, who conclude that the evidence is weak. Moreover IARC
stated that,
“the possible association between exposure and altered autonomic control of the heart is
speculative” [12] (page 270).
3.25 The WHO monograph summarises evidence including epidemiological studies of cardiovascular
disease incidence (especially for electricity utility company employees, who have had
occupational exposure to ELF EMF) and laboratory tests of heart rate variability using smaller
groups of volunteers.
3.26 Although some of the heart rate variability studies reported a change in heart beat intervals
during or after ELF EMF exposure, a roughly equal number of studies did not find an effect. A
pooled (multi-study) analysis suggested that heart rate variation was only found where other
study factors such as sleep disturbance, stress and blood sampling were present in addition to
ELF EMF exposure. More recent studies using a strong magnetic field (many times greater than
the maximum from an overhead power line) did not find any effect on heart rate variability.
WHO‟s 2007 monograph concludes that,
“Overall, the evidence does not support an association between ELF [EMF] exposure and
cardiovascular disease.” [11] (page 8).
Neurodegenerative Disorders
3.27 A number of studies have researched amyotrophic lateral sclerosis and Alzheimer‟s disease in
people occupationally exposed to ELF EMF. IARC reported that when considered together the
studies indicate that there appears to be an association between the occurrence of disease and
estimated exposure to ELF EMF. However, as the study designs have been shown to be weak,
support for the hypothesis has subsequently reduced [12]. This position is shared by ICNIRP and
WHO, demonstrating that studies investigating the association between low frequency exposure
and Alzheimer‟s disease are inadequate and inconclusive [6] [11].
3.28 The 2009 review from SCENHIR indicates a possible increase in Alzheimer‟s disease arising
from exposure to ELF fields. However, SCENHIR concluded that further epidemiological and
laboratory investigations of this observation are required [18]. This conclusion is based on
laboratory studies which have provided suggestive evidence that long-term exposure of

16
rpsgroup.com
laboratory rodents to 50 Hz magnetic fields of 1.10 – 2.00 mT may impair or improve memory and
increase anxiety-related behaviour in behavioural tests [18].
Immune System
3.29 A number of studies have investigated the effect of exposure to magnetic fields on markers of
immune function. IARC reports [12] two studies that measured changes in the number of white
blood cells that form part of the immune system, including monocytes and natural killer T-cells (a
type of lymphocyte).
3.30 The first compared a control group with two groups of workers (hospital staff operating magnetic
resonance imaging units and industrial workers operating induction heaters) routinely exposed to
magnetic fields. The study found that the numbers of natural killer cells and monocytes were
significantly increased in the exposed group.
3.31 In the second study a group of 16 men aged 20-30 years were exposed to 50 Hz, 10 µT magnetic
fields either continuously or at varying intervals between the hours of 23.00 and 08.00. No
significant differences were observed between the exposed group and control group for a wide
range of immune function markers including monocytes and lymphocytes.
Genotoxic Effects
3.32 Genotoxic effects relate to structural changes at the gene level and include mutagenicity
(mutation of specific genes), chromosomal mutation (change in the number or structure of
chromosomes), micronuclei formation (small additional pieces of the nucleus, indicative of DNA
damage) and adduct formation (chemicals bound to DNA causing possible mutation). A number
of studies reported by IARC investigate the clastogenic effects (ability to break chromosomes) of
exposure to power frequency electric and magnetic fields.
3.33 As an example, IARC reported a study in which chromosome analyses were performed on
lymphocytes from 32 workers occupationally exposed for more than 20 years to 50 Hz electric
and magnetic fields in 380 kV switchboards. Comparison with a control group of 22 workers who
had not been exposed to EMF showed that neither the numbers of structural chromosomal
changes nor the frequencies of sister chromatid exchanges were increased.
3.34 Such studies are subject to confounding by genotoxic agents such as tobacco and solvents,
limiting the conclusions that can be drawn by comparing exposed and control groups. In-vitro
studies conducted on mammalian cells have proved inconclusive, with little evidence that
mutations could be directly caused by ELF magnetic fields [12]. The WHO monograph found that
in general, studies of ELF field exposure of cells show no induction of genotoxicity at fields below
50 mT [11].
3.35 IARC concluded that results from studies into the effects on in-vitro cell proliferation, malignant
transformation and cellular end points such as signal transduction are inconsistent. However,

17
rpsgroup.com
some studies suggest that ELF magnetic fields affect cell proliferation and modify cellular
responses to other factors such as melatonin [12].
3.36 In summary, ELF EMF are part of the non-ionising spectrum and as such do not have enough
energy to cause direct cell damage to macromolecules leading to genotoxic effects through
ionisation. The above studies support that view, providing little evidence of mutation directly
caused by ELF magnetic fields, although additional research has been recommended.
Conclusion
3.37 The authoritative evidence base explores a range of possible effects from ELF EMF on human
health. Reviews published subsequent to the 2002 IARC review and categorisation of EMF as
„possibly carcinogenic‟ have reached similar conclusions: the evidence for an association
between ELF EMF exposure and carcinogenic affects, particularly leukaemia, is limited, and
research does not rule in or out the possibility of a causal link. The evidence for other potential
health effects such as Alzheimer‟s, cardiovascular disease, and effects on the immune system
does not support a substantive link with ELF EMF.
3.38 Extensive research has been conducted into the potential for health effects associated with ELF
EMF; the 2007 WHO monograph alone draws upon around 1,000 published studies. While
further research is desirable to investigate whether any causal mechanism underlies a possible
correlation between ELF EMF exposure and childhood leukaemia, and whether the association is
real or due to confounding factors, existing research has covered a wide breadth of topic areas,
leaving limited avenues of emerging evidence. Scientific research can provide evidence that
something might be unsafe but cannot prove that no health effect occurs [1], and as such while
further study of cancer and other possible adverse health outcomes discussed above may be
warranted, it must be accepted that a degree of uncertainty in the evidence base is likely to
remain.
3.39 As a follow-up to this discussion of the existing body of evidence, a review of further studies
published following the 2007 WHO report is provided in the following section.

18
rpsgroup.com
4 Scientific Literature Post-2007
Introduction
4.1 A review of scientific literature presented by the wider scientific community following the 2007
WHO monograph has been conducted in order to determine how the current evidence base
aligns with the position held by authoritative groups and to identify any discrepancies or
remaining uncertainties in the health evidence base.
4.2 As highlighted by the authoritative evidence base in Chapter 3, the need for further research and
independent replication of study findings is indicated, in order to establish in particular whether
there is evidence of a link between ELF EMF and cancer. Therefore this area is the main focus of
the following literature review.
Methodology
4.3 An initial search of literature following the 2007 WHO monograph has been conducted using the
PubMed database. The main criteria for the search were that the studies considered ELF EMF in
the power frequency range and had been published during 2007-2012, subsequent to the WHO
monograph. The search terms used were: EMF, ELF EMF, ELF magnetic field, EMF high
voltage, EMF non ionising radiation and EMF power line. In total, 111 papers were considered
and the results categorised by study type: epidemiological (27); in-vitro (42) or in-vivo (11);
magnetic field (17); electric field (3); and guidelines (11).
4.4 The studies were prioritised by an abstract review to determine the relevance to health effects
from ELF EMF and their value to this review. Following this, 15 studies were reviewed in detail
and have been summarised within this document. The full literature search can be seen in
Appendix A.
4.5 A large number of studies for the subject area relate to radio frequency EMF. As this is relevant
to mobile phones and associated infrastructure rather than power line frequency EMF, the terms
“radio frequency” and “radiofrequency” have been excluded from the search.
4.6 In March 2014, this literature review was supplemented with a search focusing on
epidemiological studies of childhood leukaemia published in 2013-14, as this had been the
principal topic of interest for possible health impacts identified in the initial review, and a number
of relevant peer-reviewed scientific papers had been published in the interim. The same search
approach was employed, using the terms EMF/magnetic field/power line/high voltage and
leukemia/leukaemia2. The publications that provided new epidemiological research regarding
2 "2013/01/01"[Date - Publication] : "3000"[Date - Publication] AND (emf[Title/Abstract] OR magnetic field[Title/Abstract] OR power line[Title/Abstract] OR high voltage[Title/Abstract]) AND (leukemia[Title/Abstract] OR leukaemia[Title/Abstract])

19
rpsgroup.com
childhood leukaemia and electricity networks or EMF are listed in Appendix A, and their findings
are discussed in paragraphs 4.14 to 4.20.
Cancer
4.7 ELF magnetic fields have been classified as possibly carcinogenic to humans, with a possible
correlation between long-term exposure to magnetic fields above 0.3-0.4 µT and the risk of
childhood leukaemia [20]. However, a mechanism to explain this possible effect, if real, has not
been identified, leading to a requirement for further research. A review by Schüz, 2011, of the
epidemiological evidence base concluded that the assessment of ELF magnetic fields as a
possible carcinogen that may cause childhood leukaemia remains valid [21]. To date, despite a
wide body of evidence, a causal relationship has not been established and although research
activities are ongoing, it is possible that this status may remain uncertain [21] (see Section 2.4.3).
Cancer promotion
4.8 The initiation of cancer by ELF fields is theoretically improbable in that ELF EMFs are non-
ionising and do not have the required energy to cause direct damage at the molecular level.
Mechanisms of cancer promotion including inhibited melatonin production have been considered,
with some evidence of decreased blood serum level melatonin under power frequency magnetic
fields [22].
4.9 Although presented in a 2007 paper, this conclusion is drawn from a 2005 review which has been
superseded by the HPA paper discussed in Section 2 of this document; the HPA research failed
to find consistent evidence of an association [19].
Childhood leukaemia
4.10 In case-control epidemiology studies, odds ratios are used in the reporting of results. These are
the ratio of the odds of an exposure (ELF magnetic fields from power lines) in the case group
(children with leukaemia) to the odds of an exposure in the control group (children without
leukaemia). An odds ratio of 1 for example would indicate that childhood leukaemia is equally
likely to occur in both groups from the same exposure; greater than 1 indicates that childhood
leukaemia is more likely from the exposure and below 1 indicates the childhood leukaemia is less
likely to occur from exposure to ELF magnetic fields from power lines.
4.11 A pooled analysis that combined 9 studies with 3,247 cases of childhood leukaemia and 10,400
control cases found a pooled odds ratio of 2.0 at exposure levels of >0.4 µT [23]. This association
was also reported in the IARC monograph [12]. A more recent pooled analysis based on 7
studies (from Brazil, Germany, Japan, Tasmania, the UK and two from Italy) included 10,865
cases of leukaemia and 12,853 control cases and found an odds ratio of 1.44 for exposure of
≥0.3 µT [24]. Due to data availability, the Brazilian study only considered cases of acute
lymphoblastic leukaemia in children aged eight years and under. Omitting the study from Brazil,
the pooled analysis gave a combined odds ratio of 2.02 for exposure of ≥0.4 µT, similar to that

20
rpsgroup.com
provided in earlier studies [24]. Overall, this analysis relied heavily on one study that added to the
overall size and number of cases but little to the statistical power, as few children with elevated
exposure levels were included [21].
4.12 The consistent results of the pooled analyses for a large number of international studies reduce
the possibility that an association between ELF and magnetic fields is due to chance but do not
rule out potential bias or confounding variables [21].
4.13 One such confounding variable is the use in certain studies of distance from power lines as a
proxy for EMF exposure. Using published data for the UK as an example, the magnetic field falls
to approximately 0.2 µT at 70-80 m from typical 275-400 kV transmission lines compared with 30-
50 m for 132 kV lines. In the UK 2% of residential homes with small children have background
magnetic levels of 0.2 µT and 0.5% have levels of 0.4 µT [25]. As high exposure levels are rare,
using power line proximity to estimate exposure can lead to misclassification compared to the
alternative system of direct measurements within the home to allow exposure to be directly
assigned to a household [25]. Additional confounding factors for consideration include the
multiple possible sources of ELF magnetic fields, socio-economic factors, and lifestyle choices
such as smoking and passive smoking [22].
Publications 2013-14
4.14 The updated literature search focusing on research papers published in 2013-14 concerning
epidemiological study of childhood leukaemia identified several studies of interest that add to the
evidence base. The „Draper study‟ (discussed in paragraph 3.12) has been extended by Bunch et
al [26] to add further evidence from Scotland and from 132 kV overhead lines to the data
analysed, and to present trend in risk over time. The study continued to find an elevated
childhood leukaemia risk associated with residences within 600 m of high-voltage power lines,
and in particular within 200 m. However, this risk is most apparent in earlier decades of the time
period considered in the study (1962-2008), which suggests that a factor that changes over time
(such as population characteristics) is more likely to be the explanation than a physical effect
from power lines.
4.15 A study in Denmark published in 2014 [27] that was designed to independently verify the UK
study‟s findings by using a comparable approach did not find an increased leukaemia risk for
children living within 200 m or 600 m of high-voltage power lines. The methodology for a third
independent verification study using this approach in California has been published [28], but
results are not yet available.
4.16 A study in France for the period 2002-2007, published in 2013 [29], found an increased childhood
leukaemia risk associated with living within 50 m of the highest-voltage (225 kV – 400 kV)
overhead lines, based on a small number of cases, but did not find increased risk for greater
distances or lower-voltage lines.
4.17 A pooled analysis using results from 9 previous studies published by Zhao et al in 2014 [30]
found increased risk with exposure in the categories of greater than 0.2 µT compared to below

21
rpsgroup.com
this level, and a slightly greater risk for exposure of greater than 0.4 µT compared to less than 0.1
µT.
4.18 In a further paper, residential mobility and population mixing (which could be a demographic
factor changing over time that is relevant to the Bunch et al findings) near power lines in the UK
was investigated [31], following the hypothesis of infections following population mixing as the
cause of increased childhood leukaemia risk associated with residence near nuclear sites [32].
However, this study did not find a significant association between population movement and
power line proximity.
4.19 A Dutch study published in 2013 [33] followed up epidemiological evidence of an apparent
childhood leukaemia cancer cluster. The study was not designed to investigate a causal
relationship between high-voltage power lines and childhood leukaemia, but noted that “the
children had not been subjected to prolonged exposure to strong magnetic fields emitted from the
high-voltage power line.”
4.20 Overall, the epidemiological study evidence published in 2013-14 is mixed; while a pooled
analysis and data from a short time period in France show an increased childhood leukaemia risk
associated with magnetic field exposure and short distance to high-voltage power lines, the UK
study with a very large number of cases assessed over a multi-decade time period did not find an
increased risk that could plausibly be linked to physical effects from power lines, while a parallel
independent Danish study following a comparable approach did not find any statistically
significant increased childhood leukaemia risk.
Brain tumours
4.21 Schüz, 2011, reviewed a meta-analysis of 13 studies investigating ELF magnetic fields and
childhood brain tumour risk, finding a summary odds ratio of 1.68 for exposures >0.4 µT [21].
Subsequent to this a pooled analysis of 10 studies was published which encompassed 8,372
cases of brain tumour and 11,494 control cases. Depending on the studies included the results
indicate a pooled odds ratio of 1.14 or 1.16 for exposure to 0.4 µT. Schüz concludes that these
odds ratios provide little evidence for an association between ELF magnetic field exposure and
childhood brain tumours. Although childhood brain tumours and leukaemia are not directly
comparable, due to the difference in tissue type and different potential aetiology, the substantially
lower odds ratio (compared to results seen for childhood leukaemia) does not support a common
source of underlying bias to explain apparent risk. This could suggest that if there is an
association between ELF magnetic field exposure and childhood leukaemia, it is specific to that
disease. However, the bias patterns may not be directly comparable between different studies.
[21].
4.22 A 2011 study of occupational and residential exposure to ELF EMF and the risk of brain tumours
in adults found an insignificant association (wide confidence interval of 0.86-10.4 indicating
uncertainty) between meningioma (tumour of the brain lining) and residential exposure to EMF in
subjects residing near power lines. The data suggests that occupational or residential exposure

22
rpsgroup.com
to ELF EMF may play a role in the occurrence of meningioma. However, the study is open to
misclassification through the use of proximity to power lines as the methodology for establishing
exposure and is based on a limited number of exposed participants, leading to statistically
insignificant findings [34]. Similar conclusions were found in a pooled analysis conducted by
Kheifets et al in 2010 [35].
Electric fields
4.23 The majority of studies focus on ELF magnetic fields rather than electric fields in part due to the
method of interaction between electric fields and organisms. Electric fields are largely absorbed
by skin and muscle due to the conductivity of these tissues [22]. The highest electric fields at
ground level from overhead lines is approximately 10 kV m-1, whereas the field strength inside a
home from such an outside source is 10-1000 times lower because the building attenuates the
field. Therefore within homes, wiring and appliances are the most common source of electric-field
exposure.
4.24 Similarly to magnetic fields, a mechanism of action has not been established; proposed
mechanisms include electric shocks, micro shocks and surface charge [36]. A systematic review
of existing literature for electric fields concluded that there is limited evidence of a change in
cancer risk and little basis for continued research [36].
Summary
4.25 The updated literature has been shown to be in keeping with the authoritative evidence base
outlined above, in that although the evidence for classification of ELF EMF as a possible
carcinogen based upon correlation between magnetic field exposure and disease incidence has
not been substantially altered, no further progress has been made in establishing evidence of a
causal link or a mechanism for action. A preliminary 2014 update to a European Commission
health risk scientific committee opinion [37] suggests in its draft that the lack of experimental data
“prevent[s] a causal interpretation” of evidence for childhood leukaemia risk from ELF EMF.
Some recent national reviews have concluded that the scientific evidence does not establish that
the ELF electric and magnetic fields around power lines or any device using electricity is a hazard
to health [38] [39], although another indicates that the evidence base regarding a causal
relationship remains unchanged [40].
Cardiovascular Disease
4.26 A recent study involving 58 volunteers exposed to two testing sessions (one real, one placebo)
utilising a 60 Hz magnetic field at 1,800 µT did not result in an effect on skin blood perfusion,
heart rate or heart rate variability. The magnetic field used in this study did not affect
cardiovascular parameters, and therefore should magnetic field exposure have cardiovascular
effects, they are smaller than observed in the study through the two hour resting period ECG [41].
A recent pilot study carried out by the same research group investigated the effect of exposure to

23
rpsgroup.com
a 200 µT 60 Hz magnetic field on human circulation. Ten volunteers were exposed to two testing
sessions (one real, one placebo), and the results indicate that the magnetic field used in the
study did not affect perfusion, heart rate or mean arterial pressure [42].
4.27 The above findings are in keeping with the conclusions drawn in the authoritative evidence base
reported in Section 2 of this document, in particular the IARC monograph.
Neurodegenerative Disorders
4.28 There are no known biological mechanisms to explain an association between ELF EMF
exposure and Alzheimer‟s disease. ELF EMF has not been identified as a genotoxic agent but it
has been hypothesised that it may promote or induce mutation through enhancing the effect of
other agents.
4.29 A longitudinal study of the Swiss population that investigated residential exposure to power lines
and mortality from neurodegenerative diseases found an odds ratio for Alzheimer‟s disease in
people living less than 50 m from power lines of 1.24 compared with people living 600 m or more
away [43]. However, the researchers note that there is no proof of an association and although
the hypothesis remains valid at present, further research is required [44]. In order to provide a
possible explanation for this association a number of in vitro studies have been reviewed
suggesting some evidence of induction of chromosome instability, increased production of the
peptide amyloid-β and decreased production of melatonin, all of which hypothetically may
contribute to the development of Alzheimer‟s disease [44]. Further detailed research is required in
order to establish whether there is a possible association between exposure to ELF EMF, the
above mechanisms and the onset of Alzheimer‟s disease. The authoritative evidence base
(SCENHIR, WHO and IARC) found a possible association between the occurrence of Alzheimer‟s
disease and exposure to ELF EMF but that further research is required to establish this. The
updated literature outlined above is in keeping with that stance, with results shown to be
inconclusive, requiring additional research.
4.30 Although not strictly research into neurodegenerative disorders, in a study of cognitive
performance, psychometric testing was conducted on people in a 60 Hz, 3 mT magnetic field, the
results of which indicate that magnetic field exposure removed the improvements seen with
practice. The study does not establish a clear magnetic field effect on human cognition but
speculates that ELF magnetic field may interfere with neuropsychological processes responsible
for the short term learning effect [45]. This is however in contrast to a study which placed 74 male
volunteers into five groups who were either told that exposure would enhance cognitive
performance, have a negative effect or remain neutral. Only one group was exposed to an ELF
magnetic field of 400 µT. There was no significant difference reported between the groups for
cognitive performance, psychological or physiological parameters [46].

24
rpsgroup.com
EMF Health Protection Guidelines
International guidelines
4.31 ICNIRP has published two editions of international guidelines for recommended EMF exposure
limits, in 1998 and 2010. These are expressed in the form of Basic Restriction levels for induced
current in the central nervous system (1998) and internal electric field (2010). Modelling has been
used to convert these basic restrictions into reference levels of external electric and magnetic
field strength that could be equivalent to the Basic Restriction. Table 4.1 summarises the 1998
and updated 2010 Basic Restrictions and reference levels for long-term general public exposure.
Table 4.1: ICNIRP general public Basic Restriction and reference levels for electric and magnetic
field exposure at 50 Hz [5] [6]
Basic Restriction Electric field reference level
Magnetic field reference level
ICNIRP 1998 (head and trunk) 2 mA m-2 5 kV m-1 100 µT
ICNIRP 2010
5 kV m-1 200 µT (CNS of head) 20 mV m-1
(All tissues) 400 mV m-1
4.32 The guideline Basic Restriction levels consider well-established effects from electric and
magnetic fields such as the stimulation of peripheral and central nerves. These are based on
acute (i.e. immediate or short-term) effects perceptible or detectible from EMF exposure. To
those levels based on short-term exposure, ICNIRP applies precautionary reduction factors in
light of the uncertainty in the scientific data for long term exposure. ICNIRP‟s approach takes into
account the evidence presented in the WHO and IARC monographs and wider evidence base,
but does not consider the evidence of any disease causation to be strong enough to form the
basis of exposure guidelines. With regard to leukaemia, ICNIRP states that,
“It is the view of ICNIRP that the currently existing scientific evidence that prolonged exposure to
low frequency magnetic fields is causally related with an increased risk of childhood leukemia
[sic] is too weak to form the basis for exposure guidelines. Thus, the perception of surface electric
charge, the direct stimulation of nerve and muscle tissue and the induction of retinal phosphenes
are the only well established adverse effects and serve as a basis for guidance.” [47] (page 2)
4.33 The 1998 ICNIRP guidelines have been recommended by the EC (1999/519/EC) and widely
adopted within the EU (either by transposition of the recommendation into national legislation, or
on a voluntary/guideline basis that can often form a de-facto standard) as well as by many other
non-EU countries. Some European countries, however, apply lower magnetic field exposure
limits, some examples of which are given in Table 4.2 [48].

25
rpsgroup.com
Table 4.2: Magnetic Field Restriction Examples in Europe
Country/Region Magnetic field restriction Applicable to Notes
Poland 75 µT
Slovenia 10 µT Public areas Formerly 5 µT [49]
Belgium 10 µT
Italy 3 µT New installations near homes, schools and
playgrounds
10 µT for existing installations near same; 100 µT elsewhere
Switzerland 1 µT New installations near
playgrounds, and places of long-term exposure
Netherlands 0.4 µT Long-term exposure of children
Not a binding limit but a recommendation to local
government
Tuscany (Italy) 0.2 µT [50]
4.34 The reduced limits set out in Table 4.2 in several cases apply for areas classed as sensitive
receptors such as schools, hospitals, and new homes. In Switzerland an exemption from the
lower limit is granted for new installations if all measures that are technically and financially viable
have been taken [51]. In Sweden, rather than a generic limit, change from the existing
background is assessed, and radical deviation from it should be reduced where reasonable [48].
In Denmark, a voluntary agreement is in place between the government and electricity industry to
examine options for exposure reduction if annual exposure for a new installation would be above
0.4 µT [48]. The WHO International EMF Project provides an overview of adopted exposure limits
throughout the world with the aim of providing a framework for matching EMF standards
worldwide [52]. For example the limits for public exposure across a number of countries
(Australia, Austria, Hungary, Italy, Poland) are comparable with those from ICNIRP but allow
higher exposure levels for a few hours per day (from 100–1,000 µT) [53].
4.35 Other national interpretations of the ICNIRP guidelines exist. For example the UK‟s Department
of Energy and Climate Change (DECC) published a voluntary code of practice for the electricity
industry in 2011, updated in 2012 [54], in which the results of modelling for the HPA of EMF
interaction with the body have been used to set external electric and field strength guideline limits
that are equivalent to the 1998 Basic Restriction level. These are 360 µT for unperturbed
magnetic field strength and 9 kV m-1 for unperturbed electric field strength from overhead power
lines.
Precautionary principle
4.36 As noted, the prevailing international guidelines commonly accepted in EU states do not
recommend EMF exposure restrictions on the basis of possible but unconfirmed health impacts

26
rpsgroup.com
discussed in this review, although as a precautionary approach they do apply significant
reduction factors from the thresholds of known physical effects from EMF in order to account for
scientific uncertainty regarding issues such as the potential for long-term health impacts.
4.37 A viewpoint therefore exists which suggests that, given the (limited) evidence particularly
regarding a possible correlation of long-term magnetic field exposure and childhood leukaemia at
field strengths significantly lower than the ICNIRP guideline limits, it may be appropriate to apply
the precautionary principle and consider further intervention where practicable to reduce the
potential exposure to EMF.
4.38 Gee, 2009, states that,
“the precautionary principle was designed to justify actions to protect the public and the
environment in the absence of some significant knowledge, and could be used to justify exposure
reductions to EMF, despite current gaps in knowledge.” [55] (page 220).
This is relevant given that a mechanism of action has not been established to explain any
potential association between exposure to ELF magnetic field strengths below the international
guideline level and adverse health outcomes. Nevertheless, as noted by Kheifets et al, 2010,
there has been a shift in the tone of debate surrounding risk management to,
“how can we do something measured and reasonable that is a correct response to the scientific
evidence and associated uncertainty, as well as to public concern.” [56] (page 1487).
4.39 A full discussion of this issue, which is likely to be a national policy matter, is outside the scope of
this literature review. However, it is worth noting that an open paper in 2010 by Maslanyj et al
offers a useful summary of the application of the precautionary principle to this issue. The authors
conclude that although there is,
“no clear indication of harm at field levels implicated … the aetiology of childhood leukaemia is
poorly understood. Taking a precautionary approach suggests that low-cost intervention to
reduce exposure is appropriate. This assumes that if the risk is real, its impact is likely to be
small. It also recognises the consequential cost of any major intervention. The recommendation is
controversial in that other interpretations of the data are possible, and low-cost intervention may
not fully alleviate the risk.” [57] (page 8)
4.40 The paper notes in particular that due to uncertainties in the evidence and the fact that they may
not be resolved in the near future,
“despite the need for evidence-based policy making, many of the decisions remain value driven
and therefore subjective.” [57] (page 8)
4.41 The recommendation of a precautionary stance echoes WHO‟s 2007 view, which suggested that
the use of „suitable precautionary measures to reduce exposure is reasonable and warranted‟ in
view of uncertainties about the effects of chronic magnetic field exposure, but that due to the
weakness of the evidence of a link between exposure to ELF magnetic fields and childhood
leukaemia, the benefits of exposure reduction on health are unclear. WHO emphasised that any

27
rpsgroup.com
precautionary measures should not compromise the benefits of electric power, and that the costs
of any precautionary measures to further reduce exposure would only be justified where they are
very low or have no cost.
4.42 Discussing the precautionary principle in a recent publication, however, Repacholi, 2012 [58]
notes that when assessing the evidence offered by scientific studies, there are four key criteria,
namely: (i) Do the studies overall show a statistically significant and strong relationship between
the exposure and the health effect?; (ii) Are the results of different types of studies consistent?;
(iii) Is there a statistically significant dose-response relationship?; and (iv) Is it biologically
plausible that exposure is capable of causing the health effect? He concludes that the view of
WHO Task Force on EMF in reviewing scientific studies undertaken has been that the evidence,
while mixed, may partially satisfy the first criterion but fails to satisfy the remaining three criteria
and does not support a health risk from EMF overall. Given this, Repacholi references the Task
Force in stating that ICNIRP exposure guidelines and their scientific validity would be undermined
were they to be reduced by national authorities “to some arbitrary level in the name of precaution”
[11], cited in [58], and suggests that doing so may inflame rather than help address public
perceptions of risk.
Conclusion
4.43 Following the 2007 WHO monograph, additional scientific research has been carried out to try
and determine whether there is a causal link between ELF EMF and disease, in particular
childhood leukaemia. To this end, the evidence base remains inconclusive; the IARC
categorisation of ELF EMF as a possible carcinogen remains supported by evidence of possible
correlation between exposure and disease, but evidence of a causal relationship or a plausible
mechanism to explain causation has not been established following extensive research. Some
recent national reviews have concluded that the scientific evidence does not establish that the
ELF electric and magnetic fields around power lines or any device using electricity is a hazard to
health [38] [39]. Epidemiological studies of childhood leukaemia published in 2013-14 continue to
provide mixed evidence, with some studies finding increased risk associated with residential
proximity to power lines but others not, while trends over time data in childhood leukaemia risk for
those living close to power lines in the largest UK study implicates a non-EMF factor.
4.44 Study limitations such as estimating long term exposure, the source of exposure and relation to a
health outcome through a given mechanism of action cast doubt as to whether a firm conclusion
will be reached in the near future. Similarly, the results of research into neurodegenerative
disorders remain inconclusive, with the need for further research indicated in order to establish
whether a real health impact exists. The results for ELF EMF and cardiovascular disease in both
the authoritative and updated literature have failed to establish an association between the two
with future research perhaps better targeted toward neurodegenerative disease and cancer.
Similar conclusions have been drawn for the health outcomes associated with electric fields.

28
rpsgroup.com
4.45 In the light of these findings, existing public exposure guidelines from ICNIRP have been set
based on robust, well established acute effects from EMF. They do not account for postulated
possible long term health effects from extremely low frequency fields due to the uncertainty
surrounding the evidence base, but do incorporate a significant reduction factor from the lowest
threshold for established effects, to allow for uncertainty and for long-term exposure. In the
absence of an established causal mechanism it is considered appropriate to remain within
guidelines set to manage known effects and where possible to further reduce unnecessary
exposure.

29
rpsgroup.com
Evidence Base

30
rpsgroup.com
5 EMF Evidence Based Study Scope and Key Aims
5.1 The key aim of this element of the study is to compile a robust EMF evidence base from high-
voltage transmission infrastructure in Ireland, and relate this to the present state of scientific
knowledge regarding potential health impacts as discussed in the literature review. The primary
scope of work undertaken has been a series of measurements at varying distances from a range
of existing infrastructure items representative of the typical designs in use throughout Ireland, at
locations around Dublin and Co. Kildare.
5.2 As discussed in the preceding sections, it is felt that real-world measurements of EMF from
operational power lines, allied to a review of the health impact research literature, provides the
best evidence from which to address perceived as well as actual risk from EMF.
5.3 Magnetic field strength depends directly on the load (amount of power) carried by the
transmission infrastructure items, and so it is necessary not only for such an evidence base to
contain measurements taken under typical operating conditions, but also for measurements and
analysis to consider (real-world) high-load conditions – i.e. during periods when the load on the
transmission grid is greater than average. 5.4 Analysis of measured magnetic field strength together with records of the load on power lines
over a year allows magnetic field strength at average and highest loads to be estimated, using
the measured data. Measurements have also been made to record the magnetic field
experienced where several power lines cross or run together in close proximity.

31
rpsgroup.com
6 Approach
Site selection
6.1 The strength of EMF generated and profile of how the field strength changes with distance is
primarily dependent upon power line geometry, the current carried, and the load balance between
phases. High-voltage transmission infrastructure in Ireland comprises a range of tower and cable
designs, transmitting power over single or multiple circuits at a number of different voltages (and,
hence, currents for a given power load).
6.2 In order to capture a robust dataset regarding EMF from power lines, it is necessary to survey a
representative range of overhead and underground transmission line designs carrying varying
power loads. This would allow a generalised set of typical EMF data for classes of power lines
under these load conditions to be established, that can be applied to future developments.
6.3 Conversely, field strength as experienced by a receptor at a given location would be influenced
by a range of highly site-specific local factors such as topography, structures, and
transient/changeable factors such as other sources of EMF or weather conditions. Duration of
receptor exposure and location within the field would also strongly influence the potential degree
of exposure.
6.4 Investigation of such local factors is not a goal of this study, as their combination would likely be
unique to any given location or receptor. The goal of site selection, instead, has been to choose
power lines representative of the range of designs used, in settings that allow unobstructed space
for measurement. This has been designed to allow focus on the power line EMF rather than
influences of particular settings. Secondary considerations included the practicalities of land
access and choice of general study areas that contain multiple power lines of different designs.
6.5 For these reasons, areas near the transmission substations at Dunstown, Maynooth, Kilteel and
Finglas were chosen, all to the west of Dublin, within County Dublin and County Kildare. Two
additional sites were used: at the Curragh (Co. Kildare), open land was used for measurements
of a 400 kV single circuit overhead line with horizontal tower design, and at Firhouse in Dublin,
additional measurements of a double-circuit 110 kV line were made due to access limitations at
Maynooth. A plan of sampling point locations is given in Appendix B.
6.6 EMF strength drops rapidly with distance from the source. In addition, electric and magnetic fields
are vectors, which means that the combined field strength from multiple sources would not
typically be as great as the scalar sum of their maximum strength. These two points ensure that
field strength measurements tend to be dominated by single proximate sources. The distance
between EMF sources even where several are present in the area of a substation is sufficient to
allow measurements of individual power lines.

32
rpsgroup.com
6.7 These sites also enabled EMF measurements to be taken of the substations themselves, as the
substations at Dunstown, Maynooth and Kilteel comprise 400 kV, 220 kV and 110 kV transformer
and switching equipment.
6.8 Table 6.1 shows the high-voltage transmission range of infrastructure types used in Ireland and
the sites chosen for EMF measurements of examples for each type.
Table 6.1: Infrastructure elements and EMF measurement sites
Infrastructure Measurement site
(location plan shown in Appendix B)
Overhead power lines (AC)
400 kV single circuit on double circuit tower Dunstown (Co. Kildare)
400 kV single circuit The Curragh (Co. Kildare)
220 kV double circuit Maynooth (Co. Kildare)
220 kV single circuit Dunstown (x2) (Co. Kildare)
110 kV double circuit Maynooth and Firhouse (Co. Kildare and Co. Dublin)
110 kV single circuit Kilteel (Co. Kildare)
Underground power cables (AC)
220 kV single circuit Finglas (Co. Dublin)
110 kV single circuit Finglas (Co. Dublin)
Substations (AC)
400 kV / 220 kV transformer substation Dunstown (Co. Kildare)
220 kV / 110 kV transformer substation Maynooth (Co. Kildare)
110 kV transmission substation Kilteel (Co. Kildare)
Survey times
6.9 The EMF survey aimed to record field strengths under typical conditions, representative of normal
power loads on the grid infrastructure elements, as well as higher load conditions when a greater
amount of power was being transmitted.
6.10 Power demand, and hence grid load, varies over two distinct temporal scales: daily over a 24-
hour cycle, and seasonally over an annual cycle. Factors influencing daily demand profiles
include social and working routines, while annual patterns are influenced by factors such as
colder weather and shorter daylight hours in the winter. A third scale of variation over a week,
with differences in demand over working days and the weekend, may also be perceived.

33
rpsgroup.com
6.11 In light of these variations in power load carried, measurements that targeted typical conditions
were undertaken during September 2012 and March 2013 at three intervals per day, over a
period of three days per week (two weekdays and one weekend day) for each type of overhead
line and underground cable, in order to capture a representative picture of EMF strength under
typical operating conditions.
6.12 One further set of measurements targeted higher load conditions. Analysis of historic total grid
load data indicated that the highest annual loads tend to occur in the winter, particularly in
December and January. A single set of measurements for each item of infrastructure was
conducted in January 2013.
6.13 Although total grid load in Ireland has the relatively clear trends discussed, load on individual
power lines in the grid can be much more variable, due to factors such as load balancing within
the grid and the generation and storage stations that are active at a given time.
6.14 Real-time load data and hourly records of loads were used to establish the load on each
infrastructure item at the time at which measurements were taken.
Measurement methods
Measurement distances
6.15 Existing published calculations [59] and measurements [9] of EMF from power lines indicate that
the strength of both the magnetic and electric field would be expected to reduce proportionate to
approximately the inverse square or inverse cube (depending on design, phasing) of distance
from the source.
6.16 For this reason, a measurement profile was chosen that allocates a greater proportion of
measurements to the area close to the line, in order to offer finer resolution in the area where the
field strength changes most rapidly.
6.17 Measurements at up to 100 m from the power line centrelines were proposed, as the field
strength would (due to the decrease of field strength with distance noted above) be negligible
compared to its maximum directly under/above the source.
6.18 Due to the closer spacing of cores in underground cables, the field strength was expected to drop
more rapidly with distance than for the overhead lines. This was borne out in pilot measurements
taken, and measurements were therefore grouped more closely over a shorter distance for the
underground cables.
6.19 Substations were measured from the closest publically-accessible point, which in all three cases
was the outer perimeter security fence, in order to be representative of potential general public
exposure. The distance between EMF sources (HV equipment on the substation site) and fence
meant that a shorter measurement distance beyond the fence was warranted; space constraints
at the sites limited this to 15 m, 30 m and 50 m at the substations measured.

34
rpsgroup.com
6.20 Substation measurements were taken at the farthest accessible point on the fence from overhead
power lines crossing it, in order to reduce as far as possible the influence of field strength from
the overhead lines on the results.
6.21 Measurement distances are summarised in Table 6.2.
Table 6.2: EMF measurement distances
Infrastructure Measurement distances (m)
400 kV overhead line
220 kV overhead line
110 kV overhead line
0, 5, 10, 15, 20, 25, 50, 75, 100*
220 kV underground cable 0, 2, 5, 10, 15, 20, 25, 30, 35, 40, 50
110 kV underground cable 0, 2, 4, 6, 8, 10, 12
Substations 0, 5, 10, 15, 20, 25, 30, 50**
* Limited to 75 m in some cases due to space/access constraints
** Maximum; limited to 15 m and 30 m in other cases due to space constraints
6.22 A distance of 0 m corresponds to the central point under the power line, above the underground
cable, or at the substation fence. For horizontal design overhead lines, the central point lay
directly under the middle (of three) phase wires. For double circuit vertical design overhead lines,
the central point lay directly under the central earth wire, equidistant from the wires of each circuit
either side. For the single circuit overhead line on double circuit pylons, the central point lay
directly under the lower phase wire. Positioning was established visually, using parallax between
the phase wires.
6.23 The centreline of both underground cables was located using the EMF meter, on the predication
that this would be the point at which the maximum magnetic field strength would be experienced.
It would not be possible to confirm that this alignment with the cable‟s physical location is borne
out without excavating the cable; however, it is the location of maximum field strength that is of
interest, rather than cable centreline per se.
Measurement equipment
6.24 Magnetic field measurements were conducted using a Narda EHP-50D meter with electric and
magnetic field probes. The meter offers three-axis field measurement, with an RMS (root mean
square) total of field strength measured presented in the results. A calibration certificate for the
meter used is reproduced at Appendix C.
Measurement height
6.25 All measurements were taken with the EMF meter at 1 m above ground level. Potential EMF
interaction with the body is through induced currents, primarily in the central nervous system, and
such currents are generated by the field over the entire surface of the body. Field strength will not

35
rpsgroup.com
be uniform over the body as the distance from source is greater at head or feet, for example. A
measurement height of 1 m above ground is, however, considered to provide a good
approximation of field strength as it would be experienced body-wide, being approximately at the
height of a standing adult‟s torso.
6.26 The height of the power line above the point of measurement also influences the field strength
measured. Measurements were conducted from a point measured to be in the centre of the span
between pylons, at which point the line sags to its lowest level. Where the topography of the
measurement site was not flat (especially on the Curragh), the measurement centre point was
selected on high ground in order to avoid capturing artificially low field strengths due to greater
line clearance over a valley or dip in the land (i.e. greater than usual vertical distance between
power line and measurement point).
6.27 Underground cable burial depth would also affect the magnetic field measured at 1 m above
ground level; however it was not possible to ascertain cable depth. In general, however, direct-
buried underground cables (as opposed to those located in conduits or utilities pipes) are typically
at a depth of 1 m – 2 m.
Measurement variation
6.28 A number of factors influence real-world measurements of electric and magnetic fields, that would
cause variation in the measurement results over several series of measurements at the same
infrastructure item, even when the recorded loads at the time of measurement are similar or the
same. Factors likely to cause variability in the measurement results include:
Exact load at the time of measurement. Loads were generally recorded from real-time data
at the start of measurement series, and may have varied while measurements were
undertaken.
Topography of the measurement sites. Although relatively flat sites were selected where
possible, topography will have affected the straight-line distance from the EMF sources to a
small degree.
Meteorological conditions at the time of measurement. Ambient temperature can affect the
heating, and hence degree of sag (affecting measurement distance), in overhead line
conductors. Wind causes some movement in the conductors of overhead lines, again
affecting distance from them. Electric field measurements are particularly sensitive to
conductivity, affected by humidity and rainfall.
Transmission system voltage variability, which would directly affect the electric field
strength measured. Within the Grid Code [60], under normal operation, variation from 370
kV to 410 kV, 210 kV to 240 kV and 105 kV to 120 kV is possible around the nominal
operating voltages of 400 kV, 220 kV and 110 kV respectively. During transmission system
disturbances, variation from 350 kV to 420 kV, 200 kV to 245 kV and 99 kV to 123 kV is
possible around the nominal operating voltages of 400 kV, 220 kV and 110 kV respectively.

36
rpsgroup.com
EMF meter accuracy. Meter calibration results are given in Appendix C. This indicates that
meter accuracy would be a minor component of results variation.
6.29 Variability within results would be expected in measurements conducted under real-world
conditions (as opposed to theoretical calculations). The consistency of results, and degree of
variability, is discussed in the results consistency section of chapter 7.

37
rpsgroup.com
7 Magnetic Field Results
7.1 Table 7.1 to Table 7.15 show the magnetic field strength measured for each of the high-voltage
transmission infrastructure items surveyed, with the load at the time of each measurement.
Variation in the results measured at similar loads is due to factors outlined in the measurement
variation discussion in Section 6. The consistency of results is discussed further in the results
consistency section, below.
Results tables
Table 7.1: Measured magnetic field for 400 kV single circuit overhead line (double circuit tower) [see Figure 7.1]
Name Moneypoint → Dunstown
Location Dunstown
Type 400 kV single circuit
Design Double circuit tower
Date 03/09/12 03/09/12 03/09/12 05/09/12 05/09/12 05/09/12 09/09/12 09/09/12 09/09/12 21/01/13
Time 10:35 14:02 16:41 09:30 12:13 15:18 10:30 12:47 16:02 14:40 Load (MVA) 181 201 256 199 238 247 223 152 121 286
Dist. (m) Magnetic field (µT)
0 2.30 2.40 3.20 2.52 3.08 3.02 2.70 2.10 1.70 3.74
5 2.04 2.10 2.96 2.30 2.92 2.86 2.60 1.94 1.58 3.57
10 1.72 2.02 2.50 1.90 2.40 2.36 2.18 1.62 1.32 3.24
15 1.34 1.40 1.96 1.52 1.90 1.86 1.74 1.26 1.04 2.89
20 0.98 1.20 1.60 1.20 1.48 1.48 1.36 0.98 0.83 2.07
25 0.79 0.98 1.20 0.94 1.18 1.16 1.08 0.77 0.67 1.28
50 0.31 0.70 0.50 0.32 0.45 0.44 0.41 0.29 0.25 0.57
75 0.17 0.50 0.45 0.19 0.23 0.28 0.20 0.14 0.12 0.46
100 0.10 0.11 0.17 0.11 0.14 0.16 0.12 0.09 0.07 0.21

38
rpsgroup.com
Table 7.2: Measured magnetic field for 400 kV single circuit overhead line (horizontal tower
configuration) [see Figure 7.2]
Name Moneypoint → Dunstown
Location The Curragh
Type 400 kV single circuit
Design Single circuit tower
Date 03/09/12 03/09/12 03/09/12 05/09/12 05/09/12 05/09/12 09/09/12 09/09/12 09/09/12 21/01/13
Time 12:58 15:31 18:20 11:23 14:30 16:44 09:30 12:01 15:16 13:30 Load (MVA) 196 255 236 212 243 237 166 177 221 280
Dist. (m) Magnetic field (µT)
0 3.20 4.30 3.80 3.56 3.92 3.78 2.54 2.64 3.30 4.86
5 3.00 4.30 3.77 3.50 3.90 3.68 2.52 2.56 3.28 4.83
10 2.80 3.90 3.40 3.24 3.58 3.28 2.40 2.40 2.98 4.61
15 2.10 3.20 2.70 2.68 2.88 2.62 1.96 1.96 2.46 4.34
20 1.60 2.40 2.09 2.04 2.16 2.02 1.50 1.48 1.82 3.61
25 1.20 1.60 1.60 1.50 1.58 1.48 1.10 1.10 1.34 2.78
50 0.50 0.50 0.50 0.45 0.48 0.44 0.34 0.33 0.39 0.78
75 0.40 0.40 0.38 0.19 0.19 0.19 0.15 0.15 0.18 0.52
100 0.05 0.05 0.05 0.12 0.12 0.11 0.04 0.11 0.07 0.20
Table 7.3: Measured magnetic field for 220 kV single circuit overhead line 1 [see Figure 7.3]
Name Dunstown → Turlough Hill
Location Dunstown
Type 220 kV single circuit
Design Horizontal tower
Date 03/09/12 03/09/12 03/09/12 05/09/12 05/09/12 05/09/12 09/09/12 09/09/12 09/09/12 21/01/13
Time 11:10 14:30 17:10 10:23 12:50 15:58 11:00 13:10 16:25 15:00 Load (MVA) 35 49 20 42 81 73 55 59 18 42
Dist. (m) Magnetic field (µT)
0 1.30 2.10 0.90 1.82 3.52 3.18 2.32 2.44 0.68 1.97
5 1.20 2.20 0.60 1.62 3.30 3.04 2.12 2.30 0.58 1.93
10 1.02 1.80 0.60 1.25 2.64 2.42 1.53 1.84 0.50 1.84
15 0.93 1.30 0.45 0.84 1.82 1.66 1.19 1.22 0.32 1.42
20 0.66 0.90 0.05 0.56 1.20 1.05 0.80 0.74 0.24 1.01
25 0.44 0.60 0.05 0.38 0.83 0.75 0.56 0.50 0.17 0.73
50 0.16 0.05 0.08 0.10 0.21 0.19 0.16 0.10 0.06 0.30
75 0.07 0.05 0.01 0.04 0.09 0.08 0.08 0.03 0.03 0.09
100 0.02 0.02 0.01 0.02 0.03 0.03 0.02 0.02 0.01 n/a

39
rpsgroup.com
Table 7.4: Measured magnetic field for 220 kV single circuit overhead line 2 [see Figure 7.4]
Name Dunstown → Maynooth
Location Dunstown
Type 220 kV single circuit
Design Horizontal tower
Date 03/09/12 03/09/12 03/09/12 05/09/12 05/09/12 05/09/12 09/09/12 09/09/12 09/09/12 21/01/13
Time 12:00 15:00 17:30 10:45 13:12 16:08 11:15 13:30 16:43 15:15
Load (MVA) 82 38 58 93 72 67 60 74 26 20
Dist. (m) Magnetic field (µT)
0 2.96 1.20 2.10 3.10 2.44 2.32 1.88 2.44 0.81 1.05
5 2.88 1.20 1.70 2.94 2.38 2.18 1.72 2.28 0.82 0.95
10 2.30 0.80 1.55 2.42 1.96 1.64 1.42 1.92 0.65 0.95
15 1.78 0.60 1.30 1.78 1.44 1.30 1.05 1.50 0.48 0.92
20 1.20 0.40 0.80 1.24 0.97 0.86 0.72 1.02 0.32 0.73
25 0.71 0.40 0.50 0.86 0.70 0.62 0.52 0.72 0.23 0.46
50 0.22 0.05 0.05 0.25 0.20 0.17 0.14 0.20 0.09 0.13
75 0.10 0.05 0.05 0.10 0.09 0.09 0.07 0.09 0.03 0.06
Table 7.5: Measured magnetic field for 110 kV single circuit overhead line [see Figure 7.5]
Name Kilteel → Maynooth
Location Kilteel
Type 110 kV single circuit
Design Horizontal wooden pole
Date 04/09/12 04/09/12 04/09/12 06/09/12 06/09/12 06/09/12 08/09/12 08/09/12 08/09/12 21/01/13
Time 09:36 12:36 15:15 10:00 12:20 16:47 11:00 13:35 16:47 13:00 Load (MVA) 13 14 14 13 14 12 14 14 12 14
Dist. (m) Magnetic field (µT)
0 0.93 0.98 1.01 0.97 1.01 0.93 1.06 1.06 0.93 1.22
5 0.90 0.90 0.85 0.84 0.87 0.82 0.97 0.93 0.82 1.00
10 0.60 0.52 0.55 0.54 0.58 0.57 0.66 0.58 0.57 0.87
15 0.40 0.30 0.31 0.32 0.33 0.30 0.39 0.36 0.30 0.52
20 0.27 0.20 0.20 0.19 0.21 0.19 0.24 0.22 0.19 0.34
25 0.17 0.13 0.14 0.13 0.13 0.12 0.16 0.15 0.12 0.23
50 0.03 0.04 0.04 0.03 0.04 0.06 0.04 0.04 0.06 0.09
75 0.02 0.02 0.02 0.02 0.02 0.03 0.02 0.02 0.03 0.04
100 0.00 0.00 0.00 0.00 0.00 0.00 0.00 0.00 0.00 n/a

40
rpsgroup.com
Table 7.6: Measured magnetic field for 220 kV double circuit overhead line circuit 1 [see Figure
7.6]
Name Maynooth → Woodlands
Location Maynooth
Type 220 kV double circuit
Design Vertical tower
Date 01/03/13 01/03/13 01/03/13 04/03/13 04/03/13 04/03/13 09/03/13 09/03/13 09/03/13 21/01/13
Time 11:17 14:01 15:00 11:00 12:58 13:46 10:23 11:16 12:06 10:40 Load (MVA) 237 206 204 173 171 168 77 64 66 148
Dist. (m) Magnetic field (µT)
0 4.97 4.23 3.75 3.19 3.07 3.14 2.09 1.56 1.65 2.46
5 4.42 3.91 3.63 3.18 3.13 3.21 1.69 1.70 1.81 3.15
10 3.49 3.09 2.97 2.54 2.54 2.59 1.31 1.36 1.42 2.58
15 2.62 2.24 2.12 1.83 1.87 1.89 0.96 0.93 0.98 1.98
20 1.92 1.65 1.50 1.34 1.35 1.40 0.65 0.66 0.68 1.49
25 1.42 1.22 1.13 1.02 0.99 1.08 0.48 0.49 0.53 1.17
50 0.51 0.42 0.40 0.36 0.37 0.36 0.16 0.16 0.21 0.38
75 0.32 0.30 0.28 0.28 0.29 0.28 0.11 0.28 0.12 0.24
100 0.15 0.14 0.13 0.11 0.11 0.11 0.05 0.06 0.06 0.12
Table 7.7: Measured magnetic field for 220 kV double circuit overhead line circuit 2 [see Figure
7.7]
Name Maynooth → Shannonbridge
Location Maynooth
Type 220 kV double circuit
Design Vertical tower
Date 01/03/13 01/03/13 01/03/13 04/03/13 04/03/13 04/03/13 09/03/13 09/03/13 09/03/13 21/03/13
Time 11:34 14:13 15:07 11:13 13:06 13:52 10:31 11:24 12:25 10:50 Load (MVA) 10 17 16 40 39 47 108 109 108 32
Dist. (m) Magnetic field (µT)
0 2.25 2.50 2.39 2.33 2.26 2.22 2.48 2.61 2.43 3.58
5 1.69 1.91 1.80 1.87 1.76 1.76 1.97 2.01 1.96 2.92
10 1.09 1.43 1.28 1.39 1.19 1.32 1.33 1.52 1.29 1.29
15 0.88 1.02 0.94 1.00 0.97 0.98 1.05 1.09 1.03 0.96
20 0.63 0.76 0.69 0.76 0.71 0.73 0.81 0.88 0.79 0.80
25 0.41 0.58 0.53 0.59 0.58 0.56 0.63 0.69 0.61 0.64
50 0.17 0.25 0.23 0.23 0.26 0.23 0.23 0.27 0.22 0.28
75 0.22 0.19 0.20 0.20 0.19 0.20 0.19 0.20 0.19 0.15
100 0.12 0.09 0.09 0.09 0.09 0.09 0.08 0.08 0.09 0.08

41
rpsgroup.com
Table 7.8: Measured magnetic field for 110 kV double circuit overhead line circuit 1 [see Figure
7.8]
Name Maynooth → Rinawade
Location Maynooth
Type 110 kV double circuit
Design Vertical tower
Date 01/03/13 01/03/13 01/03/13 04/03/13 04/03/13 04/03/13 09/03/13 09/03/13 09/03/13
Time 12:27 14:42 15:51 11:41 13:33 14:13 10:58 11:46 12:52 Load (MVA) 32 30 30 33 31 32 25 27 30
Dist. (m)* Magnetic field (µT)
0 1.71 1.69 1.59 1.72 1.51 1.44 1.22 1.60 1.72
5 1.32 1.22 1.11 1.21 1.24 1.19 0.91 1.01 1.19
10 0.93 0.88 0.78 0.91 0.94 0.94 0.74 0.75 0.86
15 0.64 0.57 0.55 0.63 0.66 0.65 0.55 0.56 0.61
20 0.47 0.41 0.38 0.46 0.49 0.49 0.42 0.42 0.39
25 0.34 0.31 0.28 0.34 0.37 0.36 0.31 0.32 0.31
50 0.11 0.10 0.09 0.12 0.12 0.13 0.12 0.11 0.09
75 0.06 0.06 0.06 0.06 0.06 0.06 0.06 0.06 0.06
* Space constraints permitted measurement only to 75 m
Table 7.9: Measured magnetic field for 110 kV double circuit overhead line circuit 2 [see Figure
7.9]
Name Maynooth → Ryebrook
Location Maynooth
Type 110 kV double circuit
Design Vertical tower
Date 01/03/13 01/03/13 01/03/13 04/03/13 04/03/13 04/03/13 09/03/13 09/03/13 09/03/13
Time 12:18 14:30 15:22 11:32 13:23 14:06 10:49 11:40 14:50
Load (MVA) 10 17 18 17 19 19 35 29 21
Dist. (m) Magnetic field (µT)
0 1.76 1.64 1.67 1.68 1.71 1.59 1.99 1.69 1.78
5 1.29 1.26 1.34 1.39 1.36 1.29 1.56 1.38 1.42
10 0.84 0.78 0.82 0.89 0.88 0.92 1.14 0.90 0.92
15 0.54 0.49 0.51 0.57 0.56 0.62 0.60 0.58 0.61
20 0.37 0.33 0.36 0.42 0.38 0.40 0.42 0.39 0.43
25 0.26 0.24 0.24 0.28 0.27 0.30 0.31 0.27 0.32
50 0.10 0.08 0.09 0.13 0.09 0.11 0.11 0.10 0.10
75 0.06 0.06 0.06 0.07 0.07 0.06 0.07 0.06 0.07
100 0.03 0.04 0.04 0.03 0.03 0.03 0.05 0.04 0.04
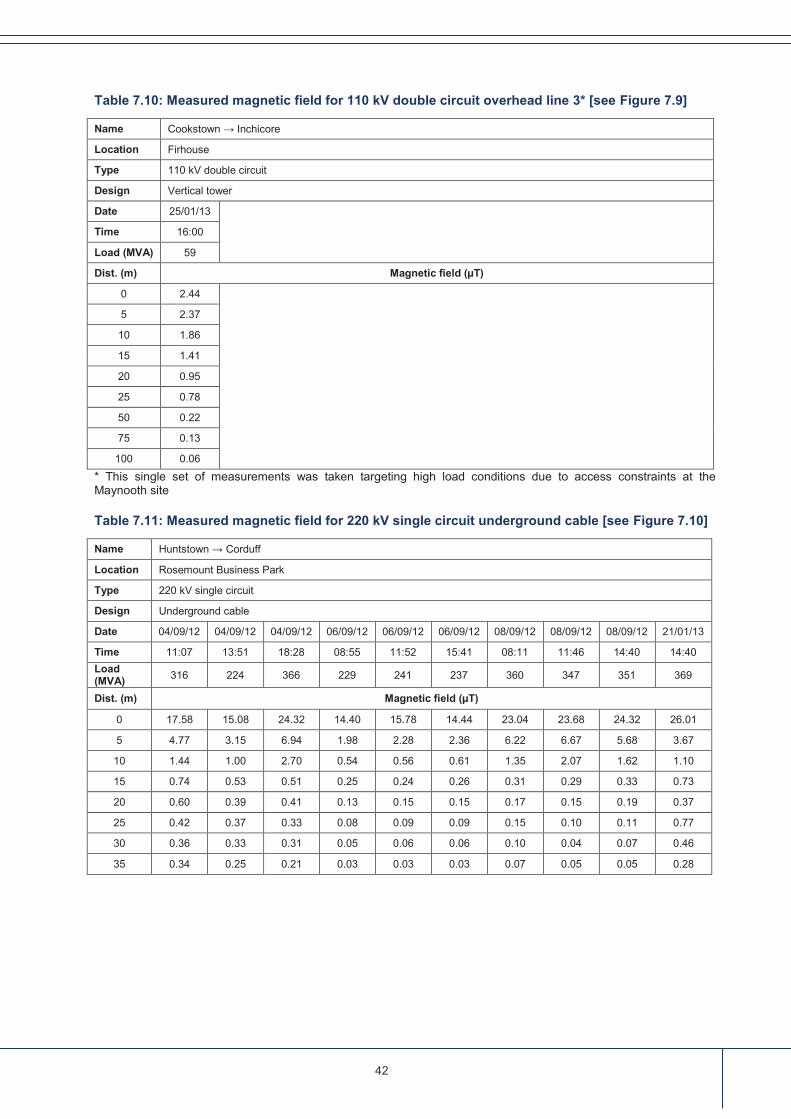
42
rpsgroup.com
Table 7.10: Measured magnetic field for 110 kV double circuit overhead line 3* [see Figure 7.9]
Name Cookstown → Inchicore
Location Firhouse
Type 110 kV double circuit
Design Vertical tower
Date 25/01/13 Time 16:00
Load (MVA) 59
Dist. (m) Magnetic field (µT)
0 2.44 5 2.37
10 1.86
15 1.41
20 0.95
25 0.78
50 0.22
75 0.13
100 0.06
* This single set of measurements was taken targeting high load conditions due to access constraints at the Maynooth site
Table 7.11: Measured magnetic field for 220 kV single circuit underground cable [see Figure 7.10]
Name Huntstown → Corduff
Location Rosemount Business Park
Type 220 kV single circuit
Design Underground cable
Date 04/09/12 04/09/12 04/09/12 06/09/12 06/09/12 06/09/12 08/09/12 08/09/12 08/09/12 21/01/13
Time 11:07 13:51 18:28 08:55 11:52 15:41 08:11 11:46 14:40 14:40 Load (MVA) 316 224 366 229 241 237 360 347 351 369
Dist. (m) Magnetic field (µT)
0 17.58 15.08 24.32 14.40 15.78 14.44 23.04 23.68 24.32 26.01
5 4.77 3.15 6.94 1.98 2.28 2.36 6.22 6.67 5.68 3.67
10 1.44 1.00 2.70 0.54 0.56 0.61 1.35 2.07 1.62 1.10
15 0.74 0.53 0.51 0.25 0.24 0.26 0.31 0.29 0.33 0.73
20 0.60 0.39 0.41 0.13 0.15 0.15 0.17 0.15 0.19 0.37
25 0.42 0.37 0.33 0.08 0.09 0.09 0.15 0.10 0.11 0.77
30 0.36 0.33 0.31 0.05 0.06 0.06 0.10 0.04 0.07 0.46
35 0.34 0.25 0.21 0.03 0.03 0.03 0.07 0.05 0.05 0.28

43
rpsgroup.com
Table 7.12: Measured magnetic field for 110 kV single circuit underground cable [see Figure 7.11]
Name Finglas → Dardistown
Location Finglas
Type 110 kV single circuit
Design Underground cable
Date 04/09/12 04/09/12 04/09/12 06/09/12 06/09/12 06/09/12 08/09/12 08/09/12 08/09/12
Time 10:45 13:37 18:47 08:30 12:05 16:01 11:35 14:20 18:01 Load (MVA) 22 22 22 21 22 22 22 21 21
Dist. (m) Magnetic field (µT)
0 1.98 2.12 2.28 2.12 2.16 2.32 2.22 2.12 2.08
2 1.04 1.52 1.32 1.26 1.26 1.24 1.48 1.30 1.26
4 0.54 0.66 0.56 0.51 0.56 0.58 0.67 0.52 0.55
6 0.20 0.32 0.30 0.29 0.31 0.31 0.35 0.32 0.32
8 0.16 0.19 0.18 0.17 0.22 0.18 0.23 0.22 0.22
10 0.12 0.13 0.14 0.12 0.12 0.13 0.15 0.14 0.15
12 0.09 0.09 0.10 0.08 0.09 0.09 0.10 0.11 0.10
Table 7.13: Measured magnetic field for 400/220 kV substation [see Figure 7.12]
Name Dunstown 400/220 kV substation
Date 03/09/12 03/09/12 03/09/12 05/09/12 05/09/12 05/09/12 09/09/12 09/09/12 09/09/12 21/01/13
Time 10:45 14:17 16:52 09:42 12:27 15:26 10:45 13:01 16:17 15:30 Load (MVA) 176 197 248 181 234 235 233 162 115 281
Dist. (m) Magnetic field (µT)
0 0.12 0.11 0.10 0.13 0.11 0.12 0.11 0.11 0.10 0.07
5 0.09 0.09 0.08 0.09 0.10 0.09 0.09 0.09 0.09 0.11
10 0.06 0.07 0.07 0.07 0.07 0.06 0.07 0.07 0.07 0.11
15 0.05 0.06 0.05 0.06 0.06 0.05 0.06 0.06 0.06 0.10

44
rpsgroup.com
Table 7.14: Measured magnetic field for 220/110 kV substation [see Figure 7.13]
Name Maynooth 220/110 kV substation
Date 01/03/13 01/03/13 01/03/13 04/03/13 04/03/13 04/03/13 09/03/13 09/03/13 09/03/13 21/01/13
Time 11:45 14:25 15:21 11:21 13:16 14:02 10:44 11:38 12:32 11:00 Load (MVA) 135 135 134 141 143 138 122 123 122 154
Dist. (m) Magnetic field (µT)
0 0.10 0.11 0.09 0.10 0.10 0.09 0.10 0.12 0.10 0.00
5 0.69 0.70 0.69 0.69 0.70 0.64 0.72 0.69 0.69 0.51
10 0.57 0.57 0.54 0.57 0.57 0.57 0.57 0.56 0.57 0.44
15 0.50 0.49 0.49 0.51 0.49 0.49 0.49 0.49 0.49 0.36
20 0.44 0.44 0.44 0.44 0.44 0.44 0.42 0.44 0.44 0.29
25 0.38 0.41 0.38 0.38 0.38 0.38 0.38 0.38 0.38 n/a
30 0.34 0.34 0.36 0.34 0.29 0.34 0.34 0.34 0.34 n/a
Table 7.15: Measured magnetic field for 110 kV substation [see Figure 7.14]
Name Kilteel 110 kV substation
Date 04/09/12 04/09/12 04/09/12 06/09/12 06/09/12 06/09/12 08/09/12 08/09/12 08/09/12 21/01/13
Time 09:00 12:26 16:41 10:20 12:40 17:10 11:15 13:50 17:25 13:10 Load (MVA) 13 14 14 15 14 14 11 10 10 15
Dist. (m) Magnetic field (µT)
0 0.05 0.06 0.06 0.05 0.05 0.06 0.06 0.06 0.06 0.07
5 0.03 0.05 0.04 0.03 0.03 0.05 0.05 0.05 0.05 0.07
10 0.03 0.04 0.03 0.03 0.03 0.04 0.04 0.04 0.04 0.07
15 0.03 0.03 0.03 0.02 0.02 0.03 0.03 0.03 0.03 0.07
20 0.03 0.03 0.03 0.02 0.02 0.03 0.03 0.03 0.03 0.07
25 0.02 0.02 0.02 0.02 0.02 0.02 0.02 0.02 0.02 0.06
50 0.01 0.01 0.02 0.01 0.01 0.01 0.01 0.01 0.01 0.06

45
rpsgroup.com
Results graphs
7.2 Figure 7.1 to Figure 7.14 show the measured magnetic field strength plotted against distance for
each of the high-voltage transmission infrastructure items surveyed. For double-circuit overhead
lines, the load at the time of measurement is given for both circuits on the graphs of
measurements to each side of the overhead line. The measured magnetic field strength is
influenced by the load on both circuits.
7.3 Variation in the results measured at similar loads is due to factors outlined in the measurement
variation discussion in Section 6.
Figure 7.1: Measured magnetic field plotted against distance for 400 kV single circuit overhead
line (double circuit tower) [see Table 7.1]
0.00
0.50
1.00
1.50
2.00
2.50
3.00
3.50
4.00
4.50
5.00
0 10 20 30 40 50 60 70 80 90 100
Mag
netic
fiel
d (µ
T)
Distance (m)
286
256
247
238
223
201
199
181
152
121
Measurement
series load (MVA)

46
rpsgroup.com
Figure 7.2: Measured magnetic field plotted against distance for 400 kV single circuit overhead
line (horizontal tower configuration) [see Table 7.2]
Figure 7.3: Measured magnetic field plotted against distance for 220 kV single circuit overhead
line 1 [see Table 7.3]
0.00
0.50
1.00
1.50
2.00
2.50
3.00
3.50
4.00
4.50
5.00
0 10 20 30 40 50 60 70 80 90 100
Mag
netic
fiel
d (µ
T)
Distance (m)
280
255
243
237
236
221
212
196
177
166
0.00
0.50
1.00
1.50
2.00
2.50
3.00
3.50
4.00
4.50
5.00
0 10 20 30 40 50 60 70 80 90 100
Mag
netic
fiel
d (µ
T)
Distance (m)
81
73
59
55
49
42
42
35
20
18
Measurement
series load (MVA)
Measurement
series load (MVA)
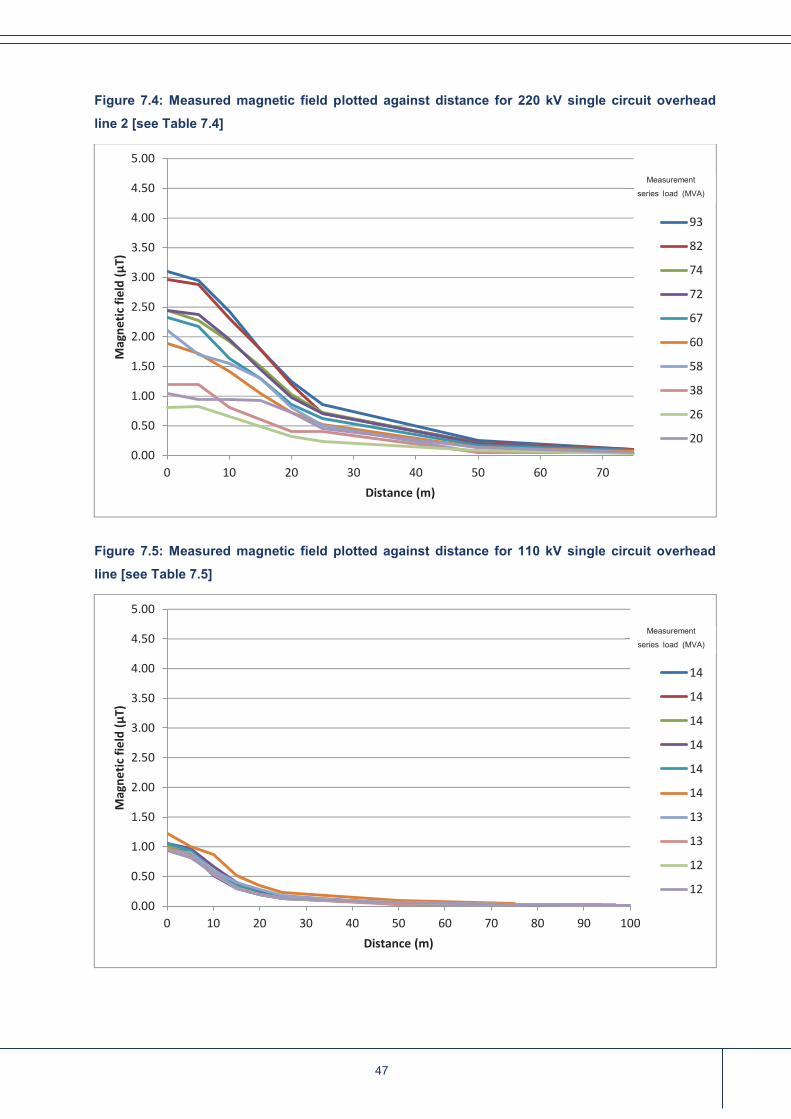
47
rpsgroup.com
Figure 7.4: Measured magnetic field plotted against distance for 220 kV single circuit overhead
line 2 [see Table 7.4]
Figure 7.5: Measured magnetic field plotted against distance for 110 kV single circuit overhead
line [see Table 7.5]
0.00
0.50
1.00
1.50
2.00
2.50
3.00
3.50
4.00
4.50
5.00
0 10 20 30 40 50 60 70
Mag
netic
fiel
d (µ
T)
Distance (m)
93
82
74
72
67
60
58
38
26
20
0.00
0.50
1.00
1.50
2.00
2.50
3.00
3.50
4.00
4.50
5.00
0 10 20 30 40 50 60 70 80 90 100
Mag
netic
fiel
d (µ
T)
Distance (m)
14
14
14
14
14
14
13
13
12
12
Measurement
series load (MVA)
Measurement
series load (MVA)

48
rpsgroup.com
Figure 7.6: Measured magnetic field plotted against distance for 220 kV double circuit overhead line circuit 1 [see Table 7.6]
Note: the magnetic field measured to each side of this overhead line was also influenced by the load on the circuit on the other side of the line. The measured magnetic field on each side of the overhead line is shown in this figure and Figure 7.7. In each case, the loads on the circuit on the opposite site to the measurements are shown in brackets.
Figure 7.7: Measured magnetic field plotted against distance for 220 kV double circuit overhead line circuit 2 [see Table 7.7]
Note: the magnetic field measured to each side of this overhead line was also influenced by the load on the circuit on the other side of the line. The measured magnetic field on each side of the overhead line is shown in this figure and Figure 7.6. In each case, the loads on the circuit on the opposite site to the measurements are shown in brackets.
0.00
0.50
1.00
1.50
2.00
2.50
3.00
3.50
4.00
4.50
5.00
0 20 40 60 80 100
Mag
netic
fiel
d (µ
T)
Distance (m)
237
206
204
173
171
168
148
77
66
64
0.00
0.50
1.00
1.50
2.00
2.50
3.00
3.50
4.00
4.50
5.00
0 20 40 60 80 100
Mag
netic
fiel
d (µ
T)
Distance (m)
109
108
108
47
40
39
32
17
16
10
Measurement series load (MVA)
Circuit 2 Circuit 1
Measurement series load (MVA)
Circuit 1 Circuit 2
( )
( )
( )
( )
( )
( )
( )
( )
( )
( )
( )
( )
( )
( )
( )
( )
( )
( )
( )
( )
Double circuit overhead line. Side measured in red.
Double circuit overhead line. Side measured in red.

49
rpsgroup.com
Figure 7.8: Measured magnetic field plotted against distance for 110 kV double circuit overhead line circuit 1 [see Table 7.8]
Note: the magnetic field measured to each side of this overhead line was also influenced by the load on the circuit on the other side of the line. The measured magnetic field on each side of the overhead line is shown in this figure and Figure 7.9. In each case, the loads on the circuit on the opposite site to the measurements are shown in brackets.
Figure 7.9: Measured magnetic field plotted against distance for 110 kV double circuit overhead line circuit 2 [see Table 7.9 and Table 7.10]
Note A: the magnetic field measured to each side of this overhead line was also influenced by the load on the circuit on the other side of the line. The measured magnetic field on each side of the overhead line is shown in this figure and Figure 7.8. In each case, the loads on the circuit on the opposite site to the measurements are shown in brackets. Note B: measurements at 59 MVA load taken for CookstownInchicore overhead line.
0.00
0.50
1.00
1.50
2.00
2.50
3.00
3.50
4.00
4.50
5.00
0 10 20 30 40 50 60 70 80
Mag
netic
fiel
d (µ
T)
Distance (m)
33
32
32
31
30
30
30
27
25
0.00
0.50
1.00
1.50
2.00
2.50
3.00
3.50
4.00
4.50
5.00
0 10 20 30 40 50 60 70 80
Mag
netic
fiel
d (µ
T)
Distance (m)
59
35
29
21
19
19
18
17
17
10
( )
( )
( )
( )
( )
( )
( )
( )
( )
( )
( )
( )
( )
( )
( )
( )
( )
( )
Measurement series load (MVA)
Circuit 2 Circuit 1
Measurement series load (MVA)
Circuit 1 Circuit 2
Double circuit overhead line. Side measured in red.
Double circuit overhead line. Side measured in red.
B

50
rpsgroup.com
Figure 7.10: Measured magnetic field plotted against distance for 220 kV single circuit
underground cable [see Table 7.11]
Note: the graph scale is greater in this plot than all others in this section (due to results magnitude)
Figure 7.11: Measured magnetic field plotted against distance for 110 kV single circuit
underground cable [see Table 7.12]
0.00
5.00
10.00
15.00
20.00
25.00
30.00
0 5 10 15 20 25 30 35
Mag
netic
fiel
d (µ
T)
Distance (m)
369
366
360
351
347
316
241
237
229
224
0.00
0.50
1.00
1.50
2.00
2.50
3.00
3.50
4.00
4.50
5.00
0 2 4 6 8 10 12
Mag
netic
fiel
d (T
)
Distance (m)
22
22
22
22
22
22
21
21
21
Measurement
series load (MVA)
Measurement
series load (MVA)

51
rpsgroup.com
Figure 7.12: Measured magnetic field plotted against distance for 400/220 kV substation [see
Table 7.13]
Figure 7.13: Measured magnetic field plotted against distance for 220/110 kV substation [seeTable
7.14]
0.00
0.50
1.00
1.50
2.00
2.50
3.00
3.50
4.00
4.50
5.00
0 2 4 6 8 10 12 14
Mag
netic
fiel
d (µ
T)
Distance (m)
281
248
235
234
233
197
181
176
162
115
0.00
0.50
1.00
1.50
2.00
2.50
3.00
3.50
4.00
4.50
5.00
0 5 10 15 20 25 30
Mag
netic
fiel
d (µ
T)
Distance (m)
154
143
141
138
135
135
134
123
122
122
Measurement
series load (MVA)
Measurement
series load (MVA)

52
rpsgroup.com
Figure 7.14: Measured magnetic field plotted against distance for 110 kV substation [see Table
7.15]
0
0.5
1
1.5
2
2.5
3
3.5
4
4.5
5
0 5 10 15 20 25 30 35 40 45 50
Mag
netic
fiel
d (µ
T)
Distance (m)
15
15
14
14
14
14
13
11
10
10
Measurement
series load (MVA)

53
rpsgroup.com
Discussion
7.4 The maximum magnetic field strength recorded among the overhead power lines was 4.97 µT for
the 220 kV double-circuit overhead line, with a maximum of 26.01 µT recorded for the 220 kV
underground cable and 0.72 µT for the 220/110 kV substation. All measured results fall well
below the 2010 ICNIRP guideline reference level for general public exposure of 200 µT. As
expected, the magnetic field strength recorded for all types of overhead power lines and
underground power cables under all load conditions falls rapidly with distance from their
centrelines.
7.5 Magnetic field strengths measured directly under overhead lines vary across those surveyed,
dependent on load, from 0.68 µT to the maximum of 4.97 µT noted. Although the peak magnetic
field strength from the 220 kV underground cable is considerably greater than any overhead
lines, it also decreases more rapidly with distance from the cable, reaching a similar level to
overhead lines at 5 m – 10 m distance. Peak magnetic field strength from the underground cables
is greater than overhead lines at similar load due to the smaller distance to the measurement
point, as the burial depth of cables is less than the overhead clearance of overhead lines.
However, the magnetic field strength decreases more rapidly with lateral distance from the
underground cables than overhead lines for the same reason: a small change in distance laterally
affects the straight-line distance from the underground cable proportionally more than the
straight-line distance from the overhead line conductor, as the initial distance is smaller.
7.6 The magnetic field at the 400 kV and 110 kV substation perimeters is very weak (<0.2 µT) and
has a limited trend for decrease with distance, suggesting a contribution to the measured field
from overhead lines around the substations. The magnetic field measured at the 220/110 kV
substation shows a peak of up to 0.72 µT consistently at the 5 m distance interval (suggesting
influence from a nearby overhead line), decreasing with distance thereafter, although the field
strength at the perimeter is around 0.1 µT, similar to the other substations.
7.7 As described in the approach/methodology section, the vector nature of EMF and the rapid
decrease in field strength with distance means that in general, magnetic field exposure at a given
point is likely to be dominated by a single proximate source. Non-standard conditions, i.e. where
several powerlines or other items of high-voltage transmission infrastructure are in close
proximity, are therefore considered unlikely to lead to significantly different cumulative effects to
the measurements of individual items. Nevertheless, the possibility of greater field strength was
investigated with a series of transects under overhead lines that are in close proximity (<100m),
and a further measurement was taken where the downleads (conductors from the final
transmission tower into the substation) of the Moneypoint-Dunstown 400 kV line cross the closest
publically-accessible point at the Dunstown substation into the substation busbar. Transects were
conducted in October 2011 using a Spectran NF-5035 meter with display hold function, to
capture the highest magnetic field strength recorded while traversing under and between the
lines.

54
rpsgroup.com
7.8 The maximum magnetic field strength recorded where three 220 kV overhead lines stand in close
proximity exiting the Dunstown substation was 2.47 µT, directly under the outer phase of one line,
with lower readings recorded between them. A transect under two 220 kV overhead lines exiting
the Maynooth substation similarly recorded maximum magnetic field strengths of 1.60 µT and
3.18 µT directly under each line, with lower magnetic field strengths throughout the zone of
overlapping influence between them. Finally, the maximum magnetic field strength recorded
where the 400 kV overhead line downleads cross into the substation was 1.91 µT, comparable to
the reading under other parts of the line.
7.9 These results indicate that, as anticipated, the greatest magnetic field strength experienced at
ground level would be from the proximate overhead line. Greater cumulative field strengths in
between lines in close proximity was not found.
Annual load scaling
7.10 The series of measurements at different loads for each infrastructure item allows a mean
magnetic field strength per MVA (unit load) to be calculated for each distance interval. Combined
with hourly records of load for each infrastructure item from one year encompassing the survey
periods (April 2012 – March 2013 inclusive), this allows the typical magnetic field (based on mean
or median load) and magnetic field at high load (top 95th percentile) to be calculated.
7.11 The term „95th percentile‟ means that of all of the loads recorded (at hourly or 15 minute intervals)
during the one year period for a particular overhead line or underground cable, 95% were lower
than or equal to the 95th percentile load value, and 5% were greater than it. It has been calculated
by first sorting the loads into rank order, and determining the rank of the 95th percentile using rank
= 0.95 x the number of load records and then applying linear interpolation to determine the exact
load where the rank is not an integer.
7.12 The results are presented for several distance intervals in Table 7.16 to Table 7.22. Variation
around the mean magnetic field per MVA is indicated with the calculated standard deviation,
discussed further in the following section.
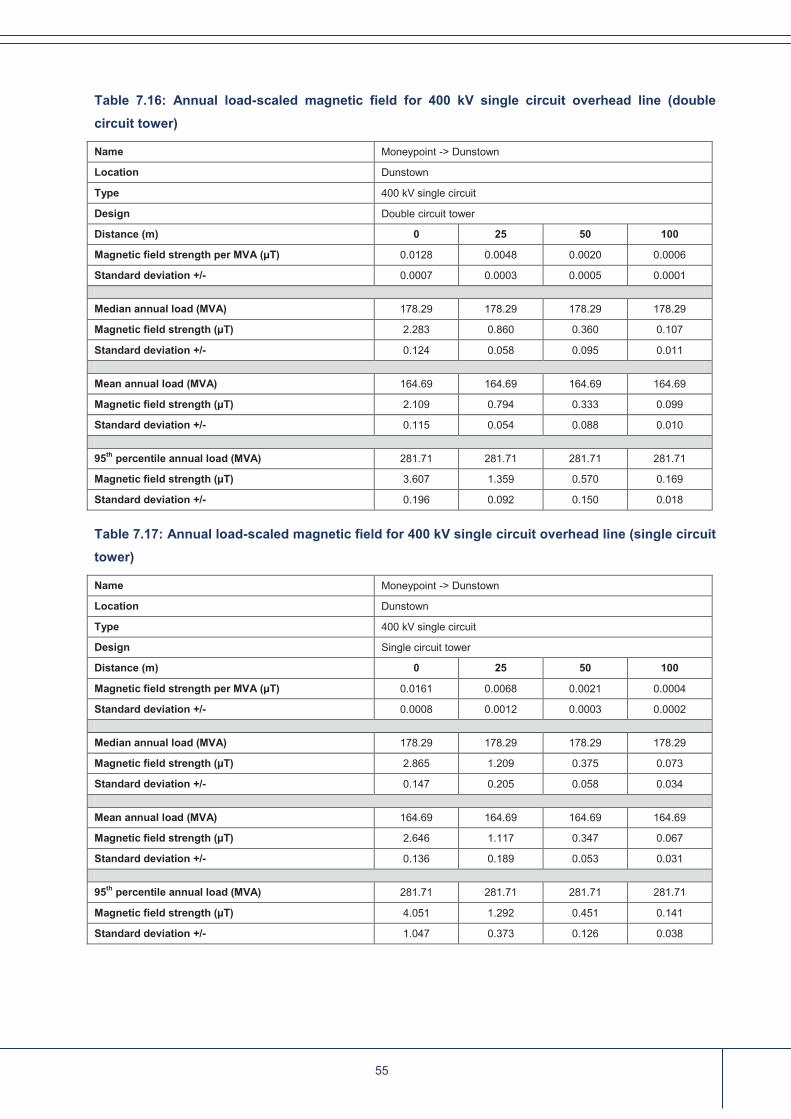
55
rpsgroup.com
Table 7.16: Annual load-scaled magnetic field for 400 kV single circuit overhead line (double
circuit tower)
Name Moneypoint -> Dunstown
Location Dunstown
Type 400 kV single circuit
Design Double circuit tower
Distance (m) 0 25 50 100
Magnetic field strength per MVA (µT) 0.0128 0.0048 0.0020 0.0006
Standard deviation +/- 0.0007 0.0003 0.0005 0.0001 Median annual load (MVA) 178.29 178.29 178.29 178.29
Magnetic field strength (µT) 2.283 0.860 0.360 0.107
Standard deviation +/- 0.124 0.058 0.095 0.011
Mean annual load (MVA) 164.69 164.69 164.69 164.69
Magnetic field strength (µT) 2.109 0.794 0.333 0.099
Standard deviation +/- 0.115 0.054 0.088 0.010
95th percentile annual load (MVA) 281.71 281.71 281.71 281.71
Magnetic field strength (µT) 3.607 1.359 0.570 0.169
Standard deviation +/- 0.196 0.092 0.150 0.018
Table 7.17: Annual load-scaled magnetic field for 400 kV single circuit overhead line (single circuit
tower)
Name Moneypoint -> Dunstown
Location Dunstown
Type 400 kV single circuit
Design Single circuit tower
Distance (m) 0 25 50 100
Magnetic field strength per MVA (µT) 0.0161 0.0068 0.0021 0.0004
Standard deviation +/- 0.0008 0.0012 0.0003 0.0002
Median annual load (MVA) 178.29 178.29 178.29 178.29
Magnetic field strength (µT) 2.865 1.209 0.375 0.073
Standard deviation +/- 0.147 0.205 0.058 0.034
Mean annual load (MVA) 164.69 164.69 164.69 164.69
Magnetic field strength (µT) 2.646 1.117 0.347 0.067
Standard deviation +/- 0.136 0.189 0.053 0.031
95th percentile annual load (MVA) 281.71 281.71 281.71 281.71
Magnetic field strength (µT) 4.051 1.292 0.451 0.141
Standard deviation +/- 1.047 0.373 0.126 0.038

56
rpsgroup.com
Table 7.18: Annual load-scaled magnetic field for 220 kV single circuit overhead line 1
Name Dunstown -> Turlough Hill
Location Dunstown
Type 220 kV single circuit
Design Horizontal tower
Distance (m) 0 25 50 100
Magnetic field strength per MVA (µT) 0.0424 0.0102 0.0032 0.0004
Standard deviation +/- 0.0030 0.0037 0.0017 0.0002
Median annual load (MVA) 33.54 33.54 33.54 33.54
Magnetic field strength (µT) 1.421 0.343 0.108 0.013
Standard deviation +/- 0.100 0.125 0.058 0.005
Mean annual load (MVA) 52.54 52.54 52.54 52.54
Magnetic field strength (µT) 2.225 0.538 0.170 0.021
Standard deviation +/- 0.157 0.196 0.091 0.008
95th percentile annual load (MVA) 166.22 166.22 166.22 166.22
Magnetic field strength (µT) 7.041 1.702 0.537 0.066
Standard deviation +/- 0.498 0.621 0.289 0.027
Table 7.19: Annual load-scaled magnetic field for 220 kV single circuit overhead line 2
Name Dunstown -> Maynooth
Location Dunstown
Type 220 kV single circuit
Design Horizontal tower
Distance (m) 0 25 50 75
Magnetic field strength per MVA (µT) 0.0354 0.0106 0.0028 0.0014
Standard deviation +/- 0.0063 0.0044 0.0015 0.0006
Median annual load (MVA) 36.75 36.75 36.75 36.75
Magnetic field strength (µT) 1.300 0.391 0.102 0.050
Standard deviation +/- 0.231 0.161 0.055 0.022
Mean annual load (MVA) 42.95 42.95 42.95 42.95
Magnetic field strength (µT) 1.519 0.456 0.120 0.058
Standard deviation +/- 0.270 0.189 0.065 0.025
95th percentile annual load (MVA) 99.02 99.02 99.02 99.02
Magnetic field strength (µT) 3.502 1.052 0.276 0.135
Standard deviation +/- 0.623 0.435 0.149 0.059

57
rpsgroup.com
Table 7.20: Annual load-scaled magnetic field for 110 kV single circuit overhead line
Name Kilteel -> Maynooth
Location Kilteel
Type 110 kV single circuit
Design Horizontal wooden pole
Distance (m) 0 25 50 100
Magnetic field strength per MVA (µT) 0.0754 0.0110 0.0035 0.0001
Standard deviation +/- 0.0048 0.0022 0.0014 0.0000
Median annual load (MVA) 14.09 14.09 14.09 14.09
Magnetic field strength (µT) 1.063 0.155 0.050 0.001
Standard deviation +/- 0.068 0.031 0.020 0.000
Mean annual load (MVA) 15.89 15.89 15.89 15.89
Magnetic field strength (µT) 1.198 0.175 0.056 0.001
Standard deviation +/- 0.077 0.035 0.022 0.000
95th percentile annual load (MVA) 33.30 33.30 33.30 33.30
Magnetic field strength (µT) 2.512 0.367 0.118 0.002
Standard deviation +/- 0.161 0.074 0.047 0.001
Table 7.21: Annual load-scaled magnetic field for 220 kV underground cable
Name Corduff -> Huntstown
Location Rosemount Business Park
Type 220 kV single circuit
Design Underground cable
Distance (m) 0 10 20 30
Magnetic field strength per MVA (µT) 0.0651 0.0041 0.0009 0.0006
Standard deviation +/- 0.0044 0.0017 0.0005 0.0005 Median annual load (MVA) 227.18 227.18 227.18 227.18
Magnetic field strength (µT) 14.783 0.930 0.205 0.137
Standard deviation +/- 1.006 0.377 0.121 0.118 Mean annual load (MVA) 240.49 240.49 240.49 240.49
Magnetic field strength (µT) 15.649 0.985 0.217 0.145
Standard deviation +/- 1.065 0.399 0.128 0.125
95th percentile annual load (MVA) 388.40 388.40 388.40 388.40
Magnetic field strength (µT) 25.274 1.591 0.351 0.234
Standard deviation +/- 1.720 0.644 0.207 0.201

58
rpsgroup.com
Table 7.22: Annual load-scaled magnetic field for 110 kV underground cable
Name Finglas -> Dardistown
Location Finglas
Type 110 kV single circuit
Design Underground cable
Distance (m) 0 4 8 12
Magnetic field strength per MVA (µT) 0.0995 0.0264 0.0091 0.0044
Standard deviation +/- 0.0045 0.0023 0.0013 0.0004
Median annual load (MVA) 20.42 20.42 20.42 20.42
Magnetic field strength (µT) 2.032 0.539 0.186 0.089
Standard deviation +/- 0.092 0.047 0.026 0.009
Mean annual load (MVA) 19.65 19.65 19.65 19.65
Magnetic field strength (µT) 1.955 0.519 0.179 0.086
Standard deviation +/- 0.088 0.045 0.025 0.009
95th percentile annual load (MVA) 25.76 25.76 25.76 25.76
Magnetic field strength (µT) 2.563 0.680 0.234 0.112
Standard deviation +/- 0.115 0.059 0.032 0.011

59
rpsgroup.com
Results consistency
7.13 Standardising the magnetic field measurements against load, as in the above tables, also allows
the level of consistency in the measurement results to be investigated. Magnetic field strength is
directly dependent upon current and should therefore vary linearly at a given distance with
changes in power load (as the voltage on each infrastructure item is approximately fixed).
7.14 The standard deviation in the results is typically <20% for measurements closer to the
centrelines, but up to around 40-50% for the measurements at the greatest distances. However, it
is small (1 x 10⁻⁵ to 9 x 10⁻³ µT) in absolute terms per MVA at these distances.
7.15 This indicates good consistency for many measurement results recorded at the higher loads,
close to the line/cable, but less so where the magnetic field was weaker at greater distances.
However, the variation in measurements of the weaker fields at the greatest distances (where the
standard deviation in percentage terms is typically greatest) would translate into absolute
apparent errors in magnetic field strength of one standard deviation under typical loads in the
order of <0.04 µT for overhead lines and <0.2 µT for underground cables.
7.16 The magnetic field measured on each side of the 220 kV and 110 kV double circuit overhead
lines is influenced by the load on both the circuits (both sides of the line). Standardising
measurements per-MVA and scaling on that basis would not account for the relative influence of
the load on each individual circuit (with the load on the circuit on the same side as the
measurements having a greater influence, particularly at closer distances) or for potential field
cancellation between the circuits (e.g. due to transposed phasing). Results scaling to annual
loads has therefore not been undertaken for the double circuit overhead lines.
7.17 In general it should be noted that the use of variation on a per-MVA basis as a measure of
possible non-systematic error in the results depends upon the load data being accurate for the
exact time the measurements were taken. In reality, load data given in real time were recorded at
the start of the measurement series (potentially varying while it was undertaken) and were
rounded to 1 MVA. Load data from annual records were available mainly at hourly intervals.
Unrecorded variance in actual load may be a cause of some apparent inconsistency in the data
when standardised against load, which does not reflect genuine error in the measurements at a
particular time.

60
rpsgroup.com
8 Electric field results
8.1 Table 8.1 to Table 8.13 show the electric field strength measured for each of the high-voltage
transmission infrastructure items surveyed, with the power load at the time of each measurement.
Variation in the results measured at similar loads is due to factors outlined in the measurement
variation discussion in Section 6.
Results tables
Table 8.1: Measured electric field for 400 kV single circuit overhead line (double circuit tower) [see
Figure 8.1]
Name Moneypoint → Dunstown
Location Dunstown
Type 400 kV single circuit
Design Double circuit tower
Date 03/09/12 03/09/12 03/09/12 05/09/12 05/09/12 05/09/12 09/09/12 09/09/12 09/09/12 21/01/13
Time 10:35 14:02 16:41 09:30 12:13 15:18 10:30 12:47 16:02 14:40 Load (MVA) 181 201 256 199 238 247 223 152 121 286
Dist. (m) Electric field (kV m-1)
0 3.90 3.60 3.42 3.48 3.15 3.74 4.08 3.96 3.10 4.72
5 3.12 3.43 2.99 2.74 2.96 3.00 3.55 3.43 2.86 4.44
10 1.93 1.51 1.81 1.73 1.78 1.78 2.20 2.16 2.02 3.84
15 1.10 0.82 0.92 0.95 1.00 0.96 1.21 1.12 0.99 1.83
20 0.51 0.70 0.58 0.68 0.48 0.47 0.91 0.77 0.53 0.98
25 0.31 0.40 0.32 0.42 0.28 0.30 0.65 0.49 0.33 0.71
50 0.21 0.22 0.16 0.22 0.16 0.15 0.28 0.20 0.15 0.29
75 0.11 0.11 0.11 0.14 0.09 0.11 0.15 0.10 0.09 0.16
100 0.07 0.07 0.07 0.10 0.06 0.07 0.15 0.06 0.06 0.15

61
rpsgroup.com
Table 8.2: Measured electric field for 400 kV single circuit overhead line (horizontal tower
configuration) [see Figure 8.2]
Name Moneypoint → Dunstown
Location The Curragh
Type 400 kV single circuit
Design Single circuit tower
Date 03/09/12 03/09/12 03/09/12 05/09/12 05/09/12 05/09/12 09/09/12 09/09/12 09/09/12 21/01/13
Time 12:58 15:31 18:20 11:23 14:30 16:44 09:30 12:01 15:16 13:30 Load (MVA) 196 255 236 212 243 237 166 177 221 280
Dist. (m) Electric field (kV m-1)
0 1.43 1.46 2.16 1.25 1.26 1.32 2.76 2.51 1.32 2.85
5 1.91 1.77 2.45 1.57 1.62 1.74 3.20 2.93 1.60 3.18
10 2.89 2.74 3.59 2.51 2.53 2.72 4.15 3.89 2.42 3.6
15 2.92 2.95 3.81 2.76 2.76 2.70 4.31 4.19 2.74 3.74
20 2.29 2.29 2.92 2.28 2.23 2.15 3.40 3.20 2.24 3.63
25 1.56 1.62 2.11 1.58 1.53 1.54 2.63 2.40 1.54 3.63
50 0.28 0.30 0.43 0.30 0.29 0.28 0.98 0.84 0.28 0.73
75 0.10 0.10 0.13 0.12 0.13 0.13 0.61 0.44 0.10 0.43
100 0.01 0.04 0.05 0.04 0.04 0.04 0.24 0.16 0.06 0.15
Table 8.3: Measured electric field for 220 kV single circuit overhead line 1 [see Figure 8.3]
Name Dunstown → Turlough Hill
Location Dunstown
Type 220 kV single circuit
Design Horizontal tower
Date 03/09/12 03/09/12 03/09/12 05/09/12 05/09/12 05/09/12 09/09/12 09/09/12 09/09/12 21/01/13
Time 11:10 14:30 17:10 10:23 12:50 15:58 11:00 13:10 16:25 15:00 Load (MVA) 35 49 20 42 81 73 55 59 18 42
Dist. (m) Electric field (kV m-1)
0 1.19 1.11 1.14 0.87 0.93 1.02 1.09 0.74 0.69 2.85
5 1.75 1.49 1.83 1.38 1.36 1.52 1.96 1.84 1.59 2.67
10 2.14 1.88 2.04 1.64 1.64 1.65 2.22 2.01 1.47 2.49
15 1.73 1.73 1.32 1.35 1.35 1.15 1.80 1.29 0.98 2.20
20 1.14 1.09 0.84 0.68 0.67 0.72 1.23 0.75 0.60 1.67
25 0.60 0.56 0.53 0.46 0.83 0.41 0.79 0.52 0.36 1.12
50 0.11 0.37 0.09 0.09 0.09 0.08 0.16 0.10 0.06 0.34
75 0.04 0.11 0.03 0.03 0.03 0.03 0.05 0.04 0.03 0.09
100 0.01 0.04 0.01 0.01 0.01 0.01 0.01 0.01 0.01 n/a

62
rpsgroup.com
Table 8.4: Measured electric field for 220 kV single circuit overhead line 2 [see Figure 8.4]
Name Dunstown → Maynooth
Location Dunstown
Type 220 kV single circuit
Design Horizontal tower
Date 03/09/12 03/09/12 03/09/12 05/09/12 05/09/12 05/09/12 09/09/12 09/09/12 09/09/12 21/01/13
Time 12:00 15:00 17:30 10:45 13:12 16:08 11:15 13:30 16:43 15:15 Load (MVA) 82 38 58 93 72 67 60 74 26 20
Dist. (m)* Electric field (kV m-1)
0 0.76 0.71 0.72 0.65 0.70 0.72 1.11 1.09 1.06 1.37
5 1.25 1.16 1.23 1.14 1.08 1.11 1.26 1.18 1.40 1.89
10 1.58 1.64 1.80 1.42 1.35 1.44 1.75 1.67 1.54 2.30
15 1.55 1.39 1.64 1.35 1.29 1.22 1.44 1.73 1.34 2.46
20 0.87 0.94 1.02 0.80 0.82 0.78 0.93 1.17 0.86 2.30
25 0.53 0.58 0.59 0.41 0.43 0.42 0.54 0.58 0.51 1.80
50 0.09 0.11 0.14 0.09 0.11 0.09 0.12 0.14 0.17 0.28
75 0.02 0.03 0.03 0.02 0.03 0.02 0.03 0.02 0.05 0.07
* Space constraints permitted measurement only to 75 m
Table 8.5: Measured electric field for 110 kV single circuit overhead line [see Figure 8.5]
Name Kilteel → Maynooth
Location Kilteel
Type 110 kV single circuit
Design Horizontal wooden pole
Date 04/09/12 04/09/12 04/09/12 06/09/12 06/09/12 06/09/12 08/09/12 08/09/12 08/09/12 21/01/13
Time 09:36 12:36 15:15 10:00 12:20 16:47 11:00 13:35 16:47 13:00 Load (MVA) 13 14 14 13 14 12 14 14 12 14
Dist. (m) Electric field (kV m-1)
0 0.32 0.20 0.22 0.30 0.20 0.20 0.57 0.20 0.20 0.51
5 0.91 0.76 0.78 0.97 0.78 0.83 1.09 0.75 0.83 1.51
10 0.90 0.77 0.68 0.80 0.70 0.75 0.93 0.52 0.75 2.39
15 0.62 0.45 0.38 0.52 0.40 0.42 0.78 0.30 0.42 1.55
20 0.32 0.25 0.21 0.25 0.23 0.23 0.41 0.14 0.23 0.87
25 0.21 0.15 0.03 0.16 0.13 0.13 0.26 0.02 0.13 0.48
50 0.06 0.03 0.02 0.03 0.02 0.06 0.06 0.01 0.02 0.09
75 0.01 0.01 0.01 0.01 0.01 0.02 0.02 0.02 0.01 0.03
100 0.00 0.00 0.00 0.00 0.00 0.00 0.00 0.00 0.00 n/a

63
rpsgroup.com
Table 8.6: Measured electric field for 220 kV double circuit overhead line circuit 1 [see Figure 8.6]
Name Maynooth → Woodlands
Location Maynooth
Type 220 kV double circuit
Design Vertical tower
Date 01/03/13 01/03/13 01/03/13 04/03/13 04/03/13 04/03/13 09/03/13 09/03/13 09/03/13 21/01/13
Time 11:17 14:01 15:00 11:00 12:58 13:46 10:23 11:16 12:06 10:40 Load (MVA) 237 206 204 173 171 168 77 64 66 148
Dist. (m) Electric field (kV m-1)
0 4.17 3.89 3.69 3.62 3.41 3.69 4.55 4.37 4.11 3.49
5 3.22 2.98 2.94 3.11 3.04 2.89 3.57 3.40 3.21 2.82
10 1.81 1.76 1.66 1.68 1.64 1.66 2.22 2.00 1.98 2.00
15 1.04 0.96 0.91 0.94 0.93 1.01 1.76 1.49 1.42 1.19
20 0.58 0.56 0.51 0.52 0.48 0.49 1.01 0.75 0.54 0.67
25 0.38 0.34 0.30 0.32 0.24 0.35 0.56 0.46 0.46 0.41
50 0.07 0.07 0.07 0.08 0.08 0.08 0.16 0.12 0.10 0.09
75 0.05 0.05 0.05 0.05 0.05 0.05 0.10 0.09 0.06 0.06
100 0.03 0.03 0.03 0.03 0.03 0.03 0.06 0.05 0.04 0.03
Table 8.7: Measured electric field for 220 kV double circuit overhead line circuit 2 [see Figure 8.7]
Name Maynooth → Shannonbridge
Location Maynooth
Type 220 kV double circuit
Design Vertical tower
Date 01/03/13 01/03/13 01/03/13 04/03/13 04/03/13 04/03/13 09/03/13 09/03/13 09/03/13 21/03/13
Time 11:34 14:13 15:07 11:13 13:06 13:52 10:31 11:24 12:25 10:50 Load (MVA) 10 17 16 40 39 47 108 109 108 32
Dist. (m) Electric field (kV m-1)
0 3.38 3.06 2.89 3.13 2.95 2.79 3.74 3.66 3.22 3.58
5 2.15 2.67 2.02 2.29 1.62 2.17 2.92 2.80 2.31 2.92
10 1.33 1.30 1.01 1.22 1.09 1.17 1.55 1.49 1.25 1.29
15 0.77 0.78 0.66 0.65 0.52 0.67 1.01 0.96 0.66 0.96
20 0.59 0.56 0.49 0.58 0.54 0.51 0.90 0.86 0.59 0.80
25 0.46 0.43 0.37 0.45 0.44 0.25 0.75 0.67 0.42 0.64
50 0.21 0.19 0.17 0.19 0.20 0.20 0.41 0.28 0.20 0.28
75 0.15 0.13 0.13 0.14 0.13 0.13 0.20 0.15 0.13 0.15
100 0.06 0.06 0.06 0.06 0.07 0.06 0.12 0.07 0.06 0.08

64
rpsgroup.com
Table 8.8: Measured electric field for 110 kV double circuit overhead line circuit 1 [see Figure 8.8]
Name Maynooth → Rinawade
Location Maynooth
Type 110 kV double circuit
Design Vertical tower
Date 01/03/13 01/03/13 01/03/13 04/03/13 04/03/13 04/03/13 09/03/13 09/03/13 09/03/13
Time 12:27 14:42 15:51 11:41 13:33 14:13 10:58 11:46 12:52 Load (MVA) 32 30 30 33 31 32 25 27 30
Dist. (m)* Electric field (kV m-1)
0 2.28 2.41 2.20 2.31 1.94 2.21 3.16 3.03 2.86
5 1.19 1.37 1.32 1.34 1.06 1.24 2.24 1.98 1.67
10 0.53 0.48 0.36 0.45 0.52 0.45 0.84 0.66 0.59
15 0.24 0.22 0.24 0.24 0.23 0.24 0.45 0.35 0.26
20 0.23 0.24 0.24 0.22 0.21 0.22 0.37 0.36 0.25
25 0.22 0.21 0.22 0.20 0.19 0.18 0.34 0.34 0.23
50 0.12 0.10 0.08 0.11 0.10 0.09 0.19 0.16 0.11
75 0.06 0.06 0.06 0.05 0.05 0.05 0.09 0.08 0.06
* Space constraints permitted measurement only to 75 m
Table 8.9: Measured electric field for 110 kV double circuit overhead line circuit 2 [see Figure 8.9]
Name Maynooth → Ryebrook
Location Maynooth
Type 110 kV double circuit
Design Vertical tower
Date 01/03/13 01/03/13 01/03/13 04/03/13 04/03/13 04/03/13 09/03/13 09/03/13 09/03/13
Time 12:18 14:30 15:22 11:32 13:23 14:06 10:49 11:40 14:50
Load (MVA) 10 17 18 17 19 19 35 29 21
Dist. (m) Electric field (kV m-1)
0 2.33 2.18 2.24 2.14 2.25 2.01 3.13 2.95 2.52
5 1.32 1.19 1.31 1.35 1.31 1.13 2.07 1.85 1.52
10 0.48 0.39 0.38 0.46 0.46 0.35 0.77 0.63 0.58
15 0.23 0.21 0.22 0.19 0.23 0.18 0.39 0.34 0.29
20 0.22 0.20 0.23 0.18 0.21 0.17 0.41 0.32 0.26
25 0.19 0.19 0.19 0.16 0.19 0.16 0.35 0.28 0.21
50 0.11 0.10 0.10 0.10 0.08 0.07 0.18 0.15 0.11
75 0.07 0.06 0.06 0.06 0.07 0.06 0.09 0.06 0.06
100 0.04 0.03 0.04 0.03 0.04 0.03 0.06 0.05 0.04

65
rpsgroup.com
Table 8.10: Measured electric field for 110 kV double circuit overhead line 3* [see Figure 8.9]
Name Cookstown → Inchicore
Location Firhouse
Type 110 kV double circuit
Design Vertical tower
Date 25/01/13 Time 16:00
Load (MVA) 59
Dist. (m) Electric field (kV m-1)
0 2.33 5 1.65
10 0.81
15 0.5
20 0.286
25 0.25
50 0.17
75 0.11
100 0.05
* This single set of measurements was taken targeting high load conditions due to access constraints at the Maynooth site
Table 8.11: Measured electric field for 400/220 kV substation [see Figure 8.10]
Name Dunstown 400/220 kV substation
Date 03/09/12 03/09/12 03/09/12 05/09/12 05/09/12 05/09/12 09/09/12 09/09/12 09/09/12 21/01/13
Time 10:45 14:17 16:52 09:42 12:27 15:26 10:45 13:01 16:17 11:00 Load (MVA) 176 197 248 181 234 235 233 162 115 281
Dist. (m) Electric field (kV m-1)
0 0.01 0.01 0.01 0.01 0.01 0.01 0.01 0.01 0.01 0.07
5 0.04 0.04 0.04 0.04 0.04 0.03 0.04 0.04 0.03 0.12
10 0.01 0.01 0.01 0.01 0.01 0.01 0.01 0.01 0.01 0.12
15 0.01 0.01 0.01 0.01 0.01 0.01 0.01 0.01 0.01 0.12

66
rpsgroup.com
Table 8.12: Measured electric field for 220/110 kV substation [see Figure 8.11]
Name Maynooth 220/110 kV substation
Date 01/03/13 01/03/13 01/03/13 04/03/13 04/03/13 04/03/13 09/03/13 09/03/13 09/03/13 21/01/13
Time 11:45 14:25 15:21 11:21 13:16 14:02 10:44 11:38 12:32 11:00 Load (MVA) 135 135 134 141 143 138 122 123 122 154
Dist. (m) Electric field (kV m-1)
0 0.03 0.04 0.03 0.04 0.04 0.03 0.02 0.03 0.04 0.00
5 0.11 0.10 0.09 0.10 0.09 0.10 0.12 0.11 0.10 0.12
10 0.08 0.09 0.08 0.07 0.07 0.08 0.07 0.06 0.07 0.07
15 0.04 0.04 0.04 0.03 0.04 0.04 0.04 0.03 0.03 0.04
20 0.02 0.02 0.02 0.02 0.02 0.02 0.02 0.02 0.02 0.02
25 0.02 0.02 0.02 0.02 0.02 0.02 0.02 0.02 0.02 n/a
50 0.02 0.02 0.02 0.02 0.02 0.02 0.02 0.02 0.02 n/a
Table 8.13: Measured electric field for 110 kV substation [see Figure 8.12]
Name Kilteel 110 kV substation
Date 04/09/12 04/09/12 04/09/12 06/09/12 06/09/12 06/09/12 08/09/12 08/09/12 08/09/12 21/01/13
Time 09:00 12:26 16:41 10:20 12:40 17:10 11:15 13:50 17:25 13:10 Load (MVA) 13 14 14 15 14 14 11 10 10 15
Dist. (m) Electric field (kV m-1)
0 0.00 0.00 0.00 0.00 0.00 0.00 n/a n/a 0.00 0.03
5 0.01 0.01 0.01 0.01 0.01 0.01 0.01 0.01 0.01 0.04
10 0.01 0.01 0.01 0.01 0.01 0.01 0.01 0.01 0.01 0.02
15 0.01 0.01 0.01 0.01 0.01 0.01 0.01 0.01 0.01 0.02
20 0.01 0.01 0.01 0.01 0.01 0.01 0.01 0.01 0.01 0.02
25 0.01 0.01 0.01 0.01 0.01 0.01 0.01 0.01 0.01 0.02
50 0.00 0.00 0.00 0.00 0.00 0.00 0.00 0.00 0.00 0.01

67
rpsgroup.com
Results graphs
8.2 Figure 8.1 to Figure 8.12 show the measured electric field strength plotted against distance for
each of the high-voltage transmission infrastructure items surveyed. Variation in the results
measured at similar loads is due to factors outlined in the measurement variation discussion in
Section 6.
Figure 8.1: Measured electric field plotted against distance for 400 kV single circuit overhead line
(double circuit tower) [see Table 8.1]
0.00
0.50
1.00
1.50
2.00
2.50
3.00
3.50
4.00
4.50
5.00
0 10 20 30 40 50 60 70 80 90 100
Elec
tric
fiel
d (k
V/m
)
Distance (m)
286
256
247
238
223
201
199
181
152
121
Measurement
series load (MVA)

68
rpsgroup.com
Figure 8.2: Measured electric field plotted against distance for 400 kV single circuit overhead line
(horizontal tower configuration) [see Table 8.2]
Figure 8.3: Measured electric field plotted against distance for 220 kV single circuit overhead line
1 [see Table 8.3]
0.00
0.50
1.00
1.50
2.00
2.50
3.00
3.50
4.00
4.50
5.00
0 10 20 30 40 50 60 70 80 90 100
Elec
tric
fiel
d (k
V/m
)
Distance (m)
280
255
243
237
236
221
212
196
177
166
0.00
0.50
1.00
1.50
2.00
2.50
3.00
3.50
4.00
4.50
5.00
0 10 20 30 40 50 60 70 80 90 100
Elec
tric
fiel
d (k
V/m
)
Distance (m)
81
73
59
55
49
42
42
35
20
18
Measurement
series load (MVA)
Measurement
series load (MVA)

69
rpsgroup.com
Figure 8.4: Measured electric field plotted against distance for 220 kV single circuit overhead line
2 [see Table 8.4]
Figure 8.5: Measured electric field plotted against distance for 110 kV single circuit overhead line
[see Table 8.5]
0.00
0.50
1.00
1.50
2.00
2.50
3.00
3.50
4.00
4.50
5.00
0 10 20 30 40 50 60 70
Elec
tric
fiel
d (k
V/m
)
Distance (m)
93
82
74
72
67
60
58
38
26
20
0.00
0.50
1.00
1.50
2.00
2.50
3.00
3.50
4.00
4.50
5.00
0 10 20 30 40 50 60 70 80 90 100
Elec
tric
fiel
d (k
V/m
)
Distance (m)
14
14
14
14
14
14
13
13
12
12
Measurement
series load (MVA)
Measurement
series load (MVA)

70
rpsgroup.com
Figure 8.6: Measured electric field plotted against distance for 220 kV double circuit overhead line
circuit 1 [see Table 8.6]
Figure 8.7: Measured electric field plotted against distance for 220 kV double circuit overhead line
circuit 2 [see Table 8.7]
0.00
0.50
1.00
1.50
2.00
2.50
3.00
3.50
4.00
4.50
5.00
0 10 20 30 40 50 60 70 80 90 100
Elec
tric
fiel
d (k
V/m
)
Distance (m)
237
206
204
173
171
168
77
64
66
148
0.00
0.50
1.00
1.50
2.00
2.50
3.00
3.50
4.00
4.50
5.00
0 10 20 30 40 50 60 70 80 90 100
Elec
tric
fiel
d (k
V/m
)
Distance (m)
109
108
108
47
40
39
32
17
16
10
Measurement
series load (MVA)
Measurement
series load (MVA)

71
rpsgroup.com
Figure 8.8: Measured electric field plotted against distance for 110 kV double circuit overhead line
circuit 1 [see Table 8.8]
Figure 8.9: Measured electric field plotted against distance for 110 kV double circuit overhead line
circuit 2 [see Table 8.9 and Table 8.10]
Measurements at 59 MVA load taken for CookstownInchicore overhead line
0.00
0.50
1.00
1.50
2.00
2.50
3.00
3.50
4.00
4.50
5.00
0 10 20 30 40 50 60 70
Elec
tric
fiel
d (k
V/m
)
Distance (m)
33
32
32
31
30
30
30
27
25
0.00
0.50
1.00
1.50
2.00
2.50
3.00
3.50
4.00
4.50
5.00
0 10 20 30 40 50 60 70 80 90 100
Elec
tric
fiel
d (k
V/m
)
Distance (m)
59
35
29
21
19
19
18
17
17
10
Measurement
series load (MVA)
Measurement
series load (MVA)

72
rpsgroup.com
Figure 8.10: Measured electric field plotted against distance for 400/220 kV substation [see Table
8.11]
Figure 8.11: Measured electric field plotted against distance for 220/110 kV substation [see Table
8.12]
0
0.5
1
1.5
2
2.5
3
3.5
4
4.5
5
0 2 4 6 8 10 12 14
Elec
tric
fiel
d (k
V/m
)
Distance (m)
281
248
235
234
233
197
181
176
162
115
0
0.5
1
1.5
2
2.5
3
3.5
4
4.5
5
0 5 10 15 20 25 30
Elec
tric
fiel
d (k
V/m
)
Distance (m)
154
143
141
138
135
135
134
123
122
122
Measurement
series load (MVA)
Measurement
series load (MVA)

73
rpsgroup.com
Figure 8.12: Measured electric field plotted against distance for 110 kV substation [see Table 8.13]
0
0.5
1
1.5
2
2.5
3
3.5
4
4.5
5
0 5 10 15 20 25 30 35 40 45 50
Elec
tric
fiel
d (k
V/m
)
Distance (m)
15
15
14
14
14
14
13
11
10
10
Measurement
series load (MVA)

74
rpsgroup.com
Discussion
8.3 The maximum electric field strength recorded among the overhead power lines was 4.72 kV m-1
for the 400 kV overhead line, and the maximum recorded among the substations was 0.12 kV m-1
for both the 400 kV and 220/110 kV substations. There is no electric field above ground level for
underground cables, as the field is fully screened by the cable sheath. All measured results fall
below the 2010 ICNIRP guideline reference level for general public exposure of 5 kV m-1.
8.4 For single-circuit overhead lines, the peak electric field strength measured was at around 5 m –
15 m distance from the centreline; these towers carry the conductors spaced horizontally, and the
peak field strength has been recorded under the outer conductor. In all cases, the measured
electric field strength decreases rapidly with distance from the peak.
8.5 Electric field strengths measured directly under the conductors of overhead lines vary across
those surveyed, from 0.75 kV m-1 to the maximum of 4.72 kV m-1 noted.
8.6 The electric field measured at substations is very weak (peaking at 0.12 kV m-1), and is lower
immediately at the perimeter in all cases. This is likely to be due to the metal fence of the
perimeter providing a path to earth for the electric field at that location, effectively screening the
electric field measured adjacent to it.
8.7 Electric field strength depends on voltage rather than current, and would not be expected to vary
significantly under differing load conditions (although some change due to thermal expansion of
overhead lines, causing sag that reduces ground clearance and hence measurement distance,
would be expected). However, significant variability and some outlier measurements are evident
in the plots of the multiple series of electric field measurements. This is likely to reflect variation in
the transmission system voltage (either within Grid Code normal expected ranges, or potentially a
transmission system disturbance), and also the fact that electric field measurements can be
affected by environmental confounding factors such as weather conditions and grounding by
nearby objects or natural features.

75
rpsgroup.com
9 Conclusions
9.1 Widely adopted international guidelines for continuous public exposure to ELF electric and
magnetic fields, published by ICNIRP, exist to protect public health. These guideline values are
based upon well-established acute effects on the body or the thresholds at which physical
impacts from fields can be perceived, with a „safety factor‟ to allow for scientific uncertainty and
the potential cumulative impacts of long-term exposure. The guidelines are expressed both as a
basic restriction (for induced current in the central nervous system or internal electric field) and a
reference level (external field strength at which the basic restriction could not be exceeded).
9.2 The most recent published reference levels (2010) are 200 µT and 5 kV m-1 for magnetic and
electric field strength respectively, although at the present time, the standing EC recommendation
for their adoption (1999/519/EC) is based upon a more stringent former reference level (1998) of
100 µT for the magnetic field and the same reference level of 5 kV m-1 for the electric field.
Magnetic field
9.3 The maximum magnetic field strengths measured at all overhead lines, underground cables and
substation perimeters surveyed are well below the ICNIRP reference level to protect public health
(Table 9.1).
Table 9.1: Maximum measured magnetic field strength
2010 ICNIRP reference level 200 µT
Maximum field strength Percentage of reference level
Underground cable 26.01 µT 13.01 %
Overhead line 4.97 µT 2.49 %
Substation perimeter 0.72 µT 0.36 %
9.4 Based on the measured data, magnetic field strengths estimated for overhead power lines and
underground cables using records of annual load are also well below the ICNIRP reference level
to protect public health under typical (mean or median load) and high power load (95th percentile)
conditions (Table 9.2).

76
rpsgroup.com
Table 9.2: Maximum magnetic field strength under annual typical and high loads
2010 ICNIRP reference level 200 µT
Overhead line*
Mean load 1.20 – 2.37 µT 0.60 – 1.18 %
Median load 1.06 – 2.56 µT 0.53 – 1.28 %
95th percentile load 2.51 – 7.04 µT 1.26 – 3.52 %
Underground cable
Mean load 1.96 –15.65 µT 0.98 – 7.83 %
Median load 2.03 – 14.78 µT 1.02 – 7.39 %
95th percentile load 2.56 – 25.27 µT 1.28 – 12.64 %
* Excluding double circuit lines
Electric field
9.5 The maximum electric field strengths measured at all overhead lines and substation perimeters
surveyed are below the ICNIRP reference level to protect public health (Table 9.3). Underground
cables produce no electric field above ground.
Table 9.3: Maximum measured electric field strength
2010 ICNIRP reference level 5 kV m-1
Overhead line 4.72 94 %
Substation perimeter 0.12 2.4 %
Public exposure
9.6 The maximum magnetic field strength from all high-voltage transmission infrastructure items
measured falls well below the ICNIRP guideline reference level for the protection of public health.
This is the case for power loads at the times of measurement, and also the case when
measurement results are scaled to higher loadings (those not exceeded 95% of the time in a
typical year for the infrastructure included in the study). Under the EC recommendation, these
public exposure guidelines are applicable primarily to long-term, residential exposure.
9.7 Although remaining within the guideline reference level is considered appropriate to protect
health, health protection bodies suggest that, based on the health impacts research literature,
public perception of risk can be addressed through application of a precautionary approach in
which unnecessary magnetic field exposure is further reduced. EirGrid typically aims, on the
grounds of residential amenity and visual impact, to site new high-voltage transmission
infrastructure away from populated areas and to maintain at least a 50 m distance from individual
dwellings where feasible. This existing approach inherently offers a further reduction in magnetic
field exposure, as the field strength decreases rapidly with distance away from the power line.

77
rpsgroup.com
9.8 The maximum electric field strength measured from the highest-voltage overhead line (400 kV) is
relatively close to the ICNIRP reference level. However, this reference level is set on a highly
conservative basis that ensures that the ICNIRP basic restriction for electric field exposure
cannot be exceeded by external field strengths below the reference level.

78
rpsgroup.com
Appendices

App
endi
x 1:
Lite
ratu
re S
earc
h
This
tab
le s
umm
aris
es t
he r
evie
w t
hat
has
been
und
erta
ken
of s
cien
tific
lite
ratu
re p
rese
nted
by
the
wid
er s
cien
tific
com
mun
ity f
ollo
win
g th
e 20
07 W
HO
mon
ogra
ph. A
n in
itial
sea
rch
was
con
duct
ed u
sing
the
PubM
ed d
atab
ase.
The
mai
n cr
iteria
for
the
sear
ch w
ere
that
the
stud
ies
cons
ider
ed E
LF E
MF
in th
e
pow
er fr
eque
ncy
rang
e an
d ha
d be
en p
ublis
hed
durin
g 20
07-2
012,
sub
sequ
ent t
o th
e W
HO
mon
ogra
ph. T
he s
earc
h te
rms
used
wer
e: E
MF,
ELF
EM
F, E
LF
mag
netic
fiel
d, E
MF
high
vol
tage
, EM
F no
n io
nisi
ng ra
diat
ion
and
EM
F po
wer
line
. The
111
pap
ers
foun
d w
ere
prio
ritis
ed b
y an
abs
tract
revi
ew, f
rom
whi
ch a
smal
ler n
umbe
r stu
dies
hav
e be
en d
raw
n up
on in
det
ail a
nd c
ited
in th
e lit
erat
ure
revi
ew d
ocum
ent.
Them
e O
verv
iew
/ N
otes
Au
thor
D
ate
Publ
ishe
d Ti
tle
Jour
nal
Volu
me,
ch
apte
r Pa
ge
num
ber
elec
tric
field
Occ
upat
iona
l exp
osur
e m
atrix
for e
xpos
ure
to a
ll E
MF
fact
ors
(ele
ctric
fiel
d, m
agne
tic fi
eld,
nui
sanc
e sh
ocks
). C
oncl
udes
that
four
job
cate
gorie
s ha
ve h
ighe
st e
xpos
ure
nam
ely
cabl
e sp
licer
s, e
lect
ricia
ns, l
ine
wor
kers
, and
su
bsta
tion
oper
ator
s
Bra
cken
, TD
20
09
An
inte
grat
ed jo
b ex
posu
re m
atrix
for
elec
trica
l exp
osur
es o
f util
ity w
orke
rs
Jour
nal o
f Occ
upat
iona
l an
d E
nviro
nmen
tal
Hyg
iene
6
(8)
499-
509
elec
tric
field
Goo
dman
, R
2009
E
xtre
mel
y lo
w fr
eque
ncy
elec
tric
field
s an
d ca
ncer
: ass
essi
ng th
e ev
iden
ce
Bio
elec
trom
agne
tics
31(2
) 89
-101
elec
tric
field
Lite
ratu
re re
view
on
heal
th e
ffect
s fro
m w
eak
elec
trom
agne
tic fi
elds
with
pow
er fr
eque
ncy
of 5
0/60
Hz.
C
oncl
udes
that
we
are
far f
rom
und
erst
andi
ng th
e bi
ophy
sics
bac
kgro
und
of p
oten
tial E
MF
effe
cts
on h
uman
su
bjec
ts. T
here
fore
furth
er in
tens
ive
stud
ies
are
need
ed to
el
imin
ate
exis
ting
draw
back
s
Zmys
lony
, M
2008
B
iolo
gica
l effe
cts
and
heal
th ri
sk o
f po
wer
freq
uenc
y el
ectro
mag
netic
fiel
ds
(neo
plas
ms
excl
uded
)
Med
ycyn
a P
racy
(P
olan
d)
59 (5
) 42
1-42
8
epid
emio
logi
cal
The
stud
y ex
amin
es th
e as
soci
atio
n be
twee
n re
side
ntia
l co
ntac
t cur
rent
s, m
agne
tic fi
eld
and
child
hood
leuk
aem
ia
in C
alifo
rnia
. No
evid
ence
foun
d of
an
asso
ciat
ion
D
oes,
M
2011
E
xpos
ure
to e
lect
rical
con
tact
cur
rent
s an
d th
e ris
k of
chi
ldho
od le
ukae
mia
R
adia
tion
Res
earc
h 17
5 (3
) 39
0-39
6
epid
emio
logi
cal
Inve
stig
ates
whe
ther
con
tact
cur
rent
is re
spon
sibl
e fo
r the
as
soci
atio
n be
twee
n ch
ildho
od le
ukae
mia
and
mag
netic
fie
lds.
Con
clud
es th
at a
ssoc
iatio
ns a
ppea
r lar
ge e
noug
h to
sup
port
the
poss
ibilit
y th
at c
onta
ct c
urre
nt c
ould
be
resp
onsi
ble
for t
he a
ssoc
iate
d of
chi
ldho
od le
ukae
mia
with
m
agne
tic fi
elds
Kav
et, R
20
11
The
rela
tions
hip
betw
een
resi
dent
ial
mag
netic
fiel
ds a
nd c
onta
ct v
olta
ge: a
po
oled
ana
lysi
s R
adia
tion
Res
earc
h A
head
of
prin
t A
head
of
prin
t
epid
emio
logi
cal
M
aes,
A
2011
Can
cyt
ogen
etic
s ex
plai
n th
e po
ssib
le
asso
ciat
ion
betw
een
expo
sure
to
extre
me
low
-freq
uenc
y m
agne
tic fi
elds
an
d A
lzhe
imer
‟s d
isea
se
Jour
nal o
f App
lied
Toxi
colo
gy
Ahe
ad o
f pr
int

Them
e O
verv
iew
/ N
otes
Au
thor
D
ate
Publ
ishe
d Ti
tle
Jour
nal
Volu
me,
ch
apte
r Pa
ge
num
ber
epid
emio
logi
cal
Acu
te ly
mph
obla
stic
leuk
aem
ia a
mon
g ch
ildre
n w
hose
m
othe
rs h
ave
been
exp
osed
to o
ccup
atio
nal E
LF E
MF.
Th
e st
udy
did
not f
ind
an in
crea
sed
risk
of A
LL in
offs
prin
g of
par
ents
with
occ
upat
iona
l exp
osur
e to
ELF
Rei
d, A
20
11
Ris
k of
chi
ldho
od a
cute
lym
phob
last
ic
leuk
aem
ia fo
llow
ing
pare
ntal
oc
cupa
tiona
l exp
osur
e to
ext
rem
ely
low
fre
quen
cy e
lect
rom
agne
tic fi
elds
Brit
ish
Jour
nal o
f C
ance
r A
head
of
prin
t
epid
emio
logi
cal
Rev
iew
doc
umen
t La
groy
e, I
2011
E
LF m
agne
tic fi
elds
: Ani
mal
stu
dies
, m
echa
nism
s of
act
ion
Pro
gres
s in
Bio
phys
ics
and
Mol
ecul
ar B
iolo
gy
Ahe
ad o
f pr
int
epid
emio
logi
cal
Impa
ct o
f 60H
z 3m
T M
F on
hum
an c
ogni
tive
perfo
rman
ce.
Pow
er li
ne w
orke
rs a
nd w
elde
rs. S
pecu
late
s a
link
betw
een
ELF
MF
and
inte
rfere
nce
with
ne
urop
sych
olog
ical
pro
cess
es re
spon
sibl
e fo
r sho
rt te
rm
lear
ning
Cor
baci
o, M
20
11
Hum
an c
ogni
tive
perfo
rman
ce in
a 3
m
T po
wer
-line
freq
uenc
y m
agne
tic fi
eld
Bio
elec
trom
agne
tics
Ahe
ad o
f pr
int
epid
emio
logi
cal
de
Kle
ijn, S
20
11
Ext
rem
ely
low
freq
uenc
y el
ectro
mag
netic
fiel
d ex
posu
re d
oes
not m
odul
ate
toll-
like
rece
ptor
sig
nalli
ng
in h
uman
per
iphe
ral b
lood
m
onon
ucle
ar c
ells
Cyt
okin
e 54
(1)
43-5
0
epid
emio
logi
cal
Legr
os A
, Cor
baci
o M
, Beu
ter A
, M
odol
o J,
Gou
let D
, P
rato
FS
, Tho
mas
AW
.
2011
N
euro
phys
iolo
gica
l and
beh
avio
ural
ef
fect
s of
a 6
0Â H
z, 1
,800
 μ
T m
agne
tic fi
eld
in h
uman
s.
Eur
J A
ppl P
hysi
ol.
ahea
d of
pr
int
epid
emio
logi
cal
K
heife
ts, L
20
10
A p
oole
d an
alys
is o
f ext
rem
ely
low
-fre
quen
cy m
agne
tic fi
elds
and
ch
ildho
od b
rain
tum
ors
Amer
ican
Jou
rnal
of
Epi
dem
iolo
gy
172
(7)
752-
761
epid
emio
logi
cal
Res
ults
do
not s
ugge
st a
MF
effe
ct
McN
amee
, DA
2010
Th
e re
spon
se o
f the
hum
an c
ircul
ator
y sy
stem
to a
n ac
ute
200-
uT 6
0-H
z m
agne
tic fi
eld
expo
sure
Inte
rnat
iona
l arc
hive
s of
oc
cupa
tiona
l and
en
viro
nmen
tal h
ealth
84
(3)
267-
77
epid
emio
logi
cal
C
arpe
nter
, DO
20
10
Ele
ctro
mag
netic
fiel
ds a
nd c
ance
r: th
e co
st o
f doi
ng n
othi
ng
Rev
iew
s on
E
nviro
nmen
tal H
ealth
25
(1)
75-8
0
epid
emio
logi
cal
C
hen,
C
2010
Ext
rem
ely
low
-freq
uenc
y el
ectro
mag
netic
fiel
ds e
xpos
ure
and
fem
ale
brea
st c
ance
r ris
k: a
met
a-an
alys
is b
ased
on
24,3
38 c
ases
and
60
,628
con
trols
Bre
ast c
ance
r res
tre
atm
ent
123
(2)
569-
576
epid
emio
logi
cal
H
ug, K
20
10
Par
enta
l occ
upat
iona
l exp
osur
e to
ex
trem
ely
low
freq
uenc
y m
agne
tic
field
s an
d ch
ildho
od c
ance
r: a
Ger
man
ca
se-c
ontro
l stu
dy
Amer
ican
Jou
rnal
of
Epi
dem
iolo
gy
171
(1)
27-3
5

Them
e O
verv
iew
/ N
otes
Au
thor
D
ate
Publ
ishe
d Ti
tle
Jour
nal
Volu
me,
ch
apte
r Pa
ge
num
ber
epid
emio
logi
cal
M
cNam
ee, D
A 20
10
The
card
iova
scul
ar re
spon
se to
an
acut
e 18
00-m
icro
T 60
-Hz
mag
netic
fie
ld e
xpos
ure
in h
uman
s
Inte
rnat
iona
l arc
hive
s of
oc
cupa
tiona
l and
en
viro
nmen
tal h
ealth
83
(4)
441-
454
epid
emio
logi
cal
M
ehic
B.
2010
R
etra
ctio
n: E
valu
atio
n of
car
cino
geni
c ef
fect
s of
ele
ctro
mag
netic
fiel
ds (E
MF)
. B
osn
J B
asic
Med
Sci
10
(4)
331
epid
emio
logi
cal
B
ayaz
it V,
Bay
ram
B
, Pal
a Z,
Ata
n O
. 20
10
Eva
luat
ion
of c
arci
noge
nic
effe
cts
of
elec
trom
agne
tic fi
elds
(EM
F).
Bos
n J
Bas
ic M
ed S
ci
10(4
) 33
2
epid
emio
logi
cal
K
heife
ts L
, S
wan
son
J, K
ande
l S
, Mal
loy
TF.
2010
R
isk
gove
rnan
ce fo
r mob
ile p
hone
s,
pow
er li
nes,
and
oth
er E
MF
tech
nolo
gies
. R
isk
Ann
als
30(1
0)
1481
-94
epid
emio
logi
cal
G
obba
, F
2009
Nat
ural
kille
r cel
l act
ivity
dec
reas
es in
w
orke
rs o
ccup
atio
nally
exp
osed
to
extre
mel
y lo
w fr
eque
ncy
mag
netic
fie
lds
exce
edin
g 1
mic
roT
Inte
rnat
iona
l jou
rnal
im
mun
opat
holo
gy
phar
mac
olog
y 22
(4)
1059
-106
6
epid
emio
logi
cal
S
chüz
, J
2009
Ele
ctro
mag
netic
fiel
ds a
nd
epid
emio
logy
: an
over
view
insp
ired
by
the
four
th c
ours
e at
the
Inte
rnat
iona
l S
choo
l of B
ioel
ectro
mag
netic
s
Bio
elec
trom
agne
tics
30(7
) 51
1-24
epid
emio
logi
cal
Con
clud
es th
at h
igh
leve
ls o
f exp
osur
e m
iscl
assi
ficat
ion
rend
er th
e fin
ding
s fro
m s
tudi
es th
at re
ly o
n di
stan
ce
alon
e un
-inte
rpre
tabl
e M
asla
nyj M
20
09
Pow
er fr
eque
ncy
mag
netic
fiel
ds a
nd
risk
of c
hild
hood
leuk
aem
ia:
mis
clas
sific
atio
n of
exp
osur
e fro
m th
e us
e of
the
'dis
tanc
e fro
m p
ower
line
' ex
posu
re s
urro
gate
.
Bio
elec
trom
agne
tics
30(3
) 18
3-8
epid
emio
logi
cal
B
inhi
V.
2008
Do
natu
rally
occ
urrin
g m
agne
tic
nano
parti
cles
in th
e hu
man
bod
y m
edia
te in
crea
sed
risk
of c
hild
hood
le
ukae
mia
with
EM
F ex
posu
re?
Int J
Rad
iat B
iol
84(7
) 56
9-79
epid
emio
logi
cal
Ahl
bom
A, B
ridge
s J,
de
Sez
e R
, Hille
rt L,
Juu
tilai
nen
J,
Mat
tsso
n M
O,
Neu
baue
r G, S
choz
J,
Sim
ko M
, Bro
men
K
.
2008
Pos
sibl
e ef
fect
s of
ele
ctro
mag
netic
fie
lds
(EM
F) o
n hu
man
hea
lth--o
pini
on
of th
e sc
ient
ific
com
mitt
ee o
n em
ergi
ng
and
new
ly id
entif
ied
heal
th ri
sks
(SC
EN
IHR
).
Toxi
colo
gy
246(
2-3)
24
8-50
epid
emio
logi
cal
M
ezei
G, G
adal
lah
M, K
heife
ts L
. 20
08
Res
iden
tial m
agne
tic fi
eld
expo
sure
an
d ch
ildho
od b
rain
can
cer:
a m
eta-
anal
ysis
. E
pide
mio
logy
19
(3)
424-
30

Them
e O
verv
iew
/ N
otes
Au
thor
D
ate
Publ
ishe
d Ti
tle
Jour
nal
Volu
me,
ch
apte
r Pa
ge
num
ber
epid
emio
logi
cal
O
tto M
, von
M
aehe
ndah
l KE
. 20
07
Ele
ctro
mag
netic
fiel
ds (E
MF)
: do
they
pl
ay a
role
in c
hild
ren'
s en
viro
nmen
tal
heal
th (C
EH
)?
Int J
Hyg
Env
iron
Hea
lth
210(
5)
635-
44
epid
emio
logi
cal
K
heife
ts, L
. et a
l 20
10
A p
oole
d an
alys
is o
f ext
rem
ely
low
-fre
quen
cy m
agne
tic fi
elds
and
ch
ildho
od b
rain
tum
ors
Amer
ican
Jnl
of
Epi
dem
iolo
gy
Onl
ine
vers
ion
10.1
093/
aje/
kwq1
81
epid
emio
logi
cal
Rev
iew
of l
itera
ture
dea
ling
with
hea
lth e
ffect
s of
exp
osur
e to
EM
F em
itted
by
inst
alla
tions
incl
udin
g po
wer
line
s an
d tra
nsfo
rmer
sta
tions
. Con
clud
es th
at fu
rther
inte
nsiv
e in
vest
igat
ions
are
requ
ired
Zmys
lony
M
2007
Bio
logi
cal m
echa
nism
s an
d he
alth
ef
fect
s of
EM
F in
vie
w o
f req
uire
men
ts
of re
ports
on
the
impa
ct o
f var
ious
in
stal
latio
ns o
n th
e en
viro
nmen
t
Med
ycyn
a P
racy
(P
olan
d)
58(1
) 27
-36
guid
elin
es
S
afig
iann
i AS
, S
pyrid
opou
los
AI,
Kan
as V
L.
2011
E
lect
ric a
nd M
agne
tic F
ield
M
easu
rem
ents
in a
Hig
h V
olta
ge
Cen
tre.
Ann
Occ
up H
yg.
ahea
d of
pr
int
guid
elin
es
B
akke
r, JF
20
11
Chi
ldre
n an
d ad
ults
exp
osed
to
elec
trom
agne
tic fi
elds
at t
he IC
NIR
P
refe
renc
e le
vels
: the
oret
ical
as
sess
men
t of t
he in
duce
d pe
ak
tem
pera
ture
incr
ease
Phy
sics
in M
edic
ine
and
Bio
logy
56
(15)
49
67-8
9
guid
elin
es
D
amvi
k, M
20
10
Hea
lth ri
sk a
sses
smen
t of
elec
trom
agne
tic fi
elds
: a c
onfli
ct
betw
een
the
prec
autio
nary
prin
cipl
e an
d en
viro
nmen
tal m
edic
ine
met
hodo
logy
Rev
iew
s on
E
nviro
nmen
tal H
ealth
25
(4)
325-
33
guid
elin
es
Fr
agop
oulo
u, A
20
10
Sci
entif
ic p
anel
on
elec
trom
agne
tic fi
eld
heal
th ri
sks:
con
sens
us p
oint
s,
reco
mm
enda
tions
, and
ratio
nale
s
Rev
iew
s on
E
nviro
nmen
tal H
ealth
25
(4)
307-
17
guid
elin
es
S
wan
son
J.
2009
C
onsu
ltatio
n on
revi
sion
s to
the
Eur
opea
n D
irect
ive
on o
ccup
atio
nal
EM
F ex
posu
re.
Jour
nal o
f Rad
iolo
gica
l P
rote
ctio
n 29
(2)
291-
292
guid
elin
es
The
pape
r con
side
rs th
e de
finiti
ons
of p
reca
utio
n,
prev
entio
n, ri
sk, u
ncer
tain
ty, a
nd ig
nora
nce;
the
use
of
diffe
rent
stre
ngth
s of
evi
denc
e fo
r diff
eren
t pur
pose
s; th
e na
ture
and
mai
n di
rect
ion
of th
e m
etho
dolo
gica
l and
cu
ltura
l bia
ses
with
in th
e en
viro
nmen
tal h
ealth
sci
ence
s;
the
need
for t
rans
pare
ncy
in e
valu
atin
g ris
ks; a
nd p
ublic
pa
rtici
patio
n in
risk
ana
lysi
s. T
hese
issu
es a
re re
leva
nt to
th
e ris
k as
sess
men
t of e
lect
ro-m
agne
tic fi
elds
(EM
F).
Gee
D.
2009
La
te L
esso
ns fr
om E
arly
War
ning
s:
Tow
ards
real
ism
and
pre
caut
ion
with
E
MF?
P
atho
phys
iolo
gy
16(2
-3)
217-
31

Them
e O
verv
iew
/ N
otes
Au
thor
D
ate
Publ
ishe
d Ti
tle
Jour
nal
Volu
me,
ch
apte
r Pa
ge
num
ber
guid
elin
es
S
zuba
M.
2009
Con
sequ
ence
s of
cha
nged
regu
latio
ns
on th
e pr
otec
tion
of th
e en
viro
nmen
t ag
ains
t the
influ
ence
of t
he 5
0 H
z m
agne
tic fi
eld.
Med
Pr.
60
(1)
51-7
guid
elin
es
Con
side
rs re
cent
dev
elop
men
ts th
at a
re re
leva
nt to
fo
rmul
atin
g th
e ne
xt g
ener
atio
n of
gui
delin
es. P
artic
ular
ly
a si
mpl
ified
app
roac
h to
mag
netic
fiel
d as
sess
men
t in
non-
unifo
rm m
agne
tic fi
elds
and
ass
essm
ent o
f exp
osur
e to
hig
h el
ectri
c fie
lds
in re
alis
tic s
ituat
ions
(i.e
. lin
e w
orke
rs)
Kav
et, R
20
08
Rec
ent a
dvan
ces
in re
sear
ch re
leva
nt
to e
lect
ric a
nd m
agne
tic fi
eld
expo
sure
gu
idel
ines
B
ioel
ectro
mag
netic
s 29
(7)
499-
526
guid
elin
es
W
ood
AW.
2008
Ext
rem
ely
low
freq
uenc
y (E
LF) e
lect
ric
and
mag
netic
fiel
d ex
posu
re li
mits
: ra
tiona
le fo
r bas
ic re
stric
tions
use
d in
th
e de
velo
pmen
t of a
n A
ustra
lian
stan
dard
.
Bio
elec
trom
agne
tics.
29
(6)
414-
28
guid
elin
es
Exp
ress
ing
EM
F re
com
men
datio
ns fo
r chi
ldre
n, h
ow to
co
mm
unic
ate
risk
rega
rdin
g E
MF
and
child
ren
Pol
zl, C
20
11
EM
F re
com
men
datio
ns s
peci
fic fo
r ch
ildre
n?
Pro
gres
s in
Bio
phys
ics
and
Mol
ecul
ar B
iolo
gy
Ahe
ad o
f pr
int
Ahe
ad o
f pr
int
guid
elin
es
Nie
lsen
JB,
Els
tein
A
, Gyr
d-H
anse
n D
, K
ildem
oes
HW
, K
ristia
nsen
IS,
Sta
vrin
g H
.
2010
E
ffect
s of
alte
rnat
ive
styl
es o
f ris
k in
form
atio
n on
EM
F ris
k pe
rcep
tion.
B
ioel
ectro
mag
netic
s 31
(7)
504-
12
in v
itro
EM
F in
tera
ctio
ns w
ith D
NA
at d
iffer
ent f
requ
ency
rang
es.
Con
clud
es th
at th
e re
sulti
ng D
NA
dam
age
coul
d ac
coun
t fo
r inc
reas
es in
can
cer e
pide
mio
logy
B
lank
, M
2011
D
NA
is a
frac
tal a
nten
na in
el
ectro
mag
netic
fiel
ds
Inte
rnat
iona
l jou
rnal
of
radi
atio
n bi
olog
y 87
(4)
409-
415
in v
itro
Le
e, H
J 20
11
Com
bine
d ef
fect
s of
60H
z el
ectro
mag
netic
fiel
d ex
posu
re w
ith
vario
us s
tress
fact
ors
on c
ellu
lar
trans
form
atio
n in
NIH
3T3
cells
Bio
elec
trom
agne
tics
Ahe
ad o
f pr
int
in v
itro
B
ayat
, PD
20
11
Effe
ct o
f exp
osur
e to
ext
rem
ely
low
el
ectro
-mag
netic
fiel
d du
ring
pren
atal
pe
riod
on m
ice
sple
en
Indi
an J
ourn
al o
f E
xper
imen
tal B
iolo
gy
49 (8
) 63
4-63
8
in v
itro
R
aver
a, S
20
11
Ext
rem
ely
low
-freq
uenc
y el
ectro
mag
netic
fiel
ds a
ffect
lipi
d-lin
ked
carb
onic
anh
ydra
se
Ele
ctro
mag
netic
bio
logy
an
d m
edic
ine
30 (2
) 67
-73
in v
itro
ELF
MF
geno
toxi
c ef
fect
on
e-co
li. U
nder
spe
cific
co
nditi
ons
of e
xpos
ure
ELF
MF
was
sho
wn
to a
ct a
s a
non-
toxi
c bu
t cel
l gro
wth
stim
ulat
ing
agen
t B
elya
ev, I
20
11
Toxi
city
and
SO
S-re
spon
se to
ELF
m
agne
tic fi
elds
and
nal
idix
ic a
cid
in E
. co
li ce
lls
Mut
atio
n re
sear
ch
18;7
22 (1
) 56
-61

Them
e O
verv
iew
/ N
otes
Au
thor
D
ate
Publ
ishe
d Ti
tle
Jour
nal
Volu
me,
ch
apte
r Pa
ge
num
ber
in v
itro
V
ersc
haev
e, L
20
11
Gen
toxi
city
inve
stig
atio
n of
ELF
-m
agne
tic fi
elds
in S
alm
onel
la
typh
imur
ium
with
the
sens
itive
SO
S-
base
d VI
TOTO
X te
st
Bio
elec
trom
agne
tics
32 (7
) 58
0-58
4
in v
itro
Lu
ukko
nen,
J
2011
Pre
-exp
osur
e to
50
Hz
mag
netic
fiel
ds
mod
ifies
men
adio
ne-in
duce
d ge
noto
xic
effe
cts
in h
uman
SH
-SY
5Y
neur
obla
stom
a ce
lls
Pub
lishe
d on
line
in v
itro
In
ham
-Gar
ip, A
20
11
Effe
ct o
f ext
rem
ely
low
freq
uenc
y el
ectro
mag
netic
fiel
ds o
n gr
owth
rate
an
d m
orph
olog
y of
bac
teria
Inte
rnat
iona
l jou
rnal
of
radi
atio
n bi
olog
y ah
ead
of
prin
t
in v
itro
P
rato
, FS
2011
Th
e de
tect
ion
thre
shol
d fo
r ext
rem
ely
low
freq
uenc
y m
agne
tic fi
elds
may
be
belo
w 1
000
nT-H
z in
mic
e B
ioel
ectro
mag
netic
s 32
(7)
561-
569
in v
itro
C
olla
rd, J
F 20
11
In v
itro
stud
y of
the
effe
cts
of E
LF
elec
tric
field
s on
gen
e ex
pres
sion
in
hum
an e
pide
rmal
cel
ls
Bio
elec
trom
agne
tics
32 (1
) 28
-36
in v
itro
Zhan
g J,
Dew
ilde
AH
, Chi
nn P
, Fo
rem
an A
, Bar
ry
S, K
anne
D,
Bra
unhu
t SJ.
2011
Her
cept
in-d
irect
ed n
anop
artic
les
activ
ated
by
an a
ltern
atin
g m
agne
tic
field
sel
ectiv
ely
kill
HE
R-2
pos
itive
hu
man
bre
ast c
ells
in v
itro
via
hype
rther
mia
.
Int J
Hyp
erth
erm
ia.
27(7
68
2-97
.
in v
itro
Bay
at P
D, G
hanb
ari
A, S
aeid
B, K
haza
ei
M, G
horb
ani R
, A
yubi
an M
.
2011
E
ffect
of e
xpos
ure
to e
xtre
mel
y lo
w
elec
tro-m
agne
tic fi
eld
durin
g pr
enat
al
perio
d on
mic
e sp
leen
. In
dian
J E
xp B
iol
49(8
) 63
4-63
8
in v
itro
Hon
g M
E, Y
oon
KH
, Ju
ng Y
Y, L
ee T
J,
Par
k E
S, S
ohn
UD
, Je
ong
JH.
2011
Influ
ence
of e
xpos
ure
to e
xtre
mel
y lo
w
frequ
ency
mag
netic
fiel
d on
ne
uroe
ndoc
rine
cells
and
hor
mon
es in
st
omac
h of
rats
.
Kor
ean
J P
hysi
ol
Pha
rmac
ol
15(3
) 13
7-42
in v
itro
Pol
idor
i E, Z
eppa
S,
Pot
enza
L,
Mar
tinel
li C
, C
olom
bo E
, C
asad
ei L
, Ago
stin
i D
, Ses
tili P
, Sto
cchi
V
.
2011
Gen
e ex
pres
sion
pro
file
in c
ultu
red
hum
an u
mbi
lical
vei
n en
doth
elia
l cel
ls
expo
sed
to a
300
mT
stat
ic m
agne
tic
field
.
Bio
elec
trom
agne
tics
ahea
d of
pr
int
in v
itro
La
szlo
JF,
Por
szas
z R
. 20
11
Exp
osur
e to
sta
tic m
agne
tic fi
eld
dela
ys
indu
ced
pret
erm
birt
h oc
curre
nce
in
mic
e.
Am J
Obs
tet G
ynec
ol.
ahea
d of
pr
int

Them
e O
verv
iew
/ N
otes
Au
thor
D
ate
Publ
ishe
d Ti
tle
Jour
nal
Volu
me,
ch
apte
r Pa
ge
num
ber
in v
itro
The
resu
lts o
f thi
s st
udy
show
that
intra
cellu
lar C
a(2+
) ac
cum
ulat
ion
in c
ardi
ac v
entri
cles
can
incr
ease
in ra
ts
expo
sed
to E
LF m
agne
tic fi
eld
Ser
t C, S
oker
S,
Den
iz M
, Ner
giz
Y.
2011
In
trace
llula
r Ca
(2+)
leve
ls in
rat
vent
ricle
cel
ls e
xpos
ed to
ext
rem
ely
low
fre
quen
cy m
agne
tic fi
eld.
E
lect
rom
agn
Bio
l Med
30
(1)
14-2
0
in v
itro
Ste
m c
ells
exp
osed
to E
LF M
F to
eva
luat
e w
heth
er
expo
sure
affe
cts
grow
th, m
etab
olis
m a
nd d
iffer
entia
tion
of
stem
cel
ls. T
he re
sults
sug
gest
that
ELF
mag
netic
fiel
d m
ay in
fluen
ce th
e ea
rly d
evel
opm
ent o
f hM
SC
s re
late
d ad
ult c
ells
Yan
, J
2010
Effe
cts
of e
xtre
mel
y lo
w-fr
eque
ncy
mag
netic
fiel
d on
gro
wth
and
di
ffere
ntia
tion
of h
uman
mes
ench
ymal
st
em c
ells
Ele
ctro
mag
netic
bio
logy
an
d m
edic
ine
29 (4
) 16
5-76
in v
itro
Son
g H
S, K
im H
R,
Ko
MS
, Jeo
ng J
M,
Kim
YH
, Kim
MC
, H
wan
g Y
H, S
ohn
UD
, Gim
m Y
M,
Myu
ng S
H, S
im S
S.
2010
Effe
ct o
f Ext
rem
ely
Low
Fre
quen
cy
Ele
ctro
mag
netic
Fie
lds
(EM
F) o
n P
hosp
holip
ase
Act
ivity
in th
e C
ultu
red
Cel
ls.
Kor
ean
J P
hysi
ol
Pha
rmac
ol
14(6
) 42
7-43
3
in v
itro
Fr
iedl
AA
, Rüh
m W
. 20
10
Edi
toria
l exp
ress
ion
of c
once
rn
rega
rdin
g: P
ilger
A e
t al.
(200
4) N
o ef
fect
s of
inte
rmitt
ent 5
0 H
z E
MF
on
cyto
plas
mic
free
cal
cium
and
on
the
mito
chon
dria
l mem
bran
e po
tent
ial i
n hu
man
dip
loid
fibr
obla
sts,
Rad
iat
Env
iron
Bio
phys
43:
203-
207.
Rad
iat E
nviro
n B
ioph
ys
49(3
) 29
3-4
in v
itro
Y
ang
Y, T
ao C
, Zh
ao D
, Li F
, Zha
o W
, Wu
H.
2010
EM
F ac
ts o
n ra
t bon
e m
arro
w
mes
ench
ymal
ste
m c
ells
to p
rom
ote
diffe
rent
iatio
n to
ost
eobl
asts
and
to
inhi
bit d
iffer
entia
tion
to a
dipo
cyte
s.
Bio
elec
trom
agne
tics
31(4
) 27
7-85
in v
itro
S
un W
, Tan
Q, P
an
Y, F
u Y
, Zha
ng D
, Lu
D, C
hian
g H
. 20
10
Sup
erim
posi
tion
of a
n in
cohe
rent
m
agne
tic fi
eld
elim
inat
ed th
e in
hibi
tion
of h
orm
one
secr
etio
n in
duce
d by
a 5
0-H
z m
agne
tic fi
eld
in h
uman
villo
us
troph
obla
sts
in v
itro.
Cel
l Phy
siol
Bio
chem
26
(4-5
) 79
3-8
in v
itro
Mas
uda
H, d
e G
anne
s FP
, Har
o E,
B
illau
del B
, Ruf
fle
G, L
agro
ye I,
Vey
ret
B.
2010
Lack
of e
ffect
of 5
0-H
z m
agne
tic fi
eld
expo
sure
on
the
bind
ing
affin
ity o
f se
roto
nin
for t
he 5
-HT
1B re
cept
or
subt
ype.
Bra
in R
es.
1368
44
-51
in v
itro
K
im J
, Ha
CS
, Lee
H
J, S
ong
K.
2010
Rep
etiti
ve e
xpos
ure
to a
60-
Hz
time-
vary
ing
mag
netic
fiel
d in
duce
s D
NA
do
uble
-stra
nd b
reak
s an
d ap
opto
sis
in
hum
an c
ells
.
Bio
chem
Bio
phys
Res
C
omm
un.
400(
4)
739-
44

Them
e O
verv
iew
/ N
otes
Au
thor
D
ate
Publ
ishe
d Ti
tle
Jour
nal
Volu
me,
ch
apte
r Pa
ge
num
ber
in v
itro
S
un W
, Tan
Q, P
an
Y, F
u Y
, Sun
H,
Chi
ang
H.
2010
Effe
cts
of 5
0-H
z m
agne
tic fi
eld
expo
sure
on
horm
one
secr
etio
n an
d ap
opto
sis-
rela
ted
gene
exp
ress
ion
in
hum
an fi
rst t
rimes
ter v
illou
s tro
phob
last
s in
vitr
o.
Bio
elec
trom
agne
tics.
31
(7)
566-
72
in v
itro
M
anne
rling
AC
, S
imkÃ
³ M, M
ild K
H,
Mat
tsso
n M
O.
2010
Effe
cts
of 5
0-H
z m
agne
tic fi
eld
expo
sure
on
supe
roxi
de ra
dica
l ani
on
form
atio
n an
d H
SP70
indu
ctio
n in
hu
man
K56
2 ce
lls.
Rad
iat E
nviro
n B
ioph
ys.
49(4
) 73
1-41
in v
itro
Oku
dan
N, C
elik
I,
Sal
baca
k A
, C
icek
ciba
si A
E,
Buy
ukm
umcu
M,
Gok
bel H
.
2010
Effe
cts
of lo
ng-te
rm 5
0 H
z m
agne
tic
field
exp
osur
e on
the
mic
ro n
ucle
ated
po
lych
rom
atic
ery
thro
cyte
and
blo
od
lym
phoc
yte
frequ
ency
and
arg
yrop
hilic
nu
cleo
lar o
rgan
izer
regi
ons
in
lym
phoc
ytes
of m
ice.
Neu
ro E
ndoc
rinol
Let
t. 31
(2)
208-
14
in v
itro
Gul
turk
S,
Dem
irkaz
ik A
, K
osar
I, C
etin
A,
Dok
met
as H
S,
Dem
ir T.
2010
Effe
ct o
f exp
osur
e to
50
Hz
mag
netic
fie
ld w
ith o
r with
out i
nsul
in o
n bl
ood-
brai
n ba
rrier
per
mea
bilit
y in
st
rept
ozot
ocin
-indu
ced
diab
etic
rats
.
Bio
elec
trom
agne
tics
31(4
) 26
2-9
in v
itro
S
un H
, Che
Y, L
iu
X, Z
hou
D, M
iao
Y,
Ma
Y.
2010
E
ffect
s of
pre
nata
l exp
osur
e to
a 5
0-H
z m
agne
tic fi
eld
on o
ne-tr
ial p
assi
ve
avoi
danc
e le
arni
ng in
1-d
ay-o
ld c
hick
s.
Bio
elec
trom
agne
tics
31(2
) 15
0-5
in v
itro
Thes
e re
sults
con
vinc
ingl
y pr
ove
the
nega
tive
effe
ct o
f E
MF
on th
e an
tiest
roge
nic
effe
ct o
f mel
aton
in in
bre
ast
canc
er c
ells
. G
irger
t, R
20
10
Sig
nal t
rans
duct
ion
of th
e m
elat
onin
re
cept
or M
T1 is
dis
rupt
ed in
bre
ast
canc
er c
ells
by
elec
trom
agne
tic fi
elds
Bio
elec
trom
agne
tics
31(3
) 23
7-45
in v
itro
R
uiz-
Gom
ez, M
J 20
09
Ele
ctro
mag
netic
fiel
ds a
nd th
e in
duct
ion
of D
NA
stra
nd b
reak
s E
lect
rom
agne
tic b
iolo
gy
and
med
icin
e 28
(2)
201-
214
in v
itro
S
trasc
k L,
B
árt
ovÃ
¡ E, K
rejc
i J,
Foj
t L, V
ette
rl V.
20
09
Effe
cts
of E
LF-E
MF
on b
rain
pro
tein
s in
m
ice.
E
lect
rom
agne
tic b
iolo
gy
and
med
icin
e 28
(1)
96-1
04
in v
itro
P
ourli
s A
F.
2009
R
epro
duct
ive
and
deve
lopm
enta
l ef
fect
s of
EM
F in
ver
tebr
ate
anim
al
mod
els.
P
atho
phys
iolo
gy
16(2
-3)
179-
89
in v
itro
G
obba
F, B
arge
llini
A
, Sca
ringi
M,
Bra
vo G
, Bor
ella
P.
2009
Ext
rem
ely
low
freq
uenc
y-m
agne
tic
field
s (E
LF-E
MF)
occ
upat
iona
l ex
posu
re a
nd n
atur
al k
iller
act
ivity
in
perip
hera
l blo
od ly
mph
ocyt
es.
Sci
Tot
al E
nviro
n 40
7(3)
12
18-1
223

Them
e O
verv
iew
/ N
otes
Au
thor
D
ate
Publ
ishe
d Ti
tle
Jour
nal
Volu
me,
ch
apte
r Pa
ge
num
ber
in v
itro
The
findi
ngs
indi
cate
that
the
oxid
ativ
e st
ress
resu
lting
fro
m e
xpos
ure
to 5
0 H
z m
agne
tic fi
eld
of 1
0 m
T in
duct
ion
may
pro
duce
a n
umbe
r of a
dver
se e
ffect
s w
ithin
the
cell
and
thus
may
lead
to s
yste
mic
dis
turb
ance
s in
the
hum
an
body
Hen
ryko
wsk
a G
, Ja
nkow
ski W
, P
acho
lski
K,
Lew
icka
M,
Smig
iels
ki J
, D
zied
zicz
ak-
Buc
zyns
ka M
, B
uczy
nski
A.
2009
Th
e ef
fect
of 5
0 hz
mag
netic
fiel
d of
di
ffere
nt s
hape
on
oxyg
en m
etab
olis
m
in b
lood
pla
tele
ts: i
n vi
tro s
tudi
es.
Int J
Occ
up M
ed
Env
iron
Hea
lth
22(3
) 26
9-76
in v
itro
Ja
nac
B, T
ovilo
vic
G, T
omic
M, P
rolic
Z,
Rad
enov
ic L
. 20
09
Effe
ct o
f con
tinuo
us e
xpos
ure
to
alte
rnat
ing
mag
netic
fiel
d (5
0 H
z, 0
.5
mT)
on
sero
toni
n an
d do
pam
ine
rece
ptor
s ac
tivity
in ra
t bra
in.
Gen
Phy
siol
Bio
phys
. 28
Spe
c N
o:41
-6.
in v
itro
Con
clud
ed th
at e
xpos
ure
to th
e EL
F-E
MFs
for d
iffer
ent
time
perio
ds p
rodu
ced
sign
ifica
nt d
ecre
ases
in p
lasm
a ca
tala
se a
ctiv
ities
in th
e 3-
mon
th e
xpos
ure
grou
ps b
ut n
o ef
fect
s on
pro
gest
eron
e le
vel,
on 1
7-be
ta e
stra
diol
leve
l, or
on
the
mor
phol
ogy
and
wei
ght o
f ute
rus
and
ovar
ies
Ayd
in, M
20
09
Eva
luat
ion
of h
orm
onal
cha
nge,
bi
oche
mic
al p
aram
eter
s, a
nd
hist
opat
holo
gica
l sta
tus
of u
teru
s in
rats
ex
pose
d to
50-
Hz
elec
trom
agne
tic fi
eld
Toxi
colo
gica
l and
In
dust
rial H
ealth
25
(3)
153-
8
in v
itro
A
l-Akh
ras
MA.
20
08
Influ
ence
of 5
0 H
z m
agne
tic fi
eld
on
sex
horm
ones
and
bod
y, u
terin
e, a
nd
ovar
ian
wei
ghts
of a
dult
fem
ale
rats
. E
lect
rom
agn
Bio
l Med
. 27
(2)
155-
63
in v
itro
K
eklik
ci U
, Akp
olat
V
, Oze
kinc
i S, U
nlu
K, C
elik
MS
. 20
08
The
effe
ct o
f ext
rem
ely
low
freq
uenc
y m
agne
tic fi
eld
on th
e co
njun
ctiv
a an
d go
blet
cel
ls.
Cur
r Eye
Res
. 33
(5)
441-
6
in v
itro
E
rdal
N, G
urgu
l S,
Tam
er L
, Aya
z L.
20
08
Effe
cts
of lo
ng-te
rm e
xpos
ure
of
extre
mel
y lo
w fr
eque
ncy
mag
netic
fiel
d on
oxi
dativ
e/ni
trosa
tive
stre
ss in
rat
liver
.
J R
adia
t Res
(Tok
yo)
49(2
) 18
1-7
in v
itro
Stu
dy fo
und
no c
hang
es in
tran
scrip
t pro
tein
leve
l on
the
auto
nom
ic n
ervo
us s
yste
m a
nd c
atec
hola
min
ergi
c sy
stem
B
enfa
nte,
R
2008
The
expr
essi
on o
f PH
OX2
A, P
HO
X2B
an
d of
thei
r tar
get g
ene
dopa
min
e-be
ta-h
ydro
xyla
se (D
beta
H) i
s no
t m
odifi
ed b
y ex
posu
re to
ext
rem
ely-
low
-fre
quen
cy e
lect
rom
agne
tic fi
eld
(ELF
-E
MF)
in a
hum
an n
euro
nal m
odel
.
Toxi
colo
gy in
vitr
o 22
(6)
1489
-95
in v
itro
Torre
s-D
uran
PV,
Fe
rreira
-Her
mos
illo
A, J
uare
z-O
rope
za
MA
, Elia
s-V
iña
s D
, V
erdu
go-D
iaz
L.
2007
Effe
cts
of w
hole
bod
y ex
posu
re to
ex
trem
ely
low
freq
uenc
y el
ectro
mag
netic
fiel
ds (E
LF-E
MF)
on
seru
m a
nd li
ver l
ipid
leve
ls, i
n th
e ra
t.
Lipi
ds H
ealth
Dis
16
;6
31

Them
e O
verv
iew
/ N
otes
Au
thor
D
ate
Publ
ishe
d Ti
tle
Jour
nal
Volu
me,
ch
apte
r Pa
ge
num
ber
in v
itro
Roy
chou
dhur
y, S
20
09
Influ
ence
of a
50
Hz
extra
low
fre
quen
cy e
lect
rom
agne
tic fi
eld
on
sper
mat
ozoa
mot
ility
and
ferti
lisat
ion
rate
s in
rabb
its
Jour
nal o
f en
viro
nmen
tal s
cien
ce
and
heal
th
44(1
0)
1041
-104
7
in v
ivo
C
am, S
T 20
11
Occ
upat
iona
l exp
osur
e to
mag
netic
fie
lds
from
tran
sfor
mer
sta
tions
and
el
ectri
c en
clos
ures
in T
urke
y
Ele
ctro
mag
netic
bio
logy
an
d m
edic
ine
30 (2
) 74
-79
in v
ivo
G
obba
, F
2011
Occ
upat
iona
l and
env
ironm
enta
l ex
posu
re to
ext
rem
ely
low
freq
uenc
y m
agne
tic fi
elds
: a p
erso
nal m
onito
ring
stud
y in
a la
rge
grou
p of
wor
kers
in
Italy
Jour
nal o
f Exp
osur
e S
cien
ce a
nd
Env
ironm
enta
l E
pide
mio
logy
Ahe
ad o
f pr
int
in v
ivo
Spo
t mea
sure
men
t of E
LF E
MF
and
RF
over
8 y
ears
co
verin
g 35
mun
icip
aliti
es in
Ser
bia.
Pap
er p
rese
nts
a su
mm
ary
of v
alue
s m
easu
red
in h
ouse
hold
s un
dern
eath
ov
erhe
ad p
ower
line
s. M
easu
red
leve
ls b
elow
ICN
IRP
guid
elin
e sa
fe v
alue
s
Vul
evic
, B
2011
S
urve
y of
ELF
mag
netic
fiel
d le
vels
in
hous
ehol
ds n
ear o
verh
ead
pow
er li
nes
in S
erbi
a
Rad
iatio
n P
rote
ctio
n D
osim
etry
14
5 (4
) 38
5-38
8
in v
ivo
Res
iden
tial p
roxi
mity
to tr
ansm
issi
on li
nes
is u
nlik
ely
to b
e as
soci
ated
with
stil
lbirt
h, b
ut m
ore
rese
arch
is n
eede
d to
ru
le o
ut a
pos
sibl
e lin
k A
uger
, N
2011
Stil
lbirt
h an
d re
side
ntia
l pro
xim
ity to
ex
trem
ely
low
freq
uenc
y po
wer
tra
nsm
issi
on li
nes:
a re
trosp
ectiv
e co
hort
stud
y
Occ
upat
iona
l and
E
nviro
nmen
tal M
edic
ine
Ahe
ad o
f pr
int
in v
ivo
Rev
iew
whi
ch c
onsi
ders
the
limita
tion
of th
e m
etho
dolo
gy
for m
easu
ring
expo
sure
(poi
nt in
tim
e m
easu
rem
ents
in
hom
es) a
nd e
vide
nce
of w
heth
er E
MF
is c
arci
noge
nic
M
iller
, AB
2010
E
lect
ric a
nd m
agne
tic fi
elds
at p
ower
fre
quen
cies
C
hron
ic D
isea
ses
in
Can
ada
29 S
uppl
1
69-8
3
in v
ivo
B
aldi
, I
2010
Occ
upat
iona
l and
resi
dent
ial e
xpos
ure
to e
lect
rom
agne
tic fi
elds
and
risk
of
brai
n tu
mor
s in
adu
lts: A
cas
e-co
ntro
l st
udy
in G
irond
e, F
ranc
e
Inte
rnat
iona
l jou
rnal
of
canc
er
Ahe
ad o
f pr
int
in v
ivo
To
mits
ch, J
20
10
Sur
vey
of e
lect
rom
agne
tic fi
eld
expo
sure
in b
edro
oms
of re
side
nces
in
low
er A
ustri
a B
ioel
ectro
mag
netic
s 31
(3)
200-
208
in v
ivo
K
roll,
ME
2010
Chi
ldho
od c
ance
r and
mag
netic
fiel
ds
from
hig
h-vo
ltage
pow
er li
nes
in
Eng
land
and
Wal
es: a
cas
e-co
ntro
l st
udy
Brit
ish
Jour
nal o
f C
ance
r 10
3(7)
11
22-7
in v
ivo
C
akir,
DU
20
09
Alte
ratio
ns o
f hae
mat
olog
ical
var
iatio
ns
in ra
ts e
xpos
ed to
ext
rem
ely
low
fre
quen
cy m
agne
tic fi
elds
(50H
z)
Arc
hive
s of
med
ical
re
sear
ch
40(5
) 35
2-35
6

Them
e O
verv
iew
/ N
otes
Au
thor
D
ate
Publ
ishe
d Ti
tle
Jour
nal
Volu
me,
ch
apte
r Pa
ge
num
ber
in v
ivo
D
uyan
G, X
u G
, Yu
H, Y
ang
S, Y
ang
Q,
Yan
W.
2008
M
odel
ling
of e
lect
rom
agne
tic
envi
ronm
ent o
f tra
nsm
issi
on li
nes
for
stud
ying
effe
ct o
f ELF
-EM
F.
Con
f Pro
c IE
EE
Eng
M
ed B
iol S
oc
13
31-4
in v
ivo
Je
ffers
, D
2007
Tr
ansm
issi
on li
nes,
EM
F an
d po
pula
tion
mix
ing.
R
adia
tion
Pro
tect
ion
Dos
imet
ry
123(
3)
398-
401
mag
netic
fiel
d
Yos
t MG
20
11
A re
curri
ng q
uest
ion:
are
ther
e he
alth
ef
fect
s of
pow
er fr
eque
ncy
mag
netic
fie
lds
Arc
hive
s of
pae
diat
ric
and
adol
esce
nt
med
icin
e 16
5 (1
0)
959-
961
mag
netic
fiel
d
Gio
rgi,
G
2011
Effe
ct o
f ext
rem
ely
low
freq
uenc
y m
agne
tic fi
eld
expo
sure
on
DN
A
trans
posi
tion
in re
latio
n to
freq
uenc
y,
wav
e sh
ape
and
expo
sure
tim
e
Inte
rnat
iona
l jou
rnal
of
radi
atio
n bi
olog
y 87
(6)
601-
608
mag
netic
fiel
d
Exa
min
es s
tudi
es in
to E
LF-M
F an
d th
e ris
k of
chi
ldho
od
leuk
aem
ia. C
oncl
udes
that
the
asse
ssm
ent t
hat E
LF-M
F ar
e a
poss
ible
car
cino
gen
and
may
cau
se c
hild
hood
le
ukae
mia
rem
ains
val
id
Sch
üz, J
20
11
Exp
osur
e to
ext
rem
ely
low
-freq
uenc
y m
agne
tic fi
elds
and
the
risk
of
child
hood
can
cer:
upda
te o
f the
ep
idem
iolo
gica
l evi
denc
e
Pro
gres
s in
Bio
phys
ics
and
Mol
ecul
ar B
iolo
gy
Ahe
ad o
f pr
int
mag
netic
fiel
d
Del
Sep
pia
C,
Men
cacc
i R, L
usch
i P
, Var
anin
i M,
Ghi
one
S.
2011
D
iffer
entia
l mag
netic
fiel
d ef
fect
s on
he
art r
ate
and
noci
cept
ion
in a
nosm
ic
pige
ons.
B
ioel
ectro
mag
netic
s.
ahea
d of
pr
int
mag
netic
fiel
d
Hou
pt T
A, C
asse
ll J,
Car
ella
L, N
eth
B,
Smith
JC
. 20
11
Hea
d til
t in
rats
dur
ing
expo
sure
to a
hi
gh m
agne
tic fi
eld.
P
hysi
ol B
ehav
. 10
5(2)
38
8-39
3
mag
netic
fiel
d
Isla
s R
, Hei
ne T
, M
erin
o G
. 20
11
The
Indu
ced
Mag
netic
Fie
ld.
Acc
Che
m R
es.
ahea
d of
pr
int
mag
netic
fiel
d
Sul
pizi
o M
, Fal
one
S, A
mic
arel
li F,
M
arch
isio
M, D
i G
iuse
ppe
F,
Ele
uter
io E
, Di I
lio
C, A
ngel
ucci
S.
2011
Mol
ecul
ar b
asis
und
erly
ing
the
biol
ogic
al e
ffect
s el
icite
d by
ext
rem
ely
low
-freq
uenc
y m
agne
tic fi
eld
(ELF
-MF)
on
neu
robl
asto
ma
cells
.
J C
ell B
ioch
em.
ahea
d of
pr
int
mag
netic
fiel
d A
n ev
alua
tion
of m
etho
ds fo
r cla
ssify
ing
apar
tmen
ts in
ex
posu
re c
ateg
orie
s fo
r ELF
-MF
base
d on
pro
xim
ity to
the
trans
form
er s
tatio
n
Roo
sli M
, Jen
ni D
, K
heife
ts L
, Mez
ei G
. 20
11
Ext
rem
ely
low
freq
uenc
y m
agne
tic fi
eld
mea
sure
men
ts in
bui
ldin
gs w
ith
trans
form
er s
tatio
ns in
Sw
itzer
land
. S
ci T
otal
Env
iron
40
9(18
) 33
64-9

Them
e O
verv
iew
/ N
otes
Au
thor
D
ate
Publ
ishe
d Ti
tle
Jour
nal
Volu
me,
ch
apte
r Pa
ge
num
ber
mag
netic
fiel
d
de B
ruyn
L, d
e Ja
ger L
. 20
10
Effe
ct o
f lon
g-te
rm e
xpos
ure
to a
ra
ndom
ly v
arie
d 50
Hz
pow
er
frequ
ency
mag
netic
fiel
d on
the
ferti
lity
of th
e m
ouse
.
Ele
ctro
mag
n B
iol M
ed
29(1
-2)
52-6
1
mag
netic
fiel
d
McN
amee
DA,
C
orba
cio
M, W
elle
r JK
, Bro
wn
S,
Sto
dilk
a R
Z, P
rato
FS
, Bur
eau
Y,
Thom
as A
W,
Legr
os A
G.
2010
Th
e re
spon
se o
f the
hum
an c
ircul
ator
y sy
stem
to a
n ac
ute
200-
uT, 6
0-H
z m
agne
tic fi
eld
expo
sure
.
Int A
rch
Occ
up E
nviro
n H
ealth
. 84
(3)
267-
77
mag
netic
fiel
d
McN
amee
DA,
C
orba
cio
M, W
elle
r JK
, Bro
wn
S, P
rato
FS
, Tho
mas
AW
, Le
gros
AG
.
2010
Th
e ca
rdio
vasc
ular
resp
onse
to a
n ac
ute
1800
-mic
roT,
60-
Hz
mag
netic
fie
ld e
xpos
ure
in h
uman
s.
Int A
rch
Occ
up E
nviro
n H
ealth
83
(4)
441-
54
mag
netic
fiel
d
Bot
tura
, V
2009
Urb
an e
xpos
ure
to E
LF m
agne
tic fi
eld
due
to h
igh,
med
ium
and
low
vol
tage
el
ectri
city
sup
ply
netw
orks
Rad
iatio
n P
rote
ctio
n D
osim
etry
13
7 (3
-4)
201-
205
mag
netic
fiel
d
Cve
tkov
ic D
, Cos
ic
I. 20
09
Alte
ratio
ns o
f hum
an
elec
troen
ceph
alog
raph
ic a
ctiv
ity
caus
ed b
y m
ultip
le e
xtre
mel
y lo
w
frequ
ency
mag
netic
fiel
d ex
posu
res.
Med
Bio
l Eng
Com
put
47(1
0)
1063
-73
mag
netic
fiel
d
Alb
ert G
C,
McN
amee
JP
, M
arro
L, B
ellie
r PV
, P
rato
FS
, Tho
mas
AW
.
2009
Ass
essm
ent o
f gen
etic
dam
age
in
perip
hera
l blo
od o
f hum
an v
olun
teer
s ex
pose
d (w
hole
-bod
y) to
a 2
00 µ
T, 6
0 H
z m
agne
tic fi
eld.
Int J
Rad
iat B
iol.
85
(2)
144-
152
mag
netic
fiel
d S
tudy
dem
onst
rate
s m
etho
d fo
r cla
ssify
ing
apar
tmen
ts
into
hig
h or
low
exp
osur
e ba
sed
on th
eir l
ocat
ion
in
rela
tion
to tr
ansf
orm
ers
Thur
oczy
G,
Jano
ssy
G, N
agy
N,
Bak
os J
, Sza
bo J
, M
ezei
G.
2008
E
xpos
ure
to 5
0 H
z m
agne
tic fi
eld
in
apar
tmen
t bui
ldin
gs w
ith b
uilt-
in
trans
form
er s
tatio
ns in
Hun
gary
. R
adia
t Pro
t Dos
imet
ry.
131(
4)
469-
73
mag
netic
fiel
d
Nev
elst
een,
S
2007
E
ffect
s of
info
rmat
ion
and
50 H
z m
agne
tic fi
elds
on
cogn
itive
pe
rform
ance
and
repo
rted
sym
ptom
s B
ioel
ectro
mag
netic
s 28
(1)
53-6
3

Them
e O
verv
iew
/ N
otes
Au
thor
D
ate
Publ
ishe
d Ti
tle
Jour
nal
Volu
me,
ch
apte
r Pa
ge
num
ber
Upd
ated
lite
ratu
re s
earc
h re
sults
for e
pide
mio
logi
cal s
tudi
es o
f chi
ldho
od le
ukae
mia
and
EM
F pu
blis
hed
in 2
013
to M
arch
201
4
epid
emio
logi
cal
Poo
led
anal
ysis
of n
ine
exis
ting
stud
ies.
Zh
ao, L
. et a
l 20
14
Mag
netic
fiel
ds e
xpos
ure
and
child
hood
le
ukem
ia ri
sk: A
met
a-an
alys
is b
ased
on
11,
699
case
s an
d 13
,194
con
trols
Le
ukem
ia R
esea
rch
38 (3
) 26
9-27
4
epid
emio
logi
cal
Bas
ed o
n di
stan
ce fr
om o
verh
ead
lines
. S
erm
age-
Faur
e, C
. et
al
2013
C
hild
hood
leuk
aem
ia c
lose
to h
igh-
volta
ge p
ower
line
s –
the
Geo
cap
stud
y, 2
002–
2007
Brit
ish
Jour
nal o
f C
ance
r 10
8 18
99-1
906
epid
emio
logi
cal
Dan
ish
stud
y fo
llow
ing
appr
oach
of D
rape
r stu
dy
Ped
erse
n, C
. et a
l 20
14
Dis
tanc
e fro
m re
side
nce
to p
ower
line
an
d ris
k of
chi
ldho
od le
ukem
ia: a
po
pula
tion-
base
d ca
se–c
ontro
l stu
dy in
D
enm
ark
Can
cer C
ause
s an
d C
ontro
l 25
(2)
171-
177
epid
emio
logi
cal
Sec
ond
upda
te to
Dra
per s
tudy
, add
ing
data
from
S
cotla
nd a
nd fo
r 132
kV
lines
, and
inve
stig
atin
g ris
k tre
nd
over
tim
e.
Bun
ch, L
. et a
l 20
14
Res
iden
tial d
ista
nce
at b
irth
from
ov
erhe
ad h
igh-
volta
ge p
ower
lines
: ch
ildho
od c
ance
r ris
k in
Brit
ain
1962
–20
08
Brit
ish
Jour
nal o
f C
ance
r 11
0 14
02-1
408
epid
emio
logi
cal
(met
hodo
logy
) M
etho
dolo
gy fo
r rep
licat
ion
of D
rape
r stu
dy in
Cal
iforn
ia.
Res
ults
not
yet
pub
lishe
d.
Khe
ifets
, L. e
t al
2013
Epi
dem
iolo
gic
stud
y of
resi
dent
ial
prox
imity
to tr
ansm
issi
on li
nes
and
child
hood
can
cer i
n C
alifo
rnia
: de
scrip
tion
of d
esig
n, e
pide
mio
logi
c m
etho
ds a
nd s
tudy
pop
ulat
ion
Jour
nal o
f Exp
osur
e S
cien
ce a
nd
Env
ironm
enta
l E
pide
mio
logy
Ahe
ad o
f pr
int
epid
emio
logi
cal
Inve
stig
ated
pop
ulat
ion
mix
ing
hypo
thes
is, p
revi
ousl
y su
gges
ted
for e
xces
s ch
ildho
od le
ukae
mia
risk
ass
ocia
ted
with
nuc
lear
site
s S
wan
son,
J.
2013
R
esid
entia
l mob
ility
of p
opul
atio
ns n
ear
UK
pow
er li
nes
and
impl
icat
ions
for
child
hood
leuk
aem
ia.
Jour
nal o
f Rad
iolo
gica
l P
rote
ctio
n 33
(3)
9-14
epid
emio
logi
cal
[Arti
cle
is in
Dut
ch].
Eng
lish
abst
ract
indi
cate
s th
at a
ca
ncer
clu
ster
inve
stig
atio
n fo
r chi
ldho
od le
ukae
mia
was
un
derta
ken
incl
udin
g re
view
of d
ata
rega
rdin
g a
loca
l hi
gh-v
olta
ge p
ower
line
.
Heg
ger,
C. a
nd
Ree
djik
, A.
2013
Chi
ldho
od le
ukae
mia
in a
resi
dent
ial
area
with
a h
igh-
volta
ge p
ower
line
: ap
proa
ch a
ccor
ding
to th
e D
utch
C
omm
unity
Hea
lth S
ervi
ces'
gui
delin
e 'C
ance
r C
lust
ers'
Ned
erla
nds
Tijd
schr
ift
voor
Gen
eesk
unde
15
7

rpsgroup.com
Appendix 2: Measurement Locations Map

Appendix 3: Narda EHP-50D Calibration Documents


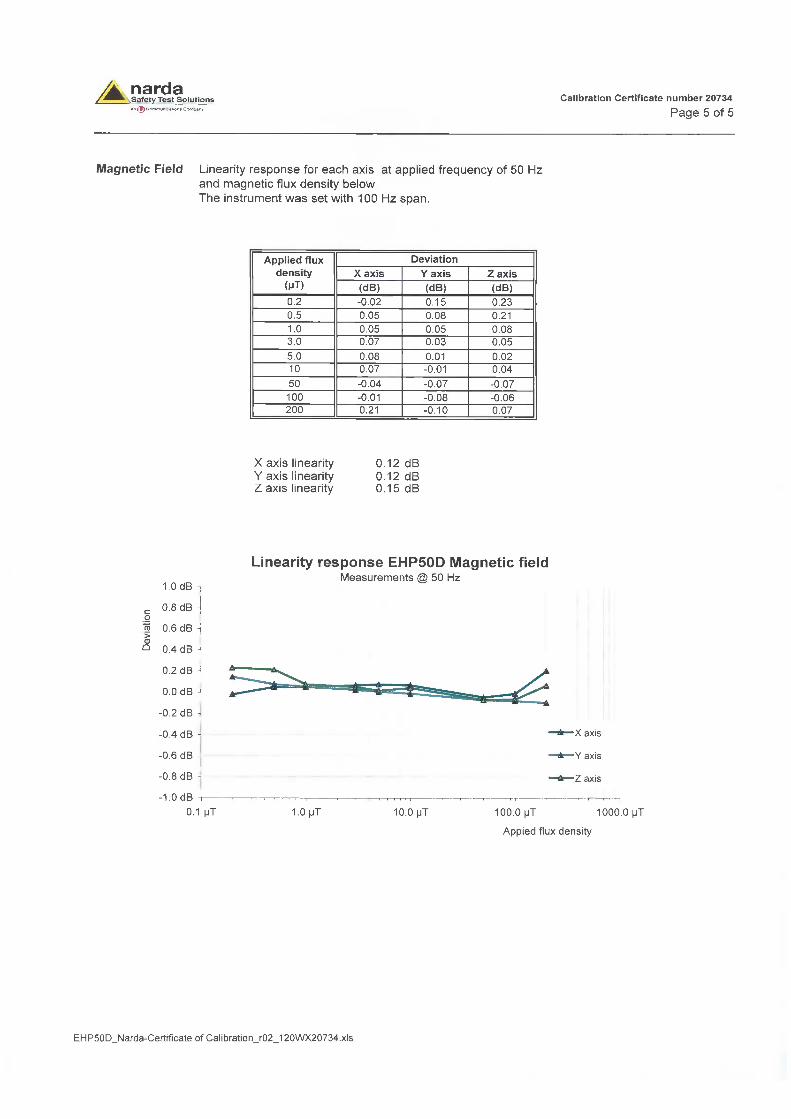


References
[1] Department of Communications, Marine and Natural Resources, “Health Effects of Electromagnetic
Fields,” Dublin, Ireland, 2007.
[2] Health Protection Agency, “Ionising radiation and how we are exposed to it,” 04 09 2008. [Online].
Available:
http://www.hpa.org.uk/Topics/Radiation/UnderstandingRadiation/UnderstandingRadiationTopics/Ris
ksFromLowLevelsOfIonisingRadiation/risks_Exposure/. [Accessed 04 05 2012].
[3] WHO, “What is ionising radiation?,” 2012. [Online]. Available:
www.who.int/ionizing_radiation/about/what_is_ir/en/index.html. [Accessed 04 05 12].
[4] M. Maslanyj, T. Mee and S. Allen, “Investigation and Identification of Sources of Residential
Magnetic Field Exposures in the United Kingdom Childhood Cancer Study (UKCCS),” 2005.
[5] ICNIRP, “Guidelines for Limiting Exposures to Time-Varying Electric, Magnetic and Electromagnetic
Fields (Up to 300 GHz),” Health Physics, vol. 74, no. 4, pp. 494-522, 1998.
[6] ICNIRP, “Guidelines for Limiting Exposure to Time-Varying Electric and Magnetic Fields (1 Hz to 100
kHz),” Health Physics, vol. 99, no. 6, pp. 818-836, 2010.
[7] EirGrid, “Information on Electric and Magnetic Fields,” Dublin, Ireland, 2007.
[8] ESB, “Electric and Magnetic Fields in the Environment,” Dublin, Ireland, 1999.
[9] J. Swanson, “Magnetic Fields From Transmission Lines: Comparison of Calculations and
Measurements.,” IEE Proceedings, Generation, Transmission and Distribution, vol. 42, no. 5, pp.
481-486, 1995.
[10] R. Wilkinson and M. (. Marmot, “Social determinants of health: the solid facts. 2nd edition.,” World
Health Organisation, Denmark, 2003.
[11] WHO, “Environmental Health Criteria 238. Extremely Low Frequency Fields,” WHO, 2007.
[12] WHO International Agency for Research on Cancer, “IARC Monoghraphs on the Evaluation of
Carcinogenic Risks to Humans, Volume 80 Non-ionising Radiation, Part 1: Static and Extremely
Low-Frequency (ELF),” IARCPress, 2002.

[13] UK Childhood Cancer Study, “Childhood Cancer and Residential Proximity to Power Lines,” British
Journal of Cancer, vol. 83, no. 11, pp. 1573-1580, 2000.
[14] G. Draper, T. Vincent and J. Swanson, “Childhood cancer in relation to distance from high voltage
power lines in England and Wales: a case control study,” British Medical Journal, vol. 330, no. 7503,
p. 1290, 04 06 2005.
[15] J. Swanson, T. Vincent, M. Kroll and G. Draper, “Childhood cancer and magnetic fields from high-
voltage power lines in England and Wales: a case control study,” British Journal of Cancer, vol. 103,
pp. 1122-1127, 2010.
[16] D. O'Sullivan, “A Review of Recent Investigations into the Possible Health Effects of Exposure to
Electromagnetic Fields (EMF) from Power Lines,” Dublin Institute for Advanced Studies, 2011.
[17] International Commission on Non-ionizing Radiation Protection., “ICNIRP guidelines for Limiting
Exposure to Time Varying Electric and Magnetic Fields (1 Hz 0 100 kHz),” Health Physics, vol. 99,
no. 6, pp. 818-836, 2010.
[18] Scientific Committee on Emerging and Newly Identified Health Risks (SCENIHR), “Health Effects of
Exposure to EMF,” European Comission, 2009.
[19] Health Protection Agency, “Power Frequency Electromagnetic Fields. Melatonin and the Risk of
Breast Cancer. Report of an Independent Advisory Group on Non-ionising Ratiation.,” Health
Protection Agency, 2006.
[20] A. Schüz and A. Ahlbom, “Exposure to Electromagnetic Fields and the Risk of Childhood
Leukaemia: A Review.,” Radiation Protection Dosimetry, vol. 132, no. 2, pp. 202-211, 2008.
[21] J. Schüz, “Exposure to Extremely Low-Frequency Magnetic Fields and the Risk of Childhood
Cancer: Update of the Epidemiological Evidence,” Progress in Biophysics and Molecular Biology,
vol. 107, pp. 339-342, 2011.
[22] M. Otto and K. Ernst Von Muhlendahl, “Electromagnetic Fields (EMF): Do they play a role in
Chldren‟s Environmental Health (CEH),” International Journal of Hygiene and Environmental Health,
vol. 210, pp. 635-644, 2007.
[23] A. Ahlbom, “A Pooled Analysis of Magnetic Fields and Childhood Leukaemia,” British Journal of
Cancer, vol. 83, pp. 689-692, 2000.
[24] L. Kheifets, “Pooled Analysis of Recent Studies on Magnetic Fields and Childhood Leukaemia,”
British Journal of Cancer, vol. 103, pp. 1128-1135, 2010.

[25] M. Maslanyj, J. Simpson, E. Roman and J. Schüz, “Power Frequency Magnetic Fields and Risk of
Childhood Leukaemia: Misclassification of Exposure from the Use of the „Distance from Power Line‟
Exposure Surrogate.,” Bioelectromagnetics, vol. 30, pp. 183-188, 2009.
[26] K. Bunch, T. Keegan, J. Swanson, T. Vincent and M. Murphy, “Residential distance at birth from
overhead high-voltage powerlines: childhood cancer risk in Britain 1962-2008,” British Journal of
Cancer, vol. 110, pp. 1402-1408, 2014.
[27] C. Pedersen, O. Raaschou-Nielsen, N. Rod, P. Frei, A. Poulsen, C. Johansen and J. Schüz,
“Distance from residence to power line and risk of childhood leukemia: a population-based case-
control study in Denmark,” Cancer Causes and Control, vol. 25, no. 2, pp. 171-177, 2014.
[28] L. Kheifets, C. Crespi, C. Hooper, M. Oksuzyan, T. Ly and G. Mezei, “Epidemiologic study of
residential proximity to transmission lines and childhood cancer in California: description of design,
epidemiologic methods and study population,” Journal of Exposure Science and Environmental
Epidemiology, vol. Ahead of print, 2013.
[29] C. Sermage-Faure, C. Demoury, J. Rudant, S. Goujon-Bellec, A. Guyot-Goubin, F. Deschamps and
J. Clavel, “Childhood leukaemia close to high-voltage power lines - the Geocap study, 2002-2007,”
British Journal of Cancer, vol. 108, pp. 1899-1906, 2013.
[30] L. Zhao, L. Xiaodong, W. Chunpeng, Y. Kangkang, L. Xueiun, L. Shuang, B. Honghong and L. Xin,
“Magnetic field exposure and childhood leukemia risk: a meta-analysis based on 11,699 cases and
13,194 controls,” Leukemia Research, vol. 35, no. 3, pp. 269-274, 2014.
[31] J. Swanson, “Residential mobility of populations near UK power lines and implications for childhood
leukaemia,” Journal of Radiological Protection, vol. 33, no. 3, pp. 9-14, 2013.
[32] L. Kinlen, “Childhood leukaemia, nuclear sites, and population mixing,” British Journal of Cancer, vol.
104, pp. 12-18, 2011.
[33] C. Hegger and A. Reedjik, “Childhood leukaemia in a residential area with a high-voltage power line:
approach according to the Dutch Community Health Services' guideline 'Cancer Clusters',”
Nederlands Tijdschrift voor Geneeskunde, vol. 157, 2013.
[34] I. Baldi, G. Coureau, A. Gruber, A. Jaffre, S. Ducamp, D. Provost, P. Lebailly, A. Vital, H. Loiseau
and R. Salamon, “Occupational and Residential Exposure to Electromagnetic Fields and Risk of
Brain Tumours in Adults: A Case-Control Study in Gironde, France,” International Journal of Cancer,
vol. 129, pp. 1477-1484, 2011.
[35] L. Kheifets, A. Ahlbom, C. Crespi, M. Feychting, C. Johansen, J. Monroe, M. Murphy, S. Oksuzyan,
S. Preston-Martin, E. Roman, T. Saito, D. Savitz, J. Simpson, J. Schüz, J. Swanson, T. Tynes, P.

Verkasalo and G. Mezei, “A pooled analysis of extremely low-frequency magnetic fields and
childhood brain tumors,” American Journal of Epidemiology, vol. 172, no. 7, pp. 752-761, 2010.
[36] L. Kheifets, D. Renew, G. Sias and J. Swanson, “Extremely Low Frequency Electic Fields and
Cancer: Assessing the Evidence,” Bioelectromagnetics, vol. 31, pp. 89-101, 2010.
[37] SCENIHR, “Preliminary opinion on potential health effects of exposure to electromagnetic fields,”
European Commission, Luxembourg, 2013.
[38] Australian Radiation Protection and Nuclear Safety Agency, “Electricity and health. Fact sheet 19,”
Melbourne, Australia, 2011.
[39] Health Canada, “It's your health. Electric and magnetic fields at extremely low frequencies,” Ottawa,
Canada, 2010.
[40] Swedish Radiation Safety Authority (SSM) Scientific Council on Electromagnetic Fields, “Eigth
report,” SSM, Stockholm, 2013.
[41] D. McNamee, M. Corbacio, J. Weller, S. Brown, F. Prato, A. Thomas and A. Legros, “The
Cardiovascular Response to an Acute 1800-µT, 60-Hz Magnetic Field Exposure in Humans,” Int
Arch Occup Environ Health, vol. 83, no. 4, pp. 441-454, 2010.
[42] D. McNamee, M. Corbacio, J. Weller, S. Brown, R. Stodkilla, F. Prato, Y. Bureau, A. Thomas and A.
Legros, “The response of the Human Circulatory System to an Acute 200- µT, 60-Hz Magnetic Field
Exposure,” Int Arch Occup Environ Health, vol. 84, no. 3, pp. 267-277, 2011.
[43] A. Huss, A. Spoerri, M. Egger and M. Roosli, “Residence near power lines and mortality from
neurodegenerative diseases: longitudinal study of the Swiss population,” American Journal of
Epidemiology, vol. 15:169, no. 2, pp. 167-175, 2009.
[44] A. Maes and L. Vershaeve, “Can Cytogenetics Explain the Possible Association between Exposure
to Extreme Low-Frequency Magnetic Fields and Alzheimer‟s Disease,” Journal of Applied
Toxicology, vol. 32, pp. 81-87, 2011.
[45] M. Corbacio, S. Brown, S. Dubois, D. Goulet, F. Prato, A. Thomas and A. Legros, “Human Cognitive
Performance in a 3 mT Power-Line Frequency Magnetic Field,” Bioelectormagnetics, vol. 32, pp.
620-633, 2011.
[46] S. e. a. Nevelsteen, “Effects of Information and 50 Hz Magnetic Fields on Cognitive Performance
and Reported Symptoms,” Bioelectromagnetics, vol. 28, pp. 53-63, 2007.

[47] ICNIRP, “Fact Sheet: On the guidelines for limiting exposure to time-varying electric and magnetic
fields (1 Hz - 100 kHz),” Health Physics, vol. 99, no. 6, pp. 818-836, 2010.
[48] R. Stam, “Comparison of international policies on electromagnetic fields,” Laboratory for Radiation
Research, National Institute for Public Health and the Environment, Bilthoven, The Netherlands,
2011.
[49] Government of the Republic of Slovenia, The Decree on Electromagnetic Radiation in the Natural
and Living Environment, 1996.
[50] Ecofys Germany, “Study on the Comparative Merits of Overhead Electricity Transmission Lines
Versus Underground Cables.,” 2008.
[51] The Swiss Bundesrat, “Ordinance on Protection from Non-Ionising Radiation,” 1999.
[52] WHO, EMF World Wide Standards, 2011.
[53] Union of the Electricity Industry - Eurelectric, EMF Exposure Standards Applicable in Europe and
Elsewhere, 2003.
[54] DECC, “Power Lines: Demonstrating compliance with EMF public exposure guidelines. A voluntary
Code of Practice,” Department of Energy and Climate Change, 2012.
[55] D. Gee, “Late Leesons from Early Warnings: Towards Realism and Precaution with EMF?,”
Pathophysiology, vol. 16, no. 2-3, pp. 217-231, 2009.
[56] L. Kheifets, J. Swanson, S. Kandel and T. F. Malloy, “Risk Governance for Mobile Phones, Power
Lines, and other EMF Technologies,” Risk Analysis, vol. 30, no. 10, pp. 1481-1494, 2010.
[57] M. Maslanyj, T. Lightfoot, J. Schüz, Z. Sienkiewicz and A. McKinlay, “A precautionary public health
protection strategy for the possible risk of childhood leukaemia from exposure to power frequency
magnetic fields,” BMC Public Health, 2010.
[58] M. Repacholi, “Concern that "EMF" magnetic fields from power lines cause cancer,” Science of the
Total Environment, vol. 426, pp. 454-458, 2012.
[59] National Grid, “Raw data on fields from overhead lines and underground cables,” undated. [Online].
Available: http://www.emfs.info/Sources+of+EMFs/Overhead+power+lines/data/. [Accessed 20
March 2012].
[60] EirGrid, “EirGrid Grid Code Version 4.0,” EirGrid, Dublin, 2011.

The Oval,160 Shelbourne Road,Ballsbridge, Dublin 4.
Telephone +353 (0)1 677 1700Fax +353 (0)1 661 5375email [email protected]
www.eirgrid.com