eindhoven university of technology master plasma chemistry
TRANSCRIPT

Eindhoven University of Technology
MASTER
Plasma chemistry analysis of an Ar/C2H2 expanding thermal plasma by means of CavityRingdown spectroscopy and Mass spectrometry
Woen, R.V.
Award date:2002
Link to publication
DisclaimerThis document contains a student thesis (bachelor's or master's), as authored by a student at Eindhoven University of Technology. Studenttheses are made available in the TU/e repository upon obtaining the required degree. The grade received is not published on the documentas presented in the repository. The required complexity or quality of research of student theses may vary by program, and the requiredminimum study period may vary in duration.
General rightsCopyright and moral rights for the publications made accessible in the public portal are retained by the authors and/or other copyright ownersand it is a condition of accessing publications that users recognise and abide by the legal requirements associated with these rights.
• Users may download and print one copy of any publication from the public portal for the purpose of private study or research. • You may not further distribute the material or use it for any profit-making activity or commercial gain

Plasma Chemistry Analysis of an Ar/ C2H2 Expanding Thermal Plasma by means of Cavity Ringdown spectroscopy and Mass
spectrometry
Remco Woen
December 5, 2002

Contents
1 Introduction 1.1 Technology assessment 1.2 Motivation .... 1.3 Aim of this thesis .
2 Deposition Set up 2.1 Cascaded are . 2.2 Expansion Vessel 2.3 Substrate 2.4 Reactor . . . . .
3 Cavity Ringdown Spectroscopy (CRDS) 3.1 Introduction ... . 3.2 Theory ........... .
3.2.l The cavity ..... . 3.2.2 density calculations 3.2.3 Conditions for CRDS
3.3 Implementation . 3.4 Measurements .
3.4. l species . .
4 Residual Gas Analyzer (RGA) 4.1 Theory ........ .
4.1.1 Apparatus ..... . 4.1.2 Time response .. . 4.1.3 Density calculation .
4.2 Implementation ..... . 4.3 Measurement procedures .
5 Results 5.1 Introduction . . . . . . 5.2 Residual Gas Analyzer
5.2.1 C2H2 ..... . 5.2.2 C4H2 ..... . 5.2.3 C2H2, C4H2, C5H2 and C5H5 measurements with an improved RGA 5.2.4 Time dependent measurements
5.3 Cavity Ringdown Spectroscopy 5.3. l C radical measurement . . 5.3.2 ·c2 radical measurement . 5.3.3 CH radical measurement .
5.4 Broadband Absorption ..... . 5.4.1 BBA at constant wavelength 5.4.2 C4H2 and BBA ....... .
1
3 3 3 5
6 6 6 7 8
9 9
10 10 13 13 15 17 17
21 21 21 24 24 25 25
27 27 29 29 32 33 35 38 38 40 41 42 42 42

5.4.3 BBA profiles for different wavelengths. 5.5 Discussion .
6 Modelling 6.1 Introduction . 6.2 reactions . . . 6.3 Fitting . . . . 6.4 Absolute densities from the model. 6.5 Discussion ............. .
7 Summary and Conclusions
8 References
9 Appendix 9.1 A: Lower limit of the electron density .......... . 9.2 B: Electron impact dissociation cross section estimations . 9.3 C: C2H2 configurations . . . . . . . . . . . . . . . . . . 9.4 D: Cracking patterns of C2H2, C4H2, C5H2 and C6H6 9.5 E: Fitting for 22 A and 61 A
9.5.1 22 A .... . 9.5.2 61 A .... .
9.6 F: Maple simulation
10 Acknowledgements/Dankwoord 10.l English .. 10.2 Nederlands .......... .
2
43 45
47 47 48 48 49 50
52
54
56 56 57 58 59 60 60 62 64
69 69 70

Chapter 1
Introduction
1.1 Technology assessment
Hydrogenated amorphous carbon (a-C:H) was introduced by Aisenber and Chabot (AIS-72} back in 1972. They were the first to acknowledge the potential of the material properties of a-C:H. Diamond-like carbon films (DLC), of which a-C:H is an example, have become a popular scientific topic over the last two decennia, which is mainly due to the good mechanical and optical properties. Hydrogenated amorphous carbon can be hard diamond like ( 40 GPa) as well as soft polymer like, has a low friction coefficient, is infra red transparent, wear resistant, chemically inert, electrically insulating, to name a few of the possible properties. Furthermore because a-C:H only possesses carbon and hydrogen, they are considered to be environmentally safe and biocompatible.
The a-C:H properties can be varied over a wide range by variation of the deposition conditions. This has been thoroughly reviewed by others in the past (JAC-98}, (KOI-89} (ROB-92}, (ROB-02). The name DLC has been deduced from the high hardness of the a-C:H films (up to 14 GPa, whereas diamond has hardness of lOOGPa).
Some examples of the industrial applications for carbon film because of its low friction coefficients and its high wear resistivity is in VCR head drums, magnetic recorder disc and magnetic recorder disc slidings. Because its environmental safeness and corrosion resistance it offers a lot of possibilities in the implementation surgery, such hip joints etc .. But there is one industrial implementation that a lot of men and women around the world use everyday and that is the use of DLC as razor blade coating. Note that this list is far form complete and that the application possibilities for carbon are far too many to all be mentioned.
In the past a:C-H layers were successfully deposited by plasma enhanced deposition techniques, one of these is the deposition by means of RF glow discharge. In this setup two electrodes are placed parallel to each other at a fixed distance. A radio frequency potentialis used to power the electrodes. A hydrocarbon gas is injected into the reactor, where it is ionized and dissociated. Good quality films were successfully deposited at growth rates between 0,1 to 1 nm s-1 . A variety of vapour deposition techniques for DLC layers was reviewed by Catherine (CAT-91). These techniques all share a common feature, namely that the deposition takes place due to bombardment by a beam of medium energy ions. These techniques are capable of depositing layers at a rate in the order of 4 nm/s.
For industrial use however this method is not preferable because of the low deposition rate. A different approach was taken by the plasma group in Eindhoven. The layers are deposited by means of the expanding thermal plasma technique (ETP) [KR0-88A}, [GIE-97). By using this setup it was possible to produce good quality layers with rates in the order of 70 nm/s [KR0-90}, [GIE-97).
1.2 Motivation
A difference between the ETP technique and other Plasma Enhanced Chemical Vapor Deposition (PECVD) techniques, of which a variety was reviewed by Catherine (CAT-91}, is the deposition rate. Another main difference is the deposition mechanism. These techniques described in [ROB-02} are all depositing by means
3

Figure 1.1: An example of an industrial aplication of carbon layers in all day life. The razorblades have been coatind with DLC to make the razer hard and wear resistent. This will prolong the life time of the razorblade and make shaving more comfortable.
of a technique in which medium energy ion bombardment plays a dominant role. These techniques are aimed at growing films with good mechanica! and tribological properties.
In general the bombardment of ions takes place by means of biasing the substrate. The mechanism of ion beam deposition is described by the subplantation model. Robertson (ROB-92} proposed that sp3 bounding occurs by the ion füDc causing a increase of the density. The density will increase if the incident ion penetrates the first atomie layer of the thin film and enters a interstitial, subsurface position. Here it rebounds to its neighbors and acquires bulk bounding of the appropriate hybridization. Lower energy ions will not penetrate the sublayer, but will just stick to the surface. Higher energy ions will penetrate into deeper layers, but the excess energy dissipates rapidly (10- 12 s) in a "thermal spike", during which this excess density can relax. Thus when layers are depositing by means of bombardment of medium energy ions, an optimum ion energy can be observed when the density is displayed as a function of ion energy (see .fig. 1.2).
2.6 ~-----------------~
2.4 1 (') ! E • (.l
1 --O>
~ 2.2 1 ëii • c Q)
0
2 - •
100 200 300 400 500 Energy per C atom (eV)
Figure 1.2: The graph shows the behaviour of the density as a function of energy per C atom in an ion bombardment proces. A maximum in the density can be achieved with an energy between 50 and 150 eV.
The graph, displayed in Fig 1.2, shows the density in g/cm3 as a function of the C atom energy in eV. It is a typical behavior for the ion bombardment process. The curve shows a maximum at a ion energy in
4

the region of 50-150 eV. It was thought that biasing was indispensable for making good quality a:C-H layers. In the ETP setup
however Gielen showed that ion bombardment does not play a major role as a result of negligible substrate biasing, due to low electron temperature ( <0.3 eV) (GIE-96A}. Layers grown with an ETP setup are grown by surface deposition and can not be described by the subplantation model.
16
14
~ 12 co a.. 10 ~ (/) 8 (/)
~ 6 "E co I 4
2
0
0
I
• Acetylene flow variation 1
• Are current variation
5
•• •
10 15 20
Growth rate [nm's]
25 30
Figure 1.3: The graphs shows the behaviour of the hardness as a function of the growth rate. The profile displays a
saturation behaviour and the maximum is found at high growth rate.
The Fig 1.3 shows a typical dependence of layer properties, in this case the hardness, on the growth rate. It can be seen that the radical properties are not compromised at high growth rate. It is clear that there is a difference between the ETP technique and the ion bombardment technique. The difference is the different role of the ions and the radicals. For conventional techniques, medium energy ions were needed to grow good quality films (CAT-91}. With an ETP setup the layers are grown by radicals, which stick to the surface.
The plasma used for the deposition is an Ar /C2H2 ETP. In order to know the dominant deposition precursor, it is important to know the plasma chemistry. From this information the growth mechanism can be deduced. The first step to do this is to find out which species are present in the plasma and how they affect the plasma chemistry. In previous work it was concluded that the main growth precursor in an Ar/C2H2 ETP is the C2H radical, one of the possible dissociation products of C2H2, (GIE-99A}. Further research indicated the existence of the other dissociation products of C2H2 molecule: C, C2 and CH (ENG-99}, (BEN-02}. Furthermore a broadband absorption (BBA) was observed in a wide wavelength range. To get more insight in the role of these radicals and the BBA in the plasma chemistry more investigation is required. To investigate of the plasma chemistry two diagnostic tools are used, Cavity Ringdown Spectroscopy (CRDS), to monitor transient species and Mass Spectrometry (MS), to monitor stable species.
1.3 Aim of this thesis
The goal of this research is to gain more insight in the plasma chemistry of an Ar/C2H2 ETP. With this knowledge a growth mechanism can be understood and the ETP deposition technique can be optimized. The focus is on the plasma products in an Ar/C2H2 ETP and their role in the plasma chemistry. What are the exact roles of the transient and stable species in the plasma chemistry and whether they can be responsible for the growth of a:C-H layers. Finally the experimental results will be compared with the plasma chemistry model.
Another main issue is the Broadband Absorption (BBA), which is an absorption over a wide wavelength range. Several experiments will be done to unravel the cause of the BBA.
5

Chapter 2
Deposition Set up
Carbon layers can be deposited by a number of techniques, examples other then the setup described in this chapter are RF-glmv discharge deposition or ion beam deposition. The setup used for this research is based on an expanding thermal plasma and was developed at the Eindhoven University of°"rechnology (KR0-88A). The setup is able to deposit high quality a:C-H and DLC films and has already proven to be a good method in the past (KR0-90} (GIE-97), (GIE-96B).
The expanding thermal plasma deposition setup eau be divided into three geometrically separated parts. The first part is the plasma source, which is the cascaded are. In the are an Argon thermal plasma is generated (Te -leV, electron density ne -1022 m-3 ). The second part is the expansion vessel into which the Argon thermal plasma expands. In the vessel the precursor gas (C2H2) is admixed and dissociated into radical fragments by the Ar+ and e-, emanating from the are. Here the plasma chemistry takes place. The third part is the substrate. This is placed at the end of the expansion vessel and here the deposition will take place. The deposition setup is described in more detail in, [GIE-96B).
2 .1 Cascaded are
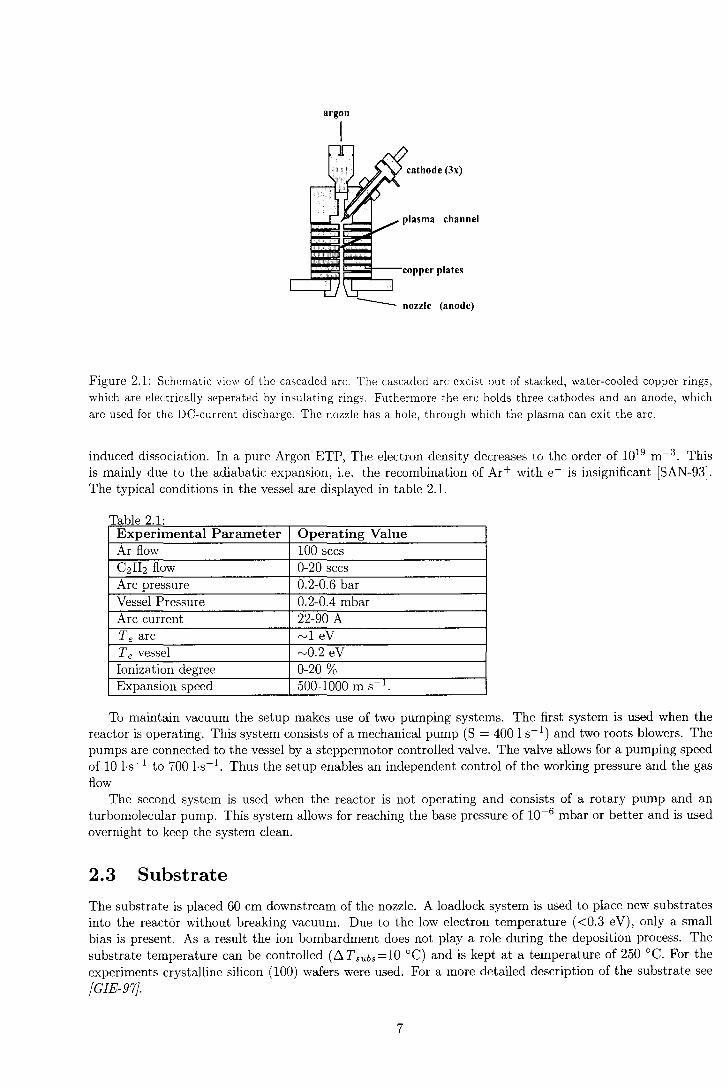
The plasma is generated by means of a cascaded are (see Fig 2.1). The cascaded are exist of three cathodes, a stack of insulated copper plates and an end anode plate with a copper nozzle. A DC discharge runs between the cathodes and the anode. The carrier gas, in this case Argon, enters the cascaded are at the top, at constant flow (100 standard cubic cm per second (sccs)) and at subatmospheric pressure (0.2 - 0.5 bar). The amount of Ar entering the are is controlled by a mass flow controller and can be varied from 0 to 500 sccs (for the experiments a flow of 100 sccs wil! be used unless stated otherwise). As the Ar gas passes down through the channel it is partly ionized by the DC discharge, creating the thermal Ar plasma ( Te=l eV). The ionization degree (1 - 20 %) is only dependent on the are parameters (are current and Ar flow). The density of electrons created in the are is in the order of 1022 m-3 . The higher the are current the higher the ionization degree the higher the electron density. Typical discharge power is between 2 and 5 kW
2.2 Expansion Vessel
The subatmospheric Ar thermal plasma expands into the vessel, which is kept at low pressure (0.3 mbar). Due to this high pressure difference ( ~ = 103 ) the first part of the expansion is supersonic and there is
Pvc.'i.'iel
no influence of the vessel conditions on the cascaded are. After the supersonic expansion a the stationary shock front occurs, after which the plasma expands subsonically towards the substrate. At 5 cm under the nozzle a gas inlet ring injects the precursor gas (C2H2 for deposition and 0 2 for etching of the a-C:H films) downstream into the expanding thermal plasma (ETP). The amount of injected C2H2 is controlled by a mass flow controller and can be varied from 0 to 20 sccs. The vessel has a diameter of 32 cm and the length from the nozzle to the substrate is 60 cm, but can be varied. In the supersonic expansion the electron temperature decreases to less then 0.3 e V , due to adiabatic expansion. Due to this low electron temperature, the electron impact dissociation processes can be neglected and the plasma chemistry is dominated by ion
6
argon
1
cathode (3x)
plasma channel
-- nozzle (anode)
Figure 2.1: Schematic view of the cascaded are. The cascaded are excist out of stacked, water-cooled copper rings, which are electrically seperated by insulating rings. Futhermore the ere holds three cathodes and an anode, which are used for the DC-current discharge. The nozzle has a hole, through which the plasma can exit the are.
induced dissociation. In a pure Argon ETP, The electron density decreases to the order of 1019 m-3 . This is mainly due to the adiabatic expansion, i.e. the recombination of Ar+ with e- is insignificant [SAN-93]. The typical conditions in the vessel are displayed in table 2.1.
Table 2 1· .. Experimental Parameter Operating Value Ar flow 100 sccs C2H2 flow 0-20 sccs Are pressure 0.2-0.6 bar Vessel Pressure 0.2-0.4 mbar Are current 22-90 A Te are ,..,.,1 eV Te vessel "'0.2 eV Ionization degree 0-20 3 Expansion speed 500-1000 m s-1 .
To maintain vacuum the setup makes use of two pumping systems. The first system is used when the reactor is operating. This system consists of a mechanica! pump (S = 400 1 s- 1 ) and two roots blowers. The pumps are connected to the vessel by a steppermotor controlled valve. The valve allows for a pumping speed of 10 l-s- 1 to 700 l-s- 1 . Thus the setup enables an independent control of the working pressure and the gas flow
The second system is used when the reactor is not operating and consists of a rotary pump and an turbomolecular pump. This system allows for reaching the base pressure of 10-6 mbar or better and is used overnight to keep the system clean.
2.3 Substrate
The substrate is placed 60 cm downstream of the nozzle. A loadlock system is used to place new substrates into the reactor without breaking vacuum. Due to the low electron temperature ( <0.3 eV), only a small bias is present. As a result the ion bombardment does not play a role during the deposition process. The substrate temperature can be controlled (D.Tsubs=lO °C) and is kept at a temperature of 250 °C. For the experiments crystalline silicon (100) wafers were used. For a more detailed description of the substrate see (GIE-97}.
7

2.4 Reactor
(a)
substrate hol der
(b)
Plasma source: p = 0.2-0.6 bar Ar11o ... = 1 OOsccs I." = 22-90 Amps T. = 1 eV
Expanding pLasma: p= 0.3 mbar
--1---1 C2 H2 t1c ... = 0-20 sccs I"c = 22-90 Amps T. = 0.3 eV
Substrate: c-Si (100)
11"".~2so0
c
Figure 2.2: (a) A picture of the reactor used for the experiments. (b) a schematic of the reactor and some typical parameters for the plasma source, the expansion vessel and the substrate.
The total picture of what is described above, is shown in Fig 2.2. The cylindrical reactor vessel has a vertical orientation. At the top of the reactor a vertically movable housing can be found, in which the cascaded are is placed. This allows for variation of the distance from the nozzle to the substrate (10 - 60 cm).
An important concept of the ETP is its remote nature. The high pressure difference is responsible for the separation of the are plasma and the downstream vessel. Thus after the plasma has been created in the are and expands in the vessel, there is no additional power input downstream. This allows for independent variation of the parameters (are current and C2H2 flow), for detailed plasma chemistry studies. Furthermore, the deposition process does not depend on the substrate (e.g. insulating or conducting material). This makes the ETP setup, together with the low electron temperature, very suitable for a detailed study of the plasma chemistry in an expanding Ar/C2H2 plasma.
8

Chapter 3
Cavity Ringdown Spectroscopy (CRDS)
CRDS is a diagnostic technique suited to do sensitive absorption measurements on low density species. The technique was first introduced in 1988 by O'Kecfe and Deacon [KEE-88]. CRDS is a line of sight measurcment and can have a time resolution in the order of microseconds, dependent on the amount of absorption. It has proven a very useful diagnostic tool for research clone by the ETP group at the Applied Physics department of the Eindhoven Univcrsity of Technology, for example on Ar/H2/SiH4 and Ar/HMDS0/02 plasma's. This diagnostic tool will be used in this research to look at radical dcnsities in the expanding thermal Ar /C2H2 plasma.
3.1 Introduction
Electrons can, when absorbing or emitting energy in the form of a photon, make transitions to higher ( excitation) or lower ( degeneration) energy states. The frequency of the photon, involved in the transition, must fit the energy difference between the two states according to the Planck formula:
6.E = hw 27r
(3.1)
here 6.E is the energy difference between the two states involved, h is the Planck constant and w is the frequency. Each molecule or atom has a unique set of electronic transitions and thus an unique set of frequencies at which it will absorb (absorption spectrum) or emit (cmission spectrum). These spectra can thus be used to identify species.
The CRDS technique is based on optical absorption spectroscopy (OAS). The basic set up of OAS is shown in Fig 3.1
" Ahsorbing me<lium light source
detector
Figure 3.1: Schematic of an OAS experiment. A light source shoots through the absorbing medium. After passing through the medium the intensity is again measured by a detector. By comparing the ingoing and the outcoming intensity the amount of absorbance can be calculated. From this, information about the medium can be extracted.
In this setup a light source shoots through the absorbing medium. When passing through the medium some of the energy of the light is absorbed by the medium, if the light has the resonant frequency according
9

to Eq. 3.1. The absorbed energy is used for the excitation of the electrons in the medium. By varying the wavelength of the light source and acquiring the absorbance as a function of the wavelength, the spectra! signature can be obtained, which can be used to identify the specie.
A classica! OAS setup has, apart from the advantage of the simple experimental setup, several disadvantages. The first is the low sensitivity, which has several reasons. One reason is the small absorption path length of the light. The second reason can be the low absorbance of the specie. Tlms OAS is only suited for measuring species with high densities or species with large absorption or measurements with large absorption paths. None of conditions are present in the expanding thermal plasma. The second disadvantage is that the intensity of the laser beam entering the medium has to be well known, in order to calculate the absorbance. This requires a stable an light source. Note that the sensitivity is only as good as the fiuctuation of the laser intensity.
concave mirror
" [ ] Ahsorbing medium
Pulsed laser
detector
Figure 3.2: Schematic setup of a CRDS experiments. A pulsed laser is shot through a cavity where the absorbing medium is situated. The mirrors are highly reflective, resulting in multiple passings through the medium before all of the energy has "leaked" out of the cavity
These difficulties are overcome by using CRDS. The basic set up for CRDS is shown in Fig 3.2. The main difference with OAS is that an optical cavity is build around the absorbing medium with two highly refiective mirrors, in which a laser beam can be "trapped". For CRDS it is necessary to have highly refiective mirrors ( R > 99,993) and a pulsed laser. More detail on the setup will be given in section 3.2.3. A pulsed laser beam enters the cavity on the right. After passing through the medium it reaches the left mirror, here part of the beam leaks out to the detector and part of the beam is refiected. The refiected part, again goes through the absorbing medium and at the other mirror, apart is refiected and a leaks out and so on. One of the disadvantages with OAS is the small absorption path length, this is overcome with CRDS by the use of the mirrors, which allow the laser pulse to go through the absorbing medium hundreds of times, resulting an a path length of several hundreds of meters. Allowing for high sensitive measurement of low density radicals in the plasma, with small absorbance (densities in the order of 1015 were able to be measured).
With each round trip some of the light leaks out into the detector. The detector measures an exponential decaying signal, since with each round trip the intensity decreases. The decay only depends on the refiectivity of the mirrors R and on the absorption by the medium and not on the initia! intensity of the pulsed laser entering the cavity.
3.2 Theory
3.2.1 The cavity
Absorption theory [BUS-99}
The basis of CRDS is found in the absorption of the energy of an electromagnetic wave. Consider a medium with two energy levels. Denote these levels l (lower level) and u (upper level). When an electromagnetic wave of the right frequency, fitting the energy difference between the levels according to equation 3.1, passes through the medium the species will absorb some of the energy for the transition u <---- 1. The decrease of energy dl of the electromagnetic wave passing trough the medium with a distance of dx is given by
10

Lambert-Beer law [ATK-98]. (3.2)
Here Iin is the intensity of the light entering the cavity and a denotes the absorption coefficient for the given transition. This coefficient is a function of three parameters, the population densities for the lower and upper levels n1 (x) and nu {x), with x the spatial coordinate of the cavity with the absorbing plasma, and the absorption cross section CT, which is frequency dependent. The cross-section in turn is a function of the frequency. The absorption coefficient in the cavity is given by the following equation.
a(w) = CT(w)[n1(x) - (gu/gz)nu(x)] (3.3)
In the expression gr and gu denote the statistica! weights of the corresponding levels l and u. In our case nz{x) >> nu(x), since the temperature is low enough ("'1000 K). Then nz{x) = n(x) and thus Eq. 3.3 can be reduced to.
a(w,x) = CT(w,x)n(x) (3.4)
From now on it will be assumed that the temperature is constant in the spatial direction, thus CT f::- CT( x). When it will also be assumed that the density is constant in the plasma and zero outside the plasma, the total absorption per pass, A ( w), can be calculated by integrating 3.4 over the cavity length of the line of sight:
d d
A(w) =la a(w, x)dx =la CT(w)n(x)dx = CT(w)N1L (3.5)
here d is the length of the cavi ty, L is the absorption path length and N 1 is the total lower state population density.
Combining Eq. 3.2 and 3.5 an expression for the intensity of the laser pulse as seen by the detector can be deduced:
I = Iinexp[-A(w)] (3.6)
here Iin is the initial laser pulse intensity through the medium. This expression is valid for the set-up without a cavity shown in Fig 3.1. .:'Jow consider the set-up shown in Fig 3.2. For one pass through the set up, which includes first passing through mirror 1, then through the medium , then through mirror 2 and finally into the detector where the intensity measured, the intensity is then given by:
(3.7)
here I 0 denotes the the intensity of the detected light after zero round trips in the cavity and T denotes the transmission coefficient of the mirrors. A round trip is defined as the distance travelled by the laser beam after going back and forth through the cavity. For one round trip through the cavity, the intensity measured by the detector is given by:
li = Io{Rexp[-A(w)]} 2 (3.8)
where I 1 is the intensity of the detected light after 1 round trip and R denotes the reflection coefficient of the mirrors. Note that it is assumed for Eq. 3.8, that the mirrors have equal reflectivity. Thus after n round-trips in the cavity the intensity measured by the detector can be calculated by combining Eq. 3. 7 and 3.8.
In= Ioexp[2n(lnR-A(w)] (3.9)
In the case where the round-trip time is smaller then the sampling frequency of the detector, the discreet parameter n can be replaced by the time using t = 22c where the c denotes the speed of light. Thus:
I( ) J, [tc((lnR - A(w))]
t = 0 exp d (3.10)
The two Eq. 3.9 and 3.10 are graphically shown in the Fig. 3.3. The figures show the decrease in intensity with each round-trip for the case where the round-trip time is larger then the sampling frequency of the detector (discreet) and for the case where the round-trip is longer (analog)
11

ÎI
1 h1tut111._ n ---+ t ---+
(a) (b)
Figure 3.3: Intensity of the detected light as a funtion of the number of roundtrips ( a) and as a function of the time
(b). In the case of a the roundtrip time is larger then the detection frequency and in the case of b the roundtrip time is shorter
Ringdown time vs absorption
The ringdown time is the time it takes for the intensity to drop with ~, thus In = Io exp( -1) (Note that by introducing this property, it is not necessary to know the absolute value of the intensity of the laser beam entering the cavity which is a principle advantage of CRDS). The ringdown is then given by:
d T(w) = c[lnR-A(w)] (3.11)
If there is no absorbing medium in the cavity the last term of the denominator (A(w)) will be zero. The obtained expression will give the ringdown time only due to the reflectivity of the mirrors. This ringdown time will be denoted Te ( e for empty) and is thus constant for a specific pair of mirrors.
For the experiments we are interested in the absorption per pass, which we can calculate from the measured ringdown time, when an absorbing medium present in the reactor. Since all the other quantities are known, rewriting Eq. 3.11 will yield an expression for the absorption per pass as a function of the ringdown time:
d 1 1 A(w) = -(- - -)
C Tj Te (3.12)
The subscript .f and e denote the ringdown time for a full and empty cavity. Thus by measuring the ringdown time for an empty cavity and a filled cavity the absorption can be calculated without needing to know the initial intensity of the laser beam passing through the cavity. The transient for an empty cavity and a filled cavity and their ringdown time are shown in Fig. 3.4.
I<> " .... ".
lo/e" "."""
Time
Figure 3.4: Exponential decay of a cavity with and without absorbing medium. The absorbing medium has a faster decay. The ringdown time TJ (with absorbing medium) and Te (without absorbing medium) are indicated.
12

3.2.2 density calculations
If the upper quantum level u of the transition u f-- l is not significantly populated from the lower level 1, then the absolute value of a (see Eq. ??) can be calculated by:
100 100
hw a(w)dw = CT(w)N1dw = -NzBzu 0 0 c
(3.13)
with N1 is the total number of absorbing species, which is in general a function of the spatial coordinate x,and Bzu is the Einstein coefficient for absorption and w is the frequency of the transition. Btu is related to the Einstein coefficient for spontaneous emission by:
A _ 91 B 8Irhw ul - - lu--
3-
9u C (3.14)
Combining Eq. 3.13 and 3.14 gives:
(3.15)
When doing absorption experiments, the total absorption G is the quantity that is measured. This is given by:
G = 100 100
A(w)P(w - w')dwdw' (3.16)
here the integral over A(w) is the absorption peak and the integral over P(w - w') is the laser profile. If the width of the laser profile is small enough in comparison to the peak width, the laser profile can be replaced by a delta function giving:
(3.17)
Remember Eq. 3.5, that gives A(w): the absorption per pass at frequency w. For absorption of light with a continuous spectrum the total absorption is:
roo rd rd roo G =Jo Jo a(w)dxdw =Jo Jo a(w)dwdx (3.18)
here the changing of the integrals is justified, since a(w) is not a function of the spatial coordinate x. Combining 3.15 and 3.18:
G = a(w)dwdx = 9u -N1Au1dx = .....'!:!:.._Au1N1L 1d 100 1d À 2 9 À 2
0 0 0 91 8Jr 91 8Jr (3.19)
Note that it was already assumed that the density was constant in the medium (Nr)and zero outside the medium and that the absorption path length was L. Eq. 3.19 can be rewriting to an expression that relates the total absorption D with the density of the lower level 1 N 1 :
3.2.3 Conditions for CRDS
Up till now it has been assumed that every frequency is suited to preform cavity ringdown in any cavity. This is actually not the case. In order to preform CRDS some demands have to be met.
Stable cavity
First the cavity has to be stable this means that the length of the cavity d should be smaller then twice the curvature of the mirrors. If this is not the case the pulsed laser beam is able to escape from the cavity (see fig. 3.5) (BUS-99].
13

(a) >I 1 d~ 800 mm
"' 1 Mirror
d- J200mm
r-500mm
Figure 3.5: (a) shows a stable cavity: d < 2r. The entering lightbeam is confined to the cavity. (b) shows a unstable cavity: d > 2r. The entering lightbeam is able to escape the cavity
Eigen modes
Another aspect not yet addressed is the presence of modes in an optical cavity. When the pulse length of the incident laser beam is longer then the round trip time, wave fragments propagating in the same direction will interfere and this will results in resonance of the light in the cavity. In a resonant cavity only light with frequency equal to that of the cavity eigen modes will transmit. The eigen modes of a cavity are determined by the Maxwell equations. The mirrors that make up the cavity determine the boundary conditions. These eigen modes are uniquely denoted by the transverse electromagnetic TEMqmn modes [SME-98]. The eigen frequencies Wqmn for an empty resonator are given by [BOY-61]
Wqmn=_..'.:_[q+~arctan( d )(m+n+l)l 2L 7r Jd(2r - d
(3.20)
The mn indexes re present mode numbers of the transverse electromagnetic field (transverse modes), q is the index of the mode of the axial standing wave along the cavity axis (longitudinal mode) and r is the radius curvature of the mirrors.
When looking at different longitudinal modes with the same transverse indexes m and n, these modes are separate by a frequency range w1 = c/2d. Transverse modes with the same longitudinal indexes are separated by a frequency range Wt = (c/7rd) arctan{ Jd/(2r - d)}. Ideally between two modes the cavity is not transparent. The problem from the eigen modes can arise, when the longitudinal and the transverse modes degenerate. For example when d = 1000 mm and r = 500 mm. Then the longitudinal and the transverse modes are separated by 150 MHz (see Fig. 3.6b)
The way this is avoided is by filling the non transparent frequency ranges between the longitudinal modes up with transversal modes. This is clone by building a cavity where modes do not degenerate. For instance if d = 800 mm and r = 500 mm. Calculating the separation between the longitudinal and transverse modes: w1 = 188 MHz and Wt = 133 MHz. Then according to Eq. 3.20 this cavity has eigen modes Wqmn = 188q + 133(m + n + 1). Since there are so an infinite amount of possible combinations for qmn, the frequency range between two longitudinal modes is "'filled up " with transverse modes. The cavity is said to have a "quasi continuum distribution " (see Fig. 3.6a).
Saturation
Another condition that needs to be fulfilled for CRDS measurements, is that the laser energy should not be to high. If this is the case then the pumping rate will be higher then the relaxation rate of the absorbing species. As a consequence the transition will saturate and the absorption coefficient decreases (see Eq. 3.3).
14

(a)
(b) Missing line
î 1 . 1 • 1 .. 1 • 1 1 . • 1
100 200 300 400 500 fîOO 70()
Frequency (MHz)
Figure 3.6: Schematic mode distribution for a confocal ca\'ity with a length of 1000 mm for which the transverse
modes are degencrated with a longitudinal mode (b) and for the same cavity with a quasi continuous distribution
( a).
The problem of saturation was investigated in detail by P. Macko et. al. (MAcf;;;lnd Benedikt (BEN-02}. For this report it suffices to say that for every experiment the saturation was c~d.
3.3 Implementation
fundemental
to cavity:
Filter
prism
dichroic
DyeJáser, PDL 3 sPeétra PhY$iés
diaphragm
Figure 3.7: Top view schematic of the lasersystem. The inside of the dye laser is not shown. The laser going to the
cavity can be switched to the desired wavelength. The abriviations THG and SHG stand for resp. Third Harmonie
Generator and Second Harmonie Generator. These are doubling and tripling units.
The CRDS set up can be divided into three parts. First there is the pulsed laser system. Second there is the cavity, where the actual absorption process takes place and finally the detection system.
15

Laser system
A laser system that consists of a Nd:YAG laser and a PDL-3 laser is used. The complete laser system is shown in Fig 3.7. The Nd:YAG (Spectra-Physics /Quanta Ray DCR-11) is used to pump the PDL-3 laser. The light exiting the Nd:YAG is pulsed with a frequency of 10 Hz and has a wavelength of 1064 nm. After frequency tripling in the THG (Third Harmonie generator), the is wavelength of 355 nm. This wavelength is used to pump the different dyes in the dye laser. The two dichroic mirrors filter out the 355 nm wavelength. This laser beam is used to pump energy into the laser dye in the PDL-3 laser. The PDL-3 produces laser light of which the frequency can be controlled. This is clone by a steppermotor controlled grating in the PDL-3 laser. By changing the angle of the grating, the frequency can be varied [PDL-3 Manual]. The frequency range over which can be varied is dependent on the dye in the PDL-3.
Before entering the cavity there is an option to use the SHG (Second Harmonie generator) unit to double the frequency of fundamental beam of the dye in order to get a laser with doubled wavelength in comparison to the fundamental wavelength of the dye. If the doubling unit is used a Pellin-Broca prism has to be incorporated in the system to filter out the desired wavelength. The system involves some prisms in order to sent the laser beam through the cavity and some diaphragms to filter out the center of the beam in order to get a homogeneous spot. Finally before entering the cavity the laser passes through a neutral density filter to decrease the energy entering the cavity, in order to avoid saturation (BEN-02}.
Cavity
Side view
D Position 2 ["]
57 cni
D ~pumps Dyel..asèr
y
Figure 3.8: Schematic of the reactor with the laser system, seen from the side and from the top. In the top view, the part of the reactor surrounding the mirror is enlarged, showing how the mirrors are protected by a flow of Argon.
The cavity can be mounted onto the reactor at two different positions as shown in Fig 3.8. This allows for research of the expanding plasma at different positions. Looking at the side view, position 1 is at distance of 57 cm downstream of the nozzle, 3 cm above the substrate. Position 2 is 30 cm under the nozzle. In the following position 1 will be referred to as the down position and position 2 as the up position.
From the top view of the reactor it can be seen that the laser shoots over the middle of the substrate. The part that holds the highly reflective mirror is enlarged. An Argon flow is used to protect the mirror against depositing particles as shown in the Fig 3.8. The typical Ar protection flow was in the order of 15 sccs, resulting in a protection pressure of 0,04 mbar.
Detection
The final part of the CRDS set up is the detection of the signal. Each time the laser reflects at a mirror, part of the intensity leaks out of the cavity since the mirrors are not 1003 reflective. After the mirror at one end of the cavity, a Photo Multiplier Tube (PMT, Hamamatsu R928) is placed to detect the signal. A
16

..... " .... " .... ···•••h••···········
500 M Samples/.
Oscilloscope
Narrowband
filter\
~pumps D
Figure 3.9: Schema tic of the detection setup. The Pl\IT measures the intensity of the light exiting the cavity. This is transformed into a electrical signa! and is send to a oscilloscope, where it is visualized. From here it is send to a pc for further analysis.
narrow band filter is placed between the cavity and the detector to filter out the plasma radiation. The signal is then transported to a digital 500Ms/s, 100 MHz oscilloscope (Tektronix TDS340a). The oscilloscope is triggered externally by the YAG laser. The transient (the decay of the signal coming out of the cavity) can be averaged and shown on the oscilloscope. The typical time scale to see the transient is in the order of 200 ns. A typical number pulses over which was averaged was 32 pulses. The signal from the oscilloscope is led to a pc for further analyses, where the ringdown time can be calculated from the transient.
3.4 Measurements
CRDS is able to measure the absorption of non stable species along the line of sight of the laser, from this information the lmver state density of the observed transition can be calculated. For the experiments CRDS is used the measure the radical densities in an expanding remote Ar/C2H2 plasma. The radicals that can be present, are the radicals that are produced in the dissociation of C2H2. These are C, C2, CH and C2H. In the past there have already been experiments performed to monitor the behavior of these radicals [BEN-02], [ENG-99]. It was already concluded then that no spectral signature of C2H was observed. Instead where the C2H was expected, a broadband absorption was observed. So only the first three radicals were investigated in more detail, furthermore also an attempt was made to find the radical CH3, which could be a possible results of the plasma chemistry taking place in an Ar/C2H2 plasma.
The densities can be calculated from the area under the absorption peak. The peak is obtained by calculating the absorption at successive wavelengths, with a stepsize of 0,00005 nm. The absorption is calculated form the ringdown time at those wavelengths. A typical peak scan is shown in Fig. 3.10. This is the peak scan of C transition, which will be discussed in the next section. These peak scans are done at different experimental conditions i.e. different are current and C2H2 flow. This way the the absorption and thus the density of the different radicals can be obtained as a function of the C2H2 flow and at different are currents. These results will be shown in chapter 5. For each species a different transition is used, these will be discussed in the next section
3.4.1 species
c The transition used for the absorption measurement on the C radical is the electronic transition from the ls22s2 2p3s 1 P 1 state to the ls22s22p2 180 state. This is the transition from the metastable state to an
17

247,94
-•- - C absorption 61 amps up
• • !
• .. . ~ 1
' • ~ ... ,,..."_·~ .,,,_ . .,,..
~ ""- sv.itching on/off / «
.· ""-C H inflow/ : --- 2 2 • • .... ,.. " .....
247,95 247,96
wavelength (nm]
247,97
Cpeak
BBA
247,98
Figure 3.10: A typical peak scan is shown. A transient is aquired for each wavelength. From the transient the absorption is calculated for that wavelength. By scanning over a wavelength range the peak can be displayed. The area under the peak is a measure for the absorption for that transition. A broadband absorption (EBA) can be seen on top of which the C peak is situated.
excited state. The metastable state is 2.5 eV above the ground state. For the density calculations it will be assumed that the metastable state is representative for the density in the ground state, since the formation of C radicals is such that the metastable and ground state are formed in a similar process (BEN-02A}. The C metastable state is detected around a wavelength of 247,931 nm.
A measured C peak is shown in Fig. 3.10 for the conditions of 61 Are current and a C2H2 flow of 0.8 sccs. The scan can be divided into three stages. The first stage part of the scan, is from 247,942 nm to 247,95. During this stage, the reactor is filled with Ar gas and a plasma is running (i.e. current is running through the are). The absorption calculated during this stage is only due to the losses at the mirrors. Around 247,95 nm C2 H2 is injected into the reactor and the absorption increases due to absorption by the plasma product C. This absorption is constant for the wavelength range shown in Fig. 3.10. The BBA however does vary with the wavelength, but the wavelength range in Fig. 3.10 is too small to show the dependence. On top of the BBA at 247,96 nm the C peak can be observed. Around 247,97 the C2H2 injection is switched off and the absorption decreases again. Note that the C peak should be at 247.931 nm, whereas the graphs shows the peak around 247.96 nm. This offset is due to an offset in the PDL-3 dye laser.. The BBA will be discussed in more detail later on in this section
C2
The transition used for C2 detection, is the Swan system d 3 II9 (v'=O) f- X 3 IIu (v=O), which is also a transition from a metastable state to an excited state and is located around 514 nm. The energy difference between the metastable and the ground state is 0.2 eV. Again it will be assumed that the density in the metastable state is representative for the density in the ground state.
In comparison to C the identification of molecular radicals, like C2 , and CH is less straightforward. Because of the rotational and vibrational states, C2 has a complex spectra] signature. To identify the specie, the molecular spectrum was simulated [ALD-??] and compared with the measured spectrum. The measured C2 spectrum is shown in Fig 3.11. From the simulation a peak was chosen for the experiments, that was easy to identify and has little rotational and vibrational temperature dependence. This peak was used to calculate the absorption due to this specific transition, in the same way described with C.
18

- Spectra! signatlre c,
513.9
used peak
I
514.2
wavelengh (nmj
514,5 514.8
-- Spectra! signature C H
430.8 431.0 4312 431,4 431,6
Wave~ngh [nmj
Figure 3.11: The spectra! signature of C2 and CH. Also indicated in the graphs, is the peak used for the measurement.
CH
The transition for CH used in the experiments is A 26 (v'=O) <--- X 2II(v"=0) and is a transition from the ground state to an excited state and is located around 430 nm. Like C2 , CH possesses rotational and vibrational excited states which result in a complex molecular spectrum. The molecular spectrum was simulated with LIFBASE [LUQ-99] and compared with the measured spectrum. The measured CH spectrum is shown in Fig 3.11. Like with C2, a peak was chosen that was easy to identify and has little rotational and vibrational temperature dependence. This peak was focused on to calculate the absorption due to this specific transition, in the same way as was done with C.
The main reason why CH3 was looked into, was because CH3 is a possible product of the complex chemistry of an Ar/C2H2 ETP. However no CH3 was detected.
Broadband absorption(BBA)
Over the wavelength range of 220 nm to 520 nm an absorption is observed that depends on the wavelength. On top of this overall absorption, the transition peaks of the radicals that were monitored, were situated. The BBA phenomenon is not unique for the study of the Ar/C2H2 ETP. In other experiments the BBA is also observed. The BBA can have several causes. Some of these possible causes will be discussed briefiy to give some insight in how the BBA can come about.
Predissociative states. Zalicki et. al (ZAL-95} measured for the first time the CH3 B2 A1 <--- X 2 A2 electronic transition, which shows a broadened peak feature from 214-218 nm. The transition is from the ground state to the first excited state. The excited state is crossed by a dissociative state. After the excitation to the excited state, the chance occurs for an excited electron to jump to the dissociative state. leaving the total molecular energy unchanged. The lifetime in the first excited state is inversely proportional to the "chance "the electron will jump to the dissociative state. For some excited electrons there is a high probability that the "jump "to the dissociative state will be made. As a consequence these electrons will have a very short lifetime. From Heisenberg's uncertainty principle, a small uncertainty in lifetime means in a large uncertainty in energy. This results in broadening of the peaks, causing the broadband absorption. This phenomenon is shown in Fig. 3.12.
Chromophoric groups. [ATK-98] Absorption of a photon can often be traced to excitation of specific groups of electrons or to electrons belonging to a small group of atoms. Groups with these kind of features
19

Exited state
Metastable state
Inte1molecular distance
Figure 3.12: Schematic potential energy diagram, explaining predissociation of CH3. The Predissociation process upon the electronic ground state to the excited state is indicated by the arrows.
are called chromophoric groups. One possible chromophoric group is for example the C=C double bound. When absorption takes place due to this transition, a 7r electron is excited into an antibounding 7r* orbital. The energy involved for an unconjugated double bound is about 7 eV, which corresponds to an absorption at 180 nm. When the double bond is part of a conjugated chain, the energies of the molecular orbital lie closer together and the 7r* <--- 7r transition moves to longer wavelength. In the case of C=C it may even lie in the visible region if the conjugated system is long enough.
Scattering. When electromagnetic radiation falls on an object, it forces the electrons to oscillate and radiate. When this happens in the case medium is homogeneous, the secondary waves interfere destructively except in the original propagation. Thus the light can only be seen when looking into the original direction of the incident beam. In the case the medium is not homogeneous, the light in scattered in other directions too.
When scattering occurs by particles in the order of a tenth of the wavelength of the incident light the scattering can be described by Rayleigh scattering. This kind of scattering shows a clear dependence on the wavelength an can be described by:
J Rayleigh ~ À -4 (3.21)
Overview of the species monitored by CRDS
Table 3 l· .. Radical Wavelength Transition C (metastable state) 247.931 nm ls:l2s"2p0 s 1 P 1 <--- ls:l2s:l2p:l 1 Sa C2 514 nm d ,jl1
9 <--- X ,jITu
CH 430 nm A :l.0._ <--- X :lll CH3 216 nm B:lA1 <--- X :lA2 BBA 216 nm - 520 nm ?
20

Chapter 4
Residual Gas Analyzer (RGA)
To measure background density of stable species a mass spectrometer or RGA (AccuQuad 200™ D, Kurt Lesker Co.), was used. The information gained form these measurements can be used to unravel the chemistry in this deposition plasma. In this way the consumption of the precursor gas, C2H2 can be measured, as well as possible stable monomers or polymers that may contribute to the growth.
The RGA measures outside the beam, i.e. in the background, as will be made clear in section 4.2, where the implementation of the RGA is described. No ions and radicals can be measured in this way by the RGA, since these species will have reacted away before they reach the RGA, due to their high reactiveness. Thus only measurements on stable species can be performed. The time scale on which the RGA can distinguish between different processes is in the order of 0,02 s (see section 4.1.2).
The RGA consists of three main parts (see Fig 4.1), the ionizer, the quadrupole mass filter and the detector. For detailed information see (KUR-96).
lonizer r--r-·····===-=········===··=···--···· L __ J Quadrupole Detector [__
Figure 4.1: Schematic of the RGA probe, excisting of the ionizer, the quadrupole and the detector. These three
parts are in contact with the reactor.
4.1 Theory
4.1.1 Apparatus
The three parts of the probe all have their own specific function. When a particle reaches the RGA, it will first encounter the ionizer. ( the way the species reach the RG A will be discussed in more detail in section 4.2). The ionizer contains a heating filament which produces electrons with an energy in the range of 20 to 100 eV. For the experiments the default setting of 70 eV was used. These electrons are used to ionize the electrical neutral particles that enter the mass probe. These ionized particles are directed towards the quadrupole mass filter, where they are separated based on their mass to charge ratio, by means of an varying electrical field. The particles that successfully pass through the quadrupole mass filter are collected on a detector. This can be either a faraday cup or an electron multiplier. In the experiments always the electron multiplier was used, since much higher sensitivities could be reached. The downside of the electron multiplier is that the gain decreases with increasing mass M by roughly 1/M (GRA-00}.
21

Flament Repaller ----- ___ __L,
1
L_ ! ~ 1 1 :
Focus ~ate-i r---- _T_J 1
---------------1------' Anode grid
(b)
Figure 4.2: (a) The components that make up the ionizer (b) The schematic lay out of the ionizer.
lonizer
The hart of the ionizer is a oxidation-resistant thoria coated iridium wire in a circular construction, called the filament. By heating this filament, the electrons are accelerated to energy in the range of 70 eV, which is needed for the ionization of the entering particles. This in turn is required to separate the different species by means of an varying RF electric field. The components that make up the ionizer are shown in Fig 4.2a
Fig 4.2b shows the schematic build up of the ionizer. A cylindrical shaped grid cage, which is positively charged with reference to the filament, is placed through the filament. Thus the electrons that are thermally emitted from the filament are accelerated towards the anode grid. Because of the open construction of the grid, there are electrons that do not hit the grid, but pass through it. When colliding with a molecule or atom, these electrons can ionize that particle.
Some electrons however pass through the anode grid without ionizing a particle and pass into the volume between the anode grid and the repeller By keeping the repeller, which encloses all the components of the ionizer, at a negative potential, these electrons are decelerated and re-accelerated into the anode grid. Thereby increasing the ionization efficiency of the electron current by multi passes in comparison to single pass configuration. After ionization the focus plate that is held at a negative potential is used to guide the ions out of the anode cage and into the quadrupole.
Quadrupole mass filter
After being ionized in the ionizer the particles enter the quadrupole mass filter. In the quadrupole they are filtered according to their mass-to-charge ratio. The working part of the quadrupole are four electrically conducting, cylindrical rods, placed parallel to each other and forming a square when looked on from the front.
Figure 4.3: Schematic of of the quadrupole that produces the oscilating electric field. The figure at the bottom shows how the rods are electrically coupled.
22

Figure 4.4: Schematic of the detector. CDEM stands for Continues Dynode Electron Multiplier. In the text the name Electron Multiplier will be used
The four rods are electrically connected two by two as shown in Fig 4.3. The principle on which the filtering takes place is the oscillating electric field that is produced by the quadrupole, U + Vocos( wt). The particles that enter the filter are spatially oscillating in the directions perpendicular to the direction of movement. By choosing the DC and the RF components in a certain matter, only the species of interest will have a stable trajectory and will pass through the filter. After passing through the filter the ions will be focussed onto the detector.
Detector
Particles that successfully pass through the filter will hit a detector, which consists of two parts. A Faraday cup and a electron multiplier. There are two ways by which the ions can be detected. The first is by direct detection.This feature makes use of the faraday cup. This is a small stainless steel bucket, located on-axis at the end of the quadrupole. Ions that enter the bucket strike a metal wall and are neutralized by electron transfer from the metal to the ion. The electrons used for this process will produce a current that is of the same intensity of the incoming ion current.
Figure 4.5: Schematic of the Electron Multiplier (detector) and the working proces
The second method makes use of the electron multiplier. It consists of a straight four channel tube, with a cone attached to the front of it. The procedure of an electron entering the tube is shown schematically in Fig 4.5. When a electron enters the cone, it will collide with the wall. The wall is covered with material with a high secondary emission coefficient. As a result the entering electron will be multiplied each time it hits the wall. The extra electrons enter the cone more deeply and in turn will hit the wall and the process starts all over again. In this way the number of electrons that will reach the end of the cone where the detection takes place will increase dramatically. Thus a more sensitive detection can take place. For the experiments the multiplier tube was used. The detector is connected to the Electronic Control Unit.(ECU). The ECU contains all the necessary electronics to operate the RGA From here the data is transported to a pc for further analysis.
23

4.1.2 Time response
To have a good indication on which time scale the RGA can still distinguish between two processes, it is important to know the response time. The RGA and the reactor are separated by a 30 micron diameter pinhole. To estimate the time response of the RGA to a change in the reactor, it is important to know how long it takes to build up the density of a species in the RGA. The time response will be needed later on in the analysis of the results. The density of the RGA can be described by:
dna RGA <Pa Hturbo ' = -- - --- *naRGA dt VRGA VRGA '
( 4.1)
Here na,RGA is the density of specie a in the RGA, <Pa is the flux of particles per second entering the RGA, V RGA is the volume of the RGA ("-'11) and Hturbo is the pumping speed of the turbo pump ("-'50 1 s-1 ). Solving Eq. 4.1 gives the following analytica! solution for the time dependent increase in density of a specie in the RGA:
<I> a { Pturbo na,RGA(t)=H (l-exp--V *t})
Turbo RGA ( 4.2)
The steady state density in the RGA is given by v,~"'"'. Thcn if it is assumed that the ionization and the detection are instantaneous, a good estimate of the time scale on which the RGA can distinguish is TRGA = V"':'' 0 • For the experimental setup, T;::::; 0.02 s. Thus the RGA should be able to follow processes
HCA
slower then 20 ms.
4.1.3 Density calculation
The RGA can be calibrated to calculate the density of the monitored some species, however not for C4 H2 and C6H2, since these are not purchasable. In order estimate of the densities of these species, the effectiveness of the RGA for C4 H2 and C6H2 is compared to that of C2H2. The RGA can be calibrated for the case with C2H2.
The signal of the RGA is given in current [A] and this is linearly related to the density of the species. The linear dependence hmvever is different for every specie and is given by:
(4.3)
Here the subscript a denotes the monitored species, Sa is the signal produced by the RGA in A, Ea is the efficiency of the RG A for specie a, a a ( E) is the cross section for the electron impact in [nm 2], Ie the electron current in the ionizer in [mA] and na is the density of specie a in the ionizer. The electron impact cross section is given by the literature for the different species. However, no valve for C4H2 and C6H2 could be found. The value will then be estimated, by using a linear fit through known electron impact cross section (see Appendix B). The value for Ie is the same for all the experiments (40 mA). Finally the Ea is given by:
Ea = l * /3(Ee) * ta(m/Q) * Ba(m/Q) ( 4.4)
Here l is the length of the ionizer, /3 is the efficiency of the ionizer, t is the transmission pro babili ty of the mass filter and B is the efficiency of the detector. The efficiency of the ionizer is the chance that an entering species will be ionized. This is only dependent on the electron energy Ee(70 eV). The transmission probability t and efficiency of the mass filter B are both a function of the mass to charge ratio m/Q. Because we will only take into account the single ionization (Q =1 ), t and e will just be a function of m.
Now by calibrating the RGA with C2H2, the densities of the other species can be estimated by:
( 4.5)
Rewriting Eq. 4.5:
( 4.6)
24

·····················
Pinlmle
Figure 4.6: Schematic of the RGA and the way it is connected to the reactor. A turbo is connected to the RGA and the RGA is separated from the reactor by a pinhole of 30 micron.
The value for Sa is given by the experiment, Sc2
H2
and nc2
H2
are given by the calibration. Then by making an estimate for the first factor the density of specie a can be calculated.
An estimate for the mass dependence of the mass filter and the detector however is not trivial and a no guide line is given by the manufacturers. There has been some research into this dependence. De Graaf (GRA-00} used a factor of 1/m for the decrease of the gain with increasing mass. C.M. Leeuwis argued that the total mass dependence of the efficiency of the mass filter and the detector is 1/ m0·5 . In this report the latter will be used since the latter dependency is larger then the former. Together with (the estimate of) the electron impact cross section, the density of specie a can be estimated.
4.2 lmplementation
The implementation of the RGA onto the reactor is straight forward. The only demand is that the working pressure of the RGA has to be under 10-4 bar. This is accomplished by placing a pinhole between the RGA and the reactor with a diameter of 30 micron. If the reactor pressure is low enough, the pinhole can be removed allowing for amore sensitive measurement. The first valve is used to separate the RGA from the reactor. The signal from the RGA is directed to a pc for further analysis. The set up is shown in Fig 4.6
The RGA measured the densities in the background, i.e. outside the beam. In the background the density is constant and in a steady state and the flux <I> reaching the RGA can be calculated as:
1 <î> RGA = 4nvApinhole (4.7)
here n is the density in the reactor, v is the thermal velocity and Àpinhole is the area of the pinhole.
4.3 Measurement procedures
Besides ionization of the specie, also dissociation, dissociation ionization and double ionization can take place due to the high electron energy (70 eV). Every molecule therefor has a specific cracking pattern in which the molecule is fragmented and can thus be used to identify the specie. In case of an atom an isotope spectrum will be obtained. As a consequence it is possible that some cracking patterns will overlap both contributing to the same amu. In order to get the signal of the separate species, the spectrum has to be
25

0,5 .------------------.
-- Measured spectrum of C2H
2
- Cracking pattern for C2H2 - 0.41~---------~ ~
0 ; 0,3 .!!: êii ~ ë 0,2
~ :l 0
0 ü 0,1 Q)
~
:',j /,
1 i
N r-/'
0,0 ~~~--'-~----~~--'"-----~c-="""'--'---'-,L_,L_'----' ~ ~ ~ ~ ~ ~ n ~ ~ ~
amu
Figure 4.7: Example of a cracking pattern. The shown pattern is that of C2H2.
deconvoluted (see Appendix D). An example is shown in Fig 4.7, here apart of the cracking pattern of C2H2 is displayed. The measured peaks fit the literature values (the black lines) [NIS].
Two different settings of the RGA were used to do the experiments. The first setting measured the densities of species over a range of amus and the second setting monitors peak heights of different amus as a function of time. The first setting will be called the time independent scan whereas the second setting will be called the time dependent scan. The typical scans are shown in Fig 4.8
The RGA displays the data in currents. The intensity is directly related to the density, as was discussed in the previous section There are two ways to measure the density with the RGA, the time independent scan and the time dependent scan (see fig. 4.8). The area under the peaks, caused by the specie of interest, is taken as a measure for the density. For the time dependent scans one of the peaks from the cracking pattern is monitored in time. In this way the species can be monitored during change of the experimental parameters. In the figure the densities are first monitored when only Ar gas is led into the reactor, next the plasma is turned on and Ar plasma fills the reactor, following C2H2 is admixed and the Ar/C2H2 plasma is made, then the plasma is turned of and the reactor is filled with Ar and C2H2 gas and finally the C2H2 flow is shut down. The densities of Ar, C2H2, C4H2 and C6H2 are monitored for the different conditions.
1E·9 r------;:==============::::::::----'"'""i
1E-10
1E-11
~ ~ 1E·12
~ "' c: ~ 1E-13
1E·14
Time independent scan at 75 amps, 36 sccs
1E-15 11-l........IJ__._...J!JJ'-'-..J...W'--L...>"'--"
o m ~ ~ ~ ~ ro ro oo ~ ~
Arru
1E·B ,-----;==========,..------, Time dependent scan
1E-9 fa áfferent experi men tal setting
Ar Ar Ar+C,H, Ar+CH Ar ___ ~ plasma ____:...1 _..ccp!=••""m=-• __ _
1E·10 "" .•• "",,.".""__ " ____ "" " •
~ ~1E·11 ,., ~ á)1E·12
Ë
1E-13
1E·14
100
C1H
1
C,H1
C,H,
200 ~ ~
nme[s] 500
Figure 4.8: Left a typical time independent scan is shown. Right a typical time dependent graph is shown.
26

Chapter 5
Results
5.1 Introduction
It was already shown by Gielen (GIE-96A} that for increasing growth rate, layers with better material properties could be grown (see Fig. 1.3). The material with the best mechanica! properties however was grown in the case of critica! loading (GIE-96C}. The term critica! loading was introduced to denote the situation when the Ar+ flow is of the same magnitude as the injected C2H2 flow. As was stated before the ion induced dissociation of C2H2 by the Ar+ is dominant due to the low electron temperature. It was also concluded that in case of critica! loading the main reaction product in the plasma is C2H . Thus it was argued that C2H was the dominant growth precursor in the Ar/C2H2 ETP.
De Graaf et al {GRA-99}, (GRA-00} introduced the plug-down model as 1-dimensional simplification of the plasma chemistry in the reactor (see Fig. 5.1). In the plug-down model the plasma is treated as a plasma beam, allowing for outward diffusion only. Furthermore De Graaf measured the consumption of C2H2 and simulated this in the plug-down model taking the dissociation by Ar+ as a dominant loss process. The simulation showed good resemblance with his measurements. Also was shown by De Graaf that the stable molecules CxH2(x = 2, 3, 4, 5, 6) are present in the background of the plasma (GRA-99A}.These results will be discussed in more detail in the next section.
Further research on the Ar/C2H2 ETP was done by Letourneur, Benedikt and Wisse {ENG-99}, {BEN-00}, {BEN-02A}. They showed the existence of CH, C2 and C radicals, which are dissociation products of C2H2, in the plasma by means of CRDS. Typical radical densities just above the substrate found, were: ""'1015 m-3 for C, ""'1017 m-3 for C2 and between 5*1015 and 8*1016 m-3 for CH. They also concluded that with upper estimates for the sticking probabilities, these densities cannot account for the growth rate observed ( ""'20 nm s- 1 ). Furthermore they observed an absorption over a large wavelength range on which the measured peaks of the radicals was situated. They suspected that the BBA might be caused by the C2H radical, but no hard evidence was found for this.
The results, mentioned above, predict both stable and transient species in the plasma. In this respect CRDS and RGA are complementary diagnostic tools. The RGA is capable of measuring the stable species, such as C2H2. C4 H2, C5H2 and C6H6 out of the plasma beam, whereas CRDS, due to its high sensitivity and good timer resolution, is aimed at measuring the detection of the transient species such as C, C2 and CH.
The result that will be shown in this report, will show that reaction of C2H2 with radicals, present in the ETP, play an important role in the plasma chemistry. This is supported by both the CRDS measurements and the RGA measurements. Furthermore it will be shown that only incorporating the loss of C2H2 by Ar+ into the plug-down model is not sufficient and that the reactions of C2H2 with other radicals have to be taken into account. Finally the results on the BBA will be discussed, giving more insight in this phenomenon.
But before the results of the RGA and the CRDS will be discussed, the processes in the reactor and the way these are analyzed have to be understood. The plasma is created in the are, but the actual plasma chemistry takes place downstream. Here C2H2 is admixed into the Ar plasma. It is assumed that perfect mixing occurs. The 1-dimensional plug-down model will be used to model the plasma chemistry. Note that there is no additional power input downstream into the plasma, i.e. the the downstream plasma can be
27
lnjection poin~z = 0
Supersornc
Shock Ex pan s1 on"{
1 Plug-down model CRDS
Subsonic > 06 m ~ppos1t1on Transport L
j CRDS .,._pown pos1t1on
(a) (b)
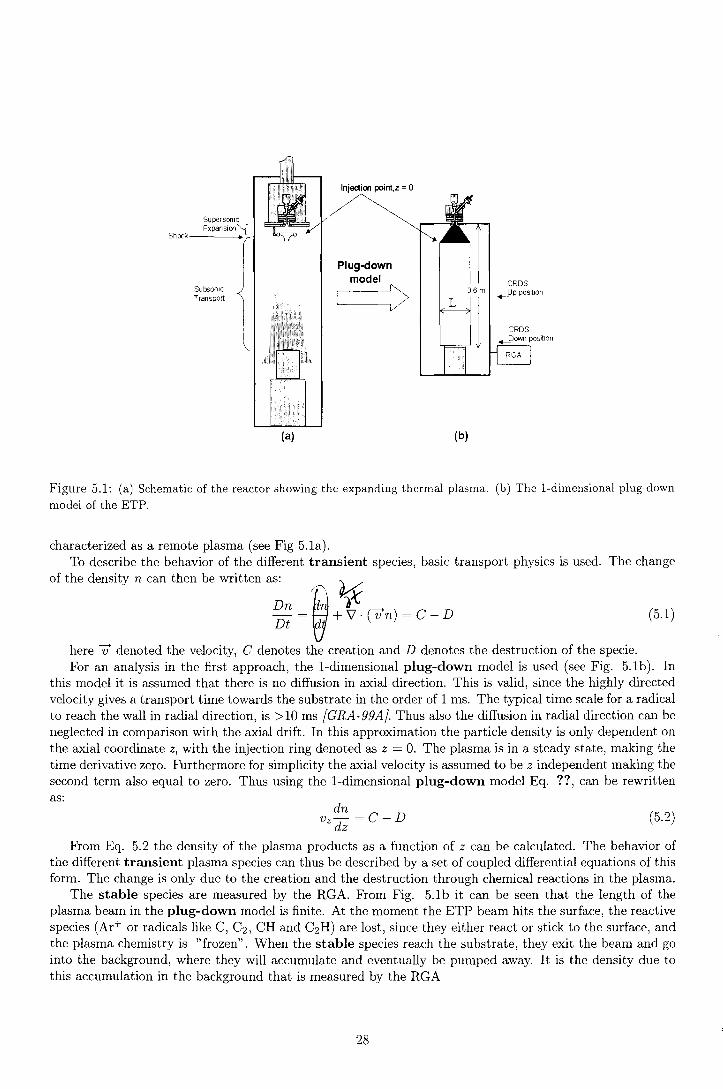
Figure 5.1: (a) Schematic of the reactor showing the expanding thermal plasma. (b) The 1-dimensional plug-down
model of the ETP.
characterized as a remote plasma ( see Fig 5. la). To describe the behavior of the different transient species, basic transport physics is used. The change
of the density n can then be written as: ~ ~
Dn id r/C Dt = fJ + V · (V' n) = C - D (5.1)
here V' denoted the velocity, C denotes the creation and D denotes the destruction of the specie. For an analysis in the first approach, the 1-dimensional plug-down model is used ( see Fig. 5.1 b). In
this model it is assumed that there is no diffusion in axial direction. This is valid, since the highly directed velocity gives a transport time towards the substrate in the order of 1 ms. The typical time scale for a radical to reach the wall in radial direction, is > 10 ms [ G RA-9 9A}. Thus also the diffusion in radial direct ion can be neglected in comparison with the axial drift. In this approximation the particle density is only dependent on the axial coordinate z, with the injection ring denoted as z = 0. The plasma is in a steady state, making the time derivative zero. Furthermore for simplicity the axial velocity is assumed to be z independent making the second term also equal to zero. Thus using the 1-dimensional plug-down model Eq. ??, can be rewritten as:
dn Vz-=C-D
dz (5.2)
From Eq. 5.2 the density of the plasma products as a function of z can be calculated. The behavior of foe different transient plasma species can thus be described by a set of coupled differential equations of this form. The change is only due to the creation and the destruction through chemical reactions in the plasma.
The stable species are measured by the RGA. From Fig. 5.lb it can be seen that the length of the plasma beam in the plug-down model is finite. At the moment the ETP beam hits the surface, the reactive species (Ar+ or radicals like C, C2 , CH and C2H) are lost, since they either reactor stick to the surface, and the plasma chemistry is "frozen". When the stable species reach the substrate, they exit the beam and go into the background, where they will accumulate and eventually be pumped away. It is the density due to this accumulation in the background that is measured by the RGA
28

5.2 Residual Gas Analyzer
In the past experiments have been clone to investigate the presence of stable particles by means of a RG A by A de Graaf (GRA-00}. In his research de Graaf already observed the existence of CmHn molecules in an expanding Ar /C2H2 plasma, with m = 2, 3, 4, 5, 6. This data was obtained by taking the difference between the RGA scans at plasma on and off conditions. It was also concluded that the influence of the polymers is negligible, because they estimated from the measurements that less then 43 of the C2H2 was used to build them (GRA-99A}.
A Similar experiment was clone for the research described in this thesis. In Fig 5.2 the substraction of an RGA scan for plasma on and off conditions is shown. The experimental conditions are an are current of 48 A and a C2H2 injection flow of 18.7 sccs.
1E-10 .-----------=======;i ~ma on - plasrra off 1
1E-11
1E-12 '[ :
~ ;
~ 1E13~
1E-14
p./ \
1 E-15 '----'J.llL__J____.....ILULiw._____,u___,_c_____~__J___JLL___LJ 20 30 40 50 60 70 80
Amu
Figure 5.2: The difference between a RGA scan for plasma on and plasma off conditions at an are current of 48 amps and a C2H2 inftow of 17.8 sccs.
The plot reveals the plasma products, C4 H2 at 50 amu, C6H2 around 74 amu and C5H5 at 78 amu (also see appendix D). The polymers observed by de Graaf with m = 2, 3 and 5 are not observed, this could be because of the lower are current used for this experiment, compared to that of De Graaf [GRA-00].
The C2H2 was monitored for plasma on and off condition. By doing so the difference between of the C2H2 densities can be calculated giving the consumption of C2H2.
Fig 5.3 shows the density of the C2H2 as was measured by the RGA in the background. The upper left, upper right and lower left graphs display the C2H2 density as a function of the C2H2 flow, for the plasma on and off conditions, for three different are currents of 22, 48 and 61 A and with an Ar flow of 100 sccs. The lower right graph shows the depletion of C2H2 as a function of the C2H2 flow For each current several settings of the RGA were used (the time independent: 1 and II and time dependent measurement: III, see chapter 4). These are indicated by the different symbols used. To denote the amount of C2H2 that has reacted away two quantities have been introduced. The first is the consumption C, defined as:
C = fon-Iojf (5.3)
The second is the depletion D. The depletion is introduced to compare the results from this report with those of de Graaf and is defined as:
D = l - Ion lof!
(5.4)
Here Ion and lof! are the measured current in the RGA at the C2H2 mass (amu = 26) relative to Ar (amu = 40). The values for I 0 n are taken from the linear fit through the plasma off data points.
29

0,30 • 22A, I 22Amps 0,30 • 48A. I 48Amps
• 22A.11 • 48A, Il Plasma áf A 48A.111 ....,.0,25
"" ....,.0,25
::J =! ~ ~
Plasma off
\ . •
~ D ~ .9 0,20
" .90,20
"' Plasma oo "' .~ .~
~ 0,15 ~0.15 0\ ij ij 0 Plasma oo t:: 0,10 t::0,10 ö ::J
<.)
ö ö g 0,05 alo.os ~ ;!l 8
0,00 0,00
10 15 20 10 15 20
C2H2 inflON [sccs] C2H2 inflo.v [sccs]
0.30 • 61 A.1 61 Amps 1.0
• 61 A. Il Plasma áf •
....,.0,25 \ 0,8 ::J
~ ~ .9 0,20
§ 0,6 "' .~ il ~ 0,15 Cl ,, ~ ij 0 Plasmaoo
IN0.4 t:: 0,10 cS ::J <.)
ö 0,2 al 0,05
\ '\, • 22A
• 48A ... 61 A
\ \~ ~ \ ~ ~. ~! ~
'~-_: <~~·~: 0
1
• ll 0
0,00 0,0 10 15 20 10 15 20
C2H2 inflON [sccs] C2H2 inflow [sccs]
Figure 5.3: The figures show the intensity of the C2H2 signa! in the RGA measurement relative to the Ar intensity. The intensities are measured while there is no current running and for the three are currents 22, 48 and 61 A (upper left to lower left). A fit is drawn through the points in the depletion graph, to guide the eye.
The plasma off measurements display a linear behavior, as expected. Since there is no plasma running, there is no consumption of C2H2 , hence a linear behavior is observed.
The plasma on measurements are shifted down in comparison to the plasma off data points. The difference between the plasma off and plasma on measurements, at a fixed C2H2 flow, is the amount of C2H2 that is consumed. This amount increases with increasing are current. For the low flow regions at the plasma on conditions, the consumption of C2 H2 is total. This is best visible with the 48 and 61 A measurements.
For the high flow regions, the plasma on measurements display a linear behavior. A line with the same slope, as the line drawn through the plasma off measurements, is drawn through the plasma on measurements. The difference between the two lines is a measure for the total consumption. From the graphs it can be seen that the consumption increases for increasing are currents. The C2H2 consumption for 22 A, 48 A and 61 A is respectively around 2,5 sccs, 6,5 sccs and 9 sccs. Also can be seen that the plasma on and plasma off conditions eventually display the same linear behavior for high flows. This indicates that the consumption becomes constant with increasing C2H2 flow.
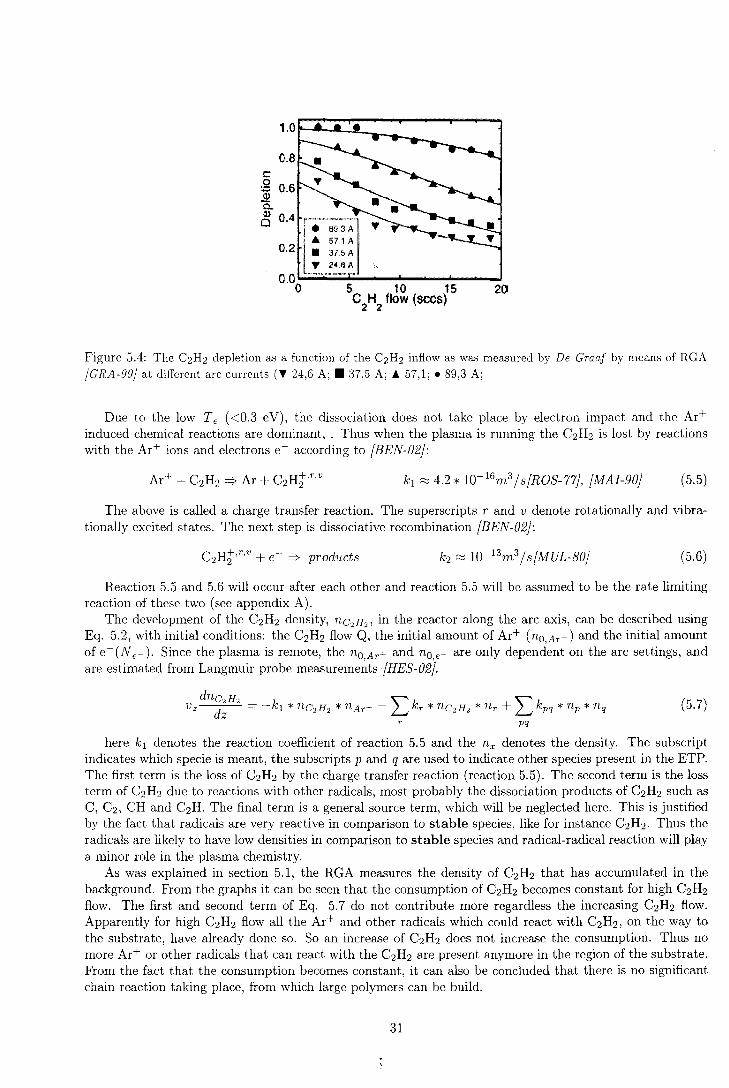
The depletion was also measured by De Graaf et. al. (GRA-99}. Fig. 5.4 shows the results of De Graaf, as a function of the C2H2. When comparing the lower right graph of Fig. 5.3 and Fig. 5.4, it can be seen that the the data points show similar behavior. Due to the fact that the lower right graph of Fig. 5.3 has more data point for low C2 H2 flow, it can be seen that at low flow regions, there is full depletion. Probably the plug-down model from De Graaf also has to take into account other loss reactions for C2H2 besides the ion-induced dissociation.
30
c: .Q 6 ]l o. a. ~ 0 .4 rr-···'"''"'"'""······, •
0.2 • 57.1 A • 37.5 A
T 24.6 A
20
Figure 5.4: The C2H2 depletion as a function of the C2H2 inflow as was measured by De Graaf by means of RGA
(GRA-99} at different are currents (T 24,6 A; • 37,5 A; Ä 57,1; • 89,3 A;
Due to the low Te ( <0.3 eV), the dissociation does not take place by electron impact and the Ar+ induced chemical reactions are dominant, . Thus when the plasma is running the C2 H2 is lost by reactions with the Ar+ ions and electrons e- according to (BEN-02):
k1 ~ 4.2 * 10-16m 3 / s(ROS-77}, (MAI-90} (5.5)
The above is called a charge transfer reaction. The superscripts r and v denote rotationally and vibrationally excited states. The next step is dissociative recombination (BEN-02):
(5.6)
Reaction 5.5 and 5.6 will occur after each other and reaction 5.5 will be assumed to be the rate limiting reaction of these two ( see appendix A).
The development of the C2H2 density, nc2 H 2 , in the reactor along the are axis, can be described using Eq. 5.2, with initial conditions: the C2H2 flow Q, the initial amount of Ar+ ( no,Ar+) and the initial amount of e-(Ne-)· Since the plasma is remote, the no,Ar+ and no,e- are only dependent on the are settings, and are estimated from Langmuir probe measurements (HES-02).
(5. 7)
here k1 denotes the reaction coefficient of reaction 5.5 and the nx denotes the density. The subscript indicates which specie is meant, the subscripts p and q are used to indicate other species present in the ETP. The first term is the loss of C2H2 by the charge transfer reaction (reaction 5.5). The second term is the loss term of C2H2 due to reactions with other radicals, most probably the dissociation products of C2H2 such as C, C2, CH and C2H. The final term is a general source term, which will be neglected here. This is justified by the fact that radicals are very reactive in comparison to stable species, like for instance C2H2. Thus the radicals are likely to have low densities in comparison to stable species and radical-radical reaction will play a minor role in the plasma chemistry.
As was explained in section 5.1, the RGA measures the density of C2H2 that has accumulated in the background. From the graphs it can be seen that the consumption of C2H 2 becomes constant for high C2H2
flow. The first and second term of Eq. 5. 7 do not contribute more regardless the increasing C2H2 flow. Apparently for high C2H2 flow all the Ar+ and other radicals which could react with C2H2, on the way to the substrate, have already done so. So an increase of C2 H2 does not increase the consumption. Thus no more Ar+ or other radicals that can react with the C2 H2 are present anymore in the region of the substrate. From the fact that the consumption becomes constant, it can also be concluded that there is no significant chain reaction taking place, from which large polymers can be build.
31

The second stable molecule that was monitored by means of the RGA is diacethylene (C4 H2 amu = 40). The existence of C4H2 was already shown by de Graaf, but the C4H2 in the background was not yet considered to be an important species at that time. The behavior of C4H2 as a function of the C2H2 flow at three different are currents, 22 A, 48 A and 61 A, was monitored for the first time during the experiments presented in this report.
Fig 5.5 displays the C4H2 density as measured in the background as a function of the C2H2 flow. All these measurements were clone while the plasma was running. No C4 H2 was detected when the plasma was off. This is an indication that C4H2 is a plasma product.
1,0 1,0
~ C4H2 ....., 1 48AI C4H2 :j oi
1 :J 0 48All ai :::::o.a ~0,8 " 0 0 Co.6 Eo.s ~ ~ .9 .9 " " ~0.4 ~0,4 ~ ~ il ë \50.2 ~
50,2 0 0 b - b 1l ~
~ ~ ;!l 0,0 ~o.o 10 15 20 10 15 20
C1H1 inftON (sccs] C1H1 infto.v [sccs]
C4H2 1,00
• 61AI --22Amps C4H2
:j c' 61All :j 48Amps ai ai "::::::: 0 :;:. 0,80 61 Amps
0 0
(.... 0 Co.so ~ ~ .9 .9 " " ~ 0 ~ 0,40 ~ ~ il ë t: 0
~ :J 5 0,20 0 0
b b 1l ~
~ ;!l 0 ~ 0,00 10 15 20 10 15 20
C1H1 inftoiv (sccs] C,H, inftON [sccs]
Figure 5.5: The C4H2 signa! in the RGA measurement relative to the Ar singal as a function of the C2H2 inflow, for currents 22, 48 and 61 A (from upper left to lower left). A fit is drawn through the points to guide the eye. The lower right figure combines the three fits of the different currents.
The C4H2 can be produced by the following reaction:
(5.8)
where C2H can be formed in the first reaction 5.6. Reaction 5.8 shows that in order to produce C4H2, also C2H2 is needed. Thus no C4H2 can be created in the low flow regions (<I>Ar+ > <I>c2 HJ, since most of the C2H2 have reacted away with Ar+.
The differential equation for the density of C4H2 , nc1
H2
can be derived in a similar way as was clone for C2fü.
(5.9)
32

Like for C2H2 the RGA measures the background density of C4H2 that has accumulated in the background. From the 22 A measurement it can be concluded that the C4H2 is a saturation curve. This means that for high enough flows of C2H2, the density of C4H2 becomes independent on the flow. This means that either the destruction and creation of C4H2 do not occur anymore, or that these processes are in equilibrium. For the first case, from the first term of Eq. 5.9, it can be seen that if C2H2 flow is increased, i.e. increasing nc
2H2 , more C4H2 is produced. Despite the increasing C2H2 density, there is no increase in C4H2 density
for high enough flows. This indicates that nc2 H must already have been consumed. For the second term it means that the other species, that reacted with C4H2, are also depleted.
The second possibility is the case where the destruction and creation are in equilibrium. One of the C2H2 loss processes is the reaction with C2H creating C6H2. In Fig 5.2 some C6H2 can be observed, supporting this hypothesis. Assuming that this is the only loss process and that the creation and destruction are equal to each other:
(5.10)
This is true if nc2 H is depleted for high flows, which is covered by the first situation, or the term between the brackets is zero. This term however can not go to zero, since for high flow, nc"H2 becomes constant (saturation curve) and nc2 H
2 increases. Thus the most probable explanation of the saturation curve is that
all the C2H has reacted mvay, not allowing anymore for the creation of C4H2. using the calibration procedure described in section 4.1.3, it can be estimated that the highest measured
density of C4H2 at 22, 48 and 61 Ais respectively 3,7*1018 m-3 , 1,3*1019 m-3 and 2,3*1019 m-3 .
After a maintenance checkup of the manufacturer and cleaning of the RGA, it was possible to detect lower signal, thus C6H2 and C6H6 that were observed in the scan shown in Fig 5.2, could also be monitored. Furthermore the setup was changed, extending the maximum flow of C2H2 from 20 to 33 sccs. Due to the short available time only the condition with 48 A was investigated. Contrary to the experiments described in the text above, the following measurements with the RGA were clone at constant pressure(0,33 mbar) instead of constant Ar flow.
C2H2 and C4H2 measurements
The C2H2 and C4H2 were again measured in this new setup and could now be monitored up toa C2H2 flow of 33 sccs. The results are in agreement with the results from section 5.2.l and 5.2.2. Fig 5.6 shows the results for the C2H2 measurement under plasma on and off conditions together with the C4H2 measurement.
0
• C2H
2 plasma off 48 Amps
C2H
2 plasma on
15 20 25
C,H, infio.v [sccs] 30 35
10 1 • C,H, 1
/ ,~/
48Amps
..
01..-~/-~~·~--L~--'--'--''--~'----'--'-~-'-~ 0 10 15 20 25 30 35
C1H
1 infio.v (sccs]
Figure 5.6: The behavior of C2H2 and C4H2 obtained with the improved setup.
33

What was already concluded in the section 5.2.1 and 5.2.2 is confirmed by the graphs in Fig 5.6. The improved setup allowed for studying of the plasma at higher flows and it can be seen that for these high flow regions the C2H2 consumption and the C4H2 density become constant. The consumption of C2H2 is about 9 sccs and the saturation density of C4 H2 is in the order of 2*1019 m-3 .
The next specie that was shown to be present as a product in the Ar/C2H2 ETP is C6 H2 .(see the left graph of Fig. 5.2). This was also concluded by De Graaf [GRA-99A}, hut was not looked at into detail. The behavior of C6 H2, as a function of the C2 H2 flow, was measured for the first time.
Fig 5. 7 shows the results of the C5H2 as was measured in the background of the ETP, for 48 amps.
1.6 r.::==::;----::-:--------...., 1 • c,H, 1 48 Amps
1,4
:1: 1.2
0 1,0 . 5; 0,8 1:: 1l b 0,6
1iî ~ 0.4
0,2
•
o.o--~~~~~~~~~~~~~~
0 10 15 20 25 30 35
C,H, inflo.v [sccs]
6,0 1 e C,H, 1
:1: 5,0
0 4,0 . ~ 3,0 1:: 1l ~ 2,0
i!l 1,0
48Amps
10 15 20 25
C2H
2 inflo.v [sccs[
Figure 5. 7: The behavior of C5H2 and C5H5 as a funciton of the C2H2 inflow.
A possible way to produce C6 H2 was already introduced in the previous section:
( k4 = unknown)
The differential equation can be derived in a similar way as was clone for C4 H2:
30 35
(5.11)
(5.12)
The first term in Eq. 5.12 is the creation term according to reaction 5.11, the second term is a general loss term. From the previous section on C4 H2, it was concluded that the density of C4 H2 as a function of the C2H2 flow displayed saturation behavior and that the C2H reacts away for high C2H2 flow. This means that for high C2H2 flows, the creation of C6H2 has to stop. From the graph it can be seen that after a peak at 26 sccs, the graph goes down. Thus a loss process is taking place. Most probably the C5H2 is lost by a reaction with C2H2 The highest density measured for these conditions, at around 26 sccs, is in the order of 3*1018 m-3.
The last stable molecule that was monitored was C6H6 , of which the presence was already observed [GRA-99A} and is also shown in Fig. 5.2. It is not certain in what way the C6 H6 is created, since there are numerous isomers with the C6 H6 formula (see appendix C). The behavior was monitored in the same way as the other stable species.
The right graph of Fig 5. 7 shows the results of the density of C6H6 as was measured by the RGA in the background. The highest density of C6 H6 was measured around 36 sccs and was in the order of 9*1017 m-3 .
34

5.2.4 Time dependent measurements
The time dependent measurement in Fig 4.8 shows a slow build up of the densities of C4H2 and C5H2, whereas the densities of other, C2H2 and C5H6 , do not display this behavior. From the time response calculations (section 4.1.2) it can be concluded that the build up seen in Fig 4.8 is not due to the RGA, which has a response in the order of 0.02 s. Thus this build up is due to a processes in the reactor.
The typical residence time in the reactor is in the order of 0,4 s, whereas the build up time of the densities measured for C4 H2 C5H2 is in the order of 10 s. Thus processes other then the accumulation in the background have to be taken into account. One possibility is the deposition on the substrate and the reactor wall, which can depend on the hydrogen passivation of the surface.
To investigate this two kind experiments were done. For the first experiments the reactor wall was "passivated" by covering the wall with H. To do this, first a deposition was run for 30 seconds at 75 A with an C2H2 flow of 36 sccs. Next an Ar/H plasma was run for 1 minute at 1 sccs of Hand then for 2 minutes at 10 sccs of H. Following a Ar plasma was run for 1 minute and finally the Ar/C2H2 plasma was run and the densities were monitored.
For the second experiments, the wall was "activated". First a deposition was run for 30 seconds at 75 A with an C2H2 flow of 36 sccs. This was followed by running a Ar plasma at 75 A for 5 minutes and then at 48 A for 1.5 minutes. Finally he Ar/C2H2 plasma \rns run and the densities were monitored.
Fig 5.8 shows the results of the densities of C4 H2,and C6 H2 in the background, which were monitored in time for the two conditions described above by the RGA. The graphs on the left are for the "passivated" wall conditions and the graphs on the right are for the "activated" wall conditions. The "dimp" in all the graphs is due to a C2H2 cut of for 15 s. This is to check if there is indeed no build up anymore. The results for show that for C4H2 and C6H2 the "passivated" conditions (left graphs) the dcnsity build up is faster then under the "activated"' (right graphs) conditions. This could suggests that the slow build up is due to deposition to the walls. Apparently the stable molecules C4 H2,and C5H2 stick to the surface. Fig 5.9 shows the results of the densities of C2H2,and C5H5 in the background. No build up was observed for C2H2 and C6H6 . This strongly suggest that C2H2 and C5H5 do not deposit.
35

1.4 ,---;::::========::------, 1,2
~ 1,0
0 0,8
" ë ~ 0,6
il ~ 0,4
"' ~ 0,2
Ar flo.v
C4 H
2, passivated wall
Ar/C,H, plasrra Ar/C,H, flo.v Ar flo.v ~----
c,H, ftON áffor 15 s
~ I •
•
r..\V•. ,~ 0,0 ~~!.._.J......_J_~·~~~~~~~~~
900 950 1000 1050 1100 1150 1200 1250 1300 1350 1400 1450
nme[s] 0,5 .------;::::=========;--------,
1 C6H
2, passivated wall 1
0,4
0 0,3
" ~ il 0.2
b ~ ~ 0.1
0,0
Ar flo.v Ar/C2H
2 plaS1T0 Ar/C
2H
2 flovv Ar flo.v
~----~ ----- ~----c,H, ftON off tor 15 s
900 950 1000 1050 1100 1150 1200 1250 1300 1350 1400 1450
Time[s]
1.4 ,-----;::=======::::;-----1
1,2
Ar flo.v Ar/C2H, plasrra Ar/C2 H2 flo.v Arflovv
~ 1,0
c,H, ftON áffor 15 s •
\ .A 0 0,8
" ~ 0,6
il ~ 0,4
"' . !~\!"
0,0 ·~1 ·- ~ ~ 0,2
0 .
™ ~ ~ 900 950 ~ 1~ 1~ 1~ = Time(s]
0.5,-------;::=======~---,
1 C6H
2 activated wall 1
0,4
Ar flo.v Ar/C2H
2 plasrra Ar/C2H2 flo.v Arflovv
0,3 '" C2H2 ftON offfor 15 S
~ 0,2
a b
~ 0,1
0,0
750 ~ ~ 900 950 1000 1050 1100 1150 1200 nme[s]
Figure 5.8: Behavior of C4H2 and C6H2 as a function of time for activated and passivated wall conditions
36

100
1 C
2H
2, passivated wall
80 Ar flow
~ Ar/C H plasrra Ar/C H, flow __ ,_, ___ 2 Ar flow
" 60 0
j: c,H,T~l_J--o- l
900 950 1000 1050 1100 1150 1200 1250 1300 1350 1400 1450
Time[s] 0,30 ,-----;:::========:::;-------,
J C6H6, passivated wall J
0,25
0,20
0
~ 0,15
i:l b 1il 0,10
~
Ar flow Ar/C2H
2 plasrra Ar/C2H2 flON Ar flow
~
0
" î; t:: i:l b 1:l
" Ql 0
900 950 1000 1050 1100 1150 1200 1250 1300 1350 1400 1450
nme[s]
100
80
60
40
20
750
Ar/C2H2 plasrra Ar/C,H, flow Ar flow
800 850 900 950 1000 1050 1100 1150 1200 nme[s]
0,30 ,--------;:=========;,...-------, J C
6H
6, activated wall J
0,25
Ar pasrra Ar/C2H
2 plasrra Ar/C2H2 flow A flON
750 800 850 900 950 1000 1050 1100 1150 1200
nme[s]
Figure 5.9: Behavior of C2H2 and C5H5 as a function of time for activated and passivated wal! conditions
37

5.3 Cavity Ringdown Spectroscopy
Results from previous work already indicated the present of the radicals C, C2 and CH. The CRDS was used to monitor these hydrocarbon radicals to gain more insight on the role these radicals play in the plasma chemistry, Besides these radicals also the BBA was measured. The hydrocarbon radicals are known to be created in the following chain of reactions.
First the C2H2 reacts according to reactions 5.5 and 5.6. Possible products of reaction 5.6 are as followed:
(5.13)
The three most probable branches of reaction products are shown in reaction 5.13. The o/ s are called the branching ratios and represent the chance a certain branch occurs, further more the equation: a 1 +a2 +a3 =1 holds.
The reactions 5. 5 and 5.13 will be called the primary reactions, since only one Ar+ and e- pair is needed for these reactions to occur. Notice that in the second and third branch C2 and CH can already be created. It is assumed that the first branch, with C2H as a product, is dominant. C2 and CH, next to C, can also be created in secondary reactions (second Ar+ and e- pair is needed), according to:
C2H +Ar+ ==;. C2H+,r,v +Ar
C2H+,r,v + e- ~ CH* + C
fà C2 + H
(k5=unknwon m3 /s)
(k6=unknwon m3/s)
(5.14)
(5.15)
In reaction 5.15 (3 represents the branching ratio and the equation (31 +(32=1 holds. A differential equation can be constructed for each radical from which the density is calculated. In the differential equations the creation term by a radical radical reaction is again neglected.
(5.16) 0
(5.17)
(5.18)
The differential equations 5.16, 5.17 and 5.18 describe the density of respectively C, CH and C2 in time. The C2H2 flow, Q, the no, Ar+ and no, e- are the initial conditions for these differential equations. The first term of these equations is the creation term deduced from reactions 5.14, 5.15. The second term is a general loss term by, if any yet unknown, reactions with other species present in the plasma
Several parameters were used to monitor the radicals. All the graphs are a function of the C2H2 flow. The second parameter is the are current. The currents used are: 22, 48 and 61 A. Finally the measurements were clone at two different positions: 30 cm from the are, called the up position, and 57 cm from the are, called the down position. The latter one is 3 cm over the substrate.
5.3.1 C radical measurement
In Fig 5.10 the.densities of the metastable Care shown as a function of the C2H2 flow. The measurements at the down position were already performed by Benedikt et. al. {BEN-02). The lower state densities are calculated out of CRDS measurements (note that it is not the ground state density of C that is being measured). for this an estimate for the diameter of the beam had to be estimated. This was take to be 15 cm.
38

0
[. 3
~ ïll c -8
22Amps
T~ j_ r._ ~'!-"----•• • • •
1.0 C
2H
21nflow
61 Amps
10
C2H
2inflow
15
• Cup 1 • Cdown
15 20
i
"
48Amps
" .
10 C,H,inflow
Up
. ·,~ ''··, .. ' 1 ---------------- ' • ' ·~
15 20
• 22Amps • 48 Amps " 61 Amps
~~-co-.• - ... ~r-.=:.=_=:: o~, ~~~~~~~~~~~~~~~~----<
~ ef Dovvn
10
c,H,inflON 15 20
Figure 5.10: The figure shows the behaviour of Cas a funetion the C2H2 inflow. The upper left, upper right and lower left graphs display the results obtained for different are eurrents. In the lower right graph the down measurements of the different are eurrents are shown together.A line through the points is fitted to guide the line, unless stated itherwise, the same is clone for the rest of the graphs in this seetion.
Each graph represents the measurement for one current, except for the lower right graph. This graph combines the down and the up measurement for all three currents.
All profiles show a clear peak in the flow region of 1-6 sccs. The peaks increase with increasing are current. This is logic, since more power is pun into the plasma, allowing for more dissociation. Also the peaks for the up position are higher then the down position. Apparently it is namely creation of C that has taken place from the nozzle to the up position. From the up to the down position the signal is quenched, i.e. it is namely destruction that has taken place.
Cis created by second step reactions (see reaction 5.14 and 5.15), this means that C2H must be created before reaction 5.14 can occur. The creation term is the first term on the right hand side of Eq. 5.16, the second term represents the loss process of C. C is lost by reactions with other species that are present in the plasma. The most probable candidate for a reaction with C for high C2H2 flow is C2H2:
(5.19)
For the low flow regions (<I>Ar+ < <I>c2 H 2 ), the results show that the graphs for the up and the down measurements are similar up to a certain point, from where they deviate. An argument that supports the theory that Cis lost by a reaction C2H2, is that the point at which the C density from the down measurement starts to deviate form the up measurement, corresponds with the point at which the consumption of C2H2 is not total anymore (see fig. 5.3 ). The unconsumed C2H2 allows for a reaction with C. Including reaction 5.19 into Eq. 5.16 gives:
39

(5.20)
If C2H2 increases, the second term on the right hand side of Eq. 5.20 is larger. Thus there is a higher loss rate with C2H2 for high C2H2 flows.
5.3.2 C2 rad ic al measurement
6.0
C2
up 1
5,0
~
.d ~
0 • [. 4,0 v 1 ', ~ t
"' '' "' • "' l '•, ~ 3,0
8. .. 5 i'i 2,0
.t b ·+ "' .0
"' ro 0,0
10 15
C2H
2 inflo.v [sccs]
6,00
• 48 Afrlls 1
5,00
"!
0 4,00
[.
"' "' ~3,00 ij; Q_
5 2 00
~· ·· ....• ~ 1,00
0,00 20
• ••
•~., .$, A
~·-· ~-10
C2H
2 inflCNI (sccs]
15
• 22 Arr4Js • 48Afrlls
" 61 Arr4Js
20
Figure 5.11: The figure shows the behaviour of C2 as a function the C2H2 infiow. The left graph is the measurement at the up position and the right graphs are the measurements at the down position. For the up position only the 48 are current measurement was available.
In Fig 5.11 the absorption per pass by C2 is shown as a function of the C2H2 flow for both the up and the down position. For the down position three are currents were used: 22, 48 and 61 A. For the up position only the 48 A measurements was obtained due to problems with the setup.
Note that the scale of the y-axis between the left and the right graphs is arbitrary now. This is because the up and down results were obtained with different spectral resolutions, due to the use of different dye lasers. The right graph shows the previous results obtained by Letourneur et al. The densities were calculated to be in the order of 1017 m-3 (BEN-00}
Using the C results, it can be assumed that at the up position the density of C2 will be higher in comparison to the down position. As is the case with C, a loss process due the reaction of C2 with other species will take place between the up and the down position, causing the density to go down. Note however that there is a difference in comparison with the results of C (see the lower right graph in fig. 5.10). For the C measurements, the height of the peaks increase with increasing are current, whereas with C2 , the 48 A measurement has the highest intensity.
The difference between C and C2 is that C2 can also be created in the primary reactions, whereas C can only be created in the secondary reactions. It is however not certain that this difference is the cause of the different results.
The C2 is most probably lost by the following reaction:
(5.21)
Including this reaction 5.21 into differential Eq. 5.18 gives:
~~ (3 ~ Vz~ = 2 * k5 * nc2H * nAr+ - kg* nc2 * nc2H2 - L kq * nc2 * nq (5.22) q
If the density of C2H2 increases there is a larger contribution of the loss term. This is in agreement with the results where for high C2H2 flows the density goes down.
40

5.3.3 CH radical measurement
5,0 2,0
CH up • 22 Alrps CH down • 22Alrps
• 48 Alrps • 48Alrps w~4.0 • 61 Alrps • 61 Alrps
0 C?-1.5 . 0
ill 3,0 . "' (/) a. (/)
~ ~ 1,0 a.
~ ö 2,0 a. '8. ö b
10,5 (/) .0
" " 1,0
~
0,0 0,0 10 15 20 w 15 20
C,H, inflo.v [sccs] C1H
2 inflCNI (sccs]
Figure 5.12: The figure sho\\·s the behaviour of CH as a function the C2H2 inflow. The left graphs are the measurements at the up position and the right graphs are the measurements at the down position. At each position the three currents 22, 48 and 61 were used.
Fig 5.12 shows the absorption due to CH for the up and down position for three currents: 22, 48 and 61 A. Note that the scale of the y-axis between the left and the right graphs is again arbitrary. This is because the up and down results were obtained with different spectral resolutions, due to the use of different dye lasers. The right graph shows the previous results as measured by Letourneur et. al (ENG-99}. Densities were calculated to be in the order of 1016 m-3 .
Using the C measurement results it is again assumed that at the up position the absorption is higher than at the down position.
The results show that a loss process takes place between the up and the down position. The reaction by which then CH radical is probably lost is lost is:
(5.23)
Including reaction 5.23 into Eq. 5.17 gives:
dncH ~ Vz~ = /31 * k6 * nc2 H * nAr+ - ku * ncH * nc2 H 2 - ~ kp * ncH * np
p
Again for increasing density of C2H2 the contribution of the loss term is larger. This is in agreement with the results where for high C2H2 flows the density goes down.
The CH measurement shows similar behavior compared with C2, in the sense that the 48 A peak is the highest, whereas the C radical shows increasing height with increasing current. The difference can be caused by the similar role C2 and CH play in the plasma chemistry, namely that they both can be created in primary and secondary reactions, whereas C can not.
There is another difference. The C and C2 have different slopes at low C2H2 flow for the three currents, whereas for CH the slope is the same for the three currents. This can be due to an extra loss reaction by metastable Ar, that is taking place for the C and C2 and not for CH. The reason for this can be the large energy difference between C and C2 (respectively 11,26 eV and 11,4 ± 0,3 eV) (NIS-B} on one side and CH (10,64 ± 0,01 eV) (NIS-B} on the other side. Since metastable Ar has an energy of 11,55 or 11,74 {NIS-B} it is more likely tö react with C and C2 then with CH, causing the difference in behavior for the three currents. Further research into this matter is needed.
41

1,00 1,00
• 22Amps BBA up 248 nm • 22.Arrps BBA down 248 nm 0,90 0,90 • 48Amps • 48.Arrps ...,. 0,80 " 61 Amps -,.0,80 À 61 Arrps " " "' ai
N';::_ 0.70 ~';::_0,70
0 0,60 0 0,60 . . ';;;' 0,50 ';;;' 0,50
"' "' ~ 0.40 ~0.40 " " Q. Q. 6 0,30 6 0,30
~0.20 ~0,20 ~ 0,10 ~ 0,10
0,00 0,00 10 15 20 10 15 20
C1H
1 inflON [sccs] C
1H
1 inflON [sccs]
Figure 5.13: The graphs show the behaviour of the BBA for the three currents 22, 48 and 61 amps at the up and the down position.
5.4 Broadband Absorption
All the CRDS measurements in the range of 215 nm to520 nm showed a broadband absorption in addition to the peak of interest. A number of explanation are possible for this phenomenon (see section 3.4.4). It is not certain what is causing the broadband absorption at this time. In order to gain more insight into the BBA, several experiments were done combining the RGA and the CRDS data, looking more closely at the profiles of the BBA as a function of the C2H2 flow and comparing the results described in this paper with the work of other groups.
5.4.1 BBA at constant wavelength
Fig 5.13 shows the behavior of the BBA as a function of the C2H2 flow for the three different currents (22, 48 and 61 A) at the two different positions (up and down). The BBA increases with increasing are current and is higher at the down position. Furthermore for the 22 A measurements the graphs are the same at both positions. This could indicate that for 22 A the plasma chemistry has fully evolved at the up position.
The regions where the BBA is zero for the different currents, seems to correspond to the regions where the C2H2 is fully consumed (see Fig 5.3). This could indicate that the particles that cause the BBA are created from reactions including C2H2.
The residence time of the particles in the reactor is in the order of 0,4 s, thus the density in the background can be assumed to be homogeneous. In the 1-dimensional approach it was assumed that the diameter of the beam remains constant throughout the reactor. In practice however the diameter of the beam increases further down the reactor. This means, together with the homogeneous density in the background, that there are less particles ion the CRDS line of sight in the lower regions of the reactor. Thus the fact that the BBA is higher down then up is an argument that the BBA is caused by particles in the beam. Still, the measured BBA can be a combination of the absorption in the beam and the background. However from the CRDS measurements it was concluded that no radicals are present any more for high C2H2 flow regions, since they will all have reacted away. The BBA has to be caused by stable species, created directly in the beam and not in the background.
From the BBA up and down measurement (see FIG. 5.13) it can be seen that the BBA is a saturation curve and that the BBA is probably caused by a stable specie. One of the candidates is the C4 H2 molecule, which also displays a saturation curve. To get more insight whether or not the BBA is caused by the C4 H2 the profiles of the different curves are compared.
42

0,8
:j
~
" 0,6
0
[, ~ .9 0,4 Q)
> ~ ~
~0.2 ö 0 àl ~o.o
20
20
• 48A 1 D 48All
• BBA
...
10 15 20 C
1H
1 inftcw [sccs]
Figure 5.14: The profiles of the BBA and the C4H2 are compared with other. This is done for the are current of 22 amps (upper left), 48 amps (upper right) and 61 amps (lower left). The profiles for 22 and 61 amps show some resemblance. It seems that there is a shoulder missing at the inflow region of 1 - 9 sccs for 22 amps and 5 - 15 sccs for 48 amps. The profiles of 61 amps are different.
Fig 5.14 shows the results of this comparison. Everything is scaled to the 22 A measurements, here the BBA is scaled to the C4H2 in such a way that the saturation levels coincide. The same scale for the BBA-y axis of and the C4H2-y axis as is used in the 22 A graphs, is used is used in the 48 A and 61 A graph. This way the development of the BBA and the C4H2, can be monitored relative to each other. There is no clear correlation between C4H2 and the BBA at high are current, where the measured data do not overlap.
An extra check was clone look into the correlation between the C4H2 and the BBA. This was clone by measuring the C4H2 by means of RGA simultaneously with the BBA by means of CRDS at varying are current ( 15 A - 71 A) at a constant C2H2 flow of 18. 7 sccs. The data is plotted on a double log scale and the results are sown in Fig 5.15.
A line with slope 1 is drawn through the different measurements. The slope 1 indicates a linear dependence. The graph shows a linear dependence between C4H2 and the BBA if the are current is not too high ( I < 40 A). The graph shows that for high current the ration C4H2/BBA becomes larger.
5.4.3 BBA profiles for different wavelengths.
During the CRDS measurements on the radicals C, C2 and CH, the BBA could also be observed. The absorption peaks caused by different radicals were situated on top of the BBA. lt was already noticed then
43

Figure 5.15: The graphs shows the measured BBA and C4H2 at the same sattings. The measurements are clone at
a C2H2 inflow of 17,8 sccs at different are current (15 - 75 A)
that the BBA varied with the wavelength. To gain more insight into this behavior, the BBA as a function of the C2 H2 flow was abstracted from the radical measurements. The results are shown in Fig. 5.16. In the left graph the profiles are normalized for high C2H2 flow. Note that here we assume that for high C2H2 flow, i.e. during the saturation, one specie is dominant. All the measurements were done at the down position at 48 A. The 278 measurement was already obtained in previous experiments by Letourneur.
7,0 ~---------------~
1BBAat48A1 6,0
6
------ -· --- ----
"!~
5,0
/-- 248 nm
~·/ " E ~ 4,0
"' a.
~ 3,0
5 e. 11: 2,0
~ 1,0
' ./ 278 nm
:r'°/ ·" ...•.. • .- • I ~ ~! -. ' -- ,., - " T
• .• 431 rim i •. '• 'f/ . ···--· ". • 517 rint-- • -• •- +---.
0,0 c......o• """"~/~· ---L--~-~-~-"---~---'-" 10 15 20
c2H
2 flow [sccs]
Figure 5.16: The graphs show the behaviour of the BBA for different wavelenths: 248, 430 and 517 nm. The
graphs on the right are the normalized graphs. Notice the absolute difference in absorption between the different wavelengths.
All the graphs display saturation behavior, it can also be seen that the BBA increases for decreasing wavelength. The profiles obtained at 431 and 517 nm can not be explained by a model where the BBA is caused by just one particle. Then the profile of the second particle can be obtained by subtracting two BBA profiles form each other, when they are normalized at the high C2H2 flow.
It is clear that the BBA as a function of the C2H2 flow is different for different wavelengths. It is interesting now to see how the BBA behaves as a function of the wavelength at constant C2H2 flow. This is shown in Fig. 5.17.
The function À -n is fitted through the points, giving a n of 6,4.
44

Similar results have been found by C. Buchta et al. (BUC-95). They preformed light scattering and fluorescence measurements on laminar premixed flames. The flames were obtained by feeding a mix of oxygen with methane or ethylene at atmospheric pressure to a porous plate burner. The flames exhibited variation in their temperature and composition only in the axial direction. Thus by measuring at different heights above the burner, information could be obtained on the evolution of the burning mixture as a function of the residence time. The parameter varied is called the equivalence ratio </> and is defined as the carbon to oxygen ratio (C/O) of the mixture of chiometric combustion leading to C02 and H20 as final products (C/Ostoi. = 0,25 for methane and 0,33 for ethylene flames). The results they obtained are shown in Fig. 5.18
The results show an absorption over the full range of the measured wavelengths. For the two top curves a peak is situated on top of the BBA. They also fitted the function >. -n through the data point and found values for n in the range from 1 to 9. dependent on what conditions were used. The main conclusions were that absorption and fluorescence in the UV was due to aromatic functionalities or chromophoric groups containing not more then two aromatic rings, and the fluorescence in the visible range is attributed to larger aromatic polycyclic structures in higher molecular mass structures.
The BBA that is observed in the experiment shown in chapter 5 can be caused by a similar group, that is causing the absorption and fluorescence in the Buchta experiments.
5.5 Discussion
In the preceding chapter the results of the two diagnostic tools and the BBA were presented separately. There is of course a link between the results, since they are all measurements on the same ETP. Here the results will be handled in a combined discussion.
The RGA results show that the reactions of C2H with C2H2, and for higher C2H2 flow also with C4H2, play a important role in the plasma chemistry. From the C4H2 saturation it can also be concluded that C2H has reacted away by the time it reaches the substrate for high C2H2 flows. Thus at these conditions the growth can not be caused by the C2H radical and the growth must be due to other species sticking to the surface.
Furthermore C, C2 and CH radicals are only present at low C2H2 flow regions, since at high C2H2 flow the radicals will have all been lost by reactions with C2H2. Thus these radicals only play a role during deposition at low C2H2 flow when the <I> Ar+ > <l>c2 H 2 • Thus the measurements show that for increasing C2H2 flow the composition of the plasma is controlled from a C, C2 and CH radical beam toa C2H radical beam and finally to a C4H2 molecule rich beam.
lt is still not sure at this time what is causing the BBA. From the BBA measurement at the up and down position it can be argued that the BBA is caused by species in the beam. However the BBA has to be caused by a stable species, since it is still present at high C2H2 flow. Since stable species accumulate in the background, it can not be excluded that the background absorption does not contribute to in the BBA. Also
1,4
...,. 1,2 :J
~ ~- 1,0
0 [., 0,8
::! ~ 0,6 :g_ c: g 0,4 e-0
~ 0,2
0,0
200 250 300 350 400 450 500 550
'Mlvelength [nm]
Figure 5.17: The BBA as a function of the wavelength. The depence is to the power of -6,4.
45

0.6 .... ·~ 'É .!i .!il 0.4 i 8 c: .2 ü L
0.2
i 0 2.00 22ü 240 260 280 300
wave~ength, nm
Figure 5.18: Resutls obtained from [BUC-95]: UV extinction spectra for a fully sooting premixed ehtylene-oxygen
flame (•, 1> = 2,3; z = 10 mm) and for a fully sooting and a near sooting methane oxygen flame at different heights above the burner (Q ,iJ = 'J 5· z = 10 mm " ,1, = 2 2· z = 8 mm· 0 ,1, = 2 2· z = 2 5 mm) 'l/- -, ) ' v' lj/ ' ) ' 'lf/ ' ' '
from the dependence of on the C2 H2 flow at different wavelengths, it could be seen that more then 1 species has to contribution to the BBA. Furthermore it was concluded that the BBA rv À -
5•4
. This dependence could be caused by aromatic group. It can be thus be that the BBA is not caused by 1 species, but by one functional group, namely the internally excited chromophoric group -G=C-H. This group is present in the plasma as a radical, but also as a group in the molecules C4 H2 and C6H2 . The internal excitation plays a role, since the BBA can not be correlated to C2H2.
46

Chapter 6
Modelling
6.1 Introduction
The plasma chemistry can be described by a set of coupled differential equations derived from the chemical reactions, that occur in the reactor, and their reaction coefficients as were given in chapter 5. The plug-down model is taken as a geometry for the model. In this model it was assumed that the velocity and the area of the beam are independent on the z coordinate. Also it is assumed that the perfect mixing occurs when between C2H2 and the Ar plasma, when it is injected at the point z = 0. Furthermore it is assumed that there is no interaction between the beam and the background and that the plasma products exiting the beam do not enter back into the beam at the top, i.e. no recirculation. Finally it is assumed that the dissociative recombination is skipped. It is assumed to happen automatically. The geometry and the differential equation were put into a maple program (see appendix F), the model is schematically shown in Fig. 6.1.
u
plasma chemistry
.......... " .......... " ... .
,,,_"_"_,,_,,_"_"_,," i initial conditions: !
z=O i - Ion flux i ~ !- C18:i flux j
i.."_"_"_,,_,,_"_"_,,1
ff'ittiö'gJ?äräiüêtër-s:~ 1 1 :-AreaA i 1 1 . . j· ve oc1ty u i i- Jonization dergred
t-~:~"~.~-~~~-"-.. -! "_"_"_"_"_"_"_", : ..+. n 1
~ "t'= a*A i t_,,_"_"_"_"_" __ ,_;
z=52 ~
Figure 6.1: The geometry of the maple model and the fitting paramers.
The initial conditions of the model are given by the ion flux, which is a result of the Ar flow (100 sccs) and the ionization degree and the C2H2 flux. These parameters coincide with the experimental parameters, namely the are current and the C2H2 flow. The output of the model is the flux of a specie at a specific distance from the injection point (z = 0) as a function of the C2H2 flow.
To calculate the density for a stable specie the flux ~ has to be divided by the pumping speed ( ""0,4 m3 /s). In the case of radical density the flux~ has to be divided by the product of the area of the beam A and the velocity of the beam u. The parameters that were used to fit the curves, obtained from the model, with the measured data are: ionization degree, and the product of the area of the beam A and the velocity of the beam u. From this product if the velocity was fitted the area could be calculated and vice versa.
47

6. 2 reactions
The equations that were put into the model, are obtained from the chemica! reactions given in chapter 5. An overview of the coupled differential equations is given below. These are the differential equations of Ar+, C2H2, C2H, C4H2, C6H2, C2, CH, C and products. The products is a general name for the products of the reactions of C2, CH, C with C2H2, but since it is not known how these species react a general name is used. Note that C6H6 is not included in the model. This is because it is not known how the C6H6 is created. The k are the reaction coefficients, the value of which are summarized in the table 6.1 and the values of the reaction coefficients are summarized in table 6.2
Table 6 1· .. Reaction Coefficient value [m;is- 1)
k1 4,2*10-ib [TSU-93]
k3 1,3*10-1b[L00-95]
k4 1,3*10-rn[REF]
k5 4,2*10- 1b[REF]
k1 3*10- 1b [CHA-99] kg 3*10- 1b[REI-80]
k11 3*10-1b[GUA-98]
Table 6 2 Branching ratios value
0:1 1
0:2 0 0:3 0
!31 0,5
!32 0,5
Overview of differential equations Table 6.2:
C2H:
C4H2:
C6H2:
C2: CH: C: Products:
Aud<I>J;+ = -k1<PAr+<Pc2H2 - k5<PAr+<Pc2H
Aud<I>~;H 2 = -k1<Pc2H2<PA,+ - k3<Pc2H2<Pc2H - k1<Pc2H2<Pc - kg<Pc2H2<Pc2 -k11 <Pc2H2 <PcH
Aud<I>~} 11 = 0:1k1<Pc 2H2<PA,+ - k3<PC2H2<PC2H - k4<Pc.H2<PC2H - k5<PC2H<PAr+
Au d<I>~;" 2 = k3<Pc 2H2 <Pc2H - k4 <Pc4H2 <Pc2H
A d<f>c5H2 k ;,;. ;,;. u dz = 4'1!'C4H2'l!'C2H
Au :t~ 2 = 0:2k1 <Pc2H2 <P Ar+ + f31 k5<PC2H<P Ar+ - kg<Pc2H2 <Pc2 Auy. = 2 * 0:3k1<Pc2H2<PAr+ + f32k5<Pc2H<PAr+ - k11<Pc2H2<PcH d<I>z Au~0~0~2~<Pc 2H<PAr+ - k1<Pc2H2<Pc Au dz - kg<Pc2H2 <Pc2 + k11 <Pc2H2 <PcH + k1<Pc2H2 <Pc
6.3 Fitting
To compare the modeling with the measured data, only the set of the 48 A are current will be used. The Measurements for 22 A and 61 A will be shown in appendix E.
The input of the model are the differential equations and the reaction coefficients, together with the initia! conditions: Ar flow (100 sccs), branching ratios (see table 6.1) and the C2H2 flow. The model was then fitted to the data by changing the fitting parameters: area of the beam A, velocity of the beam u and the ionization degree .
First the modeling of the stable species will be discussed. These are the density of C2H2 for plasma on and off conditions and the density of C4H2 as a function of the C2H2 flow. The fitting parameters have a value of: A *u = 9,42 (at was assumed that A = 0,016 m2 thus u = 600 m s-1) and ionization degree =
48

0,033. The model is given as a function of C2H2 flow at a distance of 52 cm from the starting point. Fig. 6.2 shows the results.
12,0 r;::====:;--=--:-:---:--:-::-:-----,,--, • pasma off C2H2 at 48 A
c;)"
E
10,0
iF 6,0
0
~ 6,0
'Vi c: ~ 1:l 4,0 ~ iii ~ 2,0
• pasmaon
p.,· floo = 3,3 sccs /
10 15
C2H2 inflo.v [sccs]
20
1,7
1,5
c;)" ?- 1,3
0 . 1,1
;;:: 0,9
Vi c: ~ 0,7
~ ~ 0,4
~ 02
0,0
N' flON = 3,3 SCCS
/
10 15 20
C2H2 inflON [sccs]
Figure 6.2: Comparison of the model with the measured densities by means of RGA in the background. Left the measured density of C2H2 for plasma on and off conclitions and right the measurecl density of C4H2. Also includecl in the right graph is the clensity of C2H and C5H2 from the model
The model was fitted using the C2H2 density at the plasma off conditions. The profiles from the model then show good resemblance with the measured data, for both C 2H2 and C 4H2. Also shown in in the two graphs is the Ar+ flow. Furthermore in the right graph of Fig. 6.2 the density of C2H and C6H2 as a function of the C2H2 flow is shown. The behavior of C 2H shows a peak around 5 sccs and then reacts away for high C2H2 flows, as was expected (see section 5.2.2.). From the modeling it can be seen that the peak of the C 2H density occurs at "'4,5 sccs C 2H2 flow whereas the Ar+ flow is 3,3 sccs. If C 2H is the main growth precursor, the model shows that the hardest material is not grown at critical loading (3,3 sccs), as was argued by Gielen (GIE-96C) but is shifted to higher C 2 H2 flow. This is because the loss process of C 2H2 by other reaction, besides the ion-induced dissociation, have to be taken into account.
At low C2H2 regions the presence of the dissociation products of C 2H2, was shown. The behavior of these transient species were simulated by the chemistry model. Fig. 6.3 , 6.4 and 6.5 show the results on respectively C, C2 and CH. The model shows good resemblance with the measured data. The chemistry was modeled at a distance of 18 cm for the up position and 52 for the down position. Notice the same profile for all the up and all the down positions for the C, C 2 and CH. since the reaction coefficients for the creation and destruction of these radicals are the same, they play a similar role in the model, hence the same profile. By changing the branching rations (3 only the the densities change, not the profile. From the C2 up modeling it can be seen that a shoulder is missing for high C2H2 flow. This can be an indication that C2
is also produced in the primary reaction, i.e. a 1 #- 1. Thus it is not only C2H is made in the dissociative recombination reaction (reaction5.13).
6.4 Absolute densities from the model.
From the model, which was calibrated with the C2H2 density at plasma off conditions, the following densities could be deduced. For C4H2 the highest measured density at 48 A at a C 2H2 flow of 17.8 sccs was estimated at 1,4*1019 m-3 . The modeled density at those conditions was 1,7*1020 m-3 . The difference between the two densities can be due to sticking to the walls and the substrate and to the inaccuracy due to the unknown efficiency of the RGA for C4 H2.
Because the branching ratios (3 1 and (32 have equal value, namely 0,5, the transient species densities, obtained from the model, are the same for both up and down position and are respectively 6,5*1017 m-3
and 1,2*1018 m-3 . The measurements show that the C density is in the order of 4,5*1015 m-3 for the up
49

position and 2,6*1015 m-3 for the down position. From (BEN-00} and (ENG-99} the radical density for the C2 and CH at the down position were estimated to be respectively rvl017 m-3 and rvl016 m-3 . The densities of the model and the measurement do not coincide, also note that from the modeling the density at the up position is lower then the down position, this contrary to the metastable C measurement, where the density was higher for the up position in comparison to the down position.
6.5 Discussion
The results of the CRDS and the RGA shown in chapter 5 shows that for high C2H2 flow the radicals above the substrate have all reacted away and that the consumption and the C4H2 density become constant. This is in agreement with the model, since the modal also predicts the depletion of the radicals at high C2H2. This argues that the loss of C2H2 by the radicals can not be neglected. Also the model suggests that for high C2H2 flow the deposition of C4H2 and C6H2 play an important role.
For the model to be more precise some improvements can be made. The processes involving the metastable Ar can be implemented. Also the branching ratios can be changed to account for the possible creation of C2 in the primary reaction and finally of course the list of chemical reaction can be improved by adding more reactions.
a.o~--------------~
"'i 6,0
0
;: 4,0
~ ái u
~ ~ 2,0
~
Cup, 48A
P.;° ftow = 3,3 sccs ,.,/'
iv-"'· /. ""'"-,,
:'. '
'~ /. '~----.
0.0 L...l.-~-_,_-~--'---~--1~-~-·-~-==L...J 10 15 20
C1H
1 inflow [sccs]
8.0 ~--------------~
'?É. 6,0
0
[, 4,0
~ ái u ~ ~ 2,0
~
Cdown, 48A
Ar° flCIN = 3,3 sccs ~
10 15
C2H
2 inflCIN [sccs]
20
Figure 6.3: Comparison of the metastable C density as was measured by measn of CRDS and the metastable C
density simulated with the maple model for the position up (left) and (down). The fit through the data points is obtained from the model.
50

8,0
7,5 C2
up, 48A C2
down, 48A 7,0
6,0 P·i fto.v = 3,3 sccs 6,0 Pi ftON = 3,3 sccs r- /
,~ / ~ ~ 5,0
i 4,5 t.,..
a. [ 4,0
! ! i 3,0 " 3,0
l 2.0
1,5
1,0
0,0 0,0 0,0 0,0 0,0 0,0 0,0 10 15 20
C2H2 inftcw [sccs] C2H1 inftON [sccs]
Figure 6.4: Comparison of the C2 absorption as was measured by means of CRDS and the metastable C2 density simulated with the maple model for the position up (left) and (down). The fit through the data points is obtained from the model.
6,0 2,0
CH up, 48A CH down, 48A
5,0 Ar' ftcw = 3,3 sccs / 1,5
.~ Ar' ftow = 3,3 sccs 4,0 ~
/ 0 0 L.. L..
L.o [ 1.0
~ ! 6 6 ·~ 2,0 ~
~ ~ 0,5
1,0
0,0 0,0 10 15 20 10 15 20
C,H, inftON [sccs] C2H1 inftcm [sccs)
Figure 6.5: Comparison of the ground stateCH absorption as was measured by means of CRDS and the ground state CH density simulated with the maple model for the position up (left) and (down). The fit through the data points
is obtained from the model.
51

Chapter 7
Summary and Conclusions
The goal of this thesis was to gain more insight in the plasma chemistry of an Ar/C2H2 ETP. This was clone by studying the plasma products in the Ar/C2H2 ETP and their role in the plasma chemistry, by means of CRDS and RGA. The role of the transient and stable species in the plasma chemistry and whether or not they can be responsible for the growth of a:C-H layers was determined. Finally using the information from the measurements a model of the plasma chemistry occurring in the ETP is developed, and is compared with the measured data. Another main issue was the Broadband Absorption (BBA). What exactly is causing this BBA, was studied by analysis of both RGA and CRDS results.
The two complementary diagnostic tools, RGA and CRDS were used to monitor species present in the plasma. CRDS was used to monitor the transient species, C, C2 and CH and RGA was used to monitor the stable species: C2H2, C4H2, C5H2 and C5H5.
The plasma chemistry is indeed dominated by Ar+ induced dissociation of C2H2. It was shown that the
plasma composition depends on the ~c 2112 ratio. In the case ':_c 2112 is in the order of 1, the C2H radical Ar+ '±'Ar+
is dominant in the plasma and is the main growth precursor for these conditions. If ~c 2112 < 1 the C2H Ac+
radical is dissociated into C, C2 and CH in secondary reactions with Ar+, as was shown with the CRDS measurements. The growth for these conditions is thus dominated by the radicals C, C2 and CH. Finally if i 2112 > 1, even though there is still some C, C2 and CH created in the plasma, as was shown with the
Ac+
CRDS measurements at the up position, by the time the radicals reach the substrate they will all have reacted away with C2H2. It is not known at this time what the reaction products are. The dominant species in the plasma in these regions are the stable molecules C4H2, C6 H2 and C6 H6 as was shown with the RGA measurements. Furthermore it was shown that C4H2 and C6H2 can stick to the surface. It is thus suggested that for the conditions where ~' 2112 > 1 the deposition is governed by the stable molecules C4H2 and C5H2.
'±'Ar+
Also it was shown that the consumption of C2H2 becomes constant when ~; 2112 >> 1, suggesting that no '±"Ar+
further polymerization takes place in the plasma When comparing the behavior of the BBA as a function of the C2H2 flow, for different wavelengths, it can
be concluded that the BBA can not be caused by just 1 species. At this time it is suggested that the BBA is not caused by specific 1 species, hut by 1 chromophoric group, namely the internally excited -G=C-H. This groups is present as a radical, hut also as a group in the molecules C4H2 and C6H2. The assumption that the -G=C-H is internally excited is important, since no correlation is found between the C2H2 and the BBA.
Finally when comparing the model with the measured data, a good resemblance can be seen, confirming the picture of the plasma chemistry. The model can still be improved by adding reactions involving metastable Ar, using the reported values for the reaction coefficients and completing the chemical reaction list.
• The plasma chemistry can be explained on the basis of Ar+ induced dissociation of the C2H2 molecule.
• C4H2 and C5H2 can stick to the surface.
• For low C2H2 flow (i 2112 < 1) the plasma is dominated by C, C2 and CH radicals. Ac+
• Around critical loading (~c 2112 ~ 1) the plasma is dominated by the C2H radical. Ac+
52

• At high C2H 2 flow (~c 2 H 2 > 1) the plasma is dominated by the C4H2 molecule. Ac+
• We suggest as a candidate for the BBA: the internally excited -C=C-H group.
• The model shows good resemblance, hut to further improve the model the inclusion of metastable Ar and additional chemical reactions will be necessary.
53

Chapter 8
References
(Abbreviationj: publication
[AIS-71] S. Aisenberg, R.Chabot, J. Appl. Phys. 42 (1971) 2953.
[ALD-??] : E. Aldea, simulation program. internal report
[ASS-02]: F.J.R. Assche, graduation thesis, april 2002, ETP 02-06, Technica! University Eindhoven.
[ATK-98]: P.W. Atkins, Physical Chemistry, Oxford University Press, 5th edition, 1998.
[BEN-02]: J.Benedikt, K.G.Y. Letourneur, M. Wisse, D.C. Schram, M.C.M. van de Sanden, Diamond and Related Materials 11 (2002) 989-993.
[BEN-02A]: J.Benedikt et. al. to be published.
[BOY-61] G.D. Boyd, J.P. Gorden, Bell. Syst. Techn. J. 40, 489 (1961)
[BUC-95]: C. Buchta, A D'Alessio, A D'Anna, G. Gambi, P. Minutolo, R. Russo, Planet. Space Sci. Vol. 43. NOS 10/11, pp. 1227-1232, 1995
[BUS-99]: Busch Busch editors, Cavity Ringdown Spectroscopy, an Ultra Trace Absorption Measurement Technique, 1999, APS Pub.
[CAT-91] Y. Catherine, in R.E. Clausing (ed.), Diamond and Diamond-like Carbon Plenum, New York, 1991, .193.
[CRA-OO]D. Chastaign, P.L. James, I.R. Sims, I.W.M. Smith, Phys. CRem. Chem. Phys. 1 (1999) 2247
[ENG-99][10] R. Engeln, K.G.Y. Letourneur, M.G.R. Boogaarts, M.C.M. van de Sanden, D.C. Schram, Chem. Phys. Lett. 310 (1999) 405-410.
[GIE-97]: J.W.AM. Gielen, W.M.M. Kessels, M.C.M. van de Sanden, D.C. Schram, J. Appl. Phys. 82 (1997) 2643.
[GIE-96A]: J.W.AM. Gielen, P.R.M.Kleuskens, M.C.M. van de Sanden, L.J. van IJzendoorn, D.C. Schram, J. Appl. Phys. 80 (1996) 5986.
[GIE-96B]: J.W.AM. Gielen, M.C.M. van de Sanden, P.R.M.Kleuskens, D.C. Schram, Plasma Sources Sci. Technol. 5 (1996) 492.
[GRA-99]: Ade Graaf, M.F.AM.van Rest, M.C.M. van de Sanden, K.G.Y. Letourneur, D.C. Schram, Appl. Phys Lett. 74 (1999) 2927.
[GRA-99A]: A de Graaf, M.F.AM.van Rest, M.C.M. van de Sanden, K.G.Y. Letourneur, D.C. Schram, 1999, Proc. 14th Symp. Plasma Chemistry (ISPC-14) Vol. 1, p 1755.
54

[GRA-00]: Ade Graaf, promotion thesis, ISBN 90-386-1539-6.
[GRU-94]: D.NM. Gruen, S.Liu, AR. Krauss, J. Luo, X. Pan, Appl. Phys. Lett. 64 (1994) 1502
[GUA-98]: R. Guadagnini, G.C. Schats, S.P. Walch, J. Phys. Chem. A 102 (1998) 5857.
[HES-02]: M.F.A.M. van Rest, promotion thesis, Technica! University, Applied Physics, 2002.
[JAC-98] W.Jacobs, Thin Solid films 326 (1998) 1-42.
[KEE-88]: AO' Keeffe,D.AGDeacon,Rev.Sci.Intrum.59,2544(1988)
[KOI-89] P.Koidl, C.Wild, B. Dischler, J.Wagner, M. Ramsteiner, Mat Sci. Forum 52/53 (1989) 41.
[KR0-90]: G.M.W.Kroesen, D.C. Schram, M.J.F. van de Sande, Pl. Chem. and Pl. Proc. Vol. 10, No. 1, 1990.
[KR0-88]: Kroesen, promotion Thesis, Technica! university, Applied Physics, 1988.
[KR0-88A]: G.M.W. Kroesen, C.J. Timmermans, D.C. Schram, Pure and Apll. Chem. 60, 795, (1988).
[KUR-96]: Kurt J. Lesker Co., Operating :VIanual and Programming Reference, 1996.
[LIG-91]: P.D. Lightfoot, Chem. Phys. Lett. 180 (1991).
[L00-95]: H. vavn Look J. Peeters, .J. Phys. Chem 99 (1995) 16284.
[LUQ-99]: .J. Luque, D.R. Crosley, LIFBASE: Databasae and Spectra! Simulation Progra, (Version 1.5), SRI International Report MP 99-009, 1999
[MAC-??] P. Macko, D. Romanini, N. Sadeghi, Saturation phenomena in cw Cavity Ringdown Spectroscopy, total density depletion by collision transfers.
[MAI-90]: W.B, Maier, J. Chem. Phys. 42 (1965) 1790.
[MUL-80]: P.M. Mul, J.W. McGowan, Astr. Phys. J. 237 (1980) 749.
[NIS]: Nist Chemistry Webbook, http://webbook.nist.gov/chemistry
[NIS-A]: http//physics.nistgov /PhysRefData/ionization/EII _ table.html
[NIS-B]: http://physics.nist.gov/ cgi-bin/ AtData/levels _form ?XXP-15XXEllqCqIXXS
[REl-80]: H. Reisler, M.S. Mangir, C. Wittig, J. Chem. Phys. 73 (1980) 2280.
[ROB-92] J. Robertson, Surf. Coat. Technol. 50 (1992) 185.
[ROB-02] J Robertson, Material Science and Engineering R 37 (2002) 129-281
[ROS-77]: H.M. Rosenstoch, K. Draxl, B.W. Steiner, J.T. Herron, J. Phys. Chem. Ref. Data 6 (1977) 93.
[SAN-93]: M.C.M. van de Sanden, J.M. de Regt D.C. Schram, Phys. Rev. E. vol. 47 ,No. 4, 2792.
[SMR-97] A Smets, Master thesis, december 1997, VDF /NT 98-01.
[TSU-93]: M. Tsuji. H. HKouno, K. Matsumura, T. Funatsu, Y. Nishimura, J. Chem. Phys. 98 (1993) 2011.
[ZAL-95]: P. Zalicki, Y. Ma, R.N. Zare, E.H. Wahl, T.G. Owano, C.N. Kruger, Chem. Phys. Lett. 234 (1995), 269.
55

Chapter 9
Appendix
9.1 A: Lower limit of the electron density
It is assumed that the charge exchange reaction is the mte limiting reaction .. When looking at the two reaction coefficients of reactions 5. 5 and 5. 6, it can be seen that k1 < < k2. This means that if the electron density ne is high enough compared to the C 2H2 density (nc2 H 2 ), the reaction 5.5 is indeed the mte limiting reaction. A lower limit of ne will be calculated
The two reactions that are competing are:
Ar+ + C2H2 ::::;. Ar+ C2Ht·r,v
C2Ht·r,v + e- ::::;. C2H + H
[kce :::::: 10-16 m3 s-1]
[kdr :::::: 3 * 10-13 m3 s- 1]
Remember that n Ar+ = ne-, thus in order for the dissociative recombination reactions to be much Jast er then the charge exchange, the ratio between the electron density , ne-, and the C2 H 2 density, nc2 H 2 , has to be:
ne k 10-16 CT io-3
nc2
H2
> kdr = 3 * 10-13 :::::: (9.1)
For maximum C2H2 ffow (-20 sccs), nc2
H 2 -10 20 m-3 . Thus the lower limit for ne in order to justify the assumption is: 10 17 m-3 .
56

9.2 B: Electron impact dissociation cross section estimations
For the density calculations the electron impact dissociation cross-section has to be known. Pram the literature several cross sections could be found, but not all. To calculate the densities an estimate for the unknown cross sections have to be known. This was done by using the known cross sections of other hydrocadbons (see table).
Table 9 l· .. Specie Mass Cross section [A<=) CH4 16 3.524
C2H2 26 4.374 C2H4 28 5.115 C2H6 30 6.422 C3Hs 44 8.619
C 6 H 6 (benzene) 78 12.685
By using the linear .fit through the known cross sections other can be estimated. The cross sections for C 4 H 2 and C 6 H 2 had to be estimated. From the linear .fit it was estimated that the electron impact cross section at 50 (C4H2) is 8.8 A2 and at 74 (C6H2) is 12.4 A2 .
12
10
~ § 8
i "' ~ 6 ü
4 CH2
y=0.1517x+1.1786
"" : C6H2= 72 Amu
C3H3 •
C2H6 •
• C H 2 •
• C2H
2
' '
' ' CH=50Amu• 4 2 '
2~~~~~~~-'--'---'-~~~~~~~~~
0 10 20 30 40 50 60 70 80 90 100
Amu
Figure 9.1:
57

9.3 C: C2H2 configurations
The RGA measurement showed the existence of C6H6 in the plasma. It is not clear how this specie is created. One of the reasons is because the numerous configurations of C6H6. A number of the most common figurations is shown here, there are however even more exotic isomers possible. The stars indicate that the cracking pattern is available for these isomers [NIS-A]. From comparison of the cracking patterns for the different isomers with the measured mass spectrum, the isomer 1,5-Hexadiyne could be excluded.
* *
Benzene 2,4-Hexadiyne 1,5-Hexadiyne
*
1,3-Hexadiyne 1,4-Hexadiyne 1,3-Hexadien-5-yne
* ,.---;;;;;;;;;;-'
l ,5-Hexadien-3-yne cyclopropane, tris(methylene)
3,4-dimethylenecyclobut-1-ene
=C~
Fulvene Hexa-l ,2-diene-5-yne 1,2,4,5-Hexatetraene
58

To identify the stable species the measured spectrum was compared to spectrum found in the literature ({NIS} and RGA software). The results are shown in Fig. 9.2. The the literature values for C 2H2 and C 4H2 show good resemblance with the measured spectra. For the measurements the highest peak of each of the different species was followed. No cracking pattern for C6 H2 could be found, hut it is highly unlike that the C5H2 will have contributions to the signals of C2H2 and C4H2. The C5H5 molecule has numerous isomers (see appendix E), each of which have a different cracking patterns. None of the cracking patterns fitted the measured spectrum. lt is thus not sure which isomer for C6H6 is present in the plasma, it can also be that a combination of isomers is present in the plasma. Since the cracking pattern C6H6 is not known, it is not known whether or not this molecule also contributes to the signals of C 2H2, C 4H2 and C6H2. The signal of C5H5 is however the lowest of all signals and contribution can be neglected.
table 9 2· .. Species C2H2
C4H2
C4H2
C5H5
used peak contribution by other species 26 no 50 no 74 to C 2H 2 and C 4H2 signals, hut not likely. 78 possible to C2H2, C4H2, and C5H2, hut due to low signa! will be neglected
0,5 ,-------------------,
- Measured spectrum of C1H
1
o.4 - Cracking pattern for C1H1
~ .2 0,3
~ ~ ~ 02 ~· 'iii c "' 0
0,1
0,0 21
3,5
3,0
~~2.5
~ 2,0
ë ~ 1,5
"' " .2 1,0
" "' " 0 0,5
0,0 70
22 23 24 25 26 27 amu
- Measured spectrum of C,H,
71 72 73 74 amu
N,
28 29 30
75 76
12,0 r.==========------, -- Measured spectrum of C, H
10,0 - cracking pattem of C,H,
C)
~ 6,0 c
"' 1:: "' " 0 4,0
ü "' ii 0 2,0
0,0
6,0
5,0
~ :'2~4.0
C)
::;3,0 c "' 1:: "' ~2,0 ü "' " 01,0
0,0
46 48 50 amu
-- Measured spectrum of c,H,
75 76 77 78 amu
noise
/
52 54
79 BO
Figure 9.2: The measured spectrum of C2H2, C4H2, C5H2 and C5H5 by means of RGA. Also shown are the spectrum for the literature. For C5H5 no literature spectrum is shown, because the C5H5 has many conficurations, each with
a different cracking pattern.
59

9.5 E: Fitting for 22 A and 61 A
The same argumentation as was made for the fitting for the 48 A in chapter 6 is valid for 22 A and 61 A. The graphs are shown in the same order; first the stable species, followed by the radicals, C, C2 and CH.
9.5.1 22 A
0,6
0,3 ~ C2H2, 22A :i si ~ 0,5
/ ;- 0,3
" "' ~ /
~ 0,2 [., 0,4
.9 p" ~
" .~
~/ .9 0,3
'" 0,2 "' ë ~ ~
/
/~ ë 0,2
0,1 ë i3 "' b t: / ~ i3 0,1 ü
0,1 /v " b ~ ~"> ü
"' 0,0
,.,~!"·ÇJ y ;!l 0,0
10 15 20 10 15 20
C1H, 1nflow [sccs] C1H1 inflow [sccs]
Figure 9.3: Comparison of the model with the measured densities by means of RGA in the background. Left the
measured density of C2H2 for plasma on and off conditions and right the measured density of C4H2. Also included in the right graph is the density of C2H and C5H2 from the model
2,5 2,5
Cup, 22A Cdown, 22A
"- 2,0 f.i flON = 1 SCCS "'2.o f.i flON = 1 SCCS ..---- .s .s - /
~
f\ 0 1,5 [1·5 . z. z. ·v; c:: 111 rl \ ~.o ~ 1,0
! \ . ~ ~ ij! :J
~----"' ~ 0.5 ~.5
0,0 0,0
10 15 20 10 15 20
C2H2 inflON [sccs] C2H2 inflON [sccs]
Figure 9.4: Comparison of the metastable C density as was measured by measn of CRDS and the metastable C density simulated with the maple model for the position up (left) and (down). The fit through the data points is obtained from the model.
60

1,6
C1down, 22A
1,4
~- 1,2
~ 1,0 t_,
"' [ 0,8
i;; ~ 0,6 0
'ê-1il 0,4
;';! ·,
' 0,2
"'~----0,0
10 15 20
C2H
2 inflow [sa::s]
Figure 9.5: Comparison of the C2 absorption as was measured by means of CRDS and the metastable C2 density simulated with the maple model for the down position.
2,0
w
0 1,6
[. • "' "' ~ 1,2
i;; 1 0.
~ O,B ' •I b
1 "' .c 1 "' "' 0,4 1
~ 1 1
0,0
CHup, Z2A
/>/' flo.v = 1 sccs
•
10 15 20
C2H
2 inflCMI (sccs)
1,6 ,---------------------,
- 1,2 ".'
0
CH do.vn, 22 A
/>/' flON = 1 SCCS
/
0,0 c.....;_~,.--::=;:=::a::=~=======::::a:=.-....J 10 15 20
C1H
1 inflON [sccs]
Figure 9.6: Comparison of the CH absorption as was measured by means of CRDS and the metastable CH density simulated with the maple model for the up (left) and down (right) position.
61

9.5.2 61 A
"'----0,6
0 . ~ .90,4
" .:? Ol ~ ë " ~0.2 " b à! ~
0,0 20
61 A
Ar' flON = 4,5 sccs ,,---
•
t"- - -·
10
C2H1 inflo.v [sccs]
15 20
Figure 9.7: Comparison of the model with the measured densities by means of RGA in the background. Left the
measured density of C2H2 for plasma on and off conditions and right the measured density of C4H2. Also included in the right graph is the density of C2H and C6H2 from the model
10,0 10,0
9,0 Cup, 61 A
9,0 Cdown, 61 A
8,0 f>i flo.v = 4,5 sccs 8,0
"'- ...--- ~-P,/ flON = 4 ,5 SCCS .s 7,0 .s 7,0
- 6,0 / 6,0 0 0
c 5,0 [. 50
~ 1' ' 4,0 111
5i 5i 4,0 "O
3.0
~-~ "O
"O "O 3,0 l'! l'! ii! 2,0 ii!
2,0
~ :B 1,0 :::;:
1.0 1
0,0 0,0
10 15 20 10 15 20
C2H1 inflo.v (sccs) C2H2 inflON (sccs)
Figure 9.8: Comparison of the metastable C density as was measured by measn of CRDS and the metastable C
density simulated with the maple model for the position up (left) and (down). The fit through the data points is obtained from the model.
62 . '

C2
down, 61 A
Ar flow= 4,5 sccs
/
10
C2H
2 inflow [sccs]
----.. _._____
15 20
Figure 9.9: Comparison of the C2 absorption as was measured by means of CRDS and the metastable C2 density simulated with the maple model for the down position.
5,0 1.8
4,5 CH up, 61 A
1,6 CH dovvn, 61 A
w~4,0 Ai flo.v = 4,5 sccs 1,4 /
[, 3,5 0 1,2
Al flow= 4,5 sccs
/ IJl 3,0 " "' ';;;' 1,0 Q. "' " 2,5 ~ Q. i!l 0,8 Ei 2,0 Q.
i5. Ei 0,6 ~ 1,5 i 0,4 .0
~ 1,0 :f. "' ~ 0,5 0,2
0,0 0,0 • 10 15 20 10 15 20
C1H
2 inflow [sccs] C
2H
1 inflow [sccsJ
Figure 9.10: Comparison of the CH absorption as was measured by means of CRDS and the metastable CH density simulated with the maple model for the up (left) and down (right) position.
63

9.6 F: Maple simulation
The simulation program for the plasma chemistry. The model also includes an extra parameter that was not used yet for the modeling of the data presented in this report. These is the metastable Ar and the reactions that involve metastable Ar.
> restart: > with(DEtools): > with(PDEtools):
Definition of the reactions and constants: Reactions Involved Rl Arp + C2H2 ( + e- )
R2 Arp + C2H2 + C2H R3 C4H2 + C2H R4 C2H + Ar+ ( + e-)
R5 C + C2H2 R6 C + Arp R7 C2 + C2H2 R8 C2 + Arp R9 CH + C2H2 R9 CH + Arp Rlü C2H2 + Arm
Constant Setting > K[l]:=4.2e-16: > K[3]:=1.3e-16: > K[4]:=0e-16: > K[5]:=K[l]: > K[7]:=3e-16: > K[S]:=Oe-14: > K[9]:=3e-16: > K[lü]:=Oe-14: > K[l1]:=3e-16: > K[12]:=0e-16: > K[l3]:=0e-16:
->al *(C2H + H +Ar) -> a2*(C2 + H +H +Ar) -> a3*(CH + CH +Ar) -> C4H2 + H -> C6H2 + H -> hl *(C2 + H) -> b2*(CH + C) -> ? ->?
->? ->? ->? ->? ->?
> al:=l: a2:=0: a3:=0: # 553, 333, 123 > bl:=0.5: b2:=1-bl: # 553, 503
kl ( +k2)
k3 k4
k5 ( +k6)
k7 k8
k9 klü kll kl2
kl3
> L[vessel]:=0.60: V:=0.168: A:=0.5*0.031415926: # area of the plasma beam (R -7 cm) > sccs:=2.6875el9: # particles/sec > T:=lOOO: k:=l.38e-23:
Initialisation of the parameters: Model Parameters > xdet:= 0.57: > u:=600: > iondegr:= 0.033: > metasdegree:=O: > imax:=34: > jmax:=60:
# CRDS detection height # velocity m.s-1 # ionization degree # metastables # number of C2H2 fluxes # seconds
64

> flowmax:=34; > dowrite:=O; flowmax := 34 dowrite := 0
# highest C2H2 flux (in sccs) # write into the files
Calculation of constants + allocating memory > KK[l]:=K[l]/(u* A): > KK[3]:=K[3]/(u* A): > KK[4]:=K[4]/(u* A): > KK[5]:=K[5]/(u*A): > KK[7]:=K[7]/(u*A): > KK[8]:=K[8]/(u*A): > KK[9]:=K[9]/(u*A): > KK[lO]:=K[lO]/(u* A): > KK[ll]:=K[ll]/(u* A): > KK[12]:=K[l2]/(u* A): > KK[l3]:=K[l3]/(u* A): > flowAr :=lOO*sccs: > flowArp :=flowAr*iondegr: > flowArm :=metasdegree*flowArp: > x_i:=array(O .. imax): Arp_i:=array(O . .imax): Arm_i:=array(O . .imax): > C2H2_i:=array(O . .imax): C2H_i:=array(O . .imax): > C4H2_i:=array(O . .imax): prod_i:=array(O . .imax): > C2_i:=array(O . .imax): CH_i:=array(O . .imax): > C_i:=array(O . .imax): #arrays to put calculated flows in (at xdet) > if dowrite=l then > x_j:=array(O .. jmax,O . .imax): Arp_j:=array(O .. jmax,O . .imax): Arm_j:=array(O .. jmax,O . .imax): > C2H2_j:=array(O .. jmax,O . .imax): C2H_j:=array(O .. jmax,O . .imax): > C4H2_j:=array(O .. jmax,O . .imax): prod_j:=array(O .. jmax,O . .imax): > C2 _j:=array(O .. jmax,O . .imax): CH _j:=array(O .. jmax,O . .imax): > C _j:=array(O .. jmax,O . .imax): # arrays to put calculated flows in >end if: >
System of equations to be solved in FLOW (x = axial position) > sysl := > { > u*diff(Arp(x),x) = -KK[l ]* Arp(x)*C2H2(x) -KK[5]*C2H(x)* Arp(x), > u*diff(Arm(x),x) = -KK[S]*C(x)* Arm(x) -KK[10]*C2(x)* Arm(x) -KK[l2]*CH(x)* Arm(x) > -KK[l3]*C2H2(x)*Arm(x), > u*diff(C2H2(x),x) = -KK[l]* Arp(x)*C2H2(x) -KK[3]*C2H2(x)*C2H(x) -KK[7]*C2H2(x)*C(x) > -KK[9]*C2H2(x)*C2(x) -KK[ll]*C2H2(x)*CH(x) -KK[l3]*C2H2(x)* Arm(x), > u*diff(C2H(x),x) = +al *KK[l]* Arp(x)*C2H2(x) -KK[3]*C2H2(x)*C2H(x) -KK[4]*C4H2(x)*C2H(x) > -KK[5]* Arp(x)*C2H(x), > u*diff(C4H2(x),x) = +KK[3]*C2H2(x)*C2H(x) -KK[4]*C4H2(x)*C2H(x), > u*diff(C6H2(x),x) = +KK[4]*C4H2(x)*C2H(x), > u*diff(C2(x),x) = +a2*KK[l]* Arp(x)*C2H2(x) +hl *KK[5]* Arp(x)*C2H(x) -KK[9]*C2H2(x)*C2(x) > -KK[10]*Arm(x)*C2(x), > u*diff(C(x),x) = +b2*KK[5]* Arp(x)*C2H(x) -KK[7]*C2H2(x)*C(x) -KK[S]* Arm(x)*C(x), > u*diff(CH(x),x) = +2*a3*KK[l]*Arp(x)*C2H2(x) +b2*KK[5]*C2H(x)*Arp(x)-KK[ll]*C2H2(x)*CH(x) > -KK[l2]*Arm(x)*CH(x), > u*diff(prod(x),x) = +KK[ll]*C2H2(x)*CH(x) +KK[9]*C2H2(x)*C2(x) +KK[7]*C2H2(x)*C(x) > }:
65

Solution of the problem .for several C2H2 FLOWS > fp:=fopen("Result57cm00.dat" ,WRITE): > fprintf( fp,'' Model: For Remco3Dfinal.mws, modified 22 .11.2002 \ n" ) : > fprintf( fp,'' Experimental conditions: \n"): > fprintf(fp,''ions metastables veloc xdet al a2 a3 bl b2\n"): > fprintf(fp,''3e 3e 3e 3e 3e 3e 3e 3e 3e\n" ,iondegr, metasdegree, u, xdet, al,a2,a3,bl,b2): > fprintf(fp,''imax jmax FlowMax \n"): > fprintf(fp,''3e 3e \n" ,imax, jmax, flowmax): > fprintf(fp,"kl k3 k4 k5 k7 k8 k9 klO kll kl2 kl3\n"): > fprintf(fp,''3e 3e 3e 3e 3e 3e 3e 3e 3e 3e 3e\n" ,K[l], K[3], K[4], K[5], K[7], K[8], K[9], > K[lO], K[ll], K[l2], K[l3]): > fprintf(fp,''insccs inC2H2 outC2H2 Ar+ Arm C2H C4H2 C6H2 C2 C CH products\n"): >
Solving PDE + saving result > for i from 0 to imax do > flowC2H2:=fiowmax/imax*i*sccs: > x_i[i]:=flowC2H2: Initial conditions: > IC_l := {Arp(O)=fiowArp, Arm(O)=fiowArm, C2H2(0)=fiowC2H2, C2H(0)=0, C4H2(0)=0, C6H2(0)=0,
C2(0)=0, C(O)=O, CH(O)=ü, prod(O)=O}: Solving ptocedure: > f := combine(dsolve (sysl union IC _l, {Arp(x), Arm(x), C2H2(x),C2H(x),C4H2(x),C6H2(x),C2(x),C(x),CH(x), > type=numeric, maxfun=lOOOOOO, output=listprocedure)): Storing resulting densities as function of C2H2 flows: > f_Arp :=subs(f,Arp(x)): Arp_i[i]:=f_Arp(xdet): #storing the results function of C2H2 flow > f_Arm :=subs(f,Arm(x)): Arm_i[i]:=f_Arm(xdet): > f _ C2H2 :=subs(f,C2H2(x)): C2H2_i[i]:=f _ C2H2(xdet): > f_ C2H :=subs(f,C2H(x)): C2H_i[i]:=f_ C2H(xdet): > f_ C4H2 :=subs(f,C4H2(x)): C4H2_i[i]:=f_ C4H2(xdet); > f_ C6H2 :=subs(f,C6H2(x)): C6H2_i[i]:=f_ C6H2(xdet); > f_ C2 :=subs(f,C2(x)): C2_i[i]:=f_ C2(xdet); > f_C :=subs(f,C(x)): C_i[i]:=f_C(xdet); > f_ CH :=subs(f,CH(x)): CH_i[i]:=f_ CH(xdet); > f_prod :=subs(f,prod(x)): prod_i[i]:=f_prod(xdet); > Writing into a file: > > fprintf(fp,''3e 3e 3e 3e 3e 3e 3e 3e 3e 3e 3e 3e\n", i, x_i[i], C2H2_i[i], Arp_i[i], Arm_i[i],
C2H_i[i], C4H2_i[i], C6H2_i[i], C2_i[i], C_i[i], CH_i[i], prod_i[i]): > if dowrite=l then > for j from 0 to jmax do > JJ:=(j/jmax)*60/100: > > Arp_j[j,i]:=f_Arp(JJ): > Arm_j[j,i]:=f_Arm(JJ): > C2H2_j[j,i]:=f_ C2H2(JJ): > C2H_j[j,i]:=f_ C2H(JJ): > C4H2_j[j,i]:=f_ C4H2(JJ); > C6H2_j[j,i]:=f_ C6H2(JJ); > C2_j[j,i]:=f_ C2(JJ); > C_j[j,i]:=f_C(JJ); > CH_j[j,i]:=f_ CH(JJ); > prod_j[j,i]:=f_prod(JJ);
66

> end do: #of loop for different distances > end if: #of writing into files > end do: #of loop for one flow of C2H2 > fclose(fp): > > if dowrite=l then #write into the files > > Arp _ file:=fopen(" Arp.dat" ,WRITE): > for i from 0 to imax do > for j from 0 to jmax do > JJ:=(j/jmax)*60/100: > fprintf( Arp _file," %e ", Arp _j[j ,i]): >end do: > fprintf(Arp _file," \n" ): >end do: > fclose( Arp _file): > > Arm_file:=fopen(" Arm.dat" ,WRITE): > for i from 0 to imax do > for j from 0 to jmax do > JJ:=(j/jmax)*60/100: > fprintf(Arm_file,"%e ", Arm_j[j,i]): >end do: > fprintf(Arm_file,"\n"): >end do: > fclose (Arm_ file): > > C2H2_file:=fopen("C2H2.dat" ,WRITE): > for i from 0 to imax do > for j from 0 to jmax do > JJ:=(j/jmax)*60/100: > fprintf(C2H2_file,"%e '', C2H2_j[j,i]): >end do: > fprintf(C2H2_file,"\n"): >end do: > fclose( C2H2 _file): > > C2H_file:=fopen("C2H.dat" ,WRITE): > for i from 0 to imax do > for j from 0 to jmax do > JJ:=(j/jmax)*60/100: > fprintf(C2H_file,"%e ", C2H_j[j,i]): >end do: > fprintf(C2H_file,"\n"): >end do: > fclose(C2H_file): > > C4H2_file:=fopen("C4H2.dat" ,WRITE): > for i from 0 to imax do > for j from 0 to jmax do > JJ:=(j/jmax)*60/100: > fprintf( C4H2 _file," %e ", C4H2 _j[j ,i]): >end do: > fprintf(C4H2 _file," \n" ):
67

>end do: > fclose( C4H2 _file): > > C6H2_file:=fopen("C6H2.dat" ,WRITE): > for i from 0 to imax do > for j from 0 to jmax do > JJ:=(j/jmax)*60/100: > fprintf(C6H2_file,"3e ", C6H2_j[j,i]): >end do: > fprintf( C6H2 _file," \n"): >end do: > fclose( C6H2 _file): > > C2 _file: =fopen(" C2.dat", WRITE): > for i from 0 to imax do > for j from 0 to jmax do > JJ:=(j/jmax)*60/100: > fprintf(C2_file,"3e ", C2_j[j,i]): >end do: > fprintf(C2_file,"\n"): >end do: > fclose(C2_file): > > CH_file:=fopen("CH.dat" ,WRITE): > for i from 0 to imax do > for j from 0 to jmax do > JJ:=(j/jmax)*60/100: > fprintf(CH_file,"3e ", CH_j[j,i]): >end do: > fprintf(CH_file,"\n"): >end do: > fclose( CH _file): > > C_file:=fopen("C.dat" ,WRITE): > for i from 0 to imax do > for j from 0 to jmax do > JJ:=(j/jmax)*60/100: > fprintf(C _file,"3e ", C _j[j,i]): >end do: > fprintf(C_file,"\n"): >end do: > fclose( C _file): > > prod_file:=fopen("products.dat" ,WRITE): > for i from 0 to imax do > for j from 0 to jmax do > JJ:=(j/jmax)*60/100: > fprintf(prod_file,"3e ", prod_j[j,i]): >end do: > fprintf(prod_ file," \n" ): >end do: > fclose(prod _file): > >end if:
68

Chapter 10
Acknowledgements /Dankwoord
10.1 English
Today it is the 25th of November 2002, one week before the deadline of my report. Although it is sÛll far from being .finished, there is good hope that everything will be ready on time and naw might be a good time to re.f1ect back on the last year. Since at this moment 1 can fully appreciate the effort 1 have put and am putting in my graduation work and thus fully appreciate the people who helped and are helping me.
First of all 1 want to express my gratifode the two people with whom 1 worked with throughout this last year. First my mentor Jan Benedikt, whom helped me a lot with his guidance and support. Your optimism, knowledge and patience have been very important factors for the me successfully .finishing my graduation project. Without you 1 would have had far less of the learning experience 1 have gained naw from this project. Another person who had been very important during the project is Mariadriana Creatore. Your help and support to was indispensable. Thank you bath for a wonderful year and good luck with your projects.
Secondly 1 would like to thank my professor Richard van de Sanden for his help and guidance. Your energy and knowledge have been, are and will be very inspiring. The meetings we had were always very enlightening and always brought new light to the matter. Thank you.
Next 1 would like to thank Ries, Jo, Herman and Bertus for their technica/ support. You all made working a lot easier.
Furthermore there are of course the other people with whom 1 worked in Depo 1, Siebe van Mensfoort, Joris Vorselaars and Keith O'Brian. It was great working with you all and 1 hope that wherever 1 will go, 1 will .find the seem energetic and high spirited people to work with. Of course 1 also must not forget the rest of people in the ETP group, with whom 1 spend the last year: Arno, Bram, Erik, Jan, Igor, Jean-Pierre, Joost, Jungie, Peter 0., Peter V., Rens, Richard, Wiebe and Yolanda. 1 had a great time and you all made the sometimes very long days and weeks seem much shorter. Hope you will all do good with your projects and 1 must also mention Hans van Kuijk and Mark Bax.
Last but not least my family and friends. 1 know that 1 have been neglecting you during this last year, so thank you for your support and most of all your patience, Tzoe Keat, Ivo, Texas, Assuntina, Sean, Shawn, Sergio, Prescilla ,Cindy, Dylan, Kelsey, Ivan, Clayton, Darryl, Tim, Giovanni, Maartje, Germa, Sharyn, my aunts and uncle and cousins and the rest of my very very big family. It is not possible to name you all, but you can be sure that 1 did not f orget you.
A very special thanks to my parents (Armand Woen and Antinie Resodikromo) and my brother (Brian Woen), who have always been by my side and whom 1 know will always stay by my side, thank you, You made me the person 1 am today, 1 love you all. 1 would also like to thank my grand parents (Paimin f!3 Saminten Resodikromo and John f!3 Agnes Woen Tjoen Soen) even though not all of you are here anymore to share in my joy, 1 know that you would be proud of me. It is only through your hard work and effort that 1 gat this chance. 1 will never f orget what you all have done f or me.
69

10.2 Nederlands
Het is vandaag 25 november 2002, een week voordat mijn verslag moet af zijn. Hoewel mijn verslag nog lang niet af is, is er goede hoop dat alles op tijd af zal zijn en lijkt het nu een geschikt moment om terug te kijken op het afgelopen jaar. Immers op dit moment ben ik me terdege van bewust van alle energy die ik steek in mijn afstuderen en is mijn waardering voor de mensen die me helpen en geholpen hebben nu heel aanwezig.
Ten eerste wil ik graag de twee personen bedanken, met wie ik het afgelopen jaar heb gewerkt. Als eerste mijn directe begeleider Jan Benedikt, die me heel erg heeft geholpen met mijn afstuderen. Jouw optimisme, kennis en-g~d~ld zifr/,~~gbelangI'ijk gèweest voor mijn afstuderen. Zonder jou had ik waarschijnlijk veel minder geleerd dan dat ik nu heb. Vervolgens ook Mariadriana Creatore. Jou hulp en steun was ook onmisbaar. Dank jullie beide voor een bijzonder jaar en veel succes met jullie eigen projecten.
Ten tweede wil ik graag mijn dank uitspreken aan IJ,ic~(J,td van de Banden, voor zijn help en begeleiding. Uw energy en kennis waren en zullen altijd een grote inspriatie bron zijn. De vergaderingen die we hadden waren altijd heel inspirerend en brachten altijd nieuwe onderwerpen aan het licht. Dank u wel.
Vervolgens wil ik ook de technici bedanken, Ries, Jo, Herman en Bertus. Bedankt voor jullie hulp in de po 1. Ook wil ik graag de mensen bedanken met wie ik heb samen gewerkt in depo 1, Siebe van M ensfoort, Joris Vorselaars and Keith O'Brian. Het was super om met jullie samen te werken en ik hoop dat, wie mijn toekomstige colelga 's ook mogen worden, ze dezelde energy en opgewektheid hebben als jullie. Natuurlijk mag ik ook de rest van de ETP groep niet vergeten: Arno, Bram, Erik, Jan, Igor, Jean-Pierre, Joost, Jungie, Peter 0., Peter V., Rens, Richard, Wiebe and Yolanda. Jullie maakten de soms wat lange dagen stukken gezelliger en korter. Als laatste van mijn mede studenten wil ik graag ook Hans en Mark, mijn ART buddies noemen.
Graag wil ik natuurlijk ook mijn familie en vrienden bedanken voor hun steun. Ik weet dat ik jullie soms een beetje heb verwaarloosd, dus dank jullie wel voor jullie begrip en geduld: Tzoe Keat, Ivo, Texas, Assuntina, Sean, Shawn, Sergio, Prescilla ,Cindy, Dylan, Kelsey, Ivan, Clayton, Darryl, Tim, Giovanni, Maartje, Germa, mijn oom en tantes en neven en nichten van mijn hele hele grote familie.
Tenslotte wil ik nog speciaal noemen mijn ouders ( Armand Woen and Antinie Resodikromo) en mijn broer {Brian Woen), die er altijd voor me waren en waarvan ik weet dat ze er altijd voor me zullen zijn, ik hou van jullie. Dankzij jullie ben ik de persoon, die ik ben vandaag. Als allerlaatste wil ik ook heel graag bedanken mijn grootouders (Paimin & Saminten Resodikromo and John & Agnes Woen Tjoen Soen). Helaas zijn jullie niet allemaal meer hier om in mijn geluk te delen, maar ik weet zeker dat jullie trots op me zouden zijn. Het is dankzij jullie harde werken dat ik deze kans heb mogen krijgen. Ik zal nooit vergeten wat jullie voor me hebben gedaan.
70