eindhoven university of technology master determining … · of great importance for the successful...
TRANSCRIPT
Eindhoven University of Technology
MASTER
Determining the success factors of Scrum projects
Meurs, T.P.M.
Award date:2015
DisclaimerThis document contains a student thesis (bachelor's or master's), as authored by a student at Eindhoven University of Technology. Studenttheses are made available in the TU/e repository upon obtaining the required degree. The grade received is not published on the documentas presented in the repository. The required complexity or quality of research of student theses may vary by program, and the requiredminimum study period may vary in duration.
General rightsCopyright and moral rights for the publications made accessible in the public portal are retained by the authors and/or other copyright ownersand it is a condition of accessing publications that users recognise and abide by the legal requirements associated with these rights.
• Users may download and print one copy of any publication from the public portal for the purpose of private study or research. • You may not further distribute the material or use it for any profit-making activity or commercial gain
Take down policyIf you believe that this document breaches copyright please contact us providing details, and we will remove access to the work immediatelyand investigate your claim.
Download date: 11. Jul. 2018
Eindhoven, 6th July 2015
by
T.P.M. (Timo) Meurs
BSc Industrial Engineering & Innovation Sciences – TU/e 2012
Student identity number 0679982
In partial fulfillment of the requirements for the degree of
Master of Science
in Innovation Management
Supervisors:
dr. J.M.P. Gevers, TU/e, HPM
dr. P.M. Le Blanc, TU/e, HPM
H. Aerts, TomTom
Determining the
success factors of
Scrum projects
ii
TUE. School of Industrial Engineering
Series Master Theses Innovation Management
Subject headings: Scrum projects, teamwork, success factors
iii
Abstract Nowadays, one of the most popular software development methods in industry is Scrum
methodology. Team are the building blocks of Scrum methodology, so it is obvious that teamwork is
of great importance for the successful completion of Scrum project. However, it is not clear which
specific teamwork factors determine Scrum project success and which do not. Therefore, this study
investigates which teamwork factors determine Scrum project success with the help of a literature
study and a survey study. The main findings are that the teamwork factors communication, team
diversity, backup behavior, mutual trust, and shared leadership are positively related to Scrum
project success, and that team autonomy, shared mental models, and knowledge sharing are
positively related to Scrum project success as well, albeit only in terms of their impact on the team.
Additionally, a negative relationship is found between monitoring behavior and the time and budget
dimension of Scrum project success. Furthermore, this study has also led to recommendations for
organization using Scrum methodology. The most important recommendation is to organize a
discussion session twice a year, in which team leads share their views on why their Scrum teams
score relatively low or high on certain teamwork factors and how this can be related to Scrum
project success, in order to generate new ideas to improve Scrum project success.
iv
Preface This report is the result of the master thesis project I have executed at TomTom in Eindhoven. It
marks not only the end of my master in Innovation Management, but it also represents the end of a
six year study period in Industrial Engineering and Innovation Sciences at the Eindhoven University
of Technology. A period which I have experienced as a very pleasant one. I would like to thank
several people who contributed to this master thesis project.
First, I would like to thank my primary university supervisor dr. Josette Gevers, who provided me
with great feedback during this research project and its preliminary activities. She always supported
me in the right way, even when I switched from research topic several times before the actual start
of the research project. Furthermore, I would also like to thank my second university assessor dr.
Pascale Le Blanc.
Besides that, I would like to thank my company supervisor Hans Aerts, who gave me the opportunity
to execute my master thesis project at TomTom. Not only he, but also all other employees were
extremely helpful and always prepared to make time available for my research project.
Of course, I would also like to thank my parents and sister for their generous and loving support
throughout my studies. They have always encouraged me to make the most out of life.
Last, but definitely not least, I would like to thank my friends, who have always been there for me.
Thanks for all fantastic moments and precious memories we made. You made my time as student
unforgettable!
v
Management summary The introduction of agile methods has been one of the most important innovations in software
development technology of the last decade (Vlaanderen, Jansen, Brinkkemper, & Jaspers, 2011). The
use of agile software development (ASD) methods can lead to significant benefits (Mann & Maurer,
2005). One of the most popular ASD methods in industry at this moment is Scrum methodology
(Dingsøyr, Nerur, Balijepally, & Moe, 2012). Because teams are the building blocks of ASD methods
such as Scrum methodology (Schwaber, 1997), teamwork plays a crucial role in completing a Scrum
project successfully. TomTom in Eindhoven, the software development company at which this
master thesis project was conducted, has already been making use of Scrum methodology for seven
years. Although TomTom in Eindhoven knows that teamwork in general is important for the
successful completion of their Scrum projects, they do not know on which specific teamwork factors
they should focus to improve Scrum project success. The purpose is to help TomTom in Eindhoven
identify the teamwork factors which are positively related to Scrum project success. Therefore, the
research question of this master thesis project is:
“Which teamwork factors determine Scrum project success?”
Method
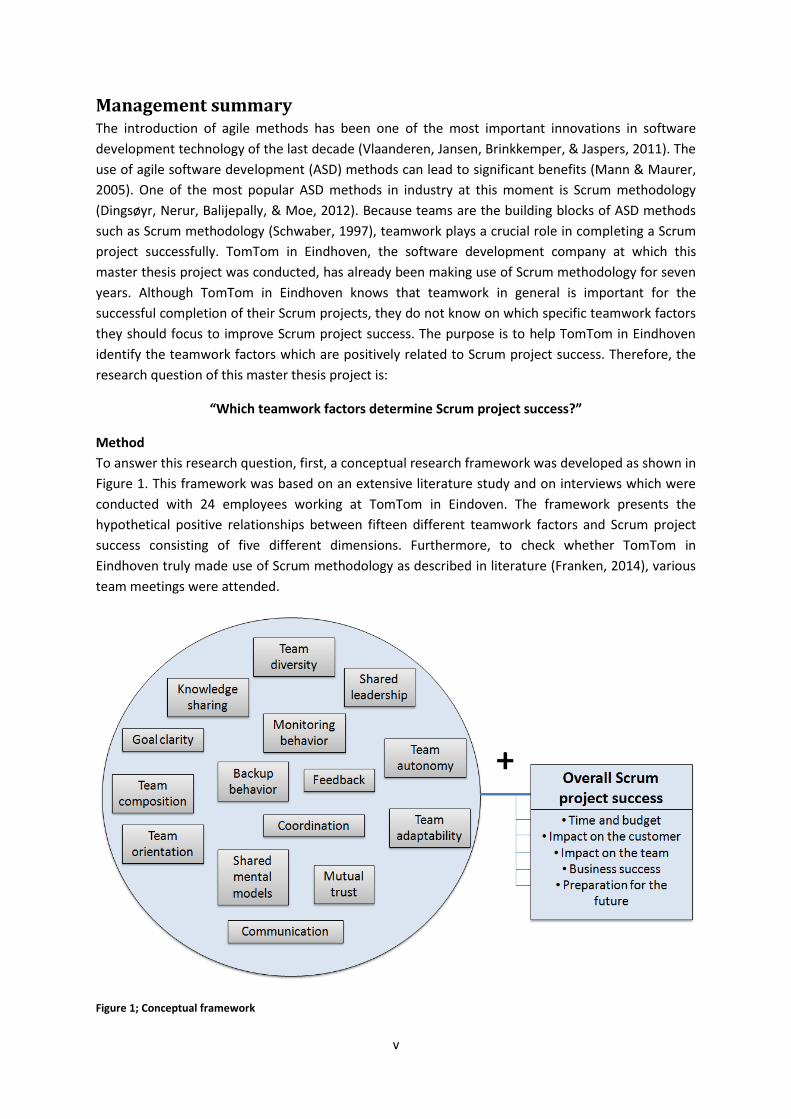
To answer this research question, first, a conceptual research framework was developed as shown in
Figure 1. This framework was based on an extensive literature study and on interviews which were
conducted with 24 employees working at TomTom in Eindoven. The framework presents the
hypothetical positive relationships between fifteen different teamwork factors and Scrum project
success consisting of five different dimensions. Furthermore, to check whether TomTom in
Eindhoven truly made use of Scrum methodology as described in literature (Franken, 2014), various
team meetings were attended.
Figure 1; Conceptual framework
vi
Then, the conceptual framework was tested with the help of a survey mechanism. Based on scales
used in previous literature, two surveys were developed: one for project managers, in which they
were asked to evaluate Scrum project success and its dimensions, and one for team members, in
which they were asked to evaluate the presence of teamwork factors within the Scrum team.
Afterwards, correlation and regression analyses were used to confirm or reject the hypotheses of
the conceptual framework. Apart from that, the results of the survey study were used as input for an
one-hour long discussion session during which ideas on how Scrum project success at TomTom in
Eindhoven could be improved with the help of teamwork factors were discussed. This resulted in
some concrete recommendations for TomTom in Eindhoven.
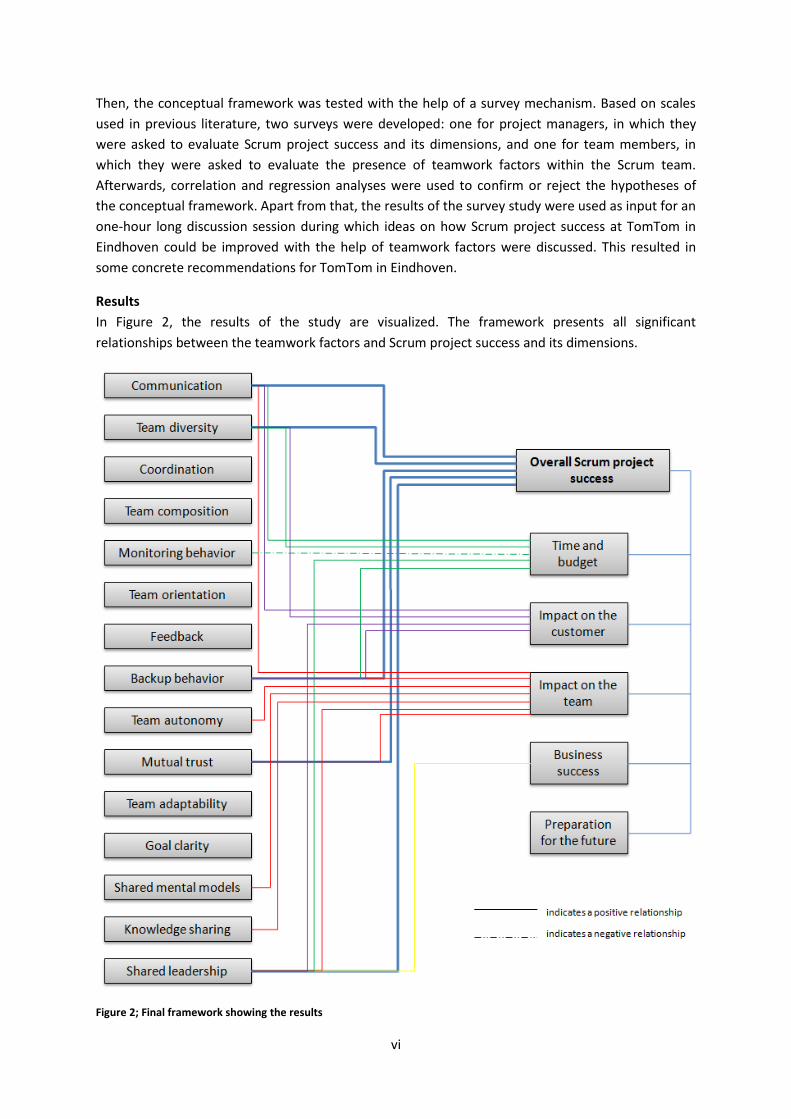
Results
In Figure 2, the results of the study are visualized. The framework presents all significant
relationships between the teamwork factors and Scrum project success and its dimensions.
Figure 2; Final framework showing the results
vii
Conclusions
Different conclusions can be made on basis of the results of this study:
The teamwork factors communication, team diversity, backup behavior, mutual trust, and
shared leadership determine Scrum project success.
The teamwork factors team autonomy, shared mental models, and knowledge sharing
determine team aspects of Scrum project success, such as team satisfaction and motivation.
There is a negative relationship between monitoring behavior and the time and budget
dimension of Scrum project success.
Teamwork factors mainly affect the short-term dimensions of Scrum project success.
Customer satisfaction and trust is strongly related to whether a Scrum project is running on time
and within time. If the project is running on time and within budget, it is very likely that
customer satisfaction and trust will be high.
It should be noted that the causal relationships mentioned in some of the conclusions have been
based on the theoretical background of this study, since the survey study could not provide any hard
evidence for the causality of relationships.
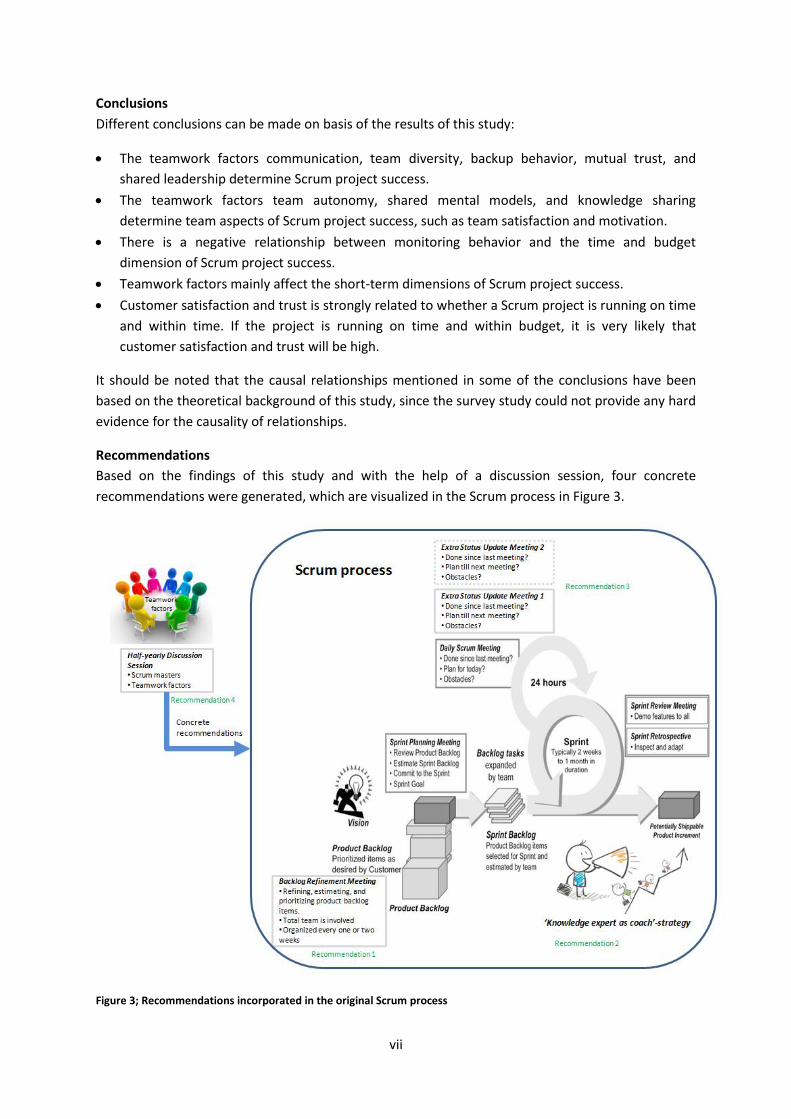
Recommendations
Based on the findings of this study and with the help of a discussion session, four concrete
recommendations were generated, which are visualized in the Scrum process in Figure 3.
Figure 3; Recommendations incorporated in the original Scrum process
viii
Table of contents
Abstract .................................................................................................................................................. iii
Preface ................................................................................................................................................... iv
Management summary ........................................................................................................................... v
1. Introduction ........................................................................................................................................ 1
1.1 Research background .................................................................................................................... 1
1.2 Company background ................................................................................................................... 2
1.3 Relevance of research ................................................................................................................... 3
1.4 Structure ....................................................................................................................................... 3
2. Theoretical development .................................................................................................................... 4
2.1 Scrum methodology ...................................................................................................................... 4
2.2 Scrum project success ................................................................................................................... 6
2.2.1 The ‘iron triangle’ success criteria ......................................................................................... 6
2.2.2 Additional success criteria ..................................................................................................... 6
2.2.3 Multidimensional project success framework ....................................................................... 7
2.2.4 Overall Scrum project success ............................................................................................... 8
2.3 Teamwork factors ......................................................................................................................... 8
2.3.1 Teamwork factors as Scrum project success factors ............................................................. 8
2.3.2 Selection of teamwork factors ............................................................................................... 9
2.4 Conceptual framework ............................................................................................................... 15
3. Research methodology ..................................................................................................................... 17
3.1 Interviews and observations ....................................................................................................... 17
3.2 Paper-based survey instrument .................................................................................................. 17
3.2.1 Procedure ............................................................................................................................. 17
3.2.2 Participants .......................................................................................................................... 18
3.2.3 Measures .............................................................................................................................. 19
3.2.3 Data aggregation .................................................................................................................. 22
3.2.4 Data analyses ....................................................................................................................... 23
4. Results ............................................................................................................................................... 25
4.1 Descriptive statistics ................................................................................................................... 25
4.2 Correlations ................................................................................................................................. 26
4.3 Hierarchical regression analysis .................................................................................................. 29
4.4 Testing of hypotheses ................................................................................................................. 30
4.5 Summary of results ..................................................................................................................... 32
ix
5. Conclusion and discussion ................................................................................................................ 33
5.1 Conclusion ................................................................................................................................... 33
5.2 Discussion .................................................................................................................................... 33
5.3 Limitations and future research .................................................................................................. 36
6. Recommendations ............................................................................................................................ 38
6.1 Organizing Backlog Refinement meetings .................................................................................. 38
6.2 Introducing a ‘knowledge expert as coach’-strategy .................................................................. 38
6.3 Increasing the frequency of short status update meetings ........................................................ 39
6.4 Organizing half-yearly discussion session .................................................................................. 39
6.5 Overview of recommendations .................................................................................................. 40
7. References ........................................................................................................................................ 41
Appendix I: Outline semi-structured interview .................................................................................... 49
Appendix II: Survey for project managers ............................................................................................ 50
Appendix III: Survey for team members ............................................................................................... 54
Appendix IV: Overview of average team scores as input for discussion meeting ................................ 62
Appendix V: Results of paired-samples t-test with all Scrum project success dimensions .................. 63
Appendix VI: Results of hierarchical regression with significantly correlating teamwork factors as
independent variables .......................................................................................................................... 64
Appendix VII: Collinearity statistics ....................................................................................................... 65
1
1. Introduction This master thesis project is about teamwork factors determining Scrum project success. This
chapter describes the motivation for this research topic and shows the problem statement and
research question. Furthermore, the company at which the master thesis project has been
performed will be introduced. Then, the relevance of the project will be discussed, followed by an
outline of the rest of this report.
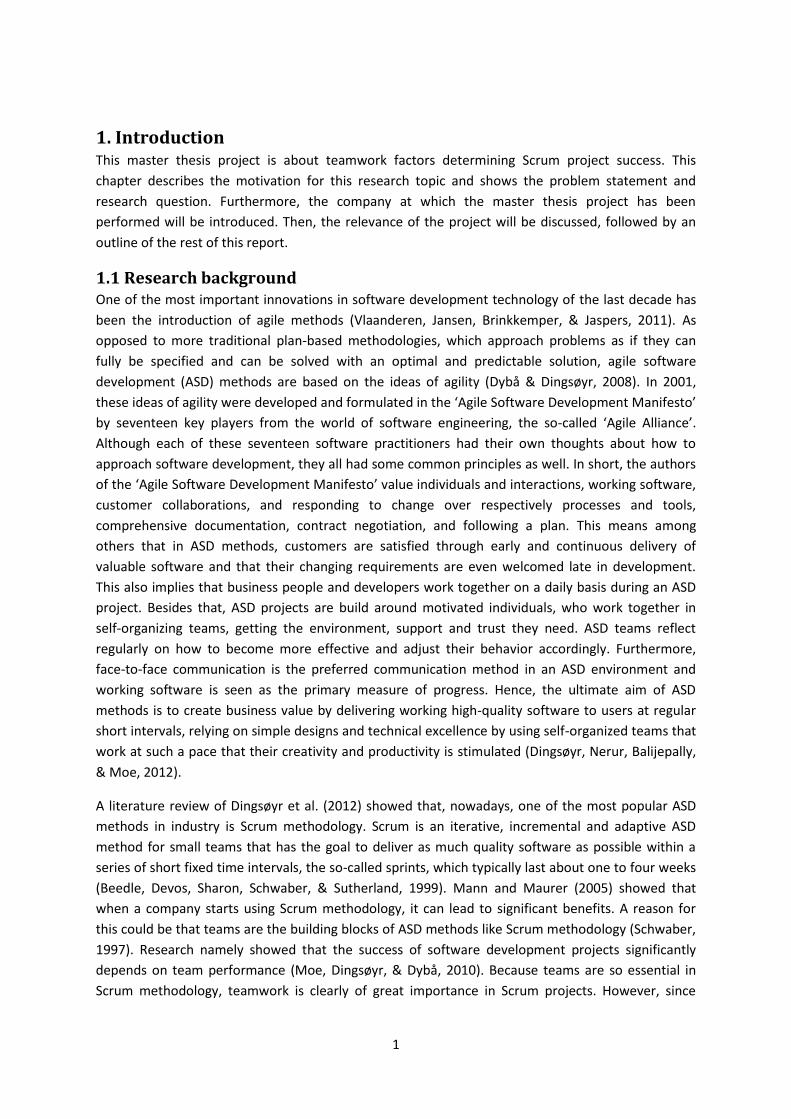
1.1 Research background One of the most important innovations in software development technology of the last decade has
been the introduction of agile methods (Vlaanderen, Jansen, Brinkkemper, & Jaspers, 2011). As
opposed to more traditional plan-based methodologies, which approach problems as if they can
fully be specified and can be solved with an optimal and predictable solution, agile software
development (ASD) methods are based on the ideas of agility (Dybå & Dingsøyr, 2008). In 2001,
these ideas of agility were developed and formulated in the ‘Agile Software Development Manifesto’
by seventeen key players from the world of software engineering, the so-called ‘Agile Alliance’.
Although each of these seventeen software practitioners had their own thoughts about how to
approach software development, they all had some common principles as well. In short, the authors
of the ‘Agile Software Development Manifesto’ value individuals and interactions, working software,
customer collaborations, and responding to change over respectively processes and tools,
comprehensive documentation, contract negotiation, and following a plan. This means among
others that in ASD methods, customers are satisfied through early and continuous delivery of
valuable software and that their changing requirements are even welcomed late in development.
This also implies that business people and developers work together on a daily basis during an ASD
project. Besides that, ASD projects are build around motivated individuals, who work together in
self-organizing teams, getting the environment, support and trust they need. ASD teams reflect
regularly on how to become more effective and adjust their behavior accordingly. Furthermore,
face-to-face communication is the preferred communication method in an ASD environment and
working software is seen as the primary measure of progress. Hence, the ultimate aim of ASD
methods is to create business value by delivering working high-quality software to users at regular
short intervals, relying on simple designs and technical excellence by using self-organized teams that
work at such a pace that their creativity and productivity is stimulated (Dingsøyr, Nerur, Balijepally,
& Moe, 2012).
A literature review of Dingsøyr et al. (2012) showed that, nowadays, one of the most popular ASD
methods in industry is Scrum methodology. Scrum is an iterative, incremental and adaptive ASD
method for small teams that has the goal to deliver as much quality software as possible within a
series of short fixed time intervals, the so-called sprints, which typically last about one to four weeks
(Beedle, Devos, Sharon, Schwaber, & Sutherland, 1999). Mann and Maurer (2005) showed that
when a company starts using Scrum methodology, it can lead to significant benefits. A reason for
this could be that teams are the building blocks of ASD methods like Scrum methodology (Schwaber,
1997). Research namely showed that the success of software development projects significantly
depends on team performance (Moe, Dingsøyr, & Dybå, 2010). Because teams are so essential in
Scrum methodology, teamwork is clearly of great importance in Scrum projects. However, since
2
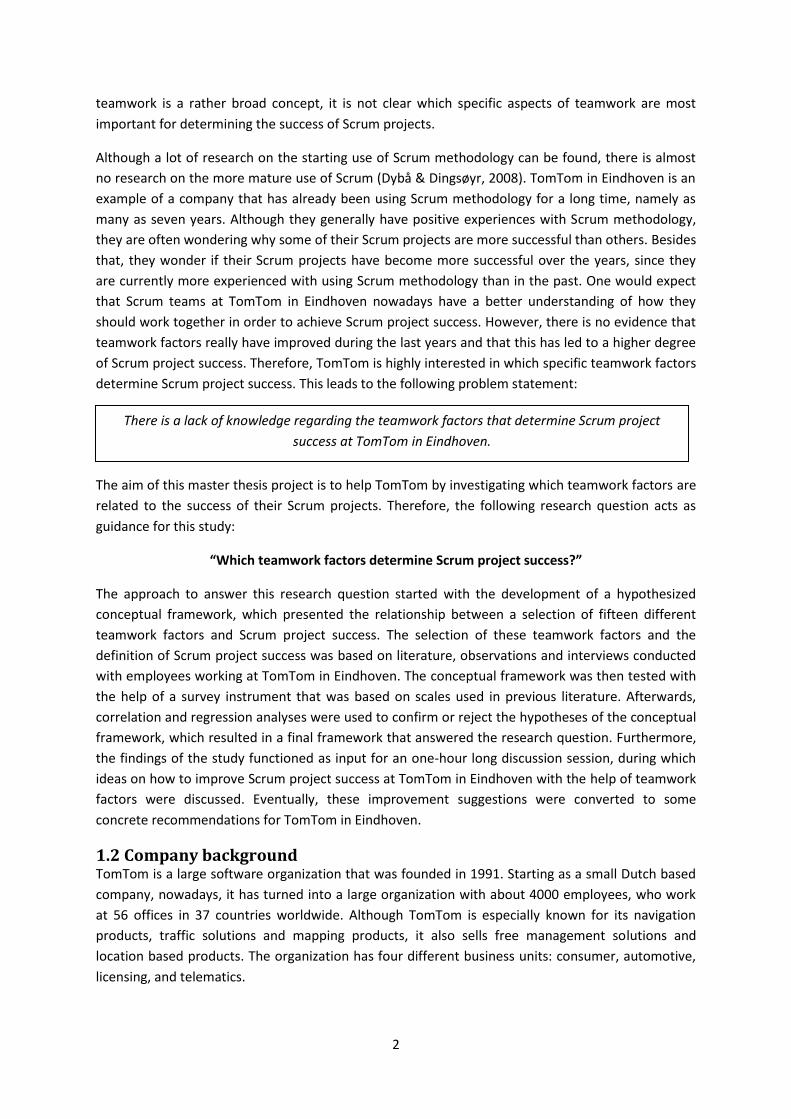
teamwork is a rather broad concept, it is not clear which specific aspects of teamwork are most
important for determining the success of Scrum projects.
Although a lot of research on the starting use of Scrum methodology can be found, there is almost
no research on the more mature use of Scrum (Dybå & Dingsøyr, 2008). TomTom in Eindhoven is an
example of a company that has already been using Scrum methodology for a long time, namely as
many as seven years. Although they generally have positive experiences with Scrum methodology,
they are often wondering why some of their Scrum projects are more successful than others. Besides
that, they wonder if their Scrum projects have become more successful over the years, since they
are currently more experienced with using Scrum methodology than in the past. One would expect
that Scrum teams at TomTom in Eindhoven nowadays have a better understanding of how they
should work together in order to achieve Scrum project success. However, there is no evidence that
teamwork factors really have improved during the last years and that this has led to a higher degree
of Scrum project success. Therefore, TomTom is highly interested in which specific teamwork factors
determine Scrum project success. This leads to the following problem statement:
The aim of this master thesis project is to help TomTom by investigating which teamwork factors are
related to the success of their Scrum projects. Therefore, the following research question acts as
guidance for this study:
“Which teamwork factors determine Scrum project success?”
The approach to answer this research question started with the development of a hypothesized
conceptual framework, which presented the relationship between a selection of fifteen different
teamwork factors and Scrum project success. The selection of these teamwork factors and the
definition of Scrum project success was based on literature, observations and interviews conducted
with employees working at TomTom in Eindhoven. The conceptual framework was then tested with
the help of a survey instrument that was based on scales used in previous literature. Afterwards,
correlation and regression analyses were used to confirm or reject the hypotheses of the conceptual
framework, which resulted in a final framework that answered the research question. Furthermore,
the findings of the study functioned as input for an one-hour long discussion session, during which
ideas on how to improve Scrum project success at TomTom in Eindhoven with the help of teamwork
factors were discussed. Eventually, these improvement suggestions were converted to some
concrete recommendations for TomTom in Eindhoven.
1.2 Company background TomTom is a large software organization that was founded in 1991. Starting as a small Dutch based
company, nowadays, it has turned into a large organization with about 4000 employees, who work
at 56 offices in 37 countries worldwide. Although TomTom is especially known for its navigation
products, traffic solutions and mapping products, it also sells free management solutions and
location based products. The organization has four different business units: consumer, automotive,
licensing, and telematics.
There is a lack of knowledge regarding the teamwork factors that determine Scrum project
success at TomTom in Eindhoven.
3
The TomTom office where this master thesis project was performed is located in Eindhoven. At this
office the Custom Systems (CS) department, part of the automotive business unit, is located. It
provides software and connected services solutions to numerous original equipment manufacturers
(OEMs) and Tier one companies (Tier1s). Where OEMs are companies that make the final product
for the consumer place (i.e. car manufacturers), Tier1s are the companies that are direct suppliers to
OEMs. At TomTom CS various project are running. Each project has a core team, consisting of a
program manager and a project manager and sometimes a product manager and product architect.
Dependent on the size of the project, one or more engineering teams are involved in the project.
These engineering teams are so-called Scrum teams. The Scrum teams usually consist of a Scrum
master, which can usually be seen as the team lead, a product owner, which may be the same
person as the Scrum master, and a group of software engineers.
1.3 Relevance of research The relevance of this research is apparent from the two main contributions to scientific knowledge.
Most prominently, there is a lack of research on the success factors of ASD projects. Of course, many
researchers have already tried to identify which factors determine project success. Where some
studies paid attention to project success factors in general (Pinto & Slevin, 1987), others focused on
potential success factors of specific projects. However, because projects using ASD methods are
relatively new, there are only a few studies that tried to identify the success factors of ASD projects
(Misra, Kumar, & Kumar, 2009; Chow and Cao, 2007). Besides that, it can be concluded that
teamwork factors are not often explicitly mentioned as project success factors in previous research.
Only communication and monitoring behavior and feedback are sometimes mentioned as project
success factors (Pinto & Slevin, 1987). Nevertheless, there are many indications that also other
teamwork factors can be considered as project success factors. By investigating the relationship
between a more elaborate set of teamwork factors and Scrum project success, this research tries to
find out which important teamwork factors can indeed be regarded as project success factors.
Furthermore, although project success is a topic which has frequently been discussed in literature,
there is still no unambiguous definition of the concept (Liu & Walker, 1998). It can have a total
different meaning for different people because of varying perceptions. This research tries to define
Scrum project success in such a way that it is applicable to all Scrum projects. Finally, it has already
been mentioned that there is a lack of research on the more mature use of Scrum methodology
(Dybå & Dingsøyr, 2008). This research is performed at a company that has already been using
Scrum methodology for a long time.
1.4 Structure The remainder of the thesis is structured as follows. In section 2, we will provide the theoretical
background that, combined with knowledge obtained by observations and interviews with
TomTom’s employees, has led to the development of a hypothetical framework. Then, section 3 will
describe the research method for testing the hypothetical framework. In section 4, the results of the
study will be presented. These results will be discussed in section 5, together with the limitations of
the study and ideas for future research. Finally, in section 6, recommendations for TomTom in
Eindhoven will be formulated.
4
2. Theoretical development In this section, the theoretical background of this research will be presented. First, the ASD method
Scrum methodology will be discussed, since this study has its focus on projects in which this ASD
method is used. After that, it will be defined what is meant by Scrum project success by identifying
different Scrum project success dimensions. Then, the attention will shift towards the selection of
fifteen teamwork factors. Finally, the last part of this section will present the conceptual framework
that will act as basis for the rest of this study.
2.1 Scrum methodology Just like many other software engineering companies, TomTom in Eindhoven makes use of the ASD
method called Scrum methodology. Scrum, introduced by Schwaber (1997), is based on the work of
Pittman (1993) and Booch (1995). The name ‘Scrum’ originates from rugby, where a scrum or
scrummage is a method to restart the rugby game after a short interruption that involves players
packing closely together, attempting to gain possession of the ball. In a scrummage, the rugby teams
have to work as tight, integrated units, with both a clear role for every individual team member and
a strong focus on the collective team goal. So, the team is crucial in a scrummage. This is also the
case for Scrum methodology, where a multidisciplinary and self-managing team forms the core, the
so-called Scrum team. The Scrum team consists of a Scrum master, who can be regarded as team
leader, a product owner, who represents all stakeholders, and a development team, consisting of
developers. Together they pursue the same goal: to develop as fast as possible a product that adds
most value and satisfies the stakeholders (Franken, 2014).
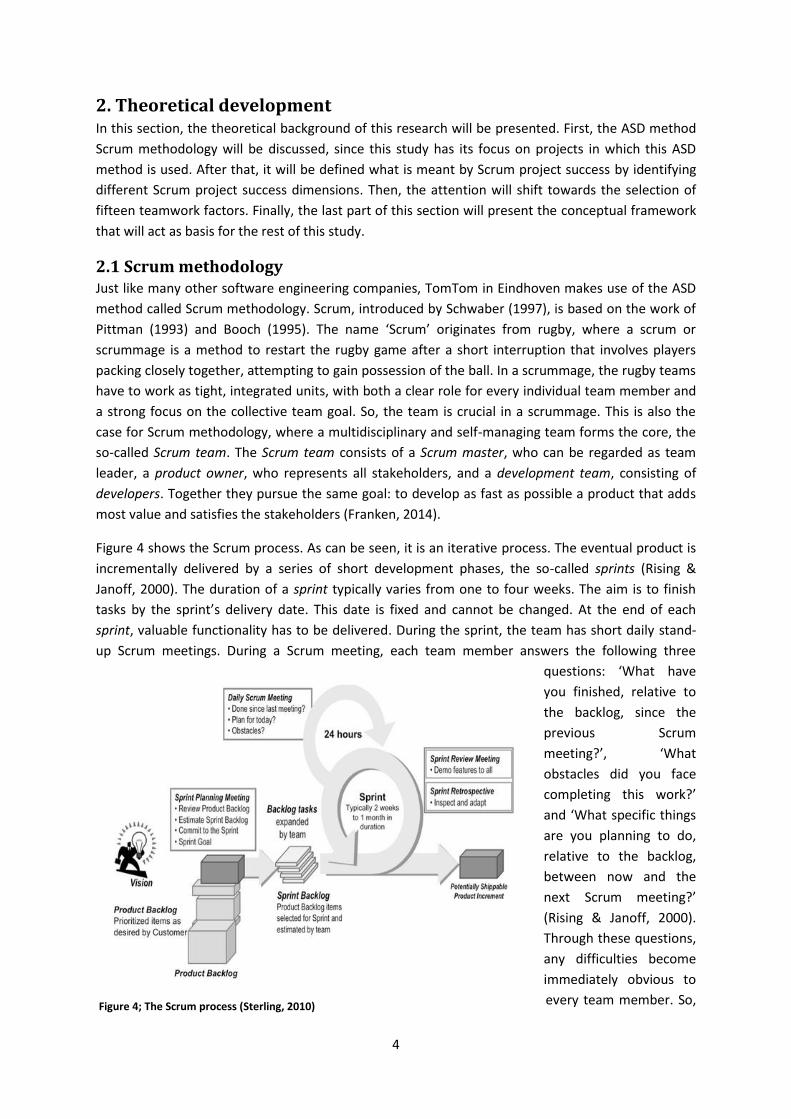
Figure 4 shows the Scrum process. As can be seen, it is an iterative process. The eventual product is
incrementally delivered by a series of short development phases, the so-called sprints (Rising &
Janoff, 2000). The duration of a sprint typically varies from one to four weeks. The aim is to finish
tasks by the sprint’s delivery date. This date is fixed and cannot be changed. At the end of each
sprint, valuable functionality has to be delivered. During the sprint, the team has short daily stand-
up Scrum meetings. During a Scrum meeting, each team member answers the following three
questions: ‘What have
you finished, relative to
the backlog, since the
previous Scrum
meeting?’, ‘What
obstacles did you face
completing this work?’
and ‘What specific things
are you planning to do,
relative to the backlog,
between now and the
next Scrum meeting?’
(Rising & Janoff, 2000).
Through these questions,
any difficulties become
immediately obvious to
every team member. So, Figure 4; The Scrum process (Sterling, 2010)
5
the result of the daily Scrum meetings is that communications are optimized and information sharing
is maximized (Beedle et al., 1999). The daily Scrum meetings are stand-up meetings, because
although some researchers argue that daily Scrum meetings should last fifteen to thirty minutes
(Rising & Janoff, 2000), most researchers think these meetings should not last longer than
approximately fifteen minutes (Mann & Maurer, 2005). Either way, most important is that the
meeting provides enough time to stress obstacles, but that there is no time to brainstorm about a
solution (Rising & Janoff, 2000).
The team is led by a Scrum master. According to Rising and Janoff (2000), tasks of the Scrum master
are among others: leading the Scrum meetings, keeping them short and focused, recording decisions
made at the Scrum meeting and tracking action items, identifying the initial backlog to be completed
in a sprint, and ensuring that every team member makes progress. The Scrum master provides
leadership, motivates and facilitates the team in line with the Scrum principles (Kautz, Johanson, &
Uldahl, 2014). In short, the Scrum master has to ensure that Scrum is applied properly.
An important instrument in the Scrum method is the backlog. There can be made a difference
between two types of backlogs, namely the product backlog and the development sprint backlog.
The first one consists of a prioritized list of all items relevant to a specific product (Vlaanderen et al.,
2011). The list is administered by the product owner, who represents all stakeholders and is
responsible for the composition of the product backlog, keeping in mind the various interests of the
different stakeholders. The progress of the product or release is tracked by the product owner as
well, namely in a so-called Release Burndown Chart (Franken, 2014).
If an item on the product backlog has been totally specified and has been approved by a developer, it
can be copied from the product backlog onto the development sprint backlog. The development
sprint backlog is a backlog that belongs to a specific development team. So, every development
team participating in the software development process has its own development sprint backlog.
The backlog contains all requirements that are assigned to the team at the start of a sprint. Every
item is split into several tasks, so that they can be assigned to specific team members. So, basically,
it describes what work has to be done in one sprint. Progress is tracked by the team in a so-called
Sprint Burndown Chart (Franken, 2014).
Apart from the usually daily Scrum meetings during a sprint, which are discussed earlier, Scrum
methodology has also some other important meetings (Franken, 2014). At the start of a sprint, a first
meeting is organized: the Sprint Planning meeting. The first part of this meeting is used to decide
which items will be worked on during the sprint. The second part is used to show the division of
work. Besides that, it is stated what the development team can deliver at the end of the sprint. At
the end of a sprint, a feedback meeting is held: the Sprint Review. In this meeting the development
team shows its work to the product owner and stakeholders. Subsequently, the team receives
feedback from the product owner and stakeholders. Finally, there is a last meeting: the Sprint
Retrospective. In this meeting, the team members look back at the last sprint. Both the process and
the outcome of the sprint are assessed and discussed by each individual team member (Kautz et al.,
2014).
6
2.2 Scrum project success When talking about project success, it is important to make a distinction between criteria and
factors. According to Lim and Mohamed (1999), criteria of project success are the series of standards
or principles by which project success is or can be judged. Criteria can also be regarded as
dimensions of project success, so both terms are used interchangeably in this master thesis. Factors
for project success, on the other hand, are the series of facts, circumstances or influences which
either impede or facilitate the project success (Lim & Mohamed, 1999). In literature, the factors that
have most influence on the success of a project are described as critical success factors. In short,
where factors influence the success or failure of a project, criteria form the basis of the judgment
about the actual success or failure of a project.
2.2.1 The ‘iron triangle’ success criteria
Traditionally, a project was regarded as successful when it met the following three success criteria:
cost, time, and quality, the so-called ‘iron triangle’ criteria (Atkinson, 1999). Also today, those three
criteria are regarded as important dimensions of project success. In software development projects,
it is the aim to develop high quality software, in as little time and with as little cost as possible.
However, it has become clear that project success cannot be judged by these criteria alone. The ‘iron
triangle’ criteria are namely short-term criteria that do not reflect success in the long term. Ika
(2009) stated that there are enough examples of projects that met all three criteria, but were still
considered as failures. Shenhar, Dvir, Guth, Lecher, Patanakul, Poli and Stafnovic (2005) mentioned
for example the project of the second generation of the Ford Taurus car. This project was completed
on time in 1995 within cost and quality. Nevertheless, the project turned out to be considered as a
failure in the marketplace. Similarly, there are also examples of projects that did not meet the
criteria, but still were considered as successful. Collyer and Warren (2009) mentioned for example
the movie Titanic, which exceeded both budget and time and was thought to become a huge flop,
but was eventually one of the most successful movies ever.
2.2.2 Additional success criteria
Many researchers think that in order to measure project success, apart from the ‘iron triangle’
criteria, additional success criteria should be used. For example, DeCotiis and Dyer (1979) stressed
the importance of customer satisfaction. They demonstrated in their study that five of twelve
aspects of R&D success were linked to the external client environment. According to them, a project
can be successful in terms of the ‘iron triangle’ criteria, but when the final project outcomes do not
meet the expectations of the customer, the project is still regarded as a failure. Also Baker, Murphy,
and Fisher (1983) stated the importance of customer satisfaction as a measure of project success.
According to them, the level of satisfaction of four different groups of stakeholders should be added
to the ‘iron triangle’ criteria: the customer organization, the developing organization, the project
team, and the end-users. Baker et al. (1983) argued that, in the long run, it is really important that
the parties associated and affected by the project are satisfied. In their work, Bubshait and Farooq
(1999) argued that project managers often fail to realize that there is another criterion apart from
the ‘iron triangle’ criteria, which is just as important, namely the people criterion. Without people
working together in teams, there would be no projects. Because of this, Hoegl and Gemuenden
(2001) used team performance and personal success of team members as criteria of project success.
The importance of people-related criteria is also apparent from a study of Dingsøyr and Lindsjørn
(2013), who used team performance as an equivalent of ASD project success. They stated that
7
results of teamwork cannot only be evaluated among the ability of the team to meet project goals
and budgets, and the quality of the developed software, but also among the team members’
motivation to work together in the future. If team members who work at a certain project are not
motivated to work together in the future, the project cannot be regarded as successful, because in
the long run it can cause team members to leave the organization and they will no longer be able to
add value to the organization.
2.2.3 Multidimensional project success framework
Based on previous literature and their own observations, Shenhar, Levy and Dvir (1997) proposed a
multidimensional framework to assess project success along four distinct dimensions: project
efficiency, impact on the customer, business success, and preparing for the future. To test this
framework and to find the corresponding measures of each dimension, in a later study, Shenhar,
Dvir, Levy, and Maltz (2001) made use of a factor analysis. This factor analysis also revealed four
distinct success dimensions. The first dimension, project efficiency, covered two of the ‘iron triangle’
criteria, and was about meeting schedule and budget goals. The second dimension, impact on the
customer, involved customer satisfaction and the fulfilling of customer needs, such as meeting
functional performance and meeting technical specifications. The third dimension, business success,
was about benefits derived by the organization, such as market share, growth, or profits. Finally, the
fourth dimension, preparing for the future, was related to the future and encompassed longer term
benefits, such as the creation of new markets, technologies or product lines. Shenhar et al. (2001)
demonstrated that project success really is a multidimensional concept and cannot be assessed by
only a single- or two-dimensional measure. Their suggestion was to use at least four major
dimensions for assessing project success, although they argued that it may be needed to use
additional dimensions, dependent on the type of project.
In 2007, Shenhar and Dvir published a book based on fifteen years of study in project management.
During these fifteen years, Shenhar and Dvir had gathered data on more than six hundred projects in
Israel and the United States. In their book, Shenhar and Dvir (2007) came up with a renewed
framework of project success criteria. This framework was one of the results of their extensive
research that took place in several phases, bringing up models that gradually changed during a long
and iterative process of going back and forth between data and theory. In their book, Shenhar and
Dvir (2007) suggested that a comprehensive assessment of project success in both short and long
term can be defined by the measurement of five different project success dimensions: project
efficiency, impact on the customer, impact on the team, business success, and preparation for the
future. So, the only actual main difference between this new framework compared to the one
proposed by Shenhar et al. (2001) was the addition of a fifth dimension, the impact on the team.
This dimension was about how the project affects the team and its members. It covered among
others team satisfaction, the team’s loyalty to the organization, team morale, and the retention of
team members after the project has been finished. Besides that, it also measured the indirect
investment the organization had made in the team members by assessing the development of team
members’ skills, team learning and growth. Furthermore, Shenhar and Dvir (2007) argued that the
first four dimensions can be regarded as short-term dimensions of project success, whereas the last
dimension, preparation for the future, can be seen as a long-term dimension of project success.
Looking at the four short-term dimensions, project efficiency is the shortest-term dimension,
followed by impact on the customer and impact on the team, and then by business success.
8
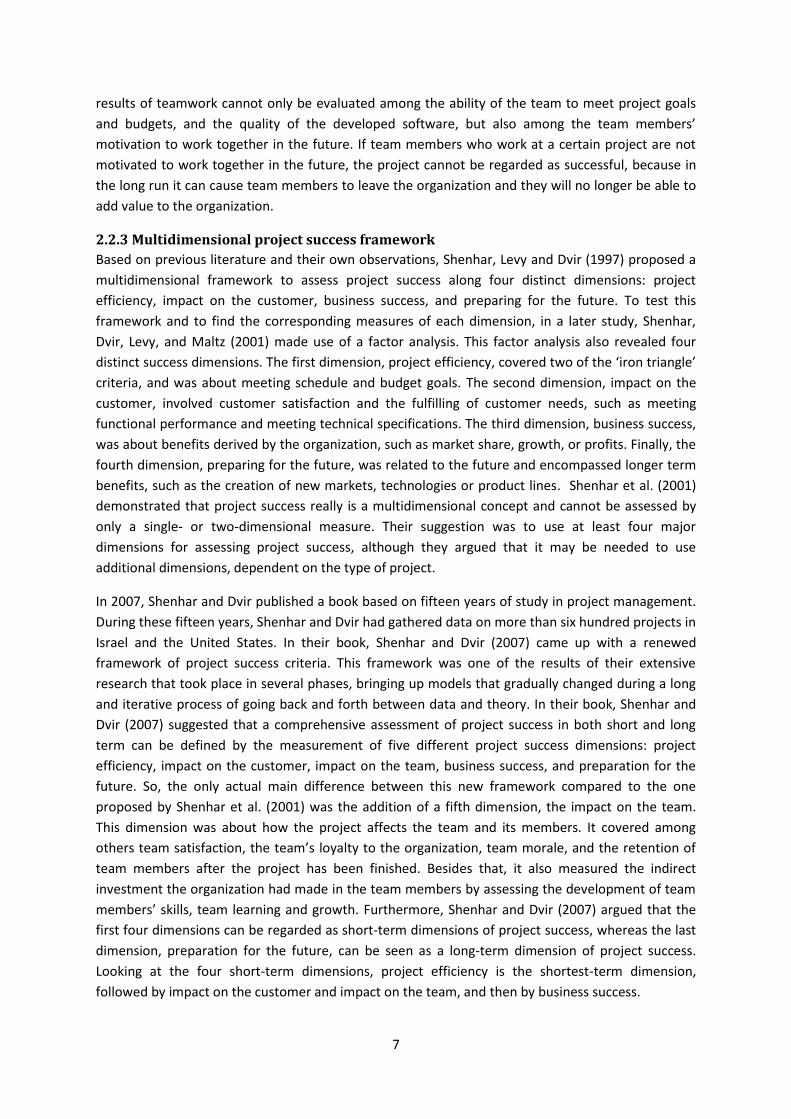
2.2.4 Overall Scrum project success
When defining the success of Scrum projects, the addition of the impact on the team as a fifth
dimension seems absolutely necessary. People-related criteria namely form an essential part of the
success of ASD method, because ASD methods highly value individuals and their interactions. This
was also confirmed by the semi-structured interviews with 24 employees working at TomTom.
Therefore, a slightly adapted version of Shenhar and Dvir’s (2007) multidimensional project success
criteria framework will be used to represent Scrum project success in this research. These proposed
Scrum project success criteria and their corresponding measures can be found in Figure 5. To
increase clarity, the name of Shenhar and Dvir’s (2007) first dimension has been changed from
‘Project efficiency’ to ‘Time and budget’. The corresponding measures of each Scrum project success
dimension are based on Shenhar and Dvir’s (2007) Project Success Assessment Questionnaire.
Figure 5; Proposed Scrum project success criteria
2.3 Teamwork factors 2.3.1 Teamwork factors as Scrum project success factors Rubin and Seeling (1986) were among the first to study project success factors. They studied the
influence of a project managers’ experience on the success or failure of the project. Using technical
performance as a measure of project success, they found that the experience of a project manager
hardly affects project success, but that the size of the project does. Since then, more researchers
paid attention to project success factors, some of them focusing on the critical success factors of
projects in general (Martin, 1976; Baker et al., 1983; Locke, 1984; Pinto & Slevin, 1987), others
focusing on the success factors of specific project types (Lester, 1998; Abdel-Hamid, Sengupta, &
Swett, 1999; Johnson, Boucher, & Robinson, 2001; Chow & Cao, 2007; Misra et al., 2009). It would
be impossible to sum up all possible critical success factors, because of the diversity of the projects
(Belassi & Tukel, 1996). Besides that, the amount of potential success factors is just tremendous.
Therefore, it was decided to narrow the scope of this master thesis project by focusing on teamwork
factors only instead of all possible success factors. It is namely clear that ASD methods like Scrum
9
methodology are build around teams (Schwaber, 1997). So, it is obvious that the success or failure of
a project highly depends on how well these teams function.
2.3.2 Selection of teamwork factors
Over the past decades, multiple studies on teams and teamwork have been executed and many
researchers developed teamwork models or framed aspects of teamwork (Salas, Stagl, Burke, &
Goodwin, 2007). In order to select fifteen teamwork factors for this study, we have looked at
different of these teamwork models. Three of them, namely Dickinson and McIntyre’s (1997)
teamwork model, Salas, Sims and Burke’s (2005) teamwork effectiveness framework, and Hoegl and
Gemuenden’s (2001) teamwork model, can be found in Figure 6, 7 and 8, respectively. They all
include the most important elements that are also considered in other research on teamwork
processes (Moe et al., 2010).
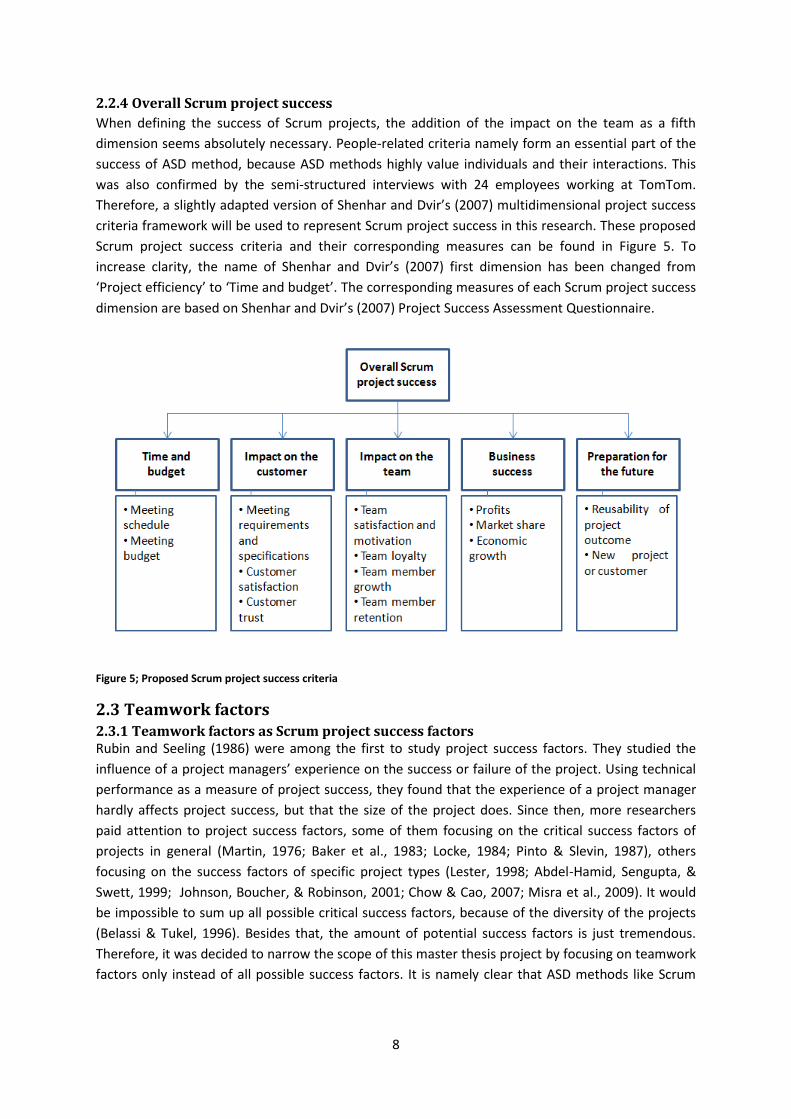
The model of Dickinson and McIntyre (1997) was based on previous literature reviews and
researches. They identified and defined seven core components of teamwork: communication, team
orientation, team leadership, monitoring, feedback, backup, and coordination. A learning loop of
these components and the
relationships between the
components form the core
of their teamwork model.
According to Moe et al.
(2010) the Dickinson and
McIntyre model covers
important elements that
are required in self-
organized and software
teams, two main
characteristics of the
Scrum teams that take
part in our study.
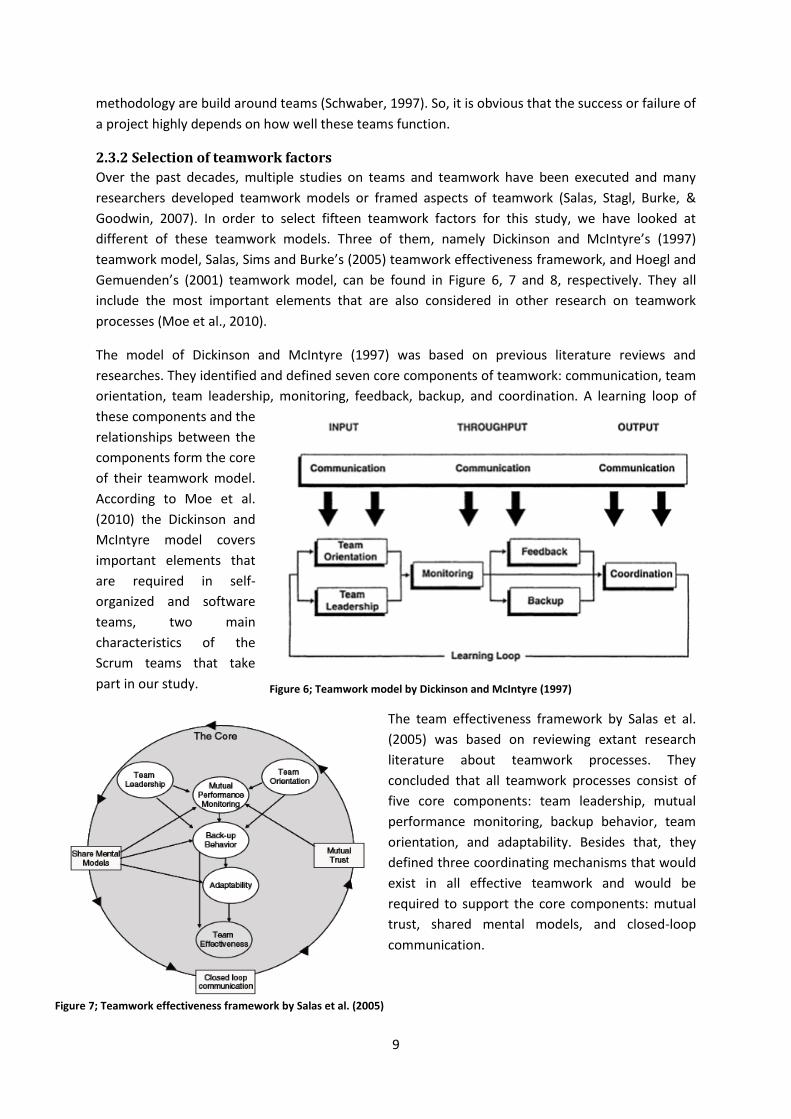
The team effectiveness framework by Salas et al.
(2005) was based on reviewing extant research
literature about teamwork processes. They
concluded that all teamwork processes consist of
five core components: team leadership, mutual
performance monitoring, backup behavior, team
orientation, and adaptability. Besides that, they
defined three coordinating mechanisms that would
exist in all effective teamwork and would be
required to support the core components: mutual
trust, shared mental models, and closed-loop
communication.
Figure 7; Teamwork effectiveness framework by Salas et al. (2005)
Figure 6; Teamwork model by Dickinson and McIntyre (1997)
10
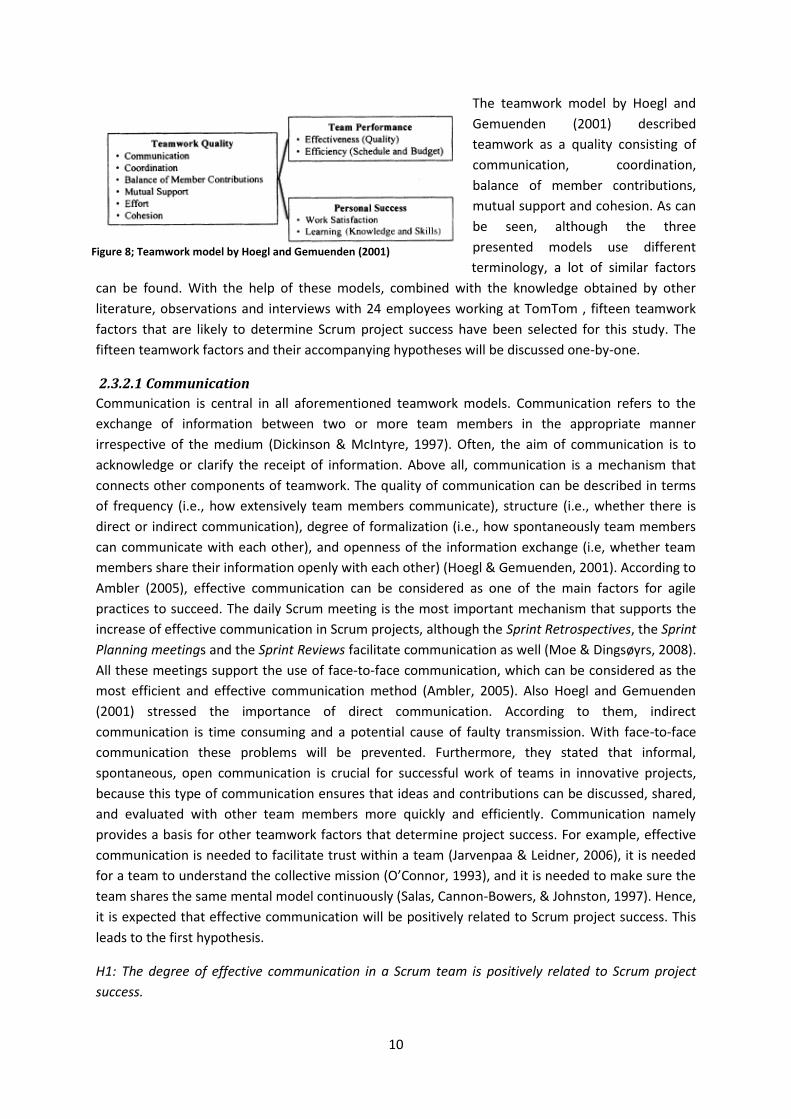
The teamwork model by Hoegl and
Gemuenden (2001) described
teamwork as a quality consisting of
communication, coordination,
balance of member contributions,
mutual support and cohesion. As can
be seen, although the three
presented models use different
terminology, a lot of similar factors
can be found. With the help of these models, combined with the knowledge obtained by other
literature, observations and interviews with 24 employees working at TomTom , fifteen teamwork
factors that are likely to determine Scrum project success have been selected for this study. The
fifteen teamwork factors and their accompanying hypotheses will be discussed one-by-one.
2.3.2.1 Communication
Communication is central in all aforementioned teamwork models. Communication refers to the
exchange of information between two or more team members in the appropriate manner
irrespective of the medium (Dickinson & McIntyre, 1997). Often, the aim of communication is to
acknowledge or clarify the receipt of information. Above all, communication is a mechanism that
connects other components of teamwork. The quality of communication can be described in terms
of frequency (i.e., how extensively team members communicate), structure (i.e., whether there is
direct or indirect communication), degree of formalization (i.e., how spontaneously team members
can communicate with each other), and openness of the information exchange (i.e, whether team
members share their information openly with each other) (Hoegl & Gemuenden, 2001). According to
Ambler (2005), effective communication can be considered as one of the main factors for agile
practices to succeed. The daily Scrum meeting is the most important mechanism that supports the
increase of effective communication in Scrum projects, although the Sprint Retrospectives, the Sprint
Planning meetings and the Sprint Reviews facilitate communication as well (Moe & Dingsøyrs, 2008).
All these meetings support the use of face-to-face communication, which can be considered as the
most efficient and effective communication method (Ambler, 2005). Also Hoegl and Gemuenden
(2001) stressed the importance of direct communication. According to them, indirect
communication is time consuming and a potential cause of faulty transmission. With face-to-face
communication these problems will be prevented. Furthermore, they stated that informal,
spontaneous, open communication is crucial for successful work of teams in innovative projects,
because this type of communication ensures that ideas and contributions can be discussed, shared,
and evaluated with other team members more quickly and efficiently. Communication namely
provides a basis for other teamwork factors that determine project success. For example, effective
communication is needed to facilitate trust within a team (Jarvenpaa & Leidner, 2006), it is needed
for a team to understand the collective mission (O’Connor, 1993), and it is needed to make sure the
team shares the same mental model continuously (Salas, Cannon-Bowers, & Johnston, 1997). Hence,
it is expected that effective communication will be positively related to Scrum project success. This
leads to the first hypothesis.
H1: The degree of effective communication in a Scrum team is positively related to Scrum project
success.
Figure 8; Teamwork model by Hoegl and Gemuenden (2001)
11
2.3.2.2 Team diversity
According to Jehn, Northcraft, and Neale (1999) team diversity refers to any attribute in which team
members differ from each other. It can be regarded as the heterogeneity within a team in terms of
individual attributes. In this study, team diversity is defined as informational diversity. Informational
diversity refers to the variation in knowledge base and perspective that team members bring to the
team (Jehn et al., 1999). Nonaka and Takeuchi (1995) argued that teams whose members have
different education backgrounds perform better than teams whose members have homogeneous
backgrounds, since the diversity of knowledge facilitates communication and information exchange.
Besides that, Glick, Miller and Huber (1993) stated that teams with mixed experience and expertise
performed better than homogeneous teams. Also Mac Cormack, Verganti and Iansiti (2001) argued
that teams covering a greater amount of broad experience are positively related to project
performance. Nerur and Balijepally (2007) argued that team diversity is key for ASD methods. If a
team namely consists of members having diverse skills and perspectives, this stimulates innovation
and learning, and generates more diverse solutions for complex problems (Campion, Medsker, &
Higgs, 1993; Watson, Kumar, & Michaelsen, 1993). So, it is expected that a diverse team in terms of
informational diversity is more capable of handling requirement changes than a homogeneous team.
Therefore, we think team diversity is positively related to Scrum project success.
H2: The degree of informational diversity in a Scrum team is positively related to Scrum project
success.
2.3.2.3 Coordination
According to Dickinson and McIntyre (1997), coordination represents the execution of team
activities in such a way that team members respond as a function of the behavior of other team
members. It implies that team members perform their activities in an integrated and timely manner.
In teams, team members do not only work together on fundamental aspects of a common task, but
each team member may also work on parallel subtasks. The synchronization and harmonization of
these individual contributions are an important aspect of the quality of collaboration (Hoegl &
Gemuenden, 2001). In order to facilitate this synchronization and harmonization teams need to
agree on common work-down structures, budgets, schedules, and deliverables. So, the better the
coordination, the better the collaboration in a team. Coordination is explicitly mentioned in only two
of the mentioned models. Nevertheless, the coordination component is also implicitly mentioned in
the Salas model, where shared mental models, mutual trust, and closed-loop communication
together form the coordination component. The meaning of closed-loop communication in the Salas
model is similar to the communication components in the other two models. So, closed-loop
communication refers to the exchange of information between sender and receiver irrespective of
the medium (Salas et al., 2005). Because all three the models regard coordination as one of the main
teamwork components, it is expected that the degree of coordination in a Scrum team is positively
associated with Scrum project success.
H3: The degree of coordination in a Scrum team is positively related to Scrum project success.
2.3.2.4 Team composition
Team composition refers to the configuration of member attributes in a team (Levin & Moreland,
1990).Team composition can have a powerful influence on both team processes and outcomes
(Kozlowski & Bell, 2003). For example, it was found that teams consisting of members with higher
12
cognitive ability were better able to adapt their role structure to an unexpected change in the task
context (LePine, 2005). Besides that, two meta-analyses revealed that the average cognitive ability
of a team was a strong predictor of team performance (Devine and Philips, 2001; Stewart, 2006).
Because Scrum projects are performed by Scrum teams, we expect that there will be a positive
relationship between Scrum project success and the degree to which a Scrum team consists of
skilled team members.
H4: The degree to which a Scrum team is composed of skilled individuals is positively related to
Scrum project success.
2.3.2.5 Monitoring behavior
Monitoring in the Dickinson and McIntyre model is equivalent to mutual performance monitoring in
the Salas model. Monitoring behavior involves observing the actions and performance of other team
members and recognizing when a team member performs correctly. It implies that team members
understand the tasks of other members and are also competent in their individual tasks (Dickinson &
McIntyre, 1997). Monitoring behavior ensures that an individual will be able to provide feedback and
backup to team members. In Scrum projects, monitoring behavior is mainly fostered through the
daily Scrum meetings and the Sprint Burndown Chart (Moe & Dingsøyr, 2008). The daily Scrum
meetings reveal for example the problems other team members encounter, and the Sprint
Burndown Chart shows remaining work and team progress. In a research of Pinto and Slevin (1987),
in which they asked 418 project managers to evaluate the importance of different potential project
success factors, monitoring and feedback turned out to be one of the ten main project success
factors. Therefore, we expect a positive relationship between the degree of monitoring behavior in a
Scrum team and Scrum project success.
H5: The degree of monitoring behavior in a Scrum team is positively related to Scrum project success.
2.3.2.6 Team orientation
Team orientation is present in the first two models and is related to effort in the third model
(Dingsøyr and Dybå, 2012). Salas et al. (2005) define team orientation as the tendency to take the
behavior of others into account during group interactions and to value team goals over individual
goals. So, it is about the team tasks and the attitudes that team members have towards each other.
It expresses the level of group cohesiveness, acceptance of team norms, and the importance of team
membership. Examples of high team orientation are assigning high priority to team goals and
participating voluntarily in all relevant team aspects (Dickinson & McIntyre, 1997). According to Moe
and Dingsøyr (2008), in Scrum projects, team orientation is fostered through the Sprint Planning
meetings and the Sprint Retrospectives. Besides that, the fact that Scrum teams are self-organized
supports team orientation in such a way that the focus is on team consensus rather than dictatorial
project managers. Furthermore, after a nine-month field study in a software development that had
introduced Scrum, Moe et al. (2010) concluded among others that problems with team orientation
were important barriers for achieving team effectiveness. Therefore, we think team orientation is
positively associated with Scrum project success.
H6: The degree of team orientation in a Scrum team is positively related to Scrum project success.
13
2.3.2.7 Feedback
Although the feedback component is only explicitly mentioned in the Dickinson and McIntyre model,
it is also present in model by Salas et al. (2005). They regarded the provision of feedback as a part of
mutual performance monitoring. According to Dickinson and McIntyre (1997), the giving, seeking,
and receiving of feedback among team members is required for teams to adapt and learn from their
past performances in order to be successful. This not only includes the acceptance of positive
comments regarding performance, but also of negative criticism. Dybå, Dingsøyr and Moe (2014)
also stressed the importance of feedback. They claimed that agile project management cannot exist
without feedback and learning. Therefore, we expect that there will be a positive relationship
between feedback and Scrum project success.
H7: The degree of feedback in a Scrum team is positively related to Scrum project success.
2.3.2.8 Backup behavior
Backup behavior in the first two models corresponds to mutual support in the Hoegl and
Gemuenden model. The backup behavior component is about the ability and willingness to help
other team members performing their tasks (Dickinson & McIntyre, 1997). Examples are helping
another team member correcting a mistake, asking for assistance when needed, and performing the
task of another team member who is unable to accomplish the task. According to Dingsøyr and
Lindsjørn (2013), this component is too often neglected by agile teams. They state that agile teams
should pay more attention to backup behavior in order to enable team performance. Because of
this, it is expected that the degree of backup behavior in a Scrum team will have a positive
relationship with Scrum project success.
H8: The degree of backup behavior in a Scrum team is positively related to Scrum project success
2.3.2.9 Team autonomy
Team autonomy refers to degree to which the team has substantial freedom, independence, and
discretion in scheduling the work and in determining the procedures that will be used for executing
the work (Mierlo, Rutte, Vermunt, Kompier, & Doorewaard, 2007). Research showed that if a team
has a high degree of autonomy over project decisions, this has many positive effects. If team
members are allowed to make important decisions, they are more likely to identify with the project,
since the project is experienced as a result of their own ideas and influence (Sethi, 2000). This higher
identification makes it more likely that team members are willing to fully contribute their knowledge
to problem-solving processes which are needed for successful project completion. Furthermore,
Sethi (2000) argued that team members are also more likely to develop higher levels of support and
trust for each other, when decisions are made jointly. Besides that, Highsmith (2009) stated that ASD
methods support self-organization, self-discipline, and self-management. Research by Langfred
(2000) showed that if a team is trying to function as a self-managed team when the team members
have high individual autonomy instead of team autonomy, this can negatively impact team
performance. Therefore, we think that team autonomy is important for Scrum teams to perform
well. Hence, we expect team autonomy to be positively associated to Scrum project success.
H9: The degree of team autonomy in a Scrum team is positively related to Scrum project success.
14
2.3.2.10 Mutual trust
Mutual trust is only explicitly mentioned in the Salas model. Mutual trust is defined as the shared
belief that team members will perform their roles and protect the interests of other team members
(Salas et al., 2005). Moe et al. (2010) stressed the importance of trust by arguing that it should be
added to the Dickinson and McIntyre model. According to them, trust is required for good
communication, feedback and (shared) team leadership. When there is no trust between team
members, they are less likely to share information and to admit mistakes or accept feedback (Salas
et al., 2005). Furthermore, also Robinson and Sharp (2004) stated that agile development teams
should establish trust in order to be successful. Therefore, it is thought that mutual trust and Scrum
project success will be positively related.
H10: The degree of mutual trust in a Scrum team is positively related to Scrum project success.
2.3.2.11 Team adaptability
Adaptability seems to be only mentioned in the Salas model, but is represented in the Dickinson and
McIntyre model as well. By describing the teamwork process as a learning loop, Dickinson and
McIntyre (1997) namely show that they regard teams as adaptable and dynamically changing over
time. Salas et al. (2005) say adaptability is about changing a course of action or adjusting team
repertoire as a response to changing internal or external conditions. Furthermore, Moe and Dingsøyr
(2008) stressed that Scrum methodology has been designed to adapt to change by regular feedback
loops. This makes us think that the team’s ability to adapt will be positively related to Scrum project
success.
H11: The degree of a Scrum team’s adaptability is positively related to Scrum project success.
2.3.2.12 Goal clarity
Goal clarity is about the clarity of team goals and individual members’ roles in working towards
meeting these goals (Hu & Liden, 2011). In goal-setting theory, it is suggested that clear goals lead to
improved performance, since clear goals direct the attention of team members and encourage them
to be persistent (Locke & Latham, 1990). An important aspect of goal clarity is that individual
members know how their subtasks relate to the overall team objectives (Sawyer, 1992). According
to Diefendorff & Lord (2008) this creates a sense of relatedness with the other team members,
which encourages close interactions between team members and helps to integrate their tasks.
Furthermore, Abdel-Hamid et al. (1999) concluded that the definition of clear, specific project goals
is an important success factor for software projects. Hence, we expect that goal clarity will have a
positive relationship with Scrum project success.
H12: The degree of goal clarity in a Scrum team is positively related to Scrum project success.
2.3.2.13 Shared mental models
Shared mental models is mentioned in the Salas model. It can be defined as a shared understanding
of the task that is to be performed by the team and of the involved team interactions (Jonker,
Riemsdijk, & Vermeulen, 2011). The importance of shared mental models was, just like trust,
stressed by Moe et al. (2010), who argued that the construct should be added to the Dickinson and
McIntyre model. Shared mental models are crucial for effective teamwork because without them, it
is very likely that individual team members pursue different goals (Salas et al., 2005). Furthermore,
Park (2008) found that teams who have shared mental models are more satisfied. Besides that, Moe
15
et al. (2010) argued that shared mental models are needed for good communication, monitoring
behavior, and team orientation. Therefore, we think that shared mental models are also positively
related to Scrum project success.
H13: The degree of shared mental models in a Scrum team is positively related to Scrum project
success.
2.3.2.14 Knowledge sharing
Knowledge sharing can be regarded as a central process through which team members collectively
utilize their informational resources (Mesmer-Magnus & DeChurch, 2009). According to (Srivastava,
Bartol, & Locke, 2006) knowledge sharing is an important determinant of team performance. By
collectively exchanging and combining knowledge, team members will create new knowledge, which
enables their organizations to innovate, and makes it more likely that they outperform rival
organizations in dynamic environments (Collins & Smith, 2006). In their study, Stasser and Titus
(1985) revealed that knowledge sharing leads to improved decision making, since knowledge sharing
has as effect that alternatives are more comprehensively considered and that existing knowledge
within the team is utilized in a better way. Apart from that, knowledge sharing seems to improve
team performance also because it has a positive effect on the degree of shared mental models and
coordination of the team (Srivastava et al., 2006). So, it is expected that there will be a positive
association between knowledge sharing and Scrum project success.
H14: The degree of knowledge sharing in a Scrum team is positively related to Scrum project success.
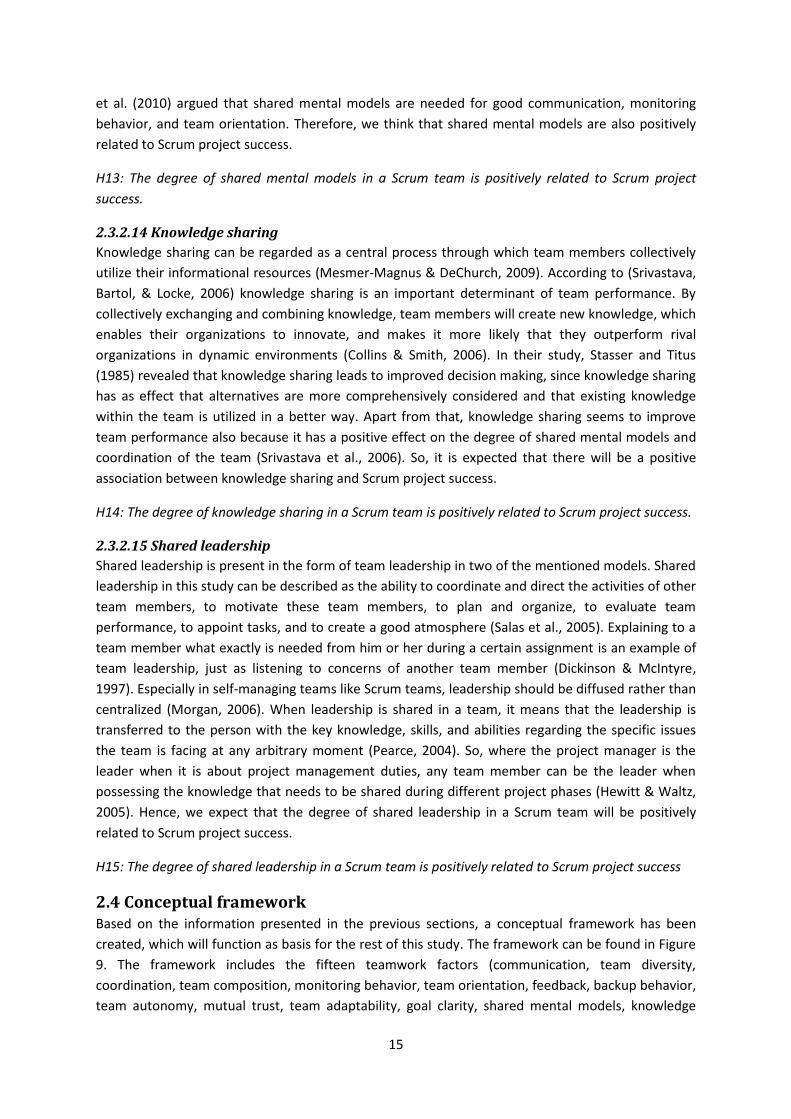
2.3.2.15 Shared leadership
Shared leadership is present in the form of team leadership in two of the mentioned models. Shared
leadership in this study can be described as the ability to coordinate and direct the activities of other
team members, to motivate these team members, to plan and organize, to evaluate team
performance, to appoint tasks, and to create a good atmosphere (Salas et al., 2005). Explaining to a
team member what exactly is needed from him or her during a certain assignment is an example of
team leadership, just as listening to concerns of another team member (Dickinson & McIntyre,
1997). Especially in self-managing teams like Scrum teams, leadership should be diffused rather than
centralized (Morgan, 2006). When leadership is shared in a team, it means that the leadership is
transferred to the person with the key knowledge, skills, and abilities regarding the specific issues
the team is facing at any arbitrary moment (Pearce, 2004). So, where the project manager is the
leader when it is about project management duties, any team member can be the leader when
possessing the knowledge that needs to be shared during different project phases (Hewitt & Waltz,
2005). Hence, we expect that the degree of shared leadership in a Scrum team will be positively
related to Scrum project success.
H15: The degree of shared leadership in a Scrum team is positively related to Scrum project success
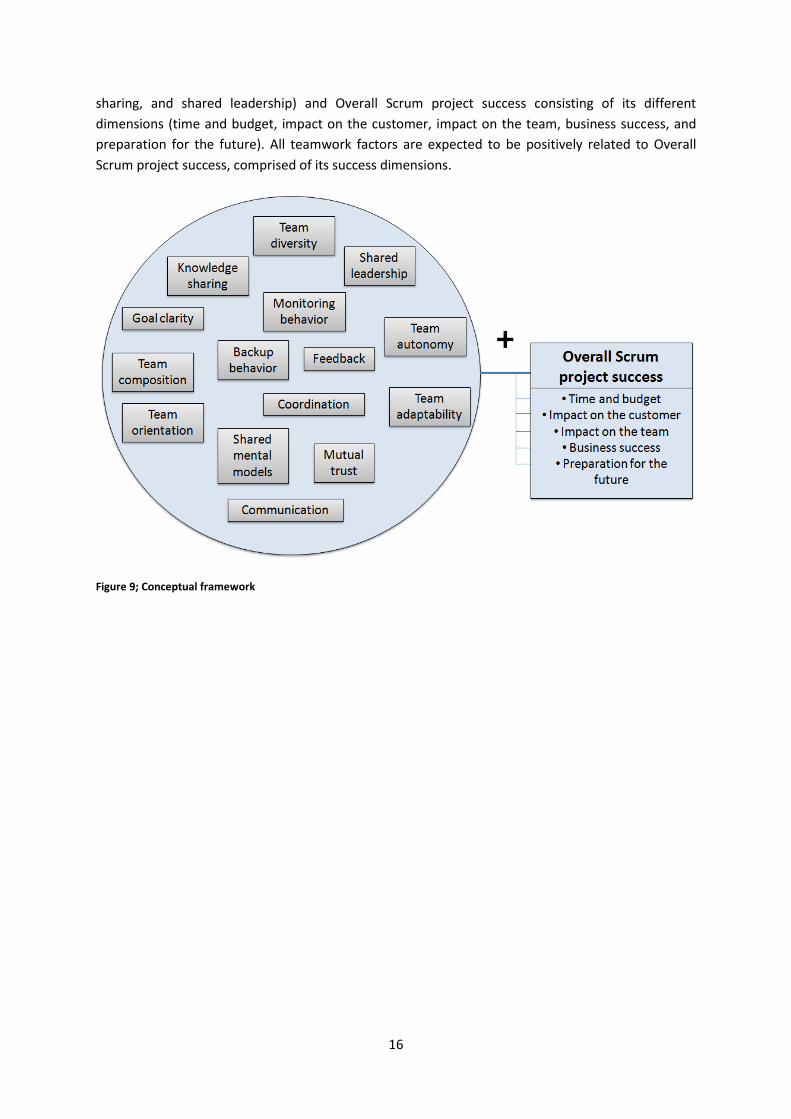
2.4 Conceptual framework Based on the information presented in the previous sections, a conceptual framework has been
created, which will function as basis for the rest of this study. The framework can be found in Figure
9. The framework includes the fifteen teamwork factors (communication, team diversity,
coordination, team composition, monitoring behavior, team orientation, feedback, backup behavior,
team autonomy, mutual trust, team adaptability, goal clarity, shared mental models, knowledge
16
sharing, and shared leadership) and Overall Scrum project success consisting of its different
dimensions (time and budget, impact on the customer, impact on the team, business success, and
preparation for the future). All teamwork factors are expected to be positively related to Overall
Scrum project success, comprised of its success dimensions.
Figure 9; Conceptual framework
17
3. Research methodology The research methodology used in this study is a so-called mixed method, using a combination of
both quantitative and qualitative methods. An advantage of a mixed methods research approach is
that the results from one method can help inform or develop the other method (Greene, Caracelli, &
Graham, 1989). Before one can conduct a quantitative analysis, a certain level of qualitative pre-
understanding about a phenomenon is needed (Van Aken, Berends, & Van der Bij, 2007). Therefore,
for this study, it is chosen to not only conduct a quantitative analysis by means of a paper-based
survey, but to increase the level of pre-understanding about the investigated phenomenon by
means of qualitative methods as well. Apart from studying relevant literature, interviews have been
conducted and observations have been made to get more insight into how strict Scrum methodology
is followed at TomTom in Eindhoven, how Scrum project success is defined at TomTom in
Eindhoven, and what teamwork factors are likely to influence Scrum project success.
3.1 Interviews and observations In total, 24 semi-structured interviews have been conducted with different employees working at
TomTom in Eindhoven. Semi-structured interviews were used, because this type of interview
includes a list of specific questions, but leaves also sufficient room for additional information. The
complete list of interview questions can be found in Appendix I. They focused on the interviewees’
thoughts about the use of Scrum methodology within their team and organization, their definition of
Scrum project success, and their thoughts about teamwork factors which are likely to influence
Scrum project success. The number of people that have been interviewed was based on the guiding
principle of saturation (Glaser and Strauss, 1967). So, I started interviewing people one by one, until I
noticed that a new interview did not shed any further light on the issues under investigation,
meaning the point of saturation had been reached. To ensure interviewees were a good
representation of the total research population, I made sure to select interviewees who differed
from each other with respect to the project they were involved in, the team in which they worked
and the function they performed. The information gathered during the interviews was used to refine
the conceptual framework (e.g. adding teamwork factors that I had not immediately identified from
the literature). Furthermore, I joined various Scrum team meetings of different Scrum teams to get
more insight into the way Scrum methodology was practiced at TomTom in Eindhoven. The
observations were of great value as they confirmed that TomTom in Eindhoven truly makes use of
Scrum methodology as described in the literature (Franken, 2014).
3.2 Paper-based survey instrument
3.2.1 Procedure
With the help of the insights gained by the interviews and observations, two paper-based surveys
were developed to test the hypothetical framework, one for project managers and one for team
members. Two different surveys were used, since we wanted to prevent common method biases
(Podsakoff, MacKenzie, Lee, & Podsakoff, 2003). Because project managers were the only individuals
having enough knowledge about all Scrum project success dimensions, they were selected to fill out
the survey for project managers. In this survey, the project managers were asked to assess the
success of the Scrum project they supervised by evaluating the different Scrum project success
dimensions. It took about 5 minutes to complete this survey. The complete project manager survey
can be found in Appendix II. The survey for team members was a bit longer and took about 15-20
18
minutes to complete. The complete survey for team members can be found in Appendix III and was
used to measure the presence of different teamwork factors in the Scrum teams. Because TomTom
was also interested in how team members would evaluate the success of the Scrum project they
were involved in, team members evaluated Scrum project success as well. This allowed for a
comparison between project managers’ and team members’ evaluations of Scrum project success.
Team members’ Scrum project success evaluations were not used for any other purpose.
In total, ten project managers and sixteen Scum teams were selected for participation in this study.
Together they were involved in ten different Scrum projects. However, to ensure there would be no
overlap between the two groups of respondent, all team leads were excluded from filling out the
survey for team members, also because some team leads had both the role of team lead and project
manager in a single project.
The paper-based project manager surveys were personally handed out to all project managers. The
team member surveys were given to the team leads of the different teams and distributed to the
team members to be filled out during a Scrum team meeting, such as a Scrum Retrospective. This
procedure was used to ensure a high response rate. In total, the project manager survey was handed
over to ten project managers, and the team member survey was handed over to 114 individuals.
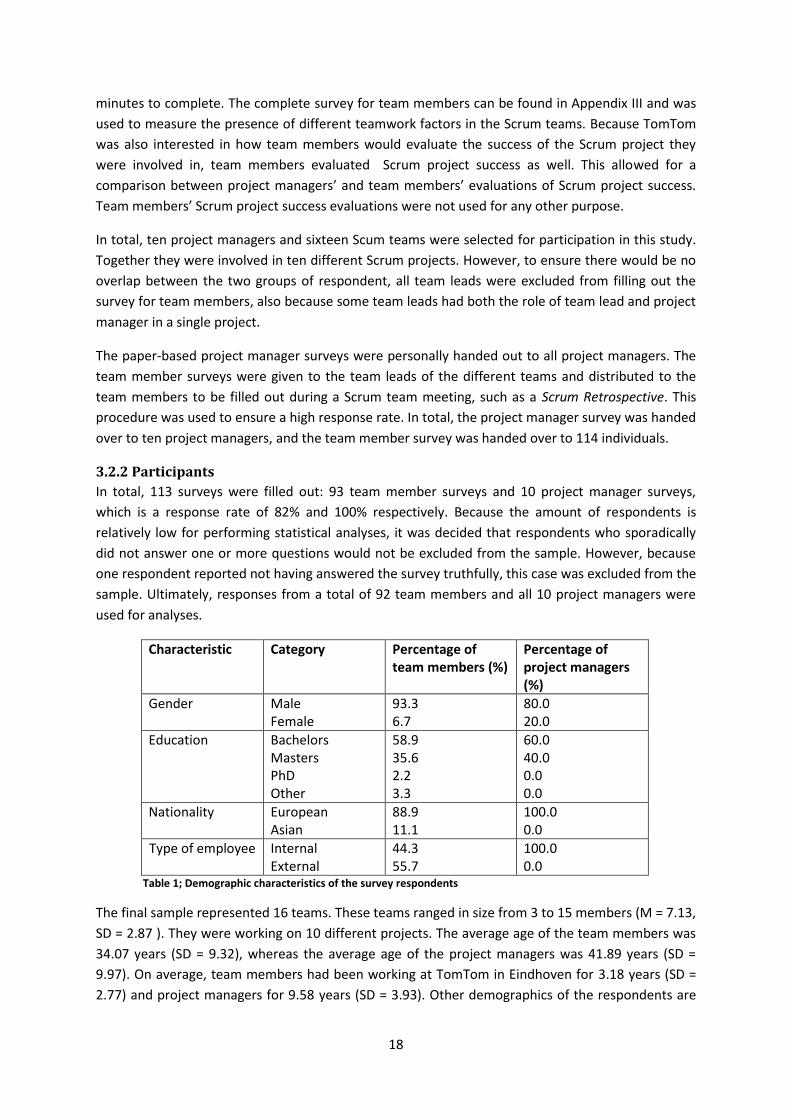
3.2.2 Participants
In total, 113 surveys were filled out: 93 team member surveys and 10 project manager surveys,
which is a response rate of 82% and 100% respectively. Because the amount of respondents is
relatively low for performing statistical analyses, it was decided that respondents who sporadically
did not answer one or more questions would not be excluded from the sample. However, because
one respondent reported not having answered the survey truthfully, this case was excluded from the
sample. Ultimately, responses from a total of 92 team members and all 10 project managers were
used for analyses.
Characteristic Category Percentage of team members (%)
Percentage of project managers (%)
Gender Male Female
93.3 6.7
80.0 20.0
Education Bachelors Masters PhD Other
58.9 35.6 2.2 3.3
60.0 40.0 0.0 0.0
Nationality European Asian
88.9 11.1
100.0 0.0
Type of employee Internal External
44.3 55.7
100.0 0.0
Table 1; Demographic characteristics of the survey respondents
The final sample represented 16 teams. These teams ranged in size from 3 to 15 members (M = 7.13,
SD = 2.87 ). They were working on 10 different projects. The average age of the team members was
34.07 years (SD = 9.32), whereas the average age of the project managers was 41.89 years (SD =
9.97). On average, team members had been working at TomTom in Eindhoven for 3.18 years (SD =
2.77) and project managers for 9.58 years (SD = 3.93). Other demographics of the respondents are
19
summarized in Table 1. The difference between internal and external employees is that external
employees are working at TomTom because they have been contracted by TomTom via a third party,
whereas internal employees are on the payroll of TomTom.
3.2.3 Measures
The survey used in this research mainly consisted of informant items, which are items that ask
individuals to evaluate their team rather than their own personal behaviors or attitudes (Van der
Vegt & Bunderson, 2005). This type of items makes it possible to measure team level constructs
based on individual responses. All items were adopted from published scales in literature. Since
longer surveys take more time to complete, tend to have more missing data, and have higher refusal
rates than shorter surveys (Stanton, Sinar, Balzer, & Smith, 2002), it was decided to not always use
the complete scales. To ensure respondents would be able to fill out the questionnaire within
twenty minutes, it was needed to shorten some original complete scales. In consultation with both
my university and company supervisor, it was decided which items would be left out of the
questionnaire. Unless stated otherwise, all survey items were assessed using a 5-point Likert scale; 1
= strongly disagree, 5 = strongly agree. All questionnaire items are presented in Appendices B and C.
Communication was measured with eight items selected from the ten-item communication subscale
of Hoegl and Gemuenden’s (2001) teamwork quality scale. In their research, the communication
subscale had a Cronbach’s alpha of .94. Typical examples of the communication scale are ‘In our
team we communicate mostly directly and personally with each other’ and ‘Project-relevant
information is shared openly by all team members in our team’. We left out the item ‘We often
communicate in spontaneous meetings, phone conversations, etcetera’, because the content of this
item is also reflected in another item, such as ‘There is frequent communication within the team’. In
our research, Cronbach’s alpha was a little lower than the Cronbach’s alpha of the original scale,
namely .75, but still high enough (Field, 2009). However, it turned out that Cronbach’s alpha would
increase to .78 if the item ‘There are mediators through whom much communication is conducted’
was deleted. Besides that, the corrected item-total correlation of this item turned out to be below
.30, which indicates fairly bad internal consistency (Field, 2009). Furthermore, some respondents
indicated that they did not know how to interpret this item exactly, because they did not understand
the word ‘mediators’. Therefore, and because the validity of the original scale had already been
affected by using only nine of the ten items, it was decided to also delete this item from the
communication scale.
Team diversity was measured by making use of Lee and Xia’s (2010) four-item software team
diversity scale. A typical example of an item is ‘Team members have skills that complement each
other’. In Lee and Xia’s (2010) study, the Cronbach’s alpha was .81. In this study, Cronbach’s alpha
was even .84.
Coordination was measured with five adopted items from the coordination subscale of Lewis’ (2003)
transactive memory system scale. The Cronbach’s alpha of this original subscale was .80 (Zhang,
Hempel, Han, & Tjosvold, 2007). In this study, the Cronbach’s alpha was .63. Although this is a
relatively low value, Kline (1999) argued that when dealing with psychological constructs values
below .70 can be expected because of the diversity of the constructs being measured. It should be
remarked that all items have corrected item-total correlations above .30, which is encouraging
(Field, 2009). An typical item of this scale is ‘We accomplish tasks smoothly and efficiently’.
20
Team composition was measured by using Edmondson’s (1999) three-item team composition scale,
consisting of items like ‘All members of our team have more than enough training and experience
for the kind of work we have to do’. The Chronbach’s alpha of this scale turned out to be pretty low
in our study, namely .58. Furthermore, all items correlated with the total scale to a good degree
(lower r = .38) and deleting one of the items would not lead to a higher Cronbach’s alpha.
Monitoring behavior was measured using four items of De Jong and Elfring’s (2010) five-item scale.
This original scale had a Cronbach’s alpha of .92. Also in this study, the Cronbach’s alpha was
acceptable, namely .82. Examples of typical items are ‘We check whether everyone meets their
obligations to the team’ and ‘Team members keep close track of whether everyone performs as
expected’. The original item ‘In our team we check whether everyone is doing what is expected’ was
not selected, because the content of this item was also represented in the other items.
Team orientation, feedback and backup behavior were all measured by adopting the corresponding
three-item scales of Park, Henking, and Egley (2004). In their study the Cronbach’s alpha were.89,
.78, and .80 respectively. In the current study the Cronbach’s alpha of team orientation (= .81) and
feedback (= .75) were high enough, but the reliability of the backup behavior scale was pretty low
(Cronbach’s alpha = .51). Deleting the item ‘Our team members provide assistance to those who
need it’, which did not well correlate with the total scale (r = .25), would increase the Cronbach’s
alpha to .52. However, this increase is negligible and both values reflect poor reliability. Therefore, it
was decided to preserve all three items. The low Cronbach’s alpha of the backup behavior scale
implies that its statistical power is low as well, which increases the chance of making a Type II error.
With other words, the chance of accepting a null hypothesis that actually is not true becomes higher.
This means that backup behavior runs a higher risk of being missed as predictor that does in fact
predict the outcome (Field, 2009). A typical example of a team orientation item is ‘Team members
assign high priority to team goals’, an item used for measuring the feedback construct is ‘Team
members provide helpful suggestions to other members’, and ‘Team members fill in for another
member who is unable to perform a task’ is an example of a backup behavior item.
Team autonomy was measured by using six selected items of the eight-item team-level autonomy
scale developed by Langfred (2005). The items ‘My team is able to choose the way to go about its
work’ and ‘My team has control over the scheduling of work’ were not selected from the original
scale, because the content of these items was also reflected in some other items, such as ‘My team
is free to decide how to go about getting work done’ and ‘My team can decide when to do particular
activities’. The original scale had a Cronbach’s alpha of 0.91 and also in this study Cronbach’s alpha
had an acceptable value, namely .81. Deleting the item ‘My team is free to choose the method(s) to
use in carrying out work’ would increase the Cronbach’s alpha to .82. However, because this
increase is negligible and the item correlates to a good degree with the total scale (r = .43), it was
decided not to delete this item from the scale.
Mutual trust was measured with a five-item scale developed by Rispens, Greer, and Jehn (2007). The
original scale had a Cronbach’s alpha of 0.87. Also in this study the Cronbach’s alpha, having a value
of .86, was acceptable. An typical example of an item is ‘My team members trust each other’.
Team adaptability was measured with nine selected items from Han and Williams’ (2008) fourteen-
item TAP scale, which originally had a Cronbach’s alpha of .94. Five items were not selected, because
of different reasons. In some cases, their content was also reflected in other items, in other cases,
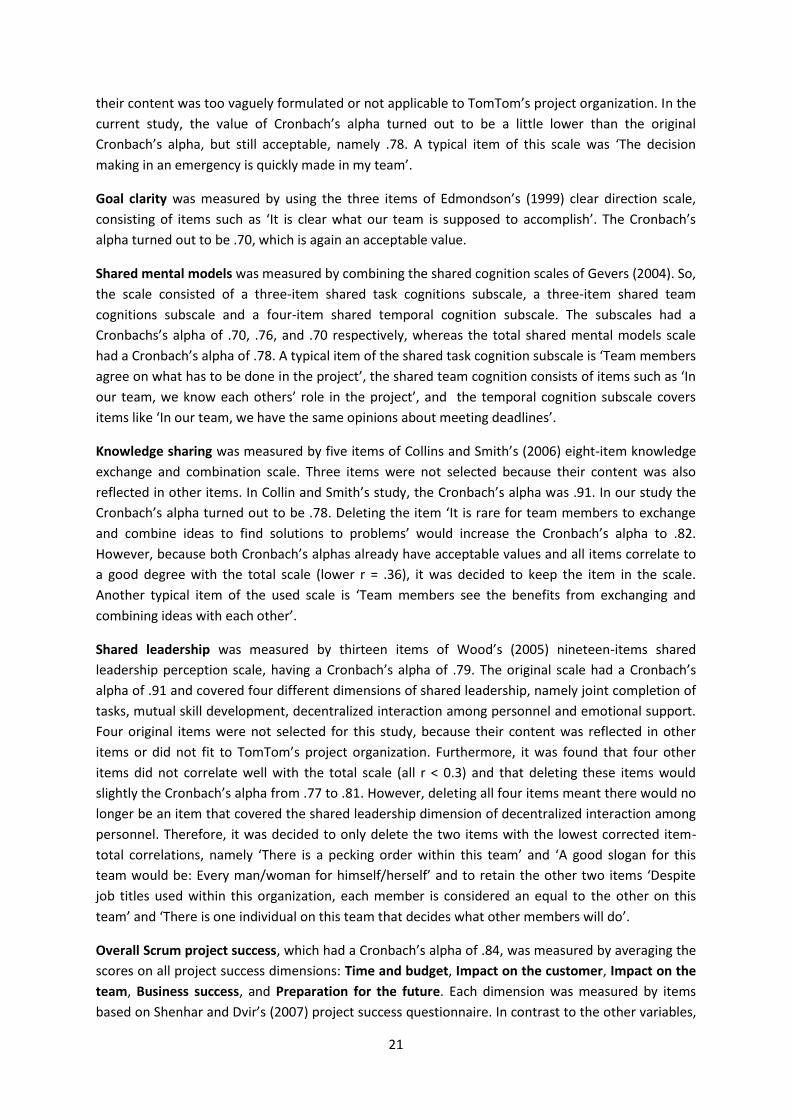
21
their content was too vaguely formulated or not applicable to TomTom’s project organization. In the
current study, the value of Cronbach’s alpha turned out to be a little lower than the original
Cronbach’s alpha, but still acceptable, namely .78. A typical item of this scale was ‘The decision
making in an emergency is quickly made in my team’.
Goal clarity was measured by using the three items of Edmondson’s (1999) clear direction scale,
consisting of items such as ‘It is clear what our team is supposed to accomplish’. The Cronbach’s
alpha turned out to be .70, which is again an acceptable value.
Shared mental models was measured by combining the shared cognition scales of Gevers (2004). So,
the scale consisted of a three-item shared task cognitions subscale, a three-item shared team
cognitions subscale and a four-item shared temporal cognition subscale. The subscales had a
Cronbachs’s alpha of .70, .76, and .70 respectively, whereas the total shared mental models scale
had a Cronbach’s alpha of .78. A typical item of the shared task cognition subscale is ‘Team members
agree on what has to be done in the project’, the shared team cognition consists of items such as ‘In
our team, we know each others’ role in the project’, and the temporal cognition subscale covers
items like ‘In our team, we have the same opinions about meeting deadlines’.
Knowledge sharing was measured by five items of Collins and Smith’s (2006) eight-item knowledge
exchange and combination scale. Three items were not selected because their content was also
reflected in other items. In Collin and Smith’s study, the Cronbach’s alpha was .91. In our study the
Cronbach’s alpha turned out to be .78. Deleting the item ‘It is rare for team members to exchange
and combine ideas to find solutions to problems’ would increase the Cronbach’s alpha to .82.
However, because both Cronbach’s alphas already have acceptable values and all items correlate to
a good degree with the total scale (lower r = .36), it was decided to keep the item in the scale.
Another typical item of the used scale is ‘Team members see the benefits from exchanging and
combining ideas with each other’.
Shared leadership was measured by thirteen items of Wood’s (2005) nineteen-items shared
leadership perception scale, having a Cronbach’s alpha of .79. The original scale had a Cronbach’s
alpha of .91 and covered four different dimensions of shared leadership, namely joint completion of
tasks, mutual skill development, decentralized interaction among personnel and emotional support.
Four original items were not selected for this study, because their content was reflected in other
items or did not fit to TomTom’s project organization. Furthermore, it was found that four other
items did not correlate well with the total scale (all r < 0.3) and that deleting these items would
slightly the Cronbach’s alpha from .77 to .81. However, deleting all four items meant there would no
longer be an item that covered the shared leadership dimension of decentralized interaction among
personnel. Therefore, it was decided to only delete the two items with the lowest corrected item-
total correlations, namely ‘There is a pecking order within this team’ and ‘A good slogan for this
team would be: Every man/woman for himself/herself’ and to retain the other two items ‘Despite
job titles used within this organization, each member is considered an equal to the other on this
team’ and ‘There is one individual on this team that decides what other members will do’.
Overall Scrum project success, which had a Cronbach’s alpha of .84, was measured by averaging the
scores on all project success dimensions: Time and budget, Impact on the customer, Impact on the
team, Business success, and Preparation for the future. Each dimension was measured by items
based on Shenhar and Dvir’s (2007) project success questionnaire. In contrast to the other variables,
22
the project success dimension were assessed using a 7-point Likert scale: 1 = strongly disagree, 7 =
strongly agree. Time and budget was measured by two items, namely ‘The project is running on
time’ and ‘The project is running within budget’, having a Cronbach’s alpha of .79. Impact on the
customer was assessed by three items with a Cronbach’s alpha of .85. A typical item of this
dimension was ‘The customer is satisfied’. The dimension Impact on the team was measured by four
items. One of the items was ‘The project team(s) is/are highly satisfied and motivated’. This subscale
had a Cronbach’s alpha of .86. Business success, which had a Cronbach’s alpha of .71, was measured
by three items such as ‘It is expected that the project will become an economic business success’.
The fifth dimension Preparation for the future had a Cronbach’s alpha of .84. ‘The project outcome
can be reused in future projects’ and ‘The project will lead to new projects and/or customers’ were
the two items that were used to measure this dimension.
3.2.3 Data aggregation
The data were analyzed at
the group level. For each
teamwork factor in this
study, individual scores were
aggregated to group mean
scores based on high levels
of intra-group agreement,
measured by wg(j) (see Table
2). The Rwg(j) (James
Demarée, & Wolf, 1984) is
used to compare the amount
of observed variance
between group members to
an amount of random
variance expected. In this
case, the random variance as
expected from a uniform
distribution was used. The
reason for this is that all teamwork factors were measured on a 5-point Likert scale. Therefore, each
answer option had an equal likelihood of being chosen, just like in a uniform distribution. The Rwg(j)
ranges from 0 to 1, indicating complete disagreement versus complete agreement among team
members. Values of .70 or above are considered adequate (George & Bettenhausen, 1990). As can
be seen in Table 2, all wg(j) are .77 or higher, so ratings of team members within the same team are
homogeneous enough to justify aggregation of individual scores to group mean scores.
Apart from the Rwg(j), the intraclass correlations ICC(1) and ICC(2) (Bliese, 2000) were assessed as well
(see Table 2). Within the context of multilevel modeling, the ICC(1) is typically used to provide an
estimate of the effect size, indicating the extent to which individual ratings are attributable to group
membership. It indicates which percentage of the variance in an individual team member’s rating
can be explained by the team member’s team. According to LeBetron and Senter (2008), an ICC(1)
value of .01 might be considered as a small effect, a value of .10 as medium effect, and a value of .25
as a large effect. Looking at Table 2, it can be seen that although some ICC(1) values can be
considered as medium effects, in general, the effects seem rather small.
Teamwork factors wg(j) ICC(1) ICC(2)
1. Communication .96 .13 .46
2. Team diversity .89 .05 .22
3. Coordination .92 .18 .56
4. Team composition .88 .17 .54
5. Monitoring behavior .77 -.11 -1.31
6. Team orientation .86 .12 .43
7. Feedback .88 .02 .10
8. Backup behavior .91 -.07 -.62
9. Team autonomy .93 .22 .62
10. Mutual trust .95 .02 .12
11. Team adaptability .96 .08 .33
12. Goal clarity .88 .03 .15
13. Shared mental models .97 .10 .38
14. Knowledge sharing .93 -.01 -.05
15. Shared leadership .97 .07 .29 Note. wg(j) = mean interrater agreement; ICC(1) = intraclass correlations ( individual rater reliability); ICC(2) = intraclass correlations (group mean rating reliability).
Table 2; Interrater agreement and reliability.
23
The ICC(2) value provides a measure of group mean reliability and thus indicates whether groups
vary in meaningful ways on the variables of interest. According to LeBreton and Senter (2008) the
minimal acceptable level for ICC(2) values is .70. It can be seen in Table 2 that all ICC(2) values are
below .70, which indicates that the group mean reliability is low, meaning that the different teams
have fairly similar teamwork factor scores. This may be due to restriction of range, which can occur
when a rating system, such as the 5-point Likert scale used in this study, is applied to a new
population (Halgren, 2012). The fact that teams have fairly similar teamwork factor scores, may limit
our ability to detect significant group-level teamwork factor effects in the subsequent analyses
(Ehrhart, Bliese, & Thomas, 2006). On the other hand, this also means that identified significant
effects are truly meaningful.
3.2.4 Data analyses
Different data analysis techniques were used to test the hypotheses.
3.2.4.1 Correlation analyses
First, a correlation table was created to get a general overview of the relations between the different
variables in our model. Since the dataset is small (N=16), it was decided to use Spearman’s
correlation coefficient rs. Spearman’s correlation coefficient is namely a non-parametric statistic and
so can be used when the data have violated parametric assumptions such as non-normally
distributed data (Field, 2009). Although all hypotheses are directional, which normally would result
in the use of a one-tailed test (Field, 2009), we decided to make use of a two-tailed test. Kimmel
(1957) argued that a one-tailed test should only be used when results in the unpredicted direction
are absolutely impossible. Since this study is about psychological constructs such as teamwork
factors, it is impossible to state that teamwork factors and Scrum project success dimensions can
only have a positive relationship or no relationship at all. There is always a possibility that a certain
teamwork factor, contrary to expectations, is negatively related to Scrum project success.
Therefore, for this study, a two-tailed test was preferred. Besides non-parametric correlations,
scatterplots with regression lines were used to provide insight into the relationships between the
study variables.
3.2.4.2 Hierarchical regression analysis
Then, we made use of hierarchical regression analysis to determine the relationship between
multiple independent variables (teamwork factors) and the dependent variables (Scrum project
success dimensions) and to examine the relative predictive importance of the independent variables.
We used the forced entry method in which we entered all independent variables that had a
significant correlation with the dependent variable.
3.2.4.3 Discussion session
In order to be able to develop concrete recommendations for TomTom in Eindhoven, after the
results had been analyzed, a discussion session was held with Scrum masters of fourteen Scrum
teams. Two of the sixteen Scrum teams were not invited for the discussion session, because it was
already hard to find a date on which the Scrum masters of the remaining fourteen Scrum teams
could be present. Two weeks before the discussion session, an overview was created which
presented the average team scores of each team on every teamwork factor that significantly,
positively correlated with at least one Scrum project success dimension or Overall Scrum project
success in general (see Appendix IV). For clarity, the three lowest scoring teams on each teamwork
24
factor were colored in red, and the three highest scoring teams on each teamwork factor were
colored in green. Then, this overview was sent to all participating Scrum masters via an e-mail, in
which the purpose of the discussion meeting and the mandatory preparations were explained. The
one-hour long discussion meeting consisted of two exercises. The first exercise only focused on the
teamwork factors Backup behavior and Mutual trust, since they were two of the five teamwork
factors that were significantly related to Overall Scrum project success. Furthermore, the team score
overview created for the discussion session showed that due to equal scores, not six, but seven
teams scored one of the three lowest or highest scores on these teamwork factors. Therefore, by
focusing on these two teamwork factors, the highest amount of Scrum masters’ views could be
shared. First, the three Scrum masters of the teams with the three lowest scores on these teamwork
factors gave their view on what possibly could cause their low score and consequently came up with
their ideas for improvement. Then, the three Scrum masters of the teams with the three highest
scores gave their view on what possibly could cause their high score. After that, the second exercise
was focused on all teamwork factors having significant, positive correlations with any Scrum project
success dimension. The Scrum masters of the five teams that scored best overall were asked to
share their views on what could have caused their relatively high team scores. By sharing
experiences regarding teamwork factors related to Scrum project success, Scrum masters could
learn from each other and gain new ideas about how to deal with teamwork factors in their own
teams. Besides that, the information obtained in the discussion session was used to formulate
concrete recommendations for TomTom about how Scrum project success at TomTom could be
further improved by means of teamwork factors.
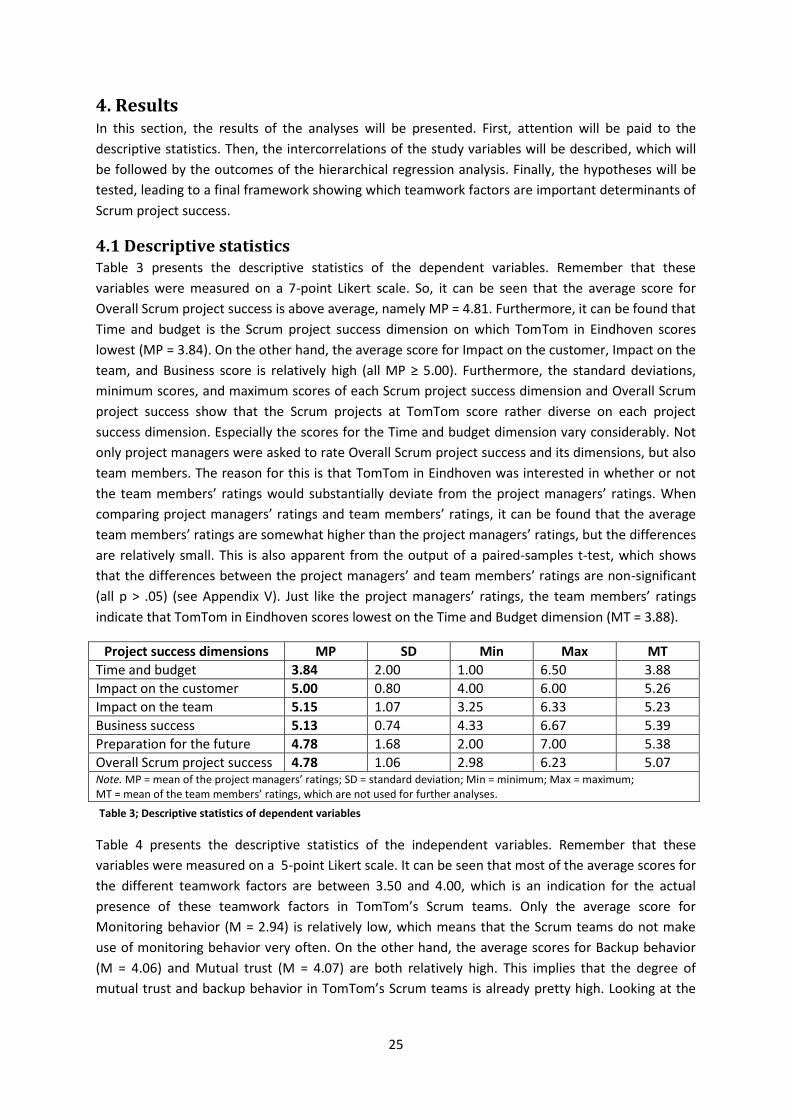
25
4. Results In this section, the results of the analyses will be presented. First, attention will be paid to the
descriptive statistics. Then, the intercorrelations of the study variables will be described, which will
be followed by the outcomes of the hierarchical regression analysis. Finally, the hypotheses will be
tested, leading to a final framework showing which teamwork factors are important determinants of
Scrum project success.
4.1 Descriptive statistics Table 3 presents the descriptive statistics of the dependent variables. Remember that these
variables were measured on a 7-point Likert scale. So, it can be seen that the average score for
Overall Scrum project success is above average, namely MP = 4.81. Furthermore, it can be found that
Time and budget is the Scrum project success dimension on which TomTom in Eindhoven scores
lowest (MP = 3.84). On the other hand, the average score for Impact on the customer, Impact on the
team, and Business score is relatively high (all MP ≥ 5.00). Furthermore, the standard deviations,
minimum scores, and maximum scores of each Scrum project success dimension and Overall Scrum
project success show that the Scrum projects at TomTom score rather diverse on each project
success dimension. Especially the scores for the Time and budget dimension vary considerably. Not
only project managers were asked to rate Overall Scrum project success and its dimensions, but also
team members. The reason for this is that TomTom in Eindhoven was interested in whether or not
the team members’ ratings would substantially deviate from the project managers’ ratings. When
comparing project managers’ ratings and team members’ ratings, it can be found that the average
team members’ ratings are somewhat higher than the project managers’ ratings, but the differences
are relatively small. This is also apparent from the output of a paired-samples t-test, which shows
that the differences between the project managers’ and team members’ ratings are non-significant
(all p > .05) (see Appendix V). Just like the project managers’ ratings, the team members’ ratings
indicate that TomTom in Eindhoven scores lowest on the Time and Budget dimension (MT = 3.88).
Project success dimensions MP SD Min Max MT
Time and budget 3.84 2.00 1.00 6.50 3.88
Impact on the customer 5.00 0.80 4.00 6.00 5.26
Impact on the team 5.15 1.07 3.25 6.33 5.23
Business success 5.13 0.74 4.33 6.67 5.39
Preparation for the future 4.78 1.68 2.00 7.00 5.38
Overall Scrum project success 4.78 1.06 2.98 6.23 5.07 Note. MP = mean of the project managers’ ratings; SD = standard deviation; Min = minimum; Max = maximum; MT = mean of the team members’ ratings, which are not used for further analyses.
Table 4 presents the descriptive statistics of the independent variables. Remember that these
variables were measured on a 5-point Likert scale. It can be seen that most of the average scores for
the different teamwork factors are between 3.50 and 4.00, which is an indication for the actual
presence of these teamwork factors in TomTom’s Scrum teams. Only the average score for
Monitoring behavior (M = 2.94) is relatively low, which means that the Scrum teams do not make
use of monitoring behavior very often. On the other hand, the average scores for Backup behavior
(M = 4.06) and Mutual trust (M = 4.07) are both relatively high. This implies that the degree of
mutual trust and backup behavior in TomTom’s Scrum teams is already pretty high. Looking at the
Table 3; Descriptive statistics of dependent variables
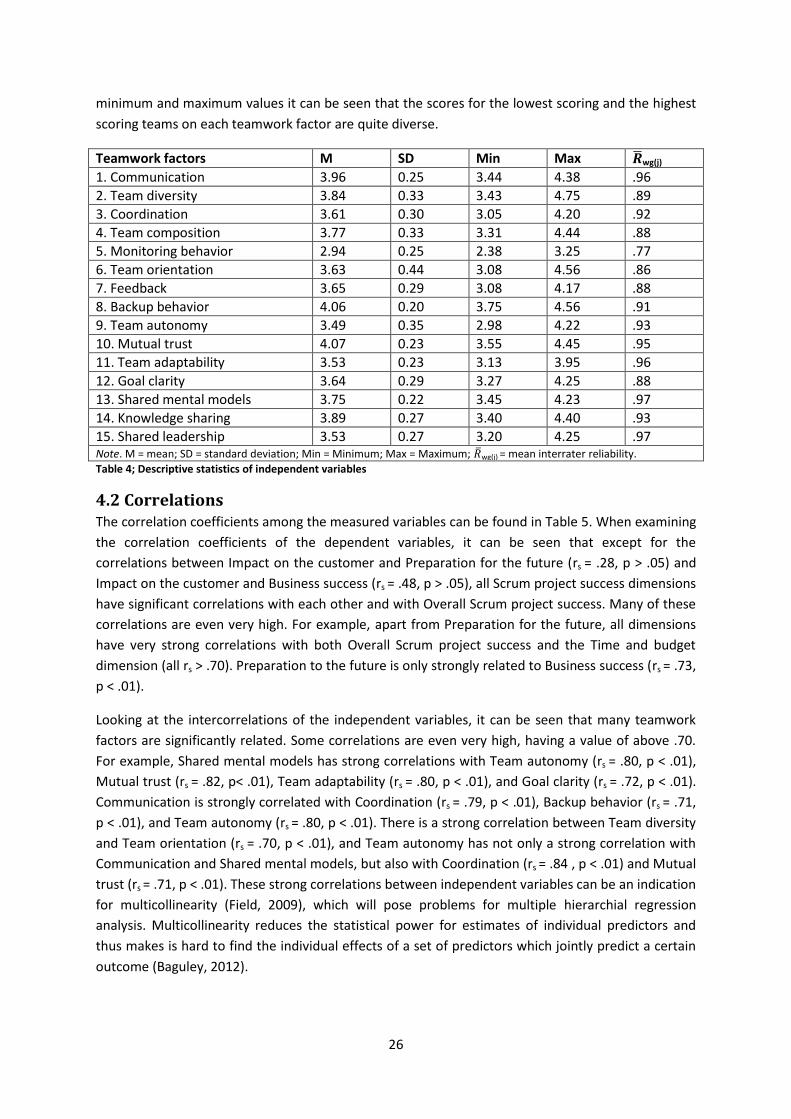
26
minimum and maximum values it can be seen that the scores for the lowest scoring and the highest
scoring teams on each teamwork factor are quite diverse.
Teamwork factors M SD Min Max wg(j)
1. Communication 3.96 0.25 3.44 4.38 .96
2. Team diversity 3.84 0.33 3.43 4.75 .89
3. Coordination 3.61 0.30 3.05 4.20 .92
4. Team composition 3.77 0.33 3.31 4.44 .88
5. Monitoring behavior 2.94 0.25 2.38 3.25 .77
6. Team orientation 3.63 0.44 3.08 4.56 .86
7. Feedback 3.65 0.29 3.08 4.17 .88
8. Backup behavior 4.06 0.20 3.75 4.56 .91
9. Team autonomy 3.49 0.35 2.98 4.22 .93
10. Mutual trust 4.07 0.23 3.55 4.45 .95
11. Team adaptability 3.53 0.23 3.13 3.95 .96
12. Goal clarity 3.64 0.29 3.27 4.25 .88
13. Shared mental models 3.75 0.22 3.45 4.23 .97
14. Knowledge sharing 3.89 0.27 3.40 4.40 .93
15. Shared leadership 3.53 0.27 3.20 4.25 .97 Note. M = mean; SD = standard deviation; Min = Minimum; Max = Maximum; wg(j) = mean interrater reliability.
Table 4; Descriptive statistics of independent variables
4.2 Correlations The correlation coefficients among the measured variables can be found in Table 5. When examining
the correlation coefficients of the dependent variables, it can be seen that except for the
correlations between Impact on the customer and Preparation for the future (rs = .28, p > .05) and
Impact on the customer and Business success (rs = .48, p > .05), all Scrum project success dimensions
have significant correlations with each other and with Overall Scrum project success. Many of these
correlations are even very high. For example, apart from Preparation for the future, all dimensions
have very strong correlations with both Overall Scrum project success and the Time and budget
dimension (all rs > .70). Preparation to the future is only strongly related to Business success (rs = .73,
p < .01).
Looking at the intercorrelations of the independent variables, it can be seen that many teamwork
factors are significantly related. Some correlations are even very high, having a value of above .70.
For example, Shared mental models has strong correlations with Team autonomy (rs = .80, p < .01),
Mutual trust (rs = .82, p< .01), Team adaptability (rs = .80, p < .01), and Goal clarity (rs = .72, p < .01).
Communication is strongly correlated with Coordination (rs = .79, p < .01), Backup behavior (rs = .71,
p < .01), and Team autonomy (rs = .80, p < .01). There is a strong correlation between Team diversity
and Team orientation (rs = .70, p < .01), and Team autonomy has not only a strong correlation with
Communication and Shared mental models, but also with Coordination (rs = .84 , p < .01) and Mutual
trust (rs = .71, p < .01). These strong correlations between independent variables can be an indication
for multicollinearity (Field, 2009), which will pose problems for multiple hierarchial regression
analysis. Multicollinearity reduces the statistical power for estimates of individual predictors and
thus makes is hard to find the individual effects of a set of predictors which jointly predict a certain
outcome (Baguley, 2012).
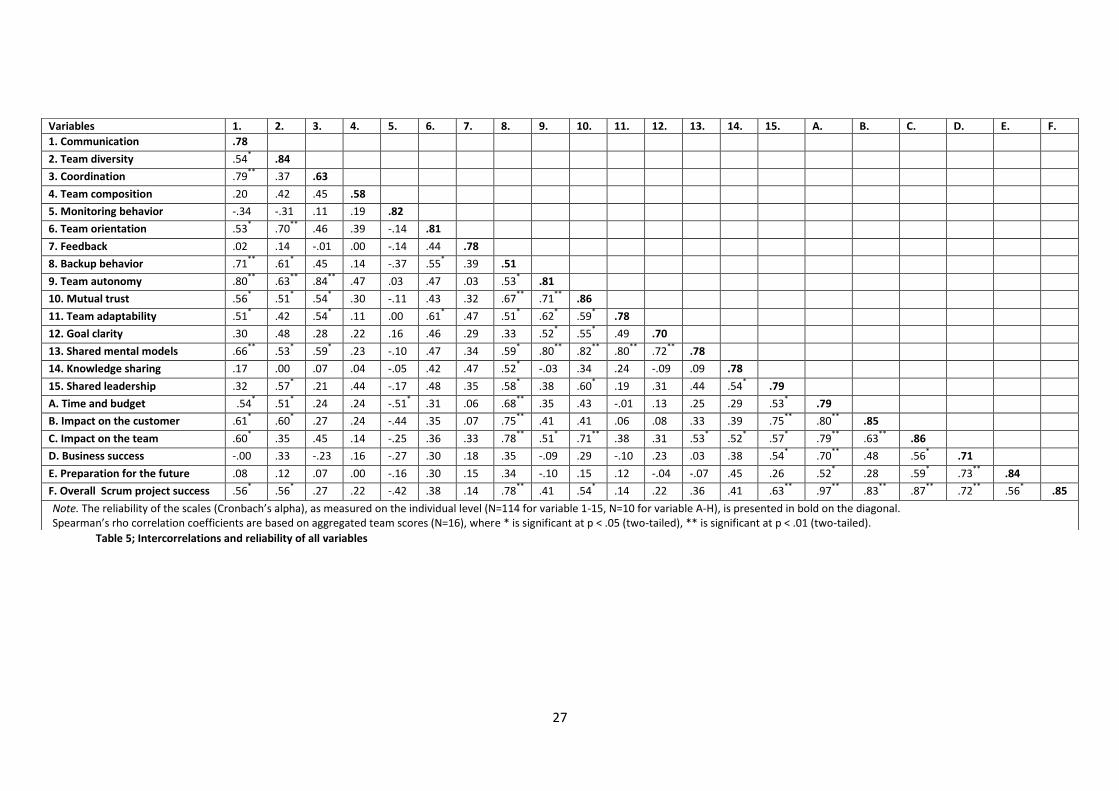
27
Table 5; Intercorrelations and reliability of all variables
Variables 1. 2. 3. 4. 5. 6. 7. 8. 9. 10. 11. 12. 13. 14. 15. A. B. C. D. E. F.
1. Communication .78
2. Team diversity .54*
.84
3. Coordination .79**
.37 .63
4. Team composition .20 .42 .45
.58
5. Monitoring behavior -.34 -.31 .11 .19 .82
6. Team orientation .53*
.70**
.46
.39 -.14 .81
7. Feedback .02 .14 -.01 .00 -.14 .44
.78
8. Backup behavior .71**
.61* .45
.14 -.37 .55
* .39 .51
9. Team autonomy .80**
.63**
.84**
.47
.03 .47 .03 .53* .81
10. Mutual trust .56*
.51* .54
* .30 -.11 .43
.32 .67
** .71
** .86
11. Team adaptability .51*
.42 .54* .11 .00 .61
* .47
.51
* .62
* .59
* .78
12. Goal clarity .30 .48
.28 .22 .16 .46
.29 .33 .52* .55
* .49
.70
13. Shared mental models .66**
.53* .59
* .23 -.10 .47
.34 .59
* .80
** .82
** .80
** .72
** .78
14. Knowledge sharing .17 .00 .07 .04 -.05 .42 .47
.52* -.03 .34 .24 -.09 .09 .78
15. Shared leadership .32 .57* .21 .44
-.17 .48
.35 .58
* .38 .60
* .19 .31 .44
.54
* .79
A. Time and budget .54* .51
* .24 .24 -.51
* .31 .06 .68
** .35 .43 -.01 .13 .25 .29 .53
* .79
B. Impact on the customer .61* .60
* .27 .24 -.44 .35 .07 .75
** .41 .41 .06 .08 .33 .39 .75
** .80
** .85
C. Impact on the team .60* .35 .45 .14 -.25 .36 .33 .78
** .51
* .71
** .38 .31 .53
* .52
* .57
* .79
** .63
** .86
D. Business success -.00 .33 -.23 .16 -.27 .30 .18 .35 -.09 .29 -.10 .23 .03 .38 .54*
.70**
.48
.56* .71
E. Preparation for the future .08 .12 .07 .00 -.16 .30 .15 .34 -.10 .15 .12 -.04 -.07 .45
.26 .52* .28 .59
* .73
** .84
F. Overall Scrum project success .56* .56
* .27 .22 -.42 .38 .14 .78
** .41 .54
* .14 .22 .36 .41 .63
** .97
** .83
** .87
** .72
** .56
* .85
Note. The reliability of the scales (Cronbach’s alpha), as measured on the individual level (N=114 for variable 1-15, N=10 for variable A-H), is presented in bold on the diagonal. Spearman’s rho correlation coefficients are based on aggregated team scores (N=16), where * is significant at p < .05 (two-tailed), ** is significant at p < .01 (two-tailed).
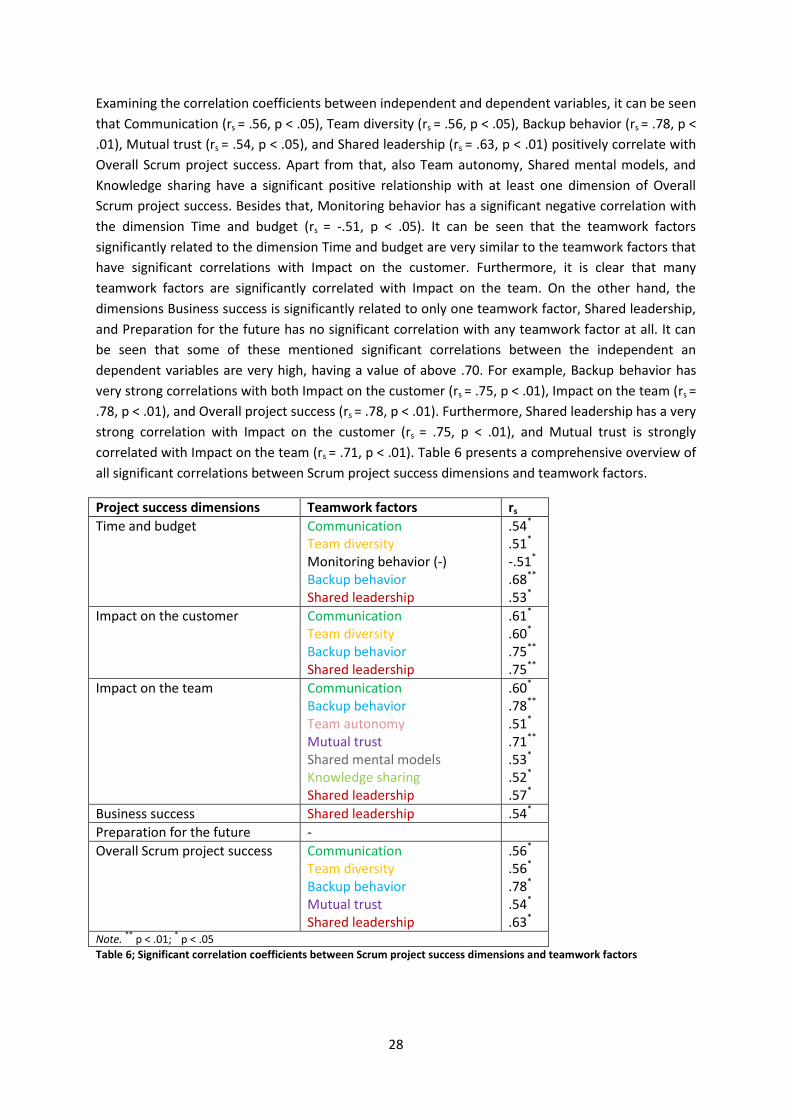
28
Examining the correlation coefficients between independent and dependent variables, it can be seen
that Communication (rs = .56, p < .05), Team diversity (rs = .56, p < .05), Backup behavior (rs = .78, p <
.01), Mutual trust (rs = .54, p < .05), and Shared leadership (rs = .63, p < .01) positively correlate with
Overall Scrum project success. Apart from that, also Team autonomy, Shared mental models, and
Knowledge sharing have a significant positive relationship with at least one dimension of Overall
Scrum project success. Besides that, Monitoring behavior has a significant negative correlation with
the dimension Time and budget (rs = -.51, p < .05). It can be seen that the teamwork factors
significantly related to the dimension Time and budget are very similar to the teamwork factors that
have significant correlations with Impact on the customer. Furthermore, it is clear that many
teamwork factors are significantly correlated with Impact on the team. On the other hand, the
dimensions Business success is significantly related to only one teamwork factor, Shared leadership,
and Preparation for the future has no significant correlation with any teamwork factor at all. It can
be seen that some of these mentioned significant correlations between the independent an
dependent variables are very high, having a value of above .70. For example, Backup behavior has
very strong correlations with both Impact on the customer (rs = .75, p < .01), Impact on the team (rs =
.78, p < .01), and Overall project success (rs = .78, p < .01). Furthermore, Shared leadership has a very
strong correlation with Impact on the customer (rs = .75, p < .01), and Mutual trust is strongly
correlated with Impact on the team (rs = .71, p < .01). Table 6 presents a comprehensive overview of
all significant correlations between Scrum project success dimensions and teamwork factors.
Project success dimensions Teamwork factors rs
Time and budget Communication Team diversity Monitoring behavior (-) Backup behavior Shared leadership
.54*
.51* -.51*
.68**
.53*
Impact on the customer Communication Team diversity Backup behavior Shared leadership
.61*
.60*
.75**
.75**
Impact on the team Communication Backup behavior Team autonomy Mutual trust Shared mental models Knowledge sharing Shared leadership
.60*
.78**
.51*
.71**
.53*
.52*
.57*
Business success Shared leadership .54*
Preparation for the future -
Overall Scrum project success Communication Team diversity Backup behavior Mutual trust Shared leadership
.56*
.56*
.78*
.54*
.63* Note.
** p < .01;
* p < .05
Table 6; Significant correlation coefficients between Scrum project success dimensions and teamwork factors
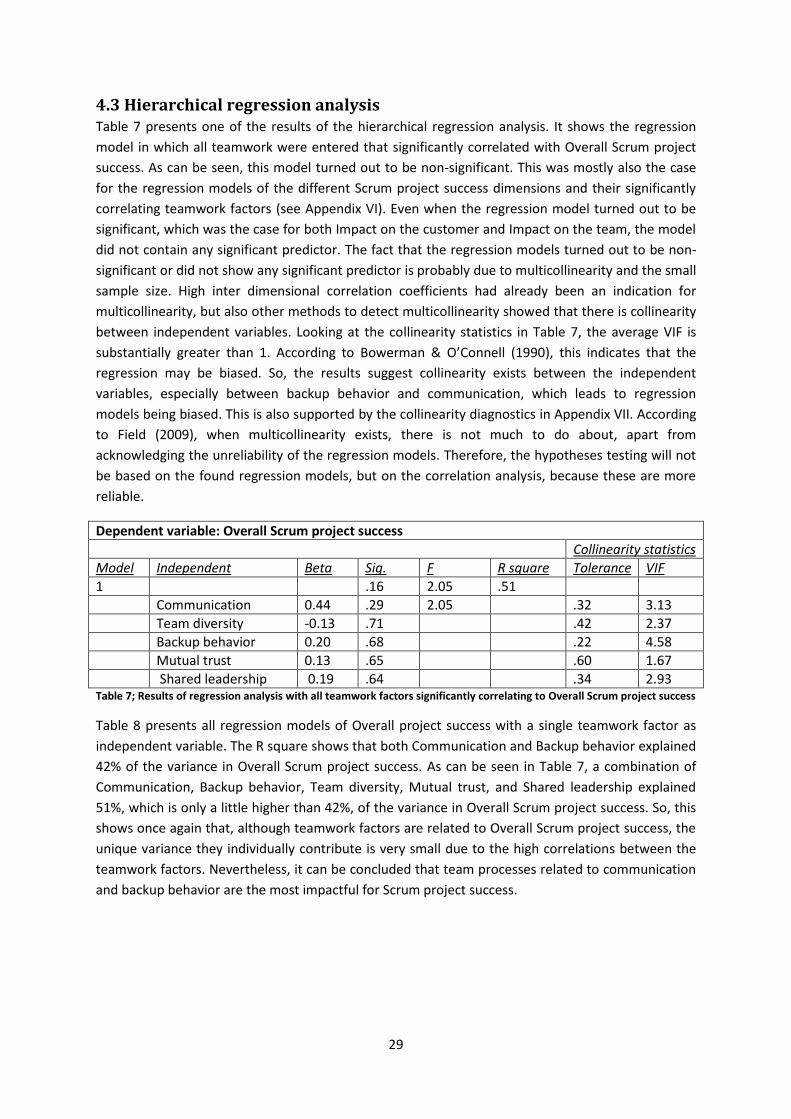
29
4.3 Hierarchical regression analysis Table 7 presents one of the results of the hierarchical regression analysis. It shows the regression
model in which all teamwork were entered that significantly correlated with Overall Scrum project
success. As can be seen, this model turned out to be non-significant. This was mostly also the case
for the regression models of the different Scrum project success dimensions and their significantly
correlating teamwork factors (see Appendix VI). Even when the regression model turned out to be
significant, which was the case for both Impact on the customer and Impact on the team, the model
did not contain any significant predictor. The fact that the regression models turned out to be non-
significant or did not show any significant predictor is probably due to multicollinearity and the small
sample size. High inter dimensional correlation coefficients had already been an indication for
multicollinearity, but also other methods to detect multicollinearity showed that there is collinearity
between independent variables. Looking at the collinearity statistics in Table 7, the average VIF is
substantially greater than 1. According to Bowerman & O’Connell (1990), this indicates that the
regression may be biased. So, the results suggest collinearity exists between the independent
variables, especially between backup behavior and communication, which leads to regression
models being biased. This is also supported by the collinearity diagnostics in Appendix VII. According
to Field (2009), when multicollinearity exists, there is not much to do about, apart from
acknowledging the unreliability of the regression models. Therefore, the hypotheses testing will not
be based on the found regression models, but on the correlation analysis, because these are more
reliable.
Dependent variable: Overall Scrum project success
Collinearity statistics
Model Independent Beta Sig. F R square Tolerance VIF
1 .16 2.05 .51
Communication 0.44 .29 2.05 .32 3.13
Team diversity -0.13 .71 .42 2.37
Backup behavior 0.20 .68 .22 4.58
Mutual trust 0.13 .65 .60 1.67
Shared leadership 0.19 .64 .34 2.93 Table 7; Results of regression analysis with all teamwork factors significantly correlating to Overall Scrum project success
Table 8 presents all regression models of Overall project success with a single teamwork factor as
independent variable. The R square shows that both Communication and Backup behavior explained
42% of the variance in Overall Scrum project success. As can be seen in Table 7, a combination of
Communication, Backup behavior, Team diversity, Mutual trust, and Shared leadership explained
51%, which is only a little higher than 42%, of the variance in Overall Scrum project success. So, this
shows once again that, although teamwork factors are related to Overall Scrum project success, the
unique variance they individually contribute is very small due to the high correlations between the
teamwork factors. Nevertheless, it can be concluded that team processes related to communication
and backup behavior are the most impactful for Scrum project success.
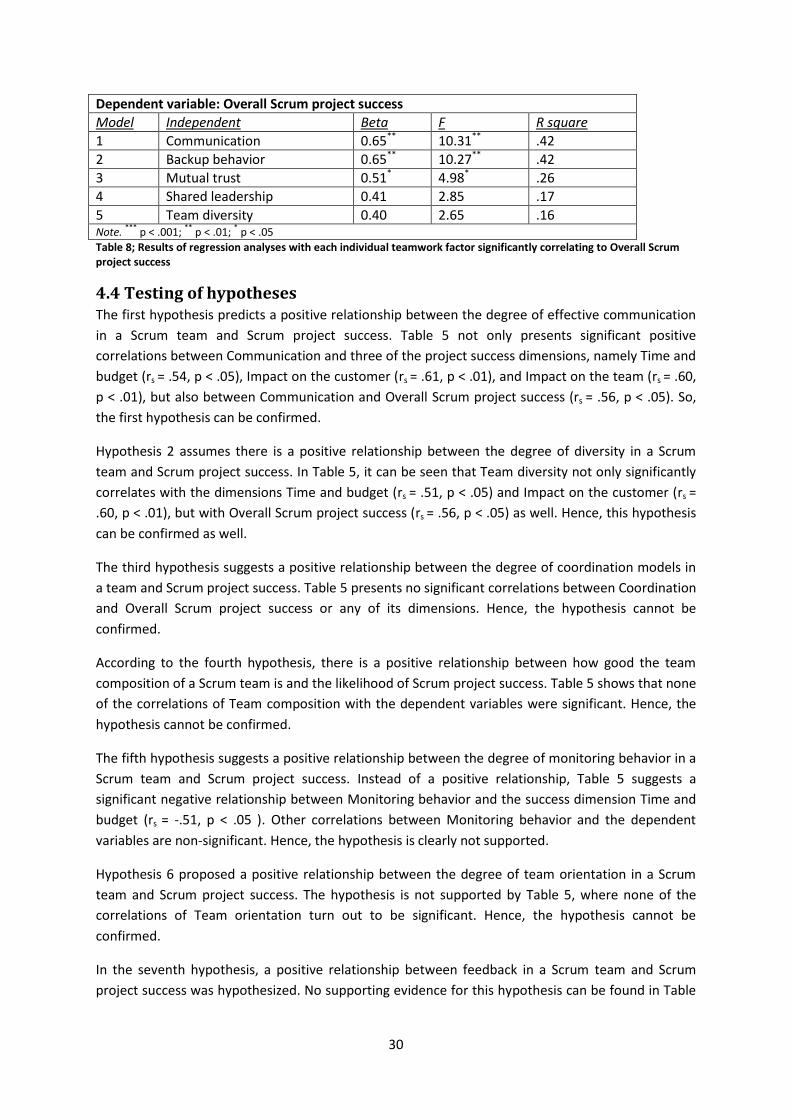
30
Dependent variable: Overall Scrum project success
Model Independent Beta F R square
1 Communication 0.65** 10.31** .42
2 Backup behavior 0.65** 10.27** .42
3 Mutual trust 0.51* 4.98* .26
4 Shared leadership 0.41 2.85 .17
5 Team diversity 0.40 2.65 .16 Note.
*** p < .001;
** p < .01;
* p < .05
Table 8; Results of regression analyses with each individual teamwork factor significantly correlating to Overall Scrum project success
4.4 Testing of hypotheses The first hypothesis predicts a positive relationship between the degree of effective communication
in a Scrum team and Scrum project success. Table 5 not only presents significant positive
correlations between Communication and three of the project success dimensions, namely Time and
budget (rs = .54, p < .05), Impact on the customer (rs = .61, p < .01), and Impact on the team (rs = .60,
p < .01), but also between Communication and Overall Scrum project success (rs = .56, p < .05). So,
the first hypothesis can be confirmed.
Hypothesis 2 assumes there is a positive relationship between the degree of diversity in a Scrum
team and Scrum project success. In Table 5, it can be seen that Team diversity not only significantly
correlates with the dimensions Time and budget (rs = .51, p < .05) and Impact on the customer (rs =
.60, p < .01), but with Overall Scrum project success (rs = .56, p < .05) as well. Hence, this hypothesis
can be confirmed as well.
The third hypothesis suggests a positive relationship between the degree of coordination models in
a team and Scrum project success. Table 5 presents no significant correlations between Coordination
and Overall Scrum project success or any of its dimensions. Hence, the hypothesis cannot be
confirmed.
According to the fourth hypothesis, there is a positive relationship between how good the team
composition of a Scrum team is and the likelihood of Scrum project success. Table 5 shows that none
of the correlations of Team composition with the dependent variables were significant. Hence, the
hypothesis cannot be confirmed.
The fifth hypothesis suggests a positive relationship between the degree of monitoring behavior in a
Scrum team and Scrum project success. Instead of a positive relationship, Table 5 suggests a
significant negative relationship between Monitoring behavior and the success dimension Time and
budget (rs = -.51, p < .05 ). Other correlations between Monitoring behavior and the dependent
variables are non-significant. Hence, the hypothesis is clearly not supported.
Hypothesis 6 proposed a positive relationship between the degree of team orientation in a Scrum
team and Scrum project success. The hypothesis is not supported by Table 5, where none of the
correlations of Team orientation turn out to be significant. Hence, the hypothesis cannot be
confirmed.
In the seventh hypothesis, a positive relationship between feedback in a Scrum team and Scrum
project success was hypothesized. No supporting evidence for this hypothesis can be found in Table
31
5, because all correlations of Feedback turn out to be non-significant. So, once again, the hypothesis
cannot be confirmed.
Hypothesis 8 suggests a positive relationship between the degree of backup behavior in a Scrum
team and Scrum project success. Table 5 shows that Backup behavior is not only significantly related
to Time and budget (rs = .68, p < .01) , Impact on the customer (rs = .75, p < .01), and Impact on the
team (rs = .78, p < .01), but also to Overall Scrum project success (rs = .78, p < .01). So, the hypothesis
can be confirmed.
The ninth hypothesis says there is a positive relationship between the degree of team autonomy in a
Scrum team and Scrum project success. Although Table 5 shows that Team autonomy and Impact on
the team are significantly correlated (rs = .51, p < .05), other correlations of Team autonomy are non-
significant. Therefore, the hypothesis can only partially be confirmed.
The tenth hypothesis is about a positive relationship between the degree of mutual trust in a Scrum
team and Scrum project success. Table 5 presents not only a positive significant correlation between
Mutual trust and Impact on the team (rs = .71, p < .01), but also between Mutual trust and Overall
Scrum project success (rs = .54, p < .05). Therefore, the hypothesis can be confirmed.
According to the eleventh hypothesis, there is a positive relationship between the adaptability of a
Scrum team and Scrum project success. No supporting evidence for this hypothesis can be found in
Table 5, because all correlations of Team adaptability turn out to be non-significant. So, the
hypothesis cannot be confirmed.
Hypothesis 12 expects a positive relationship between the degree of goal clarity in a Scrum team and
Scrum project success. Again, no supporting evidence for this hypothesis can be found in Table 5.
None of the correlations of Goal clarity are significant. Therefore, the hypothesis cannot be
confirmed.
The thirteenth hypothesis suggests a positive relationship between the degree of shared mental
models in a Scrum team and Scrum project success. Although Table 5 presents a significant
relationship between Shared mental models and Impact on the team (rs = .53, p < .05), Shared
mental models has no other significant correlations. This means that the hypothesis can only
partially be confirmed.
The fourteenth hypothesis states that the degree of knowledge sharing in a Scrum has a positive
relationship with Scrum project success. Although Table 5 shows that Knowledge sharing
significantly correlates with Impact on the team (rs = .52, p < .05), the correlation between
Knowledge sharing and Overall Scrum project success turns out to be non-significant (rs = .41, p >
.05). Therefore, the hypothesis can only partially be confirmed.
Finally, the last hypothesis, which suggests a positive relationship between the degree of shared
leadership in a Scrum team and Scrum project success, is supported by Table 5. Shared leadership is
namely not only significantly correlated with Time and budget (rs = .53, p < .05), Impact on the
customer (rs = .75, p < .01), Impact on the team (rs = .57, p < .05), and Business success (rs = .54, p <
.05), but also with Overall Scrum project success (rs = .63, p < .01). Hence, the hypothesis can be
confirmed.
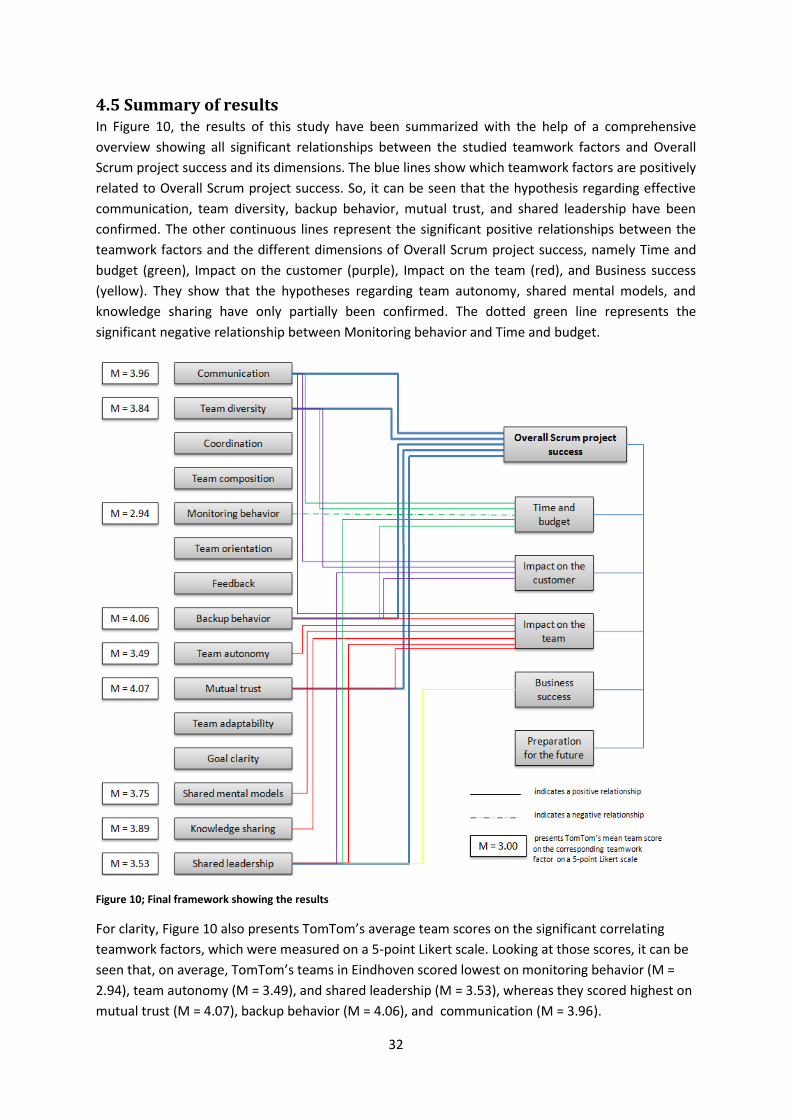
32
4.5 Summary of results In Figure 10, the results of this study have been summarized with the help of a comprehensive
overview showing all significant relationships between the studied teamwork factors and Overall
Scrum project success and its dimensions. The blue lines show which teamwork factors are positively
related to Overall Scrum project success. So, it can be seen that the hypothesis regarding effective
communication, team diversity, backup behavior, mutual trust, and shared leadership have been
confirmed. The other continuous lines represent the significant positive relationships between the
teamwork factors and the different dimensions of Overall Scrum project success, namely Time and
budget (green), Impact on the customer (purple), Impact on the team (red), and Business success
(yellow). They show that the hypotheses regarding team autonomy, shared mental models, and
knowledge sharing have only partially been confirmed. The dotted green line represents the
significant negative relationship between Monitoring behavior and Time and budget.
Figure 10; Final framework showing the results
For clarity, Figure 10 also presents TomTom’s average team scores on the significant correlating
teamwork factors, which were measured on a 5-point Likert scale. Looking at those scores, it can be
seen that, on average, TomTom’s teams in Eindhoven scored lowest on monitoring behavior (M =
2.94), team autonomy (M = 3.49), and shared leadership (M = 3.53), whereas they scored highest on
mutual trust (M = 4.07), backup behavior (M = 4.06), and communication (M = 3.96).
33
5. Conclusion and discussion In this section, the main research question will be answered and the conclusions of this research will
be presented. Besides that, the findings of the study will be discussed, the limitations of the study
will be explained, and ideas for future research will be proposed.
5.1 Conclusion The aim of this study was to investigate which teamwork factors determine Scrum project success.
Based on interviews with employees working at TomTom in Eindhoven, observations, and a
literature study, fifteen relational hypotheses were formulated about the positive relationship
between fifteen selected teamwork factors (communication, team diversity, coordination, team
composition, monitoring behavior, team orientation, feedback, backup behavior, team autonomy,
mutual trust, team adaptability, goal clarity, shared mental models, knowledge sharing, and shared
leadership) and Overall Scrum project success, which covers five dimensions (time and budget,
impact on the customer, impact on the team, business success, and preparation for the future).
These hypotheses were visualized by the conceptual model presented in Figure 9. Then, the
conceptual framework was tested with the help of a survey study, resulting in the final framework
displayed in Figure 10, which shows all found significant relationships between the teamwork factors
and Overall Scrum project success and its dimensions. Because the survey study only does not
provide any hard evidence for the causality of these relationship, it cannot simply be stated that a
high degree of certain teamwork factors leads to Scrum project success. The survey study is
relational, not causal. The causality of the relationship could also be reversed. However, not only
taking into account the survey study results, but also the findings from literature, provides a
foundation that is solid enough to conclude that the teamwork factors significantly and positively
correlating to Overall Scrum project success or any of its dimensions, can be regarded as important
determinants of Scrum project success.
Hence, based on this study it can be concluded that the degree of effective communication, informal
team diversity, mutual trust, and shared leadership are all important determinants of Scrum project
success, since they not only positively impact Overall Scrum project success, but also at least one
specific Scrum project success dimension. So, the higher the degree of these teamwork factors in the
Scrum team, the more likely becomes Scrum project success. Besides that, it can be concluded that
the degree of team autonomy, shared mental models, and knowledge sharing in a Scrum team are
important determinants of Scrum project success as well, since they have a positively impact on the
team. Somewhat surprisingly, monitoring behavior turned out to be significantly and negatively
related to time and budget aspects of Overall Scrum project success. Furthermore, it can be
concluded that teamwork factors have mainly impact on the short-term dimensions of Scrum project
success. The long-term dimension, preparation for the future, does not seem to be determined by
teamwork factors. Besides that, it is found that the teamwork factors which have an effect on the
time and budget aspects of Overall Scrum project success are mostly the same as those having
impact on the customer aspects.
5.2 Discussion That communication, team diversity, backup behavior, mutual trust, and shared leadership would be
identified as teamwork factors significantly and positively related to Overall Scrum project success
was not a surprise. These results are completely in line with the findings of the literature study.
34
Effective communication was always regarded as the mechanism that connects other components of
teamwork (Dickinson & McIntyre, 1997; Hoegl & Gemuenden, 2001; Salas et al., 2005), and was
considered as one of the main factors for agile practices to succeed (Ambler, 2005). Our findings also
demonstrate the importance of effective communication. The degree to which there is frequent
communication within the Scrum team, information is openly shared by all team members, team
members directly and personally communicate with each other, and team members are happy with
the timeliness, precision, and usefulness of the communication within the team, is positively related
to Overall Scrum project success.
Informational team diversity was argued to positively influence project performance (Glick et al.,
1993; Mac Cormack et al., 2001; Nonaka & Takeuchi, 1995), and was said to be especially important
in an ASD environment (Nerur & Balijepally, 2007). This is also apparent from our findings, which
indicate that Overall Scrum project success is positively related to the extent to which team
members in a Scrum team are from different areas of expertise, vary in functional backgrounds,
have skills that complement each other, and have a variety of different experiences.
Furthermore, our findings show the importance of backup behavior in Scrum projects. The degree to
which team members provide assistance to other members, seek opportunities to aid other
members, and fill in for other members who are unable to perform a task is positively related to
Overall Scrum project success. In literature, backup behavior was also said to be needed in ASD
teams to enable team performance (Dingsøyr and Lindsjørn, 2013).
Robin and Sharp (2004) argued that mutual trust was a requirement for ASD teams to be successful.
This is in line with the findings of this study, which demonstrate that the extent to which Scrum team
members trust each other, expect the complete truth from each other, and show integrity is
positively related to Overall project success.
Shared leadership was said to be especially important for the performance of self-managing teams,
such as Scrum teams (Morgan, 2006). The importance of shared leadership in Scrum projects is also
apparent from our findings, which show that the extent to which team members provide each other
emotional support, are regarded as equals by others, learn important skills from each other, and
jointly complete tasks, is positively related to Overall Scrum project success.
That team autonomy, shared mental models, and knowledge sharing turn out to be significantly and
positively related to Scrum project success, albeit only in terms of their impact on the team, could
also be expected on basis of the literature study. Sethi (2000) argued that team autonomy has a
positive influence on team members and the successful completion of their projects. In line with
this, the found positive relationship between team autonomy and impact on the team might suggest
that if a Scrum team has control over what it is supposed to accomplish and can decide how and
when to do it, this has a positive influence on the team’s satisfaction and motivation, loyalty, team
member growth, and team member retention.
Moe et al. (2010) stressed that shared mental models are crucial for effective teamwork, and Park
(2008) showed that shared mental models have a positive impact on team satisfaction. Therefore,
the found positive relationship between shared mental models and the impact on the team may
imply that if Scrum team members highly agree or have similar thoughts about task-related, team-
related, and time-related aspects of the Scrum project, this will have a positive influence on Scrum
35
project success, since team satisfaction and motivation, loyalty, team member growth, and team
member retention will be increased.
Furthermore, Srivastava et al. (2006) found that knowledge sharing has impact on the team and its
performance. So, the positive relationship between knowledge sharing and impact on the team may
imply that the more Scrum team members proficiently exchange and combine ideas with each other,
are willing to share knowledge, and see the benefits of exchanging and combining ideas, the higher
the degree of team satisfaction, motivation, and loyalty, team member growth and team member
retention will be.
What was not expected was the negative significant relationship between monitoring behavior and
the time and budget dimension of Scrum project success. Based on Pinto and Slevin (1987), who
identified monitoring behavior as one of the ten main project success factors, we expected a positive
relationship instead of a negative one. An explanation for this unexpected finding may be found in
reversed causation. The significant negative relationship between monitoring behavior and Scrum
project in terms of time and budget might suggest that if a project runs out of time and budget, this
is a reason for a Scrum team to increase the degree of monitoring behavior in their team. By
exhibiting more monitoring behavior, such as checking whether everyone meets their obligations to
the team and monitoring other team members’ progress on their work, the Scrum team tries to
ensure the project will not get further out of hand.
Although we expected coordination, team composition, team orientation, feedback, team
adaptability and goal clarity to be positively related to Scrum project success, in this study, these
teamwork factors did not emerge as important determinants of Scrum project success. However, it
can be argued that coordination affects Scrum project success in an indirect way. Coordination is
namely strongly related with communication and team autonomy, which are both important
determinants of Scrum project success. It may be possible, for example, that to reach and keep a
high degree of coordination in the Scrum, a high degree of effective communication is needed. This
increased degree of communication will consequently have a positive impact on Scrum project
success. So indirectly, the high degree of coordination positively affects Scrum project success as
well. The same applies to team adaptability and goal clarity, which are both strongly related to
shared mental models, and can therefore be assumed to impact Scrum project success indirectly by
adding to a team’s shared mental models.
Furthermore, it is notable that the teamwork factors which significantly correlate to the dimension
Time and budget are, apart from monitoring behavior, completely similar to the teamwork factors
significantly correlating to the Impact on the customer dimension. So, it is no surprise that these two
Scrum project success dimensions are strongly intercorrelated as well. Although there will be various
other factors influencing the satisfaction of the customer and the customer’s level of trust in the
Scrum team, such as meeting functional performance and meeting technical specifications, this
study indicates that time and budget issues are of great importance to the customer.
Finally, this study also shows that teamwork factors are more often related to short-term
dimensions of Overall Scrum project success, such as time and budget, impact on the customer,
impact on the team, and business success, than to the long-term success dimension preparation for
the future. This may be explained by the fact that this long-term Scrum project success dimension
embraces a higher degree of uncertainty. That teamwork factors have impact on short-term Scrum
36
project success dimensions is obvious, since the relative importance of these short-term success
dimensions is highest during or just at the end of a project (Shenhar & Dvir, 2007). This is just the
time period at which the Scrum team is directly involved in the project, which explains why
teamwork factors are important determinants of these Scrum project success dimensions. The
relative importance of the long-term success dimension Preparation for the future only increases
after a project has been finished (Shenhar & Dvir, 2007). In this time period, the Scrum team is no
longer directly involved in the project. So, as time passes, the influence of teamwork factors on the
success of Scrum projects will decrease and more other factors that influence long-term Scrum
project success will come into play.
5.3 Limitations and future research There are several limitations concerning this master thesis project that should be discussed. Firstly,
the teamwork factor measures in this research were all based on team members’ self-reports,
which are subject to biases. This makes it difficult to determine the extent to which, for example,
reports of backup behavior in the team reflect true characteristics of that team. However, research
indicates that self-report measures may not limit internal consistency as much as is often assumed
(Spector, 1992; Wall, Michie, Patterson, Wood, Sheehan, Clegg, & West, 2004). Besides that, the fact
that we obtained data from multiple team members and members showed high levels of intra-group
agreement enhances our confidence in the validity of the data. The Scrum project success
measurements were based on self-reports as well. Because each project was evaluated by only one
project manager, their ratings had a great impact on the results of this study. However, project
managers were the only individuals who had enough knowledge about all Scrum project success
dimensions to be able to assess Overall Scrum project success in a truthful way. By explaining to the
project managers that their ratings would not have any personal consequences and that they had to
fill in the questionnaire as honest as possible, we hoped to decrease the likelihood of biased
answers. Furthermore, we ensured that teamwork factors and Scrum project success would not be
assessed by the same individuals. Because some team leads had the role of team lead and project
manager, they were all excluded from filling out the team member survey. By using two different
surveys to measure the teamwork factors and the Scrum project success dimensions, we prevented
common method biases (Podsakoff et al, 2003).
A second limitation of this research is that it is a cross-sectional study. Therefore, it is impossible to
infer causality. So, although this study showed which teamwork factors are significantly positively or
negatively related to Overall Scrum project success or any of its dimensions, the survey study did not
provide any hard evidence for the causality of these relationships. So, it should be kept in mind that
any claim about the causality of the relationships in this study was solely based on the literature
study. For future research, it is recommended to make use of a longitudinal study. This makes it
possible to investigate how teamwork factors develop over time and how changes in teamwork
factors affect Overall Scrum project success and its dimensions. Only then, it will become clear
whether or not the significant, positive relating teamwork factors are truly determinants of Overall
Scrum project success. Besides that, it will be interesting to find out whether or not a high degree of
monitoring behavior will negatively affect the time and budget aspects of Scrum project success, or
that the causality of this relationship is reversed.
A third limitation of this study is the small sample size, which has impact on the statistical power and
the generalization of the results of the study. According to Hair et al. (2006), in general, a minimum
37
of five cases per independent variable is required. However, in order to be able to generalize the
results, even fifteen or twenty cases per independent variable are recommended (Hair et al., 2006).
A sample size of only 16 teams, as is the case in this study, is thus too small for generalization.
Another problem that was triggered by the small sample size was multicollinearity. Because of this, it
was not possible to investigate the relative predictive importance of the teamwork factors with
multiple regression. Besides that, the impact of outliers becomes much greater when having a small
sample size. The likelihood of a Type II error increases as well. This implies that we need to practice
caution in interpreting null results. On the other hand, it also suggests that the relationships that we
found have considerable strength. Despite the relatively small sample size, we have been able to
demonstrate clear relationships between various teamwork factors and Scrum project success. To
improve the generalization of the results of this study, for future research, it is recommended to
perform a study similar to this one, only then with a much larger sample size. It would be interesting
to see if the results of such a study would be equal to the findings of this study. Besides that, it
would be interesting to be able to investigate the relative predictive importance of the different
teamwork factors.
Furthermore, the variables used in this study are all highly subjective and very complex in nature.
There is only limited conceptual agreement about the meaning of the used variables, so results
regarding these variables should be viewed accordingly. For example, we measured backup behavior
in terms of three items: ‘Team members fill in for another member who is unable to perform a task’,
‘Team members seek opportunities to aid other team members’, and ‘Our team members provide
assistance to those who need it’. Therefore, the definition of backup behavior in this paper is a
function of these three items only. So, all results reported in this work that relate to backup behavior
relate to only these dimensions of the construct.
Besides that, the scales to measure the different variables in this study were all adopted from
existing scales in published literature to ensure a high validity. However, because we measured no
less than fifteen different teamwork factors, the team member questionnaire would have become
too long if we had used all complete original scales. So, we had to shorten the team members
questionnaire by deleting some of the items that were present in the original scales. As a result, the
validity of some of the constructs has negatively been affected. However, we have tried to minimize
this negative effect by choosing wisely which items had to be deleted.
This study focused on the relationship between teamwork factors and Scrum project success.
However, it is very likely that many other factors, such as management support, corporate culture,
customer involvement, and project management process, determine Scrum project success as well.
Therefore, a final recommendation for future research is to investigate which other factors can be
regarded as determinants of Scrum project success.
38
6. Recommendations This study has shown that there are significant, positive relationships between the teamwork factors
communication, team diversity, backup behavior, team autonomy, mutual trust, shared mental
models, knowledge sharing, and shared leadership, and Overall Scrum project success and its
dimensions. Although the causality of these relationships cannot be proved with this study, the high
number of significant relationships indicates that teamwork factors are of great importance for
achieving Scrum project success. Therefore, it is important that software managers and Scrum
masters recognize the importance of teamwork factors and focus on actively improving these
teamwork factors. In this final section, we provide them with concrete recommendations about how
teamwork factors could be further improved within Scrum teams. A discussion session with the
Scrum masters of fourteen Scrum teams at TomTom helped to generate ideas for recommendations.
Eventually, we have come up with four concrete recommendations that will help to improve
important teamwork factors within Scrum teams. Although the recommendations are mainly
focused on TomTom in Eindhoven, they can also be useful for other software organizations making
use of Scrum methodology.
6.1 Organizing Backlog Refinement meetings Compared to the other average team scores, TomTom’s average team scores on team autonomy
and shared leadership are relatively low. Therefore, the first recommendation is about actively
improving these two teamwork factors.
This can be done by organizing Backlog Refinement meetings every one or two weeks in which the
product owner and Scrum team members together refine the product backlog. Although the product
owner is ultimately responsible for the product backlog, it is advised to extend the involvement of all
team members in the process of creating and refining product backlog items, estimating them, and
prioritizing them. In this way, team members do not only have a say in the specification of the
development sprint backlog, but also in the product backlog. As a result, they will experience a
higher degree of shared leadership. Besides that, team members will experience a higher degree
team autonomy, since they have more control over what work and how the work has to be done. An
additional advantage of jointly refining the product backlog is that it will reduce the time required
for a Sprint planning meeting. Since there are already different Scrum meetings planned around the
time of a Sprint planning meeting, such as the Sprint Review and Sprint Retrospective, it will be very
likely that Scrum team members will highly appreciate having a shorter Sprint planning meeting.
6.2 Introducing a ‘knowledge expert as coach’-strategy Although TomTom’s average team score on knowledge sharing is not particularly low, both the
interviews conducted at the start of the study and the discussion session organized at the end of the
study revealed that some Scrum teams experience problems concerning knowledge sharing.
Currently, it is often the case that when someone who has the most knowledge about a certain
topic, the so-called knowledge expert, leaves the Scrum team or organization, the knowledge of this
person will largely be gone. This has a negative effect on Scrum project success, since it will take
time to built this knowledge again. By further improving the knowledge sharing within Scrum teams,
problems regarding transfer of knowledge could be prevented.
Therefore, the second recommendation is to introduce a ‘knowledge expert as coach’-strategy. This
strategy implies that work that is usually done by the knowledge expert because he knows most
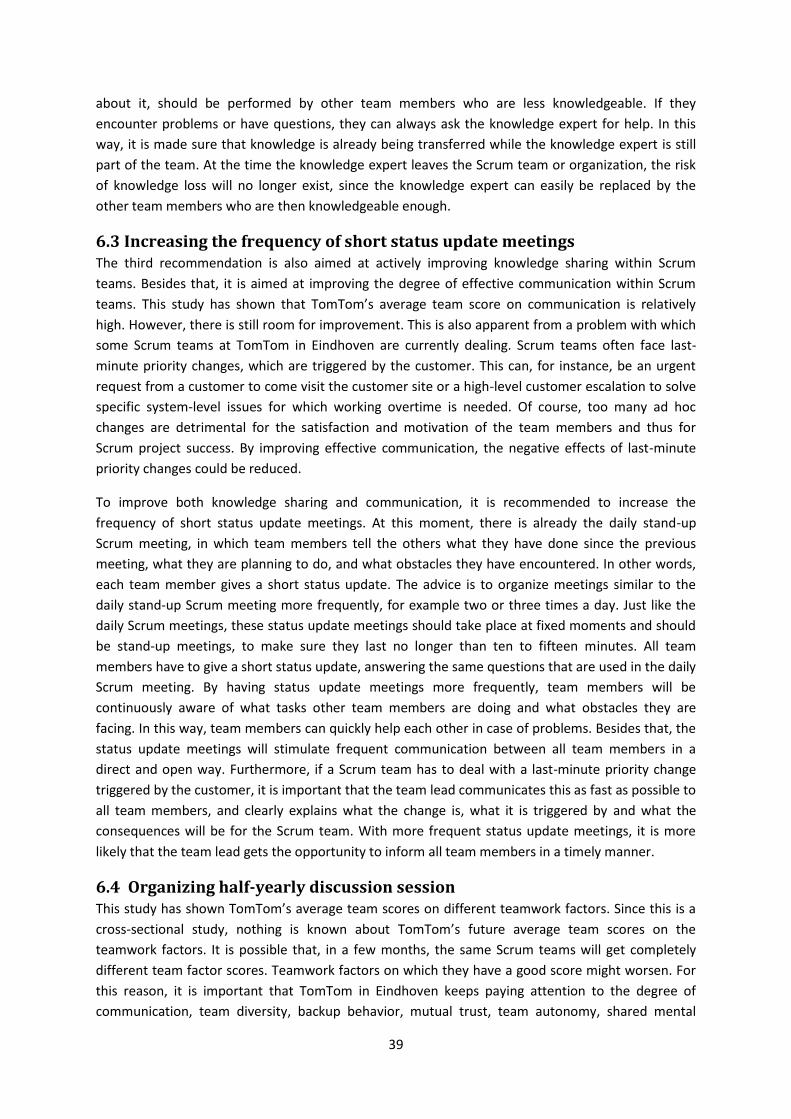
39
about it, should be performed by other team members who are less knowledgeable. If they
encounter problems or have questions, they can always ask the knowledge expert for help. In this
way, it is made sure that knowledge is already being transferred while the knowledge expert is still
part of the team. At the time the knowledge expert leaves the Scrum team or organization, the risk
of knowledge loss will no longer exist, since the knowledge expert can easily be replaced by the
other team members who are then knowledgeable enough.
6.3 Increasing the frequency of short status update meetings The third recommendation is also aimed at actively improving knowledge sharing within Scrum
teams. Besides that, it is aimed at improving the degree of effective communication within Scrum
teams. This study has shown that TomTom’s average team score on communication is relatively
high. However, there is still room for improvement. This is also apparent from a problem with which
some Scrum teams at TomTom in Eindhoven are currently dealing. Scrum teams often face last-
minute priority changes, which are triggered by the customer. This can, for instance, be an urgent
request from a customer to come visit the customer site or a high-level customer escalation to solve
specific system-level issues for which working overtime is needed. Of course, too many ad hoc
changes are detrimental for the satisfaction and motivation of the team members and thus for
Scrum project success. By improving effective communication, the negative effects of last-minute
priority changes could be reduced.
To improve both knowledge sharing and communication, it is recommended to increase the
frequency of short status update meetings. At this moment, there is already the daily stand-up
Scrum meeting, in which team members tell the others what they have done since the previous
meeting, what they are planning to do, and what obstacles they have encountered. In other words,
each team member gives a short status update. The advice is to organize meetings similar to the
daily stand-up Scrum meeting more frequently, for example two or three times a day. Just like the
daily Scrum meetings, these status update meetings should take place at fixed moments and should
be stand-up meetings, to make sure they last no longer than ten to fifteen minutes. All team
members have to give a short status update, answering the same questions that are used in the daily
Scrum meeting. By having status update meetings more frequently, team members will be
continuously aware of what tasks other team members are doing and what obstacles they are
facing. In this way, team members can quickly help each other in case of problems. Besides that, the
status update meetings will stimulate frequent communication between all team members in a
direct and open way. Furthermore, if a Scrum team has to deal with a last-minute priority change
triggered by the customer, it is important that the team lead communicates this as fast as possible to
all team members, and clearly explains what the change is, what it is triggered by and what the
consequences will be for the Scrum team. With more frequent status update meetings, it is more
likely that the team lead gets the opportunity to inform all team members in a timely manner.
6.4 Organizing half-yearly discussion session This study has shown TomTom’s average team scores on different teamwork factors. Since this is a
cross-sectional study, nothing is known about TomTom’s future average team scores on the
teamwork factors. It is possible that, in a few months, the same Scrum teams will get completely
different team factor scores. Teamwork factors on which they have a good score might worsen. For
this reason, it is important that TomTom in Eindhoven keeps paying attention to the degree of
communication, team diversity, backup behavior, mutual trust, team autonomy, shared mental
40
models, knowledge sharing, and shared leadership within the Scrum teams, also because this study
showed a positive relationship between these teamwork factors and Overall Scrum project success.
To ensure TomTom keeps paying attention to the degree of teamwork factors in their Scrum teams,
the fourth and also final recommendation is to regularly organize a discussion session, similar to the
one used in this study, preferably twice a year. In such a discussion session the Scrum masters of the
teams will have the opportunity to share their views on why their Scrum team would score relatively
high or low compared to other Scrum teams on certain teamwork factor. By sharing their
experiences regarding teamwork factors, Scrum masters will learn from each other and gain new
ideas about how to deal with teamwork factors in their own teams. With the help of a discussion
session, Scrum masters can generate concrete recommendations for all Scrum teams within
TomTom which aim to improve teamwork factors and subsequently Scrum project success.
6.5 Overview of recommendations Finally, to get a clear overview of the recommendations of this study, Figure 11 shows how the
recommendations can be incorporated in the original Scrum process of Figure 3.
Figure 11; Recommendations incorporated in the original Scrum process
41
7. References Abdel-Hamid, T. K., Sengupta, K., & Swett, C. (1999). The impact of goals on software project
management: An experimental investigation. MIS quarterly, 23(4), 531-555.
Ambler, S. (2005). Quality in an agile world. Software Quality Professional,7(4), 34.
Atkinson, R. (1999). Project management: cost, time and quality, two best guesses and a
phenomenon, its time to accept other success criteria. International Journal of Project
Management, 17(6), 337-342.
Baguley, T. (2004). Understanding statistical power in the context of applied research. Applied
Ergonomics, 35(2), 73-80.
Baker, B. N., Murphy, D. C., & Fisher, D. (1983). Factors affecting project success. Project
Management Handbook. New York: Van Nostrand Reinhold.
Beedle, M., Devos, M., Sharon, Y., Schwaber, K., & Sutherland, J. (1999). SCRUM: An extension
pattern language for hyperproductive software development. Pattern Languages of Program
Design, 4, 637-651.
Belassi, W., & Tukel, O. I. (1996). A new framework for determining critical success/failure factors in
projects. International journal of project management, 14(3), 141-151.
Bliese, P.D. (2000). Within-group agreement, non-independence, and reliability: Implications for data
aggregation and analysis. In K. J. Klein, & S. W. J. Kozlowski (Eds.), Multilevel theory, research, and
methods in organizations (pp. 349–381). San Francisco, CA: Jossey-Bass
Booch, G., (1995). Object solutions: managing the object-oriented project. Addison-Wesley.
Bowerman, B. L., & O’Connell, R. T. (1990). Linear statistical models: An applied approach (2nd ed.).
Belmont, CA: Duxbury.
Bubshait, A. A., & Farooq, G. (1999). Team building and project success. Cost engineering, 41(7), 34-
38.
Campion, M. A., Medsker, G. J., & Higgs, A. C. (1993). Relations between work group characteristics
and effectiveness: Implications for designing effective work groups. Personnel psychology, 46(4),
823-850.
Chow, T., & Cao, D. B. (2007). A survey study of critical success factors in agile software projects.
Journal of Systems and Software, 81(6), 961-971.
42
Collins, C. J., & Smith, K. G. (2006). Knowledge exchange and combination: The role of human
resource practices in the performance of high-technology firms. Academy of management
journal, 49(3), 544-560.
Collyer, S., & Warren, C. M. (2009). Project management approaches for dynamic
environments. International Journal of Project Management, 27(4), 355-364.
DeCotiis, T. A., & Dyer, L. (1979). Defining and measuring project performance. Research
Management, 22(1), 17-22.
De Jong, B. A., & Elfring, T. (2010). How does trust affect the performance of ongoing teams? The
mediating role of reflexivity, monitoring, and effort. Academy of Management Journal, 53(3), 535-
549.
Devine, D. J., & Philips, J. L. (2001). Do smarter teams do better a meta-analysis of cognitive ability
and team performance. Small Group Research,32(5), 507-532.
Dickinson, T. L., & McIntyre, R. M. (1997). A conceptual framework for teamwork
measurement. Team performance assessment and measurement, 19-43.
Diefendorff, J. M., & Lord, R. G. (2008). Goal-striving and self-regulation processes. In R. Kanfer, G.
Chen, & R. D. Pritchard (Eds.), Work motivation: Past, present, and future (pp. 151–196). New York,
NY: Routledge.
Dingsøyr, T., & Lindsjørn, Y. (2013). Team performance in agile development teams: findings from 18
focus groups (pp. 46-60). Springer Berlin Heidelberg.
Dingsøyr, T., Nerur, S., Balijepally, V., & Moe, N. B. (2012). A decade of agile methodologies: Towards
explaining agile software development. Journal of Systems and Software, 85(6), 1213-1221.
Dybå, T., & Dingsøyr, T. (2008). Empirical studies of agile software development: A systematic
review. Information and software technology, 50(9), 833-859.
Dybå, T., Dingsøyr, T., & Moe, N. B. (2014). Agile Project Management. In Software Project
Management in a Changing World (pp. 277-300). Springer Berlin Heidelberg.
Edmondson, A. (1999). Psychological safety and learning behavior in work teams. Administrative
science quarterly, 44(2), 350-383.
Ehrhart, M. G., Bliese, P. D., & Thomas, J. L. (2006). Unit-level OCB and unit effectiveness: Examining
the incremental effect of helping behavior. Human Performance, 19(2), 159-173.
43
Field, A. (2009). Discovering statistics using SPSS. Sage publications.
Franken, M. (2014). Scrum voor Dummies. Pearson Education.
George, J. M., & Bettenhausen, K. (1990). Understanding prosocial behavior, sales performance, and
turnover: a group-level analysis in a service context. Journal of applied Psychology, 75(6), 698.
Gevers, J. M. (2004). It’s about time we align: Meeting deadlines in project teams. Unpublished
doctoral dissertation. Eindhoven: Technische Universiteit Eindhoven.
Glaser, B. G. & Strauss, A. L. (1967b). Discovery of grounded theory: Strategies for qualitative
research. Hawthorne, NY: Aldine de Gruyter.
Glick, W. H., Miller, C. C., & Huber, G. P. (1993). The impact of upper-echelon diversity on
organizational performance. Organizational change and redesign: Ideas and insights for improving
performance, 176, 214.
Greene, J. C., Caracelli, V. J., & Graham, W. F. (1989). Toward a conceptual framework for mixed-
method evaluation designs. Educational evaluation and policy analysis, 11(3), 255-274.
Hallgren, K. A. (2012). Computing Inter-Rater Reliability for Observational Data: An Overview and
Tutorial. Tutorials in Quantitative Methods for Psychology, 8(1), 23–34.
Han, T. Y., & Williams, K. J. (2008). Multilevel investigation of adaptive performance individual-and
team-level relationships. Group & Organization Management, 33(6), 657-684.
Hewitt, B., & Walz, D. (2005, January). Using shared leadership to foster knowledge sharing in
information systems development projects. In System Sciences, 2005. HICSS'05. Proceedings of the
38th Annual Hawaii International Conference on (pp. 256a-256a). IEEE.
Hoegl, M., & Gemuenden, H. G. (2001). Teamwork quality and the success of innovative projects: A
theoretical concept and empirical evidence. Organization science, 12(4), 435-449.
Highsmith, J. (2009). Agile project management: creating innovative products. Pearson Education.
Hu, J., & Liden, R. C. (2011). Antecedents of team potency and team effectiveness: an examination of
goal and process clarity and servant leadership. Journal of Applied Psychology, 96(4), 851.
Ika, L. A. (2009). Project success as a topic in project management journals. Project Management
Journal, 40(4), 6-19.
44
James, L. R., Demarée, R. G., & Wolf, G. (1984). Estimating within-group interrater reliability with and
without response bias. Journal of applied psychology, 69(1), 85.
Jarvenpaa, S. L., & Leidner, D. E. (1998). Communication and trust in global virtual teams. Journal of
Computer‐Mediated Communication, 3(4), 0-0.
Jehn, K. A., Northcraft, G. B., & Neale, M. A. (1999). Why differences make a difference: A field study
of diversity, conflict and performance in workgroups. Administrative science quarterly, 44(4), 741-
763.
Johson, J., Karen, D., Boucher, K. C., & Robinson, J. (2001). Collaborating on project success. Software
Magazine.
Jonker, C. M., Van Riemsdijk, M. B., & Vermeulen, B. (2011). Shared mental models. In Coordination,
Organizations, Institutions, and Norms in Agent Systems VI (pp. 132-151). Springer Berlin
Heidelberg.
Kautz, K., Johanson, T. H., & Uldahl, A. (2014). The perceived impact of the agile development and
project management method scrum on information systems and software development
productivity. Australiasian Journal of Information Systems, 18(3), 303-315.
Kline, P. (1999). The handbook of psychological testing (2nd ed.). London: Routledge
Kozlowski, S. W., & Bell, B. S. (2003). Work groups and teams in organizations. Handbook of
psychology.
Langfred, C. W. (2000). The paradox of self-management: Individual and group autonomy in work
groups. Journal of Organizational Behavior, 21(5), 563-585.
Langfred, C. W. (2005). Autonomy and performance in teams: The multilevel moderating effect of
task interdependence. Journal of management, 31(4), 513-529.
LeBreton, J. M., & Senter, J. L. (2008). Answers to 20 Questions About Interrater Reliability and
Interrater Agreement. Organizational Research Methods, 11(4), 815-852.
Lee, G., & Xia, W. (2010). Toward agile: an integrated analysis of quantitative and qualitative field
data. Management Information Systems Quarterly, 34(1), 7.
LePine, J. A. (2005). Adaptation of teams in response to unforeseen change: effects of goal difficulty
and team composition in terms of cognitive ability and goal orientation. Journal of Applied
Psychology, 90(6), 1153.
45
Lester, D. H. (1998). Critical success factors for new product development. Research-Technology
Management, 41(1), 36.
Levin, J., & Moreland, R. (1990). Conflicts within small groups. Annual Review of Psychology, 41, 585-
634.
Lewis, K. (2003). Measuring transactive memory systems in the field: scale development and
validation. Journal of Applied Psychology, 88(4), 587.
Lim, C. S., & Mohamed, M. Z. (1999). Criteria of project success: an exploratory re-
examination. International journal of project management, 17(4), 243-248.
Liu, A. M., & Walker, A. (1998). Evaluation of project outcomes. Construction Management &
Economics, 16(2), 209-219.
Locke, D. (1984). Project Management. New York: St Martins Press.
Locke, E. A., & Latham, G. P. (1990). Work motivation and satisfaction: Light at the end of the
tunnel. Psychological science, 1(4), 240-246.
MacCormack, A., Verganti, R., & Iansiti, M. (2001). Developing products on “Internet time”: The
anatomy of a flexible development process. Management science, 47(1), 133-150.
Mann, C., & Maurer, F. (2005). A Case Study on the Impact of Scrum on Overtime and Customer
Satisfaction. In 2012 Agile Conference (pp. 70-79).
Martin, C. C. (1976). Project Management. New York: Amaco.
Mesmer-Magnus, J. R., & DeChurch, L. A. (2009). Information sharing and team performance: a
meta-analysis. Journal of Applied Psychology, 94(2), 535
Mierlo, H. V., Rutte, C. G., Vermunt, J. K., Kompier, M. A. J., & Doorewaard, J. A. C. M. (2007). A
multi‐level mediation model of the relationships between team autonomy, individual task design
and psychological well‐being. Journal of Occupational and Organizational Psychology, 80(4), 647-
664.
Misra, S. C., Kumar, V., & Kumar, U. (2009). Identifying some important success factors in adopting
agile software development practices. Journal of Systems and Software, 82(11), 1869-1890.
46
Moe, N. B., & Dingsøyr, T. (2008). Scrum and team effectiveness: Theory and practice. In Agile
Processes in Software Engineering and Extreme Programming (pp. 11-20). Springer Berlin
Heidelberg.
Moe, N. B., Dingsøyr, T., & Dybå, T. (2010). A teamwork model for understanding an agile team: A
case study of a Scrum project. Information and Software Technology, 52(5), 480-491.
Morgan, G. (2006). Images of organizations. Sage, Thousand Oaks, CA.
Nerur, S., & Balijepally, V. (2007). Theoretical reflections on agile development
methodologies. Communications of the ACM, 50(3), 79-83.
Nonaka, I., & Takeuchi, H. (1995). The knowledge-creating company: How Japanese companies
create the dynamics of innovation. Oxford university press.
O’Connor, M. A. (1993). The human capital era: Reconceptualizing corporate law facilitate labor-
management cooperation. Cornell Law Review, 78(5), 899-965.
Park, H. S. (2008). The Effects of Shared Cognition on Group Satisfaction and Performance Politeness
and Efficiency in Group Interaction. Communication Research, 35(1), 88-108.
Park, S., Henkin, A. B., & Egley, R. (2005). Teacher team commitment, teamwork and trust: exploring
associations. Journal of educational administration, 43(5), 462-479.
Pearce, C. L. (2004). The future of leadership: Combining vertical and shared leadership to transform
knowledge work. The Academy of Management Executive, 18(1), 47-57.
Pinto, J. K., & Slevin, D. P. (1987). Critical factors in successful project implementation. Engineering
Management, IEEE Transactions on Engineering Management, 34(1), 22-27.
Pittman, M. (1993). Lessons Learned in Managing Object-Oriented Development. IEEE Software,
10(1), 43-53.
Podsakoff, P. M., MacKenzie, S. B., Lee, J. Y., & Podsakoff, N. P. (2003). Common method biases in
behavioral research: a critical review of the literature and recommended remedies. Journal of
applied psychology, 88(5), 879.
Rising, L., & Janoff, N. S. (2000). The Scrum software development process for small teams. IEEE
software, 17(4), 26-32.
47
Rispens, S., Greer, L. L., & Jehn, K. A. (2007). It could be worse: A study on the alleviating roles of
trust and connectedness in intragroup conflicts. International journal of conflict
management, 18(4), 325-344.
Robinson, H., & Sharp, H. (2004). The characteristics of XP teams. In Extreme programming and agile
processes in software engineering (pp. 139-147). Springer Berlin Heidelberg.
Rubin, I. M., & Seeling, W. (1967). Experience as a factor in the selection and performance of project
managers. IEEE Transactions on Engineering Management, 14(3), 131-134.
Salas, E., Cannon-Bowers, J. A., & Johnston, J. H. (1997). How can you turn a team of experts into an
expert team?: Emerging training strategies. Naturalistic decision making, 359-370.
Salas, E., Stagl, K. C., Burke, C. S., & Goodwin, G. F. (2007, January). Fostering team effectiveness in
organizations: Toward an integrative theoretical framework. In Nebraska Symposium on
Motivation (Vol. 52, p. 185).
Salas, E., Sims, D. E., & Burke, C. S. (2005). Is there a “Big Five” in teamwork?. Small group
research, 36(5), 555-599.
Sawyer, J. E. (1992). Goal and process clarity: Specification of multiple constructs of role ambiguity
and a structural equation model of their antecedents and consequences. Journal of Applied
Psychology, 77(2), 130.
Schwaber, K. (1997). Scrum development process. In Business Object Design and Implementation
(pp. 117-134). Springer London.
Sethi, R. (2000). Superordinate identity in cross-functional product development teams: Its
antecedents and effect on new product performance. Journal of the Academy of Marketing
Science, 28(3), 330-344.
Shenhar, A. J., & Dvir, D. (2007). Reinventing project management: the diamond approach to
successful growth and innovation. Harvard Business Review Press.
Shenhar, A. J., Dvir, D., Guth, W., Lechler, T., Patanakul, P., Poli, M., & Stefanovic, J. (2005). Project
strategy: the missing link. In annual Academy of Management meeting (pp. 5-10).
Shenhar, A. J., Dvir, D., Levy, O., & Maltz, A. C. (2001). Project success: a multidimensional strategic
concept. Long range planning, 34(6), 699-725.
48
Shenhar, A. J., Levy, O., & Dvir, D. (1997). Mapping the dimensions of project success. Project
Management Journal, 28(2), 5-13.
Srivastava, A., Bartol, K. M., & Locke, E. A. (2006). Empowering leadership in management teams:
Effects on knowledge sharing, efficacy, and performance. Academy of management journal, 49(6),
1239-1251.
Stanton, J. M., Sinar, E. F., Balzer, W. K., & Smith, P. C. (2002). Issues and strategies for reducing the
length of self‐report scales. Personnel Psychology, 55(1), 167-194
Stasser, G., & Titus, W. (1985). Pooling of unshared information in group decision making: Biased
information sampling during discussion. Journal of personality and social psychology, 48(6), 1467.
Sterling, C. (2010). Managing software debt: building for inevitable change. Addison-Wesley
Professional.
Stewart, G. L. (2006). A meta-analytic review of relationships between team design features and
team performance. Journal of management, 32(1), 29-55.
van Aken, J., Berends, H., & van der Bij, H. (2012). Problem solving in organizations: A
methodological handbook for business and management students. Cambridge University Press.
Van Der Vegt, G. S., & Bunderson, J. S. (2005). Learning and performance in multidisciplinary teams:
The importance of collective team identification. Academy of Management Journal, 48(3), 532-547.
Vlaanderen, K., Jansen, S., Brinkkemper, S., & Jaspers, E. (2011). The agile requirements refinery:
Applying SCRUM principles to software product management. Information and Software
Technology, 53(1), 58-70.
Watson, W. E., Kumar, K., & Michaelsen, L. K. (1993). Cultural diversity's impact on interaction
process and performance: Comparing homogeneous and diverse task groups. Academy of
management journal, 36(3), 590-602.
Wood, M. (2005). The fallacy of misplaced leadership. Journal of Management Studies, 42(6), 1101-
1121.
Zhang, Z. X., Hempel, P. S., Han, Y. L., & Tjosvold, D. (2007). Transactive memory system links work
team characteristics and performance. Journal of Applied Psychology, 92(6), 1722.
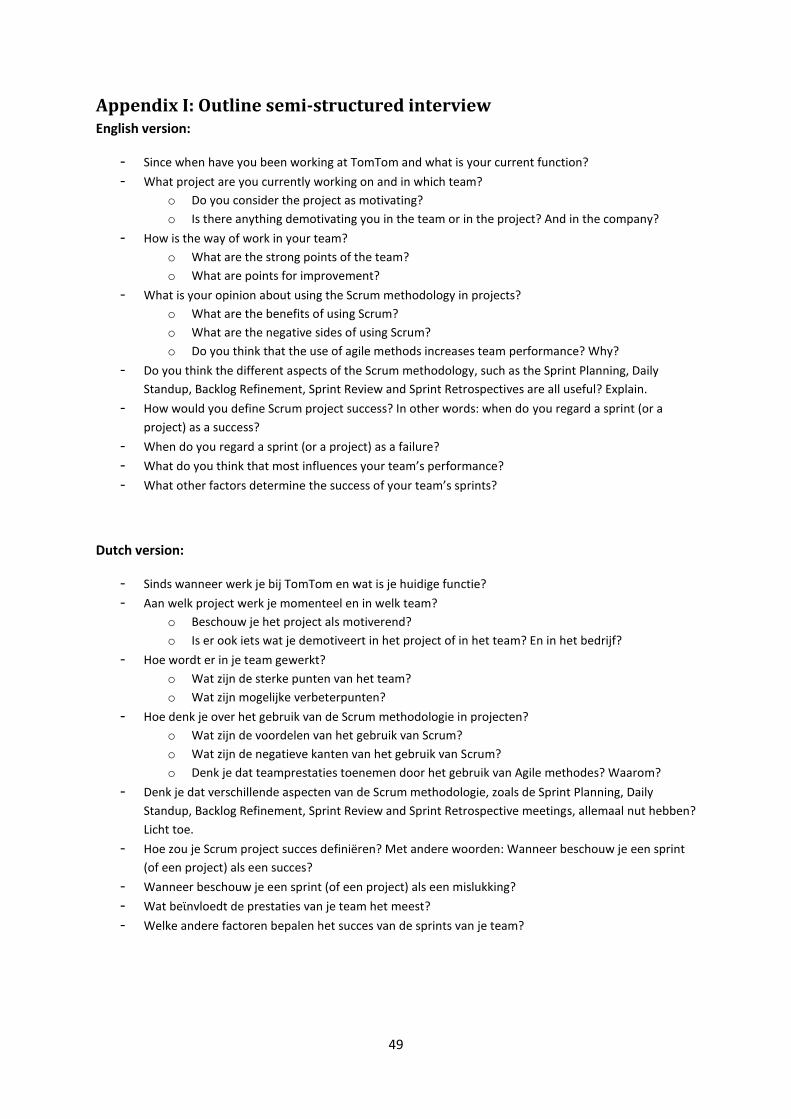
49
Appendix I: Outline semi-structured interview English version:
- Since when have you been working at TomTom and what is your current function?
- What project are you currently working on and in which team?
o Do you consider the project as motivating?
o Is there anything demotivating you in the team or in the project? And in the company?
- How is the way of work in your team?
o What are the strong points of the team?
o What are points for improvement?
- What is your opinion about using the Scrum methodology in projects?
o What are the benefits of using Scrum?
o What are the negative sides of using Scrum?
o Do you think that the use of agile methods increases team performance? Why?
- Do you think the different aspects of the Scrum methodology, such as the Sprint Planning, Daily
Standup, Backlog Refinement, Sprint Review and Sprint Retrospectives are all useful? Explain.
- How would you define Scrum project success? In other words: when do you regard a sprint (or a
project) as a success?
- When do you regard a sprint (or a project) as a failure?
- What do you think that most influences your team’s performance?
- What other factors determine the success of your team’s sprints?
Dutch version:
- Sinds wanneer werk je bij TomTom en wat is je huidige functie?
- Aan welk project werk je momenteel en in welk team?
o Beschouw je het project als motiverend?
o Is er ook iets wat je demotiveert in het project of in het team? En in het bedrijf?
- Hoe wordt er in je team gewerkt?
o Wat zijn de sterke punten van het team?
o Wat zijn mogelijke verbeterpunten?
- Hoe denk je over het gebruik van de Scrum methodologie in projecten?
o Wat zijn de voordelen van het gebruik van Scrum?
o Wat zijn de negatieve kanten van het gebruik van Scrum?
o Denk je dat teamprestaties toenemen door het gebruik van Agile methodes? Waarom?
- Denk je dat verschillende aspecten van de Scrum methodologie, zoals de Sprint Planning, Daily
Standup, Backlog Refinement, Sprint Review and Sprint Retrospective meetings, allemaal nut hebben?
Licht toe.
- Hoe zou je Scrum project succes definiëren? Met andere woorden: Wanneer beschouw je een sprint
(of een project) als een succes?
- Wanneer beschouw je een sprint (of een project) als een mislukking?
- Wat beϊnvloedt de prestaties van je team het meest?
- Welke andere factoren bepalen het succes van de sprints van je team?
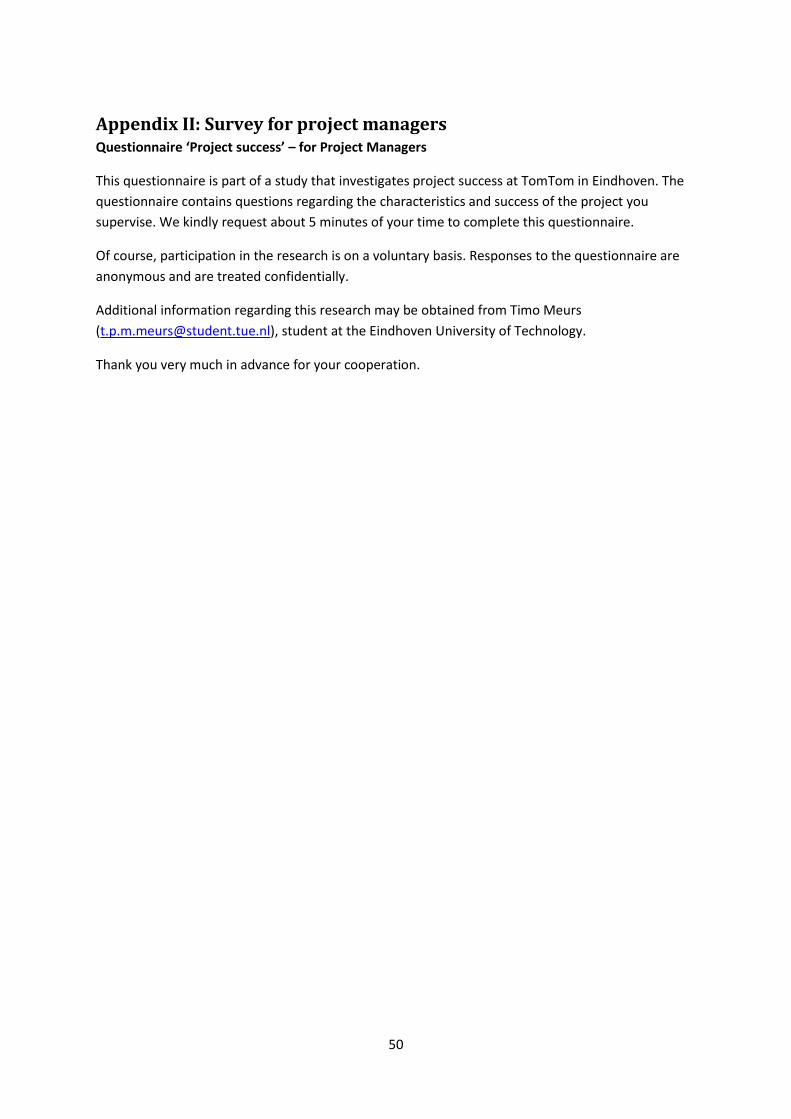
50
Appendix II: Survey for project managers Questionnaire ‘Project success’ – for Project Managers
This questionnaire is part of a study that investigates project success at TomTom in Eindhoven. The
questionnaire contains questions regarding the characteristics and success of the project you
supervise. We kindly request about 5 minutes of your time to complete this questionnaire.
Of course, participation in the research is on a voluntary basis. Responses to the questionnaire are
anonymous and are treated confidentially.
Additional information regarding this research may be obtained from Timo Meurs
([email protected]), student at the Eindhoven University of Technology.
Thank you very much in advance for your cooperation.
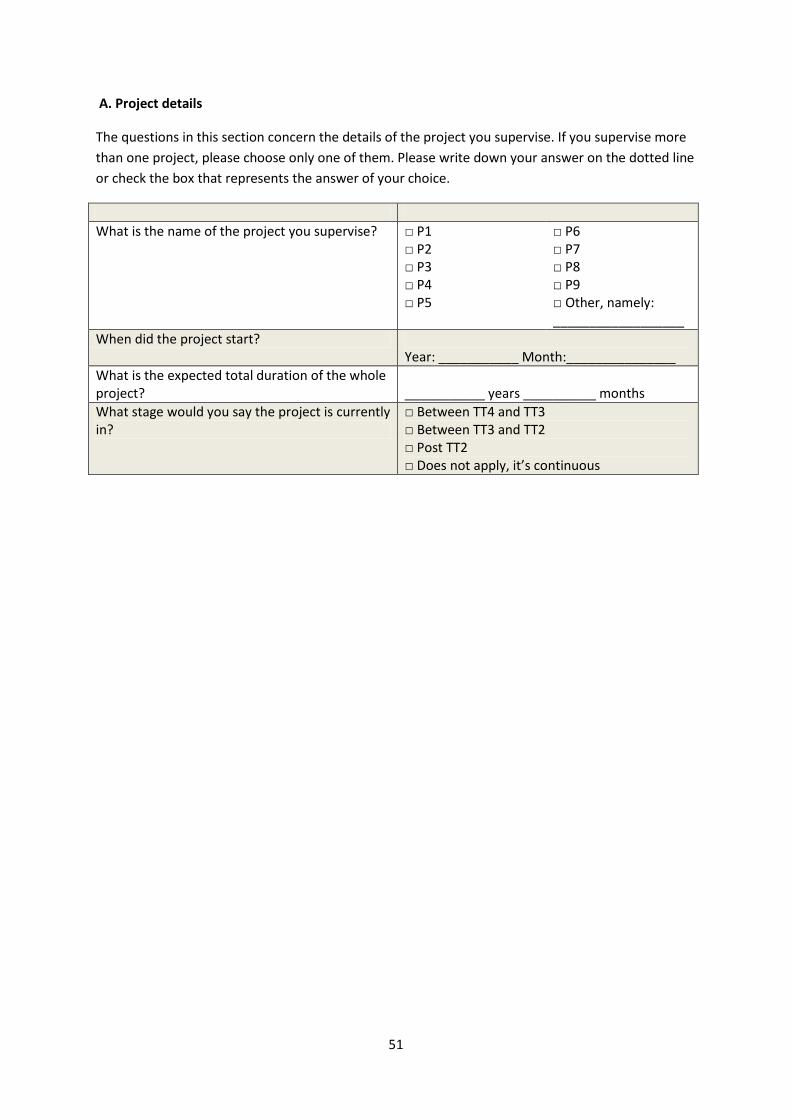
51
A. Project details
The questions in this section concern the details of the project you supervise. If you supervise more
than one project, please choose only one of them. Please write down your answer on the dotted line
or check the box that represents the answer of your choice.
What is the name of the project you supervise? □ P1 □ P2 □ P3 □ P4 □ P5
□ P6 □ P7 □ P8 □ P9 □ Other, namely: __________________
When did the project start? Year: ___________ Month:_______________
What is the expected total duration of the whole project?
___________ years __________ months
What stage would you say the project is currently in?
□ Between TT4 and TT3 □ Between TT3 and TT2 □ Post TT2 □ Does not apply, it’s continuous
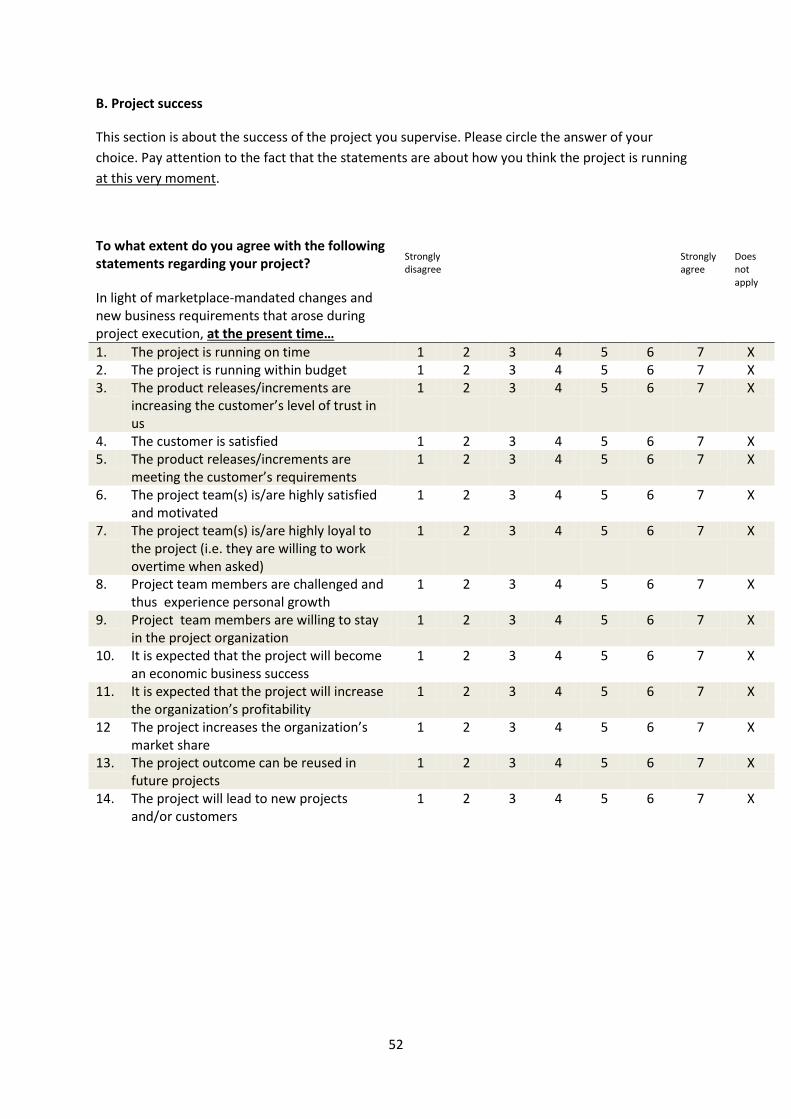
52
B. Project success
This section is about the success of the project you supervise. Please circle the answer of your
choice. Pay attention to the fact that the statements are about how you think the project is running
at this very moment.
To what extent do you agree with the following statements regarding your project?
Strongly disagree
Strongly agree
Does not apply
In light of marketplace-mandated changes and new business requirements that arose during project execution, at the present time…
1. The project is running on time 1 2 3 4 5 6 7 X 2. The project is running within budget 1 2 3 4 5 6 7 X 3. The product releases/increments are
increasing the customer’s level of trust in us
1 2 3 4 5 6 7 X
4. The customer is satisfied 1 2 3 4 5 6 7 X 5. The product releases/increments are
meeting the customer’s requirements 1 2 3 4 5 6 7 X
6. The project team(s) is/are highly satisfied and motivated
1 2 3 4 5 6 7 X
7. The project team(s) is/are highly loyal to the project (i.e. they are willing to work overtime when asked)
1 2 3 4 5 6 7 X
8. Project team members are challenged and thus experience personal growth
1 2 3 4 5 6 7 X
9. Project team members are willing to stay in the project organization
1 2 3 4 5 6 7 X
10. It is expected that the project will become an economic business success
1 2 3 4 5 6 7 X
11. It is expected that the project will increase the organization’s profitability
1 2 3 4 5 6 7 X
12 The project increases the organization’s market share
1 2 3 4 5 6 7 X
13. The project outcome can be reused in future projects
1 2 3 4 5 6 7 X
14. The project will lead to new projects and/or customers
1 2 3 4 5 6 7 X
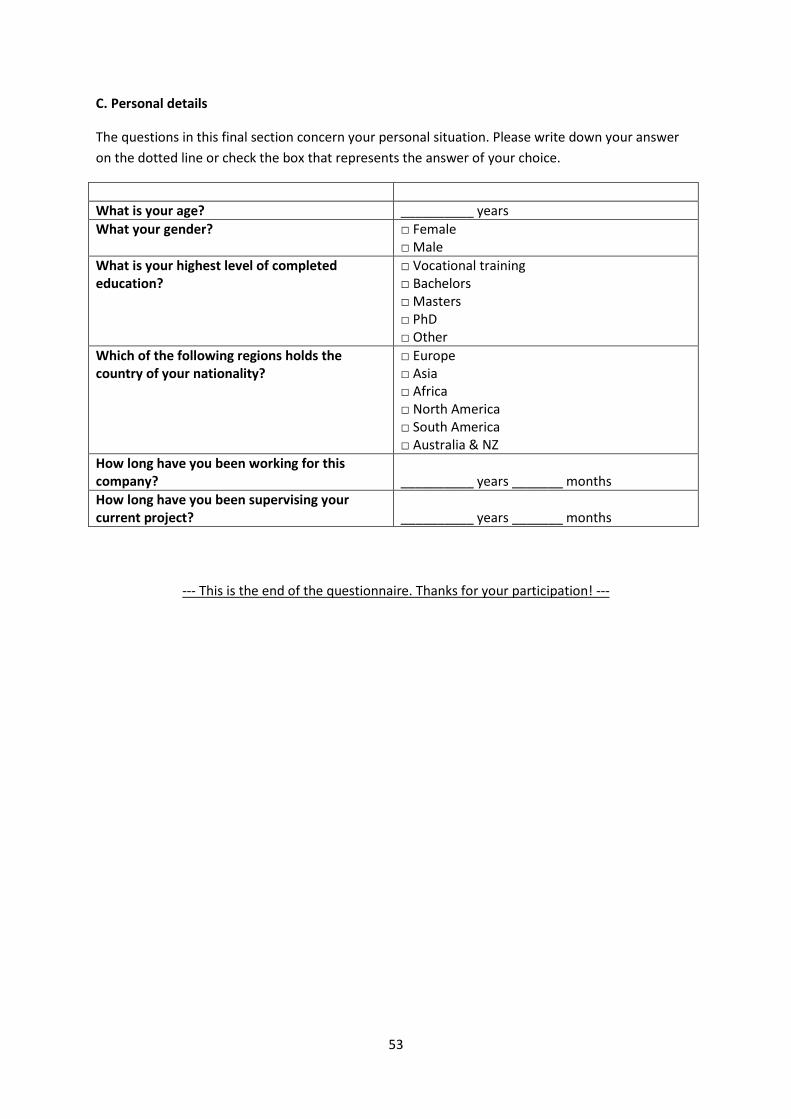
53
C. Personal details
The questions in this final section concern your personal situation. Please write down your answer
on the dotted line or check the box that represents the answer of your choice.
What is your age? __________ years
What your gender? □ Female □ Male
What is your highest level of completed education?
□ Vocational training □ Bachelors □ Masters □ PhD □ Other
Which of the following regions holds the country of your nationality?
□ Europe □ Asia □ Africa □ North America □ South America □ Australia & NZ
How long have you been working for this company?
__________ years _______ months
How long have you been supervising your current project?
__________ years _______ months
--- This is the end of the questionnaire. Thanks for your participation! ---
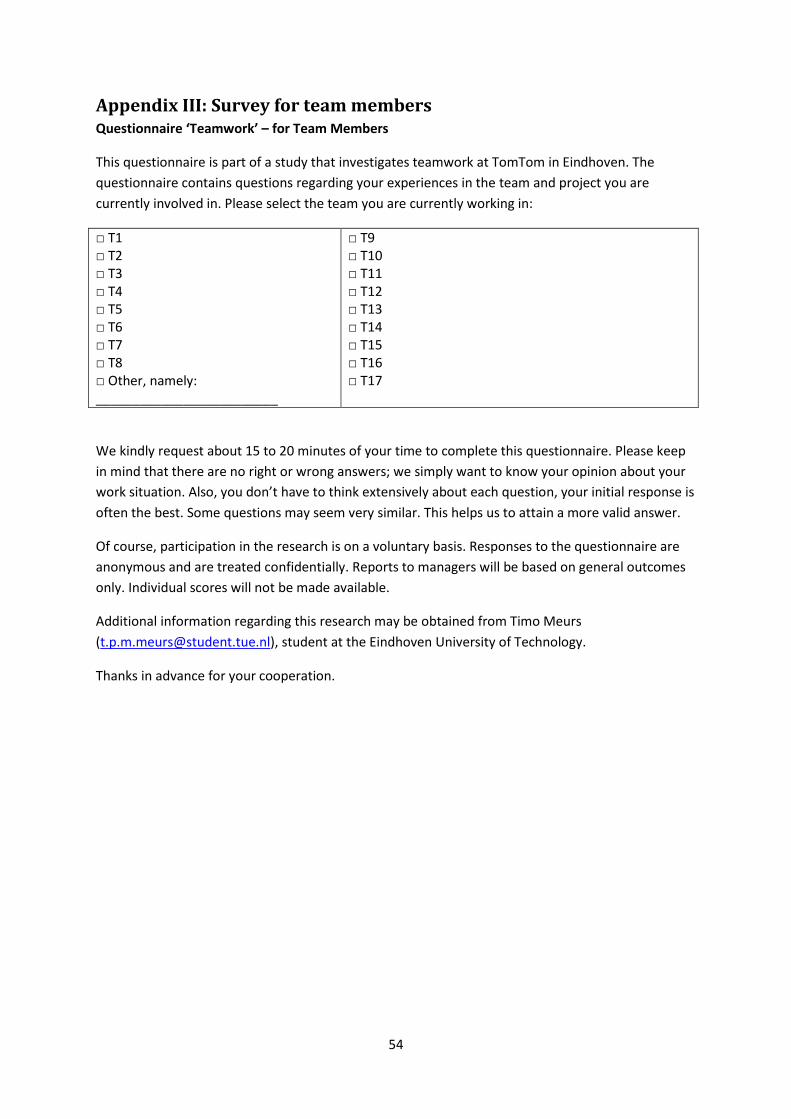
54
Appendix III: Survey for team members Questionnaire ‘Teamwork’ – for Team Members
This questionnaire is part of a study that investigates teamwork at TomTom in Eindhoven. The
questionnaire contains questions regarding your experiences in the team and project you are
currently involved in. Please select the team you are currently working in:
□ T1 □ T2 □ T3 □ T4 □ T5 □ T6 □ T7 □ T8 □ Other, namely: _________________________
□ T9 □ T10 □ T11 □ T12 □ T13 □ T14 □ T15 □ T16 □ T17
We kindly request about 15 to 20 minutes of your time to complete this questionnaire. Please keep
in mind that there are no right or wrong answers; we simply want to know your opinion about your
work situation. Also, you don’t have to think extensively about each question, your initial response is
often the best. Some questions may seem very similar. This helps us to attain a more valid answer.
Of course, participation in the research is on a voluntary basis. Responses to the questionnaire are
anonymous and are treated confidentially. Reports to managers will be based on general outcomes
only. Individual scores will not be made available.
Additional information regarding this research may be obtained from Timo Meurs
([email protected]), student at the Eindhoven University of Technology.
Thanks in advance for your cooperation.
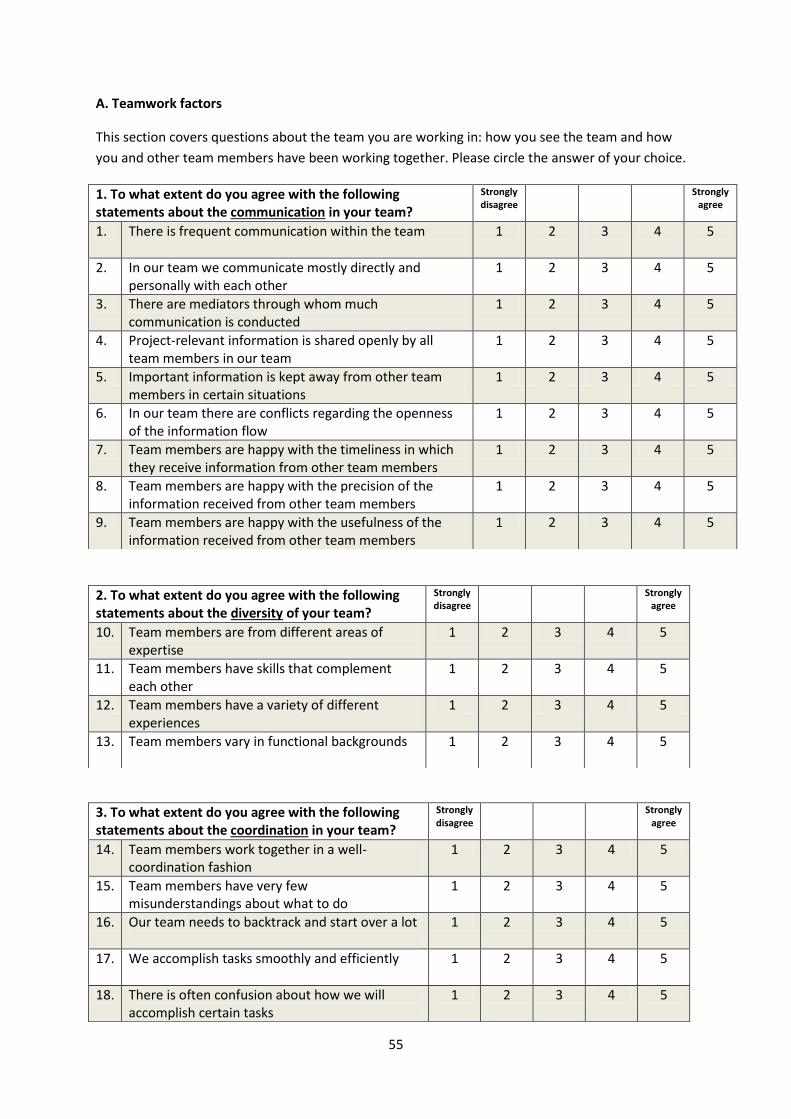
55
A. Teamwork factors
This section covers questions about the team you are working in: how you see the team and how
you and other team members have been working together. Please circle the answer of your choice.
1. To what extent do you agree with the following statements about the communication in your team?
Strongly disagree
Strongly agree
1. There is frequent communication within the team
1 2 3 4 5
2. In our team we communicate mostly directly and personally with each other
1 2 3 4 5
3. There are mediators through whom much communication is conducted
1 2 3 4 5
4. Project-relevant information is shared openly by all team members in our team
1 2 3 4 5
5. Important information is kept away from other team members in certain situations
1 2 3 4 5
6. In our team there are conflicts regarding the openness of the information flow
1 2 3 4 5
7. Team members are happy with the timeliness in which they receive information from other team members
1 2 3 4 5
8. Team members are happy with the precision of the information received from other team members
1 2 3 4 5
9. Team members are happy with the usefulness of the information received from other team members
1 2 3 4 5
2. To what extent do you agree with the following statements about the diversity of your team?
Strongly disagree
Strongly agree
10. Team members are from different areas of expertise
1 2 3 4 5
11. Team members have skills that complement each other
1 2 3 4 5
12. Team members have a variety of different experiences
1 2 3 4 5
13. Team members vary in functional backgrounds
1 2 3 4 5
3. To what extent do you agree with the following statements about the coordination in your team?
Strongly disagree
Strongly agree
14. Team members work together in a well-coordination fashion
1 2 3 4 5
15. Team members have very few misunderstandings about what to do
1 2 3 4 5
16. Our team needs to backtrack and start over a lot
1 2 3 4 5
17. We accomplish tasks smoothly and efficiently
1 2 3 4 5
18. There is often confusion about how we will accomplish certain tasks
1 2 3 4 5
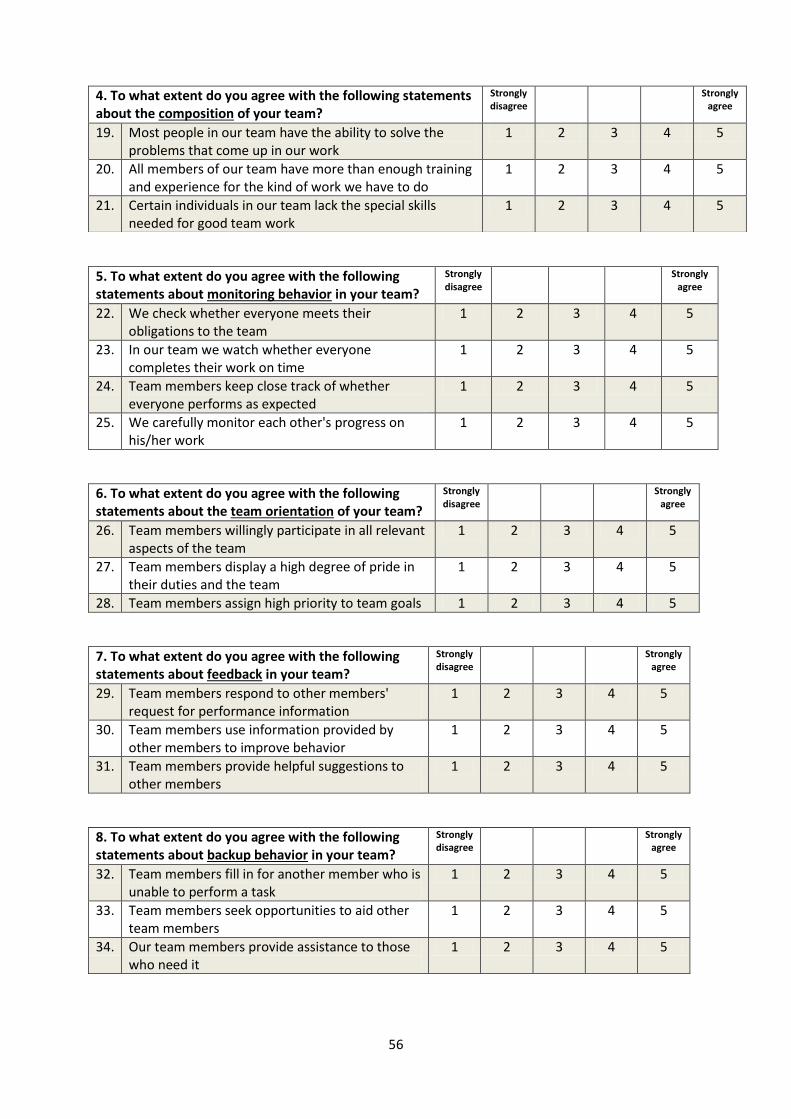
56
5. To what extent do you agree with the following statements about monitoring behavior in your team?
Strongly disagree
Strongly agree
22. We check whether everyone meets their obligations to the team
1 2 3 4 5
23. In our team we watch whether everyone completes their work on time
1 2 3 4 5
24. Team members keep close track of whether everyone performs as expected
1 2 3 4 5
25. We carefully monitor each other's progress on his/her work
1 2 3 4 5
6. To what extent do you agree with the following statements about the team orientation of your team?
Strongly disagree
Strongly agree
26. Team members willingly participate in all relevant aspects of the team
1 2 3 4 5
27. Team members display a high degree of pride in their duties and the team
1 2 3 4 5
28. Team members assign high priority to team goals 1 2 3 4 5
7. To what extent do you agree with the following statements about feedback in your team?
Strongly disagree
Strongly agree
29. Team members respond to other members' request for performance information
1 2 3 4 5
30. Team members use information provided by other members to improve behavior
1 2 3 4 5
31. Team members provide helpful suggestions to other members
1 2 3 4 5
8. To what extent do you agree with the following statements about backup behavior in your team?
Strongly disagree
Strongly agree
32. Team members fill in for another member who is unable to perform a task
1 2 3 4 5
33. Team members seek opportunities to aid other team members
1 2 3 4 5
34. Our team members provide assistance to those who need it
1 2 3 4 5
4. To what extent do you agree with the following statements about the composition of your team?
Strongly disagree
Strongly agree
19. Most people in our team have the ability to solve the problems that come up in our work
1 2 3 4 5
20. All members of our team have more than enough training and experience for the kind of work we have to do
1 2 3 4 5
21. Certain individuals in our team lack the special skills needed for good team work
1 2 3 4 5
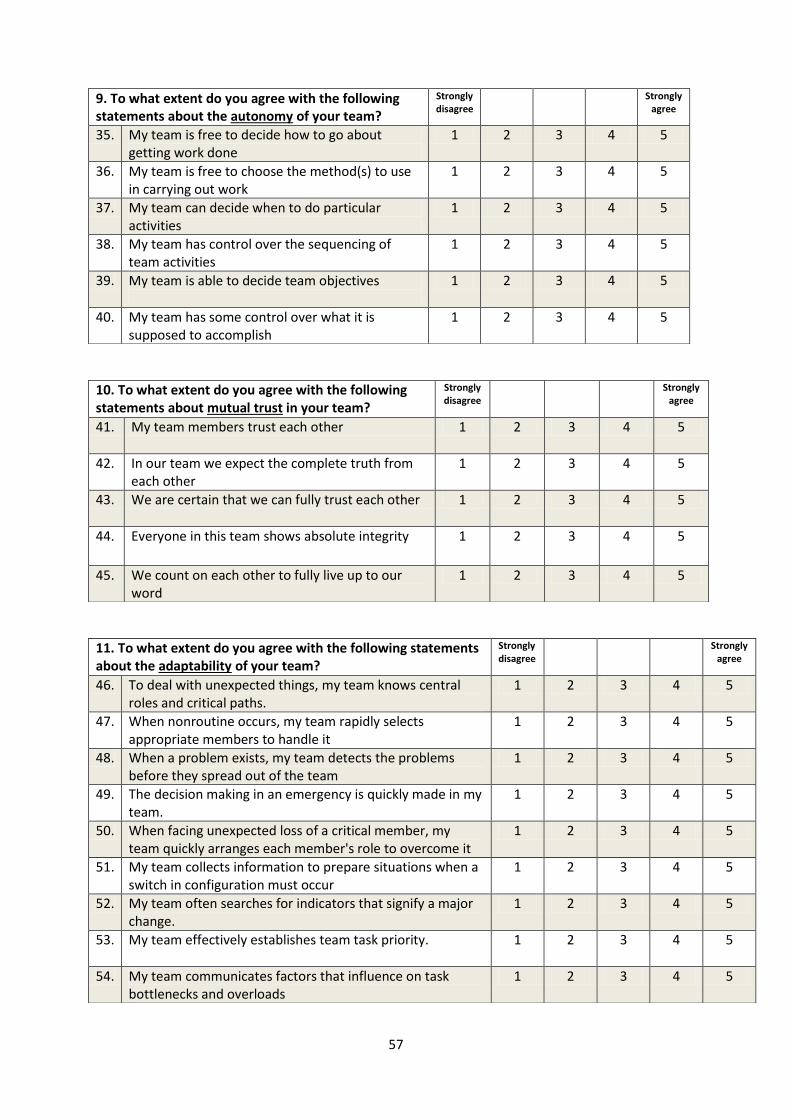
57
9. To what extent do you agree with the following statements about the autonomy of your team?
Strongly disagree
Strongly agree
35. My team is free to decide how to go about getting work done
1 2 3 4 5
36. My team is free to choose the method(s) to use in carrying out work
1 2 3 4 5
37. My team can decide when to do particular activities
1 2 3 4 5
38. My team has control over the sequencing of team activities
1 2 3 4 5
39. My team is able to decide team objectives
1 2 3 4 5
40. My team has some control over what it is supposed to accomplish
1 2 3 4 5
10. To what extent do you agree with the following statements about mutual trust in your team?
Strongly disagree
Strongly agree
41. My team members trust each other 1 2 3 4 5
42. In our team we expect the complete truth from each other
1 2 3 4 5
43. We are certain that we can fully trust each other 1 2 3 4 5
44. Everyone in this team shows absolute integrity 1 2 3 4 5
45. We count on each other to fully live up to our word
1 2 3 4 5
11. To what extent do you agree with the following statements about the adaptability of your team?
Strongly disagree
Strongly agree
46. To deal with unexpected things, my team knows central roles and critical paths.
1 2 3 4 5
47. When nonroutine occurs, my team rapidly selects appropriate members to handle it
1 2 3 4 5
48. When a problem exists, my team detects the problems before they spread out of the team
1 2 3 4 5
49. The decision making in an emergency is quickly made in my team.
1 2 3 4 5
50. When facing unexpected loss of a critical member, my team quickly arranges each member's role to overcome it
1 2 3 4 5
51. My team collects information to prepare situations when a switch in configuration must occur
1 2 3 4 5
52. My team often searches for indicators that signify a major change.
1 2 3 4 5
53. My team effectively establishes team task priority.
1 2 3 4 5
54. My team communicates factors that influence on task bottlenecks and overloads
1 2 3 4 5
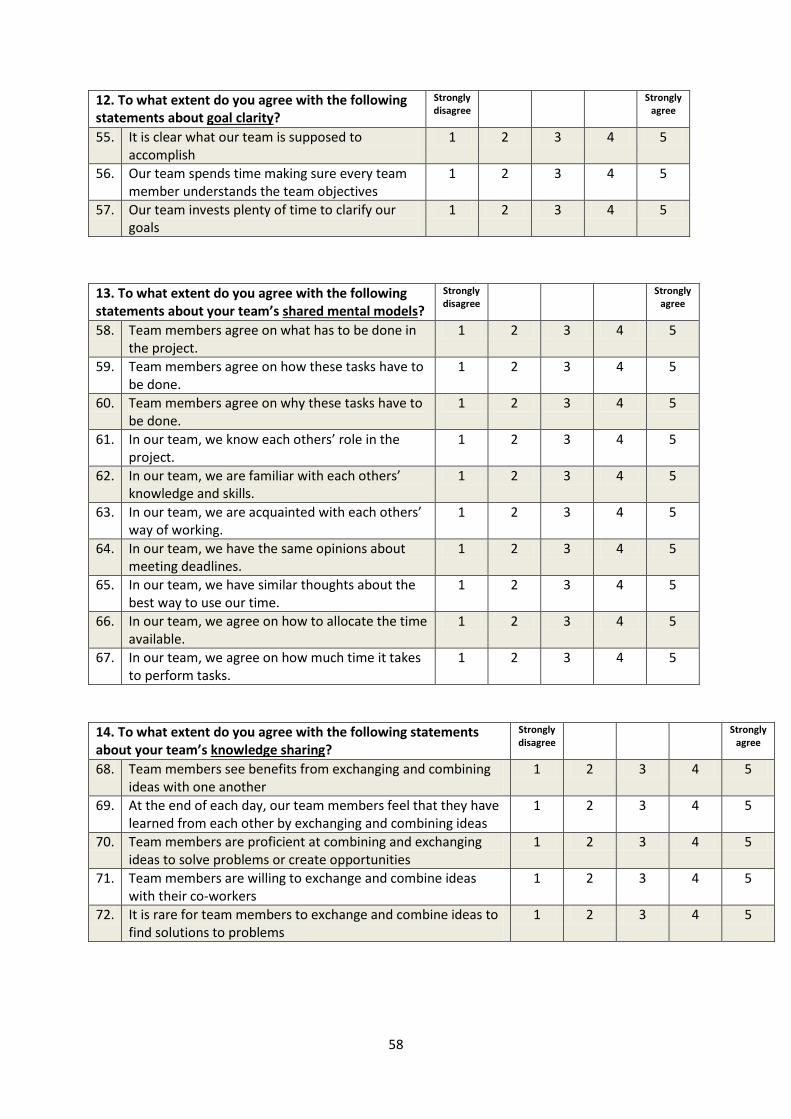
58
12. To what extent do you agree with the following statements about goal clarity?
Strongly disagree
Strongly agree
55. It is clear what our team is supposed to accomplish
1 2 3 4 5
56. Our team spends time making sure every team member understands the team objectives
1 2 3 4 5
57. Our team invests plenty of time to clarify our goals
1 2 3 4 5
13. To what extent do you agree with the following statements about your team’s shared mental models?
Strongly disagree
Strongly agree
58. Team members agree on what has to be done in the project.
1 2 3 4 5
59. Team members agree on how these tasks have to be done.
1 2 3 4 5
60. Team members agree on why these tasks have to be done.
1 2 3 4 5
61. In our team, we know each others’ role in the project.
1 2 3 4 5
62. In our team, we are familiar with each others’ knowledge and skills.
1 2 3 4 5
63. In our team, we are acquainted with each others’ way of working.
1 2 3 4 5
64. In our team, we have the same opinions about meeting deadlines.
1 2 3 4 5
65. In our team, we have similar thoughts about the best way to use our time.
1 2 3 4 5
66. In our team, we agree on how to allocate the time available.
1 2 3 4 5
67. In our team, we agree on how much time it takes to perform tasks.
1 2 3 4 5
14. To what extent do you agree with the following statements about your team’s knowledge sharing?
Strongly disagree
Strongly agree
68. Team members see benefits from exchanging and combining ideas with one another
1 2 3 4 5
69. At the end of each day, our team members feel that they have learned from each other by exchanging and combining ideas
1 2 3 4 5
70. Team members are proficient at combining and exchanging ideas to solve problems or create opportunities
1 2 3 4 5
71. Team members are willing to exchange and combine ideas with their co-workers
1 2 3 4 5
72. It is rare for team members to exchange and combine ideas to find solutions to problems
1 2 3 4 5
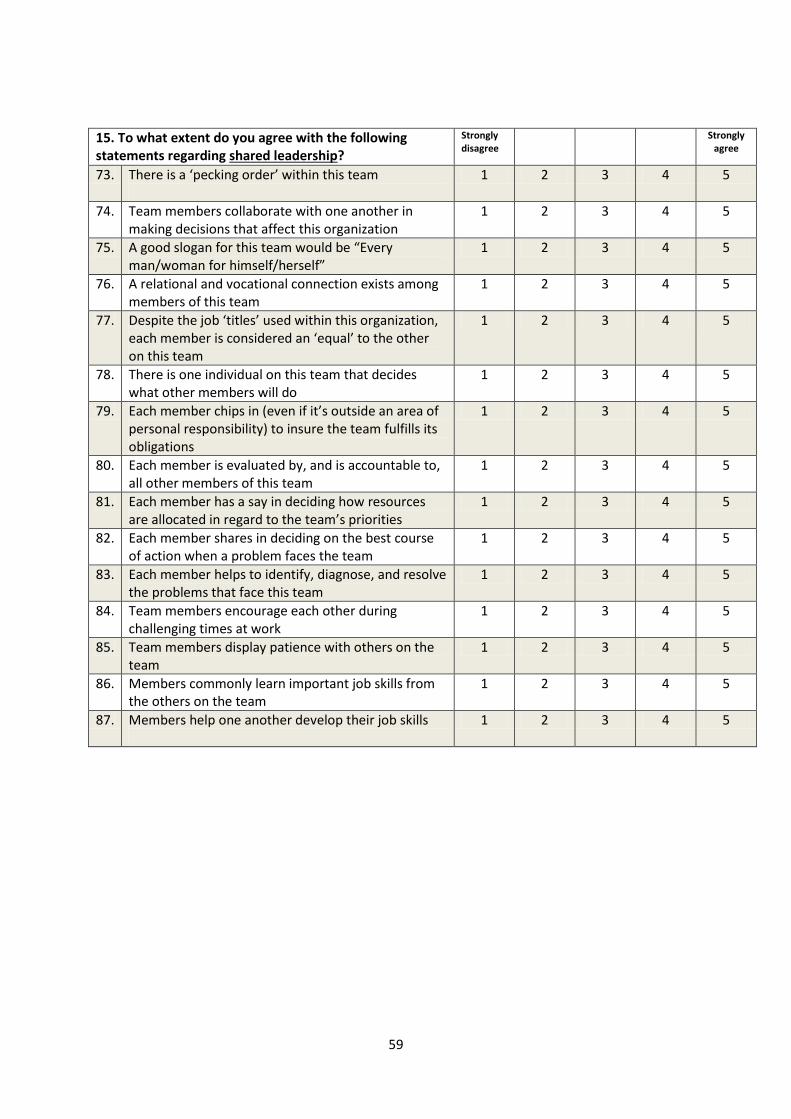
59
15. To what extent do you agree with the following statements regarding shared leadership?
Strongly disagree
Strongly agree
73. There is a ‘pecking order’ within this team
1 2 3 4 5
74. Team members collaborate with one another in making decisions that affect this organization
1 2 3 4 5
75. A good slogan for this team would be “Every man/woman for himself/herself”
1 2 3 4 5
76. A relational and vocational connection exists among members of this team
1 2 3 4 5
77. Despite the job ‘titles’ used within this organization, each member is considered an ‘equal’ to the other on this team
1 2 3 4 5
78. There is one individual on this team that decides what other members will do
1 2 3 4 5
79. Each member chips in (even if it’s outside an area of personal responsibility) to insure the team fulfills its obligations
1 2 3 4 5
80. Each member is evaluated by, and is accountable to, all other members of this team
1 2 3 4 5
81. Each member has a say in deciding how resources are allocated in regard to the team’s priorities
1 2 3 4 5
82. Each member shares in deciding on the best course of action when a problem faces the team
1 2 3 4 5
83. Each member helps to identify, diagnose, and resolve the problems that face this team
1 2 3 4 5
84. Team members encourage each other during challenging times at work
1 2 3 4 5
85. Team members display patience with others on the team
1 2 3 4 5
86. Members commonly learn important job skills from the others on the team
1 2 3 4 5
87. Members help one another develop their job skills
1 2 3 4 5
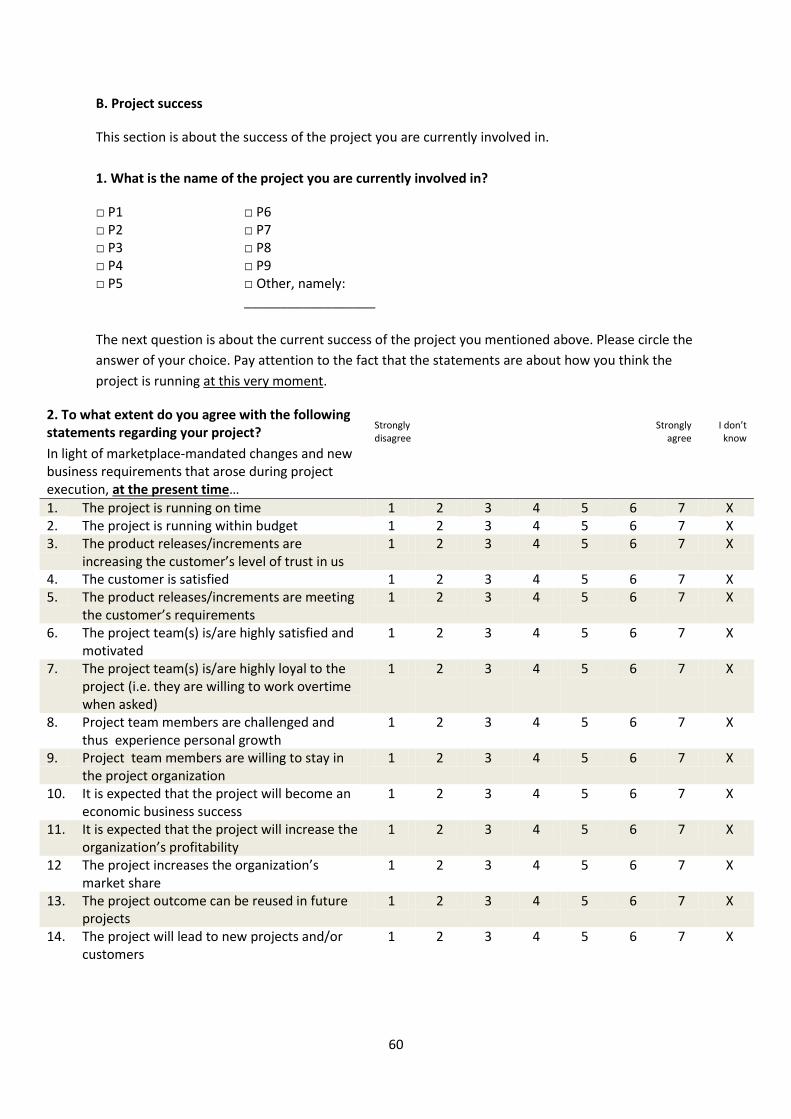
60
B. Project success
This section is about the success of the project you are currently involved in.
1. What is the name of the project you are currently involved in?
□ P1 □ P2 □ P3 □ P4 □ P5
□ P6 □ P7 □ P8 □ P9 □ Other, namely: __________________
The next question is about the current success of the project you mentioned above. Please circle the
answer of your choice. Pay attention to the fact that the statements are about how you think the
project is running at this very moment.
2. To what extent do you agree with the following statements regarding your project?
Strongly disagree
Strongly
agree
I don’t know
In light of marketplace-mandated changes and new business requirements that arose during project execution, at the present time…
1. The project is running on time 1 2 3 4 5 6 7 X 2. The project is running within budget 1 2 3 4 5 6 7 X 3. The product releases/increments are
increasing the customer’s level of trust in us 1 2 3 4 5 6 7 X
4. The customer is satisfied 1 2 3 4 5 6 7 X 5. The product releases/increments are meeting
the customer’s requirements 1 2 3 4 5 6 7 X
6. The project team(s) is/are highly satisfied and motivated
1 2 3 4 5 6 7 X
7. The project team(s) is/are highly loyal to the project (i.e. they are willing to work overtime when asked)
1 2 3 4 5 6 7 X
8. Project team members are challenged and thus experience personal growth
1 2 3 4 5 6 7 X
9. Project team members are willing to stay in the project organization
1 2 3 4 5 6 7 X
10. It is expected that the project will become an economic business success
1 2 3 4 5 6 7 X
11. It is expected that the project will increase the organization’s profitability
1 2 3 4 5 6 7 X
12 The project increases the organization’s market share
1 2 3 4 5 6 7 X
13. The project outcome can be reused in future projects
1 2 3 4 5 6 7 X
14. The project will lead to new projects and/or customers
1 2 3 4 5 6 7 X
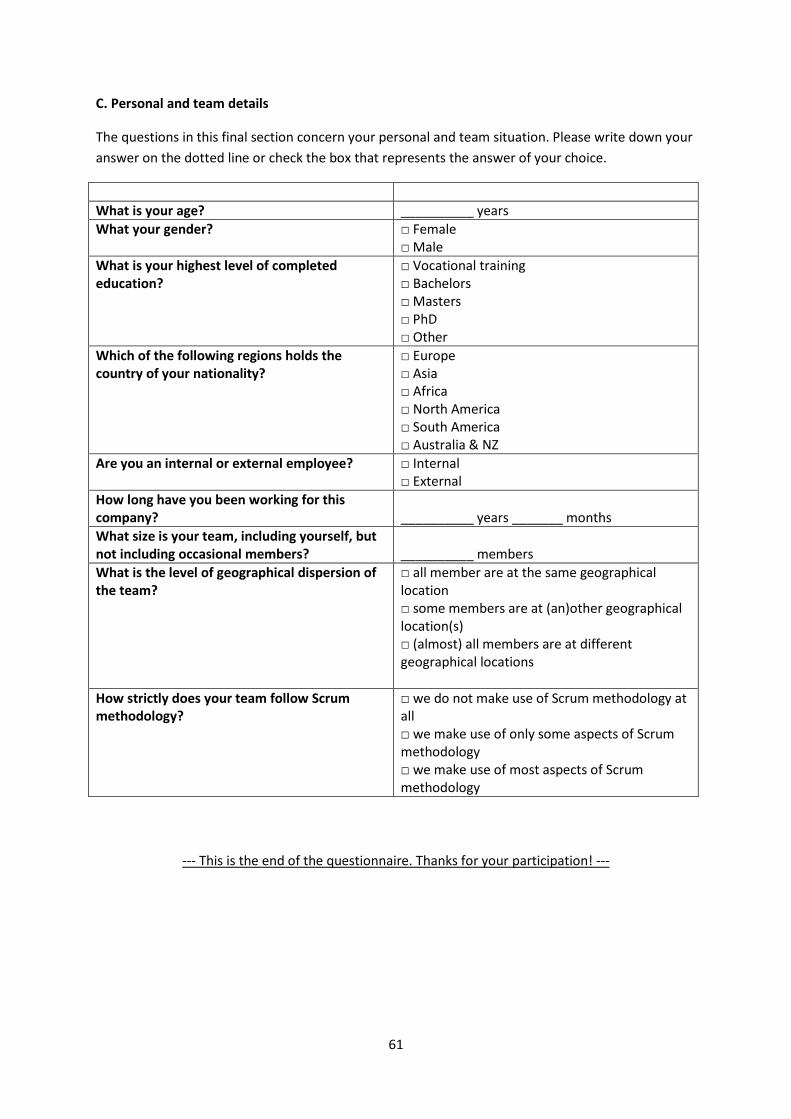
61
C. Personal and team details
The questions in this final section concern your personal and team situation. Please write down your
answer on the dotted line or check the box that represents the answer of your choice.
What is your age? __________ years
What your gender? □ Female □ Male
What is your highest level of completed education?
□ Vocational training □ Bachelors □ Masters □ PhD □ Other
Which of the following regions holds the country of your nationality?
□ Europe □ Asia □ Africa □ North America □ South America □ Australia & NZ
Are you an internal or external employee? □ Internal □ External
How long have you been working for this company?
__________ years _______ months
What size is your team, including yourself, but not including occasional members?
__________ members
What is the level of geographical dispersion of the team?
□ all member are at the same geographical location □ some members are at (an)other geographical location(s) □ (almost) all members are at different geographical locations
How strictly does your team follow Scrum methodology?
□ we do not make use of Scrum methodology at all □ we make use of only some aspects of Scrum methodology □ we make use of most aspects of Scrum methodology
--- This is the end of the questionnaire. Thanks for your participation! ---
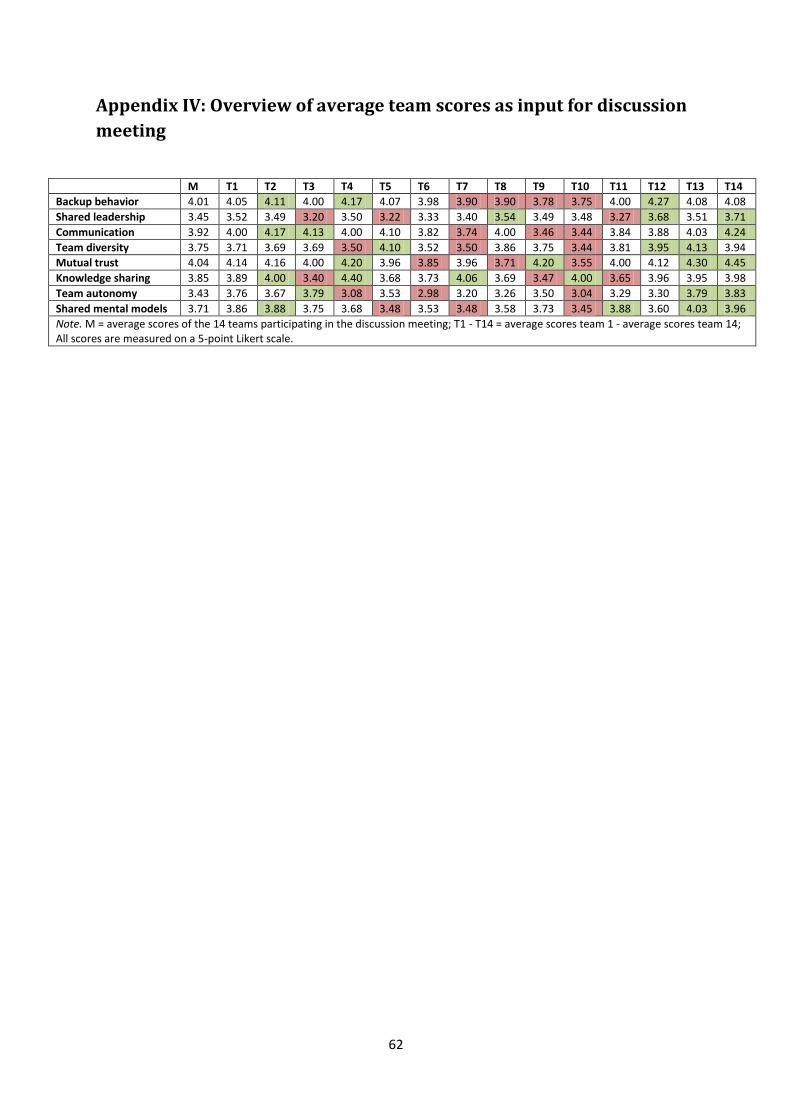
62
Appendix IV: Overview of average team scores as input for discussion
meeting
M T1 T2 T3 T4 T5 T6 T7 T8 T9 T10 T11 T12 T13 T14
Backup behavior 4.01 4.05 4.11 4.00 4.17 4.07 3.98 3.90 3.90 3.78 3.75 4.00 4.27 4.08 4.08
Shared leadership 3.45 3.52 3.49 3.20 3.50 3.22 3.33 3.40 3.54 3.49 3.48 3.27 3.68 3.51 3.71
Communication 3.92 4.00 4.17 4.13 4.00 4.10 3.82 3.74 4.00 3.46 3.44 3.84 3.88 4.03 4.24
Team diversity 3.75 3.71 3.69 3.69 3.50 4.10 3.52 3.50 3.86 3.75 3.44 3.81 3.95 4.13 3.94
Mutual trust 4.04 4.14 4.16 4.00 4.20 3.96 3.85 3.96 3.71 4.20 3.55 4.00 4.12 4.30 4.45
Knowledge sharing 3.85 3.89 4.00 3.40 4.40 3.68 3.73 4.06 3.69 3.47 4.00 3.65 3.96 3.95 3.98
Team autonomy 3.43 3.76 3.67 3.79 3.08 3.53 2.98 3.20 3.26 3.50 3.04 3.29 3.30 3.79 3.83
Shared mental models 3.71 3.86 3.88 3.75 3.68 3.48 3.53 3.48 3.58 3.73 3.45 3.88 3.60 4.03 3.96
Note. M = average scores of the 14 teams participating in the discussion meeting; T1 - T14 = average scores team 1 - average scores team 14; All scores are measured on a 5-point Likert scale.
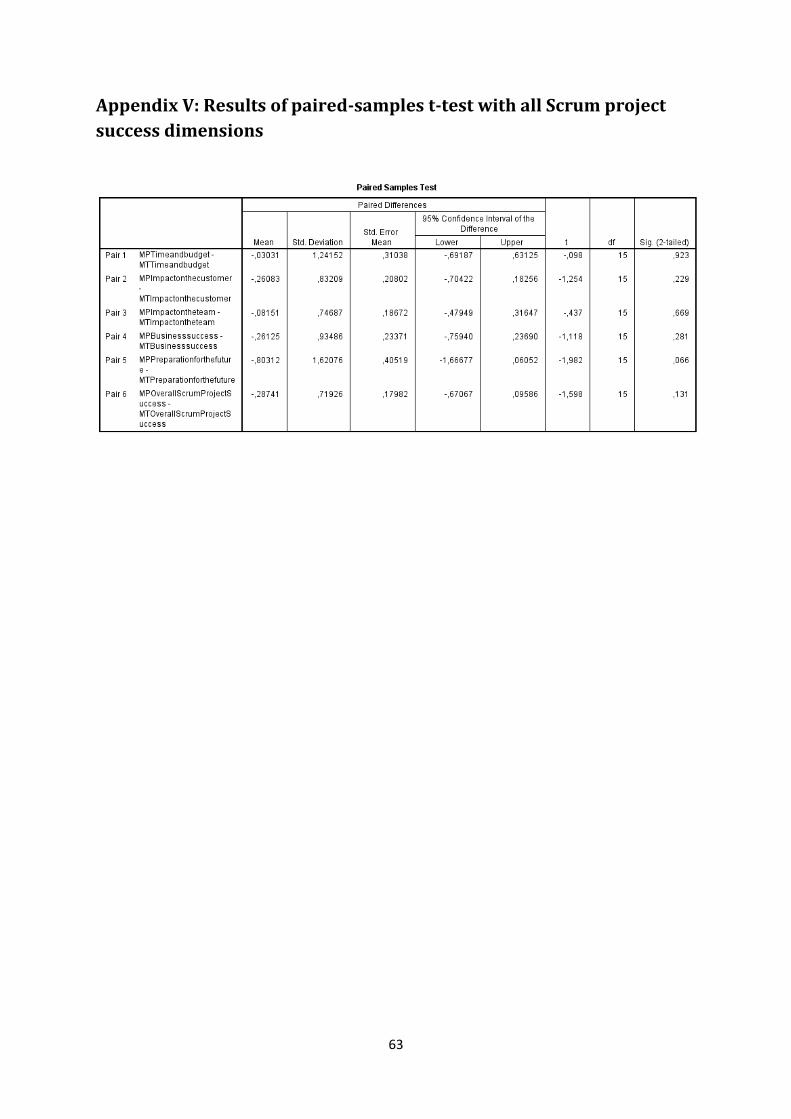
63
Appendix V: Results of paired-samples t-test with all Scrum project
success dimensions
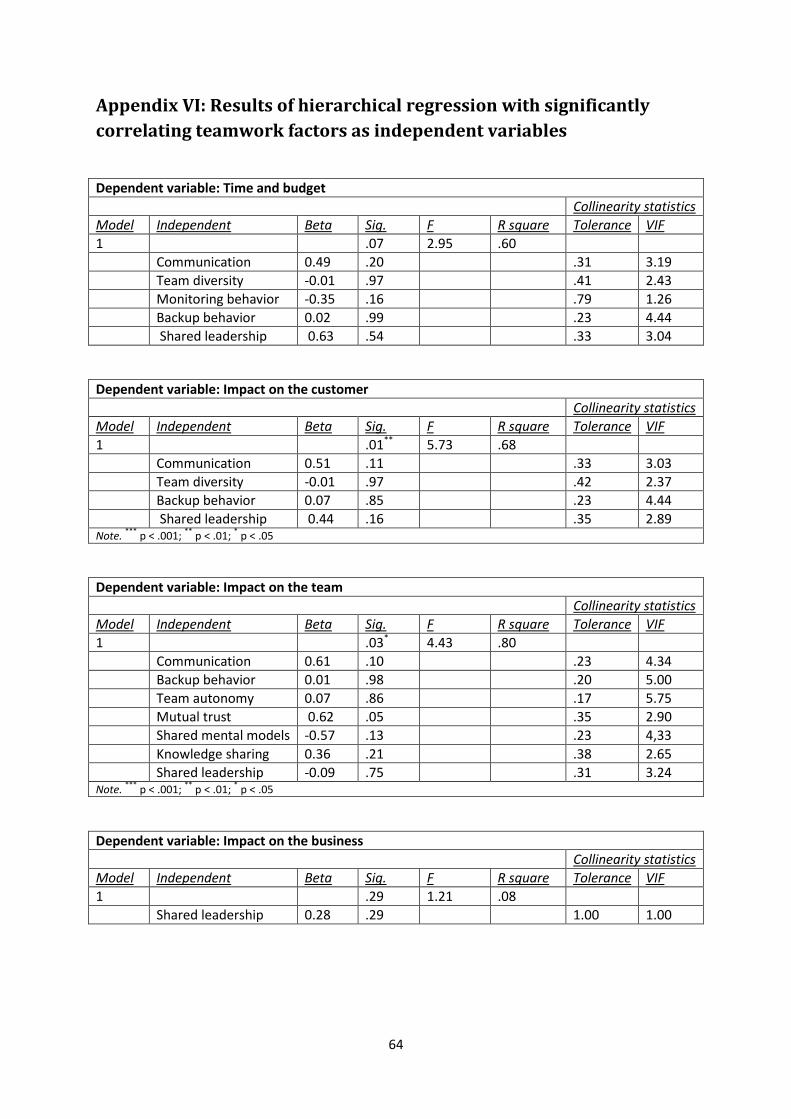
64
Appendix VI: Results of hierarchical regression with significantly
correlating teamwork factors as independent variables
Dependent variable: Time and budget
Collinearity statistics
Model Independent Beta Sig. F R square Tolerance VIF
1 .07 2.95 .60
Communication 0.49 .20 .31 3.19
Team diversity -0.01 .97 .41 2.43
Monitoring behavior -0.35 .16 .79 1.26
Backup behavior 0.02 .99 .23 4.44
Shared leadership 0.63 .54 .33 3.04
Dependent variable: Impact on the customer
Collinearity statistics
Model Independent Beta Sig. F R square Tolerance VIF
1 .01** 5.73 .68
Communication 0.51 .11 .33 3.03
Team diversity -0.01 .97 .42 2.37
Backup behavior 0.07 .85 .23 4.44
Shared leadership 0.44 .16 .35 2.89 Note.
*** p < .001;
** p < .01;
* p < .05
Dependent variable: Impact on the team
Collinearity statistics
Model Independent Beta Sig. F R square Tolerance VIF
1 .03* 4.43 .80
Communication 0.61 .10 .23 4.34
Backup behavior 0.01 .98 .20 5.00
Team autonomy 0.07 .86 .17 5.75
Mutual trust 0.62 .05 .35 2.90
Shared mental models -0.57 .13 .23 4,33
Knowledge sharing 0.36 .21 .38 2.65
Shared leadership -0.09 .75 .31 3.24 Note.
*** p < .001;
** p < .01;
* p < .05
Dependent variable: Impact on the business
Collinearity statistics
Model Independent Beta Sig. F R square Tolerance VIF
1 .29 1.21 .08
Shared leadership 0.28 .29 1.00 1.00
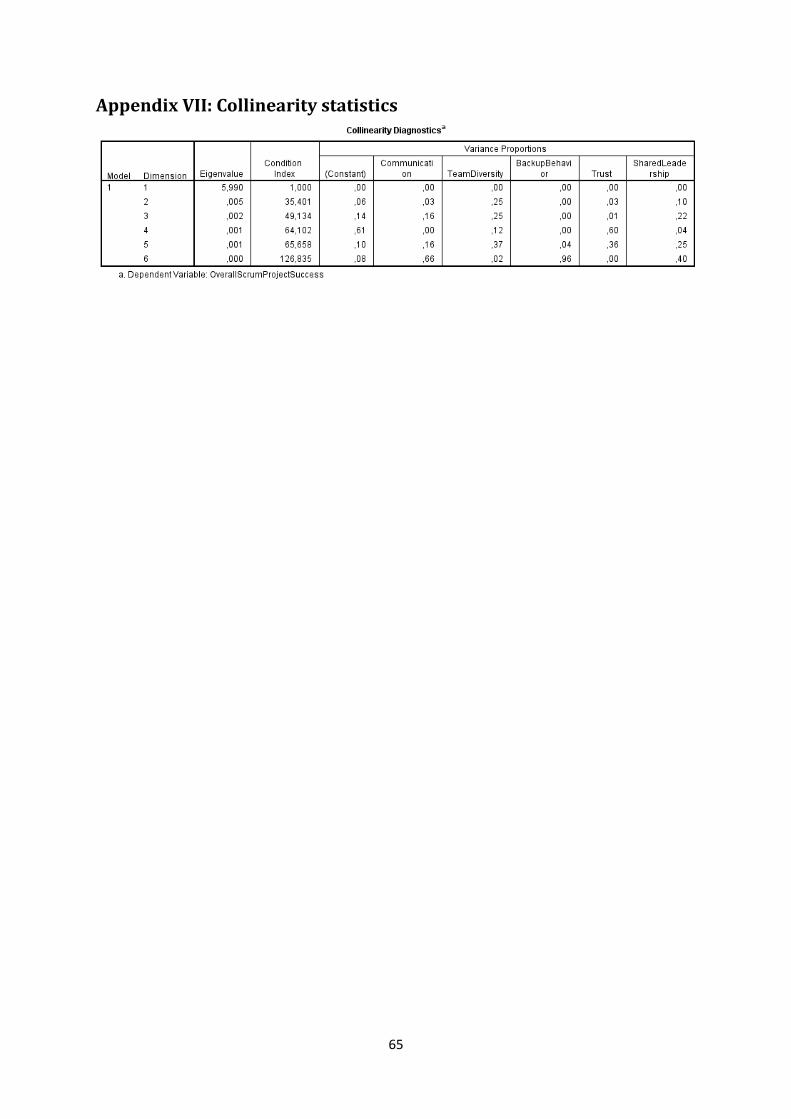
65
Appendix VII: Collinearity statistics