eiichi kusano · 2019-09-19 · aung min and theint sandy htut chapter 7 summary and policy...
TRANSCRIPT
Eiichi Kusano
The Cold Chain for Agri-food Products in ASEAN
Published by Economic Research Institute for ASEAN and East Asia (ERIA) Sentral Senayan 2, 6th floor, Jalan Asia Afrika no.8, Central Jakarta 10270 Indonesia © Economic Research Institute for ASEAN and East Asia 2019.
ERIA Research Project FY2018 No.11 Published in September 2019
All rights reserved. No part of this publication may be reproduced, stored in a retrieval system, or transmitted in any form by any means electronic or mechanical without prior written notice to and permission from ERIA.
The findings, interpretations, conclusions expressed herein do not necessarily reflect the views and policies of the Economic Research Institute for ASEAN and East Asia, its Governing Board, Academic Advisory Council, or the institutions and governments they represent.
Materials in this publication may be freely quoted or reprinted with proper acknowledgement.
This report is a part of the work mandated under ERIA Research Project from 2016 to 2019 on ‘Research Project for Policy Recommendations to ASEAN Countries on Realization of Higher Value Added of Agricultural Products’ funded by Ministry of Agriculture, Forestry and Fisheries, Japan. This research is supported by Prof. Yasuhiro Yamada, Special Assistant to the President of ERIA on CLMV Affairs, and Amane Kameda of JETRO Jakarta.
iii
Contents
List of Figures v List of Tables vii Overview ix Chapter 1 Introduction 1 Eiichi Kusano
Chapter 2 The Cold Chain in Thailand 8
Sumet Ongkittikul, Vari Plongon, Jitlaykha Sukruay, and Kittiya Yisthanichakul
Chapter 3 Overview of the Cold Chain for Agriculture in Viet Nam 62
Dang Kim Khoi, Pham Thi Kim Dung, Dang Kim Son, Do Huy Thiep, and Pham Duc Thinh
Chapter 4 A Cold Chain Study of Indonesia 101
PT Capricorn Indonesia Consult
Chapter 5 Inter-State and Transit Trade by Using the Cold Chain in the Lao
People’s Democratic Republic 148
Phanhpakit Onphanhdala
Chapter 6 The Cold Chain in Myanmar 169
Aung Min and Theint Sandy Htut
Chapter 7 Summary and Policy Implications 243
Eiichi Kusano

iv
List of Figures
Figure 1.1 A Typical Example of the Temperature Zone of the Cold Chain 3
Figure 1.2 Target Countries and Logistics Performance Index (LPI) Scores in
2018
4
Figure 2.1 Thailand’s LPI Scorecard Compared with Best Performance
Countries
16
Figure 2.2 The Capacity of Cold Storage in Thailand by Region 36
Figure 3.1 Viet Nam Agricultural Trade Growth, 2001–2017 64
Figure 3.2 Intermediate Seafood Imports of Viet Nam (US$ million) 65
Figure 3.3 Viet Nam’s Meat Imports by Value, 2005–2017 66
Figure 3.4 Import Values of Selected Fruits in Viet Nam, 2005–2017 66
Figure 3.5 Number of Modern Retail Shops in Viet Nam, 2014–2017 68
Figure 3.6 Production of High-value Agricultural Products 69
Figure 3.7 Number of Large Farms in Viet Nam, 2011–2017 70
Figure 3.8 The Flow of Imported Products for Direct Consumption 73
Figure 3.9 The Flow of Seafood Exports 75
Figure 3.10 The Flow of Intermediate Seafood Products 76
Figure 3.11 The Flow of Chilled Fruit and Vegetables in the Domestic Market 78
Figure 3.12 Cold Storage Capacity Growth in Viet Nam 79
Figure 3.13 Map of Government Agencies Related to Good Safety in Viet Nam 93
Figure 3.14 The Emerging Markets Logistics Index 2018 96
Figure 4.1 Distribution System of Food Products Based on Handling
Characteristics
112
Figure 4.2 Development of Meat Production, 2014–2018 114
Figure 4.3 Total Cold Storage Rental Company by Business Field, 2018 132
Figure 5.1 Tiers of Cold Chain Management in the Lao PDR 150
Figure 5.2 Maps of international borders 153
Figure 5.3 Selected Meat and Aquatic Products, Import Value from Thailand
(in US$’000)
158
Figure 5.4 Vegetable and Fruit Import Value from Thailand (in US$’000) 159
v
Figure 6.1 Percentage Contribution of Total Cold Chain Potential in Myanmar
(B)
176
Figure 6.2 The Flow of Fishery Products in Myanmar 181
Figure 6.3 Activities at Central San Pya Fish Market, Yangon 182
Figure 6.4 Refrigerated Trucks Lined at San Pya Fish Market, Yangon 182
Figure 6.5 The Flow of Livestock Products in Myanmar 186
Figure 6.6 Annual Foreign Trade of Meat Products (tons) 188
Figure 6.7 Annual Import of Dairy Products (tons) 188
Figure 6.8 The Flow of Selected Agricultural Products in Myanmar 192
Figure 6.9 Cold Chain Product Flow for Fresh Produce in Pyin Oo Lwin City,
Mandalay Region
193
Figure 6.10 The Flow of Fresh Produce in Yangon Region 194
Figure 6.11 Two Reefer Containers Placed at the New Danyingone Wholesale
Market
197
Figure 6.12 Building 1; the Fruit Wholesale Centre of the Danyingone
Wholesale Market
198
Figure 6.13 Processed Meat and Seafood Displayed at Hotpot City Yangon 201
Figure 6.14 Product Flow of Processed Seafood and Meat in Yangon Region 202
Figure 6.15 Processed Meat and Seafood Found at City Mart Supermarket 202
Figure 6.16 Annual Import of Refrigerated Trucks (FY 2012/2013 to FY
2017/2018)
205
Figure 6.17 Company’s Fish Farm in Ayeyarwaddy Region 209
Figure 6.18 Aung Kyaw Zaw Ice Plant in the Ayeyarwaddy Region 210
Figure 6.19 Aung Kyaw Zaw Ice Plant in the Ayeyarwaddy Region 210
Figure 6.20 Aung Kyaw Zaw Ice Plant in the Ayeyarwaddy Region 211
Figure 6.21 Loading Ice into a Refrigerated Truck from Company Owned Ice
Plant
211
Figure 6.22 Loading Ice into Cold Boxes from Company Owned Ice Plant 212
Figure 6.23 Loading Fish from an Aquaculture Farm along Yangon Pathein
Road
212
Figure 6.24 Loading Fish from an Aquaculture Farm along Yangon Pathein
Road
213
vi
Figure 6.25 Loading Fish from an Aquaculture Farm along Yangon Pathein
Road
213
Figure 6.26 Product Flow of Exported Fish and Prawns into China 215
Figure 6.27 Fish and Prawn Trucks Waiting for Customs Declaration at the
Muse 105 Mile Trade Zone
215
Figure 6.28 Reefer Trailers Found on the Mandalay – Muse Route 216
Figure 6.29 National Prosperity's Cold Store Facility in Muse 216
Figure 6.30 Product Flow of Re-export Meat Products 218
Figure 6.31 A SINO Reefer Trailer Found in Muse 218
Figure 6.32 Product Flow of Strawberries 220
Figure 6.33 Organic Strawberry Plantation of Cold Chain Pioneer in Pyin Oo
Lwin
221
Figure 6.34 Garlic Chive Plantation of Cold Chain Pioneer in Pyi Oo Lwin City 222
Figure 6.35 PSL's 8-ton Truck in Pyin Oo Lwin for Produce Pickup 223
Figure 6.36 Isuzu 3-ton Reefer Box Truck Found at the Yay Ngal Station in Pyin
Oo Lwin City
223
Figure 6.37 PSL's Yay Ngal Truck Station in Pyin Oo Lwin City, Mandalay
Region
224
vii
List of Tables
Table 2.1 Thailand GDP 9
Table 2.2 Interview Survey of Logistics Providers and Logistics Users 11
Table 2.3 Interview Survey of Supporters 11
Table 2.4 Cold Chain Processes 12
Table 2.5 Logistics Costs 15
Table 2.6 Logistics Performance Index of Thailand in 2018 16
Table 2.7 Freight Transportation Rate 18
Table 2.8 Growth Rates of Imports and Exports of Cold Chain Products (%) 19
Table 2.9 Summary of Policies 24
Table 2.10 The Total Value of the Frozen Food Market in Thailand, from 2011
to 2015
25
Table 2.11 Import and export values of cold chain products in Thailand 26
Table 2.12 Import Value of Cold Chain Products in Thailand 28
Table 2.13 Export value of cold chain products in Thailand 29
Table 2.14 The Volume of Imported and Exported Reefer Containers 30
Table 2.15 Number of Import and Export Reefer Containers (Box) 31
Table 2.16 Overview of the Chilled and Frozen Transportation Business
Group in 2019
32
Table 2.17 Number of Refrigerated Vehicles Operators in 2019 32
Table 2.18 Capacity of Warehouse, Silo, and Cold Storage in 2015 (million
metric tons)
33
Table 2.19 The Number of Total Warehouse, Silo, and Cold Storage Operators
in 2019
34
Table 2.20 Overview of the Cold Warehouse Business Group in 2019 34
Table 2.21 Details of the Cold Warehouses from Respondents in 2019 35
Table 2.22 Main Players of Transportation in the Cold Chain 41
Table 2.23 Main Players of Storage in the Cold Chain 42
Table 2.24 Main Users in Cold Chain, Clients of JWD InfoLogistics 44
Table 2.25 Policies Supporting the Cold Chain in Thailand 50
viii
Table 2.26 Organizations Comprising the Thai Federation on Logistics 52
Table 3.1 Comparison between Traditional and Modern Grocery Retail
Channels in Viet Nam, 2012–2017
67
Table 3.2 Information and Glossaries of Major Foreign Stakeholders in the
Commercial Cold Storage Market by Region
81
Table 3.3 Information and Glossaries of Major Domestic Stakeholders in
Commercial Cold Storage Market by Region
83
Table 3.4 Information and Glossaries of Major Domestic Stakeholders in the
Self-operating Segment of Seafood Cold Storage by Product
86
Table 3.5 Information and Glossaries of Major Stakeholders in Commercial
Cold Transportation Services
90
Table 4.1 Gross Domestic Products Based on Current Prices, 2014–2018
(Billion Rupiah)
103
Table 4.2 Cold Storage Company and Capacity in Indonesia, 2018 105
Table 4.3 Projection of Potential Demand for Cold Storage in Indonesia,
2019–2024
107
Table 4.4 Development of Frozen Food Consumption in Indonesia, 2014–
2018 (Ton)
108
Table 4.5 Development of Indonesia Frozen Food Export, 2014–2018 109
Table 4.6 Export of Frozen Food by Destination Country, 2017 110
Table 4.7 Development of Frozen Food Import by Indonesia, 2014–2018 110
Table 4.8 Import of Frozen Food by Origin Country, 2017 111
Table 4.9 Products That Require Cold Storage, Abbreviated 113
Table 4.10 Development of Population and Production of Broilers and Layers,
2014–2018
115
Table 4.11 Production of Fishery Products of Indonesia Based on Its Source,
2014–2018
117
Table 4.12 Frozen Fish and Shrimp Company in Indonesia, 2018 119
Table 4.13 Development of Sausage and Nugget Production, 2014–2018 122
Table 4.14 Producers of Sausage and Nugget in Indonesia and Its Capacity,
2018
123
Table 4.15 Storing Temperature and Age of Vaccine Based on Type of Vaccine 125
Table 4.16 Products That Require Cold Storage, Detailed 127
ix
Table 4.17 Number of Cold Storage Company by Business Field, 2018 129
Table 4.18 List of Companies Engaged in the Cold Storage Industry in
Jabodetabek, 2018
130
Table 4.19 Cold Storage Rental Cost of PT WCS, 2018 133
Table 4.20 Cost of Rental and Sales of Reefer Container by PT BCI, 2018 133
Table 4.21 Cold Storage Rental Company and Its Capacity in Jabodetabek,
2018
134
Table 4.22 Refrigerated Transportation Rental Company in Jabodetabek,
2018
136
Table 4.23 Price of New Refrigerated Truck, 2018 137
Table 4.24 Food Products of Some Food Companies That Require Cold Chain
Service
140
Table 4.25 Products of PT Unilever That Require Cold Chain 141
Table 4.26 Demand for cold storage in Indonesia, 2018 144
Table 5.1 Top Three Imported Food Products from Thailand 152
Table 5.2 Inter-state and Transit Import Values by International Border, FY
2013–2017 (US$’000)
154
Table 5.3 Inter-state and Transit Import Values of Chilled and Frozen
Products by Border, FY 2015–2017
155
Table 5.4 Inter-state and Transit Import Values of Chilled and Frozen
Products by Exporter, FY 2015–2017
156
Table 5.5 Inter-state and Transit Import Volumes of Chilled and Frozen
Products by Exporter, FY 2015–2017
156
Table 5.6 Inter-state and Transit Import Values of Chilled and Frozen
Products by Product, FY 2015–2017
157
Table 5.7 Laws, Regulations, Customs, and Formalities Related to Inter-state
and Transit Transport
161
Table 5.8 Laws and Regulations on Transport 163
Table 5.9 List of Key Informant Interviewees (KIIs) 164
Table 5.10 List of Cold Chain Group Discussion 166
Table 5.11 Challenges of the Cold chain and Logistics Operations 166
Table 6.1 Sample Allocation 170
Table 6.2 Current Cold Chain Demand in Myanmar (FY 2017/2018 based) 172
x
Table 6.3 Current Cold Chain Demand for Domestic Consumption in
Myanmar (FY 2017/2018) (A)
173
Table 6.4 Transition of Import of Refrigerated and Frozen Foods 175
Table 6.5 Current Cold Chain Sector of Myanmar in FY 2017/2018 (C and D)
(Ton)
177
Table 6.6 Cold Chain Demand by Product Category in FY 2017/2018 (Ton) 178
Table 6.7 Annual Statistics of Fishery Products from FY 2015/2016 to FY
2017/2018 (Ton)
178
Table 6.8 Ice Plants by State and Region 179
Table 6.9 Annual Imports of Fishery Products 183
Table 6.10 Annual Export of Fishery Products 184
Table 6.11 Annual Foreign Trade of Fishery Products 185
Table 6.12 Annual Statistics of Meat Products from FY 2015/2016 to FY
2017/2018 (tons)
185
Table 6.13 Annual Statistics of Selected Agricultural Products (tons) 189
Table 6.14 Production of Major Selected Agricultural Products in FY
2017/2018
190
Table 6.15 Foreign Trade of Agricultural Products in FY 2017/2018 190
Table 6.16 Registered Cold Storages and Processing Plants in Myanmar
(2018)
203
Table 6.17 Top 3PL Cold Chain Warehousing Service Providers in the Yangon
Region
204
Table 6.18 Estimated Cold Storage Capacity of Myanmar in 2018 204
Table 6.19 Top 3PL Cold Chain Transportation Service Providers in the
Yangon Region
206
Table 6.20 Estimated Purchase Prices of Cold Chain Trucks (2018) 206
Table 6.21 Top five Meat Traders in FY 2016/2017 208
Table 6.22 No. of Cold Chain Trucks Coming into Muse Each Day (Under
Normal Growth)
214
Table 6.23 Total Regional Trade in 2017 (Potential of Transit Trade Via
Myanmar)
234
Table 7.1 Demand for the Cold chain and Values and Changes in Circulated
Products
244
xi
Table 7.2 Composition of cold chain demand 246
Table 7.3 Major Cold Warehousing Services 249
Table 7.4 Major Cold Chain Transportation Service Providers 249
Table 7.5 Supply of Cold Storage 251
xii
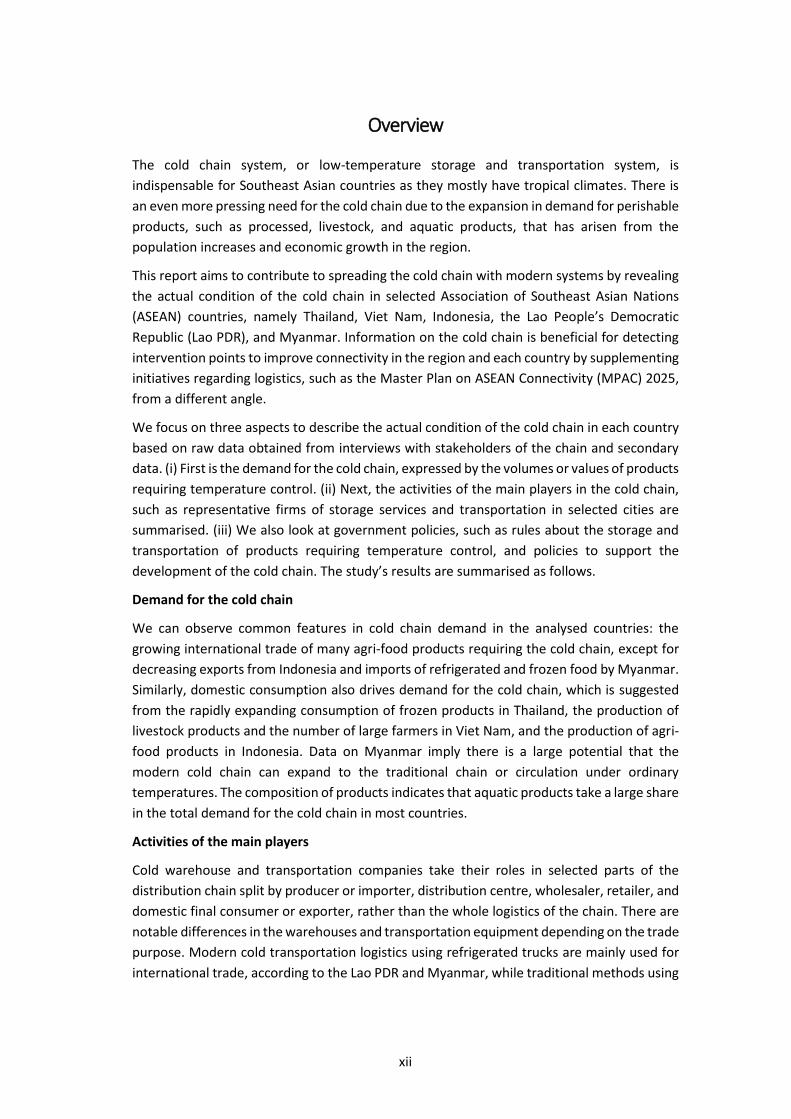
Overview The cold chain system, or low-temperature storage and transportation system, is
indispensable for Southeast Asian countries as they mostly have tropical climates. There is
an even more pressing need for the cold chain due to the expansion in demand for perishable
products, such as processed, livestock, and aquatic products, that has arisen from the
population increases and economic growth in the region.
This report aims to contribute to spreading the cold chain with modern systems by revealing
the actual condition of the cold chain in selected Association of Southeast Asian Nations
(ASEAN) countries, namely Thailand, Viet Nam, Indonesia, the Lao People’s Democratic
Republic (Lao PDR), and Myanmar. Information on the cold chain is beneficial for detecting
intervention points to improve connectivity in the region and each country by supplementing
initiatives regarding logistics, such as the Master Plan on ASEAN Connectivity (MPAC) 2025,
from a different angle.
We focus on three aspects to describe the actual condition of the cold chain in each country
based on raw data obtained from interviews with stakeholders of the chain and secondary
data. (i) First is the demand for the cold chain, expressed by the volumes or values of products
requiring temperature control. (ii) Next, the activities of the main players in the cold chain,
such as representative firms of storage services and transportation in selected cities are
summarised. (iii) We also look at government policies, such as rules about the storage and
transportation of products requiring temperature control, and policies to support the
development of the cold chain. The study’s results are summarised as follows.
Demand for the cold chain
We can observe common features in cold chain demand in the analysed countries: the
growing international trade of many agri-food products requiring the cold chain, except for
decreasing exports from Indonesia and imports of refrigerated and frozen food by Myanmar.
Similarly, domestic consumption also drives demand for the cold chain, which is suggested
from the rapidly expanding consumption of frozen products in Thailand, the production of
livestock products and the number of large farmers in Viet Nam, and the production of agri-
food products in Indonesia. Data on Myanmar imply there is a large potential that the
modern cold chain can expand to the traditional chain or circulation under ordinary
temperatures. The composition of products indicates that aquatic products take a large share
in the total demand for the cold chain in most countries.
Activities of the main players
Cold warehouse and transportation companies take their roles in selected parts of the
distribution chain split by producer or importer, distribution centre, wholesaler, retailer, and
domestic final consumer or exporter, rather than the whole logistics of the chain. There are
notable differences in the warehouses and transportation equipment depending on the trade
purpose. Modern cold transportation logistics using refrigerated trucks are mainly used for
international trade, according to the Lao PDR and Myanmar, while traditional methods using
xiii
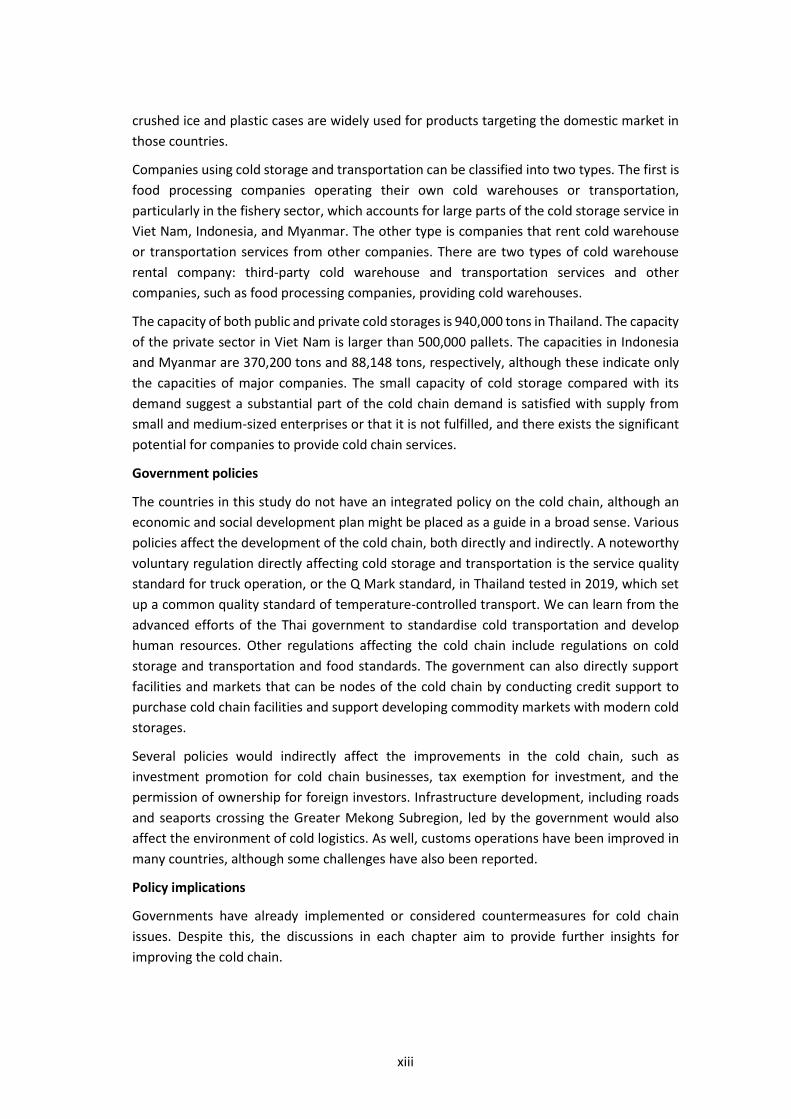
crushed ice and plastic cases are widely used for products targeting the domestic market in
those countries.
Companies using cold storage and transportation can be classified into two types. The first is
food processing companies operating their own cold warehouses or transportation,
particularly in the fishery sector, which accounts for large parts of the cold storage service in
Viet Nam, Indonesia, and Myanmar. The other type is companies that rent cold warehouse
or transportation services from other companies. There are two types of cold warehouse
rental company: third-party cold warehouse and transportation services and other
companies, such as food processing companies, providing cold warehouses.
The capacity of both public and private cold storages is 940,000 tons in Thailand. The capacity
of the private sector in Viet Nam is larger than 500,000 pallets. The capacities in Indonesia
and Myanmar are 370,200 tons and 88,148 tons, respectively, although these indicate only
the capacities of major companies. The small capacity of cold storage compared with its
demand suggest a substantial part of the cold chain demand is satisfied with supply from
small and medium-sized enterprises or that it is not fulfilled, and there exists the significant
potential for companies to provide cold chain services.
Government policies
The countries in this study do not have an integrated policy on the cold chain, although an
economic and social development plan might be placed as a guide in a broad sense. Various
policies affect the development of the cold chain, both directly and indirectly. A noteworthy
voluntary regulation directly affecting cold storage and transportation is the service quality
standard for truck operation, or the Q Mark standard, in Thailand tested in 2019, which set
up a common quality standard of temperature-controlled transport. We can learn from the
advanced efforts of the Thai government to standardise cold transportation and develop
human resources. Other regulations affecting the cold chain include regulations on cold
storage and transportation and food standards. The government can also directly support
facilities and markets that can be nodes of the cold chain by conducting credit support to
purchase cold chain facilities and support developing commodity markets with modern cold
storages.
Several policies would indirectly affect the improvements in the cold chain, such as
investment promotion for cold chain businesses, tax exemption for investment, and the
permission of ownership for foreign investors. Infrastructure development, including roads
and seaports crossing the Greater Mekong Subregion, led by the government would also
affect the environment of cold logistics. As well, customs operations have been improved in
many countries, although some challenges have also been reported.
Policy implications
Governments have already implemented or considered countermeasures for cold chain
issues. Despite this, the discussions in each chapter aim to provide further insights for
improving the cold chain.
xiv
Hard assets, such as warehouses and trucks, in specific regions or parts of the chain are
insufficient in terms of quantity and quality. For example, Viet Nam reports that both
refrigerated vehicle resources and refrigerated warehouses are not enough in the areas that
produce agricultural products. The modified cold vans with attached air conditioners widely
used by small transportation companies have room to reinforce their equipment to ensure
the quality of transported products. In addition, home delivery using cold insulation boxes
attached to motorbikes are thought to be a potential investment area. Investment in
agriculture and fishery, which are affected by natural conditions, is risky and costly. A clear
vision from the government showing the development priorities of the cold chain and the
public–private partnership mechanism would ease investors’ decisions about entry into
those sectors.
This report often stresses the insufficient soft assets in the cold chain, especially human
resources. This includes the shortage of truck drivers in the cold chain and the insufficient
English skills and knowledge for working across borders. There is a need for training for
different types of vehicles before issuing driving licences, and the expectation for universities
to educate the staff and managers of companies involved in the cold chain.
The lack of quantity and quality of infrastructure, including roads, railways, waterways, ports,
and electricity supply, can cause high logistics costs and damage perishable products. The
challenges for roads include the availability of short-distance roads, the quality of roads, and
traffic conditions. This argument contains a wide range of issues, such as investment to fulfil
highway equipment, road maintenance, traffic safety, traffic control, substitutional
transportation modes, and methods of road construction. Stable electricity supply in the
routes of the cold chain is also needed to reduce the costs of cold storage and transportation.
Integrative management of the cold chain would decrease the risks and costs during the
preservation and transportation of products. Strengthening the vertical relationship between
companies or achieving further vertical integration could be measures to realise such
integrative management. Another essential factor is individual technologies, such as the
sensor and transmitter systems used to send data or communication networks between the
actors of supply chains.
Connectivity in terms of international trade through customs is also a notable issue. In
particular, the Lao PDR and Myanmar are paying attention to transit trade as a key driver to
develop the cold chain, since it can expand without being restricted by the scale of domestic
production. Although the high connectivity of international trade requires efficient customs
operations, there would be still several issues in customs in the reported countries. The Lao
PDR argues the need for decreasing customs procedures and releasing a clear statement
about the time and fees of customs operations. The cold chain should accordingly improve
in various aspects since progress in international connectivity suggests an intensification of
international competition in cold chain industries.
1
Chapter 1
Introduction
Eiichi Kusano1
1.1. Background
The cold chain, or low-temperature storage and transportation system, is indispensable for
countries in Southeast Asia (SEA) as they mostly have a tropical climate. There is an even more
pressing need for the cold chain due to the expansion of demand for perishable products, such
as processed, livestock, and aquatic products, due to population increases and economic growth
in the region.
The cold chain is a key factor in modernising the distribution system of agri-food products and
developing the food value chain (FVC). Some case studies on dairy and fishery products in SEA
suggest that the cold chain is necessary for increasing the value of products and also extending
distribution channels.2 Nevertheless, the cold chain has been less emphasised in the context of
FVC studies, which tend to focus on the cost–benefit structure of actors in the chain and the
industrial structure in line with arguments in the literature on value chain development (VCD)
and global value chains (GVCs).3 We need to cast light on the actual state of the cold chain and
complement the arguments to improve the FVC.
The importance of logistics is mentioned as one of the central issues in the Association of
Southeast Asian Nations (ASEAN) region by the Master Plan on ASEAN Connectivity (MPAC) 2025,
a strategic document for guiding actions to improve connectivity in the region towards 2025.4
One of the strategic areas discussed in the MPAC 2025 is ‘seamless logistics’, which is expected
1 Economic Research Institute for ASEAN and East Asia (ERIA)/Japan International Research Center for Agricultural Sciences (JIRCAS). 2 See Kusano (2019). 3 See Stamm and Von Drachenfels (2011), Nang’ole et al. (2011), and Donovan et al. (2013) for value chain development (VCD), and Gereffi et al. (2005) and Gereffi and Fernandez-Stark (2016) for GVCs. Standards are another well-argued issue in global value chain and VCD studies focusing on agri-food industries (Humphrey and Memedovic 2006). 4 The MPAC 2025 was adopted at the 28th ASEAN Summit in September 2016 as the successor of the MPAC adopted at the 17th ASEAN Summit in October 2010.
2
to be achieved by reducing the costs of the supply chain in each ASEAN member state.5 However,
there is a lack of detailed information on the key logistic networks in ASEAN for identifying
specific bottlenecks and prioritising actions.6 The MPAC 2025 shows a plan to implement an
analysis of the time and costs of priority trade routes led by the Senior Economic Officials
Meeting with the Senior Officials Meeting for ASEAN Ministers on Agriculture and Forestry and
other implementing bodies/stakeholders as the first step to establishing the database of the
land transport network in ASEAN.7
1.2. Aims and scope
This report aims to contribute to spreading the cold chain with modern systems by revealing the
actual condition of the cold chain in selected ASEAN countries. Information on the cold chain
would be beneficial to detect intervention points to improve connectivity in the region and with
each country by supplementing initiatives regarding logistics, such as the MPAC 2025, from a
different angle.
We focus on three aspects to describe the actual condition of the cold chain in each country
based on raw data obtained from interviews to stakeholders of the chain and secondary data.
(i) The first is the demand for the cold chain, which is expressed by the volumes or values of
products requiring temperature control. (ii) The activities of the main players in the cold chain,
such as representative firms of storage services and transportation in selected cities, are also
examined. (iii) We also look at government policies, such as rules about the storage and
transportation of products requiring temperature control, and policies to support the
development of the cold chain.
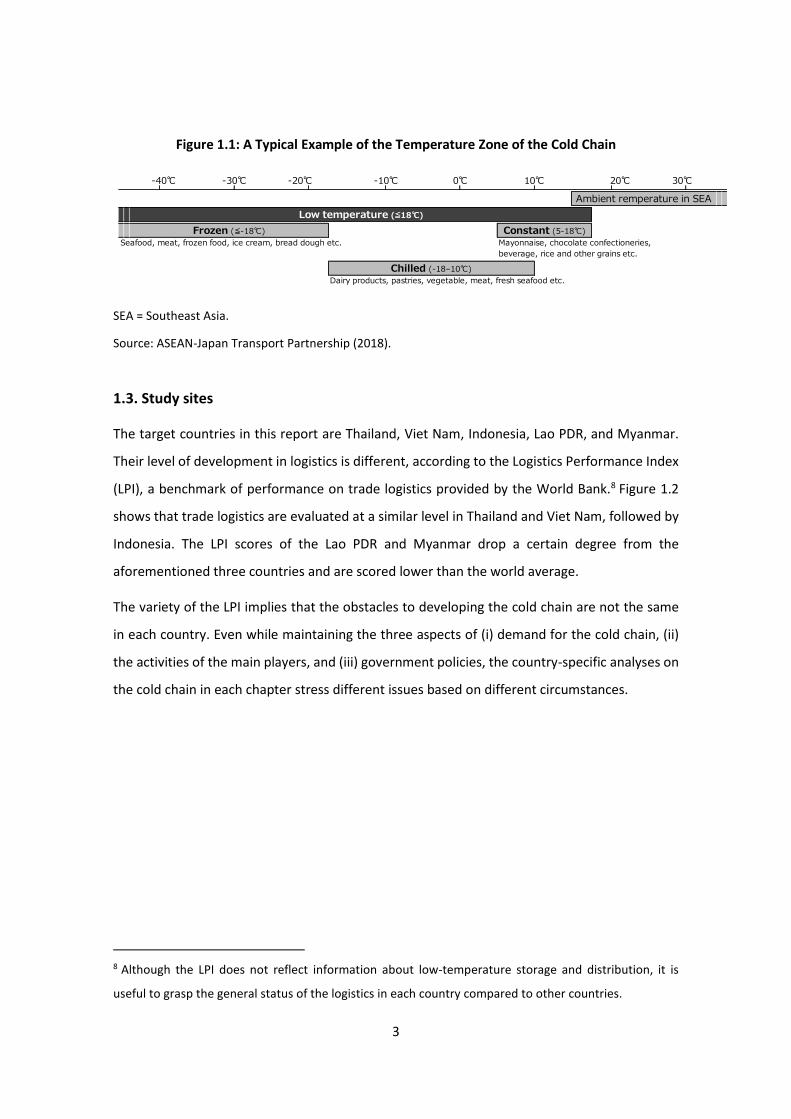
The cold chain is stipulated by the temperature zone in which products are processed, stored,
and distributed. Although actual temperatures corresponding to each zone differ by company,
Figure 1.1 shows a typical example. Many studies in this report suppose a chain at low
temperatures, but some arguments put emphasis on chilled or frozen conditions.
5 The MPAC 2025 indicates five strategic areas: sustainable infrastructure, digital innovation, seamless logistics, regulatory excellence, and people mobility. 6 See MPAC 2025, p.56. 7 The construction of the database has been called for by the ASEAN Economic Community Blueprint 2025 and the ASEAN Strategic Transport Plan 2016–2025.
3
Figure 1.1: A Typical Example of the Temperature Zone of the Cold Chain
SEA = Southeast Asia.
Source: ASEAN-Japan Transport Partnership (2018).
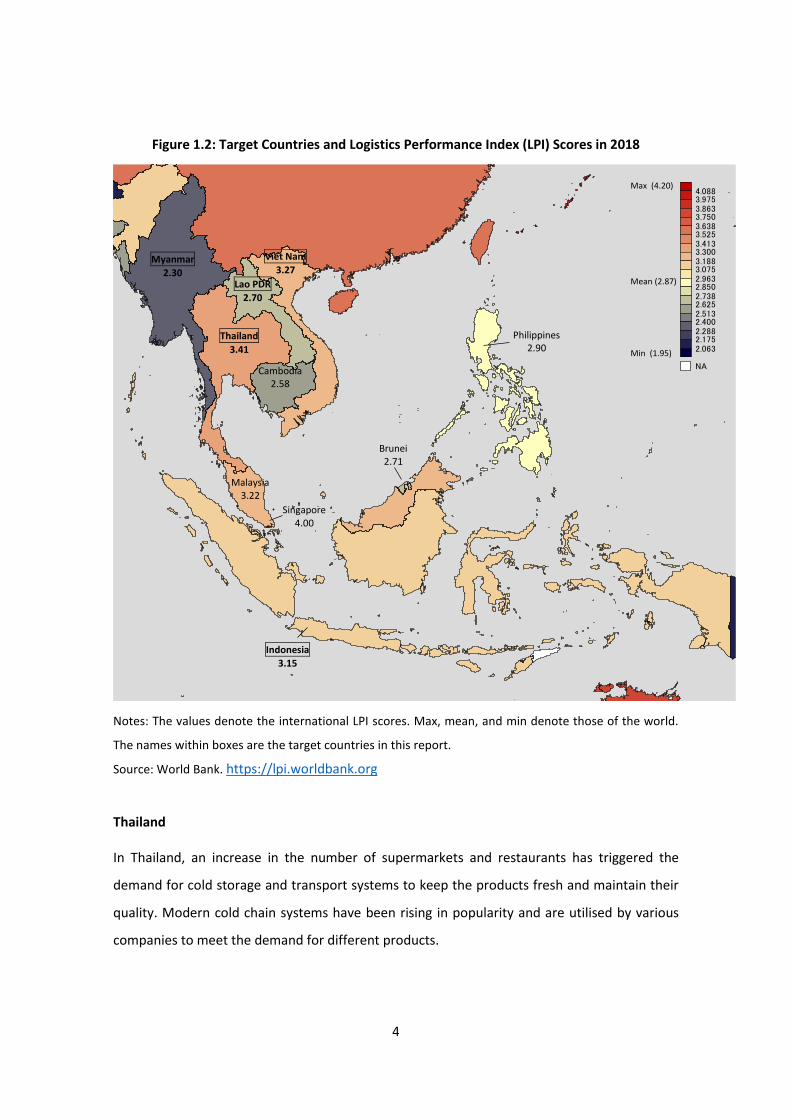
1.3. Study sites
The target countries in this report are Thailand, Viet Nam, Indonesia, Lao PDR, and Myanmar.
Their level of development in logistics is different, according to the Logistics Performance Index
(LPI), a benchmark of performance on trade logistics provided by the World Bank.8 Figure 1.2
shows that trade logistics are evaluated at a similar level in Thailand and Viet Nam, followed by
Indonesia. The LPI scores of the Lao PDR and Myanmar drop a certain degree from the
aforementioned three countries and are scored lower than the world average.
The variety of the LPI implies that the obstacles to developing the cold chain are not the same
in each country. Even while maintaining the three aspects of (i) demand for the cold chain, (ii)
the activities of the main players, and (iii) government policies, the country-specific analyses on
the cold chain in each chapter stress different issues based on different circumstances.
8 Although the LPI does not reflect information about low-temperature storage and distribution, it is
useful to grasp the general status of the logistics in each country compared to other countries.
Seafood, meat, frozen food, ice cream, bread dough etc. Mayonnaise, chocolate confectioneries,
beverage, rice and other grains etc.
Dairy products, pastries, vegetable, meat, fresh seafood etc.
Chilled (-18–10℃)
Frozen (≦-18℃)
20℃ 30℃
Low temperature (≦18℃)
Ambient remperature in SEA
Constant (5-18℃)
-40℃ -30℃ -20℃ -10℃ 0℃ 10℃
4
Figure 1.2: Target Countries and Logistics Performance Index (LPI) Scores in 2018
Notes: The values denote the international LPI scores. Max, mean, and min denote those of the world.
The names within boxes are the target countries in this report.
Source: World Bank. https://lpi.worldbank.org
Thailand
In Thailand, an increase in the number of supermarkets and restaurants has triggered the
demand for cold storage and transport systems to keep the products fresh and maintain their
quality. Modern cold chain systems have been rising in popularity and are utilised by various
companies to meet the demand for different products.
4.0883.9753.8633.7503.6383.5253.4133.3003.1883.0752.9632.8502.7382.6252.5132.4002.2882.1752.063
NA
Indonesia
3.15
Myanmar
2.30
Thailand
3.41
Malaysia 3.22
Philippines 2.90
Cambodia 2.58
Viet Nam
3.27
Lao PDR
2.70
Brunei 2.71
Max (4.20)
Mean (2.87)
Min (1.95)
Singapore 4.00

5
Chapter 2 explores the issues of the cold chain, especially in the context of the improvement in
the system through policy interventions based on statistical data and interviews as well as
arguments in past studies, such by as the World Bank and APEC. It clarifies the comprehensive
nature of the challenges to developing the cold chain, which are not limited to issues on
infrastructure.
Viet Nam
Viet Nam’s cold chain, particularly the storage market, is much larger in the south surrounding
Ho Chi Minh City than the north near Ha Noi, given the concentration of the supply of agricultural
and seafood supply. Conversely, this suggests large room for investment and development in
the north.
Chapter 3 pays attention to the activities of representative players in the cold chain in both
southern and northern areas with a list of major companies and their capacities. The list includes
27 cold storage companies, 13 pangasius or shrimp processing companies that operate their
own cold storages, and 10 cold transportation companies by location and difference in domestic
or foreign capital.
Indonesia
Indonesia is different from the other four countries in this report in terms of its geographical
and demographical characteristics. It is an archipelagic country located out of the Greater
Mekong Subregion (GMS) and has a vast population that far exceeds other ASEAN countries.
Chapter 4 summarises information on the various types of cold chain players with a list of 69
cold storage companies, 59 frozen fish and shrimp processing companies, and 55 sausage or
nugget processing companies across the country. In particular, the activities of the companies
in the metropolitan area around Jakarta, called Jabodetabek, are emphasised.
Lao PDR
The Lao PDR is characterised by a small domestic market with 7 million people in total and a
strategic location surrounded by five ASEAN member states (AMS) and China. While the
traditional cold chain, using plastic containers, ice, and pickup trucks, dominates domestic
transportation, the modern logistics system is mainly used for the international trade of agri-
food products.
6
Chapter 5 focuses on inter-state and transit trade with the highest level of the cold chain to
respond to the large demand for agri-food products from neighbouring countries through the
Lao PDR. It also discusses the factors determining trade, such as the locations of customs and
trade routes, as trade values and quantities.
Myanmar
Myanmar is located at the western end of the GMS and neighbours China and India.
Furthermore, it has the fifth-largest population among AMS and a growing economy to drive a
steady increase in both the production and consumption of agri-food products. The use of the
cold chain for agri-food products is still in its early stage but is expected to grow significantly in
the future.
Chapter 6 describes the whole cold-chain landscape of Myanmar, including both the traditional
and modern chains for fishery, livestock, and agricultural products in detail. The study explores
sites mainly along the Ayeyarwady–Yangon and Yangon–Mandalay/Pyin Oo Lwin–Muse routes.
The potential to expand the modern chain is estimated based on both trade statistics and case
studies.
References
ASEAN–Japan Transport Partnership (2018), ASEAN–Japan Guidelines on Cold Chain Logistics.
Ministry of Land, Infrastructure, Transport and Tourism, Japan.
http://www.mlit.go.jp/report/press/tokatsu01_hh_000419.html
Donovan, J., M. Cunha, S. Franzel, A. Gyau, and D. Mithöfer (2013), Guides for Value Chain
Development: A Comparative Review. CTA & World Agroforestry Centre.
Gereffi, G., and K. Fernandez-Stark (2016), Global Value Chain Analysis: A Primer (second
edition). Center on Globalization, Governance & Competitiveness.
Gereffi, G, J. Humphrey, and T. Sturgeon (2005), The Governance of Global Value Chains, Review
of International Political Economy, 12(1), pp.78–104.
7
Humphrey, J. and O. Memedovic (2006), Global Value Chains in the Agrifood Sector. Background
working paper for the UNIDO Research Project ‘Global Value Chains and Production
Networks: Prospects for Upgrading by Developing Countries’, UNIDO.
Kusano, E. (2019), Food Value Chains in ASEAN: Case Studies Focusing on Local Producers. ERIA.
Nang’ole, E., D. Mithöfer, and S. Franzel (2011), Review of Guidelines and Manuals for Value
Chain Analysis for Agricultural and Forest Products, ICRAF Occasional Paper, 17.
Stamm, A. and C.V. Drachenfels (2011), Value Chain Development: Approaches and Activities by
Seven UN Agencies and Opportunities for Interagency Cooperation. ILO.
World Bank, Aggregated LPI. https://lpi.worldbank.org/
8
Chapter 2
The Cold Chain in Thailand
Sumet Ongkittikul9, Vari Plongon9, Jitlaykha Sukruay9, Kittiya Yisthanichakul9
2.1. Preface
Introduction
The cold chain in Thailand report is a part of the ‘research project for policy recommendations
to ASEAN countries on the realization of higher value added of agricultural products’, aiming to
provide information and analysis regarding prospects of cold value chains in Thailand, especially
those of the consumption of food and products.
Thailand is known as an agricultural country as the agricultural sector has the largest share in
the Thai workforce of 11.27%, or 37.60 million people (National Statistical Office, 2018). In
addition, Thailand has been promoted as ‘Kitchen of the World’ since 2005, meaning that
Thailand intends to be a hub of food. Therefore, Thailand can be considered as a hub of
agricultural supply, which means its food and fibre products are adequate to serve both
domestic and international demand and consumption. This demonstrates that the food value
chain is essential to Thailand’s economy.
The part of the food value chain that needs temperature control is known as the cold chain. The
cold chain plays an important role in preserving quality, extending shelf life, and ensuring the
quality of products. Its processes help reduce food spoilage and waste from producers’ farms to
customers’ tables. This leads to the ability to transport products to customers over longer
distances and increased customer satisfaction. Moreover, it is an opportunity for participants in
the chain to gain more benefits and reduce their damages and costs. Most products in the cold
chain are temperature sensitive and perishable, such as agricultural products, livestock products,
fishery products, processed food, chemical products, and other temperature-controlled
products.
9 Thailand Development Research Institute (TDRI).
9
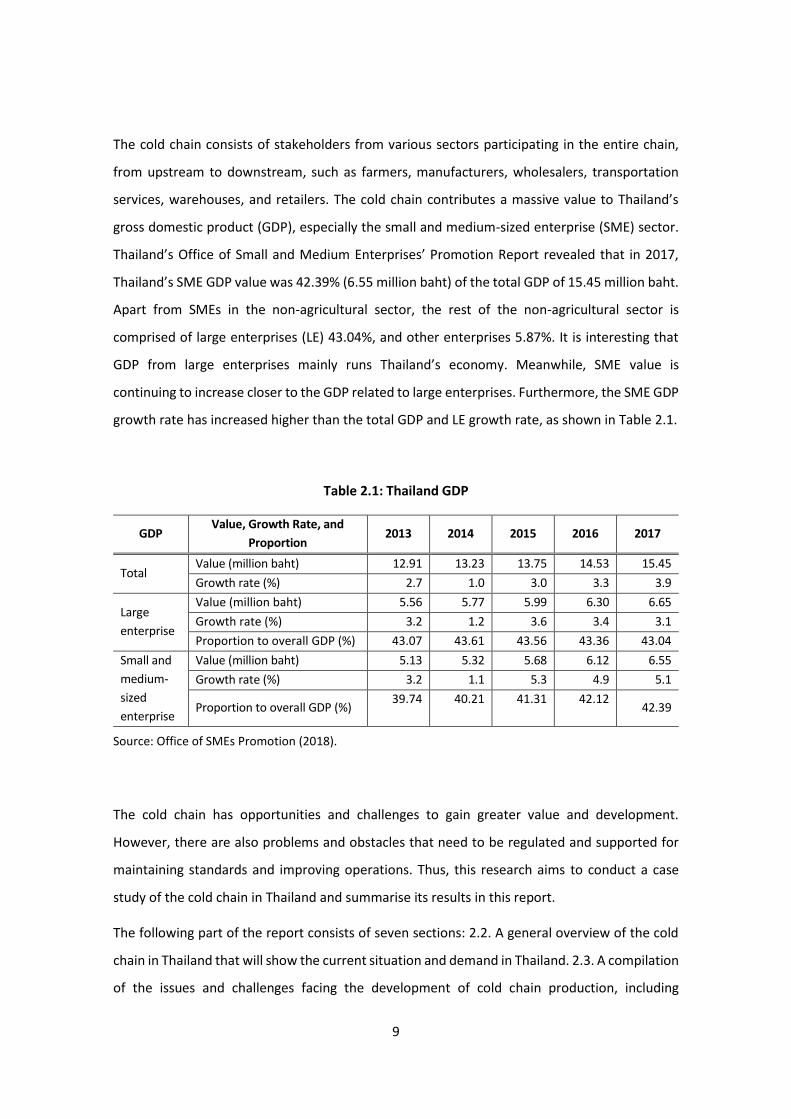
The cold chain consists of stakeholders from various sectors participating in the entire chain,
from upstream to downstream, such as farmers, manufacturers, wholesalers, transportation
services, warehouses, and retailers. The cold chain contributes a massive value to Thailand’s
gross domestic product (GDP), especially the small and medium-sized enterprise (SME) sector.
Thailand’s Office of Small and Medium Enterprises’ Promotion Report revealed that in 2017,
Thailand’s SME GDP value was 42.39% (6.55 million baht) of the total GDP of 15.45 million baht.
Apart from SMEs in the non-agricultural sector, the rest of the non-agricultural sector is
comprised of large enterprises (LE) 43.04%, and other enterprises 5.87%. It is interesting that
GDP from large enterprises mainly runs Thailand’s economy. Meanwhile, SME value is
continuing to increase closer to the GDP related to large enterprises. Furthermore, the SME GDP
growth rate has increased higher than the total GDP and LE growth rate, as shown in Table 2.1.
Table 2.1: Thailand GDP
GDP Value, Growth Rate, and
Proportion 2013 2014 2015 2016 2017
Total Value (million baht) 12.91 13.23 13.75 14.53 15.45
Growth rate (%) 2.7 1.0 3.0 3.3 3.9
Large
enterprise
Value (million baht) 5.56 5.77 5.99 6.30 6.65
Growth rate (%) 3.2 1.2 3.6 3.4 3.1
Proportion to overall GDP (%) 43.07 43.61 43.56 43.36 43.04
Small and
medium-
sized
enterprise
Value (million baht) 5.13 5.32 5.68 6.12 6.55
Growth rate (%) 3.2 1.1 5.3 4.9 5.1
Proportion to overall GDP (%) 39.74 40.21 41.31 42.12
42.39
Source: Office of SMEs Promotion (2018).
The cold chain has opportunities and challenges to gain greater value and development.
However, there are also problems and obstacles that need to be regulated and supported for
maintaining standards and improving operations. Thus, this research aims to conduct a case
study of the cold chain in Thailand and summarise its results in this report.
The following part of the report consists of seven sections: 2.2. A general overview of the cold
chain in Thailand that will show the current situation and demand in Thailand. 2.3. A compilation
of the issues and challenges facing the development of cold chain production, including
10
government policies involved in Thailand’s cold chain. 2.4. Statistics on imported and exported
cold chain products showing the demand for cold chain logistics. 2.5. A discussion on the cold
chain market in Thailand and the current temperature-controlled transportation and warehouse
conditions in the country. 2.6. A business model of the cold chain with information from
interviews as an overview and connection with the main players and users. 2.7. The expectation
of government policy from an interviewees perspective on policy to control, regulate, and
support the cold chain stakeholders, including their gathering. 2.8. A concluding summary of the
report and issues that may encourage the utilisation and development of the cold chain.
Research methodology
This research is discussed with each stakeholder along the cold chain by focusing on three
elements, including the developments, challenges, and policies in Thailand. The approaches of
the research can be identified as follows.
Firstly, to review international research to gain an overview of the importance as well as the
recent developments in the global cold chain network. There are many reviews of temperature
management on agri-food products, so this step is helpful to understand the cold chain in detail.
Secondly, to identify the current situation of both demand and supply in Thailand by gathering
secondary data. This data can show the trends and growths from the past until the present.
Thirdly, to interview cold chain stakeholders and related government agencies to identify major
elements in the cold chain: namely, the demand for frozen foods and cargo, the activities and
challenges of the main suppliers, as well as national policies in Thailand.
Finally, the information will be analysed and policy recommendations in the context of Thailand
are provided. The research team hopes to investigate and find useful information on the cold
chain that can provide beneficial guidelines for policymakers.
Survey
The research team conducted survey interviews from December 2018–January 2019. The
sample comprised five enterprises, two government agencies, and one federation.
The five enterprises were of different sizes, large, medium, and small, and comprised those in
the chilled/frozen food industry, logistics providers, and a trader, as shown in Table 2.2 and
Table 2.3 below.

11
Table 2.2: Interview Survey of Logistics Providers and Logistics Users
Size1 Enterprise2
Producer Logistic Provider Trader
Small – • Rujoran Transport Co.,
Ltd. –
Medium – • Eagles Air & Sea Co., Ltd.
• CTI Logistics Co., Ltd
• Harmony Life
International Co., Ltd.
Large • Thai Union Group PCL. – –
Note: 1. Classified sizes by fixed asset criteria in Appendix: Table A.1.
2. Details of interviewees are in Appendix Table A.2.
Source: Authors.
Table 2.3: Interview Survey of Supporters
Government Agencies
Port Authority of Thailand
Department of Internal Trade
Federation
Thai Federation on Logistics
Note: Details of interviewees are in Appendix: Table A.2.
Source: Authors.
Information from the survey interviews will be analysed and reported in further sectors. The
details include the demand for the cold chain, the government policies on the cold chain, and
the activities of the main players of the cold chain in Thailand.
2.2. General overview of the cold chain in Thailand
The cold chain is the supply chain that requires the control of temperature, humidity, and
environments. The control provides the proper conditions for particular products in the
processes of the supply chain. Reviews describe definitions of the supply chain and logistics as
follows, showing their connection to the core of cold chain logistics.
Waters (2003) states that a supply chain consists of a series of activities and organizations
through which ‘materials’ (raw materials, components, finished products, people, information,
paperwork, messages, knowledge, consumables, energy, money, and anything else needed by
operations) move through on their journey from initial suppliers to final customers. Lummus et
12
al. (2001) describe a definition of logistics that involves planning, implementing, and controlling
the flow and storage of goods and services from the point of origin to the point of consumption
for serving customer requirements. In addition, Thipkaisorn (2010) refers to Stock and Lambert
(2001) to show that logistics comprise of activities that include logistics communications,
customer service, order processing, demand forecasting, procurement, inventory management,
transportation management, warehousing and storage, reverse logistics, parts and service
support, plant and warehouse site selection, material handling, and packaging and packing.
Michigan State University (2016) concluded that logistics is a part of the supply chain process.
The supply chain focuses on competitive advantage, while logistics focuses on meeting customer
requirements.
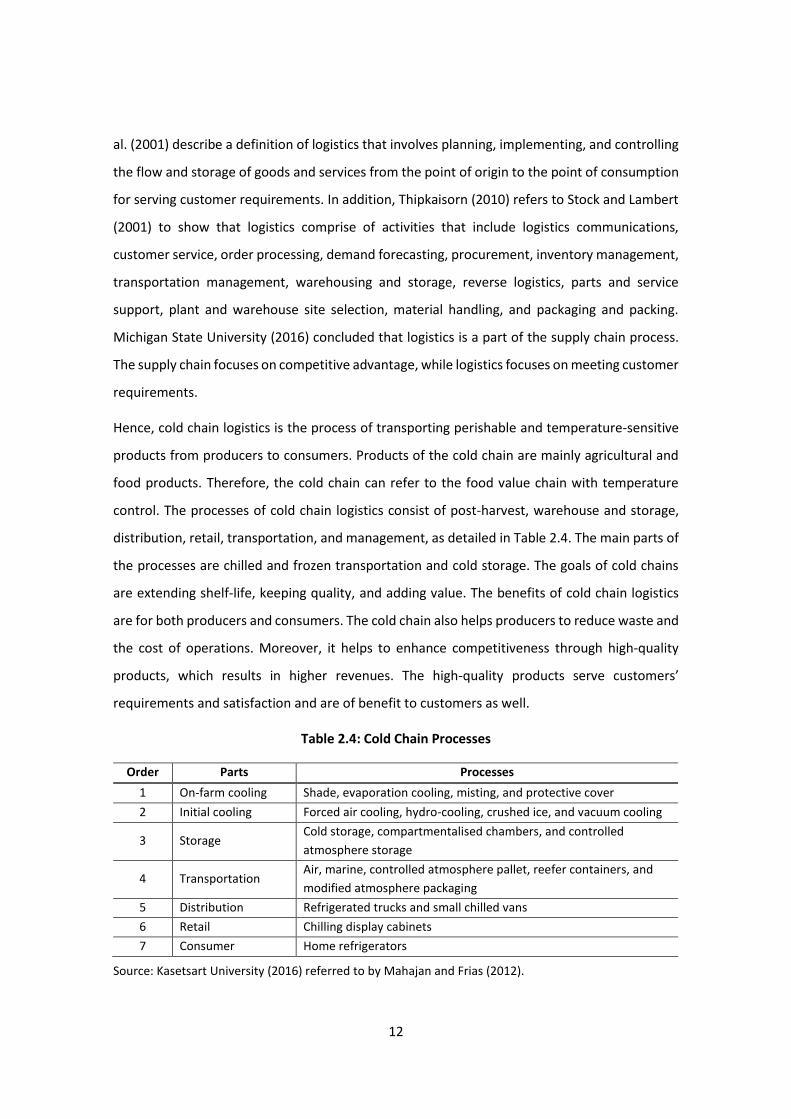
Hence, cold chain logistics is the process of transporting perishable and temperature-sensitive
products from producers to consumers. Products of the cold chain are mainly agricultural and
food products. Therefore, the cold chain can refer to the food value chain with temperature
control. The processes of cold chain logistics consist of post-harvest, warehouse and storage,
distribution, retail, transportation, and management, as detailed in Table 2.4. The main parts of
the processes are chilled and frozen transportation and cold storage. The goals of cold chains
are extending shelf-life, keeping quality, and adding value. The benefits of cold chain logistics
are for both producers and consumers. The cold chain also helps producers to reduce waste and
the cost of operations. Moreover, it helps to enhance competitiveness through high-quality
products, which results in higher revenues. The high-quality products serve customers’
requirements and satisfaction and are of benefit to customers as well.
Table 2.4: Cold Chain Processes
Order Parts Processes
1 On-farm cooling Shade, evaporation cooling, misting, and protective cover
2 Initial cooling Forced air cooling, hydro-cooling, crushed ice, and vacuum cooling
3 Storage Cold storage, compartmentalised chambers, and controlled
atmosphere storage
4 Transportation Air, marine, controlled atmosphere pallet, reefer containers, and
modified atmosphere packaging
5 Distribution Refrigerated trucks and small chilled vans
6 Retail Chilling display cabinets
7 Consumer Home refrigerators
Source: Kasetsart University (2016) referred to by Mahajan and Frias (2012).
13
The cold chain also plays an essential role in the food value chain through the enhanced delivery
of temperature-sensitive food products from producer to consumers. The cold chain helps
people to live with a better quality of life by enabling access to varieties of fresh, frozen, and
ready-to-eat foods that are produced and prepared at longer distances from where they live. As
such, the cold chain has an important role in ensuring food security.
Thailand has potential for the temperature-controlled food value chain. According to ‘Thailand's
Advantages’, an article written by the Board of Investment of Thailand (BOI 2017a), Thailand’s
geographical and location advantages make Thailand a gateway to fast-growing country markets
that have a massive demand for food, such as China, India, Viet Nam, Malaysia, and Singapore.
The country also has a growing economy, competitive human capital, world-class infrastructure,
and strong government support that make it one of the most attractive investment destinations.
In addition to being a gateway to fast-growing country markets, Thailand is also situated at the
heart of Southeast Asia, which prospers from land connections with Cambodia, the Lao PDR,
Malaysia, and Myanmar through various modes of transportation, such as road, river, sea, and
rail. In addition, it is surrounded by the Pacific Ocean and India Ocean. Moreover, future
infrastructure that is currently undergoing upgrading and construction include new international
road networks, double-track railways, high-speed trains, and other routes. Meanwhile, it is
located among plenty tropical food resources.
Thailand is an attractive investment destination due to its growing economy, as can be seen
from its GDP growth, which has been increasing, and foreign direct investment (FDI) which was
at 21% over the past six years. In addition, competitive human capital gives the benefits of the
free flow of skilled labour, services, investment, and capital across the ASEAN Economic
Community (AEC) as a single market since 2015. Moreover, the government’s tax support has
ranked Thailand as the 2nd lowest corporate tax rate in ASEAN and led to numerous free trade
agreements (FTA).
Apart from these, the government designated the food industry (BOI, 2017b) as one of the 10
key growth engines for its “Thailand 4.0” economic model. The government has also cooperated
with the private sector to set Food Innopolis as a district of investment for research,
development, and innovation for promoting and enhancing the competitiveness of Thailand’s
food industry. In this way, Thailand aims to serve both domestic demand and demand from
14
countries around the world, especially for seafood and agricultural products, which are
increasing in the volume of cold chain products, as will be discussed in detail in the following
sections.
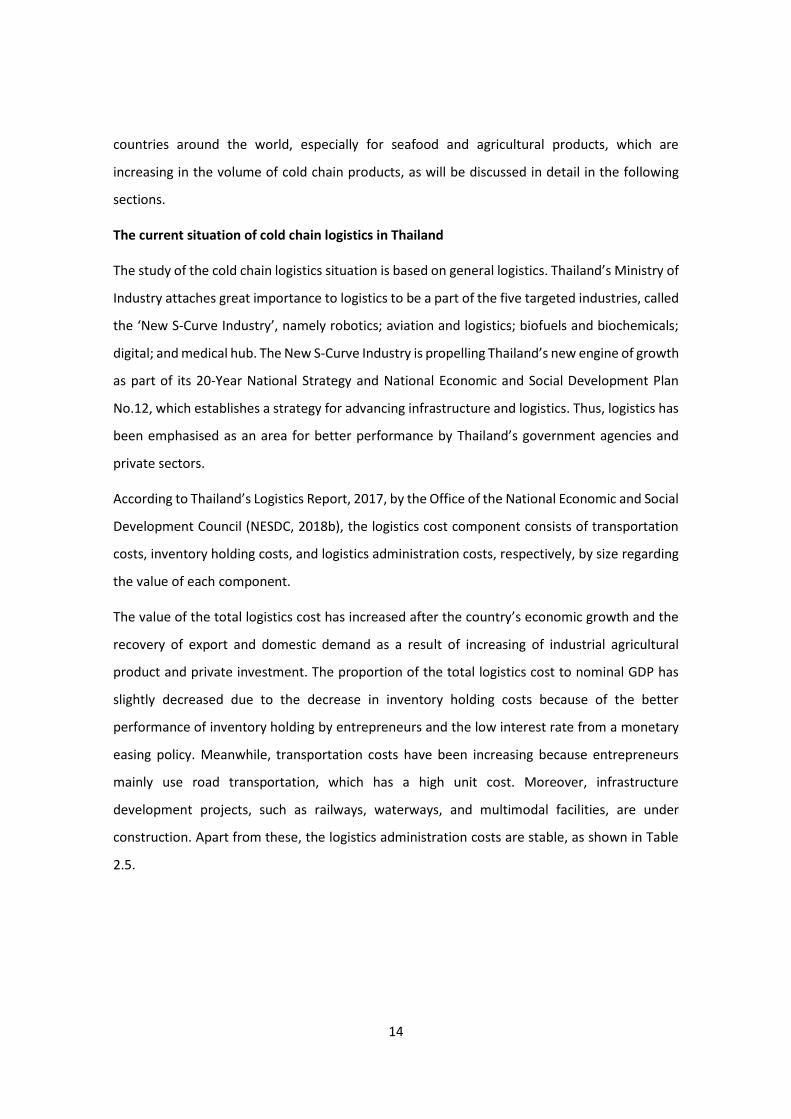
The current situation of cold chain logistics in Thailand
The study of the cold chain logistics situation is based on general logistics. Thailand’s Ministry of
Industry attaches great importance to logistics to be a part of the five targeted industries, called
the ‘New S-Curve Industry’, namely robotics; aviation and logistics; biofuels and biochemicals;
digital; and medical hub. The New S-Curve Industry is propelling Thailand’s new engine of growth
as part of its 20-Year National Strategy and National Economic and Social Development Plan
No.12, which establishes a strategy for advancing infrastructure and logistics. Thus, logistics has
been emphasised as an area for better performance by Thailand’s government agencies and
private sectors.
According to Thailand’s Logistics Report, 2017, by the Office of the National Economic and Social
Development Council (NESDC, 2018b), the logistics cost component consists of transportation
costs, inventory holding costs, and logistics administration costs, respectively, by size regarding
the value of each component.
The value of the total logistics cost has increased after the country’s economic growth and the
recovery of export and domestic demand as a result of increasing of industrial agricultural
product and private investment. The proportion of the total logistics cost to nominal GDP has
slightly decreased due to the decrease in inventory holding costs because of the better
performance of inventory holding by entrepreneurs and the low interest rate from a monetary
easing policy. Meanwhile, transportation costs have been increasing because entrepreneurs
mainly use road transportation, which has a high unit cost. Moreover, infrastructure
development projects, such as railways, waterways, and multimodal facilities, are under
construction. Apart from these, the logistics administration costs are stable, as shown in Table
2.5.
15
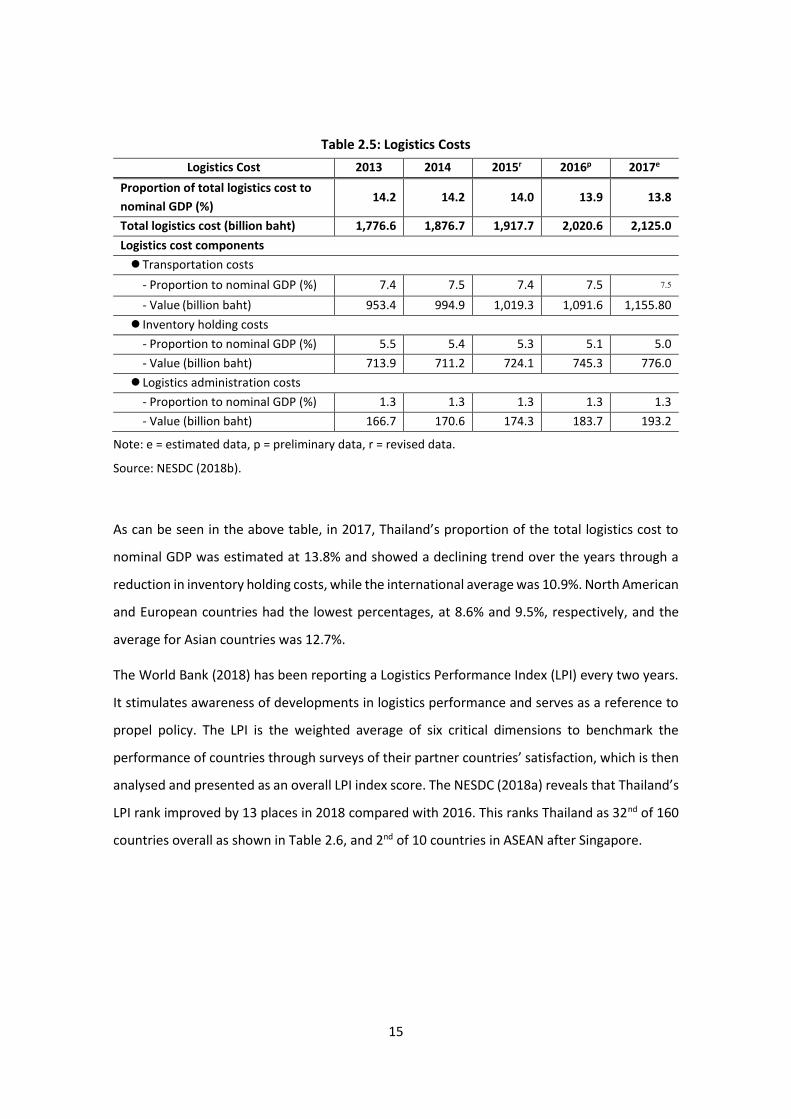
Table 2.5: Logistics Costs
Logistics Cost 2013 2014 2015r 2016p 2017e
Proportion of total logistics cost to
nominal GDP (%) 14.2 14.2 14.0 13.9 13.8
Total logistics cost (billion baht) 1,776.6 1,876.7 1,917.7 2,020.6 2,125.0
Logistics cost components
⚫ Transportation costs
- Proportion to nominal GDP (%) 7.4 7.5 7.4 7.5 7.5
- Value (billion baht) 953.4 994.9 1,019.3 1,091.6 1,155.80
⚫ Inventory holding costs
- Proportion to nominal GDP (%) 5.5 5.4 5.3 5.1 5.0
- Value (billion baht) 713.9 711.2 724.1 745.3 776.0
⚫ Logistics administration costs
- Proportion to nominal GDP (%) 1.3 1.3 1.3 1.3 1.3
- Value (billion baht) 166.7 170.6 174.3 183.7 193.2
Note: e = estimated data, p = preliminary data, r = revised data.
Source: NESDC (2018b).
As can be seen in the above table, in 2017, Thailand’s proportion of the total logistics cost to
nominal GDP was estimated at 13.8% and showed a declining trend over the years through a
reduction in inventory holding costs, while the international average was 10.9%. North American
and European countries had the lowest percentages, at 8.6% and 9.5%, respectively, and the
average for Asian countries was 12.7%.
The World Bank (2018) has been reporting a Logistics Performance Index (LPI) every two years.
It stimulates awareness of developments in logistics performance and serves as a reference to
propel policy. The LPI is the weighted average of six critical dimensions to benchmark the
performance of countries through surveys of their partner countries’ satisfaction, which is then
analysed and presented as an overall LPI index score. The NESDC (2018a) reveals that Thailand’s
LPI rank improved by 13 places in 2018 compared with 2016. This ranks Thailand as 32nd of 160
countries overall as shown in Table 2.6, and 2nd of 10 countries in ASEAN after Singapore.
16
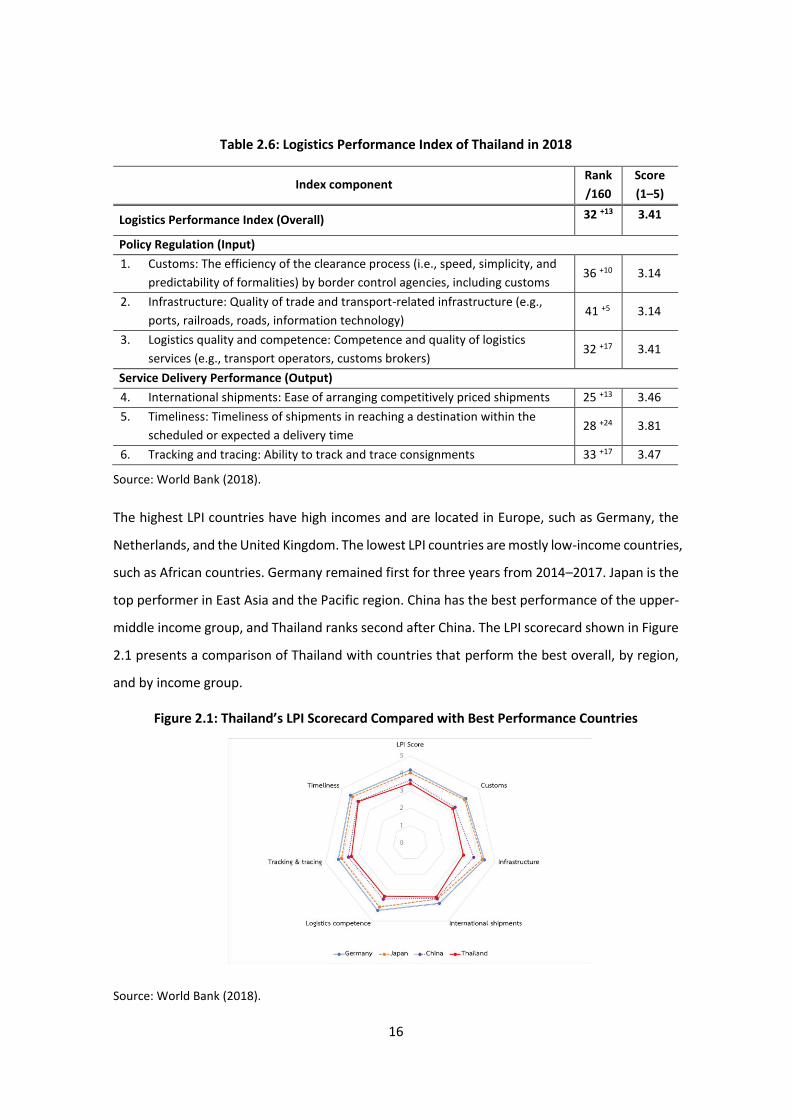
Table 2.6: Logistics Performance Index of Thailand in 2018
Index component Rank
/160
Score
(1–5)
Logistics Performance Index (Overall) 32 +13 3.41
Policy Regulation (Input)
1. Customs: The efficiency of the clearance process (i.e., speed, simplicity, and
predictability of formalities) by border control agencies, including customs 36 +10 3.14
2. Infrastructure: Quality of trade and transport-related infrastructure (e.g.,
ports, railroads, roads, information technology) 41 +5 3.14
3. Logistics quality and competence: Competence and quality of logistics
services (e.g., transport operators, customs brokers) 32 +17 3.41
Service Delivery Performance (Output)
4. International shipments: Ease of arranging competitively priced shipments 25 +13 3.46
5. Timeliness: Timeliness of shipments in reaching a destination within the
scheduled or expected a delivery time 28 +24 3.81
6. Tracking and tracing: Ability to track and trace consignments 33 +17 3.47
Source: World Bank (2018).
The highest LPI countries have high incomes and are located in Europe, such as Germany, the
Netherlands, and the United Kingdom. The lowest LPI countries are mostly low-income countries,
such as African countries. Germany remained first for three years from 2014–2017. Japan is the
top performer in East Asia and the Pacific region. China has the best performance of the upper-
middle income group, and Thailand ranks second after China. The LPI scorecard shown in Figure
2.1 presents a comparison of Thailand with countries that perform the best overall, by region,
and by income group.
Figure 2.1: Thailand’s LPI Scorecard Compared with Best Performance Countries
Source: World Bank (2018).

17
Thailand was evaluated in the Logistics Friendly Group (the first of five groups) but was still
ranked last in the group. Thus, Thailand should take the World Bank’s suggestion for the
Consistent Group (second group). The Consistent Group should place priority on developing
human resources skills, urban logistics, a dedicated logistics body, and a national data system. A
second priority should be transportation infrastructure, green logistics, spatial planning,
resilience, and a specific legal framework (NESDC, 2018a).
The suggestion conforms to the problems and obstacles of the cold chain in Thailand as stated
by Kasetsart University (2016). There are five issues:
⚫ Human resources: Cold chain staff lack the knowledge and skills for handling the proper
conditions for keeping and transporting products with both Good Distribution Practice
Standards and Good Storage Practices Standards.
⚫ Infrastructure: There is insufficient and inefficient infrastructure for the demand for the
cold chain in Thailand.
⚫ Temperature control: Temperature tracking and checking need more organizing to achieve
concrete systems.
⚫ Standard of transportation: Cold chain products usually touch external air during transfer
and transport. This may affect the quality of products and cause damage.
⚫ Electricity control: Power distribution systems are unstable. This leads to unstable
electricity, which is a resource of temperature control.
The suggested approaches for logistics performance development are expected to resolve the
main problems and obstacles. The developed performance will serve logistics demand better,
especially cold chain logistics, which is continuing to increase with the demand for cold chain
products.
Demand for the cold chain in Thailand
The demand for fresh food and processed food is expected to increase due to high competition
in the food industry. In order to support competition, effective logistics management is required.
The food industry is interested not only in transportation cost reduction but also in food quality
control for perishable goods. The cold chain is a logistics tool that is applied to extend the
18
saleable lifecycle of perishable goods and ensure that they do not perish in storage or in transit
to their end destinations. As a result, the cold chain industry has increased over the years.
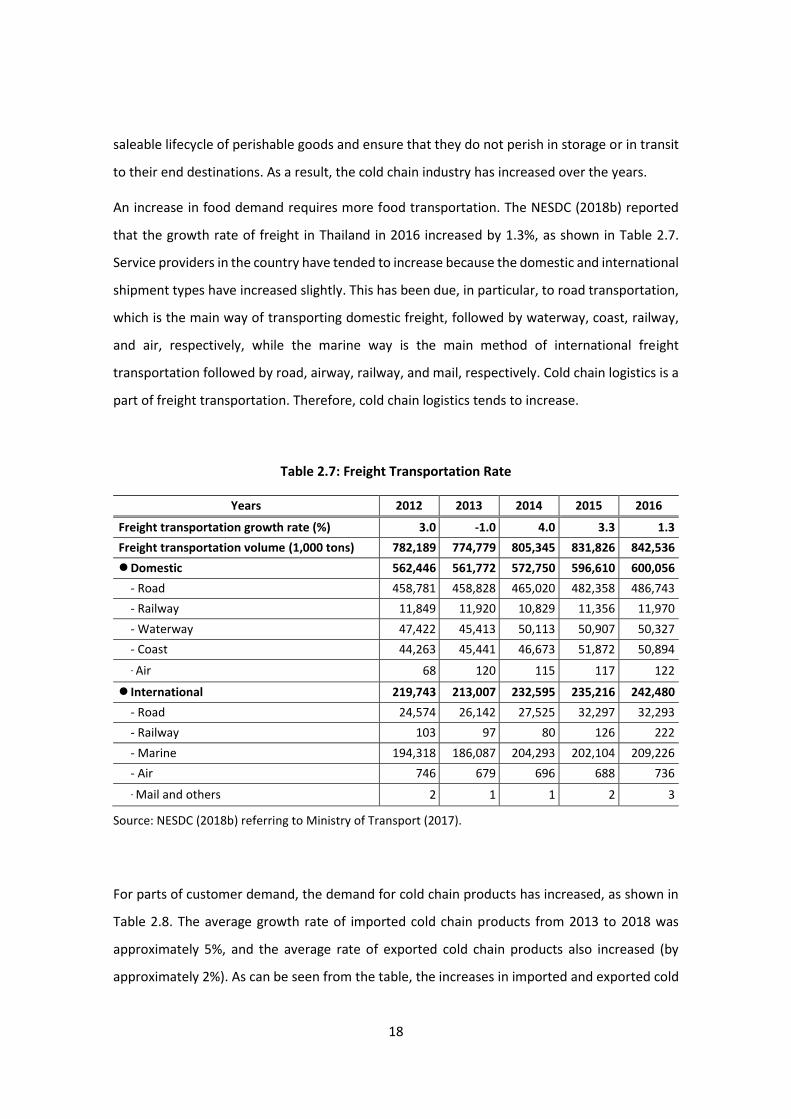
An increase in food demand requires more food transportation. The NESDC (2018b) reported
that the growth rate of freight in Thailand in 2016 increased by 1.3%, as shown in Table 2.7.
Service providers in the country have tended to increase because the domestic and international
shipment types have increased slightly. This has been due, in particular, to road transportation,
which is the main way of transporting domestic freight, followed by waterway, coast, railway,
and air, respectively, while the marine way is the main method of international freight
transportation followed by road, airway, railway, and mail, respectively. Cold chain logistics is a
part of freight transportation. Therefore, cold chain logistics tends to increase.
Table 2.7: Freight Transportation Rate
Years 2012 2013 2014 2015 2016
Freight transportation growth rate (%) 3.0 -1.0 4.0 3.3 1.3
Freight transportation volume (1,000 tons) 782,189 774,779 805,345 831,826 842,536
⚫ Domestic 562,446 561,772 572,750 596,610 600,056
- Road 458,781 458,828 465,020 482,358 486,743
- Railway 11,849 11,920 10,829 11,356 11,970
- Waterway 47,422 45,413 50,113 50,907 50,327
- Coast 44,263 45,441 46,673 51,872 50,894
- Air 68 120 115 117 122
⚫ International 219,743 213,007 232,595 235,216 242,480
- Road 24,574 26,142 27,525 32,297 32,293
- Railway 103 97 80 126 222
- Marine 194,318 186,087 204,293 202,104 209,226
- Air 746 679 696 688 736
- Mail and others 2 1 1 2 3
Source: NESDC (2018b) referring to Ministry of Transport (2017).
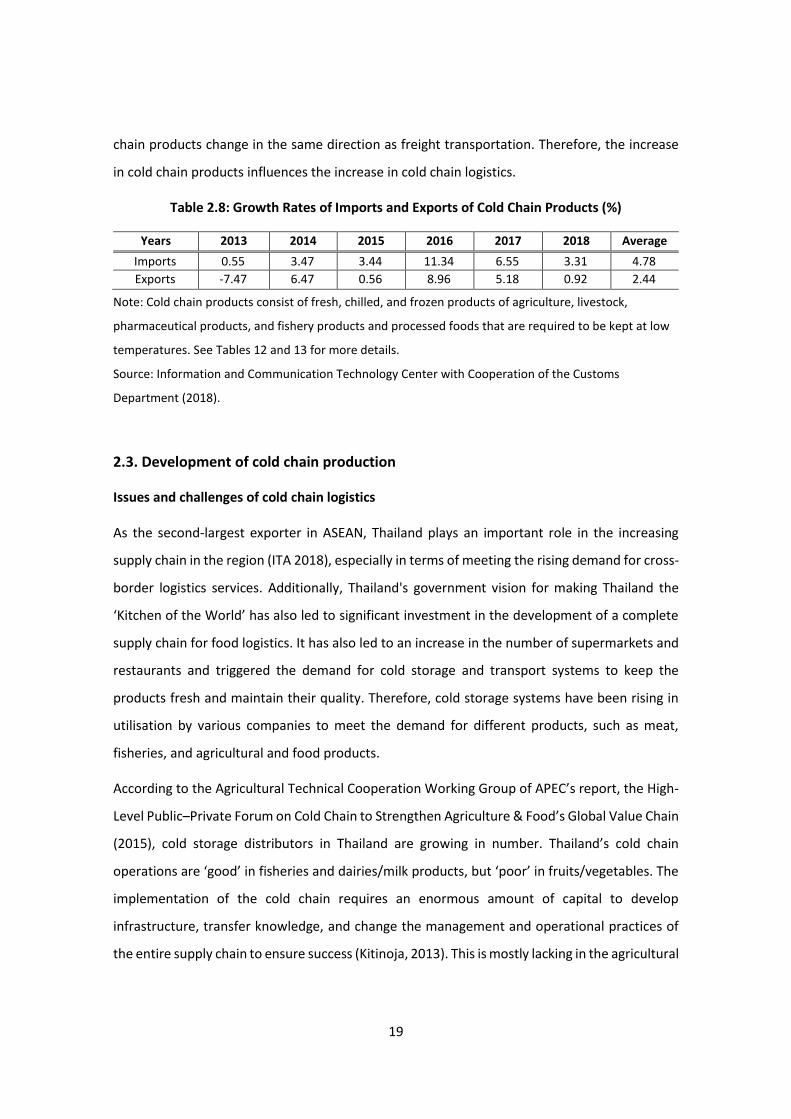
For parts of customer demand, the demand for cold chain products has increased, as shown in
Table 2.8. The average growth rate of imported cold chain products from 2013 to 2018 was
approximately 5%, and the average rate of exported cold chain products also increased (by
approximately 2%). As can be seen from the table, the increases in imported and exported cold
19
chain products change in the same direction as freight transportation. Therefore, the increase
in cold chain products influences the increase in cold chain logistics.
Table 2.8: Growth Rates of Imports and Exports of Cold Chain Products (%)
Years 2013 2014 2015 2016 2017 2018 Average
Imports 0.55 3.47 3.44 11.34 6.55 3.31 4.78
Exports -7.47 6.47 0.56 8.96 5.18 0.92 2.44
Note: Cold chain products consist of fresh, chilled, and frozen products of agriculture, livestock,
pharmaceutical products, and fishery products and processed foods that are required to be kept at low
temperatures. See Tables 12 and 13 for more details.
Source: Information and Communication Technology Center with Cooperation of the Customs
Department (2018).
2.3. Development of cold chain production
Issues and challenges of cold chain logistics
As the second-largest exporter in ASEAN, Thailand plays an important role in the increasing
supply chain in the region (ITA 2018), especially in terms of meeting the rising demand for cross-
border logistics services. Additionally, Thailand's government vision for making Thailand the
‘Kitchen of the World’ has also led to significant investment in the development of a complete
supply chain for food logistics. It has also led to an increase in the number of supermarkets and
restaurants and triggered the demand for cold storage and transport systems to keep the
products fresh and maintain their quality. Therefore, cold storage systems have been rising in
utilisation by various companies to meet the demand for different products, such as meat,
fisheries, and agricultural and food products.
According to the Agricultural Technical Cooperation Working Group of APEC’s report, the High-
Level Public–Private Forum on Cold Chain to Strengthen Agriculture & Food’s Global Value Chain
(2015), cold storage distributors in Thailand are growing in number. Thailand’s cold chain
operations are ‘good’ in fisheries and dairies/milk products, but ‘poor’ in fruits/vegetables. The
implementation of the cold chain requires an enormous amount of capital to develop
infrastructure, transfer knowledge, and change the management and operational practices of
the entire supply chain to ensure success (Kitinoja, 2013). This is mostly lacking in the agricultural
20
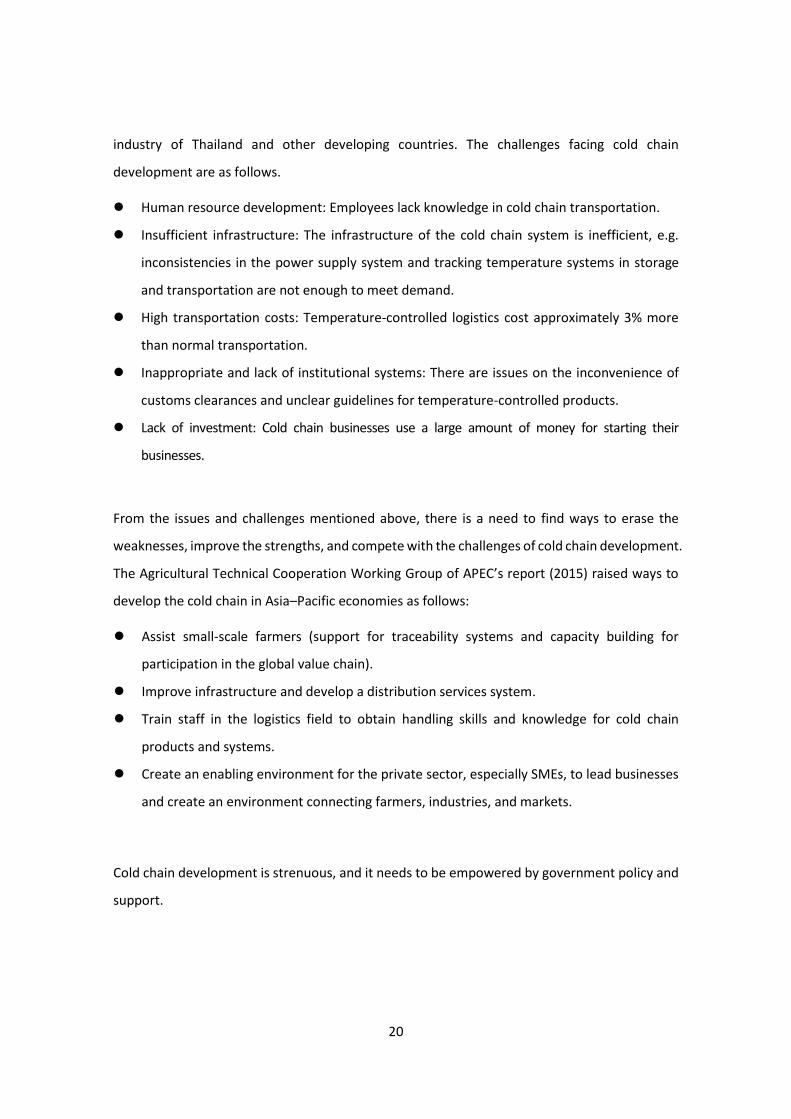
industry of Thailand and other developing countries. The challenges facing cold chain
development are as follows.
⚫ Human resource development: Employees lack knowledge in cold chain transportation.
⚫ Insufficient infrastructure: The infrastructure of the cold chain system is inefficient, e.g.
inconsistencies in the power supply system and tracking temperature systems in storage
and transportation are not enough to meet demand.
⚫ High transportation costs: Temperature-controlled logistics cost approximately 3% more
than normal transportation.
⚫ Inappropriate and lack of institutional systems: There are issues on the inconvenience of
customs clearances and unclear guidelines for temperature-controlled products.
⚫ Lack of investment: Cold chain businesses use a large amount of money for starting their
businesses.
From the issues and challenges mentioned above, there is a need to find ways to erase the
weaknesses, improve the strengths, and compete with the challenges of cold chain development.
The Agricultural Technical Cooperation Working Group of APEC’s report (2015) raised ways to
develop the cold chain in Asia–Pacific economies as follows:
⚫ Assist small-scale farmers (support for traceability systems and capacity building for
participation in the global value chain).
⚫ Improve infrastructure and develop a distribution services system.
⚫ Train staff in the logistics field to obtain handling skills and knowledge for cold chain
products and systems.
⚫ Create an enabling environment for the private sector, especially SMEs, to lead businesses
and create an environment connecting farmers, industries, and markets.
Cold chain development is strenuous, and it needs to be empowered by government policy and
support.
21
Government policies
The Thai government gives priority to economic growth, which is affected by the value of
products. Thus, the government is concerned about product quality and standards for enhancing
value. At present, the government legislates acts and provides strategic plans as a policy for
regulating and supporting the country’s activities. The policies related to cold chain operations
are in categories as follows.
⚫ Guiding and Supporting Plan: A path for participants to be followed
Twelfth National Economic and Social Development Plan (2017–2021): The main plan for
Thailand development from 2017 to 2021. The strategies responding to economics and logistics
development are the four following strategies:
Strategy 3. Strategy for Strengthening the Economy and Underpinning Sustainable Competitiveness:
Important keys to this strategy are building economic strength and competitiveness and
emphasising the stabilisation of macroeconomic management, improving the efficiency of the
financial sector, and maintaining fiscal discipline. In addition, the strategy also focuses on
strengthening the sectors of the real economy, including agriculture, manufacturing, and
services as both conventional income sources and the means of diversifying to new products
and service activities in the future.
Strategy 7. Strategy for Advancing Infrastructure and Logistics: The goal of strategy 7 is to expand
the capacity of infrastructure and logistics in the country, both in terms of quantity and quality,
to support the expansion of urban areas and key economic zones, and to help improve the
quality of life. Connectivity within the sub-region and the ASEAN community will also
systematically be increased by building infrastructure networks to support areas alongside the
economic corridors. Systems of management and regulation will be upgraded to meet
international standards in order to increase operational effectiveness and safety whilst ensuring
consumers’ rights and providing equal and widespread access to basic infrastructure. Lastly, the
country will support infrastructure-induced industries as well as logistics entrepreneurship and
organisations that have the potential to expand their businesses internationally.

22
Strategy 9. Strategy for Regional, Urban, and Economic Zone Development: Key developments and
activities are: (1) strengthening the existing production and service bases; (2) creating new
production and service bases to generate income for people in all regions; (3) supporting the quality
growth of urban areas; (4) developing and reviving the Eastern Seaboard areas to accommodate
future industrial expansion; (5) enabling the sound management of border economic areas to attain
sustainable growth and competitiveness; and (6) enhancing the efficiency of urban and regional
development implementation mechanisms to deliver concrete outcomes.
Strategy 10. Strategy for International Cooperation for Development: This strategy focuses on
adjusting domestic mechanisms towards integration; promoting creative, fair, and inclusive
mechanisms at the sub-regional and regional levels; and refining Thailand’s role with its
neighbours in sub-regional and regional development.
The Third Strategy Plan for Logistics Development (2017–2021): This plan was created under the
Twelfth National Economic and Social Development Plan (2017–2021) and aims to upgrade the
logistics system in Thailand for becoming a centre of trade, service, and investment in the region.
It consists of three strategies: (1) the development of value added in supply chain systems; (2)
infrastructure and facilities improvement; and (3) development of logistics support factors for
supporting the competitiveness and implementation of an organisation.
Supporting Plan for SMEs (2017–2021): There are three strategies for SME operation guidelines
as follows: (1) support and development in separate issues, including upgrading technology,
innovation, productivity, funding source support, promotion of national and international
market access, and entrepreneur development; (2) support for SME capability in specific groups,
including high-value start-ups, and encouraging SME network establishment and improvement
of the SME foundation; (3) development and promotion of the SME mechanism to drive SMEs
as a system, including improving tools for high-performance SME promotion.
⚫ Product Producers: Rules to be regulated for making quality and standard products
Agricultural Standards Act, B.E. 2551 (2017): This act describes the meaning and requirements
of the agricultural standard and explains the role of related organisations.
Agricultural Economics Act, B.E. 2522 (1979): Defines the wording of agricultural economics,
agriculture development, agricultural economic area, agriculture policy; and explains the role of
related organisations in agricultural economics regulation.
23
⚫ Factories/Warehouses: Regulations for controlling operations in factories and warehouses
Regulation of the Ministry of Industry: Security Measurement Regarding Cooling System Using
Ammonia as a Refrigerating Substance in Factory, B.E. 2554 (2011): This report provides details
about cooling systems, such as the design, manufacturing, and installation of refrigeration
systems, repair and modification of the systems, safety and maintenance of the systems,
emission control, and emergency preparedness and response.
Warehouse, Silo and Cold Storage Act, B.E. 2558 (2015): Provides explanations about the
authority of the committee for supervising warehouse silo and cold storage and serves as a guide
for warehouse business, silo, and cold storage business operations, including: (1) the
establishment of and applications for licences and the granting of licences; (2) supervision of
warehouse business, silo business, and cold storage business operations; (3) liability of the
operator of warehouse business, silo business, and cold storage business, and (4) appeal; detail
of warehouse business, silo business, and cold storage specifically for maintaining good of
subsidiary; and penalties.
⚫ Transportation: Acts for the constraint of the transportation system, both domestically and
internationally
Carriage of Goods by Sea Act, B.E. 2534 (1991): This act mentions the carriage of goods by sea,
including: (1) defining the words that correspond to the carriage of goods by sea, (2) rights and
duties of the carrier, (3) bills of lading, (4) rights and duties of the shipper, (5) liabilities of the
carrier, (6) exclusions to liabilities of the carrier, and (7) limitations of the liabilities of the carrier
and the calculation of damages.
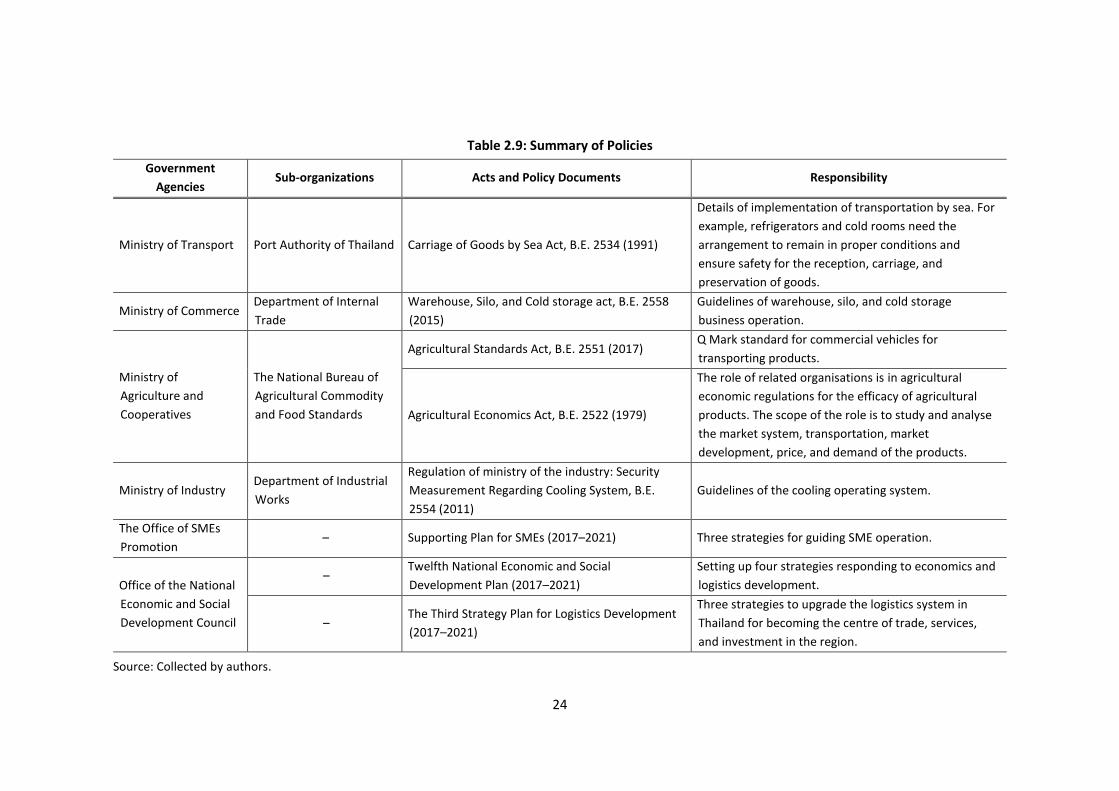
All the policies mentioned above are summarised in Table 2.9. It provides information about the
policies, related organisations, and the authorities of the organization. This information will be
useful for stakeholders.
As can be seen, there are various government agencies responsible for control, regulation, and
support activities related to the cold chain. This shows that the government places importance
on the cold chain. Even though there is no specific agency in charge of it, the policies encourage
cold chain development.
24
Table 2.9: Summary of Policies
Government
Agencies Sub-organizations Acts and Policy Documents Responsibility
Ministry of Transport Port Authority of Thailand Carriage of Goods by Sea Act, B.E. 2534 (1991)
Details of implementation of transportation by sea. For
example, refrigerators and cold rooms need the
arrangement to remain in proper conditions and
ensure safety for the reception, carriage, and
preservation of goods.
Ministry of Commerce Department of Internal
Trade
Warehouse, Silo, and Cold storage act, B.E. 2558
(2015)
Guidelines of warehouse, silo, and cold storage
business operation.
Ministry of
Agriculture and
Cooperatives
The National Bureau of
Agricultural Commodity
and Food Standards
Agricultural Standards Act, B.E. 2551 (2017) Q Mark standard for commercial vehicles for
transporting products.
Agricultural Economics Act, B.E. 2522 (1979)
The role of related organisations is in agricultural
economic regulations for the efficacy of agricultural
products. The scope of the role is to study and analyse
the market system, transportation, market
development, price, and demand of the products.
Ministry of Industry Department of Industrial
Works
Regulation of ministry of the industry: Security
Measurement Regarding Cooling System, B.E.
2554 (2011)
Guidelines of the cooling operating system.
The Office of SMEs
Promotion – Supporting Plan for SMEs (2017–2021) Three strategies for guiding SME operation.
Office of the National
Economic and Social
Development Council
– Twelfth National Economic and Social
Development Plan (2017–2021)
Setting up four strategies responding to economics and
logistics development.
– The Third Strategy Plan for Logistics Development
(2017–2021)
Three strategies to upgrade the logistics system in
Thailand for becoming the centre of trade, services,
and investment in the region.
Source: Collected by authors.
25
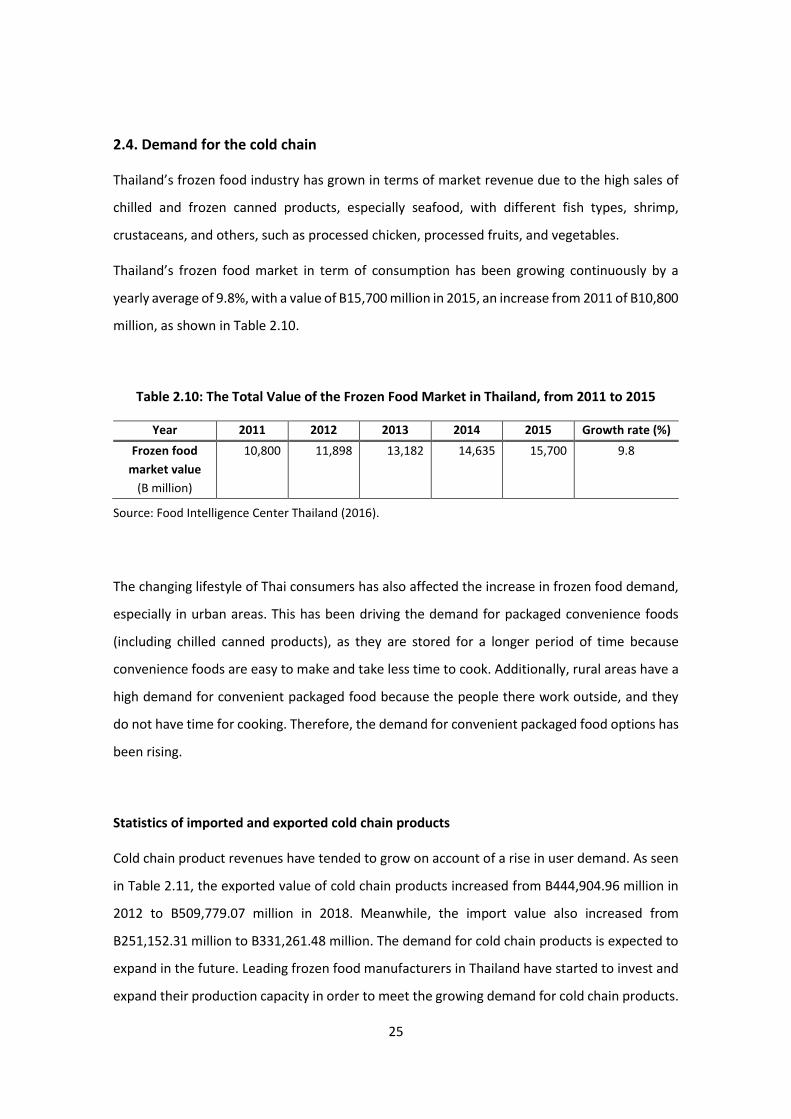
2.4. Demand for the cold chain
Thailand’s frozen food industry has grown in terms of market revenue due to the high sales of
chilled and frozen canned products, especially seafood, with different fish types, shrimp,
crustaceans, and others, such as processed chicken, processed fruits, and vegetables.
Thailand’s frozen food market in term of consumption has been growing continuously by a
yearly average of 9.8%, with a value of B15,700 million in 2015, an increase from 2011 of B10,800
million, as shown in Table 2.10.
Table 2.10: The Total Value of the Frozen Food Market in Thailand, from 2011 to 2015
Year 2011 2012 2013 2014 2015 Growth rate (%)
Frozen food
market value
(B million)
10,800 11,898 13,182 14,635 15,700 9.8
Source: Food Intelligence Center Thailand (2016).
The changing lifestyle of Thai consumers has also affected the increase in frozen food demand,
especially in urban areas. This has been driving the demand for packaged convenience foods
(including chilled canned products), as they are stored for a longer period of time because
convenience foods are easy to make and take less time to cook. Additionally, rural areas have a
high demand for convenient packaged food because the people there work outside, and they
do not have time for cooking. Therefore, the demand for convenient packaged food options has
been rising.
Statistics of imported and exported cold chain products
Cold chain product revenues have tended to grow on account of a rise in user demand. As seen
in Table 2.11, the exported value of cold chain products increased from B444,904.96 million in
2012 to B509,779.07 million in 2018. Meanwhile, the import value also increased from
B251,152.31 million to B331,261.48 million. The demand for cold chain products is expected to
expand in the future. Leading frozen food manufacturers in Thailand have started to invest and
expand their production capacity in order to meet the growing demand for cold chain products.

26
Table 2.11: Import and export values of cold chain products in Thailand
Years Value of cold chain products (B million)
Imports Exports
2012 251,152.31 444,904.96
2013 252,528.00 411,692.32
2014 261,293.44 438,331.63
2015 270,286.94 440,770.69
2016 300,935.91 480,247.42
2017 320,640.65 505,146.29
2018 331,261.48 509,779.07
Average 284,014.10 461,553.20
Source: Information and Communication Technology Center with Cooperation of the Customs Department
(2018).
⚫ Import of cold chain products
Considering the different types of imported cold chain products, as shown in Table 2.12,
pharmaceutical products (hormones, vitamins, and medicines) are the most imported with an
average of B99,002.01 million from 2012 to 2018. The majority of pharmaceutical products are
imported from Germany (B13,745.70 million in 2018), followed by the United States (B13,178.8
million) and China (B12,670.60 million). Fresh, chilled, frozen, and processed aquatic animals
have imports of B88,626.24 million on average, including (1) tuna at B42,602.59 million; (2)
salmon, cod, trout, and mackerel at B9,706.34 million; (3) shrimp at B3,982.56 million; (4) squid
at B10,440.03 million; (5) crab at B790.88 million; and (6) other processed aquatic products at
B21,103.84 million. Tuna accounts for a large part of imports because manufacturers import
tuna to produce canned and processed tuna products. The majority of imports are from Taiwan
(B8,051.90 million). In addition, agricultural products have a high average import value; the
average is B55,781.92 million. However, livestock and live plants have small import values of
B39,726.22 million and B877.71 million, respectively.
⚫ Export of cold chain products
In terms of exported cold chain products, as presented in Table 2.13, canned and processed food
products have the highest average export value (B207,609.97 million), followed by livestock
products (B106,148.64 million), aquatic products (B69,042.94 million), agricultural products
27
(B59,856.11 million), pharmaceutical products (B15,170.01 million), and live plants (B3,725.54
million), respectively. Thailand is a production base for fisheries and chicken. The majority of
exported livestock products are chilled, frozen, and processed chicken exports (B82,176.18
million). The main suppliers of chilled and frozen chicken products in 2018 were Japan, China,
and Malaysia, accounting for around half of the exported value. The majority of exported fishery
products were chilled, frozen, and processed shrimp. The United States was the biggest importer
of the products in 2018, followed by Japan and China, respectively.
As previously mentioned, the cold chain industry in Thailand is needed for food transportation
in both imports and exports. As a result, Thai food processors are also developing more
packaged, convenient foods (e.g. chilled, frozen, and instant food) to meet the demand of
domestic and foreign consumers, leading to the growth of cold chain logistics businesses, which
will be explained in the next section.
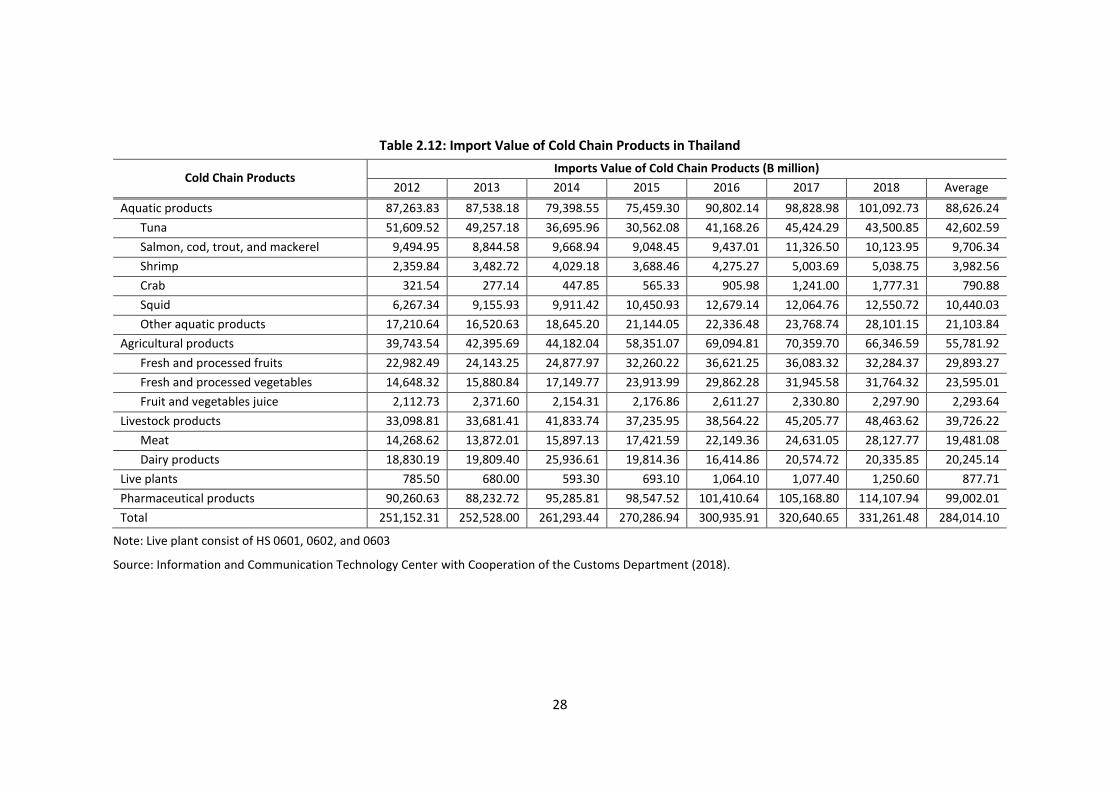
28
Table 2.12: Import Value of Cold Chain Products in Thailand
Cold Chain Products Imports Value of Cold Chain Products (B million)
2012 2013 2014 2015 2016 2017 2018 Average
Aquatic products 87,263.83 87,538.18 79,398.55 75,459.30 90,802.14 98,828.98 101,092.73 88,626.24
Tuna 51,609.52 49,257.18 36,695.96 30,562.08 41,168.26 45,424.29 43,500.85 42,602.59
Salmon, cod, trout, and mackerel 9,494.95 8,844.58 9,668.94 9,048.45 9,437.01 11,326.50 10,123.95 9,706.34
Shrimp 2,359.84 3,482.72 4,029.18 3,688.46 4,275.27 5,003.69 5,038.75 3,982.56
Crab 321.54 277.14 447.85 565.33 905.98 1,241.00 1,777.31 790.88
Squid 6,267.34 9,155.93 9,911.42 10,450.93 12,679.14 12,064.76 12,550.72 10,440.03
Other aquatic products 17,210.64 16,520.63 18,645.20 21,144.05 22,336.48 23,768.74 28,101.15 21,103.84
Agricultural products 39,743.54 42,395.69 44,182.04 58,351.07 69,094.81 70,359.70 66,346.59 55,781.92
Fresh and processed fruits 22,982.49 24,143.25 24,877.97 32,260.22 36,621.25 36,083.32 32,284.37 29,893.27
Fresh and processed vegetables 14,648.32 15,880.84 17,149.77 23,913.99 29,862.28 31,945.58 31,764.32 23,595.01
Fruit and vegetables juice 2,112.73 2,371.60 2,154.31 2,176.86 2,611.27 2,330.80 2,297.90 2,293.64
Livestock products 33,098.81 33,681.41 41,833.74 37,235.95 38,564.22 45,205.77 48,463.62 39,726.22
Meat 14,268.62 13,872.01 15,897.13 17,421.59 22,149.36 24,631.05 28,127.77 19,481.08
Dairy products 18,830.19 19,809.40 25,936.61 19,814.36 16,414.86 20,574.72 20,335.85 20,245.14
Live plants 785.50 680.00 593.30 693.10 1,064.10 1,077.40 1,250.60 877.71
Pharmaceutical products 90,260.63 88,232.72 95,285.81 98,547.52 101,410.64 105,168.80 114,107.94 99,002.01
Total 251,152.31 252,528.00 261,293.44 270,286.94 300,935.91 320,640.65 331,261.48 284,014.10
Note: Live plant consist of HS 0601, 0602, and 0603
Source: Information and Communication Technology Center with Cooperation of the Customs Department (2018).
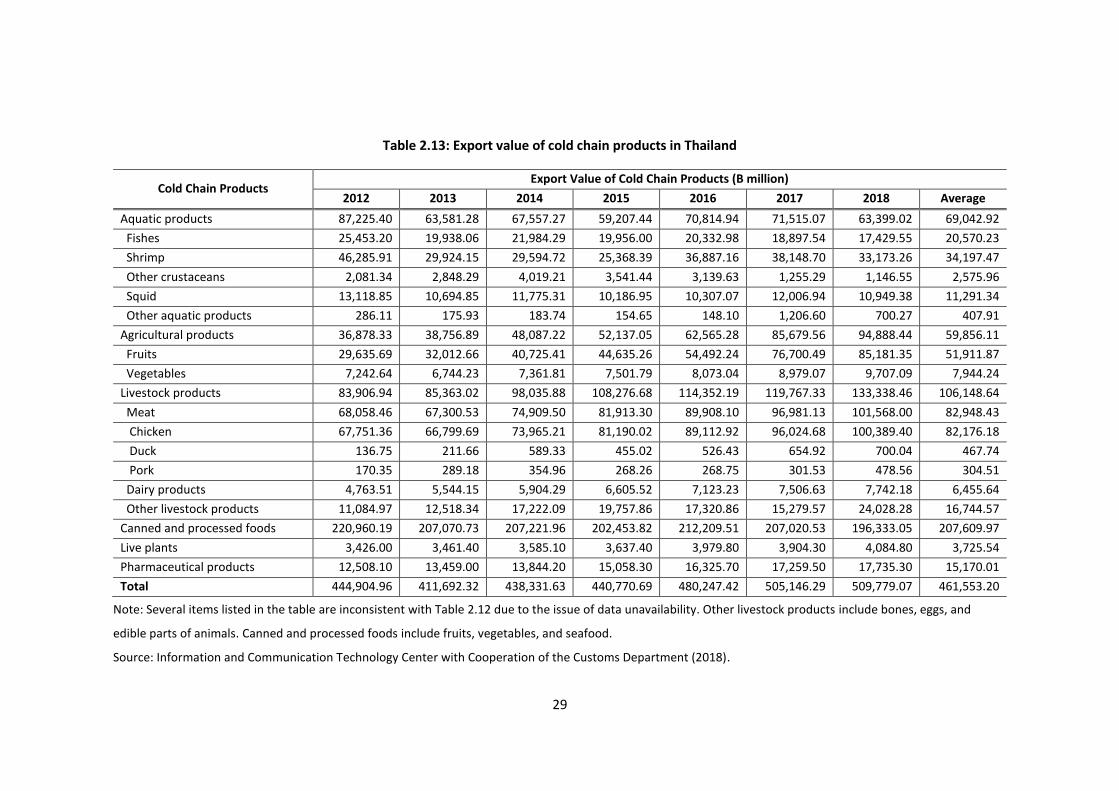
29
Table 2.13: Export value of cold chain products in Thailand
Cold Chain Products Export Value of Cold Chain Products (B million)
2012 2013 2014 2015 2016 2017 2018 Average
Aquatic products 87,225.40 63,581.28 67,557.27 59,207.44 70,814.94 71,515.07 63,399.02 69,042.92
Fishes 25,453.20 19,938.06 21,984.29 19,956.00 20,332.98 18,897.54 17,429.55 20,570.23
Shrimp 46,285.91 29,924.15 29,594.72 25,368.39 36,887.16 38,148.70 33,173.26 34,197.47
Other crustaceans 2,081.34 2,848.29 4,019.21 3,541.44 3,139.63 1,255.29 1,146.55 2,575.96
Squid 13,118.85 10,694.85 11,775.31 10,186.95 10,307.07 12,006.94 10,949.38 11,291.34
Other aquatic products 286.11 175.93 183.74 154.65 148.10 1,206.60 700.27 407.91
Agricultural products 36,878.33 38,756.89 48,087.22 52,137.05 62,565.28 85,679.56 94,888.44 59,856.11
Fruits 29,635.69 32,012.66 40,725.41 44,635.26 54,492.24 76,700.49 85,181.35 51,911.87
Vegetables 7,242.64 6,744.23 7,361.81 7,501.79 8,073.04 8,979.07 9,707.09 7,944.24
Livestock products 83,906.94 85,363.02 98,035.88 108,276.68 114,352.19 119,767.33 133,338.46 106,148.64
Meat 68,058.46 67,300.53 74,909.50 81,913.30 89,908.10 96,981.13 101,568.00 82,948.43
Chicken 67,751.36 66,799.69 73,965.21 81,190.02 89,112.92 96,024.68 100,389.40 82,176.18
Duck 136.75 211.66 589.33 455.02 526.43 654.92 700.04 467.74
Pork 170.35 289.18 354.96 268.26 268.75 301.53 478.56 304.51
Dairy products 4,763.51 5,544.15 5,904.29 6,605.52 7,123.23 7,506.63 7,742.18 6,455.64
Other livestock products 11,084.97 12,518.34 17,222.09 19,757.86 17,320.86 15,279.57 24,028.28 16,744.57
Canned and processed foods 220,960.19 207,070.73 207,221.96 202,453.82 212,209.51 207,020.53 196,333.05 207,609.97
Live plants 3,426.00 3,461.40 3,585.10 3,637.40 3,979.80 3,904.30 4,084.80 3,725.54
Pharmaceutical products 12,508.10 13,459.00 13,844.20 15,058.30 16,325.70 17,259.50 17,735.30 15,170.01
Total 444,904.96 411,692.32 438,331.63 440,770.69 480,247.42 505,146.29 509,779.07 461,553.20
Note: Several items listed in the table are inconsistent with Table 2.12 due to the issue of data unavailability. Other livestock products include bones, eggs, and
edible parts of animals. Canned and processed foods include fruits, vegetables, and seafood.
Source: Information and Communication Technology Center with Cooperation of the Customs Department (2018).
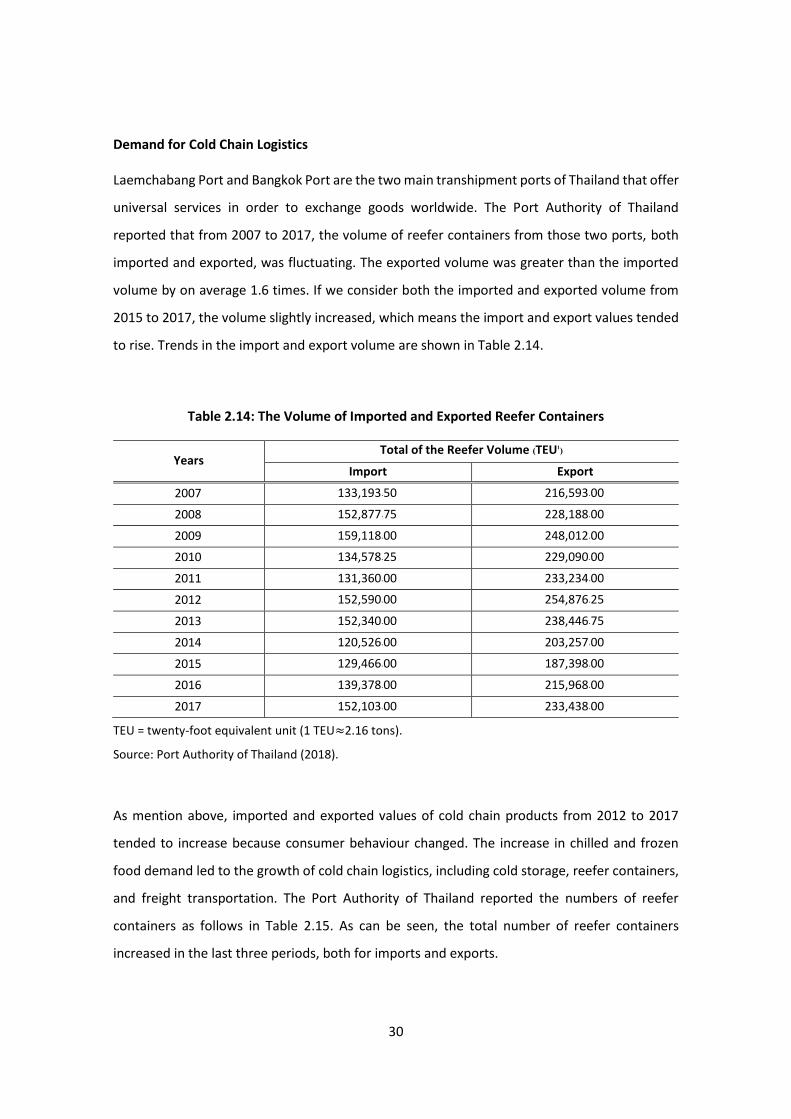
30
Demand for Cold Chain Logistics
Laemchabang Port and Bangkok Port are the two main transhipment ports of Thailand that offer
universal services in order to exchange goods worldwide. The Port Authority of Thailand
reported that from 2007 to 2017, the volume of reefer containers from those two ports, both
imported and exported, was fluctuating. The exported volume was greater than the imported
volume by on average 1.6 times. If we consider both the imported and exported volume from
2015 to 2017, the volume slightly increased, which means the import and export values tended
to rise. Trends in the import and export volume are shown in Table 2.14.
Table 2.14: The Volume of Imported and Exported Reefer Containers
Years Total of the Reefer Volume (TEU1)
Import Export
2007 133,193.50 216,593.00
2008 152,877.75 228,188.00
2009 159,118.00 248,012.00
2010 134,578.25 229,090.00
2011 131,360.00 233,234.00
2012 152,590.00 254,876.25
2013 152,340.00 238,446.75
2014 120,526.00 203,257.00
2015 129,466.00 187,398.00
2016 139,378.00 215,968.00
2017 152,103.00 233,438.00
TEU = twenty-foot equivalent unit (1 TEU≈2.16 tons).
Source: Port Authority of Thailand (2018).
As mention above, imported and exported values of cold chain products from 2012 to 2017
tended to increase because consumer behaviour changed. The increase in chilled and frozen
food demand led to the growth of cold chain logistics, including cold storage, reefer containers,
and freight transportation. The Port Authority of Thailand reported the numbers of reefer
containers as follows in Table 2.15. As can be seen, the total number of reefer containers
increased in the last three periods, both for imports and exports.
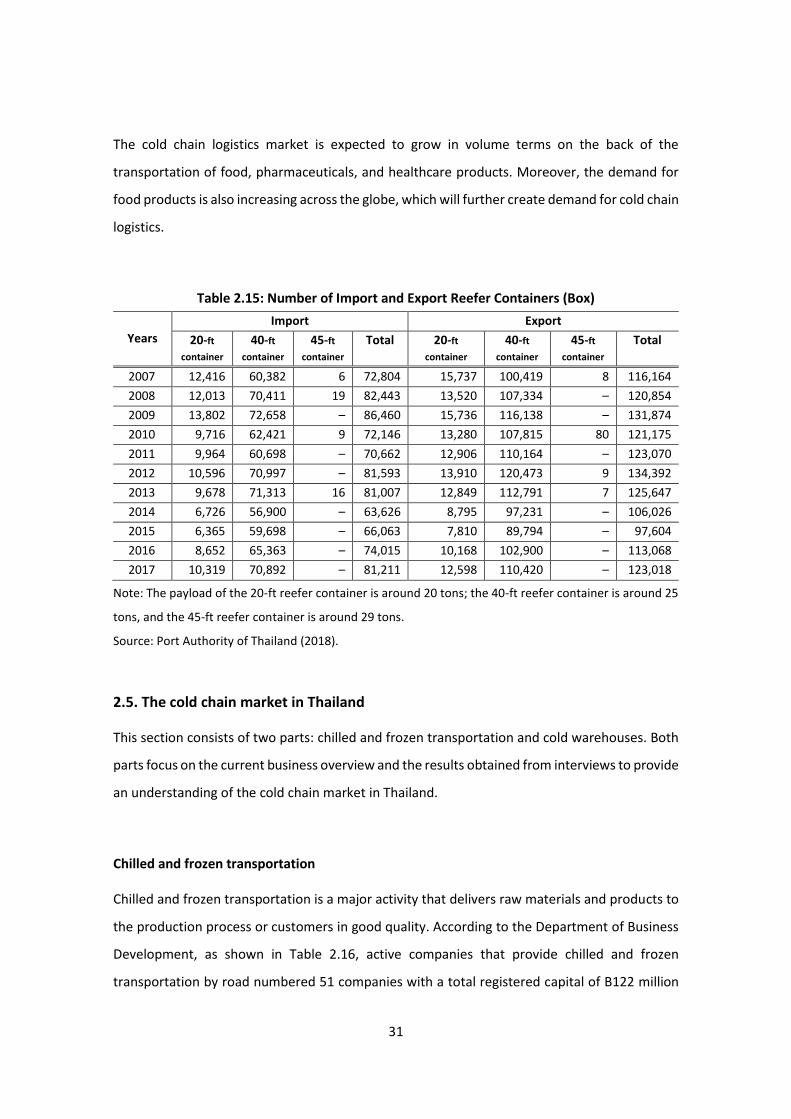
31
The cold chain logistics market is expected to grow in volume terms on the back of the
transportation of food, pharmaceuticals, and healthcare products. Moreover, the demand for
food products is also increasing across the globe, which will further create demand for cold chain
logistics.
Table 2.15: Number of Import and Export Reefer Containers (Box)
Years
Import Export
20-ft
container 40-ft
container 45-ft
container Total 20-ft
container 40-ft
container 45-ft
container Total
2007 12,416 60,382 6 72,804 15,737 100,419 8 116,164
2008 12,013 70,411 19 82,443 13,520 107,334 – 120,854
2009 13,802 72,658 – 86,460 15,736 116,138 – 131,874
2010 9,716 62,421 9 72,146 13,280 107,815 80 121,175
2011 9,964 60,698 – 70,662 12,906 110,164 – 123,070
2012 10,596 70,997 – 81,593 13,910 120,473 9 134,392
2013 9,678 71,313 16 81,007 12,849 112,791 7 125,647
2014 6,726 56,900 – 63,626 8,795 97,231 – 106,026
2015 6,365 59,698 – 66,063 7,810 89,794 – 97,604
2016 8,652 65,363 – 74,015 10,168 102,900 – 113,068
2017 10,319 70,892 – 81,211 12,598 110,420 – 123,018
Note: The payload of the 20-ft reefer container is around 20 tons; the 40-ft reefer container is around 25
tons, and the 45-ft reefer container is around 29 tons.
Source: Port Authority of Thailand (2018).
2.5. The cold chain market in Thailand
This section consists of two parts: chilled and frozen transportation and cold warehouses. Both
parts focus on the current business overview and the results obtained from interviews to provide
an understanding of the cold chain market in Thailand.
Chilled and frozen transportation
Chilled and frozen transportation is a major activity that delivers raw materials and products to
the production process or customers in good quality. According to the Department of Business
Development, as shown in Table 2.16, active companies that provide chilled and frozen
transportation by road numbered 51 companies with a total registered capital of B122 million

32
in 2019. Four companies had foreign joint investment and the other companies were local
companies. There was significant annual growth in total revenue of 43% from 2015 to 2016. It
is possible that chilled and frozen transportation will grow significantly in the future.
Table 2.16: Overview of the Chilled and Frozen Transportation Business Group in 2019
Business Profile Detail
Active company 51 companies
Registered capital B122 million
Joint investment Foreign: 4 companies (8%)
Local: 47 companies (92%)
Revenue of active companies
Year 2015: B3.31 million
Year 2016: B6.36 million
Year 2017: B6.03 million
Note: Data as of 24 January 2019, business code: 49331.
Source: Department of Business Development (2019).
Table 17 presents the number of cold transport operators in Thailand by vehicle type. Most
operators use a refrigerated mini truck, which accounts for 96%, including those with a tail lift
and without tail lift at 23% and 72%, respectively. The other types (trailer and semi-trailer) only
comprise 5%, implying that the refrigerated mini truck is the most common vehicle.
Table 2.17: Number of Refrigerated Vehicles Operators in 2019
Vehicle Type Number of Operators
Refrigerated trailer 8
Tail-lift refrigerated semi-trailer 4
Refrigerated semi-trailer 3
Refrigerated mini truck 244
Tail-lift refrigerated mini truck 79
Total 338
Note: Data of cold transport companies that were certified Q-Mark by Department of Land Transport in
Thailand.
Source: Department of Land Transport (2019).
According to an interview with a small-scale logistics provider who operates chilled and frozen
transportation and makes body trucks, the proportion of frozen and chilled trucks accounts for

33
83.5% and 16.5%, respectively. There are two types of vehicle, which are six-wheel and ten-
wheel trucks. The purchase price of a new six-wheel one starts from B2.10 million to B2.50
million; the ten-wheel one is around B3.5 million to B4.1 million. In addition, second-hand trucks
are also in use, with a price for a six-wheel from B0.85 million to B1.2 million, and ten-wheel
from B1.50 million to B2.20 million.
Thailand also has a tool to promote a level of service in freight transport, known as the service
quality standard for truck operation, or Q Mark. If operators have already registered their vehicle
with the Department of Land Transport (DLT), they can voluntarily request the DLT to certify for
the Q Mark certificate. Furthermore, DLT has implemented a Q Cold Chain program, which is an
extended standard of the Q mark, to enhance the quality of transportation of agricultural and
food products. The Q Cold Chain is about setting up a common quality standard of temperature-
controlled transport. The Q mark statistics, however, are not published at present. If the related
body improves their data collecting methods and makes them open to the public, this will be a
great benefit in the future.
The cold warehouse
In 2015, the total capacity of both public and private warehouses in Thailand was approximately
18.62 million metric tons. Conventional warehouses were dominant, accounting for 82%, while
silo and cold storages were around 13% and 5%, respectively, as shown in Table 2.18 below.
Table 2.18: Capacity of Warehouse, Silo, and Cold Storage in 2015 (million metric tons)
Type Warehouse Silo Cold Storage Total
Private 9.52 0.62 0.18 10.33
Public 5.81 1.73 0.76 8.30
Total 15.33 2.35 0.94 18.62
Source: Transportation Institute Chulalongkorn University cited from the Department of Internal Trade
(2015).
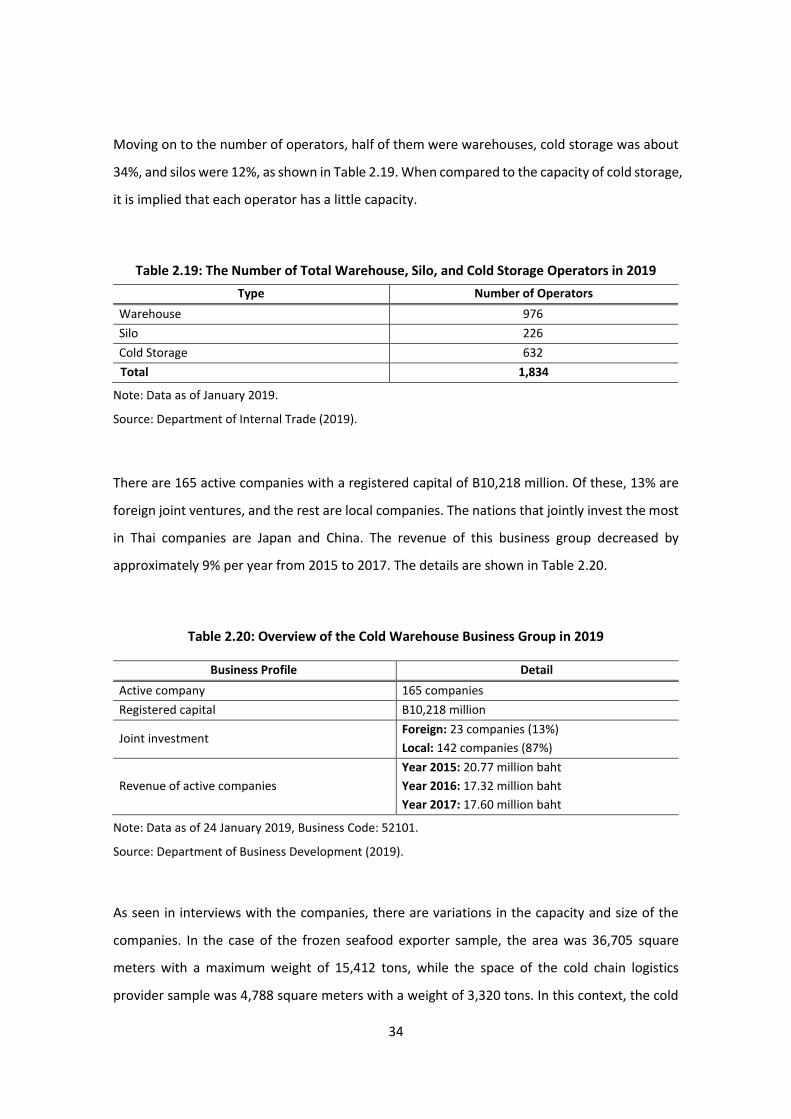
34
Moving on to the number of operators, half of them were warehouses, cold storage was about
34%, and silos were 12%, as shown in Table 2.19. When compared to the capacity of cold storage,
it is implied that each operator has a little capacity.
Table 2.19: The Number of Total Warehouse, Silo, and Cold Storage Operators in 2019
Type Number of Operators
Warehouse 976
Silo 226
Cold Storage 632
Total 1,834
Note: Data as of January 2019.
Source: Department of Internal Trade (2019).
There are 165 active companies with a registered capital of B10,218 million. Of these, 13% are
foreign joint ventures, and the rest are local companies. The nations that jointly invest the most
in Thai companies are Japan and China. The revenue of this business group decreased by
approximately 9% per year from 2015 to 2017. The details are shown in Table 2.20.
Table 2.20: Overview of the Cold Warehouse Business Group in 2019
Business Profile Detail
Active company 165 companies
Registered capital B10,218 million
Joint investment Foreign: 23 companies (13%)
Local: 142 companies (87%)
Revenue of active companies
Year 2015: 20.77 million baht
Year 2016: 17.32 million baht
Year 2017: 17.60 million baht
Note: Data as of 24 January 2019, Business Code: 52101.
Source: Department of Business Development (2019).
As seen in interviews with the companies, there are variations in the capacity and size of the
companies. In the case of the frozen seafood exporter sample, the area was 36,705 square
meters with a maximum weight of 15,412 tons, while the space of the cold chain logistics
provider sample was 4,788 square meters with a weight of 3,320 tons. In this context, the cold
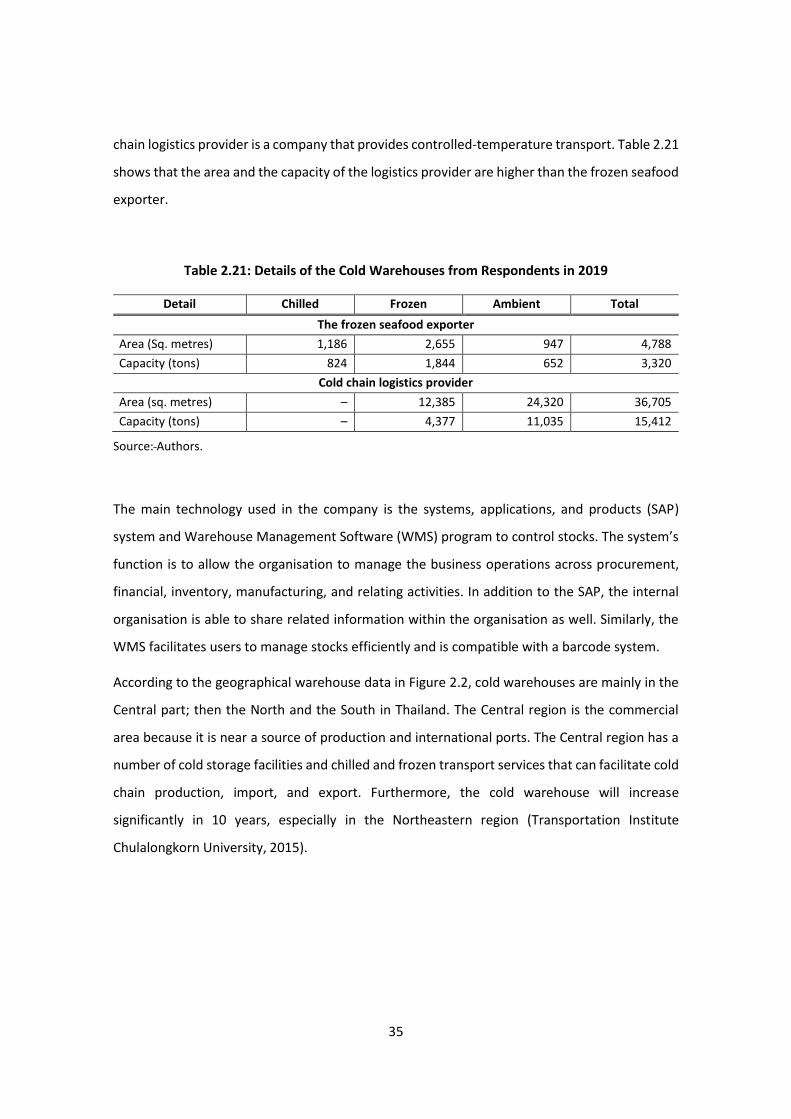
35
chain logistics provider is a company that provides controlled-temperature transport. Table 2.21
shows that the area and the capacity of the logistics provider are higher than the frozen seafood
exporter.
Table 2.21: Details of the Cold Warehouses from Respondents in 2019
Detail Chilled Frozen Ambient Total
The frozen seafood exporter
Area (Sq. metres) 1,186 2,655 947 4,788
Capacity (tons) 824 1,844 652 3,320
Cold chain logistics provider
Area (sq. metres) – 12,385 24,320 36,705
Capacity (tons) – 4,377 11,035 15,412
Source: Authors.
The main technology used in the company is the systems, applications, and products (SAP)
system and Warehouse Management Software (WMS) program to control stocks. The system’s
function is to allow the organisation to manage the business operations across procurement,
financial, inventory, manufacturing, and relating activities. In addition to the SAP, the internal
organisation is able to share related information within the organisation as well. Similarly, the
WMS facilitates users to manage stocks efficiently and is compatible with a barcode system.
According to the geographical warehouse data in Figure 2.2, cold warehouses are mainly in the
Central part; then the North and the South in Thailand. The Central region is the commercial
area because it is near a source of production and international ports. The Central region has a
number of cold storage facilities and chilled and frozen transport services that can facilitate cold
chain production, import, and export. Furthermore, the cold warehouse will increase
significantly in 10 years, especially in the Northeastern region (Transportation Institute
Chulalongkorn University, 2015).
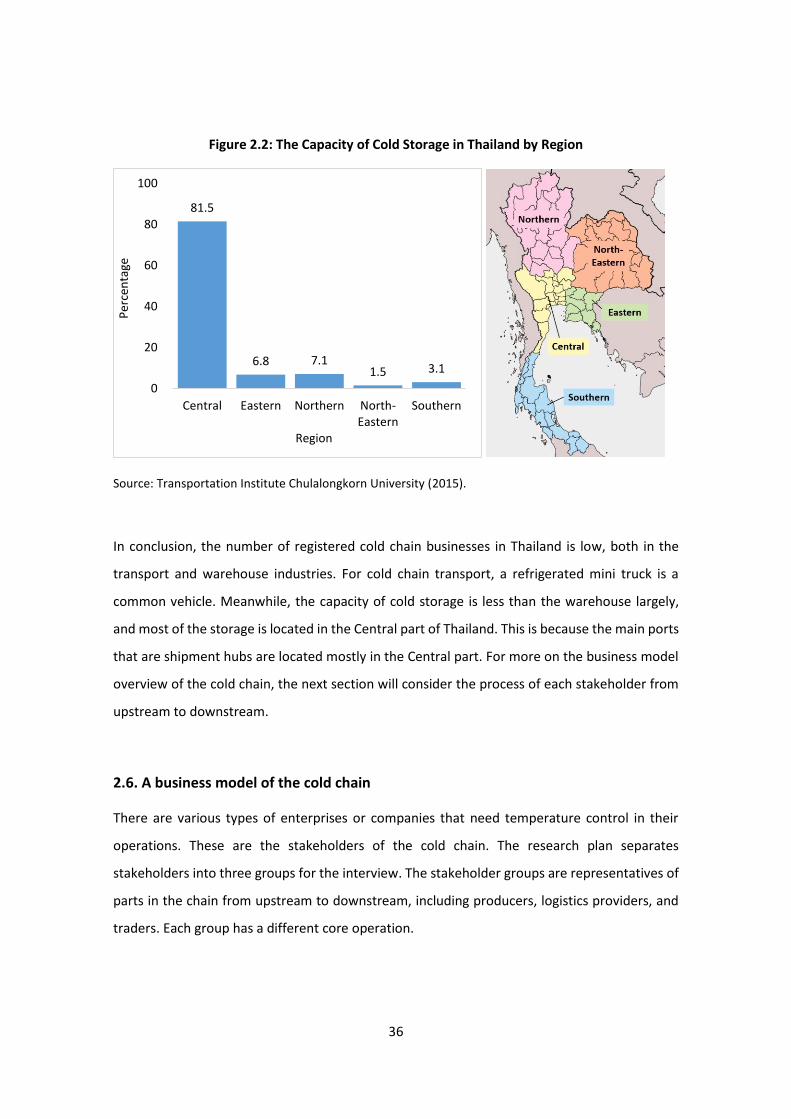
36
Figure 2.2: The Capacity of Cold Storage in Thailand by Region
Source: Transportation Institute Chulalongkorn University (2015).
In conclusion, the number of registered cold chain businesses in Thailand is low, both in the
transport and warehouse industries. For cold chain transport, a refrigerated mini truck is a
common vehicle. Meanwhile, the capacity of cold storage is less than the warehouse largely,
and most of the storage is located in the Central part of Thailand. This is because the main ports
that are shipment hubs are located mostly in the Central part. For more on the business model
overview of the cold chain, the next section will consider the process of each stakeholder from
upstream to downstream.
2.6. A business model of the cold chain
There are various types of enterprises or companies that need temperature control in their
operations. These are the stakeholders of the cold chain. The research plan separates
stakeholders into three groups for the interview. The stakeholder groups are representatives of
parts in the chain from upstream to downstream, including producers, logistics providers, and
traders. Each group has a different core operation.
81.5
6.8 7.11.5 3.1
0
20
40
60
80
100
Central Eastern Northern North-Eastern
Southern
Per
cen
tage
Region
37
Business model overview
The information from the interview shows how each type of stakeholder needs temperature
control and demonstrates the business model of the cold chain in Thailand. An overview of the
business model will be described in three topics consistent with the stakeholder group as follows.
⚫ Producer
The producer is in the upstream part on the chain and is the agriculturist and food manufacturing
industry that produces agricultural products. The agriculturist is a first producer, such as a
farmer, fisherman, or rancher. They are responsible for producing, harvesting, and collecting
supplies of fruits, vegetables, aquatic animals, and livestock for manufacturing. The
manufacturer is the next producer receiving the supply from the agriculturist, who then
processes it into a processed and final product.
Thai Union Group PCL is a representative sample of the producer group as a large producer due
to having numerous subsidiaries and associated companies domestically and internationally.
The subsidiaries and associated companies are Thai Ruamsin Patana Industry Co., Ltd., Songkla
Canning PCL., Okeanos Food Co., Ltd., Chicken of the Sea brand, King Oscar brand, John West
brand, and other subsidiary companies. The principal factory is located in Samutsakorn province.
The factory mainly produces canned tuna, pouch tuna, and canned sardines.
The cold chain is necessary for manufacturing for preserving the input supply in transportation
from the shore and customs to the factory and keeping them in cold storage during the
production process. The main input supply, which is fish, mainly comes from the Republic of
Korea, Japan, and Taiwan. The company mostly uses factory-owned normal temperature trucks.
As the fish supply is usually frozen as a pack of ice at the boat at the origin, the factory typically
keeps a supply in their cold storage. However, the factory uses third-party logistics companies
(3PLs) in oversupply periods. At that time, the supply is greater than the capability of the trucks
and cold storage. The selection criteria for the 3PLs are quality of service, price, responsibility,
and traceability. The expectations of the 3PLs are timeliness, accuracy, and completeness. The
factory emphasises human resource development by training on transportation and product
management both for normal and temperature-controlled products. Moreover, the factory also
creates the work instructions in various languages for the nationalities of its labour force to
38
ensure understanding. This affects the accuracy of their work. Additionally, the company is
working with local fishermen to support them.
⚫ Logistics provider
The logistics provider is in the midstream part of the chain. They provide transportation and
warehouse services. The core business of transportation is providing the service of sending a
supply, material, or product between the producer, warehouse, distribution centre, shipment,
and customer. Also, the core business of the warehouse is the service of storage of products for
producers and traders that do not have suitable space or warehouses to store their products.
Representative samples of the logistics provider group are Rujoran Transport Co., Ltd. as a small
provider, Eagles Air & Sea Co., Ltd. and CTI Logistics Co., Ltd. as a medium provider. The size of
the enterprises tells us the capital size, which indicates the capacity of the service operations.
The logistics providers have different kind of services, such as trucks and warehouses in various
temperatures, such as ordinary temperatures, refrigerating, and freezing. Even though the type
of service does not depend on the enterprise size, the cost of temperature-controlled trucks and
warehouses are higher than ordinary ones.
The logistics providers are usually located in the city centre, manufacturing area, border, sea-
river port, airport, or other significant locations. They typically make contracts with large traders.
Standards are essential to the logistics provider as a guarantee of their services. Thus, they are
incentivised to make their services along with the standards that are required by the client and
authority. The client requires standards for the contract, while the authority requires standards
as a regulation. The standards control and regulate hygiene, laws, driver qualifications, and
necessary technology, such as temperature controllers and GPS. Nowadays, most of the trucks
used in transporting goods are location traceable by GPS and have temperature traceability.
They are controlled and operated by well-trained staff.
⚫ Trader
The trader is in the downstream part of the chain. Moreover, it is the closest group to the
consumer as the core business of the trader is selling products to the consumer directly. The
39
traders are modern traders, shops, restaurants, and producers that sell their products to the
consumer without an intermediary. The products that traders sell are final products, semi-
finished products, ready to cook products, ready to eat products, and other consumable
products.
Harmony Life International Co., Ltd. is the representative sample of the trader group as a
medium trader. The company has owned an organic farm in Nakhon Ratchasima province. The
products of the company are fresh vegetables and processed products, such as herbal tea,
noodles, jams, soaps, and other goods. The products are mainly sold domestically at their shop
and restaurant in Bangkok, called Sustaina Organic Shop Restaurant. Also, they send products
to other modern trade shelves, such as Big C, Lotus, the mall, Tops Supermarket, and local health
shops. Moreover, their noodle product is an ingredient for the MK restaurant. The company
mainly exports herbal tea, spice, and processed organic product to Singapore, Hong Kong,
Taiwan, and the United States.
Their temperature-controlled products are fresh vegetables and jams. Thus, the company only
uses a company-owned truck to transport their products domestically from the farm to their
warehouses, offices, restaurants, and partners’ places in Bangkok. There are two zones
separately in their warehouse; the normal temperature zone and chilled zone. The company
uses large freight forwarders as 3PLs for transporting unperishable products. The selection
criteria for 3PLs are hygiene, timeliness, accuracy, and safety. The company is exceedingly
concerned about their products. Thus, they train staff to use trucks and storage that are both
normal and temperature controlled.
The above are details of each type of business model that is obviously connected by temperature
control. Next will be a discussion on its connection.
Connection of the cold chain
The cold chain connects stakeholders by temperature control in different ways due to the
different core operations of each stakeholder as a tool to maintain the condition of supply from
the origin to the end of the chain.
40
The temperature control process properly begins at the farm or in the middle of the ocean right
after the supply is picked up from its origin, to maintain the original condition as much as
possible. Then, it is sent to a receiver, who has an influence on valuing and pricing the supply. A
supply in good condition gets high compensation or payment. The receivers could be the
manufacturing industry, warehouses, distribution centres, traders, or consumers.
The manufacturing industry receives materials supply as an input. It is then processed into an
output, which is the processed and final product. While waiting for processing and sending, they
keep the supply and product in the cold storage. After the process ends, they send the output
to the warehouse, distribution centre, trader, and consumer. The trader receives the processed
and final food product from the producer. They keep the products in cold storage for stocking.
They put the products on a temperature-controlled shelf to display and wait for selling to the
consumer.
Temperature-controlled transportation and warehouses are intermediate in the chain. Thus,
they are in the middle between stakeholders. The operator of the transportation and warehouse
could be the producer, trader, or logistics provider depending on the deal and contract since
some producers and traders play the transportation and warehouse operator roles at times. This
is to support their core operations, unlike the logistics provider, whose core business is providing
transportation and warehouse services. The producers and traders that own numerous
temperature-controlled transportation and warehouse facilities are mostly large- and medium-
sized as the standard temperature control needs high capital or investment and operation. Thus,
they only use 3PLs when there is an oversupply for their capacity.
Because of the high investment costs in the chain, stakeholders are finding ways to reduce the
operating costs. In the case of a farm, the farmer tends to have temperature control by using
natural cold weather at night and dawn and protects the supply with leaves to save costs. In
addition, stakeholders reduce their costs by taking advantage of locations by building an office,
manufacturing, distribution centre, and warehouse near the origin of supply, infrastructure
facility, and customers.
This describes the connection of the cold chain, which shows that each stakeholder could play
more than one role. Each part in the chain adds value to the product by processes. Thus, the
consumer at the end of the chain can get the product from stakeholders who are playing in any

41
part of the chain, such as farmers, factory shops, modern traders, restaurants, and others,
depending on their needs on the value of commodities.
Main players and users of the cold chain
The interviewees provided the names of player and user companies of the cold chain in Thailand,
such as JWD, SCG, the Heritage, Harpers, Excel, and other companies. Also, the research team
studied the Data Warehouse of the Department of Business Development (DBD) to find the main
players and users of the chain. The methods focused on sorting the revenue which is declared
in the financial budget together with the business type reported by registered legal persons in
the latest year.
The DBD applies the Thailand Standard Industrial Classification (TSIC) from the Ministry of
Labour, which referred to the United Nations Statistics Division’s International Standard
Industrial Classification (ISIC). This is a principle to establish a TSIC business code into 21 sections
from A to U. Transportation and storage are in section H, which consists of the various types of
businesses involved. However, this study focuses on road transport services of freight by
refrigerator vehicles, which in H49331, and Refrigerated storage activities in H52101.
The road transport services of freight by refrigerator vehicles activity (H49331) refer to the main
players of transportation in the chain as shown in Table 2.22. In 2017, this activity earned a total
revenue of B587 million, and there are 29–56 operators declaring their revenue to the authority.
Table 2.22: Main Players of Transportation in the Cold Chain
Order1 Legal Person Name
Legal
Person
Type2
Size3 Location
(Province)
Revenue
(baht)4
Proportion5
(%)
1 P.M. Distribution Co., Ltd. S Nonthaburi 128,898,353 21.97
2 Paramee Logistics Co., Ltd. S Chiang Mai 111,788,683 19.05
3 2299 Trading Co., Ltd. S Chiang Mai 68,766,000 11.72
4 Konoike Asia (Thailand) Co., Ltd.
S Samut
Prakan 48,861,610 8.33
5 3G Shipping Agent P'ship. Ltd. S Surat Thani 40,529,740 6.91
6 Pattara Logistics Co., Ltd. S Bangkok 32,356,394 5.52
7 Teerasak Transport P'ship. Ltd. S Bangkok 26,119,970 4.45
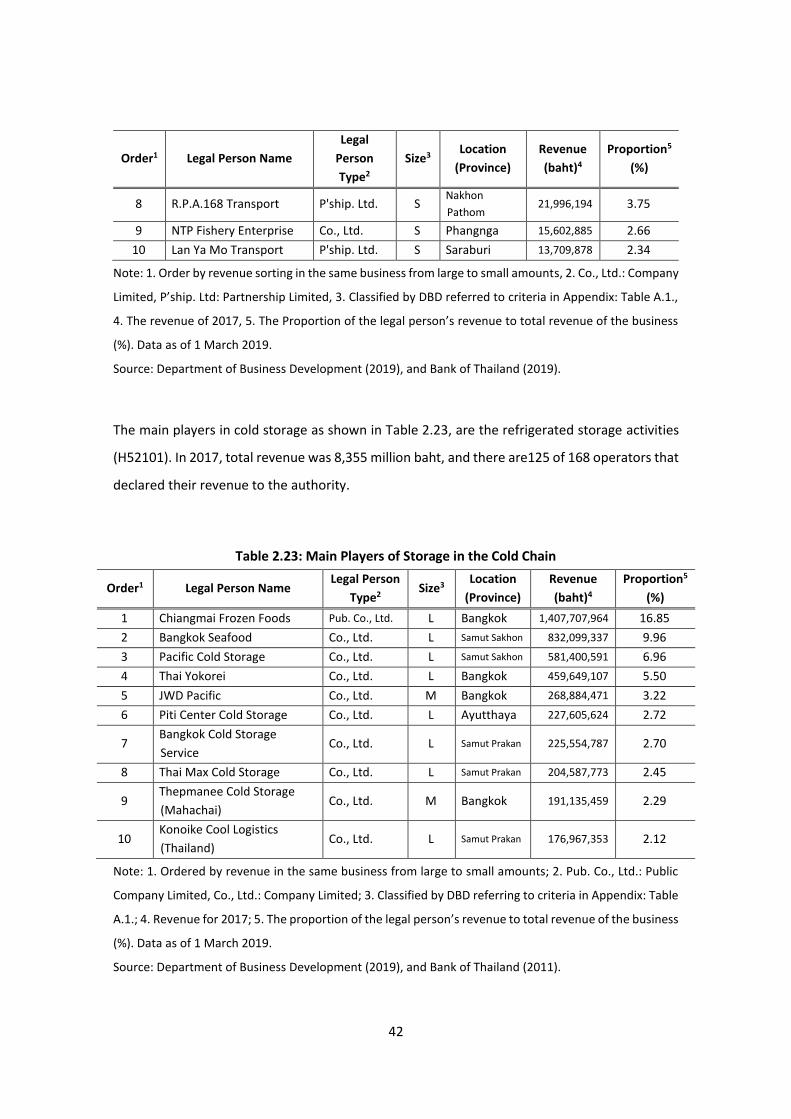
42
Order1 Legal Person Name
Legal
Person
Type2
Size3 Location
(Province)
Revenue
(baht)4
Proportion5
(%)
8 R.P.A.168 Transport P'ship. Ltd. S Nakhon
Pathom 21,996,194 3.75
9 NTP Fishery Enterprise Co., Ltd. S Phangnga 15,602,885 2.66
10 Lan Ya Mo Transport P'ship. Ltd. S Saraburi 13,709,878 2.34
Note: 1. Order by revenue sorting in the same business from large to small amounts, 2. Co., Ltd.: Company
Limited, P’ship. Ltd: Partnership Limited, 3. Classified by DBD referred to criteria in Appendix: Table A.1.,
4. The revenue of 2017, 5. The Proportion of the legal person’s revenue to total revenue of the business
(%). Data as of 1 March 2019.
Source: Department of Business Development (2019), and Bank of Thailand (2019).
The main players in cold storage as shown in Table 2.23, are the refrigerated storage activities
(H52101). In 2017, total revenue was 8,355 million baht, and there are125 of 168 operators that
declared their revenue to the authority.
Table 2.23: Main Players of Storage in the Cold Chain
Order1 Legal Person Name Legal Person
Type2 Size3
Location
(Province)
Revenue
(baht)4
Proportion5
(%)
1 Chiangmai Frozen Foods Pub. Co., Ltd. L Bangkok 1,407,707,964 16.85
2 Bangkok Seafood Co., Ltd. L Samut Sakhon 832,099,337 9.96
3 Pacific Cold Storage Co., Ltd. L Samut Sakhon 581,400,591 6.96
4 Thai Yokorei Co., Ltd. L Bangkok 459,649,107 5.50
5 JWD Pacific Co., Ltd. M Bangkok 268,884,471 3.22
6 Piti Center Cold Storage Co., Ltd. L Ayutthaya 227,605,624 2.72
7 Bangkok Cold Storage
Service Co., Ltd. L Samut Prakan 225,554,787 2.70
8 Thai Max Cold Storage Co., Ltd. L Samut Prakan 204,587,773 2.45
9 Thepmanee Cold Storage
(Mahachai) Co., Ltd. M Bangkok 191,135,459 2.29
10 Konoike Cool Logistics
(Thailand) Co., Ltd. L Samut Prakan 176,967,353 2.12
Note: 1. Ordered by revenue in the same business from large to small amounts; 2. Pub. Co., Ltd.: Public
Company Limited, Co., Ltd.: Company Limited; 3. Classified by DBD referring to criteria in Appendix: Table
A.1.; 4. Revenue for 2017; 5. The proportion of the legal person’s revenue to total revenue of the business
(%). Data as of 1 March 2019.
Source: Department of Business Development (2019), and Bank of Thailand (2011).
43
Regarding the mentioned main players by interviewees and the report from the Data Warehouse, it
appears that the common main players are JWD Pacific (5) and Pacific Cold Storage (3). They are
subsidiaries of JWD InfoLogistics Public Company Limited, as shown in their Annual Report 2018.
Therefore, the research team explored the cold chain clients of JWD InfoLogistics as shown on their
website to demonstrate the main users of the chain in Table 2.24.
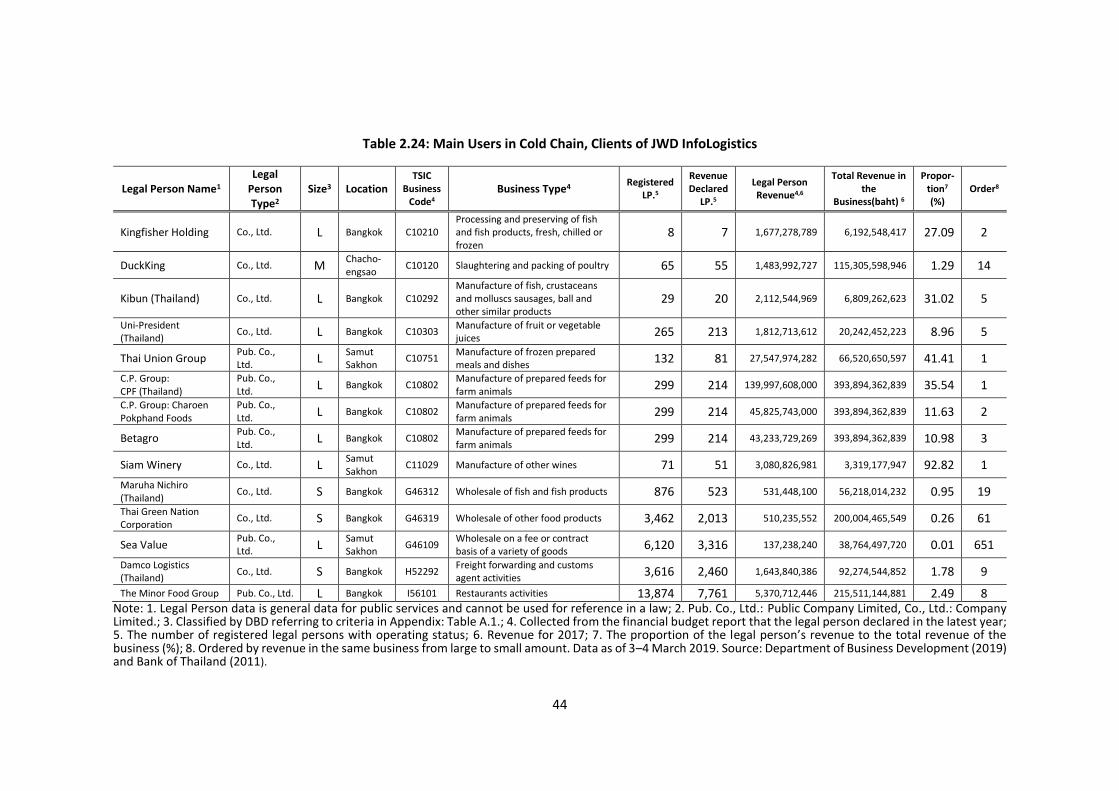
44
Table 2.24: Main Users in Cold Chain, Clients of JWD InfoLogistics
Legal Person Name1 Legal
Person Type2
Size3 Location TSIC
Business Code4
Business Type4 Registered
LP.5
Revenue Declared
LP.5
Legal Person Revenue4,6
Total Revenue in the
Business(baht) 6
Propor-tion7 (%)
Order8
Kingfisher Holding Co., Ltd. L Bangkok C10210 Processing and preserving of fish and fish products, fresh, chilled or frozen
8 7 1,677,278,789 6,192,548,417 27.09 2
DuckKing Co., Ltd. M Chacho- engsao
C10120 Slaughtering and packing of poultry 65 55 1,483,992,727 115,305,598,946 1.29 14
Kibun (Thailand) Co., Ltd. L Bangkok C10292 Manufacture of fish, crustaceans and molluscs sausages, ball and other similar products
29 20 2,112,544,969 6,809,262,623 31.02 5
Uni-President (Thailand)
Co., Ltd. L Bangkok C10303 Manufacture of fruit or vegetable juices
265 213 1,812,713,612 20,242,452,223 8.96 5
Thai Union Group Pub. Co., Ltd.
L Samut Sakhon
C10751 Manufacture of frozen prepared meals and dishes
132 81 27,547,974,282 66,520,650,597 41.41 1
C.P. Group: CPF (Thailand)
Pub. Co., Ltd.
L Bangkok C10802 Manufacture of prepared feeds for farm animals
299 214 139,997,608,000 393,894,362,839 35.54 1
C.P. Group: Charoen Pokphand Foods
Pub. Co., Ltd.
L Bangkok C10802 Manufacture of prepared feeds for farm animals
299 214 45,825,743,000 393,894,362,839 11.63 2
Betagro Pub. Co., Ltd.
L Bangkok C10802 Manufacture of prepared feeds for farm animals
299 214 43,233,729,269 393,894,362,839 10.98 3
Siam Winery Co., Ltd. L Samut Sakhon
C11029 Manufacture of other wines 71 51 3,080,826,981 3,319,177,947 92.82 1
Maruha Nichiro (Thailand)
Co., Ltd. S Bangkok G46312 Wholesale of fish and fish products 876 523 531,448,100 56,218,014,232 0.95 19
Thai Green Nation Corporation
Co., Ltd. S Bangkok G46319 Wholesale of other food products 3,462 2,013 510,235,552 200,004,465,549 0.26 61
Sea Value Pub. Co., Ltd.
L Samut Sakhon
G46109 Wholesale on a fee or contract basis of a variety of goods
6,120 3,316 137,238,240 38,764,497,720 0.01 651
Damco Logistics (Thailand)
Co., Ltd. S Bangkok H52292 Freight forwarding and customs agent activities
3,616 2,460 1,643,840,386 92,274,544,852 1.78 9
The Minor Food Group Pub. Co., Ltd. L Bangkok I56101 Restaurants activities 13,874 7,761 5,370,712,446 215,511,144,881 2.49 8 Note: 1. Legal Person data is general data for public services and cannot be used for reference in a law; 2. Pub. Co., Ltd.: Public Company Limited, Co., Ltd.: Company Limited.; 3. Classified by DBD referring to criteria in Appendix: Table A.1.; 4. Collected from the financial budget report that the legal person declared in the latest year; 5. The number of registered legal persons with operating status; 6. Revenue for 2017; 7. The proportion of the legal person’s revenue to the total revenue of the business (%); 8. Ordered by revenue in the same business from large to small amount. Data as of 3–4 March 2019. Source: Department of Business Development (2019) and Bank of Thailand (2011).
45
The main players mentioned above are Betagro, CPF, Kingfisher, Thai Union, and Sea Value,
which correlate with key players in the food processing companies in Thailand’s food industry
as reported by BOI (2017b). The main users mostly are large-size enterprises for the main players
of cold storage. Meanwhile, the main players of temperature-controlled trucks are small-sized
enterprises. This conforms to the interview that mentioned that large transportation providers
make subcontracts with small and medium logistics providers. This is how the different size
players support each other to serve the demand for services from users, which is continuing to
rise as shown in the demand for cold chain logistics. Moreover, it could imply that cold storage
needs a higher investment cost than temperature-controlled trucks.
A considerable amount of Thai and foreign investment by users gives more opportunities to the
players, especially the small and medium players. In addition, the opportunity and support to
solve problems and overcome obstacles may encourage these companies to be more successful
and grow to be large companies in the future.
2.7. Expectations of government policy
There are numerous Thai government agencies involved in providing comprehensive policies to
support the cold chain. The agencies separately work on their mission and plan to consult,
promote, and provide services for the entire cold chain’s stakeholders. This section will discuss
the cold chain policies in terms of regulation and support in three parts: regulatory policy,
supporting policy, and private sector networking. The main ideas are according to the survey
interviews given by the stakeholders’ perceptions.
Regulatory policy
There is no specific agency responsible for the cold chain. However, there are integrated policies
to regulate the chain and unite the agencies for working together. There are main agencies that
take the core responsibility and there is a committee from other agencies involved. The
regulatory policy regarding the cold chain was established with objectives to raise the standards
and quality of the products. It enhances the competitiveness of enterprises. Moreover, it
46
ensures food safety and security. Examples of outstanding cold chain regulatory policy are the
Q Cold Chain Standard project and the Warehouse, Silo, and Cold Storage Standard policy.
⚫ The Q Cold Chain Standard Project
The DLT affiliated with the Ministry of Transport takes the core responsibility of the Q Cold Chain
standard project. It is a further extended policy of the Quality Standard for Truck Operators,
known as the Q Mark standard. The Q Mark standard for commercial vehicles is used in transport
goods and products. The Q Cold Chain standard is a pilot plan tested in January 2019. Eligible in
the pilot plan are Q Mark certified enterprises. They were evaluated by the draft of Quality
Standards for Temperature Control Truck Operators. Logistics Time Magazine (2019) refers to
the director of the DLT’s statement and reveals that the objectives of this project are to develop
the potential and create an opportunity of competitiveness for operators of temperature-
controlled transportation to achieve higher efficiency and sustainability. The evaluation
approach of the Q Cold Chain standard focuses on four key factors: the operation of transport,
hygiene, the standards and maintenance of cold storage, and human resource development.
⚫ Warehouse, silo, and cold storage policy
The Market System Promotion and Administration Division subordinate of the Department of
Internal Trade affiliated with Ministry of Commerce takes the core responsibility regarding the
Warehouse, Silo, and Cold Storage Act (2015). This act leads the division’s work on issuing the
standards for warehouse, silo, and cold storage. Moreover, the division is ordered to study,
analyse, and provide advice to support and develop entrepreneurs to reach the standard. The
standard helps to reduce the cost of waste and gain competitiveness. Also, the duty of this
division includes the issuing and withdrawal of licences for operating, and it also regulates and
controls warehouse, silo, and cold storage enterprises under the laws. The standard is now still
at the department level, which is being administrated and pushed by the department to be at
the national level in the near future. The national standard must be agreed by stakeholders in
the country and administrated by a central organisation, which could be private or public.
Currently, there are more than 100 operators certified by this standard. The certified operators
consist of approximately 75% of Thai SMEs.
47
The mentioned regulatory policies are voluntary regulations. They contribute to positive results
and consequences. However, there are still problems and obstacles that affect the stakeholders
regarding regulatory policy enforcement, insufficiency of concrete support, and entrepreneur’s
administration and management. Details referring to the survey interviews are listed in seven
categories as follows.
Human resources
- Lack of efficient human resources in cold chain operation.
- Small entrepreneurs and farmers rarely use cold storage to help in handling and seasonal
value adding. Most of them sell agricultural products immediately after being harvested,
due to liquidity necessity.
- Drivers have deficient English skills and legal knowledge for working across borders.
Operation costs
- Operation costs are high due to fluctuations in the gasoline price, but the logistics service
price cannot be adjusted along with the gasoline price consistently.
Infrastructure
- The random product check area is not a temperature-controlled area, which causes
discontinuities in products’ temperature-controlling.
- Road construction causes congestion on roads. This affects delays in product delivery,
especially cold chain products that are affected by timeliness.
- The delays may result in higher transportation costs and the disorder of management.
- Traffic jams in urban areas affect the timeliness of product transportation in many
routes, such as factory–distribution centre, port–distribution centre, distribution
centre–retail, and other routes.
Investment
- Cold storage and its facilities need high capital investment.
- There is uncovered special support by the Office of the Board of Investment (BOI) in
terms of tax exemption for investment in temperature-controlled trucks and cold
48
storage. The BOI exemption depends on the investment amount/expenditure for
enhancing competitiveness.
Customs
- The inconvenient and complicated import declaration process partly causes delays
during the shipment process from the port to the factory in some cases.
- Clear numbers of export products, such as herbs, spices, and tea, are usually not
consistent among staffs’ discretion. The wasted time and loss of tax refund benefits the
partners of exporters.
Institutional systems
- Certified enterprises get excessive examinations and regulations to achieve and
maintain the certification. Meanwhile, some uncertified enterprises claim their products
as organic. This makes it unequal for certified enterprises.
- There is a problem in collecting data on cold storage as some enterprises are not co-
operating to reveal information.
Logistics prohibition
- For certain time periods, such as the new year holidays and Thai new year holiday (in
April), the government has prohibited ten-wheeled trucks and more from providing
transport services in five major routes to reduce accidents. If the transport operators
want to use trucks in these periods, the operator must seek permission on a case-by-
case basis. This affects the cold chain in terms of the lack of products on shelves in a
regional area.
As can be seen, the problems and obstacles from the stakeholder’s perspective are related to
the concerned issues on the report of the Logistics Performance Index (World Bank, 2018) and
the High Level Public–Private Forum on Cold Chain to Strengthen Agriculture & Food’s Global
Value Chain (Agricultural Technical Cooperation Working Group of APEC, 2015). Apart from that,
hearing stakeholders’ perspectives and expectations will be useful for further additional
supporting policies.
49
Supporting policies
Regarding the problems and obstacles mentioned above, the entrepreneurs from the survey
interviews are expecting the following supporting policies.
⚫ Research for value-adding to cold chain products regarding accrediting qualifications and
R&D development.
⚫ Support small and medium-sized enterprises to participate in commodities trade fair
exhibitions abroad. Regarding the high cost of participation, this support will enhance the
competitiveness of SMEs in promoting their products.
⚫ Approach and attract skilled staff working in the cold chain to solve the lack of human
resources in the business.
⚫ Achieve prompt road construction facilitates to improve the timeliness and costs of cold
chain transportation products.
⚫ Attract investment support for logistics SMEs in the cold chain, such as low-interest loans
for purchasing temperature-controlled trucks and building cold storage.
⚫ Regulation for the cold chain is necessary, but entrepreneurs think that more regulation
will create more complications for their operation. Thus, entrepreneurs currently prefer
supporting policies more than regulatory policies, especially for SMEs.
⚫ Plans for handling unexpected situations, for example airport disruptions for trading and
transportation, particularly cold chain products that matter by the hour.
⚫ Need a specific agency to support the cold chain, especially SMEs. This can be a group of
government staff, government outsourcing, cooperation between government agencies,
finance organisations, or the private sector.
⚫ Require more convenient customs processes, such as e-payments and e-documents for
simplicity and speed of operations.
⚫ Consider building resting spots for truck drivers so they can take a rest. That may help to
reduce the accident rate and human resource cost.
⚫ Intense investigation and control of uncertified standard enterprises and products to
prevent impersonation and falsifications.
Most of the expected policies are recognised and emphasised by the government. This can be
seen in Table 2.25, which refers to seven categories of problems and obstacles.
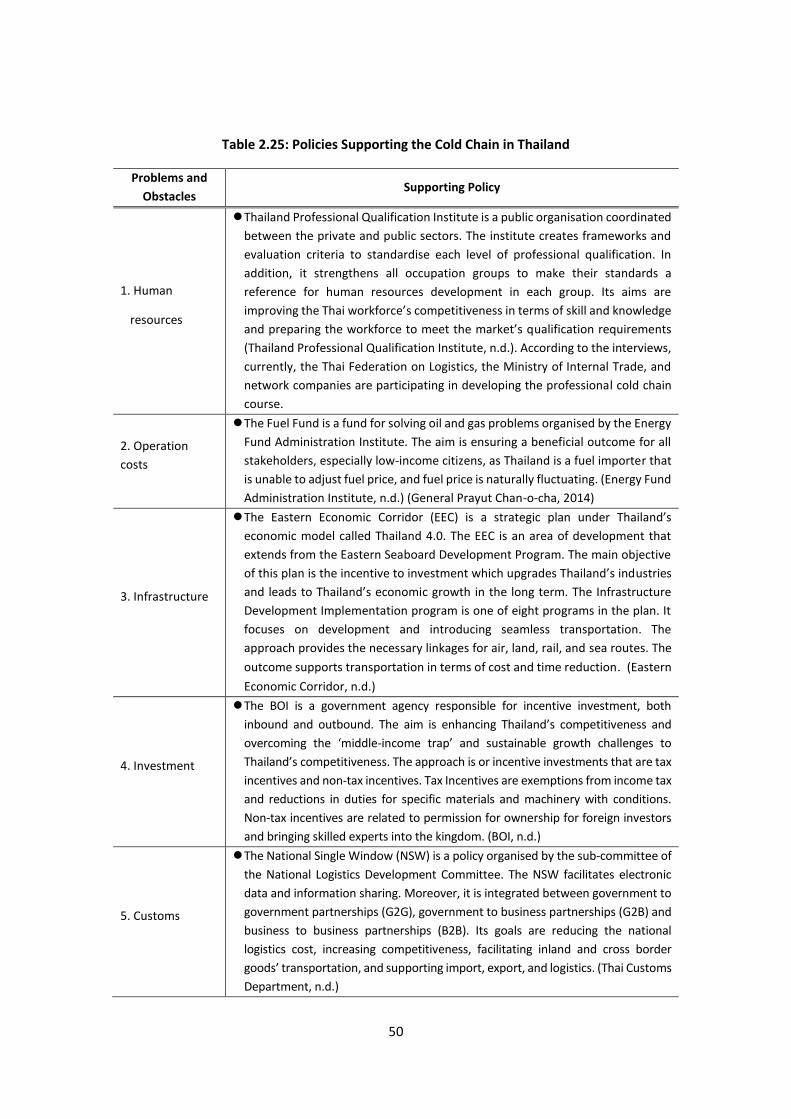
50
Table 2.25: Policies Supporting the Cold Chain in Thailand
Problems and
Obstacles Supporting Policy
1. Human
resources
⚫ Thailand Professional Qualification Institute is a public organisation coordinated
between the private and public sectors. The institute creates frameworks and
evaluation criteria to standardise each level of professional qualification. In
addition, it strengthens all occupation groups to make their standards a
reference for human resources development in each group. Its aims are
improving the Thai workforce’s competitiveness in terms of skill and knowledge
and preparing the workforce to meet the market’s qualification requirements
(Thailand Professional Qualification Institute, n.d.). According to the interviews,
currently, the Thai Federation on Logistics, the Ministry of Internal Trade, and
network companies are participating in developing the professional cold chain
course.
2. Operation
costs
⚫ The Fuel Fund is a fund for solving oil and gas problems organised by the Energy
Fund Administration Institute. The aim is ensuring a beneficial outcome for all
stakeholders, especially low-income citizens, as Thailand is a fuel importer that
is unable to adjust fuel price, and fuel price is naturally fluctuating. (Energy Fund
Administration Institute, n.d.) (General Prayut Chan-o-cha, 2014)
3. Infrastructure
⚫ The Eastern Economic Corridor (EEC) is a strategic plan under Thailand’s
economic model called Thailand 4.0. The EEC is an area of development that
extends from the Eastern Seaboard Development Program. The main objective
of this plan is the incentive to investment which upgrades Thailand’s industries
and leads to Thailand’s economic growth in the long term. The Infrastructure
Development Implementation program is one of eight programs in the plan. It
focuses on development and introducing seamless transportation. The
approach provides the necessary linkages for air, land, rail, and sea routes. The
outcome supports transportation in terms of cost and time reduction. (Eastern
Economic Corridor, n.d.)
4. Investment
⚫ The BOI is a government agency responsible for incentive investment, both
inbound and outbound. The aim is enhancing Thailand’s competitiveness and
overcoming the ‘middle-income trap’ and sustainable growth challenges to
Thailand’s competitiveness. The approach is or incentive investments that are tax
incentives and non-tax incentives. Tax Incentives are exemptions from income tax
and reductions in duties for specific materials and machinery with conditions.
Non-tax incentives are related to permission for ownership for foreign investors
and bringing skilled experts into the kingdom. (BOI, n.d.)
5. Customs
⚫ The National Single Window (NSW) is a policy organised by the sub-committee of
the National Logistics Development Committee. The NSW facilitates electronic
data and information sharing. Moreover, it is integrated between government to
government partnerships (G2G), government to business partnerships (G2B) and
business to business partnerships (B2B). Its goals are reducing the national
logistics cost, increasing competitiveness, facilitating inland and cross border
goods’ transportation, and supporting import, export, and logistics. (Thai Customs
Department, n.d.)

51
Problems and
Obstacles Supporting Policy
⚫ Port Community System development at Laemchabang Port, Bangkok Port, and
Suvarnabhumi International Airport, this project is under the Strategy Plan for
Logistics Development. The objectives of this project are setting the main system
to administrate and manage products and container status traceability,
certification documents and license examination, transaction, products, and
containers moving permission in electronic form. (Phensawang, 2018)
6. Institutional
systems
⚫ The SMEs Promotion Act established the Office of SMEs Promotion (OSMEP) in
2001 as a government agency. The office’s responsibility is coordinating the
working system and leading policy to promote SMEs, focusing on issues such as
the following:
- Improve laws and regulations for SMEs according to the SMEs Promotion
Master Plan and SMEs Promotion Action Plan
- Ensure the achievement of SME operation for both public and private sectors,
domestically and internationally
- Develop knowledge and databases for SMEs as policy recommendations and
promotion
(Office of SMEs Promotion, n.d.a)
7. Logistics
prohibition
⚫ Reliability of the logistics system is part of the approach of Thailand’s logistics
development stated by NESDC. The reliable approach is public relations,
obstacle adjustment to international trade, and risk management, as detailed
as follows:
- Public relations: participating in international logistics seminars for present
significant logistics development and increasing public relations channels,
such as making media projects and the Strategy Plan.
- Obstacle adjustment to international trade: Government to government
trade negotiations, such as cross-border transport agreements, bilateral free
trade negotiations, and trade facilitation agreements.
- Risk management: Plan for handling unusual situations for continuous
operations, such as political, natural disaster, and neighbouring country policy
changes.
(NESDC, 2018a)
Sources: See citations in this table.
This may imply that those policies are unrecognised or inaccessible by stakeholders. Meanwhile,
some supporting policies are planned for further adoption. Apart from the policy regulation and
support, the private sector networking of the entrepreneurs in the businesses can help reduce
problems and obstacles. This can lead to development by giving practical information,
negotiations, and the network’s agreement to policymakers.
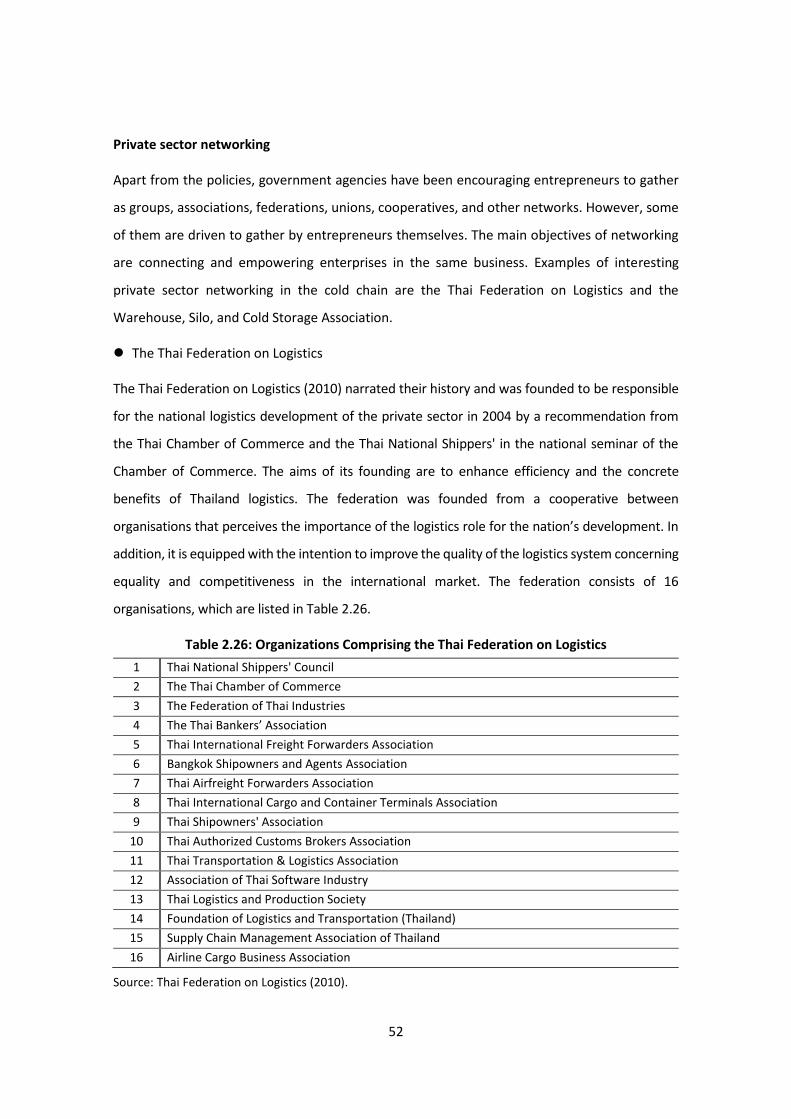
52
Private sector networking
Apart from the policies, government agencies have been encouraging entrepreneurs to gather
as groups, associations, federations, unions, cooperatives, and other networks. However, some
of them are driven to gather by entrepreneurs themselves. The main objectives of networking
are connecting and empowering enterprises in the same business. Examples of interesting
private sector networking in the cold chain are the Thai Federation on Logistics and the
Warehouse, Silo, and Cold Storage Association.
⚫ The Thai Federation on Logistics
The Thai Federation on Logistics (2010) narrated their history and was founded to be responsible
for the national logistics development of the private sector in 2004 by a recommendation from
the Thai Chamber of Commerce and the Thai National Shippers' in the national seminar of the
Chamber of Commerce. The aims of its founding are to enhance efficiency and the concrete
benefits of Thailand logistics. The federation was founded from a cooperative between
organisations that perceives the importance of the logistics role for the nation’s development. In
addition, it is equipped with the intention to improve the quality of the logistics system concerning
equality and competitiveness in the international market. The federation consists of 16
organisations, which are listed in Table 2.26.
Table 2.26: Organizations Comprising the Thai Federation on Logistics
1 Thai National Shippers' Council
2 The Thai Chamber of Commerce
3 The Federation of Thai Industries
4 The Thai Bankers’ Association
5 Thai International Freight Forwarders Association
6 Bangkok Shipowners and Agents Association
7 Thai Airfreight Forwarders Association
8 Thai International Cargo and Container Terminals Association
9 Thai Shipowners' Association
10 Thai Authorized Customs Brokers Association
11 Thai Transportation & Logistics Association
12 Association of Thai Software Industry
13 Thai Logistics and Production Society
14 Foundation of Logistics and Transportation (Thailand)
15 Supply Chain Management Association of Thailand
16 Airline Cargo Business Association
Source: Thai Federation on Logistics (2010).
53
⚫ The Warehouse, Silo, and Cold Storage Association
The Warehouse, Silo and Cold Storage Association is a non-governmental organisation. The
association was founded in 2008 by five leading companies: Chainavee Coldstorage Co., Ltd.,
Nim See Seng Cold Storage Co., Ltd., Passapop 999 Co., Ltd., CTI Co., Ltd., and Tong Hua Buayai
Co., Ltd. The association was approved as a registered association under the Trade Association
Act (1966) with excellent support from the Department of Internal Trade. The main objectives
of the association are promoting, supporting, and developing the warehouse, silo, and cold
storage business. An election is conducted every two years by members to decide the
management committee of the association (Thai Franchise Center, 2014). An interview with the
Director of Promotion and Market Mechanism Development Unit, the Department of Internal
Trade revealed that nowadays, members of the association comprise approximately 50% of
registered enterprises in the warehouse, silo, and cold storage business. Most of the members
are SMEs. The department plans to convince more enterprises to participate in the future,
especially, large enterprises. The department is open to listening to voices from the association
and other entrepreneurs in the business, especially in the process of deciding on the policy that
affects them.
Networking leads to developments. It helps to strengthen bargaining power with superior power
organisations concerning policy and finance, such as governments and clients. The benefits of
networking provide more advantages to small size enterprises than large size ones. This relates
to the study on the Participation in Development by Goulet (1989). Thus, the networking of
enterprises cooperating with supervision support from policymakers will drive efficient
development.
In conclusion, policies play a dominant role in providing support and enforcing regulations to
the cold chain. Moreover, private sector networking strengthens it. Hence, regulation, support,
and private sector networking are essential factors for cold chain development.
2.8. Conclusion
After collecting primary data by interviewing five enterprises, two government agencies, and
one federation, and secondary data by conducting research on useful sources, the result appears
that Thailand has potential in the temperature-controlled food value chain, which is the cold

54
chain. However, there are strengths to be enhanced, a weakness to erase, an opportunity to
reach, and a threat to eliminate.
The strength is the advantage of the country’s location, a growing economy, competitive human
capital, infrastructure, and strong government support. This is implied by a rising GDP and FDI
growth rate, the flow of skilled labour over the AEC, the construction of international
infrastructure networks, and planning for development under the 20-year national strategy
framework and Thailand 4.0 model. These strengths aim to promote Thailand to be a nation of
stability, prosperity, and sustainability, and a developed country according to the Sufficiency-
Economy philosophy, which is propelled by innovations. They encourage Thailand to be a
gateway to massive food demand in the region, a destination of investment, and a kitchen of
the world. The strengths also support the cold chain potential of the country. As evidenced by
the LPI, Thailand is a logistics friendly country, and it has occupied the 2nd rank in ASEAN and
32nd among 160 countries. Also, the value of the total logistics cost was expected to continue to
increase to B2,125 billion in 2017, which means a rise in demand for logistics. Moreover, 338
certificated temperature-controlled truck operators and 632 cold storage operators are serving
demand domestically and internationally.
The rising demand for food products that induces demand for cold chain logistics is an
interesting opportunity. From 2013–2018, the cold chain’s import growth rate was 4.78%, and
the export rate was increasing at 2.44%. In 2018, the import value of cold chain products was
B331,261.48 million, while the export value was B509,779.07 million. The highest value of
imports was for pharmaceutical products, while canned and processed food products, including
fruits, vegetables, and seafood had the highest value of exports. Stakeholders of the chain have
been getting benefits from this opportunity. The stakeholders that are the main players of cold
storage and the main users of cold chain logistics are large-size entrepreneurs, while the main
players of the temperature-controlled trucks are small enterprises, which make subcontracts
with the large players. Thus, more investment in the cold chain provides many opportunities for
players and users, especially the main players, which are the SMEs.
The high cost of logistics is evidently a weakness of the cold chain in Thailand. In 2017, the
logistics cost to nominal GDP was 13.9%, which was higher than Asia’s average (12.7%) and the
international average (10.9%). However, Thailand’s cost has been decreasing over the years.
55
This is because stakeholders are finding ways to reduce it by taking advantage of natural cold
weather at night and dawn and locating near suppliers and consumers.
Examples of threats or obstacles to the cold chain in Thailand mentioned by stakeholders from
the interviews were insufficient and inefficient of skilled human resources, infrastructure,
institutional systems, customs, and investment. The expectations on supporting policy regarding
those obstacles included R&D development for adding value to cold chain products, supporting
small and medium-sized enterprises to participate in the trade fair, and making skilled human
resources. Others included low interest for investment, plans for handling the unexpected
situations, specific agencies to support the cold chain, more convenient customs processes, and
resting spots for truck drivers. In addition, uncertified standard enterprises may cause low-
quality products due to intense investigation and control. Most of the expectations are currently
noted and emphasised by the government. The outstanding regulatory policies are the Q Cold
Chain Standard Project and Warehouse, Silo and Cold Storage Policy, which is a voluntary
regulation.
Examples of supporting policies that affect the cold chain are developing the professional cold
chain course of the Thailand Professional Qualification Institute and infrastructure development
of Eastern Economic Corridor. In addition, incentive investments of the Office of the Board of
Investment, the National Single Window (NSW), the Office of SME Promotion, and Logistics
Development Plan would be favourable, as well as private sector networking to engage the
benefits of activities in the business. However, some policies are unrecognised or inaccessible
by the stakeholders. Meanwhile, some supporting policies are in the plans for further adoption.
Also, the private sector networking of enterprises cooperating with supervision support by the
policymakers and proper regulation will drive efficient development. Outstanding private sector
networks are the Thai Federation on Logistics and the Warehouse, Silo and Cold Storage
Association.
Regarding the study, there are issues and suggestions that may encourage the cold chain's
utilisation and development. They may be useful to policymakers for considering supporting the
stakeholders and consumers:
56
⚫ Educate consumers to realise the nutritional value of varieties of food and how the cold
chain works for them, especially the utilisation of traceability.
⚫ Encourage consumers to classify products among certified standards products and normal
products to prevent confusion between certified and uncertified standards products. For
example, nowadays many consumers are confused about organics vegetables and
hydroponic vegetables.
⚫ Establish a specific organisation to support stakeholders in the cold chain. Due to the
current situation, numerous agencies are taking part in it. Thus, the specific organisation
will be a one-stop service, which would reduce the cost of time and processes of the cold
chain operation. Moreover, it will stimulate the fast growth of development.
⚫ Save costs through resource management and through sharing. Separating resources in
temperature-controlled trucks and cold storage into various temperature zones to handle
more than one type of product at a time could save operation costs. For example, in one
trip, a truck could carry many kinds of products that need a different temperature to control.
In addition, sharing the resources with other companies will make a value backhaul and
prevent from a trailer from being empty, known as “deadhead”.
The cold chain utilization and development provide benefits to the cold chain stakeholders as
financial compensation, primarily to SMEs, especially agriculturists. They are in the upstream
part of the chain and usually struggle with financial problems and seasonal fluctuations. The cold
chain value-adds their products so they can get higher returns, which helps to reduce poverty.
Consumers also get the benefits of cold chain utilisation and development in terms of better life
quality regarding food accessibility, availability, utilisation, and stability for food security. This is
consistent with the objectives of Thailand’s national strategy development, the ASEAN
Integrated Food Security Framework and Strategic Plan of Action – Food Security (SPA–FS) and
Vision and Strategic Plan for ASEAN Cooperation in Food, Agriculture and Fisheries 2016 – 2025
(VSP–FAF).
57
References
Agricultural Technical Cooperation Working Group of APEC (2015), High Level Public–Private
Forum on Cold Chain to Strengthen Agriculture & Food’s Global Value Chain.
Bank of Thailand (2011), ISIC–BOT. Retrieved 1 March 2019, from https://www.bot.or.th/
Thai/Statistics/DataManagementSystem/Standard/StandardCode/Pages/default.aspx#
BOI (The Board of Investment of Thailand) (2017a), Thailand’s Advantages. Retrieved
5 March 2019, from https://www.boi.go.th/index.php?page=thailand_advantages
B O I ( 2 0 1 7 b ) , T h a i l a n d : F o o d I n d u s t r y . R e t r i e v e d 1 M a r c h 2 0 1 9 , f r o m
https://www.boi.go.th/upload/content/Food industry_5aa7b40bd758b.pdf
BOI (n.d.), WHAT WE DO. Retrieved December 12, 2018, from https://www.boi.go.th/
index.php?page=what_we_do2
Department of Business Development, Ministry of Commerce (2019), Transportation and
Storage Business Category. Retrieved from https://www.dbd.go.th/dbdweb_en/
Department of Internal Trade (2019), Warehouse, Silo, and Cold Storage. Retrieved 4 January 2
019, from https://mwsc.dit.go.th/warehouseSiloColdStorage.php?submitQuery=init&a
ction=resetParam
Department of Land Transport (n.d.), Q Mark Certified. Retrieved December 27, 2018,
from https://mwsc.dit.go.th/index.php
Eastern Economic Corridor (n.d.), Infrastructure Overview. Retrieved December 12, 2018, from
https://www.eeco.or.th/en/content/infrastructure-overview
Energy Fund Administration Institute (n.d.), The Energy Fund Administration Institute. Retrieved
12 December 2019, from http://www.efai.or.th/en/home
Food Intelligence Center Thailand (2016), Frozen food market in Thailand. Retrieved
from http://fic.nfi.or.th/MarketOverviewDomesticDetail.php?id=107
General Prayut Chan-o-cha (2014), National Broadcast. Retrieved December 12, 2018,
from http://www.mfa.go.th/main/th/media-center/3756/46599
Goulet, D. (1989), ‘Participation in Development: New Avenues’, World Development,
17(2), pp.165–78.

58
Information and Communication Technology Center with Cooperation of the Customs
Departmen t (2018) , I mport an d Ex port in Tha i la nd . Ret r ieve d f rom
http://www2.ops3.moc.go.th/
International Trade Administration (ITA) (2018), Thailand Country Commercial Guide. Retrieved
from https://www.export.gov/article?id=Thailand-market-overview
Kasetsart University (2016), Industrial Cold Chain Development and Promotion Project. Retrieved fro
m https://pirun.ku.ac.th/~fagiptp/files/ColdChain/1-Introduction-(13.09.2559).pdf
Kitinoja, L. (2013), ‘Use of cold chains for reducing food losses in developing countries’,
Population, 6(1.23), pp.5–60.
Logistics Time Magazine (2019), DLT is developing Q Mark with Q Cold Chain. Retrieved from
http://www.logisticstime.net/archives/14120
Lummus, R.R., D.W. Krumwiede, and R.J. Vokurka (2001), ‘The relationship of logistics to supply
chain management: developing a common industry definition’, Industrial Management
& Data Systems, 101(8), pp.426–31.
Michigan State University (2016), Is Logistics the Same as Supply Chain Management? Retrieve
d 1 February 2019, from https://www.michiganstateuniversityonline.com/resources/s
upply-chain/is-logistics-the-same-as-supply-chain-management/
National Statistical Office (2018), Workforce situation in Thailand (February 2018). Retrieved
from http://www.nso.go.th/
NESDC (2018a), International Logistics Performance Index (LPI) 2018. Retrieved from
https://www.nesdb.go.th/ewt_dl_link.php?nid=7874&filename=logistic
NESDC (2018b), Thailand’s logistics report 2017. Retrieved from https://www.nesdb.go.th/ewt
_dl_link.php?nid=7756
Office of SMEs Promotion (2018), SME White Paper 2018. Retrieved December 28, 2018, from
http://www.sme.go.th/en/download.php?modulekey=94
Office of SMEs Promotion (n.d.a), About OSMEP. Retrieved December 12, 2018, from
https://www.sme.go.th/en/page.php?modulekey=72

59
Office of SMEs Promotion (n.d.b), Definition of SME. Retrieved December 8, 2018, from
http://www.sme.go.th/upload/mod_download/%E0%B8%99%E0%B8%B4%E0%B8%A
2%E0%B8%B2%E0%B8%A1%20SMEs.pdf
Phensawang, P. (2018), Bangkok Port is Developing e-Matching to Connect the Customs System
s. Retrieved December 12, 2018, from http://thai.logistics -manager.com/
2018/02/16/ท่าเรือกรุงเทพ-e-matching/
Thai Customs Department (n.d.), Thailand National Single Window. Retrieved December 12, 20
18, from http://www.thainsw.net/INSW/index.jsp?nswLang=E
Thai Federation on Logistics (2010). Background of Thai Federation on Logistics. Retrieved
December 15, 2018, from http://www.thailog.org/index.php?option=com_k2&view=
item&layout=item&id=1142&Itemid=470
Thai Franchise Center (2014), Warehouse silo and cold storage business association.
Retrieved December 15, 2018, from http://www.thaifranchisecenter.com/links/
show.php?id=1472
Thailand Professional Qualification Institute (n.d.), Establishment of Thailand Professional Quali
fication Institute. Retrieved 20 January 2019, from https://www.tpqi.go.th/
home.php
The Revenue Department (2018). Type of SME. Retrieved December 8, 2018, from
http://www.rd.go.th/publish/38056.0.html
The World Bank (2018), Global Rankings 2018. Retrieved from https://lpi.worldbank.org/
international/global
Thipkaisorn, S. (2010), ‘Key Logistics Development: How Thai Entrepreneurs can gain
a Competitive Edge’, Executive Journal, 30(2): 211 – 218. Retrieved from https://www.
bu.ac.th/knowledgecenter/executive_journal/30_2/pdf/aw35.pdf
Transportation Institute Chulalongkorn University (2015), The project for building capacity of
silo warehouse and cold storage operators to support the opening of the AEC.
Waters, D. (2003), Logistics: An Introduction to Supply Chain Management , Palgrave
Macmillan. Retrieved from http://library.aceondo.net/ebooks/Business_Management/l
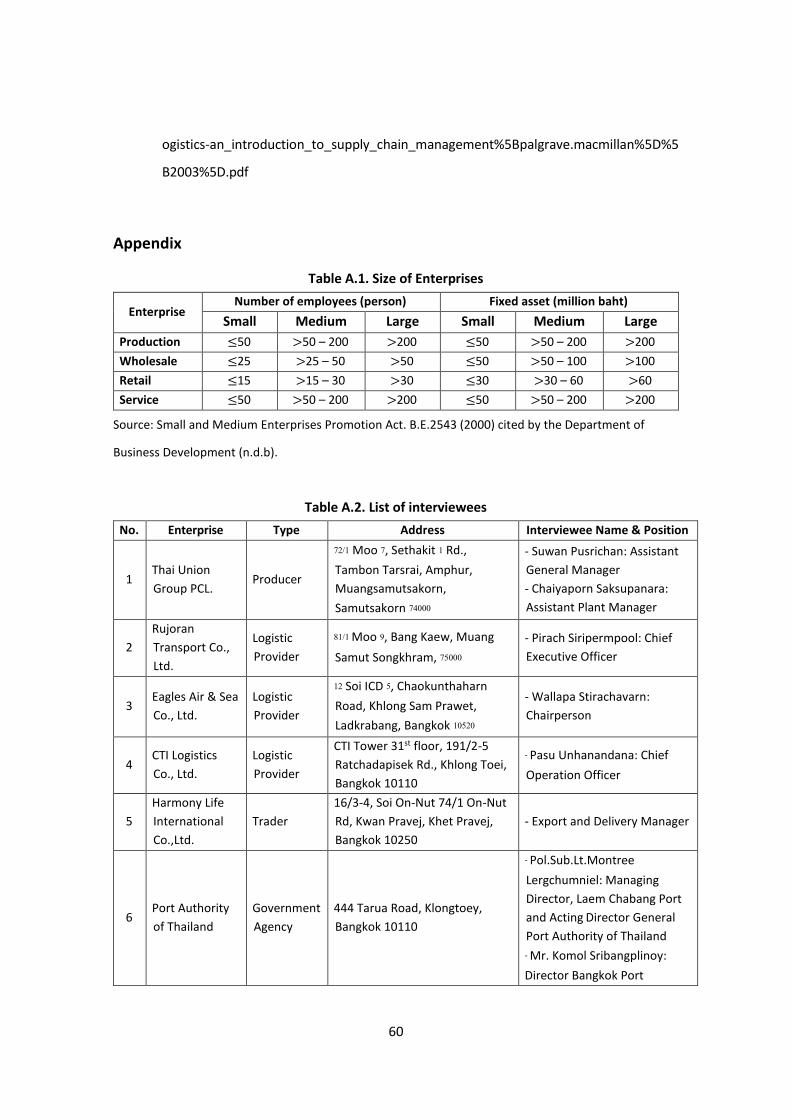
60
ogistics-an_introduction_to_supply_chain_management%5Bpalgrave.macmillan%5D%5
B2003%5D.pdf
Appendix
Table A.1. Size of Enterprises
Enterprise Number of employees (person) Fixed asset (million baht)
Small Medium Large Small Medium Large
Production ≤50 >50 – 200 >200 ≤50 >50 – 200 >200
Wholesale ≤25 >25 – 50 >50 ≤50 >50 – 100 >100
Retail ≤15 >15 – 30 >30 ≤30 >30 – 60 >60
Service ≤50 >50 – 200 >200 ≤50 >50 – 200 >200
Source: Small and Medium Enterprises Promotion Act. B.E.2543 (2000) cited by the Department of
Business Development (n.d.b).
Table A.2. List of interviewees
No. Enterprise Type Address Interviewee Name & Position
1 Thai Union
Group PCL. Producer
72/1 Moo 7, Sethakit 1 Rd.,
Tambon Tarsrai, Amphur,
Muangsamutsakorn,
Samutsakorn 74000
- Suwan Pusrichan: Assistant
General Manager
- Chaiyaporn Saksupanara:
Assistant Plant Manager
2
Rujoran
Transport Co.,
Ltd.
Logistic
Provider
81/1 Moo 9, Bang Kaew, Muang
Samut Songkhram, 75000
- Pirach Siripermpool: Chief
Executive Officer
3 Eagles Air & Sea
Co., Ltd.
Logistic
Provider
12 Soi ICD 5, Chaokunthaharn
Road, Khlong Sam Prawet,
Ladkrabang, Bangkok 10520
- Wallapa Stirachavarn:
Chairperson
4 CTI Logistics
Co., Ltd.
Logistic
Provider
CTI Tower 31st floor, 191/2-5
Ratchadapisek Rd., Khlong Toei,
Bangkok 10110
- Pasu Unhanandana: Chief
Operation Officer
5
Harmony Life
International
Co.,Ltd.
Trader
16/3-4, Soi On-Nut 74/1 On-Nut
Rd, Kwan Pravej, Khet Pravej,
Bangkok 10250
- Export and Delivery Manager
6 Port Authority
of Thailand
Government
Agency
444 Tarua Road, Klongtoey,
Bangkok 10110
- Pol.Sub.Lt.Montree
Lergchumniel: Managing
Director, Laem Chabang Port
and Acting Director General
Port Authority of Thailand
- Mr. Komol Sribangplinoy:
Director Bangkok Port

61
- A representative of Chiang
Saen Port
7 Department of
Internal Trade
Government
Agency
563 Nonthaburi Rd. Bang Krasor,
Muaeng Nonthaburi 11000
- Somchai Rattanasupa
Director of Promotion and
Market Mechanism
Development Unit, Ministry of
Internal Trade
8 Thai Federation
on Logistics Federation
99/126 Moo 16, Bang Kaeo,
Bang Phi, Samut Prakan, 10540. - Wallapa Stirachavarn:
President
Source: Authors.

62
Chapter 3
Overview of the Cold Chain for Agriculture in Viet Nam
Dang Kim Khoi10, Pham Thi Kim Dung10, Dang Kim Son10, Do Huy Thiep10, Pham Duc Thinh10
3.1. Introduction
This research aims to provide an overview of the key agricultural cold chains in Viet Nam by
identifying the main related stakeholders in Viet Nam’s cold storage and transportation system
and their capacity, analysing the associated issues/problem related to the development of Viet
Nam’s cold chain, reviewing the relevant policies and regulations to Viet Nam’s cold chain
development, and discussing the mid-term prospects of the cold chain in Viet Nam. Fruit and
vegetables, livestock, fishery, and processed foods are the main agricultural products considered
in this research.
The research methodologies include desk study, in-depth interviews, and expert consultations.
Desk study provides basic information and data on the demand drivers of cold services, including
agricultural trade, the development of modern retail and the food sector, and changes in dietary
habits from fresh foods to chilled/frozen foods for Viet Nam’s consumers. This methodology was
also used to collect fundamental information on the main stakeholders and their characteristics.
Meanwhile, in-depth interviews with some main stakeholders in cold storage and transportation
services help to map out the main cold chain flows and figure out key issues to foster cold
services in the nation. Currently, a national database related to household food consumption
and production is collected by the General Statistic Office via two main surveys: the Viet Nam
Household Living Standard Survey every two years (VHLSS) and an annual enterprise survey.
Nevertheless, both datasets have no specific information on chilled/frozen food products and
there is also no official information or dataset to estimate cold storage and transportation
capacities in Viet Nam. Therefore, in-depth interviews with various stakeholders and expert
10 Institute of Agricultural Market and Institution (AMI), Viet Nam National University of Agriculture.

63
consultations with senior managers from different companies and organisations are used to
estimate these numbers.
The results indicate that the cold chain in Viet Nam is in the early stage of development and has
a great potential for new investment. Specifically, the seafood sector seemingly outpaces other
sectors in terms of capacity, integrity, and continuity regarding cold-chain utilisation. In addition,
the emergence of domestic modern retail, fast-food services, and high-value food consumption
has created new demand for cold services in Viet Nam and is regarded as a key factor to
accelerate Viet Nam’s cold chain development in the medium term and long term. However,
Viet Nam so far has not established specific policies and regulations for the cold chain sector. In
most cases, provisions for cold services are derived from food safety, post-harvest, and logistics
policies as well as TCVN. 11 This situation would open various opportunities for related
stakeholders to implement policy advocacy activities to set up a comprehensive policy
framework for Viet Nam’s cold chain.
3.2. The current situation of the cold chain in Viet Nam
The development of the cold chain in Viet Nam, including cold storage and cold transportation,
can be seen from both the supply and demand sides.
Demand drivers of cold chain development in Viet Nam
⚫ Viet Nam’s agricultural trade growth
Over the last two decades, Viet Nam’s agricultural trade growth has experienced a fast pace,
with a compound average growth rate (CAGR) of export value from 2001–2017 of 12.5%/year
and that of import value in the same period of 13.6%/year. Wooden furniture, shrimp, cashew
nuts, fruits and vegetables, coffee, rice, rubber, and pangasius are the top agricultural exported
products, for which fruit and vegetables enjoyed the most significant increases from under
US$500 million in 2010 to US$3.5 billion in 2017. Meanwhile, livestock and its related products,
11 TCVN (or Tieu Chuan Viet Nam) means Standards of Viet Nam.
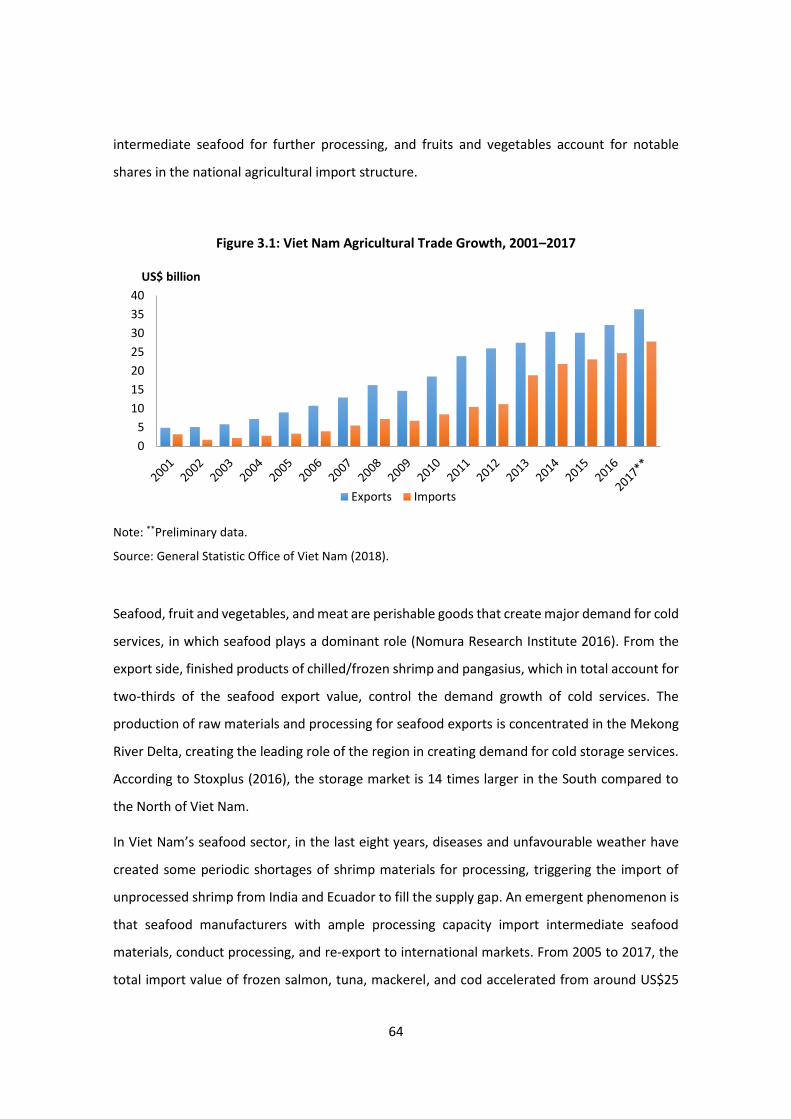
64
intermediate seafood for further processing, and fruits and vegetables account for notable
shares in the national agricultural import structure.
Figure 3.1: Viet Nam Agricultural Trade Growth, 2001–2017
Note: **Preliminary data.
Source: General Statistic Office of Viet Nam (2018).
Seafood, fruit and vegetables, and meat are perishable goods that create major demand for cold
services, in which seafood plays a dominant role (Nomura Research Institute 2016). From the
export side, finished products of chilled/frozen shrimp and pangasius, which in total account for
two-thirds of the seafood export value, control the demand growth of cold services. The
production of raw materials and processing for seafood exports is concentrated in the Mekong
River Delta, creating the leading role of the region in creating demand for cold storage services.
According to Stoxplus (2016), the storage market is 14 times larger in the South compared to
the North of Viet Nam.
In Viet Nam’s seafood sector, in the last eight years, diseases and unfavourable weather have
created some periodic shortages of shrimp materials for processing, triggering the import of
unprocessed shrimp from India and Ecuador to fill the supply gap. An emergent phenomenon is
that seafood manufacturers with ample processing capacity import intermediate seafood
materials, conduct processing, and re-export to international markets. From 2005 to 2017, the
total import value of frozen salmon, tuna, mackerel, and cod accelerated from around US$25
0
5
10
15
20
25
30
35
40
US$ billion
Exports Imports
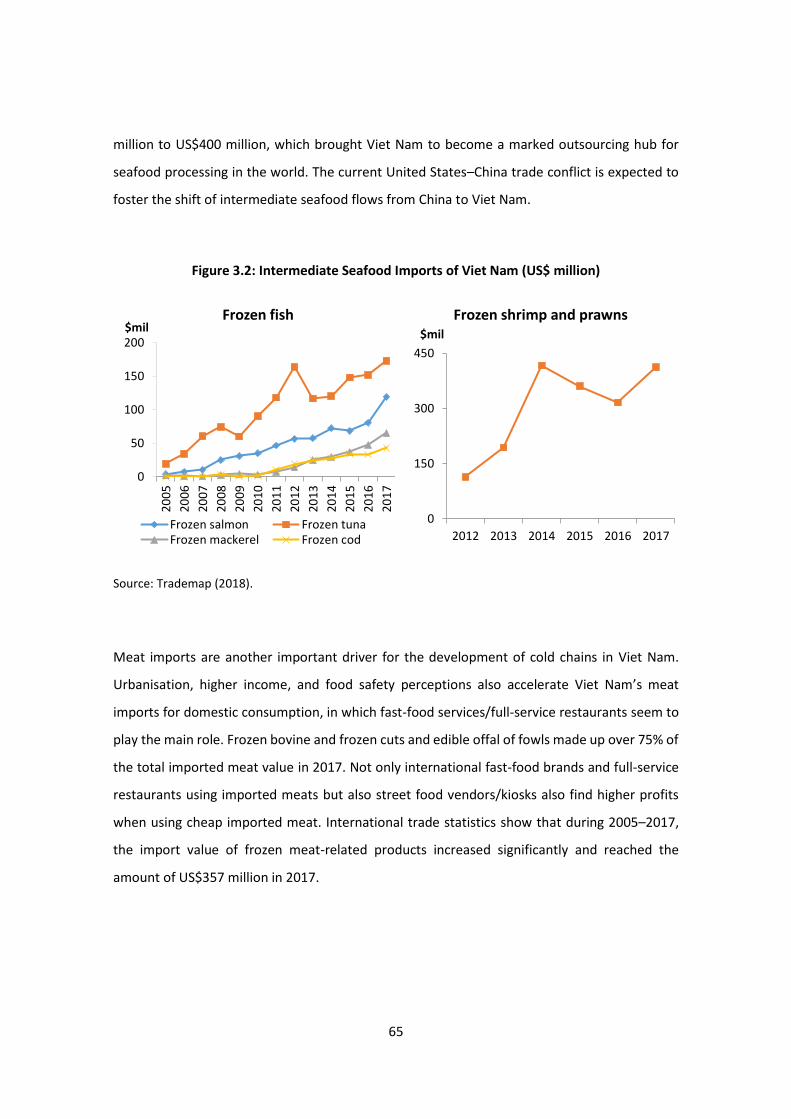
65
million to US$400 million, which brought Viet Nam to become a marked outsourcing hub for
seafood processing in the world. The current United States–China trade conflict is expected to
foster the shift of intermediate seafood flows from China to Viet Nam.
Figure 3.2: Intermediate Seafood Imports of Viet Nam (US$ million)
Source: Trademap (2018).
Meat imports are another important driver for the development of cold chains in Viet Nam.
Urbanisation, higher income, and food safety perceptions also accelerate Viet Nam’s meat
imports for domestic consumption, in which fast-food services/full-service restaurants seem to
play the main role. Frozen bovine and frozen cuts and edible offal of fowls made up over 75% of
the total imported meat value in 2017. Not only international fast-food brands and full-service
restaurants using imported meats but also street food vendors/kiosks also find higher profits
when using cheap imported meat. International trade statistics show that during 2005–2017,
the import value of frozen meat-related products increased significantly and reached the
amount of US$357 million in 2017.
0
50
100
150
200
20
05
20
06
20
07
20
08
20
09
20
10
20
11
20
12
20
13
20
14
20
15
20
16
20
17
$milFrozen fish
Frozen salmon Frozen tunaFrozen mackerel Frozen cod
0
150
300
450
2012 2013 2014 2015 2016 2017
$mil
Frozen shrimp and prawns
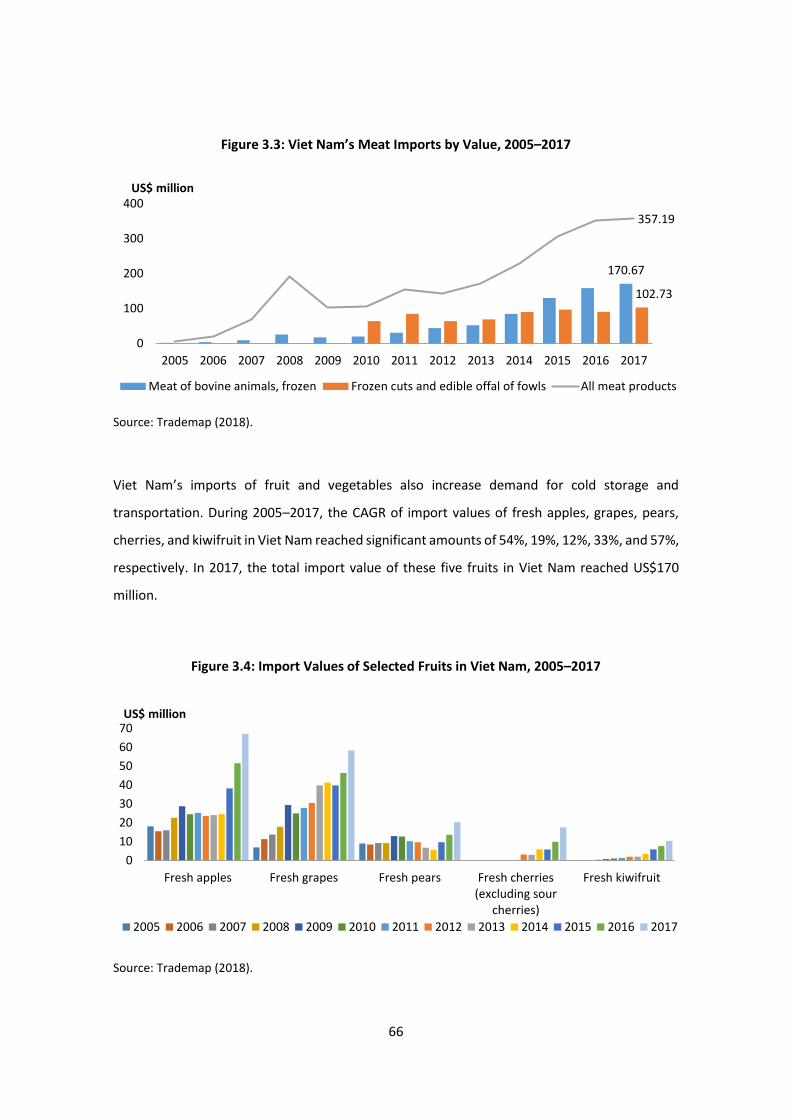
66
Figure 3.3: Viet Nam’s Meat Imports by Value, 2005–2017
Source: Trademap (2018).
Viet Nam’s imports of fruit and vegetables also increase demand for cold storage and
transportation. During 2005–2017, the CAGR of import values of fresh apples, grapes, pears,
cherries, and kiwifruit in Viet Nam reached significant amounts of 54%, 19%, 12%, 33%, and 57%,
respectively. In 2017, the total import value of these five fruits in Viet Nam reached US$170
million.
Figure 3.4: Import Values of Selected Fruits in Viet Nam, 2005–2017
Source: Trademap (2018).
170.67
102.73
357.19
0
100
200
300
400
2005 2006 2007 2008 2009 2010 2011 2012 2013 2014 2015 2016 2017
US$ million
Meat of bovine animals, frozen Frozen cuts and edible offal of fowls All meat products
0
10
20
30
40
50
60
70
Fresh apples Fresh grapes Fresh pears Fresh cherries(excluding sour
cherries)
Fresh kiwifruit
US$ million
2005 2006 2007 2008 2009 2010 2011 2012 2013 2014 2015 2016 2017
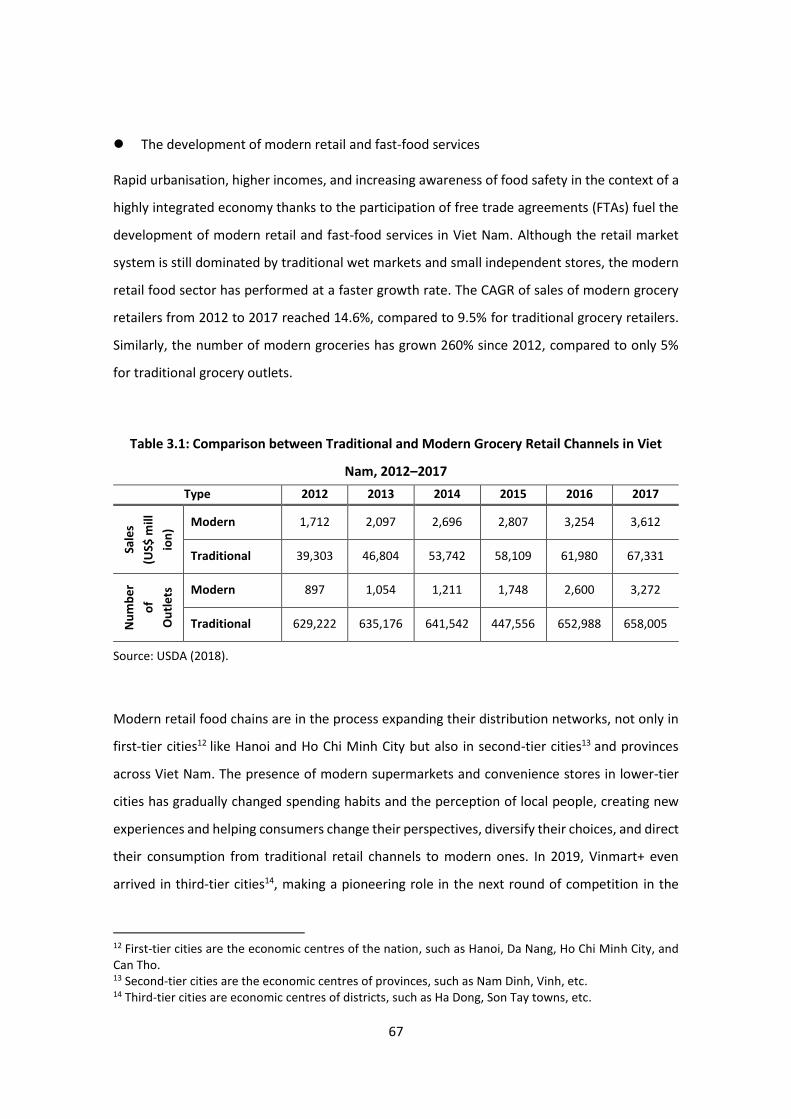
67
⚫ The development of modern retail and fast-food services
Rapid urbanisation, higher incomes, and increasing awareness of food safety in the context of a
highly integrated economy thanks to the participation of free trade agreements (FTAs) fuel the
development of modern retail and fast-food services in Viet Nam. Although the retail market
system is still dominated by traditional wet markets and small independent stores, the modern
retail food sector has performed at a faster growth rate. The CAGR of sales of modern grocery
retailers from 2012 to 2017 reached 14.6%, compared to 9.5% for traditional grocery retailers.
Similarly, the number of modern groceries has grown 260% since 2012, compared to only 5%
for traditional grocery outlets.
Table 3.1: Comparison between Traditional and Modern Grocery Retail Channels in Viet
Nam, 2012–2017
Type 2012 2013 2014 2015 2016 2017
Sale
s
(US$
mill
ion
)
Modern 1,712 2,097 2,696 2,807 3,254 3,612
Traditional 39,303 46,804 53,742 58,109 61,980 67,331
Nu
mb
er
of
Ou
tle
ts
Modern 897 1,054 1,211 1,748 2,600 3,272
Traditional 629,222 635,176 641,542 447,556 652,988 658,005
Source: USDA (2018).
Modern retail food chains are in the process expanding their distribution networks, not only in
first-tier cities12 like Hanoi and Ho Chi Minh City but also in second-tier cities13 and provinces
across Viet Nam. The presence of modern supermarkets and convenience stores in lower-tier
cities has gradually changed spending habits and the perception of local people, creating new
experiences and helping consumers change their perspectives, diversify their choices, and direct
their consumption from traditional retail channels to modern ones. In 2019, Vinmart+ even
arrived in third-tier cities14, making a pioneering role in the next round of competition in the
12 First-tier cities are the economic centres of the nation, such as Hanoi, Da Nang, Ho Chi Minh City, and Can Tho. 13 Second-tier cities are the economic centres of provinces, such as Nam Dinh, Vinh, etc. 14 Third-tier cities are economic centres of districts, such as Ha Dong, Son Tay towns, etc.
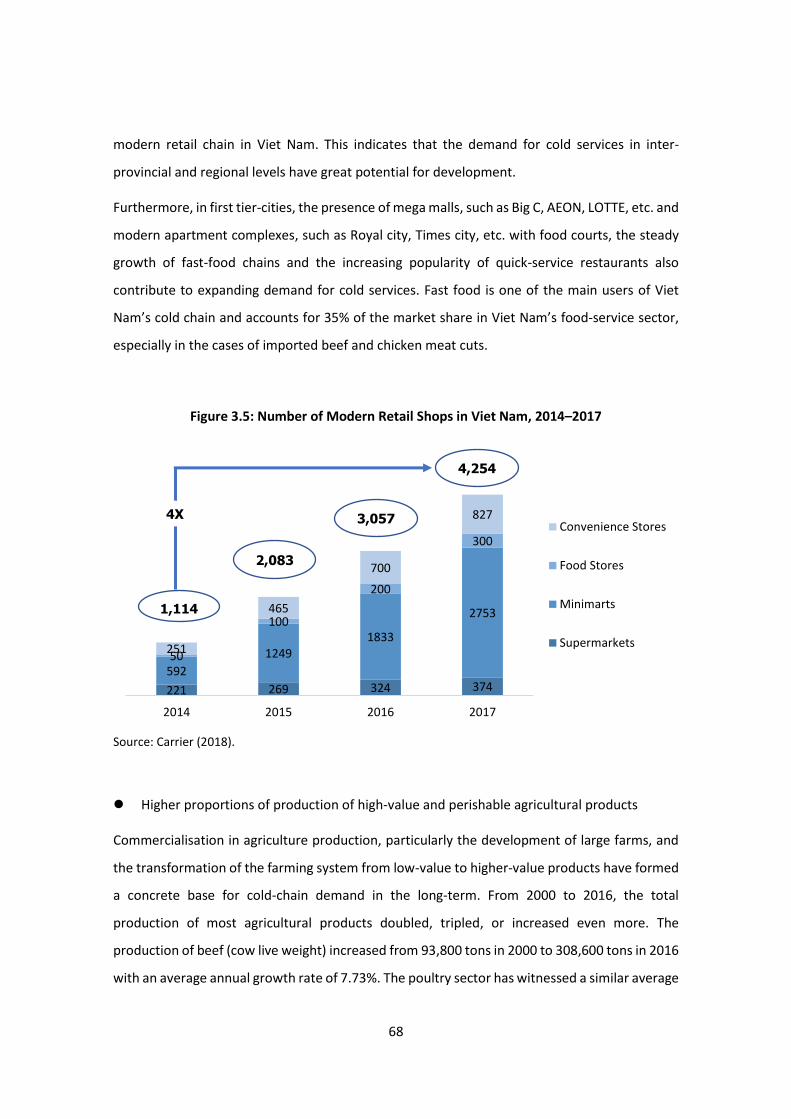
68
modern retail chain in Viet Nam. This indicates that the demand for cold services in inter-
provincial and regional levels have great potential for development.
Furthermore, in first tier-cities, the presence of mega malls, such as Big C, AEON, LOTTE, etc. and
modern apartment complexes, such as Royal city, Times city, etc. with food courts, the steady
growth of fast-food chains and the increasing popularity of quick-service restaurants also
contribute to expanding demand for cold services. Fast food is one of the main users of Viet
Nam’s cold chain and accounts for 35% of the market share in Viet Nam’s food-service sector,
especially in the cases of imported beef and chicken meat cuts.
Figure 3.5: Number of Modern Retail Shops in Viet Nam, 2014–2017
Source: Carrier (2018).
⚫ Higher proportions of production of high-value and perishable agricultural products
Commercialisation in agriculture production, particularly the development of large farms, and
the transformation of the farming system from low-value to higher-value products have formed
a concrete base for cold-chain demand in the long-term. From 2000 to 2016, the total
production of most agricultural products doubled, tripled, or increased even more. The
production of beef (cow live weight) increased from 93,800 tons in 2000 to 308,600 tons in 2016
with an average annual growth rate of 7.73%. The poultry sector has witnessed a similar average
221 269 324 374592
12491833
2753
50
100
200
300
251
465
700
827
2014 2015 2016 2017
Convenience Stores
Food Stores
Minimarts
Supermarkets
1,114
2,083
3,057
4,254
4X
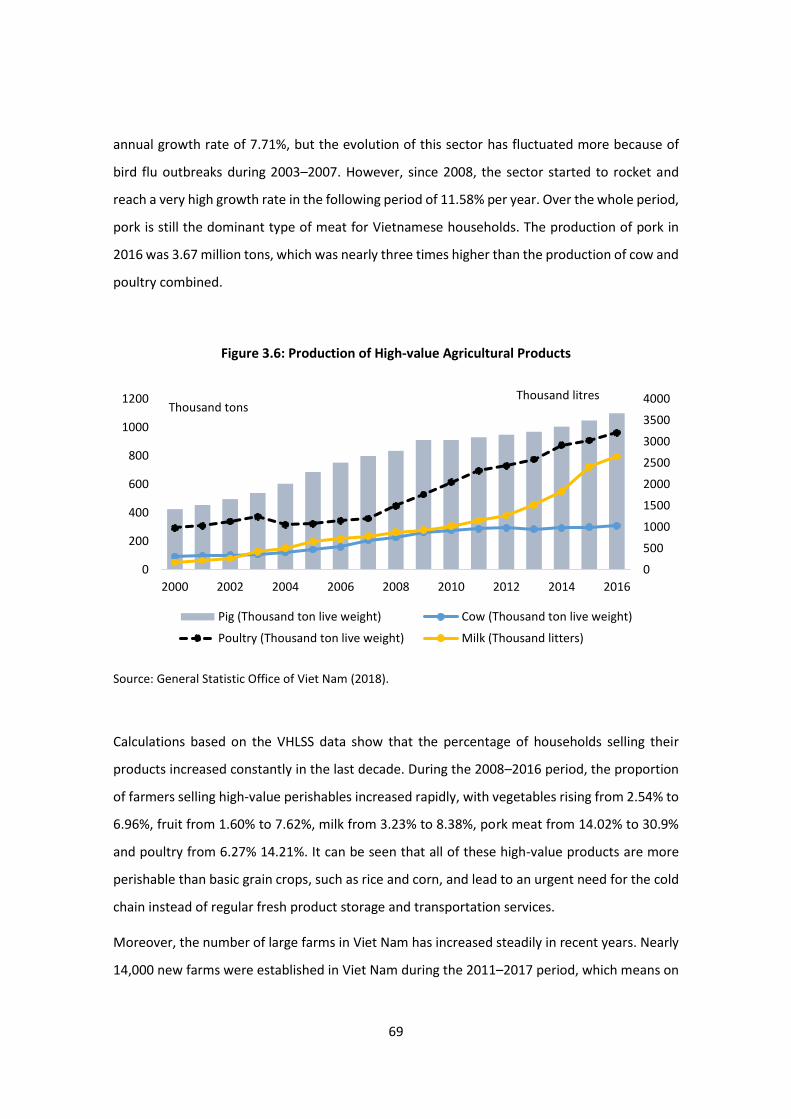
69
annual growth rate of 7.71%, but the evolution of this sector has fluctuated more because of
bird flu outbreaks during 2003–2007. However, since 2008, the sector started to rocket and
reach a very high growth rate in the following period of 11.58% per year. Over the whole period,
pork is still the dominant type of meat for Vietnamese households. The production of pork in
2016 was 3.67 million tons, which was nearly three times higher than the production of cow and
poultry combined.
Figure 3.6: Production of High-value Agricultural Products
Source: General Statistic Office of Viet Nam (2018).
Calculations based on the VHLSS data show that the percentage of households selling their
products increased constantly in the last decade. During the 2008–2016 period, the proportion
of farmers selling high-value perishables increased rapidly, with vegetables rising from 2.54% to
6.96%, fruit from 1.60% to 7.62%, milk from 3.23% to 8.38%, pork meat from 14.02% to 30.9%
and poultry from 6.27% 14.21%. It can be seen that all of these high-value products are more
perishable than basic grain crops, such as rice and corn, and lead to an urgent need for the cold
chain instead of regular fresh product storage and transportation services.
Moreover, the number of large farms in Viet Nam has increased steadily in recent years. Nearly
14,000 new farms were established in Viet Nam during the 2011–2017 period, which means on
0
500
1000
1500
2000
2500
3000
3500
4000
0
200
400
600
800
1000
1200
2000 2002 2004 2006 2008 2010 2012 2014 2016
Pig (Thousand ton live weight) Cow (Thousand ton live weight)
Poultry (Thousand ton live weight) Milk (Thousand litters)
Thousand tonsThousand litres
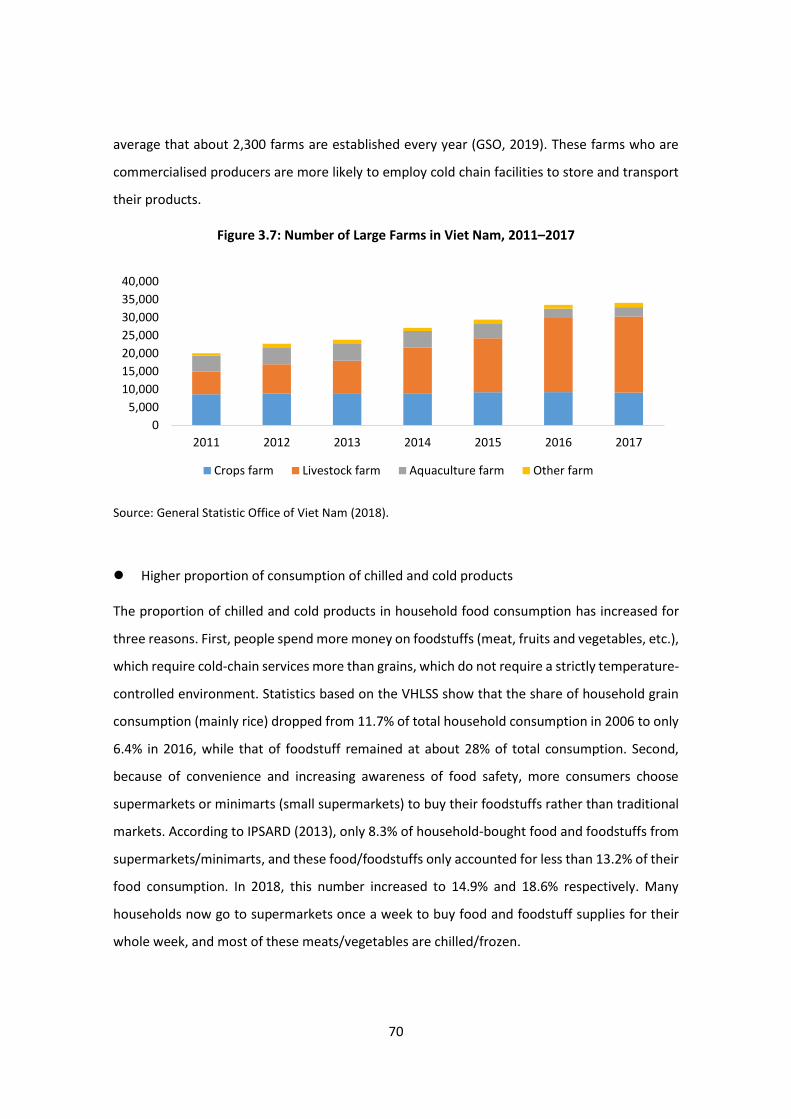
70
average that about 2,300 farms are established every year (GSO, 2019). These farms who are
commercialised producers are more likely to employ cold chain facilities to store and transport
their products.
Figure 3.7: Number of Large Farms in Viet Nam, 2011–2017
Source: General Statistic Office of Viet Nam (2018).
⚫ Higher proportion of consumption of chilled and cold products
The proportion of chilled and cold products in household food consumption has increased for
three reasons. First, people spend more money on foodstuffs (meat, fruits and vegetables, etc.),
which require cold-chain services more than grains, which do not require a strictly temperature-
controlled environment. Statistics based on the VHLSS show that the share of household grain
consumption (mainly rice) dropped from 11.7% of total household consumption in 2006 to only
6.4% in 2016, while that of foodstuff remained at about 28% of total consumption. Second,
because of convenience and increasing awareness of food safety, more consumers choose
supermarkets or minimarts (small supermarkets) to buy their foodstuffs rather than traditional
markets. According to IPSARD (2013), only 8.3% of household-bought food and foodstuffs from
supermarkets/minimarts, and these food/foodstuffs only accounted for less than 13.2% of their
food consumption. In 2018, this number increased to 14.9% and 18.6% respectively. Many
households now go to supermarkets once a week to buy food and foodstuff supplies for their
whole week, and most of these meats/vegetables are chilled/frozen.
0
5,000
10,000
15,000
20,000
25,000
30,000
35,000
40,000
2011 2012 2013 2014 2015 2016 2017
Crops farm Livestock farm Aquaculture farm Other farm

71
Thirdly, our value chain analysis and expert consultancy information show that most
chilled/frozen foodstuffs are consumed in restaurants and public kitchens/canteens rather than
in individual households. Currently, different types of chilled/frozen products are used in
restaurants. On the one hand, high-quality imported chilled/frozen meat/vegetables (e.g., beef
from Australia, United States, Japan; salmon from Norway) go to elegant restaurants, fine dining,
fast-food restaurants, and casual restaurants. On the other hand, cheap imported frozen meats
(especially chicken from the United States, Brazil, and Korea and buffalo from India) are used by
Com Binh Dan restaurants, Noodle/Pho Restaurants, school kitchens, and office/factory
canteens. Based on the author’s calculations using the VHLSS, the proportion of out-of-home
food consumption in total income has nearly doubled in the last 10 years from 7.1% in 2006 to
12.1% in 2016.
Supply drivers and the main cold chain channels in Viet Nam
The supply side of the cold chain for agriculture in Viet Nam consists of three main channels: (i)
imports of finished food products for consumption, (ii) seafood products, and (iii) chilled fruits
and vegetables in the domestic market. Each channel is characterised by its integrity, continuity,
and affordability. Integrity refers to the fact that the whole channel is undivided and managed
by a few stakeholders; thus, the fewer stakeholders in a chain, the higher the integrity of the
chain is. Continuity describes the unbroken and consistent operation of cold services along a
chain; so, the less interrupted chain shows the higher continuity. Affordability indicates the
relative costs among chains, including fixed investments of cold service suppliers as well as price
offered to achieve the client’s acceptance.
⚫ The channel of imports of finished products for direct consumption
Finished products for direct consumption contain imported fruits and vegetables, and meat,
seafood, and dairy products for either direct consumption or food services. The flow is
characterised by high continuity, medium integrity, and low affordability aimed at high-quality,
high-value food segments, mainly coordinated by distributors/retailers. Currently, the flow scale
is small but still highly promising for further expansion thanks to the increasing demand for
imported foods.

72
The flow starts from international material sources and penetrates to Viet Nam when
refrigerated containers approach ports and arrive at warehouses/distribution centres by land
transportation on trailer trucks. Containers are unloaded under temperature-controlled
procedures in warehouses/distribution centres. Products are preserved and organised in
cold/chilled facilities before being delivered to retail stores/food service suppliers via small
temperature-controlled vans, usually under 2 tons in weight, which is easy to travel in crowded
urban areas. From retailer stores, chilled/frozen foods are purchased and self-carried home by
customers or delivered to homes in simple insulation boxes.
This channel shows clearly the high continuity in most stages, and foods are maintained in a
strictly temperature-controlled and uninterrupted process. Meanwhile, its integrity is ranked as
medium because a stakeholder could only provide services for up to two or three steps with a
certain level of outsourcing along the flow. To maintain food quality in the channel, cold chain
providers must equip high-tech facilities, professional services, and modern management
systems. Therefore, both their fixed and variable costs are usually higher than average in Viet
Nam, leading to high prices offered to customers. In other words, the affordability of the flow is
low and only high-quality, high-value food importers/providers could cover the cost.

73
Figure 3.8: The Flow of Imported Products for Direct Consumption
Note: *Steps where no refrigeration is generally applied.
Source: Authors.
This channel is likely driven by distributors/retailers than cold service providers because
the modern retail market is relatively small but highly concentrated. This means that
professional cold chain services have to rely on a few big clients to cover their high costs.
Moreover, most domestic value chains of agricultural and food products in Viet Nam are
long and significantly diverse, building up various constraints to both local and
international manufacturers to establish their own, direct sales channels. At the same
time, higher income and lower tariffs led by different FTAs are favourable conditions for
Viet Nam to import more foods in the future. As a result, distributors/retailers hold long-
term advantages to create new demand and expand scale for the flow.
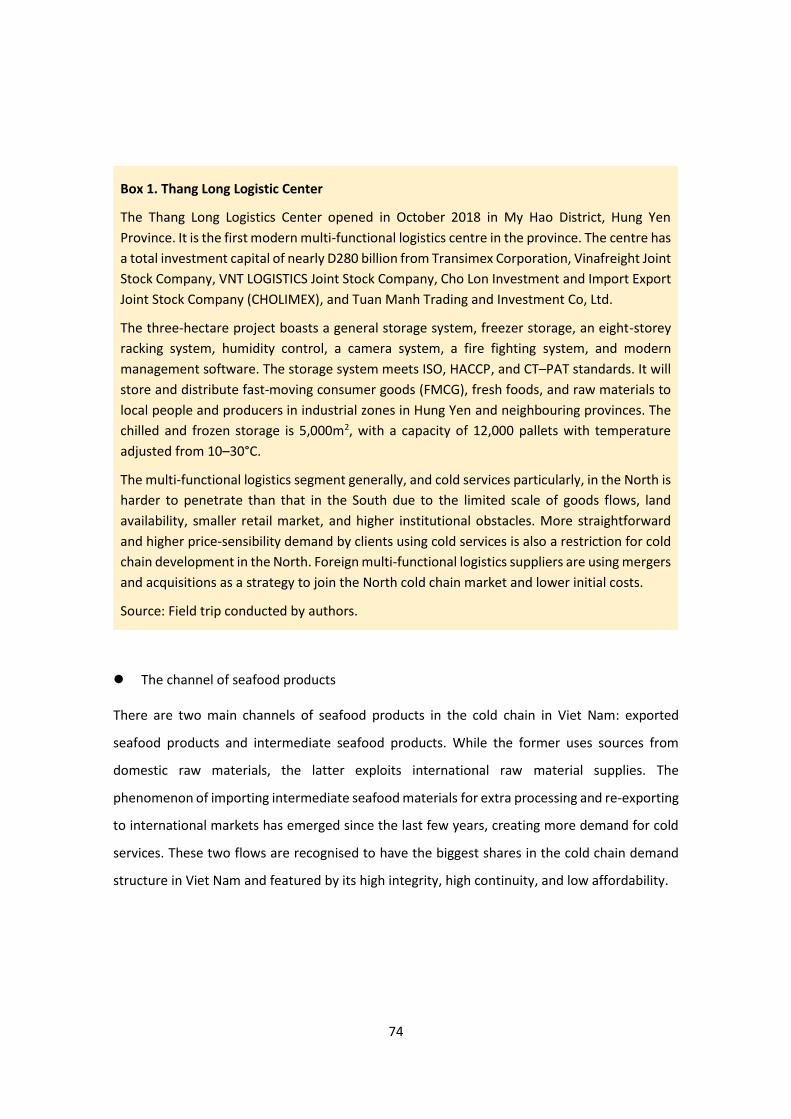
74
Box 1. Thang Long Logistic Center
The Thang Long Logistics Center opened in October 2018 in My Hao District, Hung Yen
Province. It is the first modern multi-functional logistics centre in the province. The centre has
a total investment capital of nearly D280 billion from Transimex Corporation, Vinafreight Joint
Stock Company, VNT LOGISTICS Joint Stock Company, Cho Lon Investment and Import Export
Joint Stock Company (CHOLIMEX), and Tuan Manh Trading and Investment Co, Ltd.
The three-hectare project boasts a general storage system, freezer storage, an eight-storey
racking system, humidity control, a camera system, a fire fighting system, and modern
management software. The storage system meets ISO, HACCP, and CT–PAT standards. It will
store and distribute fast-moving consumer goods (FMCG), fresh foods, and raw materials to
local people and producers in industrial zones in Hung Yen and neighbouring provinces. The
chilled and frozen storage is 5,000m2, with a capacity of 12,000 pallets with temperature
adjusted from 10–30°C.
The multi-functional logistics segment generally, and cold services particularly, in the North is
harder to penetrate than that in the South due to the limited scale of goods flows, land
availability, smaller retail market, and higher institutional obstacles. More straightforward
and higher price-sensibility demand by clients using cold services is also a restriction for cold
chain development in the North. Foreign multi-functional logistics suppliers are using mergers
and acquisitions as a strategy to join the North cold chain market and lower initial costs.
Source: Field trip conducted by authors.
⚫ The channel of seafood products
There are two main channels of seafood products in the cold chain in Viet Nam: exported
seafood products and intermediate seafood products. While the former uses sources from
domestic raw materials, the latter exploits international raw material supplies. The
phenomenon of importing intermediate seafood materials for extra processing and re-exporting
to international markets has emerged since the last few years, creating more demand for cold
services. These two flows are recognised to have the biggest shares in the cold chain demand
structure in Viet Nam and featured by its high integrity, high continuity, and low affordability.
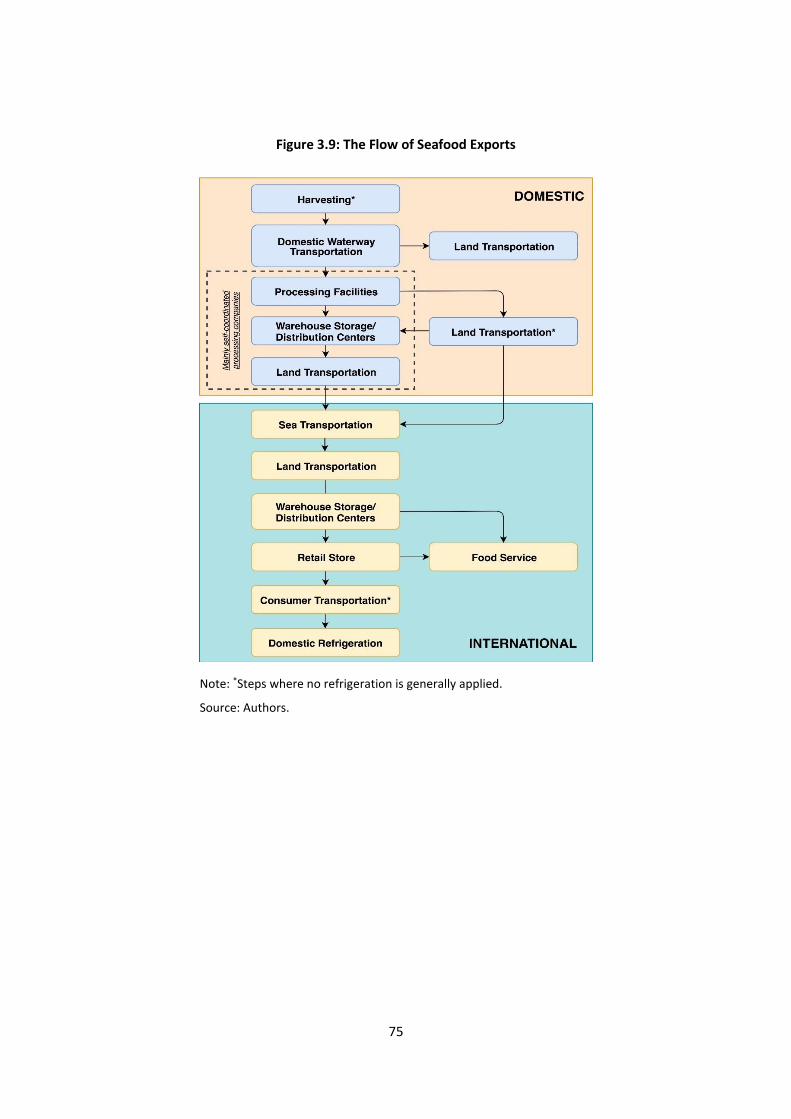
75
Figure 3.9: The Flow of Seafood Exports
Note: *Steps where no refrigeration is generally applied.
Source: Authors.

76
The seafood export flow starts from the local harvesting and transporting of raw materials,
mainly by domestic waterways either with or without temperature control, to processing
facilities mostly equipped with freezer and cold storage. The finished products are land-
transported to either warehouses/distribution centres or seaports to export. Meanwhile, the
intermediate seafood flow has a similar route but begin with international fishing/harvesting
and raw materials freezing before shipping by sea to Viet Nam for further processing. Right after
entering the processing facilities, the raw materials are stored in constant temperature-
supervised procedures to ensure their quality from the factory gates to the export markets.
Figure 3.10: The Flow of Intermediate Seafood Products
Note: *Steps where no refrigeration is generally applied.
Source: Authors.
77
These two channels demonstrate both high integrity and high continuity when cold services are
exploited uninterruptedly along the chains, from the very early stage of raw materials in the
case of intermediate seafood materials and run largely by seafood manufacturers. Cold storages
are an integral part of seafood manufacturing, but in many cases, seafood processors face
periodic capacity shortages when their businesses grow up. They could make investment
decisions in either constructing upgraded self-operating cold storages or outsourcing cold
services from professional providers. These flows are considered affordable because they have
been utilising their own cold storage and services for a long time. Thereby, the fixed costs have
depreciated significantly and the variable costs have been managed tightly. Thanks to the low
operating cost of these flows, Viet Nam’s seafood exporters can offer competitive prices in its
international markets.
⚫ The channel of chilled fruits and vegetables in the domestic market
This flow is hugely disrupted, and semi-professional cold services are significantly costly. Chilled
fruits and vegetables in the domestic market are used mostly in modern retailers, including
modern grocery stores, super/hypermarkets, and convenience stores. In other words, retailers
dominate the chain and set rules for other stakeholders.
From raw materials to land transportation and assigned preparation facilities, fruits and
vegetables are loosely temperature-tracked and preparation facilities have been installed with
elementary temperature-controlled devices, mainly air-conditioners in closed rooms to
maintain the quality of fruit and vegetable products on hot days. This situation demonstrates
low integrity and continuity of the chain as it has recruited various stakeholders with different
procedures and products that experience unstable temperature conditions along the chain.
However, the flow is burdened with its high costs, especially variable costs, due to small and
fragmented raw material production, and lack of demand as well as integrated management
solutions. Stakeholders in the flow also practice high outsourcing rates to disperse costs and
risks along the chain and, more importantly, and they do not consider their cold chain services
as a significant part of their business. The low affordability of the chain is reflected in the high
rates offered to retailers (D14,000/km) compared to uncontrolled-temperature services for
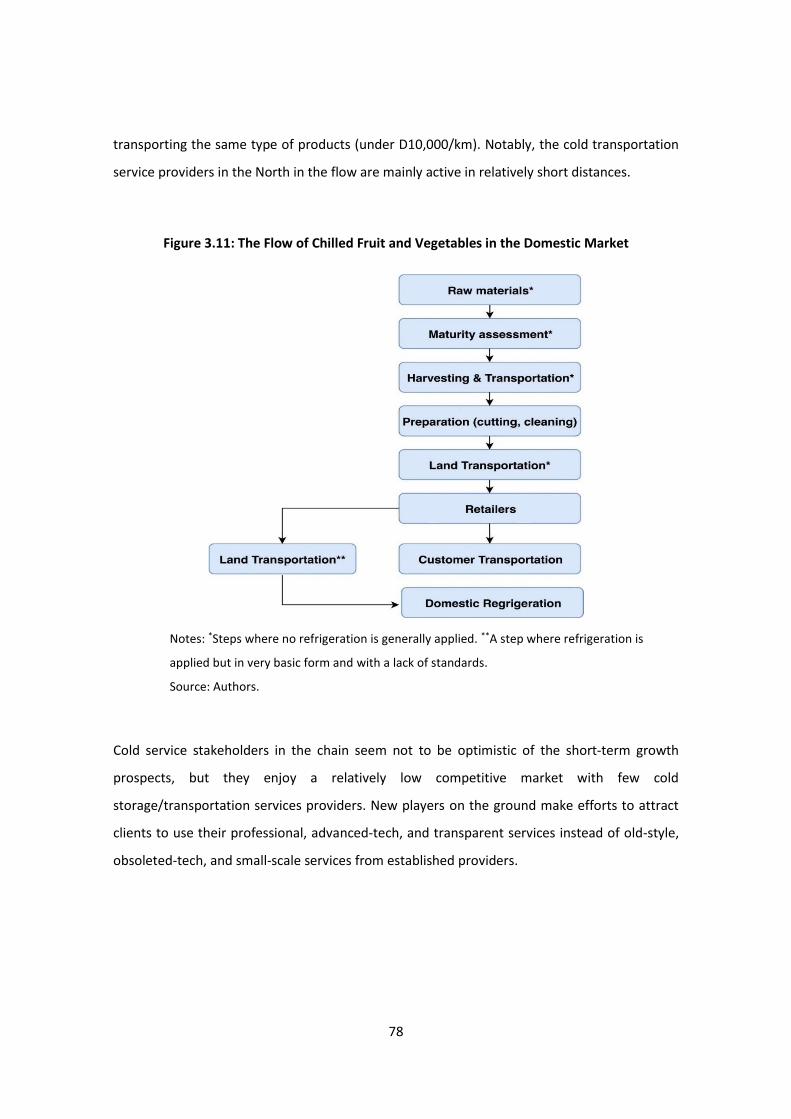
78
transporting the same type of products (under D10,000/km). Notably, the cold transportation
service providers in the North in the flow are mainly active in relatively short distances.
Figure 3.11: The Flow of Chilled Fruit and Vegetables in the Domestic Market
Notes: *Steps where no refrigeration is generally applied. **A step where refrigeration is
applied but in very basic form and with a lack of standards.
Source: Authors.
Cold service stakeholders in the chain seem not to be optimistic of the short-term growth
prospects, but they enjoy a relatively low competitive market with few cold
storage/transportation services providers. New players on the ground make efforts to attract
clients to use their professional, advanced-tech, and transparent services instead of old-style,
obsoleted-tech, and small-scale services from established providers.
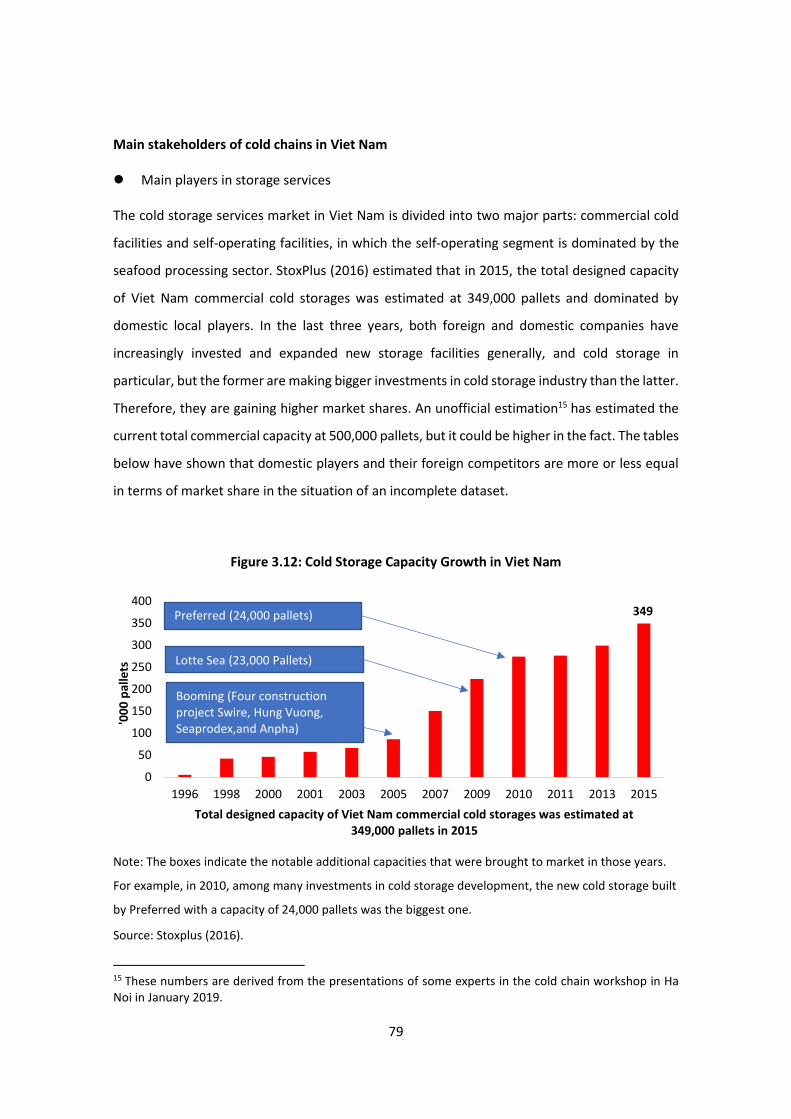
79
Main stakeholders of cold chains in Viet Nam
⚫ Main players in storage services
The cold storage services market in Viet Nam is divided into two major parts: commercial cold
facilities and self-operating facilities, in which the self-operating segment is dominated by the
seafood processing sector. StoxPlus (2016) estimated that in 2015, the total designed capacity
of Viet Nam commercial cold storages was estimated at 349,000 pallets and dominated by
domestic local players. In the last three years, both foreign and domestic companies have
increasingly invested and expanded new storage facilities generally, and cold storage in
particular, but the former are making bigger investments in cold storage industry than the latter.
Therefore, they are gaining higher market shares. An unofficial estimation15 has estimated the
current total commercial capacity at 500,000 pallets, but it could be higher in the fact. The tables
below have shown that domestic players and their foreign competitors are more or less equal
in terms of market share in the situation of an incomplete dataset.
Figure 3.12: Cold Storage Capacity Growth in Viet Nam
Note: The boxes indicate the notable additional capacities that were brought to market in those years.
For example, in 2010, among many investments in cold storage development, the new cold storage built
by Preferred with a capacity of 24,000 pallets was the biggest one.
Source: Stoxplus (2016).
15 These numbers are derived from the presentations of some experts in the cold chain workshop in Ha Noi in January 2019.
0
50
100
150
200
250
300
350
400
1996 1998 2000 2001 2003 2005 2007 2009 2010 2011 2013 2015
'00
0 p
alle
ts
Total designed capacity of Viet Nam commercial cold storages was estimated at 349,000 pallets in 2015
349
Booming (Four construction project Swire, Hung Vuong, Seaprodex,and Anpha)
Lotte Sea (23,000 Pallets)
Preferred (24,000 pallets)
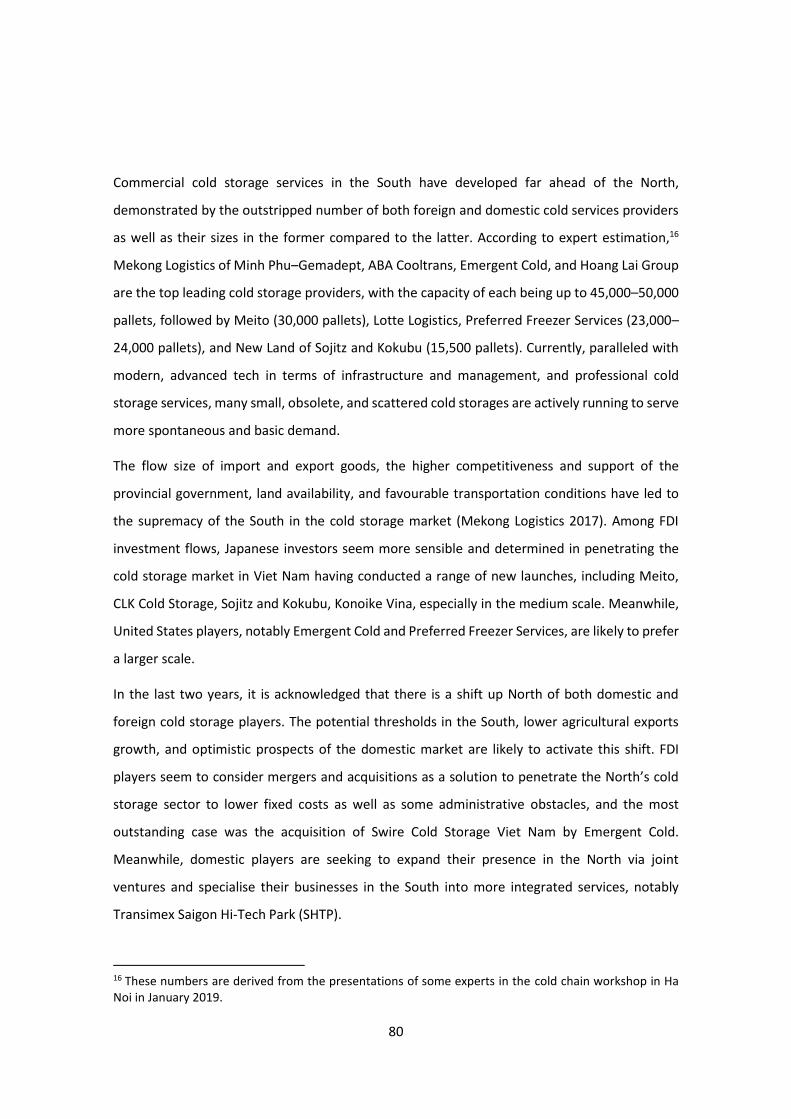
80
Commercial cold storage services in the South have developed far ahead of the North,
demonstrated by the outstripped number of both foreign and domestic cold services providers
as well as their sizes in the former compared to the latter. According to expert estimation,16
Mekong Logistics of Minh Phu–Gemadept, ABA Cooltrans, Emergent Cold, and Hoang Lai Group
are the top leading cold storage providers, with the capacity of each being up to 45,000–50,000
pallets, followed by Meito (30,000 pallets), Lotte Logistics, Preferred Freezer Services (23,000–
24,000 pallets), and New Land of Sojitz and Kokubu (15,500 pallets). Currently, paralleled with
modern, advanced tech in terms of infrastructure and management, and professional cold
storage services, many small, obsolete, and scattered cold storages are actively running to serve
more spontaneous and basic demand.
The flow size of import and export goods, the higher competitiveness and support of the
provincial government, land availability, and favourable transportation conditions have led to
the supremacy of the South in the cold storage market (Mekong Logistics 2017). Among FDI
investment flows, Japanese investors seem more sensible and determined in penetrating the
cold storage market in Viet Nam having conducted a range of new launches, including Meito,
CLK Cold Storage, Sojitz and Kokubu, Konoike Vina, especially in the medium scale. Meanwhile,
United States players, notably Emergent Cold and Preferred Freezer Services, are likely to prefer
a larger scale.
In the last two years, it is acknowledged that there is a shift up North of both domestic and
foreign cold storage players. The potential thresholds in the South, lower agricultural exports
growth, and optimistic prospects of the domestic market are likely to activate this shift. FDI
players seem to consider mergers and acquisitions as a solution to penetrate the North’s cold
storage sector to lower fixed costs as well as some administrative obstacles, and the most
outstanding case was the acquisition of Swire Cold Storage Viet Nam by Emergent Cold.
Meanwhile, domestic players are seeking to expand their presence in the North via joint
ventures and specialise their businesses in the South into more integrated services, notably
Transimex Saigon Hi-Tech Park (SHTP).
16 These numbers are derived from the presentations of some experts in the cold chain workshop in Ha Noi in January 2019.
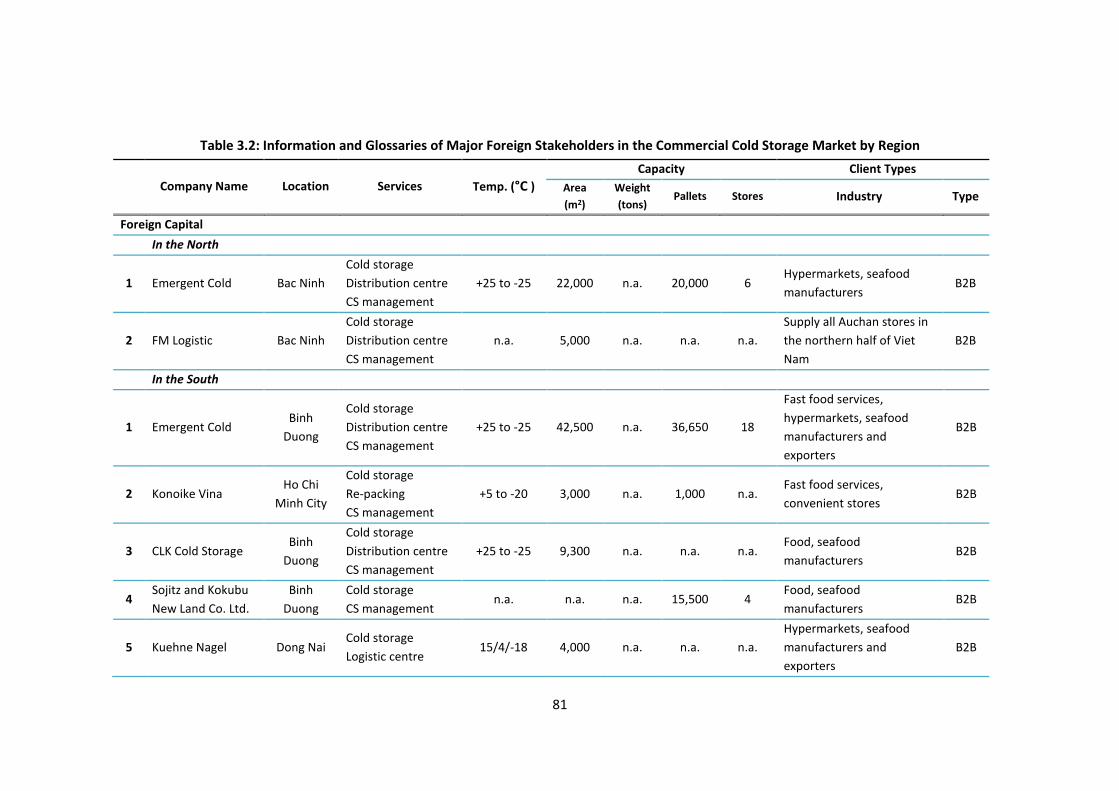
81
Table 3.2: Information and Glossaries of Major Foreign Stakeholders in the Commercial Cold Storage Market by Region
Company Name Location Services Temp. (°C )
Capacity Client Types
Area
(m2)
Weight
(tons) Pallets Stores Industry Type
Foreign Capital
In the North
1 Emergent Cold Bac Ninh
Cold storage
Distribution centre
CS management
+25 to -25 22,000 n.a. 20,000 6 Hypermarkets, seafood
manufacturers B2B
2 FM Logistic Bac Ninh
Cold storage
Distribution centre
CS management
n.a. 5,000 n.a. n.a. n.a.
Supply all Auchan stores in
the northern half of Viet
Nam
B2B
In the South
1 Emergent Cold Binh
Duong
Cold storage
Distribution centre
CS management
+25 to -25 42,500 n.a. 36,650 18
Fast food services,
hypermarkets, seafood
manufacturers and
exporters
B2B
2 Konoike Vina Ho Chi
Minh City
Cold storage
Re-packing
CS management
+5 to -20 3,000 n.a. 1,000 n.a. Fast food services,
convenient stores B2B
3 CLK Cold Storage Binh
Duong
Cold storage
Distribution centre
CS management
+25 to -25 9,300 n.a. n.a. n.a. Food, seafood
manufacturers B2B
4 Sojitz and Kokubu
New Land Co. Ltd.
Binh
Duong
Cold storage
CS management n.a. n.a. n.a. 15,500 4
Food, seafood
manufacturers B2B
5 Kuehne Nagel Dong Nai Cold storage
Logistic centre 15/4/-18 4,000 n.a. n.a. n.a.
Hypermarkets, seafood
manufacturers and
exporters
B2B

82
CS management
Custom clearance
6 Preferred Freezer
Services
Ho Chi
Minh City
Cold storage
Refrigerated
Loading/unloading
Dock
n.a. n.a. n.a. 24,000 n.a.
Fast food services,
hypermarkets, seafood
manufacturers and
exporters
B2B
7 Sagawa Express Dong Nai Cold storage
Logistic centre +3 to -20 2,322 n.a. n.a. n.a.
Hypermarkets,
manufacturers B2B
8 Meito Viet Nam Binh
Duong
Cold storage
Distribution centre
CS management
-15 to -25 n.a. 30,000 30,000 8 Food/seafood
manufacturers, exporters B2B
9 Anpha–AG Long An
Cold storage
Distribution centre
CS management
n.a. n.a. n.a. n.a. n.a. Food/seafood
manufacturers, exporters B2B
10 Panasato Binh
Duong
Cold warehousing
and logistics
services
n.a. 5,200 n.a. n.a. n.a.
Fast food services,
hypermarkets, seafood
manufacturers, exporters
B2B
11 Lotte Logistics Long An
Cold storage
Distribution centre
CS management
10 to -30 n.a. n.a. 23,000 10 Fast food services,
hypermarkets B2B
Source: Collated by authors from official websites of companies.
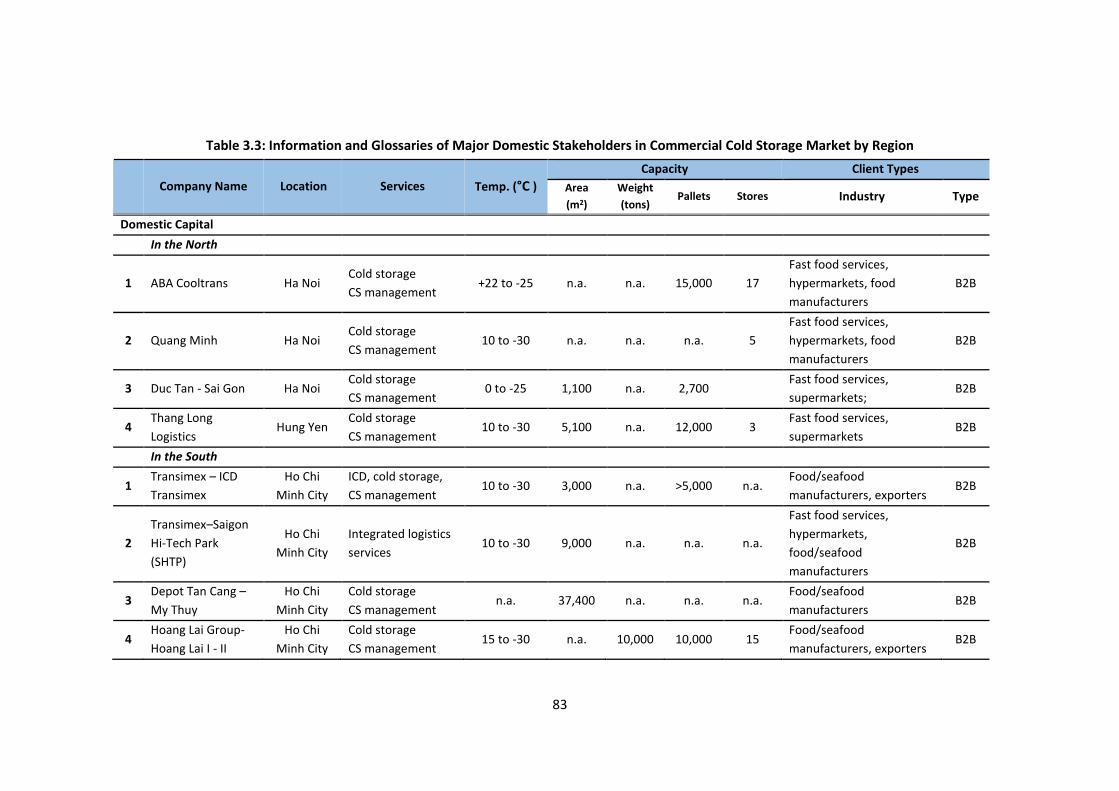
83
Table 3.3: Information and Glossaries of Major Domestic Stakeholders in Commercial Cold Storage Market by Region
Company Name Location Services Temp. (°C )
Capacity Client Types
Area
(m2)
Weight
(tons) Pallets Stores Industry Type
Domestic Capital
In the North
1 ABA Cooltrans Ha Noi Cold storage
CS management +22 to -25 n.a. n.a. 15,000 17
Fast food services,
hypermarkets, food
manufacturers
B2B
2 Quang Minh Ha Noi Cold storage
CS management 10 to -30 n.a. n.a. n.a. 5
Fast food services,
hypermarkets, food
manufacturers
B2B
3 Duc Tan - Sai Gon Ha Noi Cold storage
CS management 0 to -25 1,100 n.a. 2,700 Fast food services,
supermarkets; B2B
4 Thang Long
Logistics Hung Yen
Cold storage
CS management 10 to -30 5,100 n.a. 12,000 3
Fast food services,
supermarkets B2B
In the South
1 Transimex – ICD
Transimex
Ho Chi
Minh City
ICD, cold storage,
CS management 10 to -30 3,000 n.a. >5,000 n.a.
Food/seafood
manufacturers, exporters B2B
2
Transimex–Saigon
Hi-Tech Park
(SHTP)
Ho Chi
Minh City
Integrated logistics
services 10 to -30 9,000 n.a. n.a. n.a.
Fast food services,
hypermarkets,
food/seafood
manufacturers
B2B
3 Depot Tan Cang –
My Thuy
Ho Chi
Minh City
Cold storage
CS management n.a. 37,400 n.a. n.a. n.a.
Food/seafood
manufacturers B2B
4 Hoang Lai Group-
Hoang Lai I - II
Ho Chi
Minh City
Cold storage
CS management 15 to -30 n.a. 10,000 10,000 15
Food/seafood
manufacturers, exporters B2B
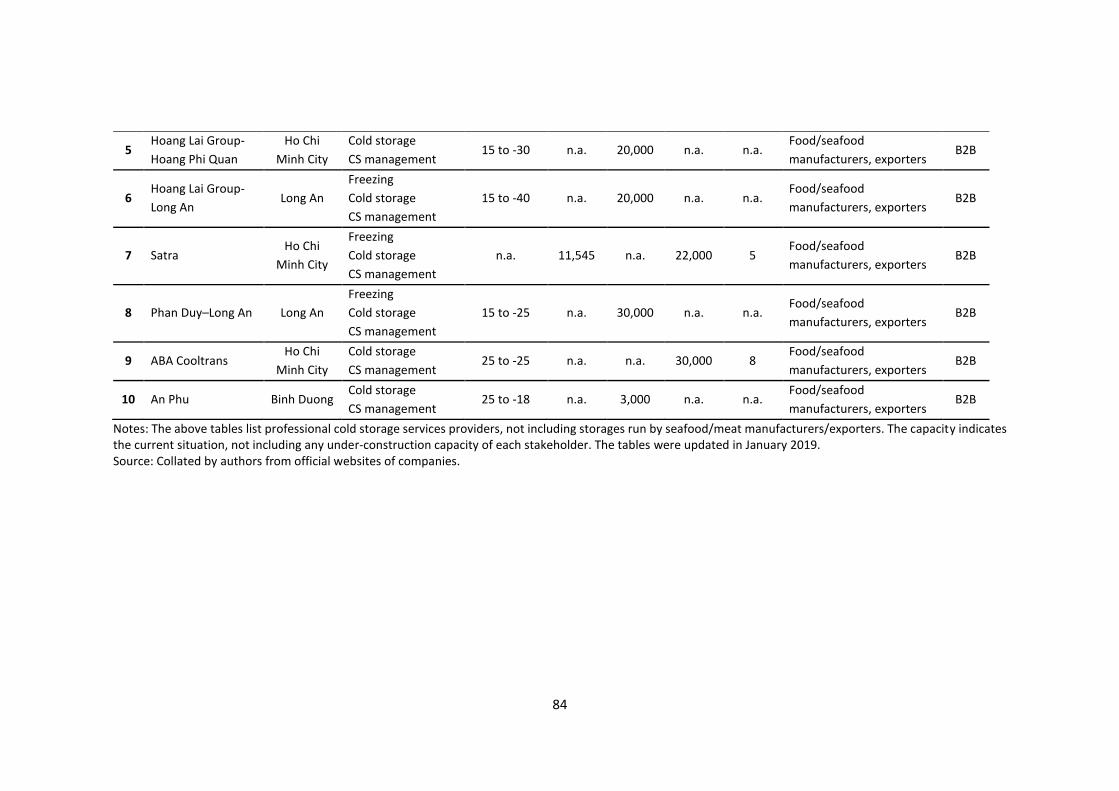
84
5 Hoang Lai Group-
Hoang Phi Quan
Ho Chi
Minh City
Cold storage
CS management 15 to -30 n.a. 20,000 n.a. n.a.
Food/seafood
manufacturers, exporters B2B
6 Hoang Lai Group-
Long An Long An
Freezing
Cold storage
CS management
15 to -40 n.a. 20,000 n.a. n.a. Food/seafood
manufacturers, exporters B2B
7 Satra Ho Chi
Minh City
Freezing
Cold storage
CS management
n.a. 11,545 n.a. 22,000 5 Food/seafood
manufacturers, exporters B2B
8 Phan Duy–Long An Long An
Freezing
Cold storage
CS management
15 to -25 n.a. 30,000 n.a. n.a. Food/seafood
manufacturers, exporters B2B
9 ABA Cooltrans Ho Chi
Minh City
Cold storage
CS management 25 to -25 n.a. n.a. 30,000 8
Food/seafood
manufacturers, exporters B2B
10 An Phu Binh Duong Cold storage
CS management 25 to -18 n.a. 3,000 n.a. n.a.
Food/seafood
manufacturers, exporters B2B
Notes: The above tables list professional cold storage services providers, not including storages run by seafood/meat manufacturers/exporters. The capacity indicates the current situation, not including any under-construction capacity of each stakeholder. The tables were updated in January 2019. Source: Collated by authors from official websites of companies.
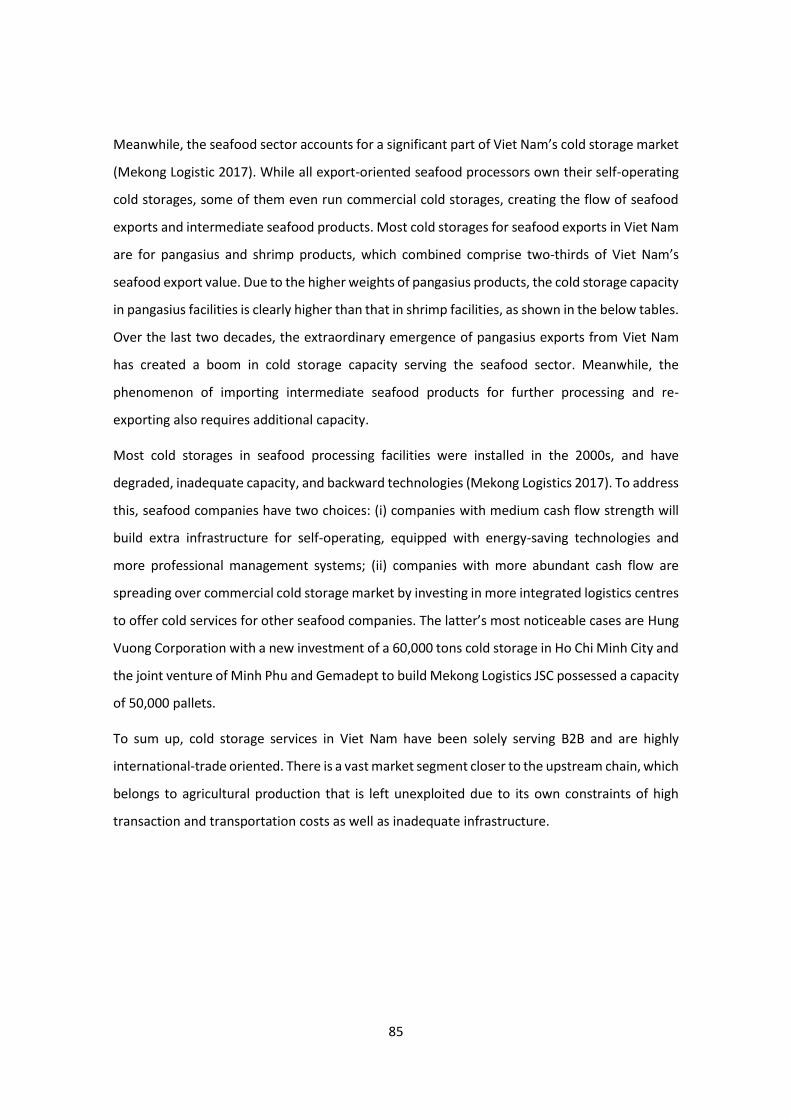
85
Meanwhile, the seafood sector accounts for a significant part of Viet Nam’s cold storage market
(Mekong Logistic 2017). While all export-oriented seafood processors own their self-operating
cold storages, some of them even run commercial cold storages, creating the flow of seafood
exports and intermediate seafood products. Most cold storages for seafood exports in Viet Nam
are for pangasius and shrimp products, which combined comprise two-thirds of Viet Nam’s
seafood export value. Due to the higher weights of pangasius products, the cold storage capacity
in pangasius facilities is clearly higher than that in shrimp facilities, as shown in the below tables.
Over the last two decades, the extraordinary emergence of pangasius exports from Viet Nam
has created a boom in cold storage capacity serving the seafood sector. Meanwhile, the
phenomenon of importing intermediate seafood products for further processing and re-
exporting also requires additional capacity.
Most cold storages in seafood processing facilities were installed in the 2000s, and have
degraded, inadequate capacity, and backward technologies (Mekong Logistics 2017). To address
this, seafood companies have two choices: (i) companies with medium cash flow strength will
build extra infrastructure for self-operating, equipped with energy-saving technologies and
more professional management systems; (ii) companies with more abundant cash flow are
spreading over commercial cold storage market by investing in more integrated logistics centres
to offer cold services for other seafood companies. The latter’s most noticeable cases are Hung
Vuong Corporation with a new investment of a 60,000 tons cold storage in Ho Chi Minh City and
the joint venture of Minh Phu and Gemadept to build Mekong Logistics JSC possessed a capacity
of 50,000 pallets.
To sum up, cold storage services in Viet Nam have been solely serving B2B and are highly
international-trade oriented. There is a vast market segment closer to the upstream chain, which
belongs to agricultural production that is left unexploited due to its own constraints of high
transaction and transportation costs as well as inadequate infrastructure.

86
Table 3.4: Information and Glossaries of Major Domestic Stakeholders in the Self-operating Segment of Seafood Cold Storage by Product
Company Name Location Current Situation Capacity Usage Note
Weight
(tons)
Pallets Industry Type
Pangasius
1 Vinh Hoan Corporation MRD In operation 9,000 n.a. Frozen fillet
pangasius
Self-operation
2 Hung Vuong Corporation Ho Chi Minh City In operation 12,000 n.a. For rent B2B, self-
operation
Ho Chi Minh City In operation 30,000 n.a. For rent Sold to ABA
Ho Chi Minh City Under construction 60,000 n.a. For rent
3 International Development
&Investment Corporation
(IDI)
Dong Thap In operation 4,600 n.a. Frozen fillet
pangasius
Self-operation
Dong Thap Under construction 10,000 n.a. Frozen fillet
pangasius
4 Nam Viet Corporation An Giang In operation 6,000 n.a. Frozen fillet
pangasius
Self-operation
5 Cadovimex II Dong Thap In operation 5,000 n.a. Frozen fillet
pangasius
Self-operation
6 Mekong Fishery JSC Can Tho In operation 400 n.a. Frozen fillet
pangasius
Self-operation
7 Godaco Seafood JSC Tien Giang In operation 8,500 n.a. Frozen fillet
pangasius
Self-operation,
B2B
Updated by 2014
8 Hung Ca Co., Ltd Dong Thap In operation >10,000 n.a. Frozen fillet
pangasius
Self-operation
Shrimp
1 Minh Phu Seafood
Corporation
Hau Giang In operation n.a. 50,000 Integrated
logistics services
B2B Mekong Logistics
JSC
2 Sao Ta Foods JSC Soc Trang In operation 4,000 n.a. Frozen shrimp Self-operation Parent company:
Hung Vuong Corp
3 Camimex Group Ca Mau In operation 2,000 n.a. Frozen shrimp Self-operation
87
Ca Mau Under construction 1,500 n.a.
4 Seaprodex Minh Hai Bac Lieu In operation 1,000 n.a. Frozen shrimp Self-operation Central cold
storage
5 Au Vung I Seafood
Processing JSC
Bac Lieu In operation >1,500 n.a. Frozen shrimp Self-operation
Notes: The above tables are listing cold storages owned by seafood manufacturers/exporters. The tables updated by Jan 2019.
Source: Collated by authors from official websites of companies.

88
⚫ Main players in transportation services
The cold transportation sector in Viet Nam is characterised by a high outsourcing rate and a
small proportion of total transportation capacity and is seemingly dominated by local players
(Luong 2018). There are no official estimations for total cold transportation capacity, and
data are unlikely to specify leading players, market share structure in the sector, or report
the number and capacity of cold trucks serving agricultural and food products. ABA Cooltrans,
Tan Nam Chinh Logistics, Tan Bao An, and Binh Minh Tai possibly seize some big shares of the
market, in which ABA Cooltrans is a relatively new, significant player that was established in
2008 and started as a cold transportation service provider before expanding to the cold
storage market via acquisition. Their main clients currently are Big C, Vinmart, METRO,
Unilever, Vinamilk, Kinh Do, and BEL.
There are four types of cold transportation. First, for imported, chilled, or frozen products,
refrigerated containers are transported directly from ports to cold storage houses using
container trucks. Second, to transport from cold storages to companies, such as
supermarkets and restaurants, etc. (B2B), small cold trucks are usually used. This is because
the urban road infrastructure in Viet Nam is characterised by small alleys and exceptionally
high rates of using motorbikes.
There are two truck types: (i) professional trucks belong to new companies such as ABA
Cooltrans, Tan Nam Chinh Logistics, etc; and (ii) modified trucks belong to small
transportation companies. Professional trucks range from 1 ton to 14 tons with real-time
updates on cargo to clients, global positioning system-enabled for real-time tracking, data
loggers for temperature monitoring, and multi-temperature adjustment. Most importantly,
the setting of the air conditioner systems of professional trucks is well designed and
constructed to maintain the cool air spread evenly in the chambers. Most of these trucks are
imported from Japan or Korea.
Modified cold trucks are mainly small for urban services and locally produced, notably by
THACO Truong Hai Company, with prices ranging from D500 million–D700 million for trucks
under two tons. A typical modified cold van is equipped with an air conditioner to control the
temperature at the desired levels of each product category. However, according to experts,
the setting of air conditioners without air tubes on the top do not spread cold air evenly
inside the truck chamber, and thus do not ensure the quality of the transported products.
89
In addition, business-to-consumer (B2C) cold services carry out very flexible solutions to
deliver goods to customers by using motorbikes attached with ice boxes on the back to keep
food chilled/cold. However, on hot days, ice boxes are insufficient to maintain low
temperatures, leading to the rapid deterioration of food. E-commerce and ‘bricks-and-clicks’
retailers17 are in need of improving their home-delivery services for perishable products and
foods.
17 Bricks-and-clicks retailers refer to a business model in which retailers operate both offline and online stores and integrate the two into a single retail strategy.

90
Table 3.5: Information and Glossaries of Major Stakeholders in Commercial Cold Transportation Services
Company Name No of Vehicles
Capacity (tons)
Temp.
(°C )
Services Client Types
Industry Type
Foreign Capital
1 Konoike Vina 15 trucks as of Apr 2016
5 – 15 25 – -25 FCL, LCL temperature-controlled road and courier services Border temperature-controlled road transportation services
Food manufacturers/ distributors/ traders
B2B
2 Panalpina World Transport (Viet Nam)
n.a. n.a. n.a. Temperature-controlled air freight Ocean reefer freight Temperature-controlled road and courier services
Food manufacturers/ distributors/ traders
B2B
3 Agility Logistics n.a. n.a. n.a. Integrated trucking network across ASEAN region linking major cities, ports and airports to one another and 150 destinations in China.
n.a. B2B
4 Meito Viet Nam n.a. 1.8 – 13 15 – -18 Temperature-controlled road transportation services Food manufacturers/ distributors/ traders
B2B
5 Panasato n.a. n.a. n.a. Handling perishable-specialised in refrigerated cargo, big quantity agricultural products
n.a. n.a.
Domestic Capital
1 ABA Cooltrans 200 1 – 14 n.a. North-South and vice versa temperature-controlled road transportation Small cold trucks for distribution in urban areas
Hypermarkets/ Food manufacturers, distributors, traders
B2B
2 Tan Bao An 35 n.a. 0 – 5; -25 – -18
Truck transportation for perishable products: meat, seafood, fruit and vegetables, milk, medical, pharmaceutical products
Food manufacturers, distributors, traders
B2B
3 Tan Nam Chinh Logistics
100 n.a. n.a. Nationwide temperature-controlled road transportation Integrated trucking network across the ASEAN region and China
n.a. B2B
4 Duc Tan – Sai Gon
n.a. 1 – 1.25 – 2.5
n.a. Truck transportation for perishable products for Hanoi and neighbouring areas
Food manufacturers, distributors, traders
B2B
5 Binh Minh Tai 30 1.4 – 18 n.a. North-South and vice versa temperature-controlled road transportation for perishable products
Hypermarkets/ Food manufacturers, distributors, traders
B2B
Source: Collated by authors from official websites of companies.
91
3.3. Government policies related to the cold chain in Viet Nam
Currently, the Vietnamese government has not established a strategy or specific policy
framework for promoting cold chain agriculture. Instead, cold chain related policies are
scattered in various laws and regulations issued by different agencies, mainly derived from
three policy categories: (i) food safety law and regulations; (ii) logistics development
promotion policies; and (iii) food standards in Viet Nam.
In terms of strategy, in 2013, the government issued Decision 899/2013/QD-CP by the
Government on Agricultural Restructure Program, in which Viet Nam would transform its
agricultural sector towards a high-value, sustainable development model. Thanks to this
policy, the Ministry of Agricultural and Rural Development (MARD) and 63 provinces have
promoted the conversion from traditional grain crops, such as rice and maize, to high-value
vegetable, flower, fruit, and aquaculture production, which are high value but also perishable
and, thus, have indirectly pushed the demand for cold services.
The top policy influencing cold chain service is the Food Safety Law, enacted in 2011; in which,
temperature-related conditions are stated in Provision 1b of Article 20: “Food producers and
traders must meet the following conditions for food preservation: Preventing the effects of
temperature, humidity, insects, animals, dust, strange smell and negative environmental
effects: guaranteeing sufficient light: having special-use equipment for adjusting
temperature, humidity and other climate conditions, ventilation equipment and other special
preservation conditions required by each type of food”. The provision was explained in detail
in Joint Circular 13/2014/TTLT-BYT-BNNPTNT-BCT on the allocation of tasks and cooperation
among regulatory agencies in food safety management, in which MARD is assigned the
responsibility of managing meat, fisheries, fruit and vegetables, eggs, and raw milk. The
National Agro-Forestry–Fisheries Quality Assurance Department (NAFIQAD) and its local
branches (under MARD) are authorised to issue food safety certification to cold storage for
agricultural products and foods. While the registration of cold transportation vehicles is the
responsibility of Viet Nam Register under the Ministry of Transportation, the Ministry of
Industry and Trade (MOIT) has been authorised to issue food safety certification to
hypermarkets, supermarkets, and other modern retail channels.
The second policy category is logistics development promotion policies, notably Decree
163/2017/ND-CP by the government on the provision of logistics services. The decree has
92
decisive impacts on shaping the investment environment currently when creating more room
for foreign investors to join logistics services in Viet Nam by specific regulations on the ‘rights
of foreign investors to acquire shares, contribute capital or establish an enterprise in sea
transport, container handling services, customs clearance, inland waterway transport
services, road transport services’. Directive 21/CT-TTg, issued in 2018 by the prime minister
on promoting the implementation of solutions to reduce logistics costs and effectively
connect transport infrastructure, attempts to link more effectively transport infrastructure
and lower logistic costs, thereby encouraging integrated logistics services and motivating e-
commerce retail, new ground for cold chain services in Viet Nam.
Specifically, to promote the post-harvest technology application for agricultural production,
Decision 68/2013/QD-TTg targets mitigating losses in post-harvest stages through credit
support to purchase machines and equipment, including refrigerated cargo; machines for
producing ice; and cold storage facilities. However, the policy has not been appreciated due
to low accessibility to targeted groups, especially farmers, cooperatives, and farming
households. Meanwhile, the cold services providers surveyed and interviewed by the
research team confirmed they were not aware of the policy.
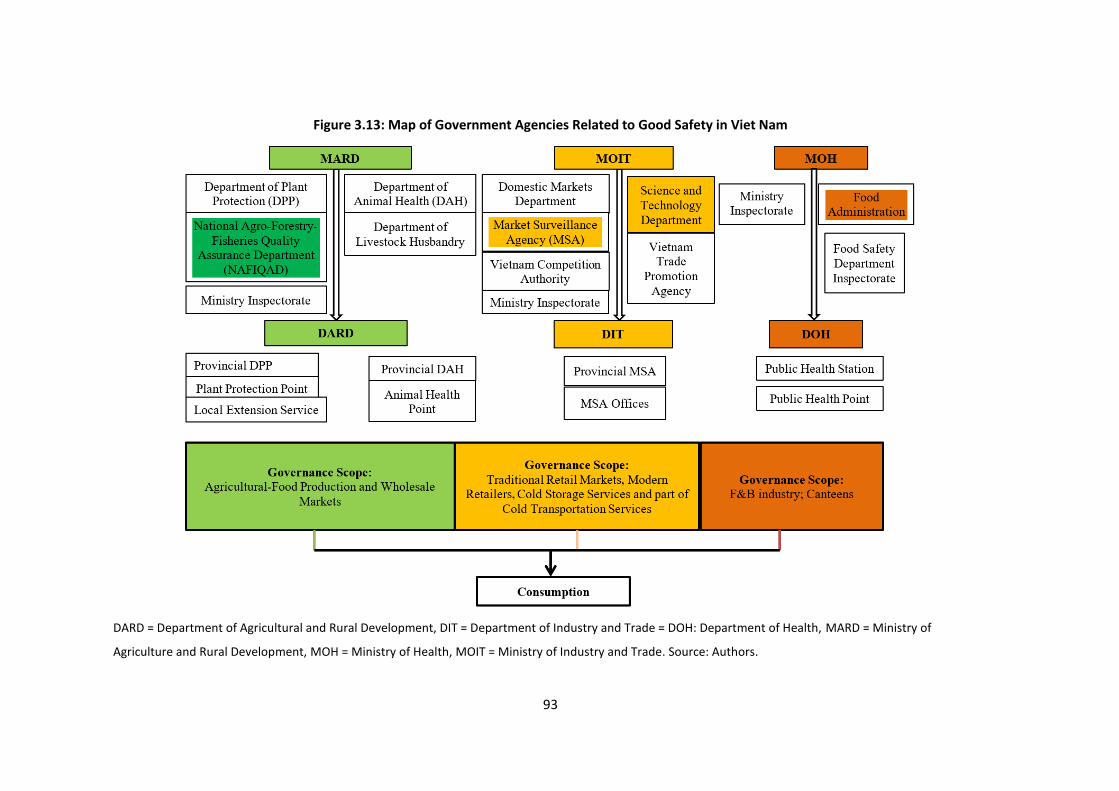
93
Figure 3.13: Map of Government Agencies Related to Good Safety in Viet Nam
DARD = Department of Agricultural and Rural Development, DIT = Department of Industry and Trade = DOH: Department of Health, MARD = Ministry of
Agriculture and Rural Development, MOH = Ministry of Health, MOIT = Ministry of Industry and Trade. Source: Authors.

94
The third policy category in supporting cold chain development is food standards applied in
Viet Nam. To boost fishery exports, the nation has formed a range of technical requirements
for frozen shrimp, pangasius, and raw fishery materials requiring temperature control. TCVN
4379 was the first standard on frozen fish exports and was issued more than 30 years ago in
1986. The most recent one is TCVN 12429:2018 issued in October 2018 on chilled meat and
its technical requirements.
3.4. Opportunities and challenges of cold chain development for agriculture in Viet
Nam
Within the cold chain
While investment in pre-cooling – getting perishable fruits and vegetables into a controlled
environment as quickly as possible after harvest – helps to reduce food loss, perhaps the
biggest challenge in developing economies like Viet Nam’s, is a shortage of refrigerated
vehicle resources and refrigerated warehouse space in material zones (Mercier et al. 2016).
Small-scale and fragmented agricultural production in Viet Nam inhibits professional cold
transportation companies. Given the fact that the average size of a household’s farm in Viet
Nam is less than one hectare and most farms are far away from cities with low-quality roads,
it is excessively costly for cold trucks to come to collect agricultural products timely after
harvesting. Depending on the products, farmers have to wait from one day to one week
before their products are collected. Normally, for perishable products, such as shrimps or
fruits, collectors or traders may come in one day. However, they usually use non-refrigerated
vans and motorbikes to transport the products to wholesalers or to the market. In the
Mekong River Delta, boats are the main transport vehicles of agricultural products in remote
areas. This means the fragmented agricultural product and foodstuff flows from the
upstream in cold chains have not favoured cold-chain development from the very beginning.
They have also been discouraging new investments in the cold chains that directly serve
farmers and rural areas.
For farmers, due to the lack of household-scale cold transportation and storage facilities,
farmers usually harvest agricultural products when they are immature. Uneven maturity
among agricultural products harvested and poor-managed household storage force farmers
to sell their products with large volumes immediately in the peaks of their harvesting periods
to maintain the product quality. The seasonality of agricultural production and abundant
supply in short harvesting periods generate unstable flows of products and pose high risks
for both agricultural producers and cold service providers at the early stage of cold chain
flows. The market for agricultural household-scale cold storage technology and equipment,
particularly for perishable products, such as high-value fruit and vegetables, is promising for
cold chain suppliers in the future.
Traditionally, the cold chain logistics sector in Viet Nam has been fragmented with small and
medium service providers that provide localised services that do not cover the end-to-end
food supply chain. Except for highly integrated in-house seafood cold chains, commercial cold
chains of other goods flows are highly fragmented in all stages. Even big companies rarely
95
offer integrated services in both cold storage and cold transport markets. The lack of long-
distance cold transport services demonstrates high risks and high variable costs in operating
the services.
Although retailers have expanded in Viet Nam in recent years, the distribution networks
remain underdeveloped to provide a safe and efficient last mile distribution service. The
phenomenon of e-commerce has been realised clearly year by year, and some retailers have
been offering fresh foods and home-delivery services. The home delivery services have
exploited mainly motorbikes attached with insulation boxes to control the temperature.
However, this solution has appeared ineffective on hot days. This is also a potential
investment area for cold chain suppliers in the future.
Outside the cold chain
Low connectivity in transport infrastructure, especially roads, domestic waterways, and
seaports, is always considered as a main factor causing high logistics costs in Viet Nam (MOIT
2015; Dexion 2015). First, the lack of integration and connection between ports and material
zones. For example, in Mekong River Delta, the main agricultural source of the nation, there
are many small ports (37 ports), but few container ports where big ships can approach.
Consequently, most agricultural products in the delta have to be transported to ports in Ho
Chi Minh City or Vung Tau province for exports and this practice significantly increase the
cost of Vietnamese products. Overloaded road transportation and under-developed railway
transportation are other issues in Viet Nam. Most warehouses are located near big cities,
such as Ho Chi Minh, Ha Noi, Da Nang, Can Tho and far away from agricultural material zones.
Agricultural products are mainly transported via degraded, poor-quality roads with too many
container trucks, while there is no internal railway system in intensive agricultural production
zones, such as the Mekong River Delta, Red River Delta, Central Highlands, and Southern East
Region. Energy also causes problems for cold chain development in Viet Nam. Interrupted
electricity supply causes huge costs to cold chain storage suppliers in Viet Nam as they have
to equip a standing by back-up battery system, which is very expensive.
In addition, professional cold storage and transport services would require high-qualified
labour, with their own specific knowledge of the nature of perishable products and quality
changes due to temperature (Asia Pacific Economic Cooperation 2015). Both the cold storage
and cold transportation sectors are facing shortages of labour. At the moment, there are
almost no university offering courses with curriculums related to cold chain logistics and
management in agriculture. This is an important segment for universities to open new
education programs and short-course training to staff and managers of companies using cold
chain services in the near future.
The lack of policy framework for cold chain development is among the notable issues and
challenges. As discussed above, while the high logistics cost has attracted the attention of
central government with the issuance of Directive 21, a specific policy framework or a
development strategy of cold chain logistics does not exist in Viet Nam. One of the key policy
priorities for the government is how to integrate the cold chain into the current logistics
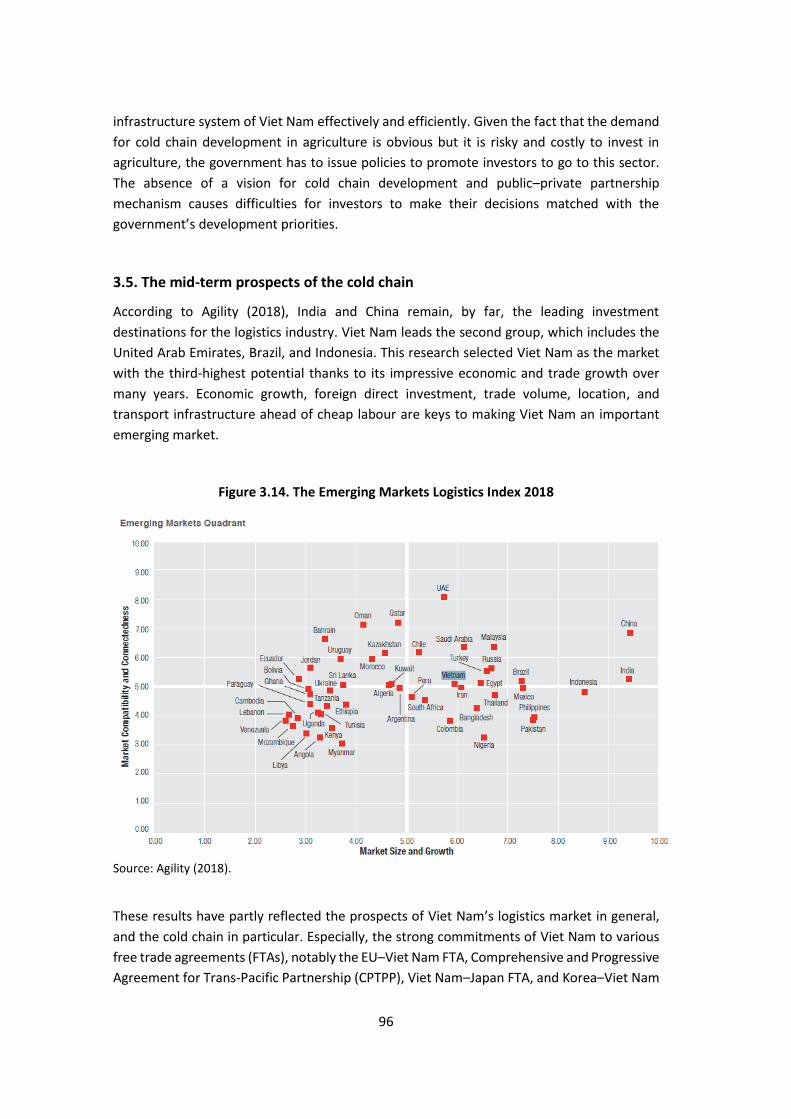
96
infrastructure system of Viet Nam effectively and efficiently. Given the fact that the demand
for cold chain development in agriculture is obvious but it is risky and costly to invest in
agriculture, the government has to issue policies to promote investors to go to this sector.
The absence of a vision for cold chain development and public–private partnership
mechanism causes difficulties for investors to make their decisions matched with the
government’s development priorities.
3.5. The mid-term prospects of the cold chain
According to Agility (2018), India and China remain, by far, the leading investment
destinations for the logistics industry. Viet Nam leads the second group, which includes the
United Arab Emirates, Brazil, and Indonesia. This research selected Viet Nam as the market
with the third-highest potential thanks to its impressive economic and trade growth over
many years. Economic growth, foreign direct investment, trade volume, location, and
transport infrastructure ahead of cheap labour are keys to making Viet Nam an important
emerging market.
Figure 3.14. The Emerging Markets Logistics Index 2018
Source: Agility (2018).
These results have partly reflected the prospects of Viet Nam’s logistics market in general,
and the cold chain in particular. Especially, the strong commitments of Viet Nam to various
free trade agreements (FTAs), notably the EU–Viet Nam FTA, Comprehensive and Progressive
Agreement for Trans-Pacific Partnership (CPTPP), Viet Nam–Japan FTA, and Korea–Viet Nam
97
FTA, are highly expected to attract more FDI and imported product flows, thereby promoting
significantly the development of the cold chain in the mid-term. Decree 163/2017/ND-CP on
the provision of logistics services to create a more friendly investment environment for FDI
investments into logistics services generally, and cold chains services in particular, is on time
to exploit the advantages.
In the mid-term, seafood, food, and drink export-oriented manufacturers likely continue to
dominate in Viet Nam’s cold chain. Therefore, their inbound logistics and integrated
production systems possibly remain as a main driver in Viet Nam’s cold chain development.
In particular, the recent launches of highly integrated logistics complexes of Transimex–
Saigon Hi-Tech Park (SHTP) in Ho Chi Minh City and Mekong Logistics of Minh Phu–Gemadept
in Hau Giang Province in Mekong Delta region would mark a new chapter for cold chain
development in Viet Nam.
Increasing consumption of high-value imported food in the domestic market and demand for
‘clean’, eco-friendly, chilled, packed foods would likely provide some momentum. For
example, in February 2018, Masan Nutri-Science (MNS) opened its largest pork processing
complex in the north of Viet Nam, to target supplying 140,000 tons of pork, accounting for
5% total domestic supply. Its main product is chilled meat kept in cold storages set at
temperatures from 0 – 4°C and optimally used in five days. MNS is cooperating with VinGroup
to offer its Meat Deli brand in separated zones inside Vinmart supermarkets. Both
enterprises are among the pioneers in developing food processing complex and modern
retail chains in Viet Nam, driving new demand for cold storage and transportation. The FTAs
would lower tariff rates and, given the low non-tariff trade barriers in Viet Nam, in the mid-
term, Viet Nam would likely have an influx of imported foods, especially meat, dairy products,
fruit, and packed foods. Meanwhile, the rapid growth of modern retail channels, e-commerce,
and food service sectors would definitely help to create more demand for cold chain services,
especially for third-party cold chain logistics service.
References
Agility (2018), Agility Emerging Markets Logistics Index 2018, https://www.agility.com/wp-
content/uploads/2018/03/Agility-Emerging-Markets-Logistics-Index-2018.pdf
Asia–Pacific Economic Cooperation – Agricultural Technical Cooperation Working Group
(2015), High Level Public–Private Forum on Cold Chain to Strengthen Agriculture &
Food’s Global Value Chain.
Carrier (2018), Proceeding of Carrier World Cold Chain Summit in Viet Nam, https://www.ca
rrier.com/carrier/en/us/news/news-article/carrier_convene_2018_world_cold_cha
in_summit_Viet Nam.aspx
Dexion (2015), ‘Swire Cold Storage Viet Nam: Modernising cold chain storage in Viet Nam’,
Case Study: 5p.
FPT Securities (2015), Viet Nam Logistics Sector Report.
98
General Statistic Office of Viet Nam (2018), Database of national socio-economic situation of
Viet Nam, https://www.gso.gov.vn/Default_en.aspx?tabid=766
Institute of Policy and Strategy for Agricultural and Rural Development (IPSARD) (2013),
‘Report on consumption of some agricultural products in Viet Nam’, Research report.
Luong, Q. T. (2018), Highlights of Cold Chain in Viet Nam from Logistics Perspectives.
Mekong Logistics (2017), Mekong Logistics Center Integrated Logistics solution for Seafood
value chain in Mekong Delta.
Nomura Research Institute (2016), Discussion Paper: Cold Chain Market in Viet Nam
Mercier, S., S. Villeneuve, M. Mondor, and I. Uysal (2017), ‘Time–Temperature Management
Along the Food Cold Chain: A Review of Recent Developments’, Comprehensive
Reviews in Food Science and Food Safety, 16, p.647–67.
Stockplus (2016), The Viet Nam M&A Report 2016: Opportunities from global integrations,
http://www.stoxplus.com/news/detail/199055
Trademap (2018), Trade statistics for international economic development, https://www.tr
ademap.org/Index.aspx
United States Department of Agriculture (USDA) (2018), Viet Nam Retail Foods Sector Report
2018.
Viet Nam Ministry of Industry and Trade (MOIT) (2017), Viet Nam Logistics Report 2017.
LIST OF COMPANY WEBSITE:
Table 2. Information and Glossaries of Major Foreign Stakeholders in the Commercial Cold
Storage Market by Region
Emergent Cold: http://www.emergentcold.com/
FM Logistics: http://www.fmlogistic.com/eng-gb/Media/News/FM-LOGISTIC-SETS-UP-BASE-
IN-VIETNAM-TO-REINFORCE-ITS-POSITION-IN-ASIA
Konoike Vina: http://www.konoikevina.com/vi
CLK Cold Storage Company Limited: https://www.kline.co.jp/en/news/other/other-
9079631322222887844.html
Sojitz and Kokubu or New Land Co. Ltd. (Vietnam): https://www.newlandvj.com/
Kuehne Nagel: https://vn.kuehne-nagel.com/vi_vn/dich-vu-kho-bai-va-phan-phoi/trung-
tam-logistics-kuehne-nagel-vietnam/tour-ao-tham-quan-nha-kho/
Preferred Freezer Services: https://www.preferredfreezer.com/us-locations.php?Ho-Chi-
Minh-City-40?expanddiv=interior-nav-region-vietnam
Sagawa Express: http://sagawa-vtm.com.vn/?lang=en
Meito Vietnam: http://www.meitovietnam.com.v
99
Anpha-AG: http://anpha-ag.com/gioi_thieu
Panasato: www.panasato.com.vn
Lotte Logistics Vietnam Co. Ltd.:
http://www.lottelogistics.com.vn/system/application/views/default/images/LOTTE-
SEA%20CATALOGUE.pdf
Table 3: Information and Glossaries of Major Domestic Stakeholders in Commercial Cold
Storage Market by Region
ABA Cooltrans: https://aba.com.vn/
Quang Minh: http://quangminhcorp.com.vn/detail/vi-Vn/201/lich-di-hang-2018
Đức Tấn – Sài Gòn: http://www.kholanhductan.com.vn/default.aspx?webid=2
Thăng Long Logistics: http://www.tll.com.vn/
Transimex: www.transimex.com.vn
CTCP Giao nhận Xếp dỡ Tân Cảng: http://s.cafef.vn/hose/TCL-cong-ty-co-phan-dai-ly-giao-
nhan-van-tai-xep-do-tan-cang.chn
Hoàng Lai Group: http://www.hoanglaico.com/Default.aspx
Satra: http://satra.com.vn/linh-vuc-hoat-dong/kho-lanh-satra-31076
Phan Duy Corp: www.phanduycorp.vn
An Phú: www.apic.com.vn
Table 4: Information and Glossaries of Major Domestic Stakeholders in the Self-operating
Segment of Seafood Cold Storage by Product
Vinh Hoan Corporation: http://vinhhoan.com/
Hung Vuong Corporation: https://www.hungvuongpanga.com/
International Development &Investment Corporation (IDI): http://www.idiseafood.com/en
Nam Viet Corporation: http://navicorp.com.vn/?lang=en
Cadovimex II : http://www.cadovimex2.com.vn/
Mekong Fishery JSC: http://www.mekongfish.vn/en/AboutUs.asp
Godaco Seafood JSC: https://godaco-seafood.com.vn/vi/
Hung Ca Co., Ltd: https://www.hungca.com/
Minh Phu Seafood Corporation: http://minhphu.com/en/home/
Sao Ta Foods JSC: https://www.fimexvn.com/index.php/en/
Camimex Group: https://www.camimex.com.vn/
100
Seaprodex Minh Hai: https://www.seaminhhai.com/
CTCP Chế biến Thủy sản XNK Âu Vững I: http://www.auvungseafood.com/
Table 5. Information and Glossaries of Major Stakeholders in Commercial Cold
Transportation Services
Panalpina World Transport (Vietnam):
http://www.panalpina.com/www/global/en/home/industry_verticals/IVChem.html
Agility Logistics: https://www.agility.com/en/emerging-markets-logistics-index/rankings-
2018/
Tân Bảo An: www.xelanhtba.com
Tân Nam Chinh Logistics: https://tannamchinh.com/gioi-thieu/gioi-thieu.html
Bình Minh Tải: www.binhminhtai.com.vn

101
Chapter 4
A Cold Chain Study of Indonesia
PT Capricorn Indonesia Consult
4.1. Introduction
Background
The cold chain system is a type of supply chain wherein the process aims to maintain
temperature so that the product is maintained during the distribution process. An important
factor in maintaining cold chain products is the correct treatment in each of the main
distribution points in the cold chain so that the right distribution channels will provide good
quality of cold chain products.
The application of cold chains requires the provision of several facilities, both in the storage
and distribution process. In the storage process, it is needed to have, among others, cold
storage and freezing machines, while in the distribution process, it is necessary to have
refrigerated transportation fleets (carriers, aircraft and vehicles).
Cold chain business is a major supporter of various industrial sectors such as the food
processing industry, fishing industry, retail network, pharmaceutical industry and so on.
Indonesia is considered to have a potential market for cold chain business. This is supported
by the user industrial sector, which shows fairly good development. The user industrial
sectors such as livestock, fisheries, processed food and chemical, pharmaceutical and drug
industries are still an important key for national development, and this can be seen from its
contribution to Indonesia’s gross domestic product (GDP) during 2018.
Based on the information from the Central Bureau of Statistics (BPS), in that period, GDP of
the livestock sector had a contribution of 1.5% or Rp231.7 trillion of the total Indonesian GDP
of Rp4,837.3 trillion, the fisheries sector contributed 2.6% of the total GDP, the food and
beverage industry accounted for 6.2% and the chemical, pharmaceutical and drug sector
amounted to 1.6% of Indonesia’s total GDP.
Scope of study
This study aims to discuss more clearly the prospects for cold chain business and the
obstacles faced by this industry. It also discusses the user industry such as the processed food
industry, fisheries industry, agricultural industry, trade industry and pharmaceutical industry.
In addition, this study features information on companies involved in the processed food
industry, fishing industry and pharmaceutical industry. Besides that, it also discusses
government policies that support the cold chain industry and the cold chain market share in
Indonesia.
102
Methodology and source of information
This study was conducted in two ways, namely, desk research and field research. Field
research is performed by conducting interviews with business players or several stakeholders
in related industries in Indonesia that produce primary data. While desk research is obtained
based on the information in the form of studies or data from related institutions such as the
Ministry of Maritime Affairs and Fisheries (KKP), Fishery Products Processing and Marketing
(P2HP), Animal Husbandry and Animal Health, BPS, and Indonesian Cold Chain Associations
(ARPI), which produce secondary data.
In addition, to complete the information, this study also relies on several studies and analyses
originating from the data bank of PT Capricorn Indonesia Consult, Inc. (PT CIC).
4.2. General review on cold storage in Indonesia
National economic development
The prospect of Indonesia’s economy is expected to improve further next year with higher
growth and maintained stability. This growth is triggered by stronger domestic demand by
both consumption and investment, improved export performance and declining imports.
Bank Indonesia (BI) estimates that domestic economic growth will be in the range of 5.5%–
6.1% until 2024.
The improving economic condition in Indonesia will certainly lift the growth of various
industrial sectors, including the processed food industry, fishing industry, agricultural
industry and pharmaceutical industry.
Based on BPS information, the growth rate of the processed food sector during 2014–2018
averaged 5.8% per year. The contribution of the livestock sector averaged 1.5%, the fisheries
sector attained 2.5% per year and the processing pharmaceutical industry reached 1.7% per
year.
In 2018, the processed food industry was the largest in contribution, namely, 6.2% of the
total GDP nationally or reaching Rp927.4 trillion and increased compared with the previous
year (2017), which reached Rp834.4 trillion.
The fisheries sector contributed 2.6% or reached Rp385.9 trillion in 2018. Meanwhile, the
chemical industry and drug sector contributed Rp239.6 trillion, while the livestock industry
contributed 1.5% with a value of Rp231.7 trillion in 2018.
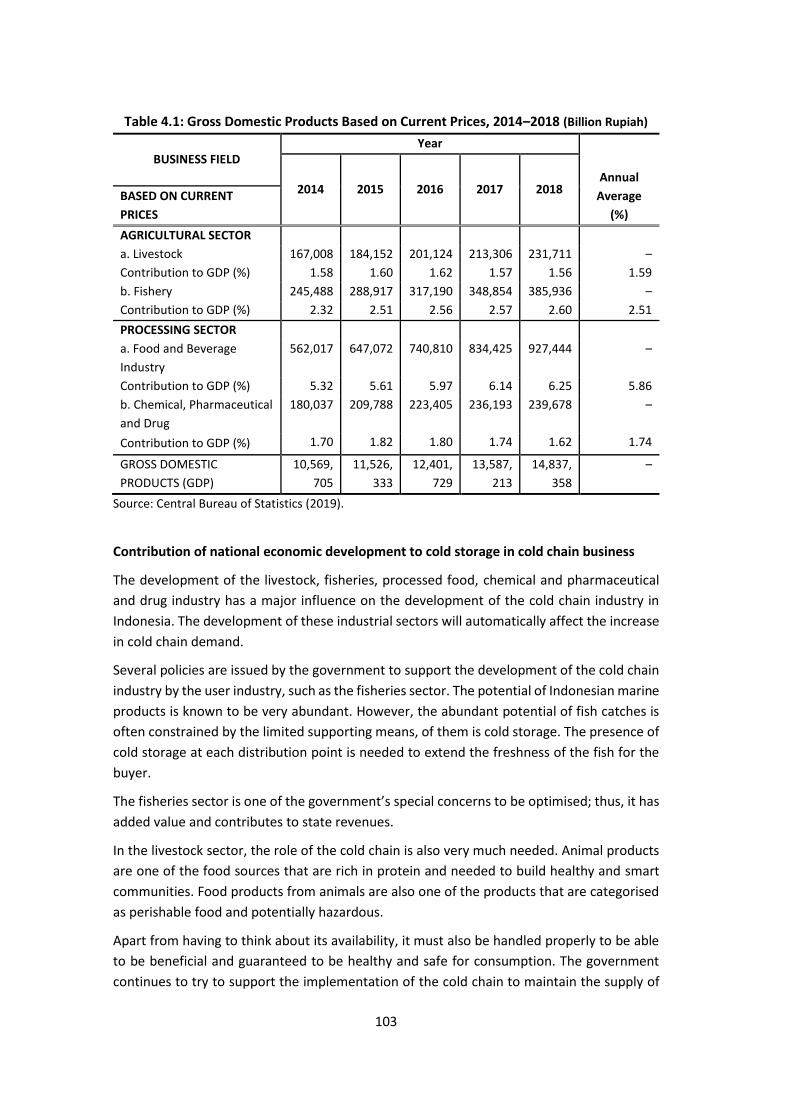
103
Table 4.1: Gross Domestic Products Based on Current Prices, 2014–2018 (Billion Rupiah)
BUSINESS FIELD Year
Annual
Average
(%)
2014 2015 2016 2017 2018 BASED ON CURRENT
PRICES
AGRICULTURAL SECTOR
a. Livestock 167,008 184,152 201,124 213,306 231,711 –
Contribution to GDP (%) 1.58 1.60 1.62 1.57 1.56 1.59
b. Fishery 245,488 288,917 317,190 348,854 385,936 –
Contribution to GDP (%) 2.32 2.51 2.56 2.57 2.60 2.51
PROCESSING SECTOR
a. Food and Beverage
Industry
562,017 647,072 740,810 834,425 927,444 –
Contribution to GDP (%) 5.32 5.61 5.97 6.14 6.25 5.86
b. Chemical, Pharmaceutical
and Drug
180,037 209,788 223,405 236,193 239,678 –
Contribution to GDP (%) 1.70 1.82 1.80 1.74 1.62 1.74
GROSS DOMESTIC
PRODUCTS (GDP)
10,569,
705
11,526,
333
12,401,
729
13,587,
213
14,837,
358
–
Source: Central Bureau of Statistics (2019).
Contribution of national economic development to cold storage in cold chain business
The development of the livestock, fisheries, processed food, chemical and pharmaceutical
and drug industry has a major influence on the development of the cold chain industry in
Indonesia. The development of these industrial sectors will automatically affect the increase
in cold chain demand.
Several policies are issued by the government to support the development of the cold chain
industry by the user industry, such as the fisheries sector. The potential of Indonesian marine
products is known to be very abundant. However, the abundant potential of fish catches is
often constrained by the limited supporting means, of them is cold storage. The presence of
cold storage at each distribution point is needed to extend the freshness of the fish for the
buyer.
The fisheries sector is one of the government’s special concerns to be optimised; thus, it has
added value and contributes to state revenues.
In the livestock sector, the role of the cold chain is also very much needed. Animal products
are one of the food sources that are rich in protein and needed to build healthy and smart
communities. Food products from animals are also one of the products that are categorised
as perishable food and potentially hazardous.
Apart from having to think about its availability, it must also be handled properly to be able
to be beneficial and guaranteed to be healthy and safe for consumption. The government
continues to try to support the implementation of the cold chain to maintain the supply of
104
meat to remain stable nationally and to meet not only domestic needs but also export market
needs.
Likewise, in the pharmaceutical sector and the processed food industry, where cold chains
are indeed needed to maintain good product quality. This condition makes it clear that cold
chain industries also have significant contributions in national economic development.
Obstacles and challenges of cold storage in cold chain business in Indonesia
The development of cold chain business is not as expected as this business has many
challenges and obstacles to face. Among them are obstacles in investment because of
infrastructure problems the lack of fiscal facilities offered by the government.
As is known, 100% raw material of the cold chain industry is still imported, and the
government has not yet agreed to provide duty exemption facility on the component as well
as the provision of tax holiday facilities to build cold storage assembly plants in the country.
Another challenge is the lack of availability of electric power in remote areas. This condition
results in the use of cold chains by the user industry not being optimal. According to
information from ARPI, the installed capacity of the industry is only half of the national
demand.
Seeing the economic development of Indonesia, which is increasingly being supported by
abundant natural resources, these obstacles and challenges can create opportunities, as well
as challenges, for the cold chain industry in the country.
Prospects for cold storage markets in Indonesia
The need for cold storage in cold chain business in Indonesia is still quite high. This is
indicated by almost all cold storage warehouses that are always fully occupied for storing
meat products, fish, vegetable fruits and so on.
In addition, Indonesia’s cold chain market has fairly good prospects, marked by the increasing
Indonesian economic growth, followed by the development of the user industry.
Another indicator is the large population with a consumption pattern that tends to require
efficiency and speed and who likes fresh products such as fresh fruits and vegetables and
processed meat, milk and other products.
Besides that, the development of network retail sector and restaurant chain stores has also
encouraged the development of cold storage business in Indonesia. Most retail networks
have many outlets spread across several locations. This requires handling the availability of
goods professionally and on time, similarly, the export and import business of fishery
products, meat, fruit and vegetables and the ice cream industry.

105
4.3. Development of cold chain products in Indonesia
Cold storage production in cold chain business in Indonesia
To maintain cold storage facilities require a substantial investment. It is not surprising that
many companies do not have their own cold storage facilities for their needs. For this reason,
many of them rent or cooperate with cold storage owners.
It is very difficult to know the amount of cold storage production in Indonesia and can only
be known from the production capacity of cold storage.
Several players involved in this business consist of various business sectors, namely, cold
storage companies, food processing industries, meat importers including slaughterhouses,
fishing industries, ice cream industries, fruit importers, retail networks and pharmaceutical
industries.
Based on a survey conducted by CIC, until the end of 2018, there were around 69 major cold
storage companies throughout Indonesia with a total capacity of 370,000 tons per year. Of
this amount, the largest capacity is owned by PT Enseval Medika Prima Tbk., which has a cold
storage production capacity of 59,000 tons. It is followed by PT Unilever Indonesia (Wall’s ice
cream) with a production capacity of 50,000 tons.
PT Sukanda Djaya ranked third with a total cold storage capacity of 45,000 tons and followed
by other companies such as PT Kiat Ananda Cold Storage, PT Mega Internasional, PT
Indomaguro Tunas Unggul and others as shown in the following table:
Table 4.2: Cold Storage Company and Capacity in Indonesia, 2018
No. Name of Company Capacity
(Ton)
Share
(%)
1 Enseval Putra Megatrading Tbk, PT 59,000 15.9
2 Unilever Indonesia, PT (Wall’s ice cream) 50,000 13.5
3 Sukanda Djaya, PT 45,000 12.2
4 Kiat Ananda Cold Storage, PT 30,000 8.1
5 Mega Internasional Sejahtera, PT 21,000 5.7
6 Indomaguro Tunas Unggul, PT 15,000 4.1
7 Dharma Samudera Fishing Industries, PT 14,000 3.8
8 Savina Cold Storage 9,000 2.4
9 Wahana Cold Storage, PT 7,000 1.9
10 Lion Super Indo, PT/Super Indo 6,600 1.8
11 Bonicom Servistama Compindo, PT 6,000 1.6
12 Central Windu Sejati, PT 6,000 1.6
13 Adib Food Supplies, PT 6,000 1.6
14 Mgm Bosco Logistics, PT 5,500 1.5
15 Perum Perikanan Indonesia 5,100 1.4
16 Bumi MenaraInternusa, PT 5,000 1.4
17 Surya Alam Tunggal, PT 5,000 1.4
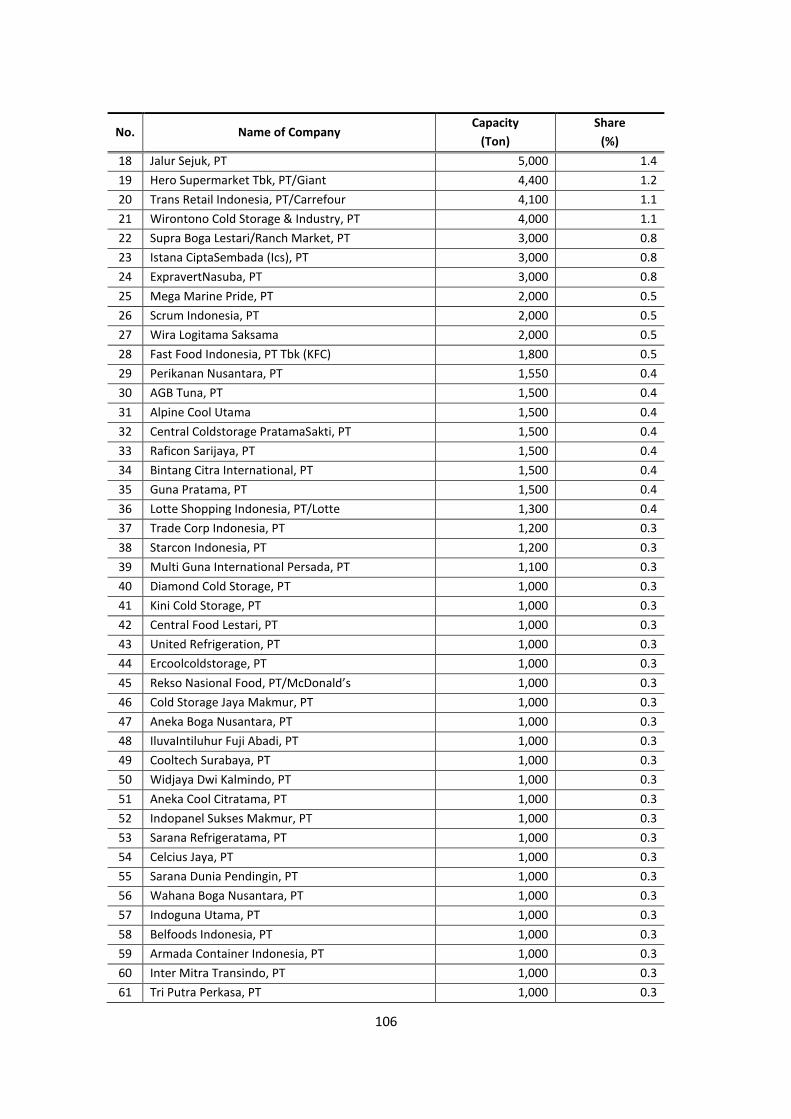
106
No. Name of Company Capacity
(Ton)
Share
(%)
18 Jalur Sejuk, PT 5,000 1.4
19 Hero Supermarket Tbk, PT/Giant 4,400 1.2
20 Trans Retail Indonesia, PT/Carrefour 4,100 1.1
21 Wirontono Cold Storage & Industry, PT 4,000 1.1
22 Supra Boga Lestari/Ranch Market, PT 3,000 0.8
23 Istana CiptaSembada (Ics), PT 3,000 0.8
24 ExpravertNasuba, PT 3,000 0.8
25 Mega Marine Pride, PT 2,000 0.5
26 Scrum Indonesia, PT 2,000 0.5
27 Wira Logitama Saksama 2,000 0.5
28 Fast Food Indonesia, PT Tbk (KFC) 1,800 0.5
29 Perikanan Nusantara, PT 1,550 0.4
30 AGB Tuna, PT 1,500 0.4
31 Alpine Cool Utama 1,500 0.4
32 Central Coldstorage PratamaSakti, PT 1,500 0.4
33 Raficon Sarijaya, PT 1,500 0.4
34 Bintang Citra International, PT 1,500 0.4
35 Guna Pratama, PT 1,500 0.4
36 Lotte Shopping Indonesia, PT/Lotte 1,300 0.4
37 Trade Corp Indonesia, PT 1,200 0.3
38 Starcon Indonesia, PT 1,200 0.3
39 Multi Guna International Persada, PT 1,100 0.3
40 Diamond Cold Storage, PT 1,000 0.3
41 Kini Cold Storage, PT 1,000 0.3
42 Central Food Lestari, PT 1,000 0.3
43 United Refrigeration, PT 1,000 0.3
44 Ercoolcoldstorage, PT 1,000 0.3
45 Rekso Nasional Food, PT/McDonald’s 1,000 0.3
46 Cold Storage Jaya Makmur, PT 1,000 0.3
47 Aneka Boga Nusantara, PT 1,000 0.3
48 IluvaIntiluhur Fuji Abadi, PT 1,000 0.3
49 Cooltech Surabaya, PT 1,000 0.3
50 Widjaya Dwi Kalmindo, PT 1,000 0.3
51 Aneka Cool Citratama, PT 1,000 0.3
52 Indopanel Sukses Makmur, PT 1,000 0.3
53 Sarana Refrigeratama, PT 1,000 0.3
54 Celcius Jaya, PT 1,000 0.3
55 Sarana Dunia Pendingin, PT 1,000 0.3
56 Wahana Boga Nusantara, PT 1,000 0.3
57 Indoguna Utama, PT 1,000 0.3
58 Belfoods Indonesia, PT 1,000 0.3
59 Armada Container Indonesia, PT 1,000 0.3
60 Inter Mitra Transindo, PT 1,000 0.3
61 Tri Putra Perkasa, PT 1,000 0.3
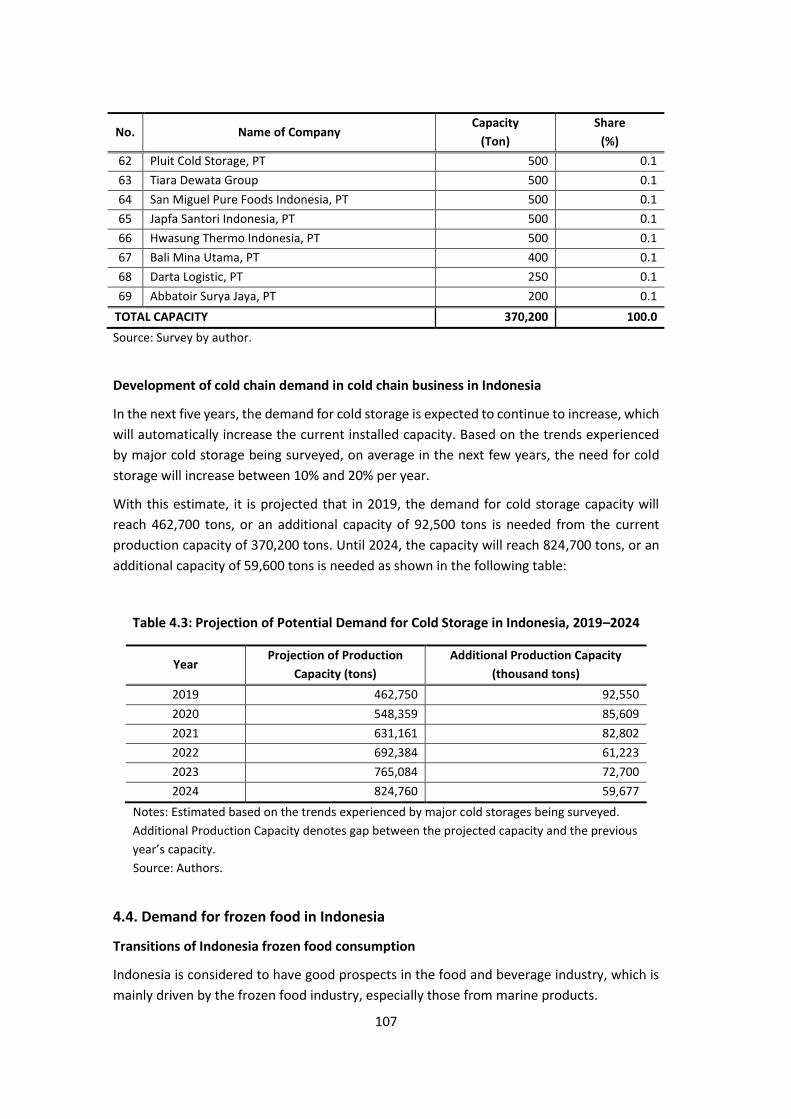
107
No. Name of Company Capacity
(Ton)
Share
(%)
62 Pluit Cold Storage, PT 500 0.1
63 Tiara Dewata Group 500 0.1
64 San Miguel Pure Foods Indonesia, PT 500 0.1
65 Japfa Santori Indonesia, PT 500 0.1
66 Hwasung Thermo Indonesia, PT 500 0.1
67 Bali Mina Utama, PT 400 0.1
68 Darta Logistic, PT 250 0.1
69 Abbatoir Surya Jaya, PT 200 0.1
TOTAL CAPACITY 370,200 100.0
Source: Survey by author.
Development of cold chain demand in cold chain business in Indonesia
In the next five years, the demand for cold storage is expected to continue to increase, which
will automatically increase the current installed capacity. Based on the trends experienced
by major cold storage being surveyed, on average in the next few years, the need for cold
storage will increase between 10% and 20% per year.
With this estimate, it is projected that in 2019, the demand for cold storage capacity will
reach 462,700 tons, or an additional capacity of 92,500 tons is needed from the current
production capacity of 370,200 tons. Until 2024, the capacity will reach 824,700 tons, or an
additional capacity of 59,600 tons is needed as shown in the following table:
Table 4.3: Projection of Potential Demand for Cold Storage in Indonesia, 2019–2024
Year Projection of Production
Capacity (tons)
Additional Production Capacity
(thousand tons)
2019 462,750 92,550
2020 548,359 85,609
2021 631,161 82,802
2022 692,384 61,223
2023 765,084 72,700
2024 824,760 59,677
Notes: Estimated based on the trends experienced by major cold storages being surveyed.
Additional Production Capacity denotes gap between the projected capacity and the previous
year’s capacity.
Source: Authors.
4.4. Demand for frozen food in Indonesia
Transitions of Indonesia frozen food consumption
Indonesia is considered to have good prospects in the food and beverage industry, which is
mainly driven by the frozen food industry, especially those from marine products.

108
The demand for frozen food in recent years is estimated to have been increasing, along with
changes in the pattern of consumption of people, which tend to be fast, practical and
economical but meet nutritional and health needs. With a population of around 260 million,
it is a considerable market potential for the frozen food industry in Indonesia, especially
supported by the increasing public purchasing power.
According to CIC’s observations, in the last five years, the consumption of frozen food has
increased by an average of 6.9% per year. While in 2014, the consumption of frozen food
only reached 5.0 million tons, and in 2015, it increased to 5.5 million tons, up 8.6%. This
condition also occurred in 2016, where frozen food consumption again increased to 5.9
million tons, up 7.4%. Until the end of 2018, frozen food consumption has reached 6.6 million
tons. More information on the development of frozen food consumption during the 2014–
2018 period is presented in the following table:
Table 4.4: Development of Frozen Food Consumption in Indonesia, 2014–2018 (Ton)
Year Production Import Export Consumption Growth (%)
2014 5,629,902 280,360 828,130 5,082,132 –
2015 5,920,708 229,551 631,013 5,519,246 8.6
2016 6,211,514 314,470 600,794 5,925,191 7.4
2017 6,502,321 389,626 621,604 6,270,342 5.8
2018 6,793,127 406,179 568,774 6,630,531 5.7
Annual Average (%) 6.9
Notes: See footnote for frozen foods referred in this discussion. 18 Domestic consumption was
estimated from production + import – export.
Source: Central Bureau of Statistics (2019).
Export of frozen food in Indonesia
Although the frozen food industry has developed in Indonesia, its marketing to the export
market has not been optimal, which has good prospects. Admittedly, there are some
obstacles to export frozen food overseas that must be faced and certainly difficult. For
18 Frozen foods in this discussion consist of HS 02023000, 02032200, 02032900, 02044100, 02069000, 02043000, 02071200, 03031900, 03032300, 03032400, 03032600,03032900, 03033100, 03033300, 03033900, 03034100, 03034200, 03034300, 03034400, 03034600, 03034900, 03035300, 03035410, 03035420, 03035500 up to 03035700, 03035910, 03035920, 03035990, 03036800, 03036900, 03038100, 03038200, 03038400, 03038911, 03038913, 03038914, 03038916 up to 03038919, 03038926 up to 03038929, 03039100, 03039200, 03046100, 03046200, 03046900, 03047900, 03048100 up to 03048400, 03048700 up to 03048900, 03049100, 03049300, 03049600, 03049700, 03049900, 03061110, 03061190, 03061210, 03061290, 03061410, 03061490, 03061500, 03061600, 03061711, 03061719, 03061721, 03061722, 03061729, 03061730, 03061790, 03061900, 03071200, 03072200, 03073200, 03074310, 03074390, 03075200, 03077200, 03078400, 03079200, 03081200, 03083030, 04014020, 04014090, 07101000, 07102100, 07102200, 07102900, 07103000, 07104000, 07108000, 07109000, 07141091, 07142010, 07143010, 07144010, 07149011, 08112000, 08119000, 12122930, 20041000, 20049010, 20049090.
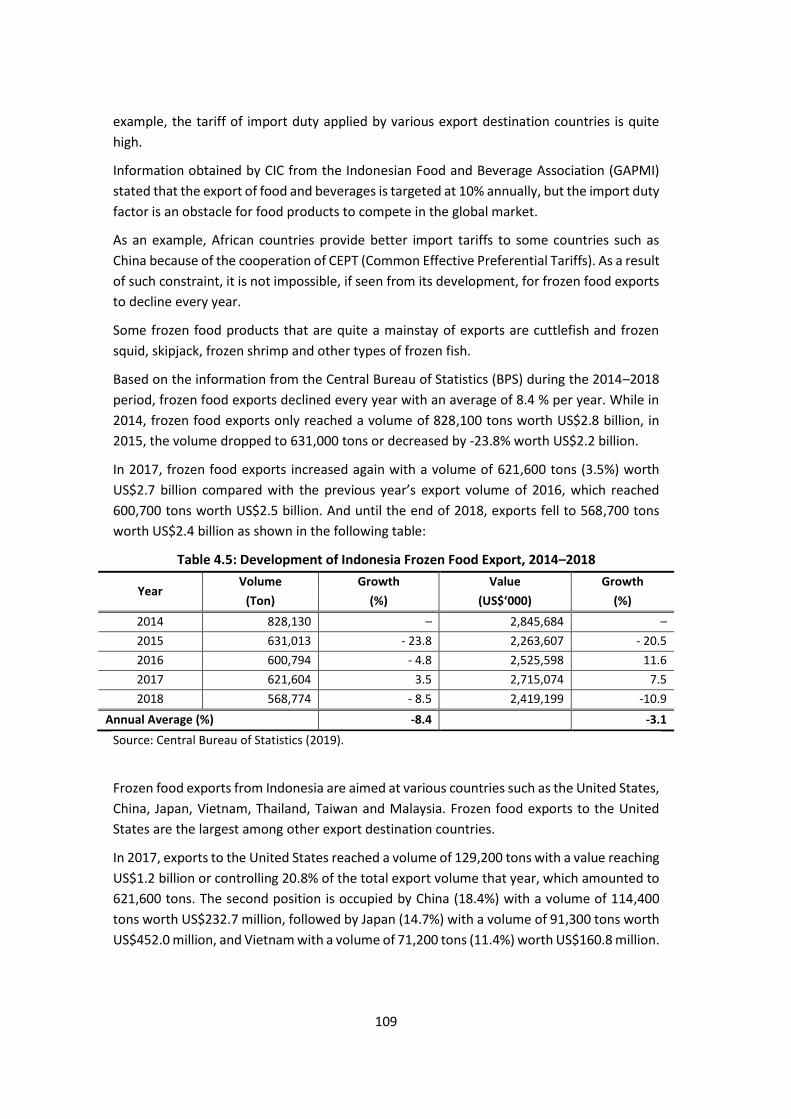
109
example, the tariff of import duty applied by various export destination countries is quite
high.
Information obtained by CIC from the Indonesian Food and Beverage Association (GAPMI)
stated that the export of food and beverages is targeted at 10% annually, but the import duty
factor is an obstacle for food products to compete in the global market.
As an example, African countries provide better import tariffs to some countries such as
China because of the cooperation of CEPT (Common Effective Preferential Tariffs). As a result
of such constraint, it is not impossible, if seen from its development, for frozen food exports
to decline every year.
Some frozen food products that are quite a mainstay of exports are cuttlefish and frozen
squid, skipjack, frozen shrimp and other types of frozen fish.
Based on the information from the Central Bureau of Statistics (BPS) during the 2014–2018
period, frozen food exports declined every year with an average of 8.4 % per year. While in
2014, frozen food exports only reached a volume of 828,100 tons worth US$2.8 billion, in
2015, the volume dropped to 631,000 tons or decreased by -23.8% worth US$2.2 billion.
In 2017, frozen food exports increased again with a volume of 621,600 tons (3.5%) worth
US$2.7 billion compared with the previous year’s export volume of 2016, which reached
600,700 tons worth US$2.5 billion. And until the end of 2018, exports fell to 568,700 tons
worth US$2.4 billion as shown in the following table:
Table 4.5: Development of Indonesia Frozen Food Export, 2014–2018
Year Volume Growth Value Growth
(Ton) (%) (US$‘000) (%)
2014 828,130 – 2,845,684 –
2015 631,013 - 23.8 2,263,607 - 20.5
2016 600,794 - 4.8 2,525,598 11.6
2017 621,604 3.5 2,715,074 7.5
2018 568,774 - 8.5 2,419,199 -10.9
Annual Average (%) -8.4 -3.1
Source: Central Bureau of Statistics (2019).
Frozen food exports from Indonesia are aimed at various countries such as the United States,
China, Japan, Vietnam, Thailand, Taiwan and Malaysia. Frozen food exports to the United
States are the largest among other export destination countries.
In 2017, exports to the United States reached a volume of 129,200 tons with a value reaching
US$1.2 billion or controlling 20.8% of the total export volume that year, which amounted to
621,600 tons. The second position is occupied by China (18.4%) with a volume of 114,400
tons worth US$232.7 million, followed by Japan (14.7%) with a volume of 91,300 tons worth
US$452.0 million, and Vietnam with a volume of 71,200 tons (11.4%) worth US$160.8 million.
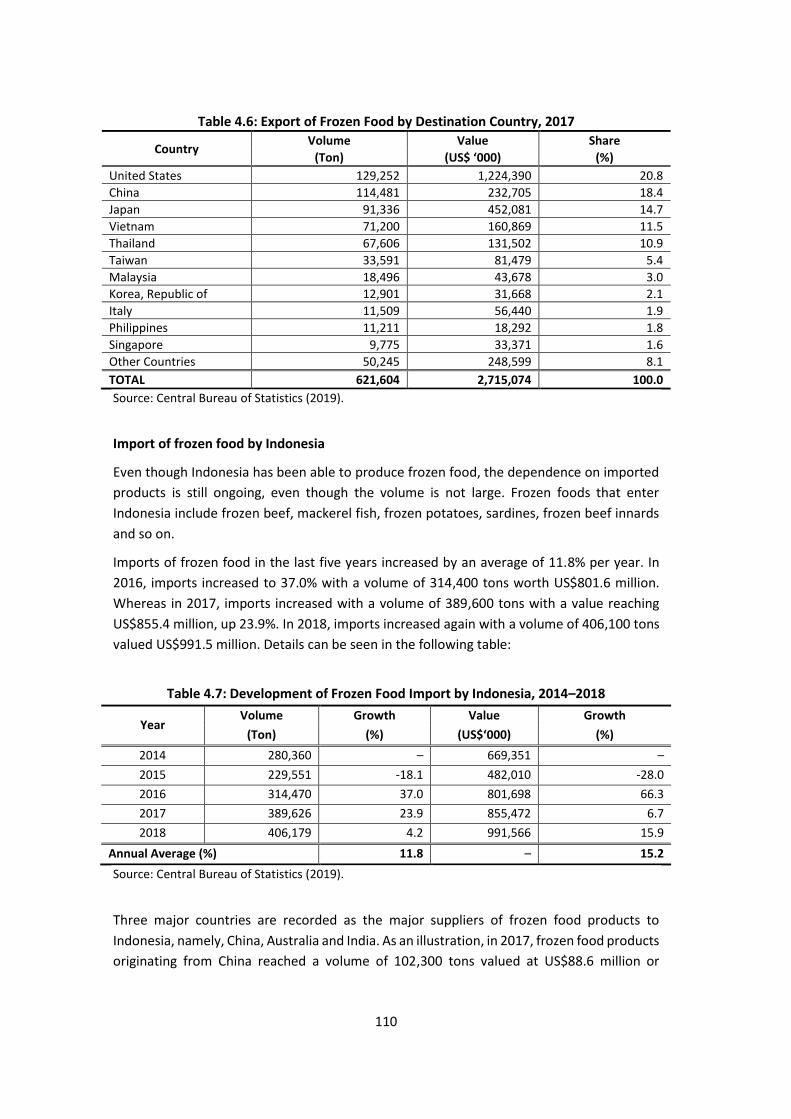
110
Table 4.6: Export of Frozen Food by Destination Country, 2017
Country Volume Value Share
(Ton) (US$ ‘000) (%)
United States 129,252 1,224,390 20.8
China 114,481 232,705 18.4
Japan 91,336 452,081 14.7
Vietnam 71,200 160,869 11.5
Thailand 67,606 131,502 10.9
Taiwan 33,591 81,479 5.4
Malaysia 18,496 43,678 3.0
Korea, Republic of 12,901 31,668 2.1
Italy 11,509 56,440 1.9
Philippines 11,211 18,292 1.8
Singapore 9,775 33,371 1.6
Other Countries 50,245 248,599 8.1
TOTAL 621,604 2,715,074 100.0
Source: Central Bureau of Statistics (2019).
Import of frozen food by Indonesia
Even though Indonesia has been able to produce frozen food, the dependence on imported
products is still ongoing, even though the volume is not large. Frozen foods that enter
Indonesia include frozen beef, mackerel fish, frozen potatoes, sardines, frozen beef innards
and so on.
Imports of frozen food in the last five years increased by an average of 11.8% per year. In
2016, imports increased to 37.0% with a volume of 314,400 tons worth US$801.6 million.
Whereas in 2017, imports increased with a volume of 389,600 tons with a value reaching
US$855.4 million, up 23.9%. In 2018, imports increased again with a volume of 406,100 tons
valued US$991.5 million. Details can be seen in the following table:
Table 4.7: Development of Frozen Food Import by Indonesia, 2014–2018
Year Volume Growth Value Growth
(Ton) (%) (US$‘000) (%)
2014 280,360 – 669,351 –
2015 229,551 -18.1 482,010 -28.0
2016 314,470 37.0 801,698 66.3
2017 389,626 23.9 855,472 6.7
2018 406,179 4.2 991,566 15.9
Annual Average (%) 11.8 – 15.2
Source: Central Bureau of Statistics (2019).
Three major countries are recorded as the major suppliers of frozen food products to
Indonesia, namely, China, Australia and India. As an illustration, in 2017, frozen food products
originating from China reached a volume of 102,300 tons valued at US$88.6 million or
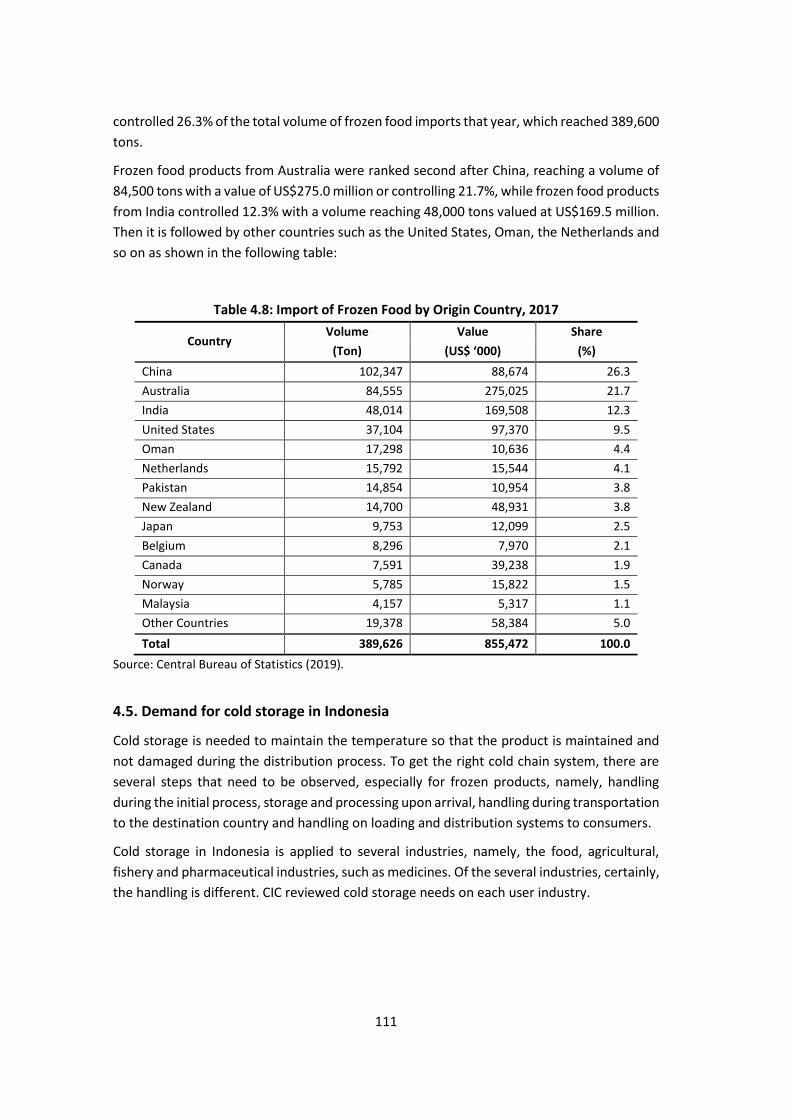
111
controlled 26.3% of the total volume of frozen food imports that year, which reached 389,600
tons.
Frozen food products from Australia were ranked second after China, reaching a volume of
84,500 tons with a value of US$275.0 million or controlling 21.7%, while frozen food products
from India controlled 12.3% with a volume reaching 48,000 tons valued at US$169.5 million.
Then it is followed by other countries such as the United States, Oman, the Netherlands and
so on as shown in the following table:
Table 4.8: Import of Frozen Food by Origin Country, 2017
Country Volume Value Share
(Ton) (US$ ‘000) (%)
China 102,347 88,674 26.3
Australia 84,555 275,025 21.7
India 48,014 169,508 12.3
United States 37,104 97,370 9.5
Oman 17,298 10,636 4.4
Netherlands 15,792 15,544 4.1
Pakistan 14,854 10,954 3.8
New Zealand 14,700 48,931 3.8
Japan 9,753 12,099 2.5
Belgium 8,296 7,970 2.1
Canada 7,591 39,238 1.9
Norway 5,785 15,822 1.5
Malaysia 4,157 5,317 1.1
Other Countries 19,378 58,384 5.0
Total 389,626 855,472 100.0
Source: Central Bureau of Statistics (2019).
4.5. Demand for cold storage in Indonesia
Cold storage is needed to maintain the temperature so that the product is maintained and
not damaged during the distribution process. To get the right cold chain system, there are
several steps that need to be observed, especially for frozen products, namely, handling
during the initial process, storage and processing upon arrival, handling during transportation
to the destination country and handling on loading and distribution systems to consumers.
Cold storage in Indonesia is applied to several industries, namely, the food, agricultural,
fishery and pharmaceutical industries, such as medicines. Of the several industries, certainly,
the handling is different. CIC reviewed cold storage needs on each user industry.
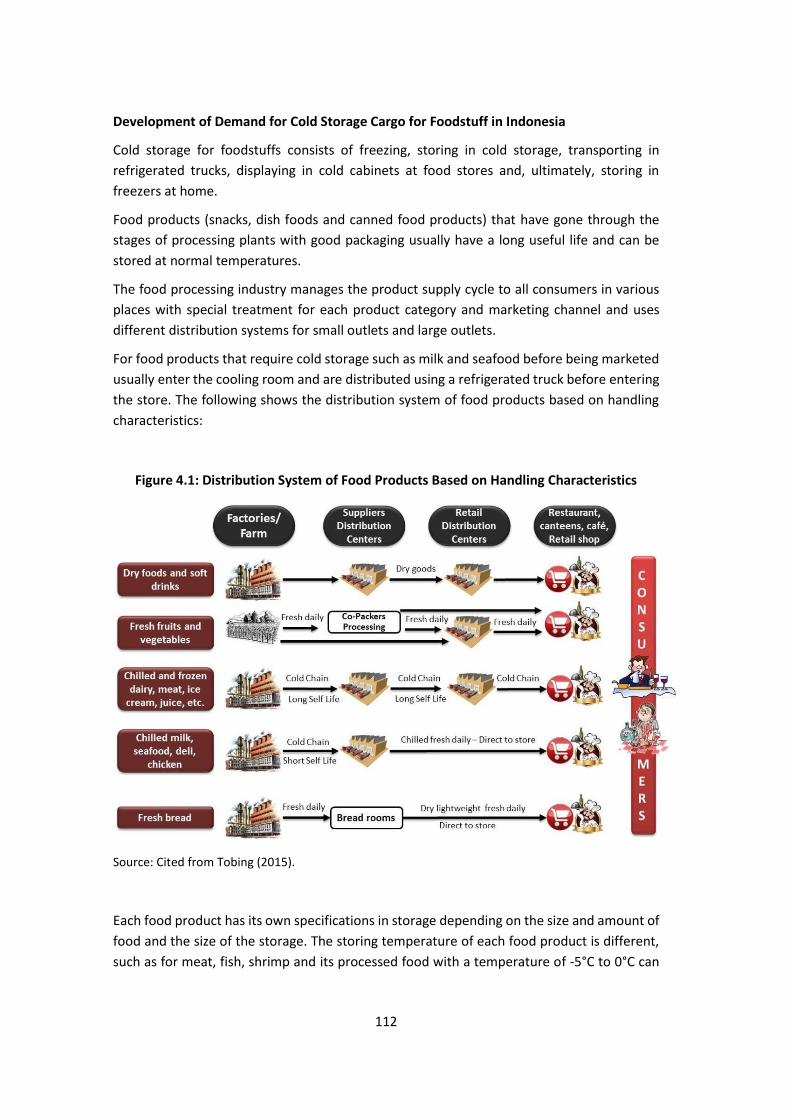
112
Development of Demand for Cold Storage Cargo for Foodstuff in Indonesia
Cold storage for foodstuffs consists of freezing, storing in cold storage, transporting in
refrigerated trucks, displaying in cold cabinets at food stores and, ultimately, storing in
freezers at home.
Food products (snacks, dish foods and canned food products) that have gone through the
stages of processing plants with good packaging usually have a long useful life and can be
stored at normal temperatures.
The food processing industry manages the product supply cycle to all consumers in various
places with special treatment for each product category and marketing channel and uses
different distribution systems for small outlets and large outlets.
For food products that require cold storage such as milk and seafood before being marketed
usually enter the cooling room and are distributed using a refrigerated truck before entering
the store. The following shows the distribution system of food products based on handling
characteristics:
Figure 4.1: Distribution System of Food Products Based on Handling Characteristics
Source: Cited from Tobing (2015).
Each food product has its own specifications in storage depending on the size and amount of
food and the size of the storage. The storing temperature of each food product is different,
such as for meat, fish, shrimp and its processed food with a temperature of -5°C to 0°C can
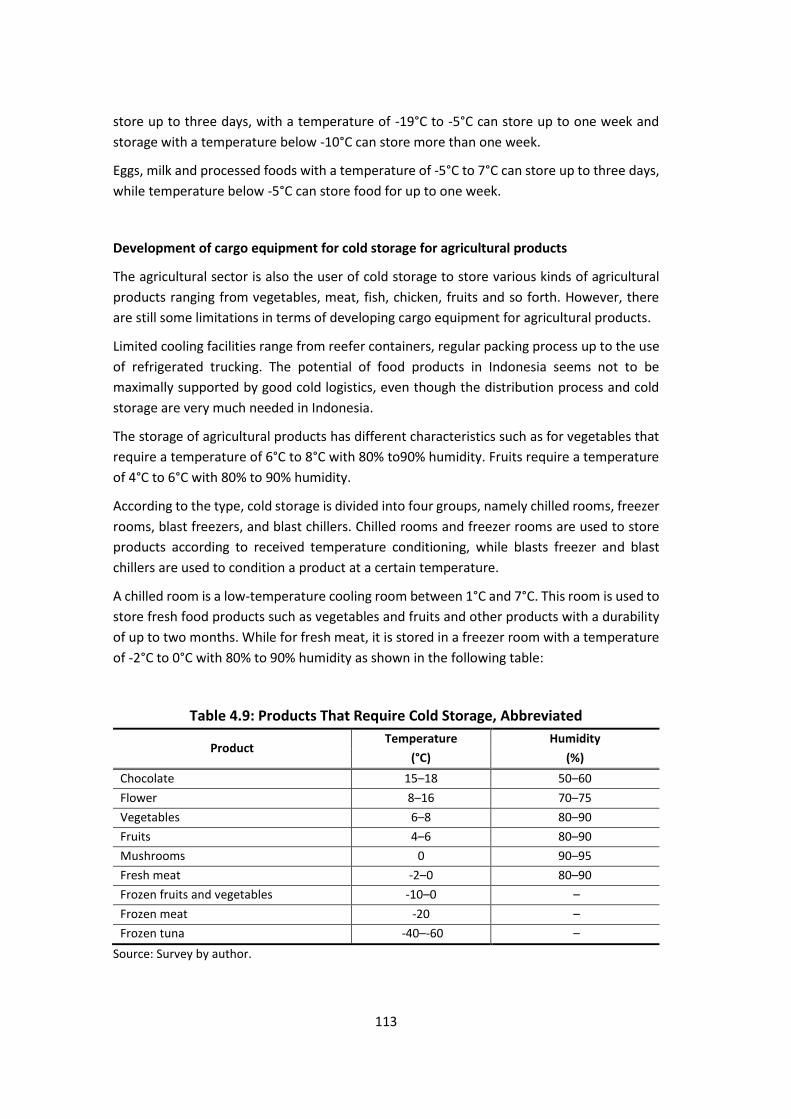
113
store up to three days, with a temperature of -19°C to -5°C can store up to one week and
storage with a temperature below -10°C can store more than one week.
Eggs, milk and processed foods with a temperature of -5°C to 7°C can store up to three days,
while temperature below -5°C can store food for up to one week.
Development of cargo equipment for cold storage for agricultural products
The agricultural sector is also the user of cold storage to store various kinds of agricultural
products ranging from vegetables, meat, fish, chicken, fruits and so forth. However, there
are still some limitations in terms of developing cargo equipment for agricultural products.
Limited cooling facilities range from reefer containers, regular packing process up to the use
of refrigerated trucking. The potential of food products in Indonesia seems not to be
maximally supported by good cold logistics, even though the distribution process and cold
storage are very much needed in Indonesia.
The storage of agricultural products has different characteristics such as for vegetables that
require a temperature of 6°C to 8°C with 80% to90% humidity. Fruits require a temperature
of 4°C to 6°C with 80% to 90% humidity.
According to the type, cold storage is divided into four groups, namely chilled rooms, freezer
rooms, blast freezers, and blast chillers. Chilled rooms and freezer rooms are used to store
products according to received temperature conditioning, while blasts freezer and blast
chillers are used to condition a product at a certain temperature.
A chilled room is a low-temperature cooling room between 1°C and 7°C. This room is used to
store fresh food products such as vegetables and fruits and other products with a durability
of up to two months. While for fresh meat, it is stored in a freezer room with a temperature
of -2°C to 0°C with 80% to 90% humidity as shown in the following table:
Table 4.9: Products That Require Cold Storage, Abbreviated
Product Temperature Humidity
(°C) (%)
Chocolate 15–18 50–60
Flower 8–16 70–75
Vegetables 6–8 80–90
Fruits 4–6 80–90
Mushrooms 0 90–95
Fresh meat -2–0 80–90
Frozen fruits and vegetables -10–0 –
Frozen meat -20 –
Frozen tuna -40–-60 –
Source: Survey by author.

114
Based on the information from ARPI, Indonesia currently lacks a cold chain for agricultural
commodities. Indonesia needs facilities and cold chains to support national cargo so that the
transportation of agricultural products can be optimised.
According to ARPI, currently, the capacity of refrigerated trucks is only around 3,000 units
with a capacity of 15,000 tons per day or only 10% of the needs, which reach an average of
150,000 tons per day.
This condition is certainly very unfortunate considering the agricultural sector, especially
livestock, is a potential market for cold chain sector. As an illustration, meat production,
especially chicken, on average, increased to 7.3% annually; pork increased to 2.1% per year
and lamb and goat meat averaged to 1.7% per year.
The production of beef and buffalo fell -0.1%. Chicken production in 2018 reached 2.6 million
tons, beef and buffalo production reached 527,000 tons, lamb and goat meat production
reached 115,000 tons and pork production reached 327,000 tons.
Figure 4.2: Development of Meat Production, 2014–2018
Source: Director General of Animal Husbandry, Ministry of Agriculture (2019).
Chicken production increased over a period of five years (2014–2018) during which period,
the production increased by an average of 8.4% per year. While in 2014, the production of
chicken meat reached 1.6 million tons with a population reaching 1.5 billion, in 2015, it
increased to 1.7 million tons with a population of layers and broilers of 1.6 billion tails.
In 2018, the production of chicken meat has reached 2.6 million tons, up 4.6%, compared
with the production in 2017, which was only 2.1 million tons, similar with the population as
seen in the table of population and production development of layers and broilers below:
2014 2015 2016 2017 2018
Cow & Buffalo 532,900 542,100 550,400 515,700 527,900
Sheep & Goat 108,700 109,400 113,700 125,500 115,600
Chicken 1,978,600 2,071,500 2,349,700 2,505,700 2,620,000
Pig 302,300 330,200 339,600 317,400 327,200
0
500,000
1,000,000
1,500,000
2,000,000
2,500,000
3,000,000
(To
n)
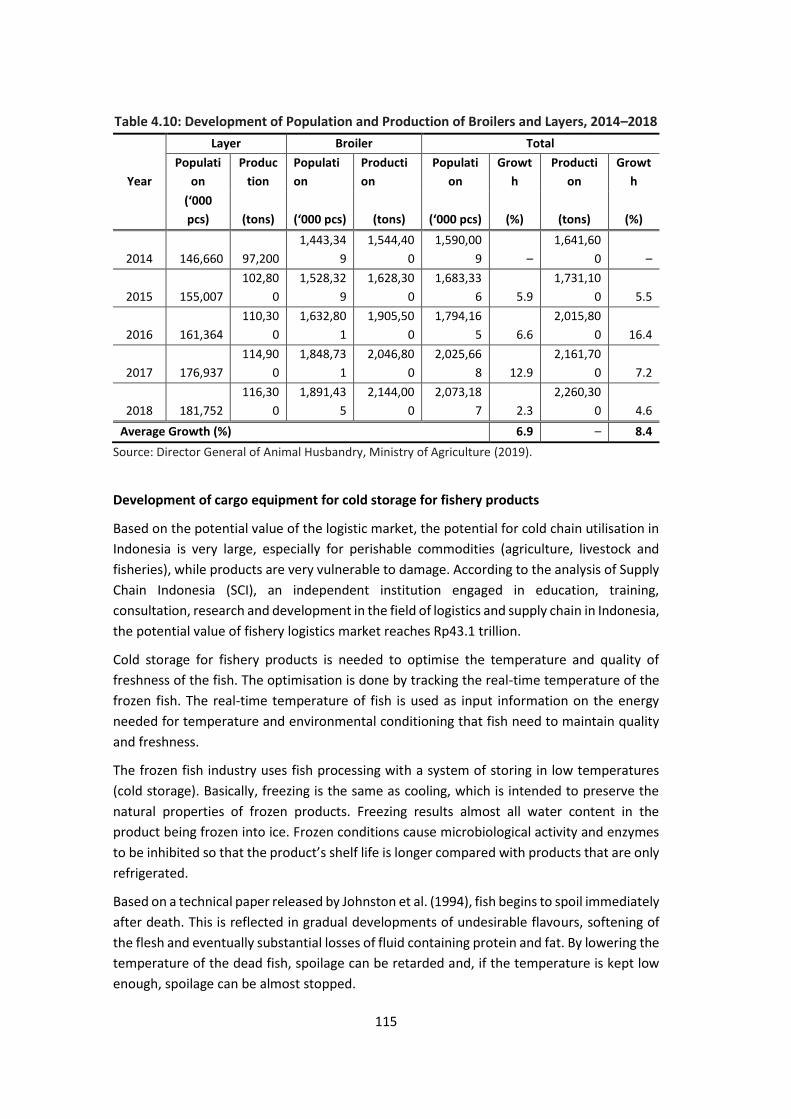
115
Table 4.10: Development of Population and Production of Broilers and Layers, 2014–2018
Year
Layer Broiler Total
Populati
on
Produc
tion
Populati
on
Producti
on
Populati
on
Growt
h
Producti
on
Growt
h
(‘000
pcs) (tons) (‘000 pcs) (tons) (‘000 pcs) (%) (tons) (%)
2014 146,660 97,200
1,443,34
9
1,544,40
0
1,590,00
9 –
1,641,60
0 –
2015 155,007
102,80
0
1,528,32
9
1,628,30
0
1,683,33
6 5.9
1,731,10
0 5.5
2016 161,364
110,30
0
1,632,80
1
1,905,50
0
1,794,16
5 6.6
2,015,80
0 16.4
2017 176,937
114,90
0
1,848,73
1
2,046,80
0
2,025,66
8 12.9
2,161,70
0 7.2
2018 181,752
116,30
0
1,891,43
5
2,144,00
0
2,073,18
7 2.3
2,260,30
0 4.6
Average Growth (%) 6.9 – 8.4
Source: Director General of Animal Husbandry, Ministry of Agriculture (2019).
Development of cargo equipment for cold storage for fishery products
Based on the potential value of the logistic market, the potential for cold chain utilisation in
Indonesia is very large, especially for perishable commodities (agriculture, livestock and
fisheries), while products are very vulnerable to damage. According to the analysis of Supply
Chain Indonesia (SCI), an independent institution engaged in education, training,
consultation, research and development in the field of logistics and supply chain in Indonesia,
the potential value of fishery logistics market reaches Rp43.1 trillion.
Cold storage for fishery products is needed to optimise the temperature and quality of
freshness of the fish. The optimisation is done by tracking the real-time temperature of the
frozen fish. The real-time temperature of fish is used as input information on the energy
needed for temperature and environmental conditioning that fish need to maintain quality
and freshness.
The frozen fish industry uses fish processing with a system of storing in low temperatures
(cold storage). Basically, freezing is the same as cooling, which is intended to preserve the
natural properties of frozen products. Freezing results almost all water content in the
product being frozen into ice. Frozen conditions cause microbiological activity and enzymes
to be inhibited so that the product’s shelf life is longer compared with products that are only
refrigerated.
Based on a technical paper released by Johnston et al. (1994), fish begins to spoil immediately
after death. This is reflected in gradual developments of undesirable flavours, softening of
the flesh and eventually substantial losses of fluid containing protein and fat. By lowering the
temperature of the dead fish, spoilage can be retarded and, if the temperature is kept low
enough, spoilage can be almost stopped.
116
Rigor mortis, over a period of hours or days soon after death, can have a bearing on handling
and processing. In some species the reaction can be strong, especially if the fish has not been
chilled. The muscles under strain tend to contract, therefore, some of the tissue may break,
especially if the fish is roughly handled, leaving the flesh broken and falling apart. If the
muscles are cut before or during rigor, they will contract and in this way fillets from fish can
shrink and acquire a somewhat rubbery texture. In many species, however, rigor mortis is
not strong enough to be of much significance.
The freezing process alone is not a method of preservation. It is merely the means of
preparing the fish for storage at a suitably low temperature. In order to produce a good
product, freezing must be accomplished quickly. A freezer requires to be specially designed
for this purpose and thus freezing is a separate process from low temperature storage. Fish
that are being frozen slowly cannot be used as ingredients for certain processing such as
canning, fumigation and so on. Based on the above considerations, besides to shorten the
time and produce high output, fish must be frozen quickly.
Frozen fish need to be stored in suitable conditions to maintain its quality. Usually, frozen
fish are stored in cold storage. This storage is the main stage of preservation and freezing
method. The temperature normally recommended for cold storage is generally -30°C to -
60°C, depending on needs.
To get an appropriate cold chain system, there are four critical stages that must be observed,
namely, handling on the initial process, storing and processing when arriving on land,
handling when transporting to the destination place and handling on loading and distribution
systems to consumers.
In developing fish handling devices with cold chains, there are various system elements that
must be met. First, the sensor is used to measure the temperature of the product and the
environment. This temperature measurement is the key to preventing damage to fish. In
further development, sensors are also used to measure humidity, moisture content and
freshness of fish products. Second, the transmitter system is used to transmit/send data
information to communications networks. Transmitter usually has become one package in
the sensor and battery. Last, communication networks are used to build connections among
supply chains.
The technology that is developing in the digital era and is compatible with cold chain
communication networks, among others, is the Internet of Things (IoT). Development
Internet networks now allow users to perform monitoring and handling of aquaculture
wherever and whenever. IoT is also a device that can be used long term because future
Internet networks will be increasingly widespread and evenly distributed.
As with the agricultural sector, the cold chain needs for the fisheries sector are also still
minimal. Even though cold chain system is one of the most important components in the
supply chain of fishery products in Indonesia so that it is not quickly damaged, special
handling is needed to keep the fish fresh and have high quality.
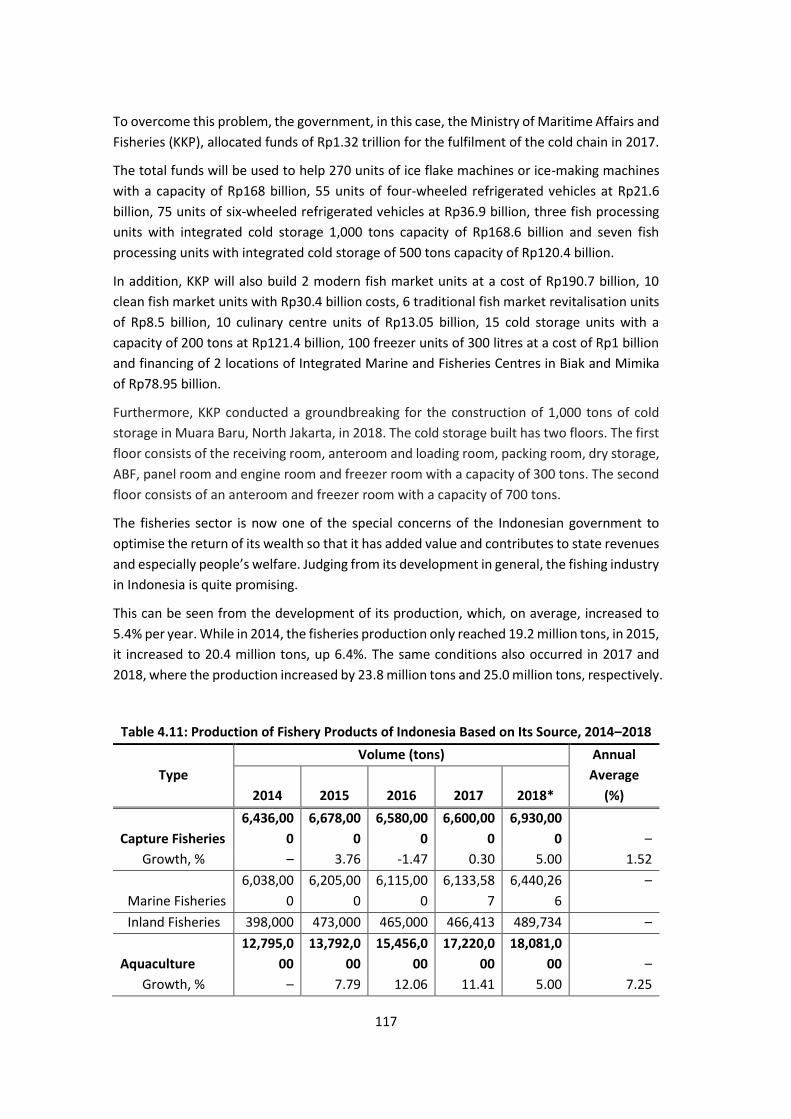
117
To overcome this problem, the government, in this case, the Ministry of Maritime Affairs and
Fisheries (KKP), allocated funds of Rp1.32 trillion for the fulfilment of the cold chain in 2017.
The total funds will be used to help 270 units of ice flake machines or ice-making machines
with a capacity of Rp168 billion, 55 units of four-wheeled refrigerated vehicles at Rp21.6
billion, 75 units of six-wheeled refrigerated vehicles at Rp36.9 billion, three fish processing
units with integrated cold storage 1,000 tons capacity of Rp168.6 billion and seven fish
processing units with integrated cold storage of 500 tons capacity of Rp120.4 billion.
In addition, KKP will also build 2 modern fish market units at a cost of Rp190.7 billion, 10
clean fish market units with Rp30.4 billion costs, 6 traditional fish market revitalisation units
of Rp8.5 billion, 10 culinary centre units of Rp13.05 billion, 15 cold storage units with a
capacity of 200 tons at Rp121.4 billion, 100 freezer units of 300 litres at a cost of Rp1 billion
and financing of 2 locations of Integrated Marine and Fisheries Centres in Biak and Mimika
of Rp78.95 billion.
Furthermore, KKP conducted a groundbreaking for the construction of 1,000 tons of cold
storage in Muara Baru, North Jakarta, in 2018. The cold storage built has two floors. The first
floor consists of the receiving room, anteroom and loading room, packing room, dry storage,
ABF, panel room and engine room and freezer room with a capacity of 300 tons. The second
floor consists of an anteroom and freezer room with a capacity of 700 tons.
The fisheries sector is now one of the special concerns of the Indonesian government to
optimise the return of its wealth so that it has added value and contributes to state revenues
and especially people’s welfare. Judging from its development in general, the fishing industry
in Indonesia is quite promising.
This can be seen from the development of its production, which, on average, increased to
5.4% per year. While in 2014, the fisheries production only reached 19.2 million tons, in 2015,
it increased to 20.4 million tons, up 6.4%. The same conditions also occurred in 2017 and
2018, where the production increased by 23.8 million tons and 25.0 million tons, respectively.
Table 4.11: Production of Fishery Products of Indonesia Based on Its Source, 2014–2018
Type
Volume (tons) Annual
Average
(%) 2014 2015 2016 2017 2018*
Capture Fisheries
6,436,00
0
6,678,00
0
6,580,00
0
6,600,00
0
6,930,00
0 –
Growth, % – 3.76 -1.47 0.30 5.00 1.52
Marine Fisheries
6,038,00
0
6,205,00
0
6,115,00
0
6,133,58
7
6,440,26
6
–
Inland Fisheries 398,000 473,000 465,000 466,413 489,734 –
Aquaculture
12,795,0
00
13,792,0
00
15,456,0
00
17,220,0
00
18,081,0
00 –
Growth, % – 7.79 12.06 11.41 5.00 7.25

118
Type
Volume (tons) Annual
Average
(%) 2014 2015 2016 2017 2018*
Marine Culture
8,379,00
0
9,035,00
0
9,773,00
0
10,888,3
97
11,432,8
17
–
Pond, Brackish
Water
2,345,00
0
2,428,00
0
3,012,00
0
3,355,76
1
3,523,54
9
–
Pond, Fresh
Water
1,774,00
0
1,964,00
0
2,289,00
0
2,550,24
5
2,677,75
7
–
Cage Cultivation 200,000 221,000 204,000 227,283 238,647 –
Paddy Field 97,000 144,000 178,000 198,315 208,231 –
TOTAL
19,231,0
00
20,470,0
00
22,036,0
00
23,820,0
00
25,011,0
00
–
Growth, % – 6.44 7.65 8.10 5.00 5.44
* Preliminary value
Source: Ministry of Maritime Affairs and Fisheries (2018).
Meanwhile, if viewed from the company side the frozen industry of fishery products has
developed quite a long time. Based on CIC’s records, there are currently around 59
companies involved in this business and spread throughout Indonesia with a total capacity
of 816,800 tons.
Based on the region, East Java province is the largest with 21 companies engaged in the
frozen fish sector. It is followed by Central Java and Jakarta as many as six companies, South
Sulawesi and Bali as many as four companies and other regions such as Bali, Lampung, South
Kalimantan, West Java and West Sumatra to the Papua region.
Of the 59 companies, PT Bone Commercial Company (Bonecom) is the oldest. PT Bonecom is
located in Makassar, South Sulawesi, and founded in 1960. PT Bonecom has a frozen goods
production capacity of 12,300 tons per year consisting of frozen shrimp of 4,000 tons, frozen
tuna/skipjack of 5,000 tons, frozen bony fillets of 2,500 tons and frozen sunfish fillets of 800
tons. In addition, PT Bonecom also has a cold storage capacity of 14,700 tons per year.
In addition to Bonecom, another company that is long in the frozen fish business is PT
Diamond Cold Storage, located in Ancol, North Jakarta. The company was founded in 1970.
In addition to being known as a company that deals with ice cream and soft drink industry, it
is also involved in the frozen fish business with a capacity of 2,000 tons per year. Besides in
Jakarta, this company has branches in Cimahi, West Java, Yogyakarta and Surabaya.
When viewed from its production capacity, the company that has the largest frozen fish
capacity is PT Central Proteina PrimaTbk with a production capacity of 400,000 tons per year.
The company that has existed in the field of animal feed business, in 2007, also expanded
into the frozen shrimp industry in the Tulang Bawang region, Lampung, with a capacity of 1.6
million tons per year. See the following table for more information:

119
Table 4.12: Frozen Fish and Shrimp Company in Indonesia, 2018
No Name of Company Year
Established Location
Production
Capacity
(tons)
1 Bali Mina Utama, PT 1987 Bali 4,670
2
Canning Indonesian
Products, PT 1948 Bali 2
3
Industri PerikananTerpadu
Chiu Shih, PT 1996 Bali 160
4 Sari Segar Laut Indonesia, PT 2002 Bali 3,000
5 Aorta, PT 1979 Central Java 1,000
6 Aquafarm Nusantara, PT 1998 Central Java 1,200
7 Karya Mina Putra, CV 1996 Central Java 6,500
8 Maya Food Industries, PT 1995 Central Java 5,000
9 Seafer General Food, PT 1991 Central Java 10,000
10 Toxindo Prima, PT 1997 Central Java 540
11 Aneka Boga Nusantara, PT 1998 East Java 1,000
12 Aneka Tuna Indonesia, PT 1991 East Java 650
13 Bumi Menara Internusa, PT 1985 East Java 5,000
14 Bumi Pangan Utama, PT 1996 East Java 7,000
15
Central Proteina PrimaTbk,
PT 1996 East Java 400,000
16
Charoen Pokphand Indonesia
Tbk, PT 1996 East Java 36,000
17 Ciomas Adisatwa, PT 1987 East Java 6,000
18 IluvaIntiluhur Fuji Abadi, PT 1997 East Java 700
19 Istana Cipta Sembada, PT 1987 East Java 1,500
20 Kelola Mina Laut Gresik, PT 1994 East Java 7,000
21 Marine Cipta Agung, PT 1994 East Java 1,800
22 Megamarine Pride, PT 1992 East Java 2,000
23 Rex Canning, PT 1990 East Java 5,000
24 Scrum Marine, PT 1997 East Java 2,100
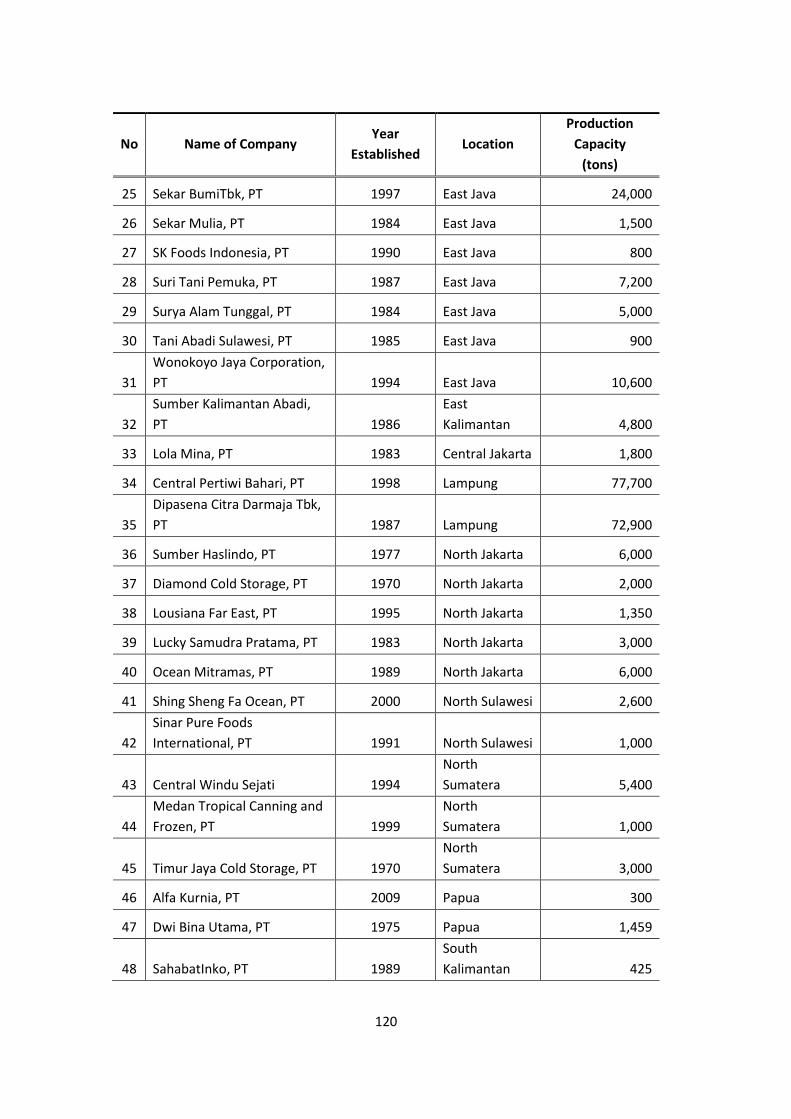
120
No Name of Company Year
Established Location
Production
Capacity
(tons)
25 Sekar BumiTbk, PT 1997 East Java 24,000
26 Sekar Mulia, PT 1984 East Java 1,500
27 SK Foods Indonesia, PT 1990 East Java 800
28 Suri Tani Pemuka, PT 1987 East Java 7,200
29 Surya Alam Tunggal, PT 1984 East Java 5,000
30 Tani Abadi Sulawesi, PT 1985 East Java 900
31
Wonokoyo Jaya Corporation,
PT 1994 East Java 10,600
32
Sumber Kalimantan Abadi,
PT 1986
East
Kalimantan 4,800
33 Lola Mina, PT 1983 Central Jakarta 1,800
34 Central Pertiwi Bahari, PT 1998 Lampung 77,700
35
Dipasena Citra Darmaja Tbk,
PT 1987 Lampung 72,900
36 Sumber Haslindo, PT 1977 North Jakarta 6,000
37 Diamond Cold Storage, PT 1970 North Jakarta 2,000
38 Lousiana Far East, PT 1995 North Jakarta 1,350
39 Lucky Samudra Pratama, PT 1983 North Jakarta 3,000
40 Ocean Mitramas, PT 1989 North Jakarta 6,000
41 Shing Sheng Fa Ocean, PT 2000 North Sulawesi 2,600
42
Sinar Pure Foods
International, PT 1991 North Sulawesi 1,000
43 Central Windu Sejati 1994
North
Sumatera 5,400
44
Medan Tropical Canning and
Frozen, PT 1999
North
Sumatera 1,000
45 Timur Jaya Cold Storage, PT 1970
North
Sumatera 3,000
46 Alfa Kurnia, PT 2009 Papua 300
47 Dwi Bina Utama, PT 1975 Papua 1,459
48 SahabatInko, PT 1989
South
Kalimantan 425

121
No Name of Company Year
Established Location
Production
Capacity
(tons)
49
Samarinda Cendana Cold
Storage& Industry, PT 1975
South
Kalimantan 1,800
50
Bone Commercial Company,
PT 1960 South Sulawesi 12,300
51
Dharma Samudera Fishing
Industries, PT 1999 South Sulawesi 25,200
52 South Suco, PT 1989 South Sulawesi 5,200
53 WahyuPradanaBinamulia, PT 1996 South Sulawesi 3,700
54 Lauraindo, PT 1990
South
Sumatera 720
55 Fega Aquafarmindo, PT 1983 Tangerang 4,900
56 Grobest Indomakmur, PT 1989 Tangerang 180
57 Adijaya Guna Satwatama, PT 1998 West Java 3,400
58 Frozen Foods Pahala, PT 1998 West Java 900
59 Danitama Mina, PT 1989
West
Sumatera 10,000
TOTAL 816,856
Source: Survey by author.
Development of cargo equipment for cold storage for processed foods
The growth of the processed food industry sector in Indonesia has not yet been matched by
the presence of the food cold chain industry, which has an installed capacity of only 50% of
national needs. For this reason, in food industry policy in the context of implementing the
industry 4.0 roadmap, the government will make improvements by building a better cold
chain network.
The processed food industries that are highly depending on cold chain systems include the
sausage and nugget industry. In addition, there are also burgers, meatballs, corned beef,
smoked meat and roulades, all of which must pass the sterilisation process to increase the
durability of the product. Cold chains are needed starting from raw materials, processing, up
to the product ready to consume by consumers because it must be stored in the refrigerator
to extend its durability.
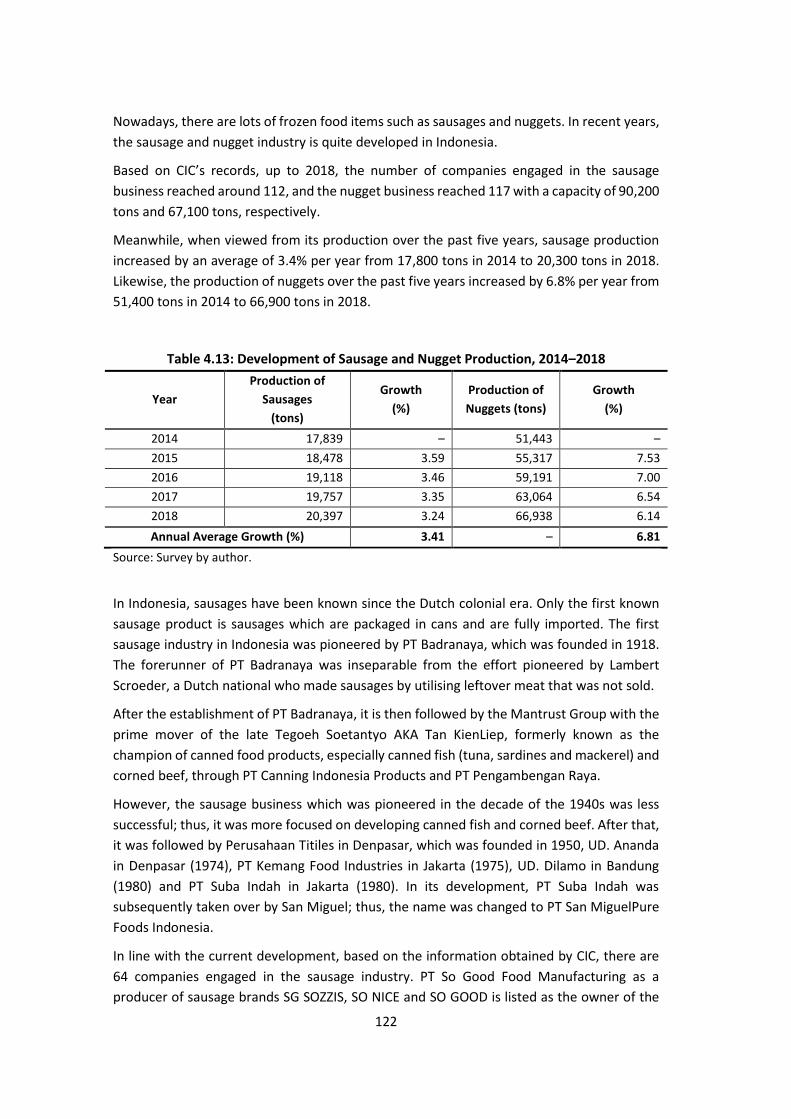
122
Nowadays, there are lots of frozen food items such as sausages and nuggets. In recent years,
the sausage and nugget industry is quite developed in Indonesia.
Based on CIC’s records, up to 2018, the number of companies engaged in the sausage
business reached around 112, and the nugget business reached 117 with a capacity of 90,200
tons and 67,100 tons, respectively.
Meanwhile, when viewed from its production over the past five years, sausage production
increased by an average of 3.4% per year from 17,800 tons in 2014 to 20,300 tons in 2018.
Likewise, the production of nuggets over the past five years increased by 6.8% per year from
51,400 tons in 2014 to 66,900 tons in 2018.
Table 4.13: Development of Sausage and Nugget Production, 2014–2018
Year
Production of
Sausages
(tons)
Growth
(%)
Production of
Nuggets (tons)
Growth
(%)
2014 17,839 – 51,443 –
2015 18,478 3.59 55,317 7.53
2016 19,118 3.46 59,191 7.00
2017 19,757 3.35 63,064 6.54
2018 20,397 3.24 66,938 6.14
Annual Average Growth (%) 3.41 – 6.81
Source: Survey by author.
In Indonesia, sausages have been known since the Dutch colonial era. Only the first known
sausage product is sausages which are packaged in cans and are fully imported. The first
sausage industry in Indonesia was pioneered by PT Badranaya, which was founded in 1918.
The forerunner of PT Badranaya was inseparable from the effort pioneered by Lambert
Scroeder, a Dutch national who made sausages by utilising leftover meat that was not sold.
After the establishment of PT Badranaya, it is then followed by the Mantrust Group with the
prime mover of the late Tegoeh Soetantyo AKA Tan KienLiep, formerly known as the
champion of canned food products, especially canned fish (tuna, sardines and mackerel) and
corned beef, through PT Canning Indonesia Products and PT Pengambengan Raya.
However, the sausage business which was pioneered in the decade of the 1940s was less
successful; thus, it was more focused on developing canned fish and corned beef. After that,
it was followed by Perusahaan Titiles in Denpasar, which was founded in 1950, UD. Ananda
in Denpasar (1974), PT Kemang Food Industries in Jakarta (1975), UD. Dilamo in Bandung
(1980) and PT Suba Indah in Jakarta (1980). In its development, PT Suba Indah was
subsequently taken over by San Miguel; thus, the name was changed to PT San MiguelPure
Foods Indonesia.
In line with the current development, based on the information obtained by CIC, there are
64 companies engaged in the sausage industry. PT So Good Food Manufacturing as a
producer of sausage brands SG SOZZIS, SO NICE and SO GOOD is listed as the owner of the
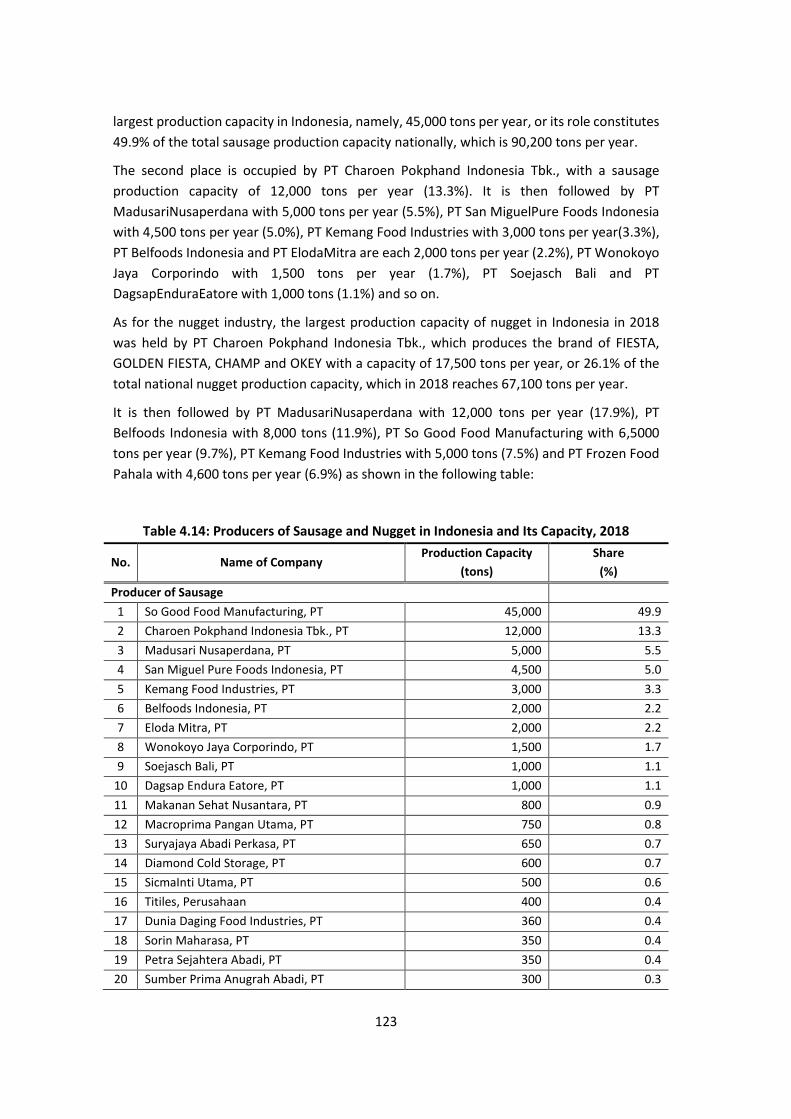
123
largest production capacity in Indonesia, namely, 45,000 tons per year, or its role constitutes
49.9% of the total sausage production capacity nationally, which is 90,200 tons per year.
The second place is occupied by PT Charoen Pokphand Indonesia Tbk., with a sausage
production capacity of 12,000 tons per year (13.3%). It is then followed by PT
MadusariNusaperdana with 5,000 tons per year (5.5%), PT San MiguelPure Foods Indonesia
with 4,500 tons per year (5.0%), PT Kemang Food Industries with 3,000 tons per year(3.3%),
PT Belfoods Indonesia and PT ElodaMitra are each 2,000 tons per year (2.2%), PT Wonokoyo
Jaya Corporindo with 1,500 tons per year (1.7%), PT Soejasch Bali and PT
DagsapEnduraEatore with 1,000 tons (1.1%) and so on.
As for the nugget industry, the largest production capacity of nugget in Indonesia in 2018
was held by PT Charoen Pokphand Indonesia Tbk., which produces the brand of FIESTA,
GOLDEN FIESTA, CHAMP and OKEY with a capacity of 17,500 tons per year, or 26.1% of the
total national nugget production capacity, which in 2018 reaches 67,100 tons per year.
It is then followed by PT MadusariNusaperdana with 12,000 tons per year (17.9%), PT
Belfoods Indonesia with 8,000 tons (11.9%), PT So Good Food Manufacturing with 6,5000
tons per year (9.7%), PT Kemang Food Industries with 5,000 tons (7.5%) and PT Frozen Food
Pahala with 4,600 tons per year (6.9%) as shown in the following table:
Table 4.14: Producers of Sausage and Nugget in Indonesia and Its Capacity, 2018
No. Name of Company Production Capacity
(tons)
Share
(%)
Producer of Sausage
1 So Good Food Manufacturing, PT 45,000 49.9
2 Charoen Pokphand Indonesia Tbk., PT 12,000 13.3
3 Madusari Nusaperdana, PT 5,000 5.5
4 San Miguel Pure Foods Indonesia, PT 4,500 5.0
5 Kemang Food Industries, PT 3,000 3.3
6 Belfoods Indonesia, PT 2,000 2.2
7 Eloda Mitra, PT 2,000 2.2
8 Wonokoyo Jaya Corporindo, PT 1,500 1.7
9 Soejasch Bali, PT 1,000 1.1
10 Dagsap Endura Eatore, PT 1,000 1.1
11 Makanan Sehat Nusantara, PT 800 0.9
12 Macroprima Pangan Utama, PT 750 0.8
13 Suryajaya Abadi Perkasa, PT 650 0.7
14 Diamond Cold Storage, PT 600 0.7
15 SicmaInti Utama, PT 500 0.6
16 Titiles, Perusahaan 400 0.4
17 Dunia Daging Food Industries, PT 360 0.4
18 Sorin Maharasa, PT 350 0.4
19 Petra Sejahtera Abadi, PT 350 0.4
20 Sumber Prima Anugrah Abadi, PT 300 0.3

124
No. Name of Company Production Capacity
(tons)
Share
(%)
21 Aroma Duta Rasaprima, PT 300 0.3
22 Sumber Pangan Jaya, PT 300 0.3
23 Elson Bernardi, PT 250 0.3
24 Winner Food Industry, PT 250 0.3
25 Pasir Kaliki, PD 200 0.2
26 Miko PanganUtama, PT 200 0.2
27 Perikanan Nusantara, PT 150 0.2
28 Satria Pangan Sejati, PT 150 0.2
29 Bumifood Agro Industri, PT 150 0.2
30 Other Producers 6,190 6.9
TOTAL CAPACITY 90,200 100.0
Producers of Nugget
1 Charoen Pokphand Indonesia Tbk., PT 17,500 26.1
2 Madusari Nusaperdana, PT 12,000 17.9
3 Belfoods Indonesia, PT 8,000 11.9
4 So Good Food Manufacturing, PT 6,500 9.7
5 Kemang Food Industries, PT 5,000 7.5
6 Frozen Food Pahala, PT 4,600 6.9
7 Wonokoyo Jaya Corporindo, PT 1,500 2.2
8 Suryajaya Abadi Perkasa, PT 1,500 2.2
9 Soejasch Bali, PT 1,250 1.9
10 Macroprima Pangan Utama, PT 1,200 1.8
11 Makanan Sehat Nusantara, PT 1,000 1.5
12 Sorin Maharasa, PT 600 0.9
13 San Miguel Pure Foods Indonesia, PT 500 0.7
14 Dagsap Endura Eatore, PT 500 0.7
15 Diamond Cold Storage, PT 250 0.4
16 Pasir Kaliki, PD 250 0.4
17 Petra Sejahtera Abadi, PT 200 0.3
18 Sumber Prima Anugrah Abadi, PT 200 0.3
19 Sakana Indo Prima, PT 200 0.3
20 Aroma Duta Rasaprima, PT 150 0.2
21 Elson Bernardi, PT 150 0.2
22 Perikanan Nusantara, PT 150 0.2
23 Central Pertiwi Bahari, PT 150 0.2
24 Satria Pangan Sejati, PT 100 0.1
25 Other Producers 3,650 5.4
TOTAL CAPACITY 67,100 100.0
Source: Survey by author.

125
Development of cargo equipment for cold storage for chemical products, pharmaceuticals,
and drugs
Cold chain processes in chemical, pharmaceutical and drug industries are also needed to
prevent damage to their chemical structure. Changes and damage to chemical structures can
cause potential loss, and drugs becomes useless as vaccines for immunisation. Failure to
provide good cold chains causes damage to almost 50% of vaccines worldwide every year.
Since the discovery of vaccines and vaccine manufacturing techniques that are growing
rapidly to date, there is one thing that absolutely must exist if we talk about vaccine storage,
namely, cold chain, which is a vaccine storage system with a temperature of between 2°C
and 8°C, so that the components in a bioactive vaccine do not get damaged because of high
temperatures or too low temperatures. With the right storage temperature, the potential for
vaccine protection will be maintained except for certain types of vaccines such as oral OPV
polio vaccine, which must be stored below -20°C.
As for the consideration in choosing the cold chain, it includes the number of targets; the
volume of vaccines to be loaded; the available energy sources; the nature, function and
temperature stability of storage facilities; the parts and recommendations of WHO or the
results of research or trials that have been conducted.
Table 4.15: Storing Temperature and Age of Vaccine Based on Type of Vaccine
Type of
Vaccine Storing Temperature Age of Vaccine
BCG +2°C up to +8°C or -15°C up to -25°C 1 year
Polio +2°C up to +8°C 6 months
-15°C up to -25°C 2 years
Measles +2°C up to +8 °C or -15°C up to -25°C 2 years
DPT +2°C up to +8°C 2 years
Hepatitis B +2°C up to +8°C 26 months
TT +2°C up to +8°C 2 years
DT +2°C up to +8°C 2 years
DPT – HB +2°C up to +8°C 2 years
Source: Galazka, Milstien, and Zaffran (1998).
The use of cold chains in the chemical, pharmaceutical and drug industry is like the horns of
a dilemma. On the one hand, the cold chain is necessary, while on the other hand, the use of
cold chain is quite expensive. Based on the information obtained, cold chain costs for
vaccines from the beginning of production until they are used in hospitals or clinics can reach
around 80% of the selling price of the vaccine itself.
Seeing this condition, the use of cold chains becomes a problem, especially for health service
providers and pharmaceutical companies and especially with conditions in some areas,
where the availability of electricity is still a problem.
126
The pharmaceutical industry has been developing in Indonesia for a long time. Various kinds
of drugs have been able to be produced in increasing numbers with an increasingly extensive
distribution network; thus, they can reach almost all levels of society. Even the
pharmaceutical industry is one of the business sectors that still survive.
Based on data collected by CIC, the total number of pharmaceutical companies in Indonesia
(both companies that have factories and importing companies that hold imported product
licenses) that registered at the relevant agencies up to the end of 2018 reached 259
companies, consisting of 217 companies that already have its own pharmaceutical factories
and the remaining 42 companies that are only listed as companies holding licenses for
imported pharmaceutical products.
4.6. Cold chain business model in Indonesia
In Indonesia, there are two models of cold chain business player, namely, those that are used
alone (integrated) and those that are fully leased. The main function of that is used alone is
to store its own products, either temporarily or for long periods, as stock.
Companies with business models like this are usually integrated with the company’s main
activities and become supporting of its operational activities. Therefore, the activity of
storing, shipping goods or distributing is performed by the company itself in accordance with
its business activities. Examples of integrated business models are the ice cream industry;
importers of meat, fruit, vegetables and food; and exporters of fish or seafood.
Occasionally, it is also leased to other parties, but the space offered is limited. An example of
an integrated company is PT Dharma Samudera Fishing Industries, which engaged in the
fisheries sector, and PT Unilever Indonesia Tbk., which produces the Wall’s ice cream brand.
For the leased one, there are two types of companies, namely, logistics and forwarders,
transportation companies, and companies that specifically engaged in the rental of cold
storage, among others are PT Wahana Cold Storage and PT Pluit Cold Storage.
Cold storage operated in Indonesia
Cold storage is a room designed with certain temperature conditions and is used to store
various products with the aim of maintaining freshness and material content. There are
several types of cold storage that are operated, namely, chilled room, freezer room, blast
freezer and blast chiller.
Chilled rooms and freezer rooms are used to store products according to received
temperature conditioning, while freezer blasts and blast chillers are used to condition a
product at a certain temperature. Chilled room is a low-temperature cooling room between
1ᵒC and 7ᵒC. This room is used to store fresh foodstuffs, such as vegetables, fruits and other
ingredients with a durability of up to two months.

127
For freezer rooms, generally, the room temperature is between -15°C and -20°C for storing
fish, meat, chicken, sausages, milk, cheese, potatoes and all types of foodstuffs and other
ingredients that require freezing temperatures.
Blast chillers are used for rapid cooling after the cooking process is complete with a target
temperature of 1°C to 4°C. Blast freezers are used for fast frozen refrigeration for processed
foods as well as for meat, fish and shrimp. The purpose of using blast chillers and blast
freezers is to avoid bacterial contamination, maintain the taste of food, avoid reducing water
content and maintain the nutrient levels.
Meanwhile, according to its capacity and function, cold storage in Indonesia is grouped into
two groups, namely, commercial and industrial. Commercial cold storage is generally used
for the needs of its owners and is leased and does not become an integrated and special part
of an industrial activity, for example, storing meat, fish, fruit and vegetable products owned
by supermarkets and hypermarkets. Commercial cold storage capacity in Indonesia is
generally under 1,000 tons.
Cold storage industries generally function as part of the production chain or become special
business activities, such as cold storage rental and logistics businesses. The capacity of
industrial cold storage in Indonesia is generally more than 1,000 tons.
Cold storage operated in Jabodetabek 19 is divided into two categories, namely, for
commercial and industrial purposes. Commercial cold storage is generally used for the
purposes of the owner and leased out. Examples are the storage of meat, chicken, fish, fruit
and vegetable products owned by supermarkets and hypermarkets. Commercial cold storage
capacity is generally below 1,000 tons.
Cold storage is used to store various kinds of products ranging from vegetables, meat, fish,
chicken, fruits and so on. These products have different characteristics, both temperature
and humidity, such as 4°C to 6°C with 80% to 90% humidity. Fresh meat requires a
temperature of -2°C to 0°C with 80% to 90% humidity as shown in the following table:
Table 4.16: Products That Require Cold Storage, Detailed
Product Temperature Humidity
(°C) (%)
Chocolate 15–18 50–60
Flower 8–16 70–75
Banana, one-half matured durian 4–16 80–90
Vegetable 6–8 80–90
Cake 4–8 60–70
Fruits 4–6 80–90
Matured durian 4–6 80–90
Mushroom 0 90–95
19Jabodetabek denotes Jakarta, Bogor, Depok, Tangerang and Bekasi or usually states as Greater Jakarta Area.
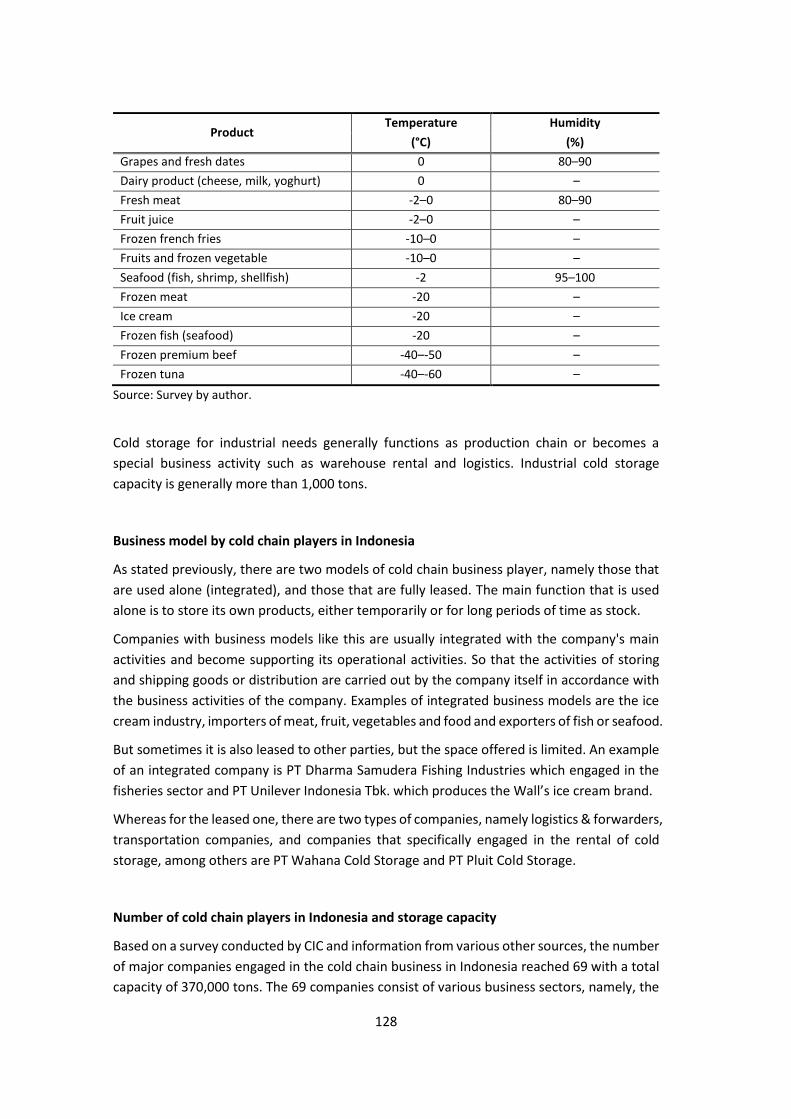
128
Product Temperature Humidity
(°C) (%)
Grapes and fresh dates 0 80–90
Dairy product (cheese, milk, yoghurt) 0 –
Fresh meat -2–0 80–90
Fruit juice -2–0 –
Frozen french fries -10–0 –
Fruits and frozen vegetable -10–0 –
Seafood (fish, shrimp, shellfish) -2 95–100
Frozen meat -20 –
Ice cream -20 –
Frozen fish (seafood) -20 –
Frozen premium beef -40–-50 –
Frozen tuna -40–-60 –
Source: Survey by author.
Cold storage for industrial needs generally functions as production chain or becomes a
special business activity such as warehouse rental and logistics. Industrial cold storage
capacity is generally more than 1,000 tons.
Business model by cold chain players in Indonesia
As stated previously, there are two models of cold chain business player, namely those that
are used alone (integrated), and those that are fully leased. The main function that is used
alone is to store its own products, either temporarily or for long periods of time as stock.
Companies with business models like this are usually integrated with the company's main
activities and become supporting its operational activities. So that the activities of storing
and shipping goods or distribution are carried out by the company itself in accordance with
the business activities of the company. Examples of integrated business models are the ice
cream industry, importers of meat, fruit, vegetables and food and exporters of fish or seafood.
But sometimes it is also leased to other parties, but the space offered is limited. An example
of an integrated company is PT Dharma Samudera Fishing Industries which engaged in the
fisheries sector and PT Unilever Indonesia Tbk. which produces the Wall’s ice cream brand.
Whereas for the leased one, there are two types of companies, namely logistics & forwarders,
transportation companies, and companies that specifically engaged in the rental of cold
storage, among others are PT Wahana Cold Storage and PT Pluit Cold Storage.
Number of cold chain players in Indonesia and storage capacity
Based on a survey conducted by CIC and information from various other sources, the number
of major companies engaged in the cold chain business in Indonesia reached 69 with a total
capacity of 370,000 tons. The 69 companies consist of various business sectors, namely, the
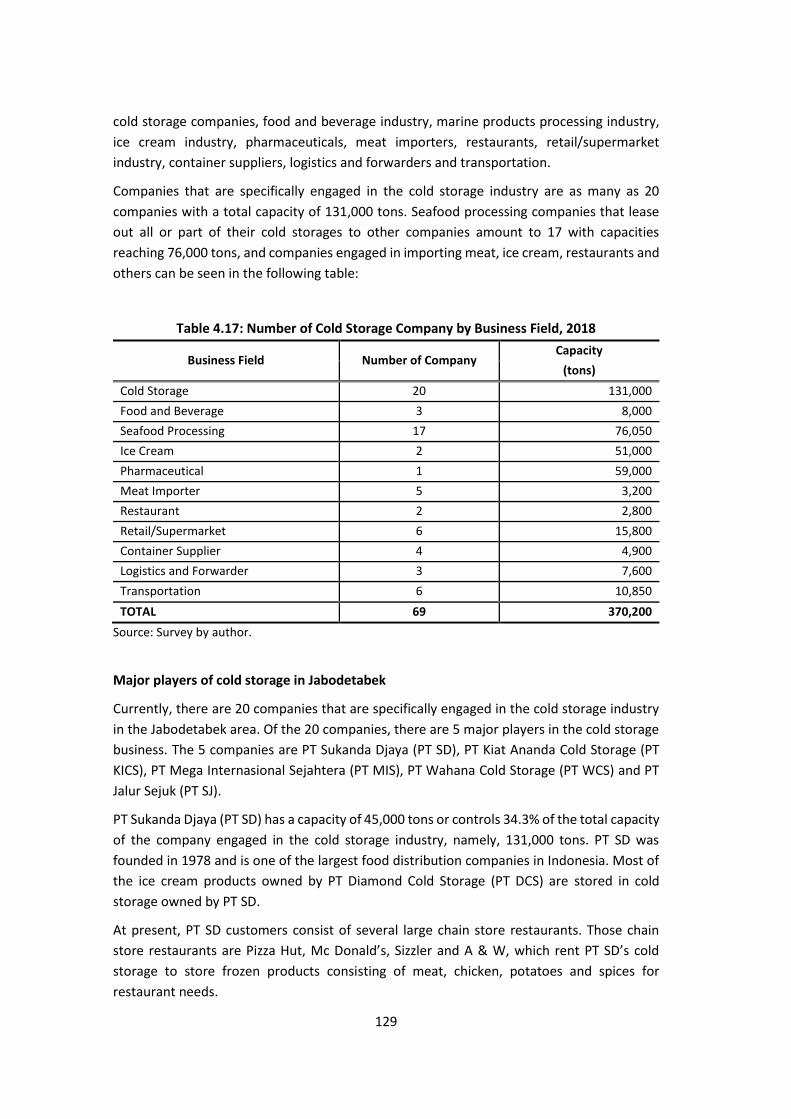
129
cold storage companies, food and beverage industry, marine products processing industry,
ice cream industry, pharmaceuticals, meat importers, restaurants, retail/supermarket
industry, container suppliers, logistics and forwarders and transportation.
Companies that are specifically engaged in the cold storage industry are as many as 20
companies with a total capacity of 131,000 tons. Seafood processing companies that lease
out all or part of their cold storages to other companies amount to 17 with capacities
reaching 76,000 tons, and companies engaged in importing meat, ice cream, restaurants and
others can be seen in the following table:
Table 4.17: Number of Cold Storage Company by Business Field, 2018
Business Field Number of Company Capacity
(tons)
Cold Storage 20 131,000
Food and Beverage 3 8,000
Seafood Processing 17 76,050
Ice Cream 2 51,000
Pharmaceutical 1 59,000
Meat Importer 5 3,200
Restaurant 2 2,800
Retail/Supermarket 6 15,800
Container Supplier 4 4,900
Logistics and Forwarder 3 7,600
Transportation 6 10,850
TOTAL 69 370,200
Source: Survey by author.
Major players of cold storage in Jabodetabek
Currently, there are 20 companies that are specifically engaged in the cold storage industry
in the Jabodetabek area. Of the 20 companies, there are 5 major players in the cold storage
business. The 5 companies are PT Sukanda Djaya (PT SD), PT Kiat Ananda Cold Storage (PT
KICS), PT Mega Internasional Sejahtera (PT MIS), PT Wahana Cold Storage (PT WCS) and PT
Jalur Sejuk (PT SJ).
PT Sukanda Djaya (PT SD) has a capacity of 45,000 tons or controls 34.3% of the total capacity
of the company engaged in the cold storage industry, namely, 131,000 tons. PT SD was
founded in 1978 and is one of the largest food distribution companies in Indonesia. Most of
the ice cream products owned by PT Diamond Cold Storage (PT DCS) are stored in cold
storage owned by PT SD.
At present, PT SD customers consist of several large chain store restaurants. Those chain
store restaurants are Pizza Hut, Mc Donald’s, Sizzler and A & W, which rent PT SD’s cold
storage to store frozen products consisting of meat, chicken, potatoes and spices for
restaurant needs.

130
PT SD handles all distribution of goods to all restaurant outlet chain stores of the customers
for the Java region.
PT SD’s cold storages are located in Cibitung, currently one of the largest cold storage
warehouses in Indonesia. PT SD has a warehouse of 14,000 sq.m with a cold storage capacity
of 45,000 tons. Currently, the truck fleet is 100 units. Whereas for handling activities in the
warehouse, the company operates 10 units of forklifts. In addition, PT SD also has several
distribution centre branches spread across Denpasar (Bali), Surabaya (East Java) and
Bandung (West Java) and Balikpapan (East Kalimantan).
The second largest in the cold chain industry is PT Kiat Ananda Cold Storage (PT KA) with a
capacity of 30,000 tons or controlling 22.9%. PT KA Kiat Ananda is an experienced and trusted
cold supply chain management company, which is for frozen food products.
Founded in Jakarta in 1998, Kiat Ananda provides an integrated cold supply chain
management solution starting from the process of purchasing goods to suppliers (import and
local), shipping goods from suppliers to clients, storing client items to distributing goods from
clients to distributors up to retailers.
PT KA has a cold storage located on Jl. Raya Narogong, Bekasi, with an area of 3 ha. The
cooling warehouse owned by PT KA has a building area of 1.6 ha and is supported by modern
cooling technology with layered doors, which are able to maintain temperature stability at
15°C to -25°C, and have more than 15 doors to speed up the loading and unloading process.
PT KA’s cold storage is able to accommodate 30, 000 pallets, equivalent to 30,000 tons.
To support the supply chain process in terms of shipping goods from upstream to
downstream, from suppliers to retailers, Kiat Ananda has prepared more than 400 fleets of
trucks with cooling systems.
The third largest is PT Mega Internasional Sejahtera (PT MIS) with a capacity of 21,000 tons
or a portion of 16.3%. PT MIS is a cold storage service company operating at the end of 2013
located in the MM2100 Cibitung Industrial Estate, Bekasi, West Java.
With a capacity of 21,000 tons, this company has four freezer rooms and two chillers. The
temperature of the cold storage room/frozen temperature of this company is -20°C to -28°C,
cold storage with a temperature of -20°C to -28°C, cold storage/chill with a temperature of
0°C to +10°C and chilled storage with a temperature of 0°C up to +10°C.
Other companies that are specialised in the cold chain industry can be seen in the following
table:
Table 4.18: List of Companies Engaged in the Cold Storage Industry in Jabodetabek, 2018
Company Year Capacity Share
Established (tons) (%)
Sukanda Djaya, PT 1974 45,000 34.35
Kiat Ananda Cold Storage, PT 1998 30,000 22.90
Mega Internasional Sejahtera, PT 2013 21,000 16.03

131
Company Year Capacity Share
Established (tons) (%)
Savina Cold Storage – 9,000 6.87
Wahana Cold Storage, PT 1997 7,000 5.34
Jalur Sejuk, PT 1987 5,000 3.82
Alpine Cool Utama 1985 1,500 1.15
Aneka Cool Citratama, PT 1997 1,000 0.76
Celcius Jaya, PT 1992 1,000 0.76
Central Food Lestari, PT 2007 1,000 0.76
Cold Storage Jaya Makmur 2010 1,000 0.76
Cooltech Surabaya, PT 2005 1,000 0.76
Ercoolcoldstorage, PT 2011 1,000 0.76
Indopanel Sukses Makmur, PT – 1,000 0.76
Kini Cold Storage – 1,000 0.76
Sarana Dunia Pendingin, PT 2006 1,000 0.76
Sarana Refrigeratama, PT – 1,000 0.76
United Refrigeration, PT 2004 1,000 0.76
Widjaya Dwi Kalmindo, PT 2008 1,000 0.76
Pluit Cold Storage, PT 2003 500 0.38
TOTAL CAPACITY 131,000 100.00
Source: Survey by author.
⚫ Companies engaged in cold storage rental
The need for renting cold storage arises when large-scale food industry and retail companies
only have cold storage facilities with limited capacity. There are even companies that do not
have cold storage facilities at all, even though the products they produce or their raw
materials must be stored in cold storage before being used or distributed. Thus, the company
needs to rent cold storage facilities from other parties.
Most of the cold storage rental companies initially served only the main users and then
developed into cold storage rental companies that serve various types of customers.
Generally, these kinds of cold storage companies have many cold storages with a relatively
small size.
There is also a cold storage company that changes its function, which was originally used
alone such as by seafood product processing company that changed its storage function,
besides for its own use but also for rent.
Fees charged to tenants are usually calculated based on rental rates per square meter (M2)
per month, while all activities ranging from storing goods to shipping goods are the
responsibility of the tenant. Most of the products stored in cold storage facilities are
processed food products, frozen food, fruit, vegetable and so on.

132
The holding capacity of commodities such as fisheries, meat, dairy products, vegetables and
fruit is currently still insufficient; thus, it is necessary for cold storage rental business, AKA
refrigerated storage space, to be very potential.
During holidays, companies like Diamond need additional cold storage for their dairy
products. Unfortunately, additional capacity cannot be gained from cold storage that
integrated with processing companies. This is why the company is currently using it for
internal storage purposes.
Based on a survey conducted by PT CIC in Jabodetabek (Jakarta, Depok, Bogor, Tangerang
and Bekasi), there are 27 major companies that rented their cold storage to other companies.
Of the 27 companies, nine of them are companies that are indeed engaged in cold storage
business, five companies engaged in transportation, four marine processing companies,
three logistics companies and forwarders, three container supplier companies, one
pharmaceutical company, one meat importing company and one ice cream company with a
total capacity of 2,009,100 tons.
Figure 4.3: Total Cold Storage Rental Company by Business Field, 2018
Source: Survey by author.
The nine companies that rent their cold storages to other companies include PT Wahana Cold
Storage. In addition to selling, PT WCS also rents cold storages for food and beverage industry,
fisheries, meat exports/imports, fruits and vegetables.
According to information obtained by PT CIC, cold storage rental system applied by PT WCS
is per day with a minimum of five days storage costs. For cold storage rental costs, there are
six component costs, namely, storage costs, handling in, handling out, handling out loose,
plug in, and overtime costs.
The storage cost is Rp13,000/pallet/day with a minimum storage cost of five days. The
storage costs do not include handling costs of Rp40,000/pallet, handling out loose costs of
Rp60,000/pallet, plug in cost of Rp50,000/hour and overtime cost of Rp200,000 per hour as
shown in the following table:
111
33
45
9
0 2 4 6 8 10
Pharmacy
Ice Cream Producer
Meat Importer
Container Supplier
Logistics & Forwarder
Marine processing
Transportation
Cold Storage
Number of Companies
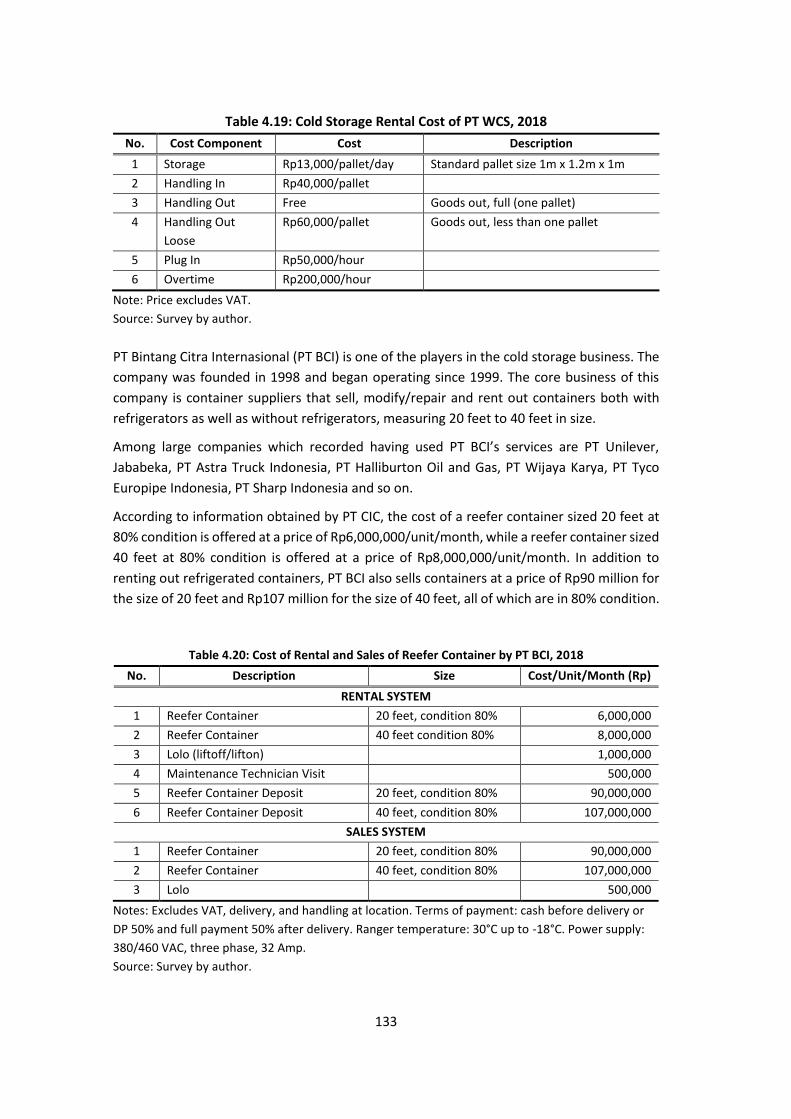
133
Table 4.19: Cold Storage Rental Cost of PT WCS, 2018
No. Cost Component Cost Description
1 Storage Rp13,000/pallet/day Standard pallet size 1m x 1.2m x 1m
2 Handling In Rp40,000/pallet
3 Handling Out Free Goods out, full (one pallet)
4 Handling Out
Loose
Rp60,000/pallet Goods out, less than one pallet
5 Plug In Rp50,000/hour
6 Overtime Rp200,000/hour
Note: Price excludes VAT.
Source: Survey by author.
PT Bintang Citra Internasional (PT BCI) is one of the players in the cold storage business. The
company was founded in 1998 and began operating since 1999. The core business of this
company is container suppliers that sell, modify/repair and rent out containers both with
refrigerators as well as without refrigerators, measuring 20 feet to 40 feet in size.
Among large companies which recorded having used PT BCI’s services are PT Unilever,
Jababeka, PT Astra Truck Indonesia, PT Halliburton Oil and Gas, PT Wijaya Karya, PT Tyco
Europipe Indonesia, PT Sharp Indonesia and so on.
According to information obtained by PT CIC, the cost of a reefer container sized 20 feet at
80% condition is offered at a price of Rp6,000,000/unit/month, while a reefer container sized
40 feet at 80% condition is offered at a price of Rp8,000,000/unit/month. In addition to
renting out refrigerated containers, PT BCI also sells containers at a price of Rp90 million for
the size of 20 feet and Rp107 million for the size of 40 feet, all of which are in 80% condition.
Table 4.20: Cost of Rental and Sales of Reefer Container by PT BCI, 2018
No. Description Size Cost/Unit/Month (Rp)
RENTAL SYSTEM
1 Reefer Container 20 feet, condition 80% 6,000,000
2 Reefer Container 40 feet condition 80% 8,000,000
3 Lolo (liftoff/lifton) 1,000,000
4 Maintenance Technician Visit 500,000
5 Reefer Container Deposit 20 feet, condition 80% 90,000,000
6 Reefer Container Deposit 40 feet, condition 80% 107,000,000
SALES SYSTEM
1 Reefer Container 20 feet, condition 80% 90,000,000
2 Reefer Container 40 feet, condition 80% 107,000,000
3 Lolo 500,000
Notes: Excludes VAT, delivery, and handling at location. Terms of payment: cash before delivery or
DP 50% and full payment 50% after delivery. Ranger temperature: 30°C up to -18°C. Power supply:
380/460 VAC, three phase, 32 Amp.
Source: Survey by author.

134
Similarly, PT Raficon Sari Jaya (PT RSJ) is engaged in container suppliers that sell and rent
reefer containers (containers equipped with refrigerators). The container is prepared for
shipping goods that require special care such as frozen fish, fresh vegetables and fruit.
Reefer containers made by PT RSJ are equipped with a dehumidification system that
guarantees the temperature and humidity of the container and the super freezer that can
maintain temperatures at -60°C/-76°F. As for the rental of containers owned by this company,
according to information, for one month with the size of 20 feet, it is rented at a price of Rp7
million, while the size of 40 feet is Rp9 million.
⚫ Capacity of cold storage rental company
As mentioned above, based on the CIC survey, there are 27 cold chain rental companies with
a production capacity of 209,000 tons. Of the 27 companies, the largest capacity is owned by
PT Enseval Medika Prima Tbk.
It is followed by PT SukandaDjaya with a capacity of 45,000 tons, PT KiatAnanda Cold Storage
with a capacity of 30,000 tons, PT Mega Internasional Sejahtera with a capacity of 21,000
tons, PT Wahana Cold Storage with a capacity of 7,000 tons and so on.
Table 4.21: Cold Storage Rental Company and Its Capacity in Jabodetabek, 2018
Company Year Capacity
Established (tons)
Enseval Medika Prima, TbkPT 1974 59,000
Sukanda Djaya, PT 1974 45,000
Kiat Ananda Cold Storage, PT 1998 30,000
Mega Internasional Sejahtera, PT 2013 21,000
Savina Cold Storage – 9,000
Wahana Cold Storage, PT 1997 7,000
Bonicom Servistama Compindo, PT 1960 6,000
Mgm Bosco Logistics, PT 1995 5,500
Perum Perikanan Indonesia 1990 5,100
Expravert Nasuba, PT 2009 3,000
Wira Logitama Saksama 1996 2,000
Perikanan Nusantara, PT 1998 1,550
Alpine Cool Utama 1985 1,500
Bintang Citra International, PT 1998 1,500
Guna Pratama, PT 2002 1,500
Raficon Sarijaya, PT 2005 1,500
Starcon Indonesia, PT 2009 1,200
Trade Corp Indonesia, PT 1990 1,200
Multi Guna International Persada, PT 2014 1,100
Central Food Lestari, PT 2007 1,000
Diamond Cold Storage 1974 1,000
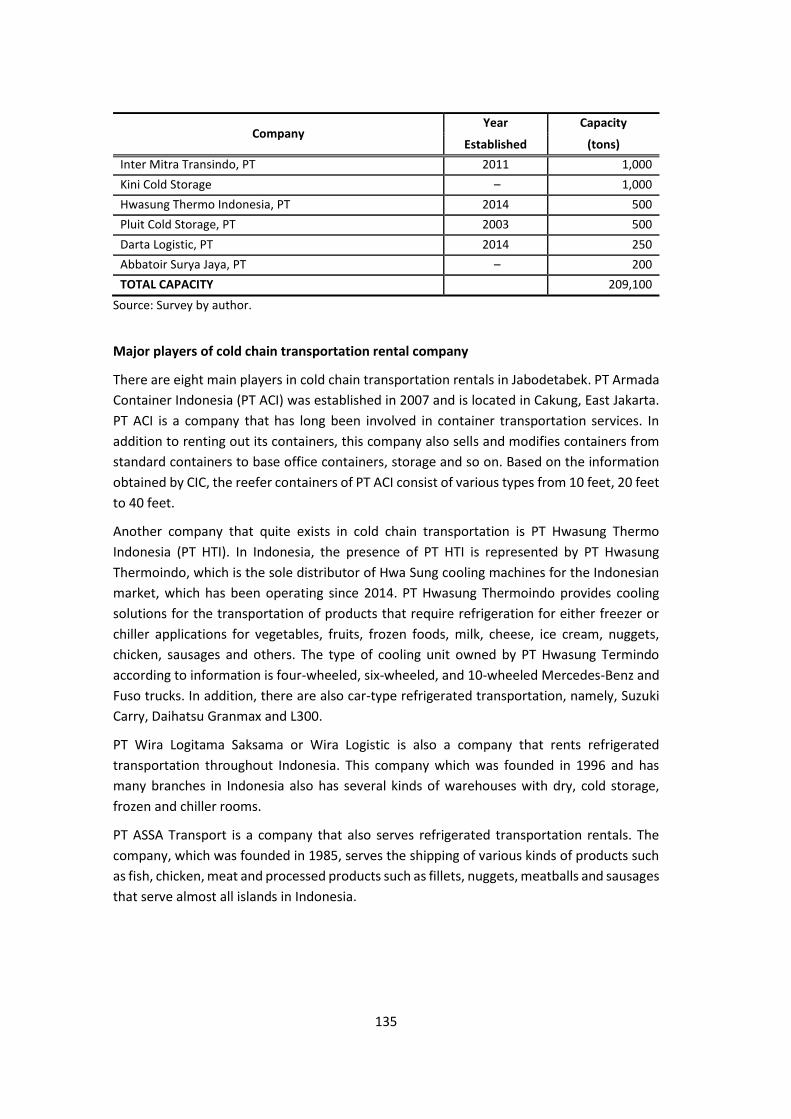
135
Company Year Capacity
Established (tons)
Inter Mitra Transindo, PT 2011 1,000
Kini Cold Storage – 1,000
Hwasung Thermo Indonesia, PT 2014 500
Pluit Cold Storage, PT 2003 500
Darta Logistic, PT 2014 250
Abbatoir Surya Jaya, PT – 200
TOTAL CAPACITY 209,100
Source: Survey by author.
Major players of cold chain transportation rental company
There are eight main players in cold chain transportation rentals in Jabodetabek. PT Armada
Container Indonesia (PT ACI) was established in 2007 and is located in Cakung, East Jakarta.
PT ACI is a company that has long been involved in container transportation services. In
addition to renting out its containers, this company also sells and modifies containers from
standard containers to base office containers, storage and so on. Based on the information
obtained by CIC, the reefer containers of PT ACI consist of various types from 10 feet, 20 feet
to 40 feet.
Another company that quite exists in cold chain transportation is PT Hwasung Thermo
Indonesia (PT HTI). In Indonesia, the presence of PT HTI is represented by PT Hwasung
Thermoindo, which is the sole distributor of Hwa Sung cooling machines for the Indonesian
market, which has been operating since 2014. PT Hwasung Thermoindo provides cooling
solutions for the transportation of products that require refrigeration for either freezer or
chiller applications for vegetables, fruits, frozen foods, milk, cheese, ice cream, nuggets,
chicken, sausages and others. The type of cooling unit owned by PT Hwasung Termindo
according to information is four-wheeled, six-wheeled, and 10-wheeled Mercedes-Benz and
Fuso trucks. In addition, there are also car-type refrigerated transportation, namely, Suzuki
Carry, Daihatsu Granmax and L300.
PT Wira Logitama Saksama or Wira Logistic is also a company that rents refrigerated
transportation throughout Indonesia. This company which was founded in 1996 and has
many branches in Indonesia also has several kinds of warehouses with dry, cold storage,
frozen and chiller rooms.
PT ASSA Transport is a company that also serves refrigerated transportation rentals. The
company, which was founded in 1985, serves the shipping of various kinds of products such
as fish, chicken, meat and processed products such as fillets, nuggets, meatballs and sausages
that serve almost all islands in Indonesia.

136
Table 4.22: Refrigerated Transportation Rental Company in Jabodetabek, 2018
No. Name of Company Established Location
1 Armada Container Indonesia, PT 2007 Jakarta
2 ASSA Transport, PT 1985 Tangerang
3 Hwasung Thermo Indonesia, PT 2014 East Java
4 Manggala Kiat Ananda, PT 1996 Tangerang
5 MgmBosco Logistic, PT 1995 Bekasi
6 Raficon Sarijaya, PT 2005 Jakarta
7 Selaras Mandiri Raya Trans, PT 2010 Tangerang
8 Wira Logitama Saksama, PT 1996 Bekasi
Source: Survey by author.
⚫ Major transportation rental players for low-temperature goods
Based on the information obtained from PT Hwasung Thermindo, on average, the company
rents out refrigerated fleets capable of cooling cargo space temperatures between 0°C and -
20°C. The Hwasung thermo machine can cool cargo temperature starting from 0°C to -20°C
with cooling capacities ranging from 2.5 x 1.6 x 1.7 meters to cargo space measuring 9.2 x 2.4
x 2.25 meters.
⚫ Number of fleet/trucks of rental company to load low-temperature goods
Refrigerated truck fleets are needed to distribute goods from factory to warehouse and from
warehouse to final customer. The function of the refrigeration truck is that the goods carried,
especially food that is easily damaged, are still in good condition.
In its operation, most companies that rent refrigerated fleets use trucks of varying sizes. The
number of truck fleets owned depends on the extent of distribution reach and the number
of customers owned by the company.
PT MGM Logistics is a company that has experience in the refrigeration transport business.
Currently, it has a large enough fleet of trucks reaching 720 trucks spread across several
branches such as Surabaya, Banjarmasin and Makassar. Based on the information obtained,
the distribution of PT MGM Logistic cooling products reached almost 100 cities in Indonesia
with 200 customers.
Likewise, with PT WiraLogitamaSaksama or Wira Logistic, it has around 300 vehicle fleets
serving the market in Java region. This company has several well-known customers such as
Sari Roti, Petronas, Coca-Cola, Givaudan, Adidas, Solaria, Danone, Unilever, Carrefour, Philip
Morris and so on.
⚫ Price of new refrigerated fleet/trucks
Based on the survey at a dealership of Mitsubishi conducted by CIC, the price of new
refrigerated truck varies greatly depending on the carrying capacity of each truck and the
type of cooler used, such as for four-wheeled trucks with FE 71 110 type with Thermoking SV
400, it is sold atRp400 million per unit. While trucks of the same type with different cooling
brands (Starkool SK 350) is sold for Rp370 million per unit.
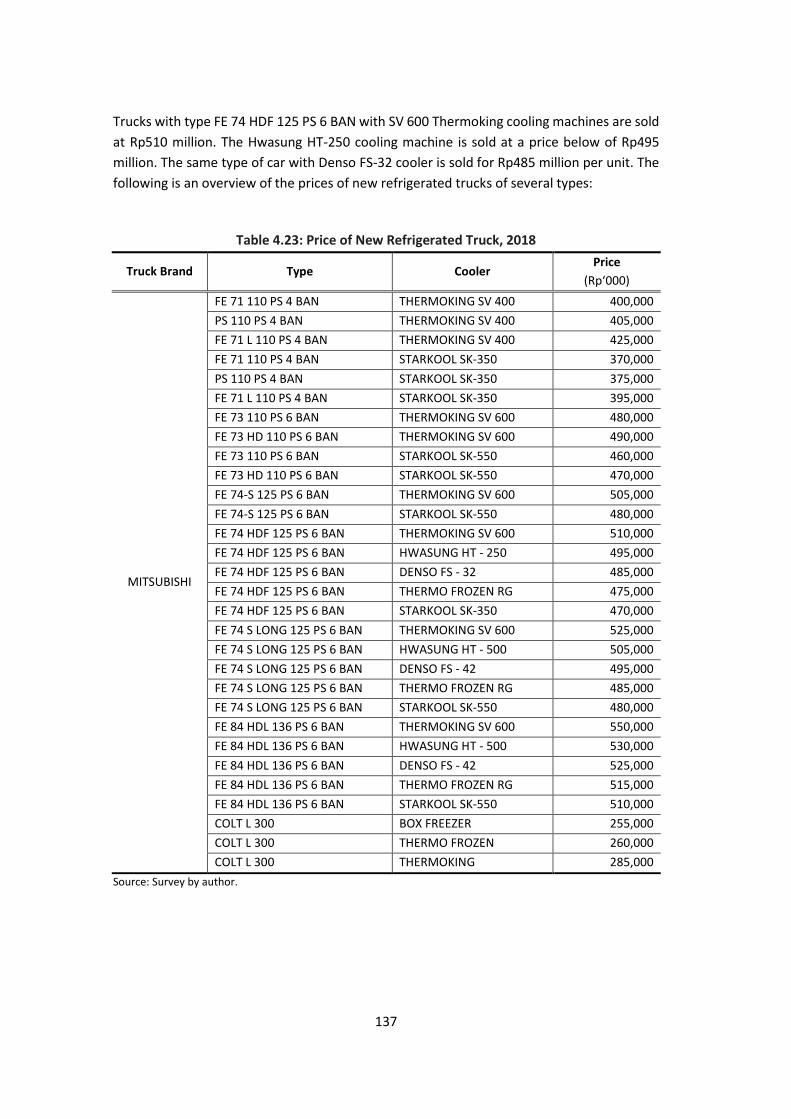
137
Trucks with type FE 74 HDF 125 PS 6 BAN with SV 600 Thermoking cooling machines are sold
at Rp510 million. The Hwasung HT-250 cooling machine is sold at a price below of Rp495
million. The same type of car with Denso FS-32 cooler is sold for Rp485 million per unit. The
following is an overview of the prices of new refrigerated trucks of several types:
Table 4.23: Price of New Refrigerated Truck, 2018
Truck Brand Type Cooler Price
(Rp‘000)
MITSUBISHI
FE 71 110 PS 4 BAN THERMOKING SV 400 400,000
PS 110 PS 4 BAN THERMOKING SV 400 405,000
FE 71 L 110 PS 4 BAN THERMOKING SV 400 425,000
FE 71 110 PS 4 BAN STARKOOL SK-350 370,000
PS 110 PS 4 BAN STARKOOL SK-350 375,000
FE 71 L 110 PS 4 BAN STARKOOL SK-350 395,000
FE 73 110 PS 6 BAN THERMOKING SV 600 480,000
FE 73 HD 110 PS 6 BAN THERMOKING SV 600 490,000
FE 73 110 PS 6 BAN STARKOOL SK-550 460,000
FE 73 HD 110 PS 6 BAN STARKOOL SK-550 470,000
FE 74-S 125 PS 6 BAN THERMOKING SV 600 505,000
FE 74-S 125 PS 6 BAN STARKOOL SK-550 480,000
FE 74 HDF 125 PS 6 BAN THERMOKING SV 600 510,000
FE 74 HDF 125 PS 6 BAN HWASUNG HT - 250 495,000
FE 74 HDF 125 PS 6 BAN DENSO FS - 32 485,000
FE 74 HDF 125 PS 6 BAN THERMO FROZEN RG 475,000
FE 74 HDF 125 PS 6 BAN STARKOOL SK-350 470,000
FE 74 S LONG 125 PS 6 BAN THERMOKING SV 600 525,000
FE 74 S LONG 125 PS 6 BAN HWASUNG HT - 500 505,000
FE 74 S LONG 125 PS 6 BAN DENSO FS - 42 495,000
FE 74 S LONG 125 PS 6 BAN THERMO FROZEN RG 485,000
FE 74 S LONG 125 PS 6 BAN STARKOOL SK-550 480,000
FE 84 HDL 136 PS 6 BAN THERMOKING SV 600 550,000
FE 84 HDL 136 PS 6 BAN HWASUNG HT - 500 530,000
FE 84 HDL 136 PS 6 BAN DENSO FS - 42 525,000
FE 84 HDL 136 PS 6 BAN THERMO FROZEN RG 515,000
FE 84 HDL 136 PS 6 BAN STARKOOL SK-550 510,000
COLT L 300 BOX FREEZER 255,000
COLT L 300 THERMO FROZEN 260,000
COLT L 300 THERMOKING 285,000
Source: Survey by author.
138
Main users of cold chain service
⚫ Food processing company
As mentioned before, the cold chain is also very much needed in various industries, including
food processing industries. The processed food industry is very dependent on the cold chain
system. Two companies are noted as main users of cold chain service for food processing
companies, namely, PT So Good Food Manufacturing (PT SGM) and PT Charoen Pokphand
Indonesia Tbk.
PT So Good Food Manufacturing, initially named PT Japfa Osi Food Industries, was
established in Jakarta on May 25, 1994. The scope of products produced by PT SGFM is
processed chicken and beef, including sausages, nuggets, meatballs, whole muscle products
(karaage, katsu, chicken steak, spicy wings and spicy chicken) and other processed meat and
seafood such as corned beef and chicken, shumai, spring rolls, brainbox, dumplings, postage
stamps and so on.
For sausage products, PT SGFM classifies sausages based on how they are served, that is,
sausages that are ready to eat and are not ready to eat, meaning they need to be cooked
first. For sausages that are ready to eat, the company markets its products with two brands,
namely, SG SOZZIS and SO NICE. SG SOZZIS was launched in 2002.
The distribution of all products produced by the company is directly handled by the parent
company, PT So Good Food, previously named PT Supra Sumber Cipta. Until now, sausage
and nugget products are still oriented to the domestic market.
PT Charoen Pokphand Indonesia Tbk., initially named PT Charoen Pokphand Indonesia
Animal Feed, was founded in 1967. On December 6, 1990, the company was renamed to PT
Charoen Pokphan Indonesia Tbk. In 1995, PT Charoen Pokphan Indonesia established a
company named PT Charoen Pokphan Indonesian Chicken Processing Plant (PT CPIT–CPP) as
a slaughterhouse and chicken meat processing industry.
PT CPIT–CPP currently produces various processed meat products, including sausages,
processed chicken (nugget, spicy wing, karaage, meatballs, dumplings, fried potatoes, etc.),
cut chicken and others (fish, fried rice and snacks). Initially, the nugget and sausage products
being the mainstay of this company was the FIVE STAR brand. However, the brand’s existence
only lasted until 2006 and was replaced by various brands that are quite successful in gaining
market share, including FIESTA, GOLDEN FIESTA, CHAMP and OKEY. For snack products, the
company uses the ASIMO and DUGEM brands.
⚫ Trading company
PT Sumber Alfaria Trijaya Tbk., known as Alfamart, is one of the trading companies that need
cold chains to store chicken products, meat, beverages and other processed foods. Alfamart
is a supermarket chain that has many branches in Indonesia.
The company was originally named PT Alfa Mitramart Utama and founded by PT Alfa
Retailindo Tbk. and PT Lancar Distrindo in 1999. On August 1, 2002, the ownership of PT Alfa
139
Mitramart Utama was transferred to PT Sumber Alfaria Trijaya, which shares are owned by
HM Sampoerna (70%) and PT Sigmantara Alfindo (30%).
Until now, Alfamart already has more than 1,000 outlets in Indonesia. More than 200 food
products and other living goods are available at competitive prices.
⚫ Distribution company
PT Unilever Indonesia Tbk. is the largest distribution company that also requires cold chains
for the produced products. Unilever produces food, drinks, cleansers and body treatments.
Unilever has more than 400 trademarks, and its products are well-known in Indonesia such
as Lux, Magnum, Dove, Margarine, Rexona, Sunsilk, Lifebuoy, Clear, Rinso, Molto, Wall’s ice
cream, Blue Band, Surf and so on.
PT Unilever Indonesia Tbk. is divided into four main divisions, namely food, beverages and
ice cream, household care and body care. In distributing its products, PT Unilever involves
around 500 Unilever distributors spread throughout Indonesia.
PT Unilever Indonesia Tbk. has six factories in Jababeka Industrial Estate, Cikarang and Bekasi
and two factories in the Surabaya Rungkut Industrial Estate in East Java with its head office
in Jakarta.
⚫ Retail company
In line with the rapid growth of retail business networks in major cities in Indonesia in recent
years, encouraging goods storage services in cold storage has increased. Most retail networks
in Indonesia have a number of outlets spread in several locations; thus, there must be
standardisation of goods in all outlets. This requires handling the availability of goods in a
professional and timely manner.
However, some retail networks only have limited cold storage space to accommodate their
trading commodities, including frozen food products, drinks, ice cream, fruit, meat, fish and
so on. With the limited capacity of its own cold storage, several large-scale network retailers
then rent logistics facilities for cold storage space.
Retail network business is divided into two groups, namely, hypermarkets and supermarkets.
Based on the classification from the Ministry of Trade, the minimum area of supermarkets is
around 600 m2 and minimarkets or convenience stores at least 140 m2, while hypermarkets
have bigger floor space than supermarkets.
Included in hypermarket group is Carrefour, which has a network in Jabodetabek (41 outlets);
Giant (44 outlets); Hypermart (100 outlets) and Lotte (13 outlets). Meanwhile, the
supermarket group includes Hero with 132 outlets, Alfa with 587 outlets and Starmart with
145 outlets in 2018.
Based on a survey conducted by CIC, each of these outlets, such as Carrefour, Giant, and
Lotte, has its own cold storage with a capacity of between 10 and 100 tons.

140
The big potential market of Indonesia has pushed the courage of retail entrepreneurs to add
outlets in Indonesia. Retail entrepreneurs are optimistic that retail businesses in Indonesia,
especially supermarkets, hypermarkets and shipping companies, have bright prospects in the
future.
Type of products that require and use cold chain service
⚫ Food company
Cold chains in the food industry are needed so that food is not quickly damaged. Food
products that require cold chains are sausages and nuggets as well as chocolate, sardines,
coconut juice and so on.
Table 4.24: Food Products of Some Food Companies That Require Cold Chain Service
Name of Company Brand Product
Carrefour Indonesia, PT CARREFOUR Sausage and Nugget
Diamond Cold Storage, PT DIAMOND Ice Cream
Garuda Food, PT CLEVO, OKKY JELLY Milk, Coconut Jelly
Hero Supermarket, PT GIANT Nugget
Kelola Mina Laut, PT MINAKU Sausage and Nugget
Lion Superindo, PT 365 Sausage Beef
Lotte Shopping Indonesia, PT LOTTEMART SAVE Sausage
Matahari Putra Prima Tbk, PT VALUE PLUS Sausage and Nugget
Olagafood, PT OLAGA Beverage
Petra Food, PT SILVER QUEEN Chocolate
Prima Food International, PT FIESTA DAN GOLDEN FIESTA Nugget
Rekso Nasional Food, PT MCDONALD’S Sausage and Nugget
Sekar Bumi Tbk., PT BUMIFOOD Nugget
Sekar Laut, PT FINNA Sardines
Sierad Produce, PT DELFARM Nugget
So Good Food Manufacturing, PT SO GOOD Sausage
Source: Survey by author.
⚫ Trading company
In developing its business, PT Sumber Alfaria Trijaya Tbk. also collaborates with large
companies and small producers with small and medium enterprises (SMEs) scale in
marketing their products. For this reason, Alfamart created a house brand private label
(HBPL) which is specially packaged in a package that has the identity of the place that sells it,
and the product can only be obtained at that place.
The purpose of creating HBPL products is to provide a choice of good quality products at
affordable prices to consumers. Therefore, the products issued by Alfamart are products
made by large and trusted factories in their fields.

141
Various products found in Alfamart require cold chains such as beverage products (Sprite,
Fanta, Coca-Cola, bottled tea, ice cream, Aqua, Le-Minerale, yoghurt and so on), food
products (fresh meat, sausages, fruits, sardines, nata de coco, pudding, dates).
⚫ Distribution company
As explained above, the products produced by PT Unilever are more than 400 brands that
are well-known to the public. Of the 400 brands, there are several products that are
produced requiring cold chains so that the quality of these products is maintained and
guaranteed. These products are food products and beverages such as Blue Band Margarine,
Wall’s ice cream, Lipton and Buavita.
Table 4.25: Products of PT Unilever That Require Cold Chain
Name of Product Weight
Blue Band Serbaguna* 1 kilogram, 17 grams, 55 grams
Blue Band Master Original Margarine 5 kilogram
Blue Band Serbaguna Sachet 200 grams
Blue Band Cake and Cookie 1 kilogram, 200 grams
Blue Band Serbaguna Tube 250 grams
Blue Band Master Original Margarine Tin 2 kilograms
Lipton Tea
Lipton Peppermint Jewel 15 Sachets 1.5 grams
Lipton Strawberry 15 sachets 1.5 grams
Lipton Yellow Label Black Tea 25 Teabags 2 grams
Buavita Juice Royale Sunshine Carrot 250 ml
Buavita Juice Slim Orange 250 ml
Buavita Juice Slim Jambu 250 ml
Buavita Juice Royale Chloro Broccoli 250 ml
Buavita Juice New Mango 1000 ml
Buavita Juice Slim Lychee 250 ml
Buavita Juice New Guava 1000 ml
Buavita Juice Slim Apple 250 ml
Buavita Juice Slim Mangga 250 ml
Walls Ice Cream 38 ml
Walls Ice Cream Magnum Almond 90 ml
Walls Ice Cream Feast Vanilla 65 ml
Walls Ice Cream Feast Chocolate 65 ml
*Name of variant from Blue Band.
Source: Survey by author.
142
4.7. Utilisation of storage
Utilisation of storage and trucks for ordinary temperatures
Storages are needed as a means to store goods and must be arranged properly so they can
be used optimally. Also, they can facilitate the storing, searching, and retrieval of goods.
Goods stored in the storage can be in the form of raw materials, semi-finished goods, spare
parts or finished products. A good storage system is a storing system that can utilise its
storage space effectively.
Storage utilisation for ordinary temperatures must be designed in a good condition with
sufficient radiation, must be easy to clean, and have a temperature range from 19°C to 21°C,
especially for food storage, which should be close to the production unit.
Ordinary temperature storage is usually used to store food products, tubers, potatoes, garlic,
shallots or tuber vegetables and shoots.
Utilisation of storage and truck for cold temperature
Storage utilisation for cold temperatures is usually performed in coolers that are stored at a
temperature of 5°C to 8°C. Besides, the cleanliness of the refrigerator must also be
maintained, not close to the source of heat and not directly exposed to the sun.
Products that are usually stored in cold temperature storage are food products in cans,
plastic, bottles or other dry food products. This type of food will be easily damaged if it is
deviated to a storage that is unclean, irregular and improperly maintained.
There are several factors that are considered in storing food products for cold temperatures,
namely, temperature controlling and humidity, arranging and placing food products, food
labelling, food ingredients recording and security as well as storage locations.
Utilisation of storage and truck for freezing temperature
Storage for freezing temperatures usually used to store perishable foodstuffs and dairy
products, such as eggs, butter, meat, and milk. Food will be saved if stored at temperatures
between -1°C and -7°C.
The foodstuff must be placed separately because if put together, it will cause contamination,
resulting in damage to the food.
Other foods stored in freezing temperature are various types of meat and ice cream, which
are consumed for a long time. Storage of this type of food is stored at a temperature of -18°C
or lower.
143
Utilisation of storage being rented by each company
Storage is a facility that functions as a location for distributing goods from suppliers to end
users. In practice, each company tends to have uncertainty in demand.
This encourages the emergence of policies from the company to conduct an inventory system.
This policy encourages companies to provide storage facilities as a place to store goods.
In general, warehouse utilisation rented by each company has four objectives, namely,
reduction in transportation and production costs, coordination between supply and demand,
production needs and warehouse needs.
The benefits of the storage are as a means to support the production process, as a place to
sort goods to be sent to customers and as a place to protect goods to be safe from the
dangers of theft, fire, floods and other security problems.
Potential demand for cold storage in Indonesia
To calculate the share of cold storage demand in Indonesia, the approach is based on the
amount of production (meat, fish, fruit, vegetables, ice cream, etc.) which usually requires
storage in cold storage.
The calculation of cold storage demand is based on the assumption of storage time on
average per type of foodstuffs such as meat requirements of 80% cold storage with an
average storage time of 30 days, fish 50% with a storage time of 30 days, fruit and vegetable
products 10% with storage time of 15 and seven days, respectively. Ice cream products need
100% cold storage with a storage time of 15 days.
Based on these assumptions, the potential for cold storage needs can be known. In 2018, the
potential need for cold storage is estimated at 17.6 million tons per year. The amount
consists of cold storage needs for each product, namely, 397.0,000 tons of beef, 12.5 million
tons of frozen fish/frozen shrimp, 1.7 million tons of chicken, 2.8 million tons of fruits,
72.0,000 tons of vegetables, 42.0,000 tons of ice cream and for other needs (nugget, sausage,
pharmaceutical and other products) amounting to 24.7,000 tons.
Compared with the cold storage capacity 370,000 tons of surveyed 69 major companies
(Tables 2 and 17), the estimated needs 17.6 million tons suggest an overwhelming lack in the
supply. There would be a quite large potential to develop cold storage particularly for the
fishery sector in Indonesia.
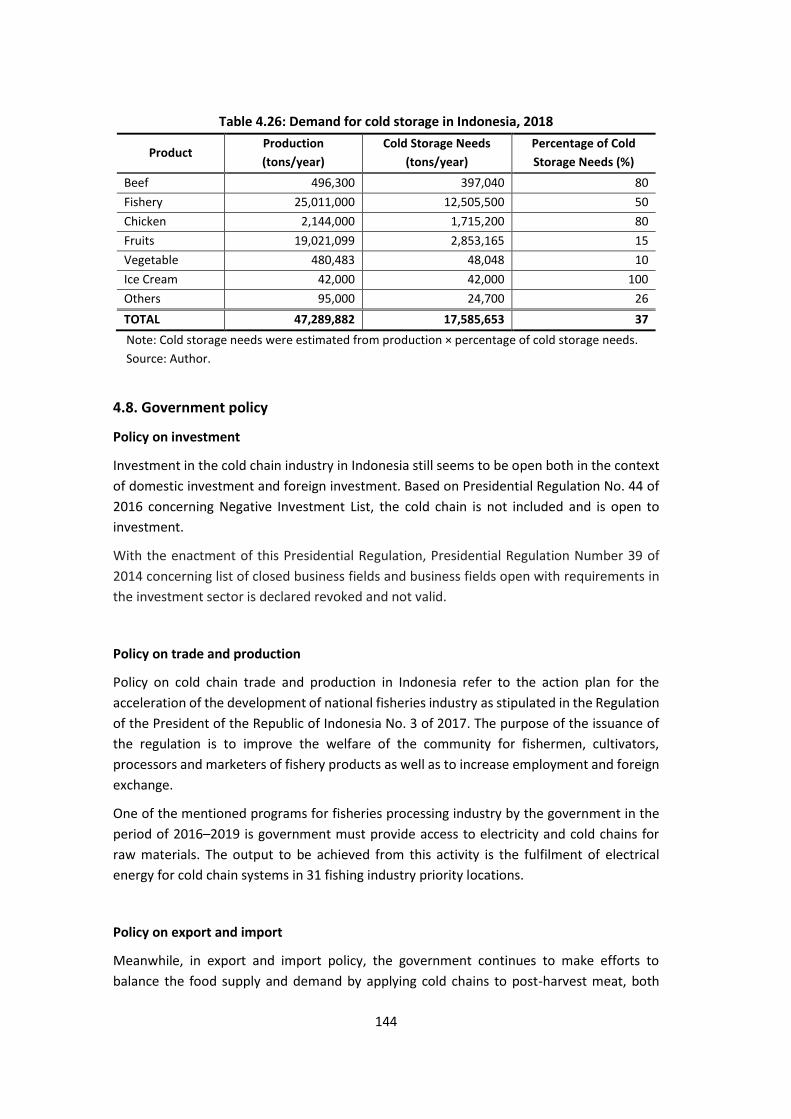
144
Table 4.26: Demand for cold storage in Indonesia, 2018
Product Production
(tons/year)
Cold Storage Needs
(tons/year)
Percentage of Cold
Storage Needs (%)
Beef 496,300 397,040 80
Fishery 25,011,000 12,505,500 50
Chicken 2,144,000 1,715,200 80
Fruits 19,021,099 2,853,165 15
Vegetable 480,483 48,048 10
Ice Cream 42,000 42,000 100
Others 95,000 24,700 26
TOTAL 47,289,882 17,585,653 37
Note: Cold storage needs were estimated from production × percentage of cold storage needs.
Source: Author.
4.8. Government policy
Policy on investment
Investment in the cold chain industry in Indonesia still seems to be open both in the context
of domestic investment and foreign investment. Based on Presidential Regulation No. 44 of
2016 concerning Negative Investment List, the cold chain is not included and is open to
investment.
With the enactment of this Presidential Regulation, Presidential Regulation Number 39 of
2014 concerning list of closed business fields and business fields open with requirements in
the investment sector is declared revoked and not valid.
Policy on trade and production
Policy on cold chain trade and production in Indonesia refer to the action plan for the
acceleration of the development of national fisheries industry as stipulated in the Regulation
of the President of the Republic of Indonesia No. 3 of 2017. The purpose of the issuance of
the regulation is to improve the welfare of the community for fishermen, cultivators,
processors and marketers of fishery products as well as to increase employment and foreign
exchange.
One of the mentioned programs for fisheries processing industry by the government in the
period of 2016–2019 is government must provide access to electricity and cold chains for
raw materials. The output to be achieved from this activity is the fulfilment of electrical
energy for cold chain systems in 31 fishing industry priority locations.
Policy on export and import
Meanwhile, in export and import policy, the government continues to make efforts to
balance the food supply and demand by applying cold chains to post-harvest meat, both
145
broiler and beef. In addition, the regulation also stipulates how to use cold storage. These
policies are issued by Minister of Agriculture Regulation No. 32 of 2017 concerning the supply,
distribution and supervision of broiler and eggs and Minister of Trade Regulation No. 20 of
2018, which is the Second Amendment of Regulation No. 59/M-Dag/Per/8/2016 concerning
provisions on exports and imports of animals and animal products.
In article 11 of the Regulation of the Minister of Trade No. 20 of 2018, it is stated that to
obtain approval for importation of animals and animal products, companies must submit
applications to the director general of import of the Ministry of Trade by attaching
requirements, including proof of ownership of cold storage and proof of ownership of
refrigerated transportation means.
Government policy on storage and transportation that uses temperature control or cooling
system
The key government policy regarding storage and transportation that uses temperature
control or cooling system is Presidential Regulation No. 71 of 2015 stating determination and
storage of basic commodity and important goods. This policy indirectly supports the role of
warehousing to ensure the smooth management of basic commodity and important goods.
The meaning of basic commodities is goods that concern the lives of many people with a high
scale of fulfilment of needs that can become a supporting factor for people’s welfare, while
important goods are strategic goods that play an important role in determining the
smoothness of national development.
The determination of basic commodities is based on the allocation of national household
expenditure for these goods, while the determination of important goods is carried out based
on the strategic nature of national development.
Types of basic commodities and/or important goods as intended include livestock and
fisheries products: beef, broiler, chicken eggs and fresh fish (milkfish, bloated and
cod/tuna/skipjack).
The regulation also states how to manage stocks and logistics by optimising inter-island trade,
monitoring stock availability in the warehouse and port, providing and optimising
distribution facilities, coordinating with relevant ministries and heads of non-ministerial
agencies in the provision of transportation modes and coordinating with ministers and heads
of non-ministerial government institutions related to the provision of stocks and reserves of
certain basic commodities controlled by the government.
Government policy supports the development of cold chain business in Indonesia
The government continues to encourage the development of cold chain business in Indonesia,
especially in the fisheries sector. The Ministry of Maritime Affairs and Fisheries has
encouraged the development of marketing facilities with cold chain systems to a number of
146
retail areas and property. This step is expected to support the distribution of capture fisheries
products to consumer centres.
The government continues to encourage the entry of investments in the cold chain industry
in Indonesia, one of which is by cooperating with several investors, including 13 Japanese
companies that participated in a business forum20 that was organised by KKP and Japan
External Trade Organization (JETRO). In this forum, the participants discussed opportunities
for investment in fisheries, especially in the construction of cold chain facilities from
upstream to downstream fisheries.
The 13 companies are FTI Japan Co., Ltd., PT Daisei Retail Indonesia, Nichirei Logistics Group
Inc., Hanwa Co., Ltd., Harada Corporation, Dah Chong Hong (Japan) Ltd., PT Seino Indomobil
Logistics, PT Sumitomo Indonesia, Taiho Shoji Co., Ltd., Zensho Holdings Co., Ltd., PT Sinfonia
Technology Indonesia, Okamoto Seihyo and Musashi Industry.
KKP hopes to attract investment from companies of Japan in the amount of Rp1 trillion this
year. With this investment, KKP wants to build direct logistics from Eastern Indonesia such as
in Makassar or Bitung. As is known so far, the map of Indonesian fisheries exports is still
centralised in the Jakarta, Surabaya and Denpasar regions.
KKP revealed that in 2018, Japan’s investment in the fisheries sector reached Rp500 billion
to Rp600 billion, and this year, it is expected to double. In addition to the cold chain sector,
other sectors that can be entered by business players are the logistics, trade and processing
sectors.
4.9. Conclusion
In general, the cold chain industry in Indonesia continues to experience growth, given the
rapid development of its industrial user such as livestock, fisheries, processed food,
pharmaceuticals and so on.
In addition, another factor that supports the development of cold chain business is the
development of network retail business and restaurants chain store in big cities and also food
and beverage processing industry as the users of cold storage. These big network retailers
are Carrefour, Giant, Hypermart and Lotte Mart, and large restaurants chain store include
Kentucky Fried Chicken, McDonald’s, Pizza Hut, Hoka-Hoka Bento and others. The ice cream
industry includes Diamond Cold Storage, Unilever and others.
These sectors are the largest users of cold storage facilities, to store their products such as
frozen food, drinks, ice cream, fruit, meat, fish and so on, which require certain cold
temperatures.
Cold chain implementation requires the provision of several facilities, both in the process of
storage and distribution. In the storage process, it needs, among others, cold storage. In
20 Indonesia–Japan business and investment forum: shaping partnership for sustainable marine and fisheries development, Jakarta, 29 January 2019.
147
Indonesia, the existence of major cold storage companies is estimated to reach 69 with a
total capacity of 370,000 tons per year.
In the next five years, cold storage needs are expected to continue to increase, which will
automatically increase the available current installed capacity. CIC estimates that by the end
of 2019, it is projected that the demand for cold storage will reach 462,700 tons, or an
additional capacity of 92,500 tons is needed from the current production capacity of 370,200
tons. And until 2024, the demand for the capacity is projected to reach 824,700 tons.
The development of cold chain business has challenges and obstacles in investment, which
are caused by infrastructure problems and the lack of fiscal facilities offered by the
government. The government has not yet provided component import duty exemption of
cold storage equipment, similarly, the provision of tax holiday facilities to build cold storage
assembly plants in the country. In addition, the lack of availability of electricity in remote
areas is also a challenge.
Cold chain needs in cold storage business in Indonesia are still quite high. Based on
Presidential Regulation Number 44 of 2016 concerning negative investment list, cold chains
are not included and are open to investment. For this reason, the government opens as wide
as possible for investors, both domestic and foreign.
References
Central Bureau of Statistics (BPS) (2019), Statistics Indonesia. https://www.bps.go.id/
(accessed 15 January 2019)
Director General of Animal Husbandry, Ministry of Agriculture (2019).
http://ditjenpkh.pertanian.go.id/index.html (accessed 15 January 2019) [in
Indonesian]
Galazka, A., J. Milstein, and M. Zaffran (1998), Thermostability of Vaccines, Global
Programme for Vaccines and Immunization, WHO/GPV/98.07, Geneva: World Health
Organization.
Johnston, W.A., F.J. Nicholson, A. Roger, and G.D. Stroud (1994), 2. Influence of Temperature,
Freezing and Refrigerated Storage in Fisheries, FAO Fisheries Technical Paper, 340,
Rome: FAO, http://www.fao.org/3/V3630E/V3630E03.htm
Ministry of Maritime Affairs and Fisheries (KKP) (2018). https://kkp.go.id/ (accessed 20
December, 2018)
Tobing, B. (2015), Rantai Pasok Pangan (Food Supply Chain), SupplyChainIndonesia, Artikel
Logistik Agrobisnis, http://supplyChainIndonesia.com/new/rantai-pasok-pangan-
food-supply-chain/ (accessed 24 June 2019) [in Indonesian]
148
Chapter 5
Inter-State and Transit Trade by Using the Cold Chain in the Lao
People’s Democratic Republic
Phanhpakit Onphanhdala21
5.1. Background of the study
The Lao People’s Democratic Republic (Lao PDR) is an agriculture-based economy in terms of
labour participation, and 60% of its labour force participates in agricultural activities (World
Bank, 2018). However, the contribution of the agricultural sector to gross domestic product
(GDP) was only 18% in 2017 (ADB, 2018). The country’s major agricultural products are rice,
starchy roots, sugarcane, and other crops, which are primarily products supplying the
domestic market with some exports to its immediate neighbours (LSB, 2018). It is obvious
that the small scale of agricultural production has experienced product loss in the supply
chain. Thongsavath et al. (2012), for example, reveals that agricultural product loss was due
to poor postharvest and transport in the case of cabbage for Champasak province in both
domestic and export supply chains. The small scale and primary production of added value
agricultural products in the Lao PDR are also due to technology and capital limitations. A
survey conducted in the Lao PDR by the Japan International Cooperation Agency (JICA) in
2012 categorised added value food products, such as processed food, into three groups as
primarily processed foods (milled rice), traditionally processed foods (fermented fish
seasoning) and processed foods by modern technology (seasonings and foods packed in
bottles and cans for long storage and long-distance transportation (JICA, 2012).
At present, the demand for food is increasing because of population growth and
consumption diversification. Four surveys of the Lao Expenditure Consumption Survey (LECS)
over the past decades have provided data on expenditure and consumption covering all
seasons and relating to aspects of every area and region in the Lao PDR. Monthly household
consumption is on a rising trend. When it comes to food consumption, surveys showed that
carbohydrate consumption has decreased, but protein and mineral consumption, such as
meat, fish, fruits, and vegetables, has increased. In other words, a variety of food
consumption is playing its role. The slow growth of higher added value agricultural products
in the Lao PDR cannot meet the higher demand in the domestic market. Therefore, demand
for imported food from its immediate neighbours has increased, such as from Thailand, Viet
Nam, and China.
Higher value-added agricultural products have been developed in many countries of ASEAN
through a set of activities from production, processing, and distribution until the products
are delivered to consumers’ hands, which is called the food value chain (Deloitte, 2015;
MAFF, 2015). Nowadays, there is considerable diversity in food consumption. The cold chain
21 National Institute for Economic Research, Lao PDR / National University of Laos.
149
has been added into part of the food value chain and aims to minimise food loss and preserve
food quality. The cold chain is the process of controlling products at proper temperatures,
especially perishable goods that have a short shelf life. This process mainly includes
precooling/freezing packaging, packing, storage, transporting (Kitinoja, 2013; GIZ, 2016). The
cold chain is widely used not only in the food industry but also the cosmetic and
pharmaceutical industries as well. It is useful to prevent food losses in many developing
countries, where rising urbanisation causes longer distances between productions areas and
consumers. Importantly, an agrarian economy, like the Lao PDR, where the expansion of
labour-intensive high-added-value sectors, such as non-timber agricultural production, helps
improve employment in rural areas, cold chain management is required to preserve product
quality.
In the Lao PDR, cold chain operations are almost entirely at the beginning stages. For
example, when producers, distributors, or traders want to transport fresh fruits, fish, and/or
vegetables from one province to another province, plastic containers and ice are needed to
preserve food quality instead of a proper cold chain system. Then a pickup truck will
transport these products to wet markets or small supermarkets. The longer distance means
more ice. As a result, when a temperature is not controlled, the colour, smell, and taste of
these fresh foods will change. This implies that the quality of the products will be affected by
heat and other conditions before reaching customers’ hands. In addition to food loss, this
also means higher food costs. High demand for the cold chain in the Lao PDR, however, does
not lead to a rising number of cold chain entrepreneurs entering the market, only some large
domestic logistics companies and foreign logistics companies that are involved in the cold
chain business.
This raises the questions: Why don’t other entrepreneurs in the Lao PDR operate a cold chain
business? What are the challenges of initiating or improving cold chain management in the
country? Moreover, how can the cold chain improve the higher value added of the Lao PDR’s
agricultural products?
In this regard, this research study aims to answer these questions by investigating the current
situation of frozen foods imported from major trade partners, the situation of the logistics
business, and cold chain management in Lao PDR. Moreover, it attempts to determine the
advantages and disadvantages of the cold chain business and how to utilise it to develop
high-value-added agricultural products for the Lao PDR.
This research will integrate quantitative analysis and qualitative analysis, with additional
results provided by direct observations. For the quantitative analysis, secondary data on
merchandised trade, especially in high value added of agricultural products, from various
domestic and international sources will be synthesised such as the ASEAN Statistics database,
the UN Comtrade database, and unpublished documents. For the qualitative analysis, the
Key Informant Interview (KII) and the Group Discussion (GD) will be employed to seek a
deeper understanding of the supply chain and cold chain management.
The background of the study is described in Section 5.1. Section 5.2 will mention about the
scope of the study based on tiers of cold chain management in the Lao PDR. Trade

150
information focusing on food imports to the Lao PDR and regulations will be shown in Section
5.3 and Section 5.4, respectively. In Section 5.5, original findings from the KII and GD will be
examined. Finally, a discussion and policy recommendations will conclude in Section 5.6.
5.2. Three tiers of cold chain management in the Lao PDR
According to the direct observations of the author, the author proposed tiers of cold chain
management in the Lao PDR as shown in Figure 5.1. The classification of these three tiers is
based on the level and volume of transport and the government authority level in the
country.
Figure 5.1: Tiers of Cold Chain Management in the Lao PDR
Source: Author’s compilation.
⚫ Tier 1 has the smallest volume of freight transport among the three tiers. It is for
internal transport within a province, which is freight transport between one district
to another district in the same province. The distribution of chilled and/or frozen
product(s) is carried out by pickup trucks or small trucks to local wet markets and
small supermarkets in town. One reason is because these trucks are suitable for a
small volume of transport and they use ice, cooling containers, and/or cooled
insulated transport boxes (not a refrigerator container), which is cheaper than a
proper temperature controlling system. Another reason is because of limitations on
truck weights in urban areas and limitations on road accessibility in rural areas,
where only smaller trucks can access.
⚫ Tier 2 is the medium volume of freight transport of the three tiers. This freight
transport is for internal transport within the country, for freight transport between
one province and another province. It is counted as the informal national level of
freight transport in cold chain logistics. Consolidated trucks will load chilled and/or
frozen products together with various kinds of other products, then distribute them
International
Tier 3: Transit
NationalTier 2:
Between provinces
Tier 1:Wihin province

151
to another province. It can be seen that sometimes consolidated trucks also play a
similar role in transport as Tier 1. For example, the transport of vegetables or fishes
from the Pakse district of Champasak province in the south to Vientiane, the capital.
Producers or traders had packed fresh vegetables or fish into ice boxes/containers
and then transported them by commercial long-distance private transport
companies, such as buses. The buses would take around 12–14 hours to travel 750
km from Champasak to Vientiane, the capital. In some cases, a consolidated truck
picked up these perishable products in Champasak and delivered to the central wet
markets in Vientiane, then its role would stop there. In addition, the truck could play
a role as a distributor to deliver these products to small wet markets.
⚫ Tier 3 is the highest level of cold chain logistics, and massive amounts of chilled
and/or frozen products are stored in proper temperature containers to preserve
their original quality. This inter-state and transit freight transport operated by both
domestic and foreign logistics companies. It is counted as a formal international
level of freight transport in cold chain logistics. In the past, Tier 3 was only inter-
state freight transport, which could be seen from the importation of frozen food
products, including fruits, meat, and vegetables by the mega project in the Lao PDR,
such as the Nam Theun 2 hydropower project. Furthermore, there were also imports
of dairy products and ice cream for supplying to supermarkets in urban areas. At
present, agricultural and food products are in high demand, both in the Lao PDR and
in nearby countries. The Lao PDR not only import chilled and/or frozen foods for
domestic consumption, but it is also a beneficiary in utilising its geographical
advantage for transit freight transport between its immediate neighbours.
The proposed three tiers of cold chain logistics are to draw a clear visual of freight transport
in the Lao PDR. Tier 1 and Tier 2 are an informal form of the cold chain, while Tier 3 is the
best starter for this research study for digging for recommendations on the high-value-added
agricultural sector development, as it is core for the fundamental improvement of people’s
livelihoods.
5.3. Overview of the situation of food imports
Currently, the Lao PDR’s major trade partners are Thailand, China and Viet Nam. In 2017,
Thailand accounted for almost 50% of trade22 in goods, while China and Viet Nam accounted
for around 26% and 14%, respectively (ASEAN Stats, 2018). In the past, trade with Thailand
and Viet Nam comprised a small volume of consumer goods along borders. In today’s world,
the international trade of the Lao PDR has expanded.
Merchandised trade transactions can be seen as a mixture between two forms, such as inter-
state and the transit of goods. The inter-state transport of goods is international freight
transport between one country to another country. The transit transport of goods is a transit
22 Both export and import.
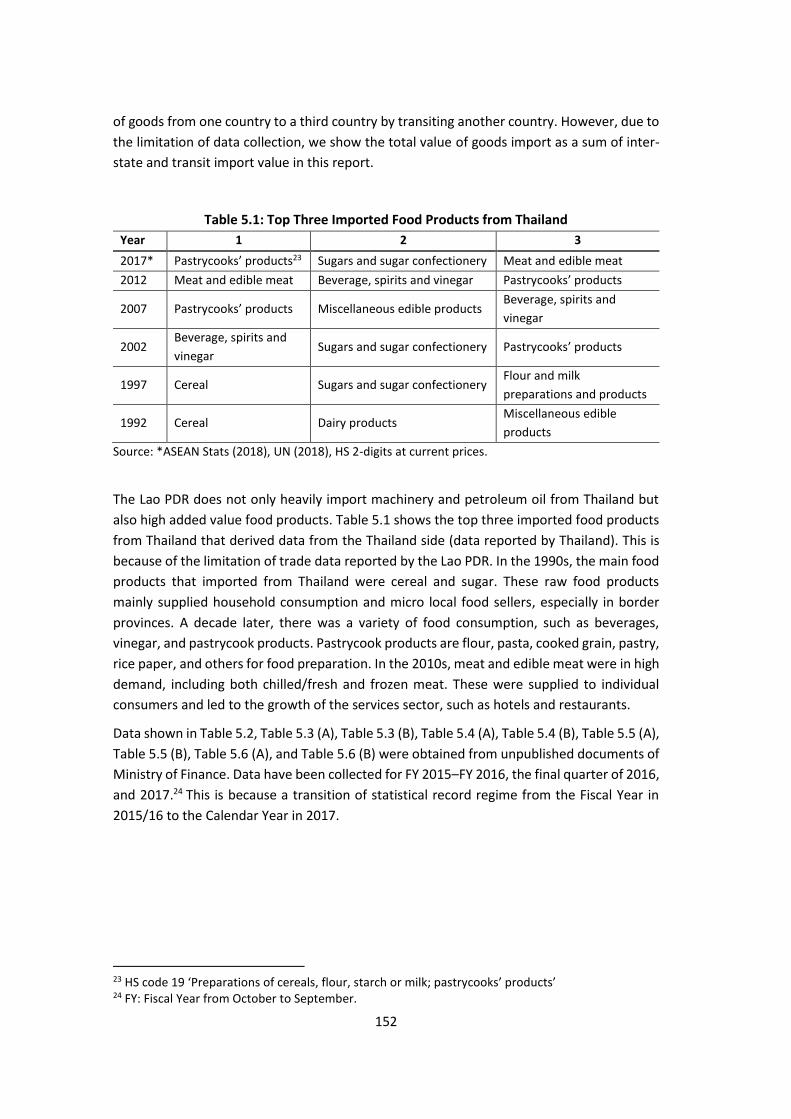
152
of goods from one country to a third country by transiting another country. However, due to
the limitation of data collection, we show the total value of goods import as a sum of inter-
state and transit import value in this report.
Table 5.1: Top Three Imported Food Products from Thailand
Year 1 2 3
2017* Pastrycooks’ products23 Sugars and sugar confectionery Meat and edible meat
2012 Meat and edible meat Beverage, spirits and vinegar Pastrycooks’ products
2007 Pastrycooks’ products Miscellaneous edible products Beverage, spirits and
vinegar
2002 Beverage, spirits and
vinegar Sugars and sugar confectionery Pastrycooks’ products
1997 Cereal Sugars and sugar confectionery Flour and milk
preparations and products
1992 Cereal Dairy products Miscellaneous edible
products
Source: *ASEAN Stats (2018), UN (2018), HS 2-digits at current prices.
The Lao PDR does not only heavily import machinery and petroleum oil from Thailand but
also high added value food products. Table 5.1 shows the top three imported food products
from Thailand that derived data from the Thailand side (data reported by Thailand). This is
because of the limitation of trade data reported by the Lao PDR. In the 1990s, the main food
products that imported from Thailand were cereal and sugar. These raw food products
mainly supplied household consumption and micro local food sellers, especially in border
provinces. A decade later, there was a variety of food consumption, such as beverages,
vinegar, and pastrycook products. Pastrycook products are flour, pasta, cooked grain, pastry,
rice paper, and others for food preparation. In the 2010s, meat and edible meat were in high
demand, including both chilled/fresh and frozen meat. These were supplied to individual
consumers and led to the growth of the services sector, such as hotels and restaurants.
Data shown in Table 5.2, Table 5.3 (A), Table 5.3 (B), Table 5.4 (A), Table 5.4 (B), Table 5.5 (A),
Table 5.5 (B), Table 5.6 (A), and Table 5.6 (B) were obtained from unpublished documents of
Ministry of Finance. Data have been collected for FY 2015–FY 2016, the final quarter of 2016,
and 2017.24 This is because a transition of statistical record regime from the Fiscal Year in
2015/16 to the Calendar Year in 2017.
23 HS code 19 ‘Preparations of cereals, flour, starch or milk; pastrycooks’ products’ 24 FY: Fiscal Year from October to September.

153
Figure 5.2: Maps of international borders
Notes: There are 27 international immigration checkpoints in total. This map does not include all international immigration checkpoints but only major ones that recorded a frozen food product movement. R3, R8, R9, and R12 denote National Roads No. 3, 8, 9, and 12, respectively. Source: Author’s compilation.
Table 5.2 shows inter-state and transit import value by the international borders of Lao PDR
between the period of FY 2013–2017. Based on secondary data from unpublished
documents25, it can be seen that a massive number of frozen/chilled/fresh food products26
requiring temperature control have been formally imported since 2015. Before this, frozen
products were probably imported individually by informal traders. For example,
frozen/chilled/fresh food products had been imported, then distributed to wet markets or
sold them at their own minimarkets. Since 2015, a proportion of frozen/chilled/fresh food
products import was more than 80% of total inter-state and transit import. The top five major
borders crossed by frozen food products trade values are 1. The 3rd Lao–Thai Friendship
Bridge (11), 2. The 2nd Lao–Thai Friendship Bridge (13), 3. Na Phao (12), 4. Dansavan (14), and
5. The 4th Lao–Thai Friendship Bridge (2), see the map in Figure 5.2. This implies that Thailand
is a major exporter of the Lao PDR, followed by Viet Nam.
25 Documents obtained from the Ministry of Finance. 26 Frozen/chilled/fresh food products include mainly livestock and aquatic products, and others such as fruit and vegetable products. While this value consists of frozen, chilled, and fresh products, most of that is frozen products.
R3
R8
R12
R9
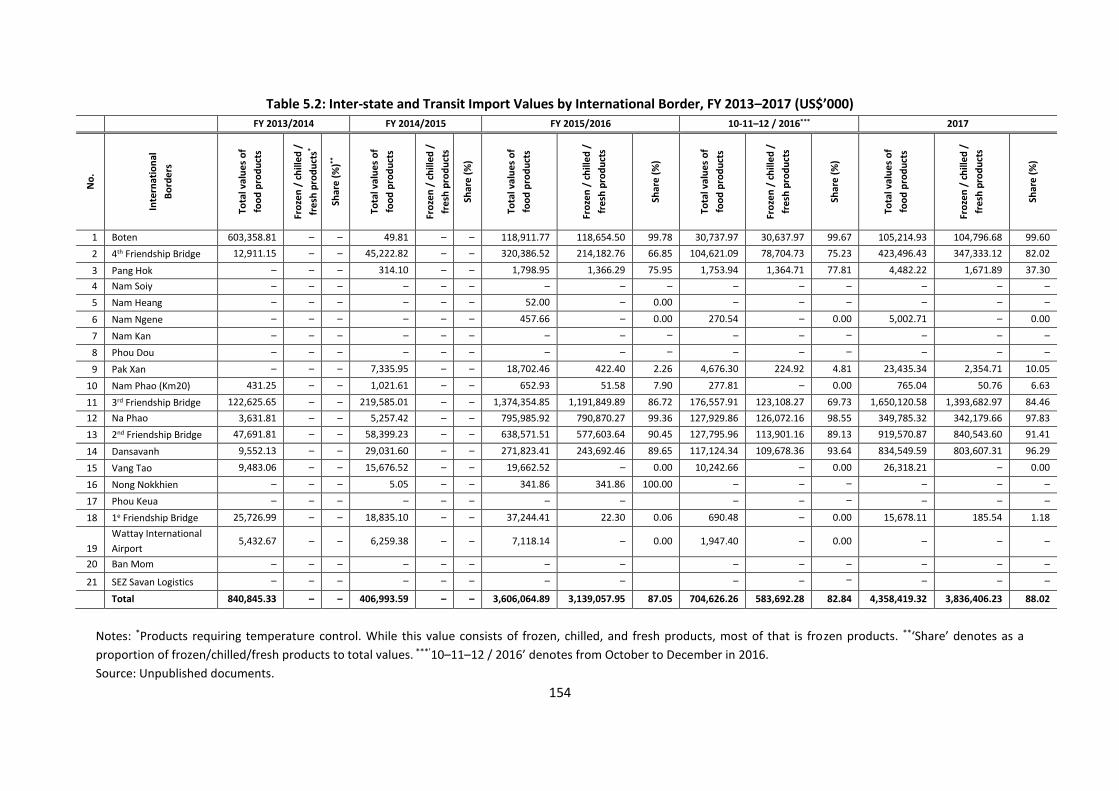
154
Table 5.2: Inter-state and Transit Import Values by International Border, FY 2013–2017 (US$’000)
FY 2013/2014 FY 2014/2015 FY 2015/2016 10-11–12 / 2016*** 2017
No
.
Inte
rnat
ion
al
Bo
rde
rs
Tota
l val
ue
s o
f
foo
d p
rod
uct
s
Fro
zen
/ c
hill
ed
/
fre
sh p
rod
uct
s*
Shar
e (
%)*
*
Tota
l val
ue
s o
f
foo
d p
rod
uct
s
Fro
zen
/ c
hill
ed
/
fre
sh p
rod
uct
s
Shar
e (
%)
Tota
l val
ue
s o
f
foo
d p
rod
uct
s
Fro
zen
/ c
hill
ed
/
fre
sh p
rod
uct
s
Shar
e (
%)
Tota
l val
ue
s o
f
foo
d p
rod
uct
s
Fro
zen
/ c
hill
ed
/
fre
sh p
rod
uct
s
Shar
e (
%)
Tota
l val
ue
s o
f
foo
d p
rod
uct
s
Fro
zen
/ c
hill
ed
/
fre
sh p
rod
uct
s
Shar
e (
%)
1 Boten 603,358.81 – – 49.81 – – 118,911.77 118,654.50 99.78 30,737.97 30,637.97 99.67 105,214.93 104,796.68 99.60
2 4th Friendship Bridge 12,911.15 – – 45,222.82 – – 320,386.52 214,182.76 66.85 104,621.09 78,704.73 75.23 423,496.43 347,333.12 82.02
3 Pang Hok – – – 314.10 – – 1,798.95 1,366.29 75.95 1,753.94 1,364.71 77.81 4,482.22 1,671.89 37.30
4 Nam Soiy – – – – – – – – – – – – – – –
5 Nam Heang – – – – – – 52.00 – 0.00 – – – – – –
6 Nam Ngene – – – – – – 457.66 – 0.00 270.54 – 0.00 5,002.71 – 0.00
7 Nam Kan – – – – – – – – – – – – – – –
8 Phou Dou – – – – – – – – – – – – – – –
9 Pak Xan – – – 7,335.95 – – 18,702.46 422.40 2.26 4,676.30 224.92 4.81 23,435.34 2,354.71 10.05
10 Nam Phao (Km20) 431.25 – – 1,021.61 – – 652.93 51.58 7.90 277.81 – 0.00 765.04 50.76 6.63
11 3rd Friendship Bridge 122,625.65 – – 219,585.01 – – 1,374,354.85 1,191,849.89 86.72 176,557.91 123,108.27 69.73 1,650,120.58 1,393,682.97 84.46
12 Na Phao 3,631.81 – – 5,257.42 – – 795,985.92 790,870.27 99.36 127,929.86 126,072.16 98.55 349,785.32 342,179.66 97.83
13 2nd Friendship Bridge 47,691.81 – – 58,399.23 – – 638,571.51 577,603.64 90.45 127,795.96 113,901.16 89.13 919,570.87 840,543.60 91.41
14 Dansavanh 9,552.13 – – 29,031.60 – – 271,823.41 243,692.46 89.65 117,124.34 109,678.36 93.64 834,549.59 803,607.31 96.29
15 Vang Tao 9,483.06 – – 15,676.52 – – 19,662.52 – 0.00 10,242.66 – 0.00 26,318.21 – 0.00
16 Nong Nokkhien – – – 5.05 – – 341.86 341.86 100.00 – – – – – –
17 Phou Keua – – – – – – – – – – – – – –
18 1e Friendship Bridge 25,726.99 – – 18,835.10 – – 37,244.41 22.30 0.06 690.48 – 0.00 15,678.11 185.54 1.18
19
Wattay International
Airport 5,432.67 – – 6,259.38 – – 7,118.14 – 0.00 1,947.40 – 0.00 – – –
20 Ban Mom – – – – – – – – – – – – – –
21 SEZ Savan Logistics – – – – – – – – – – – – – –
Total 840,845.33 – – 406,993.59 – – 3,606,064.89 3,139,057.95 87.05 704,626.26 583,692.28 82.84 4,358,419.32 3,836,406.23 88.02
Notes: *Products requiring temperature control. While this value consists of frozen, chilled, and fresh products, most of that is frozen products. **‘Share’ denotes as a
proportion of frozen/chilled/fresh products to total values. ***’10–11–12 / 2016’ denotes from October to December in 2016.
Source: Unpublished documents.

155
Table 5.3: Inter-state and Transit Import Values of Chilled and Frozen Products by Border,
FY 2015–2017
A. In US$’000
No. Borders FY 2015/2016 10–11–12/2016 2017 Sub-total
Border with Thailand
11 3rd Friendship Bdg. 390,828 153,818 394,204 938,850
2 4th Friendship Bdg. 43,862 – 118,477 162,339
13 2nd Friendship Bdg. 847 28,520 26,004 55,371
9 Pak Xan – – 83 83
Border with China
1 Boten – – – –
Border with Viet Nam
3 Pang Hok 9,320 – 3,278 12,598
Total 444,857 182,339 542,046 1,169,242
B. In ‘000 kg
No. Borders FY 2015/2016 10–11–12/2016 2017 Sub-total
Border with Thailand
11 3rd Friendship Bdg. 8,840 7,556 14,112 30,509
2 4th Friendship Bdg. 1,376 – 8,558 9,933
13 2nd Friendship Bdg. 109 3,672 3,348 7,129
9 Pak Xan – – 2 2
Border with China
1 Boten – – – –
Border with Viet Nam
3 Pang Hok 992 – 225 1,217
Total 11,317 11,228 26,245 48,790
Source: Unpublished documents.
Frozen food products have been transported from mostly Thailand through the 3rd Lao–Thai
Friendship Bridge crossing border between Khammouan and Nakhon Pranom (11). Another
important border is the 2nd Lao–Thai Friendship Bridge between Savannakhet and Mukdahan
(13) as shown in Table 5.3 (A) and (B). This is because Route No. 12, which goes through
Khammouan province of the Lao PDR and connects Thailand and Viet Nam’s borders, is
shorter than Route No. 9 of Savannakhet province. Moreover, there is a significant change in
transit products, such as fresh fruits from Thailand to China through the 4th Lao–Thai
Friendship Bridge (2) to Boten border (1). Trade between China and Viet Nam can be seen
through the route in the Lao PDR through Boten border (1) to the Pang Hok border (3). It is
worth noting that the top-three trade partners of the Lao PDR are Thailand, China, and Viet
Nam (Table 5.4 (A) and (B), Table 5.5 (A) and (B).
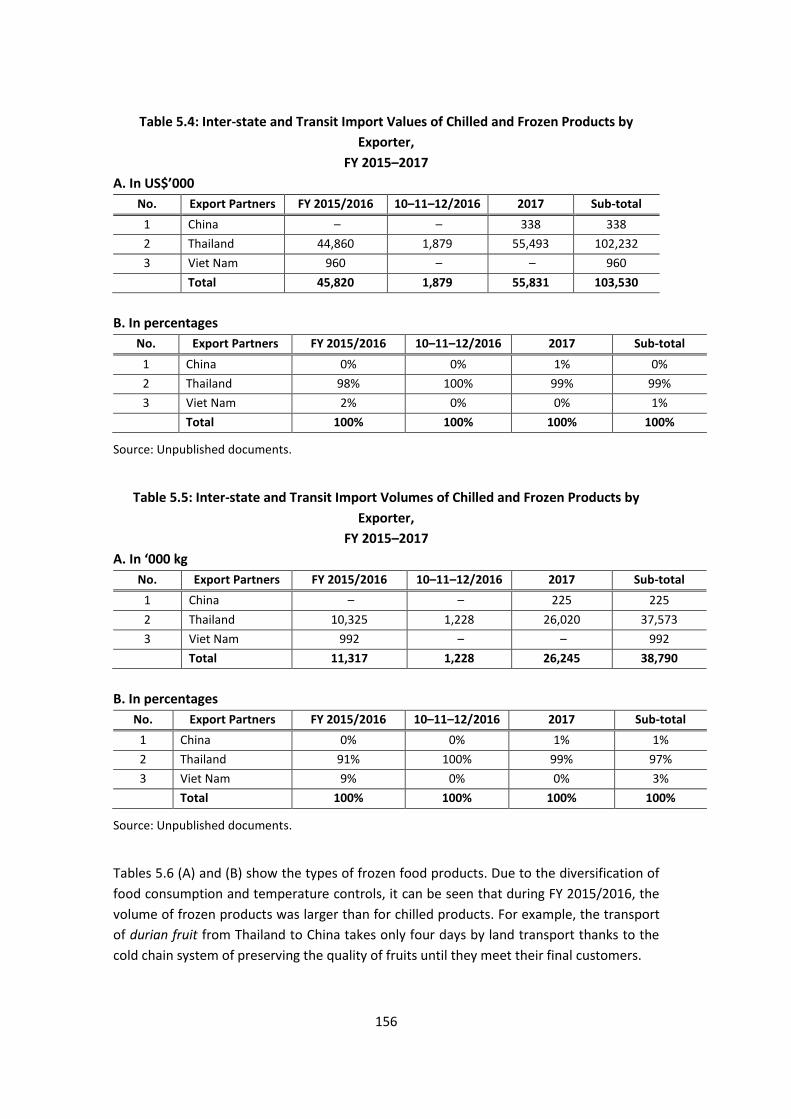
156
Table 5.4: Inter-state and Transit Import Values of Chilled and Frozen Products by
Exporter,
FY 2015–2017
A. In US$’000
No. Export Partners FY 2015/2016 10–11–12/2016 2017 Sub-total
1 China – – 338 338
2 Thailand 44,860 1,879 55,493 102,232
3 Viet Nam 960 – – 960 Total 45,820 1,879 55,831 103,530
B. In percentages
No. Export Partners FY 2015/2016 10–11–12/2016 2017 Sub-total
1 China 0% 0% 1% 0%
2 Thailand 98% 100% 99% 99%
3 Viet Nam 2% 0% 0% 1% Total 100% 100% 100% 100%
Source: Unpublished documents.
Table 5.5: Inter-state and Transit Import Volumes of Chilled and Frozen Products by
Exporter,
FY 2015–2017
A. In ‘000 kg
No. Export Partners FY 2015/2016 10–11–12/2016 2017 Sub-total
1 China – – 225 225
2 Thailand 10,325 1,228 26,020 37,573
3 Viet Nam 992 – – 992 Total 11,317 1,228 26,245 38,790
B. In percentages
No. Export Partners FY 2015/2016 10–11–12/2016 2017 Sub-total
1 China 0% 0% 1% 1%
2 Thailand 91% 100% 99% 97%
3 Viet Nam 9% 0% 0% 3% Total 100% 100% 100% 100%
Source: Unpublished documents.
Tables 5.6 (A) and (B) show the types of frozen food products. Due to the diversification of
food consumption and temperature controls, it can be seen that during FY 2015/2016, the
volume of frozen products was larger than for chilled products. For example, the transport
of durian fruit from Thailand to China takes only four days by land transport thanks to the
cold chain system of preserving the quality of fruits until they meet their final customers.
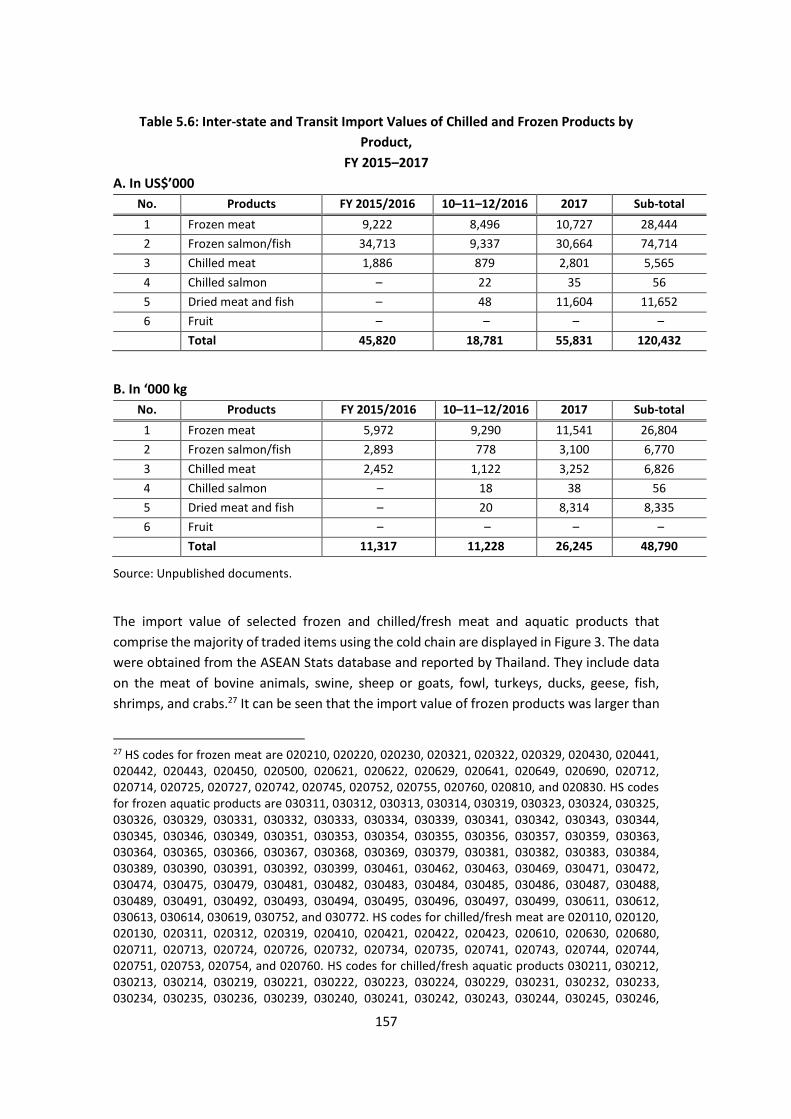
157
Table 5.6: Inter-state and Transit Import Values of Chilled and Frozen Products by
Product,
FY 2015–2017
A. In US$’000
No. Products FY 2015/2016 10–11–12/2016 2017 Sub-total
1 Frozen meat 9,222 8,496 10,727 28,444
2 Frozen salmon/fish 34,713 9,337 30,664 74,714
3 Chilled meat 1,886 879 2,801 5,565
4 Chilled salmon – 22 35 56
5 Dried meat and fish – 48 11,604 11,652
6 Fruit – – – – Total 45,820 18,781 55,831 120,432
B. In ‘000 kg
No. Products FY 2015/2016 10–11–12/2016 2017 Sub-total
1 Frozen meat 5,972 9,290 11,541 26,804
2 Frozen salmon/fish 2,893 778 3,100 6,770
3 Chilled meat 2,452 1,122 3,252 6,826
4 Chilled salmon – 18 38 56
5 Dried meat and fish – 20 8,314 8,335
6 Fruit – – – – Total 11,317 11,228 26,245 48,790
Source: Unpublished documents.
The import value of selected frozen and chilled/fresh meat and aquatic products that
comprise the majority of traded items using the cold chain are displayed in Figure 3. The data
were obtained from the ASEAN Stats database and reported by Thailand. They include data
on the meat of bovine animals, swine, sheep or goats, fowl, turkeys, ducks, geese, fish,
shrimps, and crabs.27 It can be seen that the import value of frozen products was larger than
27 HS codes for frozen meat are 020210, 020220, 020230, 020321, 020322, 020329, 020430, 020441, 020442, 020443, 020450, 020500, 020621, 020622, 020629, 020641, 020649, 020690, 020712, 020714, 020725, 020727, 020742, 020745, 020752, 020755, 020760, 020810, and 020830. HS codes for frozen aquatic products are 030311, 030312, 030313, 030314, 030319, 030323, 030324, 030325, 030326, 030329, 030331, 030332, 030333, 030334, 030339, 030341, 030342, 030343, 030344, 030345, 030346, 030349, 030351, 030353, 030354, 030355, 030356, 030357, 030359, 030363, 030364, 030365, 030366, 030367, 030368, 030369, 030379, 030381, 030382, 030383, 030384, 030389, 030390, 030391, 030392, 030399, 030461, 030462, 030463, 030469, 030471, 030472, 030474, 030475, 030479, 030481, 030482, 030483, 030484, 030485, 030486, 030487, 030488, 030489, 030491, 030492, 030493, 030494, 030495, 030496, 030497, 030499, 030611, 030612, 030613, 030614, 030619, 030752, and 030772. HS codes for chilled/fresh meat are 020110, 020120, 020130, 020311, 020312, 020319, 020410, 020421, 020422, 020423, 020610, 020630, 020680, 020711, 020713, 020724, 020726, 020732, 020734, 020735, 020741, 020743, 020744, 020744, 020751, 020753, 020754, and 020760. HS codes for chilled/fresh aquatic products 030211, 030212, 030213, 030214, 030219, 030221, 030222, 030223, 030224, 030229, 030231, 030232, 030233, 030234, 030235, 030236, 030239, 030240, 030241, 030242, 030243, 030244, 030245, 030246,

158
for chilled/fresh products. This is because they all are perishable products that have a short
shelf life. There is a requirement of the cold chain to precool or freeze products in order to
extend their shelf life until delivery to customers. On the contrary, the frozen vegetables and
fruits import value was relatively smaller than for chilled/fresh vegetables and fruits as
shown in Figure 4.28 This included potatoes, peas, beans, legumes, spinach, sweet corn,
mixed vegetables, and fruits. This is because the freezing process changes the taste of
vegetables and fruits.
It is often said that cold chain management is playing an important role in high-value-added
agricultural production. This system and less transport time can guarantee quality and the
taste of food products that have a short shelf life. But how can the Lao PDR gain such an
advantage from its geography to enhance trade integration in the course of cold chain
logistics and more importantly to enhance local agricultural production in order to supply the
domestic and regional markets, when the Lao PDR is an importer not an exporter?
Figure 5.3: Selected Meat and Aquatic Products, Import Value from Thailand (in US$’000)
030247, 030249, 030250, 030251, 040252, 030253, 030254, 030255, 030256, 030259, 030261, 030262, 030263, 030264, 030265, 030266, 030267, 030268, 030269, 030271, 030272, 030273, 030274, 030279, 030281, 030282, 030283, 030284, 030285, 030289, 030290, 030291, 030292, 030299, 030410, 030411, 030412, 030419, 030431, 030432, 030433, 030439, 0304391, 030441, 030442, 030443, 030444, 030445, 030446, 030447, 030448, 030449, 030451, 030452, 030453, 030454, 030454, 030455, 030456, 030457, and 030459. 28 HS code for frozen vegetables is 0710. HS code for frozen fruits is 0811. HS code for chilled/fresh vegetables are 070110, 070190, 070200, 070310, 070320, 070390, 070410, 070420, 070490, 070511, 070519, 070521, 070529, 070600, 070610, 00690, 070700, 070810, 070820, 070890, 070910, 070920, 070930, 070940, 070951, 070952, 070959, 070960, 070970, 070990, 070991, 070992, 070993, and 070999. HS code for chilled/fresh fruits are 080100, 080111, 080112, 080119, 080220, 080121, 080122, 080130, 080131, 080132, 080200, 080211, 080212, 080221, 080222, 080231, 080232, 080240, 080241, 080242, 080250, 080251, 080260, 080261, 080262, 080270, 080280, 080290, 080300, 080310, 080390, 080410, 080420, 080430, 080440, 080450, 080500, 080510, 080520, 080520, 080521, 080522, 080529, 080530, 080540, 080550, 080590, 080610, 080700, 080710, 080711, 080719, 080800, 080810, 080820, 080830, 080840, 080910, 080920, 080921, 080929, 080930, 080940, 081000, 081010, 081020, 081030, 081040, 081050, 081060, 081070, and 081090.
21,104
101,025
117,950 125,352
163,450
130,740 118,737
97,359
854 2,198 9,490
596 1,626 863 2,138 1,560 0
20,000
40,000
60,000
80,000
100,000
120,000
140,000
160,000
180,000
2010 2011 2012 2013 2014 2015 2016 2017
Frozen meat and aquatic product Chilled/Fresh meat and aquatic product

159
Source: ASEAN Stats (2018), at current prices.
Figure 5.4: Vegetable and Fruit Import Value from Thailand (in US$’000)
Source: ASEAN Stats (2018), at current prices.
5.4. Trade and freight transport regulations in the Lao PDR
International trade is relevant to inter-state and transit freight transport. Regulations related
to inter-state and transit transport and regular transport were proposed for trade facilitation.
It is easier to access these regulations nowadays compared to over the past decade, when
most regulations were in the Lao language with difficulties in translating them into English.
As we can see, there are more customs formalities that have been promulgated than
transport regulations. First, this is because the Customs Department plays a major role in
customs clearance. Second, there are requirements from international agencies that enforce
the Lao PDR to improve soft infrastructure in order to enhance international trade
integration.
Table 5.7 shows the laws, regulations, and customs formalities related to inter-state and
transit transport. They have been classified by level of authority, such as law, decree,
decision, instruction, notification, and official letter. Sometimes, an instruction and a
notification can be promulgated at the ministry or provincial level based on the current
situation. Customs formalities have general principles on export–import and the transit and
movement of goods within the Lao PDR. The movement of goods also covers transit goods,
temporary importation, and import for re-export vehicle and fuel. In addition, customs
formalities include the National Single Window implementation, customs declaration,
electronic customs clearance system (ASYCUDA), and fee and services charges. It can be seen
that these regulations provide general principles for general goods movements but miss
regulating principles related to perishable goods that require the fastest customs clearance.
In the course of transport regulations, this study categorised them by transport component,
such as law enforcement, driving licence, truck standard, truck weight limitation, driving
speed limitation, and measure against violators and punishment (Table 5.8). Regulations on
4 6 65 83 71 52 28 90
10,509 10,923
791 1,757
3,475
8,427
15,437
11,540
0
2,000
4,000
6,000
8,000
10,000
12,000
14,000
16,000
18,000
2010 2011 2012 2013 2014 2015 2016 2017
Frozen vegetables and fruits Chilled/fresh vegetables and fruits
160
transport are mainly authorised by the Ministry of Public Works and Transport, which include
land transport and land traffic. However, these regulations provide general statements on
truck limitations, but lack of regulations related to truck bans and unqualified technical
trucks, etc. Measures against violators only refer to fee and fine charges and have weak
statements about enforcement. On the other hand, regulations for special goods transport
are limited. There are only a few types of dangerous goods, such as cooking gas, fuel, ozone
depleting substances (ODS), and explosive substances. For prohibition goods that are
relevant to national security, regulations are authorised by the Ministry of National Defense
and the Ministry of Public Security. Furthermore, the management of consolidated trucks
and cold chain logistics is limited in terms of regulations.
To sum up, regulations on inter-state and transit transport are limited and provide only
general content in terms of principles, roles, responsibilities, and measures. The
management of goods movement is stated in general, but it is rare when it comes to
perishable goods that have a short shelf life. The statement in many regulations is rather
ambiguous and unclear. In addition, regulation enforcement is weak and not integrated.
Therefore, it makes implementation complicated for both relevant agencies and the
importers and exporters. Some of them probably abuse the regulations gap to avoid some
procedures, while some of them might struggle with the numbers of procedures, which
require more cost and time.
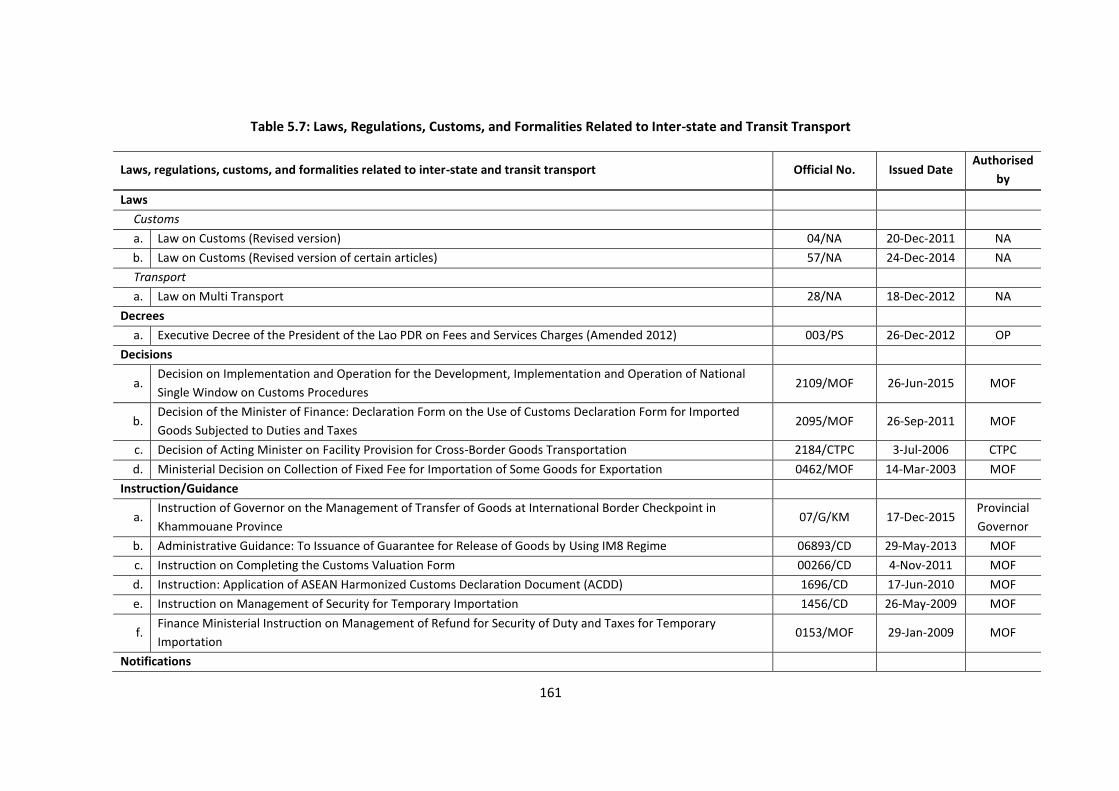
161
Table 5.7: Laws, Regulations, Customs, and Formalities Related to Inter-state and Transit Transport
Laws, regulations, customs, and formalities related to inter-state and transit transport Official No. Issued Date Authorised
by
Laws
Customs
a. Law on Customs (Revised version) 04/NA 20-Dec-2011 NA
b. Law on Customs (Revised version of certain articles) 57/NA 24-Dec-2014 NA
Transport
a. Law on Multi Transport 28/NA 18-Dec-2012 NA
Decrees
a. Executive Decree of the President of the Lao PDR on Fees and Services Charges (Amended 2012) 003/PS 26-Dec-2012 OP
Decisions
a. Decision on Implementation and Operation for the Development, Implementation and Operation of National
Single Window on Customs Procedures 2109/MOF 26-Jun-2015 MOF
b. Decision of the Minister of Finance: Declaration Form on the Use of Customs Declaration Form for Imported
Goods Subjected to Duties and Taxes 2095/MOF 26-Sep-2011 MOF
c. Decision of Acting Minister on Facility Provision for Cross-Border Goods Transportation 2184/CTPC 3-Jul-2006 CTPC
d. Ministerial Decision on Collection of Fixed Fee for Importation of Some Goods for Exportation 0462/MOF 14-Mar-2003 MOF
Instruction/Guidance
a. Instruction of Governor on the Management of Transfer of Goods at International Border Checkpoint in
Khammouane Province 07/G/KM 17-Dec-2015
Provincial
Governor
b. Administrative Guidance: To Issuance of Guarantee for Release of Goods by Using IM8 Regime 06893/CD 29-May-2013 MOF
c. Instruction on Completing the Customs Valuation Form 00266/CD 4-Nov-2011 MOF
d. Instruction: Application of ASEAN Harmonized Customs Declaration Document (ACDD) 1696/CD 17-Jun-2010 MOF
e. Instruction on Management of Security for Temporary Importation 1456/CD 26-May-2009 MOF
f. Finance Ministerial Instruction on Management of Refund for Security of Duty and Taxes for Temporary
Importation 0153/MOF 29-Jan-2009 MOF
Notifications
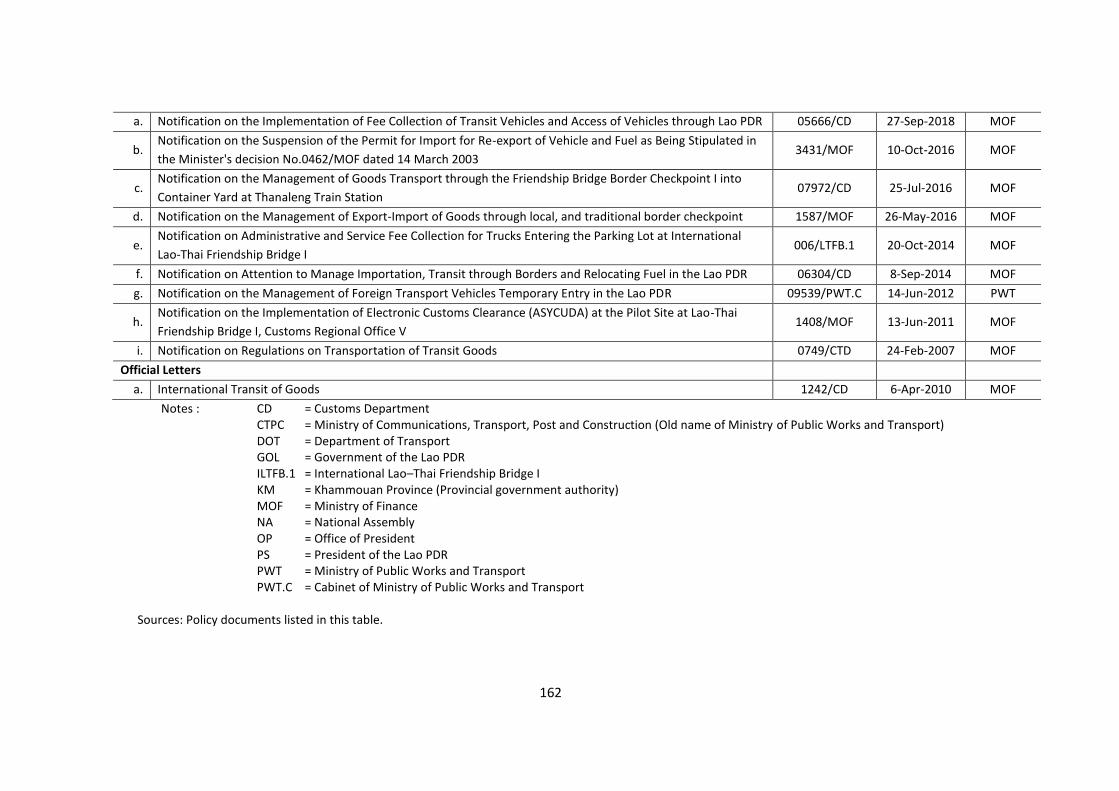
162
a. Notification on the Implementation of Fee Collection of Transit Vehicles and Access of Vehicles through Lao PDR 05666/CD 27-Sep-2018 MOF
b. Notification on the Suspension of the Permit for Import for Re-export of Vehicle and Fuel as Being Stipulated in
the Minister's decision No.0462/MOF dated 14 March 2003 3431/MOF 10-Oct-2016 MOF
c. Notification on the Management of Goods Transport through the Friendship Bridge Border Checkpoint I into
Container Yard at Thanaleng Train Station 07972/CD 25-Jul-2016 MOF
d. Notification on the Management of Export-Import of Goods through local, and traditional border checkpoint 1587/MOF 26-May-2016 MOF
e. Notification on Administrative and Service Fee Collection for Trucks Entering the Parking Lot at International
Lao-Thai Friendship Bridge I 006/LTFB.1 20-Oct-2014 MOF
f. Notification on Attention to Manage Importation, Transit through Borders and Relocating Fuel in the Lao PDR 06304/CD 8-Sep-2014 MOF
g. Notification on the Management of Foreign Transport Vehicles Temporary Entry in the Lao PDR 09539/PWT.C 14-Jun-2012 PWT
h. Notification on the Implementation of Electronic Customs Clearance (ASYCUDA) at the Pilot Site at Lao-Thai
Friendship Bridge I, Customs Regional Office V 1408/MOF 13-Jun-2011 MOF
i. Notification on Regulations on Transportation of Transit Goods 0749/CTD 24-Feb-2007 MOF
Official Letters
a. International Transit of Goods 1242/CD 6-Apr-2010 MOF
Notes : CD = Customs Department CTPC = Ministry of Communications, Transport, Post and Construction (Old name of Ministry of Public Works and Transport) DOT = Department of Transport GOL = Government of the Lao PDR ILTFB.1 = International Lao–Thai Friendship Bridge I KM = Khammouan Province (Provincial government authority) MOF = Ministry of Finance NA = National Assembly OP = Office of President PS = President of the Lao PDR PWT = Ministry of Public Works and Transport PWT.C = Cabinet of Ministry of Public Works and Transport
Sources: Policy documents listed in this table.

163
Table 5.8: Laws and Regulations on Transport
Laws and regulations on transport Official No. Issued Date Authorised
by
Laws
a. Law on Land Transport 24/NA 12-Dec-2012 PWT
b. Law on Land Traffic 23/NA 12-Dec-2012 PWT
Driving license
a. Regulation on Management and Driving License Examination of Land Transport Vehicles 3416/MCTPC 4-Sep-2002 PWT
b. Guideline on Request for Changing a Driving License, Using Different Types of Driving Licenses, Conditions for Using and Requesting a New Driving License to Replace a Lost License
9051/DoT 8-Oct-2002 PWT
c. Guideline on Criteria for Applicants for Lao Citizen Driving License Examination 906/DoT 8-Oct-2002 PWT
d. Guideline on Driving Examination Regulation 907/DoT 8-Oct-2002 PWT
Trucking standard
a. Provisions on the Technical Standards and Accessories of Vehicles that are Authorized for Import for Registering and Assembling for Using in Lao PDR
4312/MCTPC 11-Nov-2002 PWT
Truck weight
a. Regulation on Approval of Total Maximum Weight of Trucks 13848/MPWT 26-Sep-2013 PWT
b. Decision of the Minister of Public Works and Transport on Management of Truck Weight Measurement Countrywide
20480/MPWT 29-Dec-2011 PWT
c. Decision on the Approval of Total Maximum Weight if 22-Wheel/6-Axle Trucks (Semi-trailer trucks) 5064/MPWT 21-Apr-2009 PWT
e. Instruction to Inspect and Manage Heavy Trucks (Weight Measurement) for 24 hours 736/MCTPC 21-Feb-2001 CTPC
Speed limitation
a. Links to the Law on Land Traffic, No.23/NA, dated 12/12/2012, Article 19
Punishments
a. Decree on Fines and Measures against Violators of Laws and Regulations on Road Traffic, Land Transportation and Protection of National Roads
188/PM 3-Jul-2007 PWT
Transport business
a. Decision of Minister on Regulation Management Operate Business on Public Works and Transport 17582/MPWT 8-Aug-2010 PWT
Sources: Policy documents listed in this table.
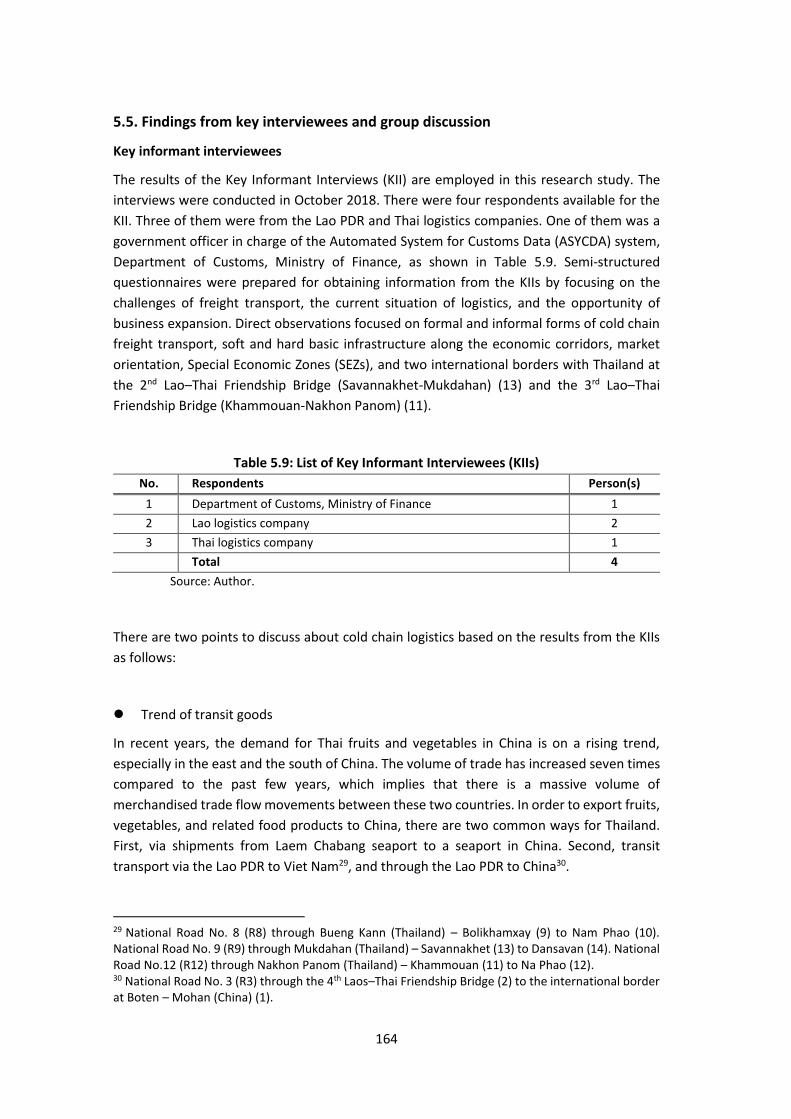
164
5.5. Findings from key interviewees and group discussion
Key informant interviewees
The results of the Key Informant Interviews (KII) are employed in this research study. The
interviews were conducted in October 2018. There were four respondents available for the
KII. Three of them were from the Lao PDR and Thai logistics companies. One of them was a
government officer in charge of the Automated System for Customs Data (ASYCDA) system,
Department of Customs, Ministry of Finance, as shown in Table 5.9. Semi-structured
questionnaires were prepared for obtaining information from the KIIs by focusing on the
challenges of freight transport, the current situation of logistics, and the opportunity of
business expansion. Direct observations focused on formal and informal forms of cold chain
freight transport, soft and hard basic infrastructure along the economic corridors, market
orientation, Special Economic Zones (SEZs), and two international borders with Thailand at
the 2nd Lao–Thai Friendship Bridge (Savannakhet-Mukdahan) (13) and the 3rd Lao–Thai
Friendship Bridge (Khammouan-Nakhon Panom) (11).
Table 5.9: List of Key Informant Interviewees (KIIs)
No. Respondents Person(s)
1 Department of Customs, Ministry of Finance 1
2 Lao logistics company 2
3 Thai logistics company 1
Total 4
Source: Author.
There are two points to discuss about cold chain logistics based on the results from the KIIs
as follows:
⚫ Trend of transit goods
In recent years, the demand for Thai fruits and vegetables in China is on a rising trend,
especially in the east and the south of China. The volume of trade has increased seven times
compared to the past few years, which implies that there is a massive volume of
merchandised trade flow movements between these two countries. In order to export fruits,
vegetables, and related food products to China, there are two common ways for Thailand.
First, via shipments from Laem Chabang seaport to a seaport in China. Second, transit
transport via the Lao PDR to Viet Nam29, and through the Lao PDR to China30.
29 National Road No. 8 (R8) through Bueng Kann (Thailand) – Bolikhamxay (9) to Nam Phao (10). National Road No. 9 (R9) through Mukdahan (Thailand) – Savannakhet (13) to Dansavan (14). National Road No.12 (R12) through Nakhon Panom (Thailand) – Khammouan (11) to Na Phao (12). 30 National Road No. 3 (R3) through the 4th Laos–Thai Friendship Bridge (2) to the international border at Boten – Mohan (China) (1).
165
Transporting perishable products, such as fruits and vegetables, requires short distances and
durations to preserve quality because the transport time directly affects the quality and taste
of fruits and vegetables. The duration of goods transport from Laem Chabang, Thailand to
China’s seaport takes around 10 to 12 days, with almost 50% cheaper costs than land freight
transport, even though the distance is longer than through the land mode. For example, 70%
of durian exports from Thailand to China via land transport takes around 4 days in total (e.g.
transport and customs clearance), by going through the 4th Lao–Thai Friendship Bridge (2). In
the past, there was smuggling at a route between Houaysay, Bokeo province to China border.
The KII informed that, however, goods transport inspection is strict now’s a day. So, a legal
trade volume between Thailand and China via this route is around 30% of total volume.
⚫ Key factors of logistics and the cold chain and business competitors
National Road No. 12 (R12) of the Lao PDR, connecting Nakhon Panom, Thailand, to Viet Nam
(11 to 12) is the main mode of transport, while the National Road No. 9 (EWEC31, 13 to 14)
and National Road No. 3 (R3) (2 to 1) are the supplementary routes informed by the KIIs.
Firstly, this was because the R12 is shorter than R9 in terms of distance and time. Secondly,
this was because of the bad road condition of R9 that was damaged by overweight trucks
loading minerals. Thirdly, it connects Thailand, the Lao PDR, and Viet Nam, then Vung Ang
seaport, for transport through the maritime mode to China and Japan. This route is also a
gateway to the New East–West Corridor for North-Eastern Thailand, the Lao PDR, and Viet
Nam.
The KIIs informed that the Lao PDR–China Railway Project is also a key factor that might
change this business game. This railway will connect Thailand, the Lao PDR, China, Russia,
and Europe by different modes of transport as a part of the One Belt One Road strategy of
China. Goods transport will be changed from different modes to another. For example,
transport from truck to railway to waterway and airway.
Normally, business rivals are those that come from the same field. In the course of the
logistics business, land freight transport businesses are competing with each other rather
than with different modes of transport. In the case of the Lao PDR, we are not competing
with logistics businesses that operate transport in the land mode, but other transport modes,
such as air and maritime as confirmed by the KIIs. For example, international trade between
Thailand and Viet Nam is via the air and maritime modes and is rapidly growing, while the
Lao PDR’s land transport business growth very slow. There are two obstacles that weaken
freight transport as well as trade competitiveness. The first obstacle is transit time, and the
second obstacle is the high logistics costs of the relevant fees and service charges. In other
words, Lao PDR companies have no choice but to compete with different modes of transport
in terms of price.
31 East–West Economic Corridor.
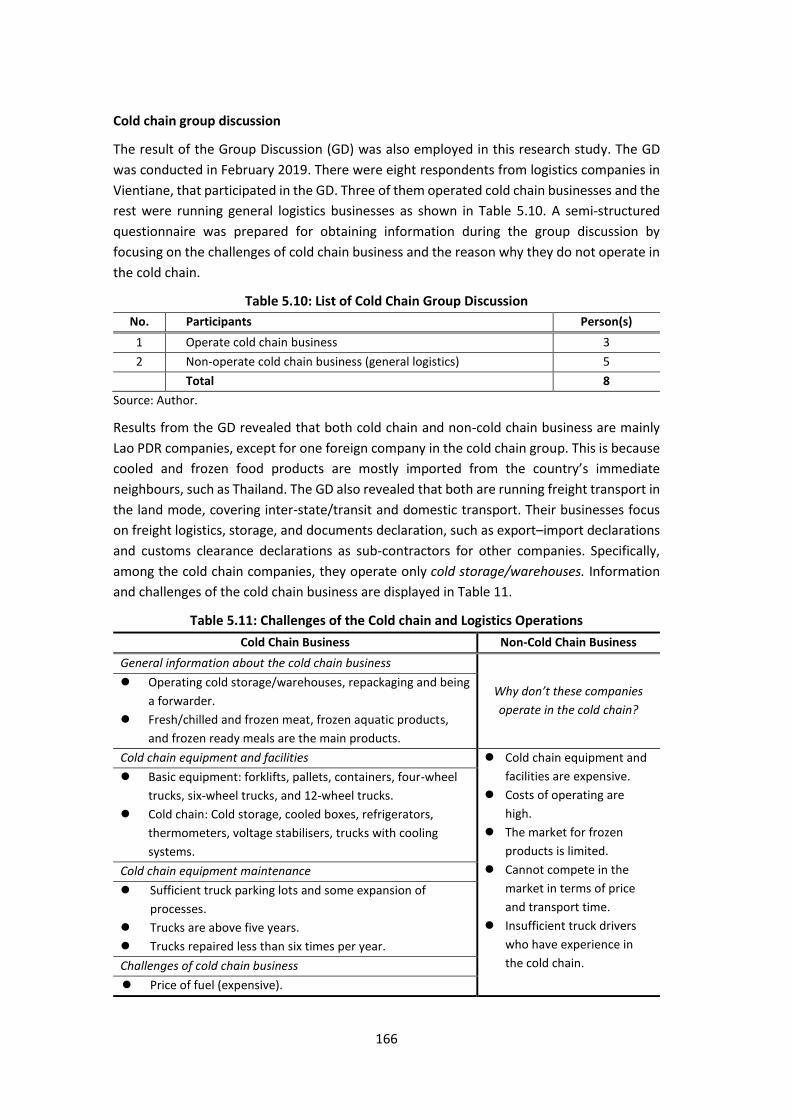
166
Cold chain group discussion
The result of the Group Discussion (GD) was also employed in this research study. The GD
was conducted in February 2019. There were eight respondents from logistics companies in
Vientiane, that participated in the GD. Three of them operated cold chain businesses and the
rest were running general logistics businesses as shown in Table 5.10. A semi-structured
questionnaire was prepared for obtaining information during the group discussion by
focusing on the challenges of cold chain business and the reason why they do not operate in
the cold chain.
Table 5.10: List of Cold Chain Group Discussion
No. Participants Person(s)
1 Operate cold chain business 3
2 Non-operate cold chain business (general logistics) 5
Total 8
Source: Author.
Results from the GD revealed that both cold chain and non-cold chain business are mainly
Lao PDR companies, except for one foreign company in the cold chain group. This is because
cooled and frozen food products are mostly imported from the country’s immediate
neighbours, such as Thailand. The GD also revealed that both are running freight transport in
the land mode, covering inter-state/transit and domestic transport. Their businesses focus
on freight logistics, storage, and documents declaration, such as export–import declarations
and customs clearance declarations as sub-contractors for other companies. Specifically,
among the cold chain companies, they operate only cold storage/warehouses. Information
and challenges of the cold chain business are displayed in Table 11.
Table 5.11: Challenges of the Cold chain and Logistics Operations
Cold Chain Business Non-Cold Chain Business
General information about the cold chain business
Why don’t these companies
operate in the cold chain?
⚫ Operating cold storage/warehouses, repackaging and being
a forwarder.
⚫ Fresh/chilled and frozen meat, frozen aquatic products,
and frozen ready meals are the main products.
Cold chain equipment and facilities ⚫ Cold chain equipment and
facilities are expensive.
⚫ Costs of operating are
high.
⚫ The market for frozen
products is limited.
⚫ Cannot compete in the
market in terms of price
and transport time.
⚫ Insufficient truck drivers
who have experience in
the cold chain.
⚫ Basic equipment: forklifts, pallets, containers, four-wheel
trucks, six-wheel trucks, and 12-wheel trucks.
⚫ Cold chain: Cold storage, cooled boxes, refrigerators,
thermometers, voltage stabilisers, trucks with cooling
systems.
Cold chain equipment maintenance
⚫ Sufficient truck parking lots and some expansion of
processes.
⚫ Trucks are above five years.
⚫ Trucks repaired less than six times per year.
Challenges of cold chain business
⚫ Price of fuel (expensive).
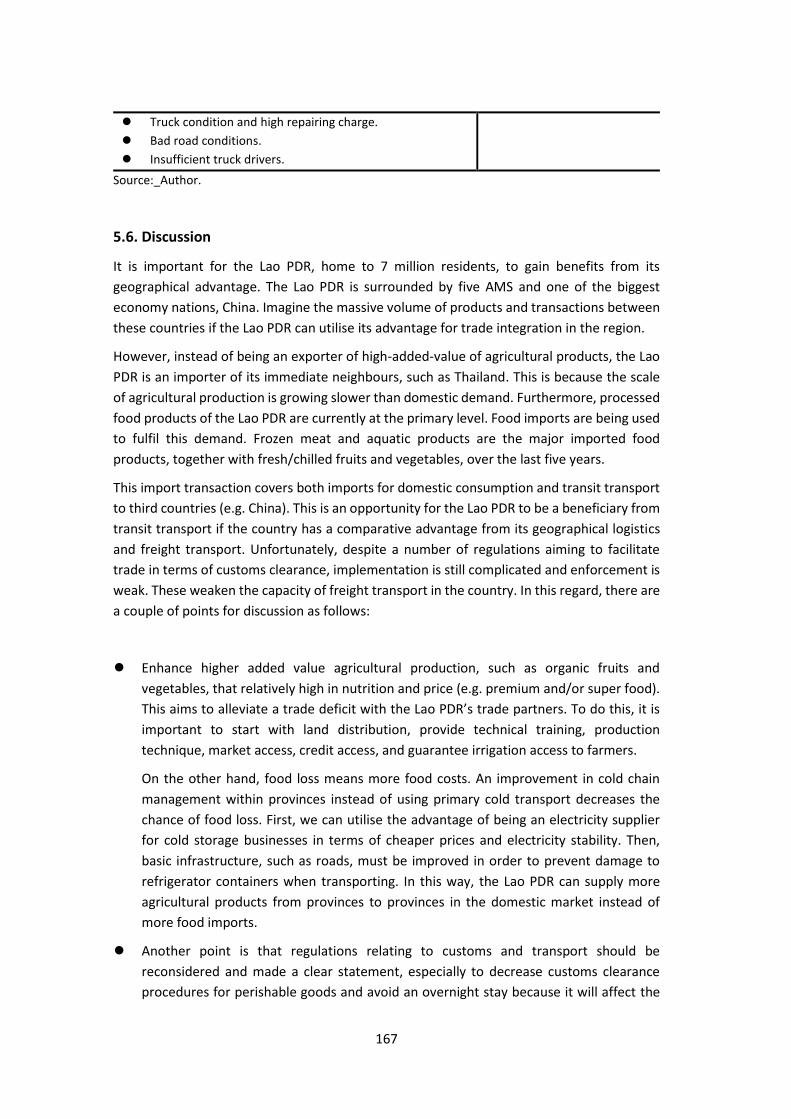
167
⚫ Truck condition and high repairing charge.
⚫ Bad road conditions.
⚫ Insufficient truck drivers.
Source:_Author.
5.6. Discussion
It is important for the Lao PDR, home to 7 million residents, to gain benefits from its
geographical advantage. The Lao PDR is surrounded by five AMS and one of the biggest
economy nations, China. Imagine the massive volume of products and transactions between
these countries if the Lao PDR can utilise its advantage for trade integration in the region.
However, instead of being an exporter of high-added-value of agricultural products, the Lao
PDR is an importer of its immediate neighbours, such as Thailand. This is because the scale
of agricultural production is growing slower than domestic demand. Furthermore, processed
food products of the Lao PDR are currently at the primary level. Food imports are being used
to fulfil this demand. Frozen meat and aquatic products are the major imported food
products, together with fresh/chilled fruits and vegetables, over the last five years.
This import transaction covers both imports for domestic consumption and transit transport
to third countries (e.g. China). This is an opportunity for the Lao PDR to be a beneficiary from
transit transport if the country has a comparative advantage from its geographical logistics
and freight transport. Unfortunately, despite a number of regulations aiming to facilitate
trade in terms of customs clearance, implementation is still complicated and enforcement is
weak. These weaken the capacity of freight transport in the country. In this regard, there are
a couple of points for discussion as follows:
⚫ Enhance higher added value agricultural production, such as organic fruits and
vegetables, that relatively high in nutrition and price (e.g. premium and/or super food).
This aims to alleviate a trade deficit with the Lao PDR’s trade partners. To do this, it is
important to start with land distribution, provide technical training, production
technique, market access, credit access, and guarantee irrigation access to farmers.
On the other hand, food loss means more food costs. An improvement in cold chain
management within provinces instead of using primary cold transport decreases the
chance of food loss. First, we can utilise the advantage of being an electricity supplier
for cold storage businesses in terms of cheaper prices and electricity stability. Then,
basic infrastructure, such as roads, must be improved in order to prevent damage to
refrigerator containers when transporting. In this way, the Lao PDR can supply more
agricultural products from provinces to provinces in the domestic market instead of
more food imports.
⚫ Another point is that regulations relating to customs and transport should be
reconsidered and made a clear statement, especially to decrease customs clearance
procedures for perishable goods and avoid an overnight stay because it will affect the
168
quality of these products and lead to food loss. In addition, a deduction of customs
clearance procedures of transit products is important. These regulations will be a guide
for custom officers and the relevant agencies to work on determining time and collecting
the exact amount of fees based on the reference rate without any negotiation.
⚫ As well as soft infrastructure, hard infrastructure also plays an important role in logistics
as well as the food value chain. Full utilisation of the upcoming Vientiane–Kunming high-
speed railway project by 2021 is the most desirable, and the construction of the
Vientiane–Hanoi expressway would contribute to the improvement of the cold chain.
These are to enhance the Lao PDR’s capacity to compete and utilise its geographical
advantage for the integration of its economy, trade, and transport in the region.
References
ADB (2018), Key Indicators for Asia and the Pacific 2018: Lao People’s Democratic Republic.
Retrieved from: https://data.adb.org/sites/default/files/lao-pdr-key-indicators-201
8_1.pdf
ASEAN Stats (2018), ASEAN International Merchandise Trade Statistics (INTS), in US$. Retrie
ved from: https://data.aseanstats.org/trade-annually
Deloitte (2015), The food value chain: A challenge for the next century, Deloitte Touche
Tohmatsu Limited, London, UK, 25417A.
GIZ (2016), Promoting Food Security and Safety via Cold Chains: Technology options, cooing
needs and energy requirements, GIZ, Bonn, Germany, 53113.
JICA (2012), Data Collection Survey on Selecting the Processed Food to Be Focused and
Promoting Foreign Direct Investment in Food Business in Laos, Japan International
Cooperation Agency (JICA), IC Net Limited.
Kitinoja, L (2013), ‘Use of cold chains for reducing food losses in developing countries’, PEF
White Paper, No. 13-03. The Postharvest Education Foundation.
LSB (2018), Lao Statistics Bureau: 2017 Statistical Yearbook. Retrieved from: https://www.ls
b.gov.la/wp-content/uploads/2018/10/Yearbook-2017.pdf
MAFF (2015), Promoting the food value chain for sustainable development, Ministry of
Agriculture, Forestry and Fisheries, Japan.
Thongsavath, C., et al. (2012), ‘Cabbage supply chain mapping and postharvest loss in the
domestic and export trade in Lao PDR’, International Food Research Journal, 19(4),
pp.1615–20.
UN (2018), UN Comtrade Database. Retrieved from: https://comtrade.un.org/data/
World Bank (2018), Employment in Agriculture (% of total employment) (modelled ILO
estimate). Retrieved from: https://data.worldbank.org/indicator/sl.agr.empl.zs
169
Chapter 6
The Cold Chain in Myanmar
Aung Min32 and Theint Sandy Htut33
6.1. Introduction and Background
Study background
The agri-food market in Southeast Asia has been activated by the steady population and
economic growth and the deepening regional and international economic integration.
However, the agri-food sector in this region still has unresolved issues, such as the low-
income of small-scale farmers. There is plenty of scope for improvement in the food value
chain (FVC) containing the whole process of production, processing, circulation, and trade of
agri-food products, from institutional and technical aspects.
This study focuses on demand for refrigerated and frozen cargo by-products; selected
agricultural products, such as fruits and vegetables, livestock products, fishery products,
processed food, and chemical products to understand the cold chain logistics sector of
Myanmar. Agricultural, livestock, and fishery are included under the agri-food industry.
Foreign trade is the one sector that is vastly driving cold chain demand. Myanmar’s
agricultural foreign trade amounted to US$2,928 million in fiscal year (FY)2017/2018, from
April to March, of which US$1,519 million was from border trade and US$1,409 million from
normal trade. However, the foreign trade of agriculture-related cold chain products was not
even 1%. It contributed only US$20 million in the same FY which was conducted via sea. Cold
chain usage for agricultural products is not found at border trade. Most traded items are
fruits, vegetables, vegetable seeds, and a few amounts of flowers.
The use of the cold chain for agriculture is still in its earliest stage and it has the most potential
for growth in the future with the support from both the private and public sectors, such as
businesses, NGOs, internal organisations, and the government. As for livestock and fishery,
in the same FY, they contributed US$91 million and US$609 million, respectively. In the
livestock sector, the trade of dairy products is also contained. In terms of cold chain logistics,
more reefer containers and generator-equipped tractor trailers and third-party logistics (3PL)
cold chain warehousing providers are needed. This particular study will analyse the whole
cold chain landscape of Myanmar in relation to its market size for each product category
while portraying the supply chains, cold chain assets, and human resources. Then, it will
identify the current issues and challenges faced by the sector and recommend the related
governments to take the necessary measures accordingly.
32 Research Director, MMRD Research Services 33 Industry Researcher, MMRD Research Services

170
Study objectives
The project aims to study cold chain logistics in Myanmar in the following scopes:
1. Current situation of the cold chain in Myanmar
2. Issues and challenges of the cold chain
3. Government policy to support its development
4. The mid-term prospects of the cold chain
Research methodology
The study of the cold chain in Myanmar was carried out by the Research Division of Myanmar
Marketing Research and Development Company (MMRD) in November and December 2018.
In order to portray the whole cold chain landscape, desk research and interviews with various
stakeholders, including associations, logistics service providers, and users were conducted
(Table 6.1). Desk research is done by collecting secondary data from various sources and
previous reports as per the requirements. Expert interviews are conducted with pivotal
associations that have direct contact with the cold chain. The study takes place in Yangon,
Mandalay/Pyin Oo Lwin, Muse, and Ayeyarwady. The main routes covered are
AyeyarwadyYangon and Yangon – Mandalay/ Pyin Oo Lwin – Muse.
Table 6.1: Sample Allocation
Description Sample Size
Expert Interviews
Myanmar International Freight Forwarders Association (MIFFA) 1
Myanmar Food Processors & Exporters Association 1
Myanmar Retailors Association 1
Cargo Truck Association 1
Myanmar Fisheries Federation (MFF) 1
Myanmar Fruits & Vegetables Association 1
Service Provider Interviews
Transportation service (trucking gate) 3
Cold storages/ processing plants 6
3PL logistics companies 11
Customers Interviews
Food processors 3
Poultry & meat processing plants/ slaughters 2
Importers/exporters 7
Retail – supermarkets 2
Pharmaceutical companies 2
Farmers 6
Total 46
Source: Authors.
171
6.2. Current Situation of the Cold Chain
Demand for refrigerated and frozen foods
The cold chain, as a subsector under the logistics industry, has every possibility of growth as
long as there is demand in the country to transport its perishable produce. A country’s
potential for the cold chain can be estimated just by looking at its available volume of
products that might need cold storage or transport. Fishery, livestock, agricultural,
pharmaceuticals, and processed foods are the most visible product categories that use the
cold chain.
Fishery products and processed foods; excluding dairy products, such as cheese, are the only
categories that are transported frozen. They are mainly export or import items with less than
20% of total production. With that, more than 80% is going in the chilled stage mixed with
crushed ice and is dedicated to domestic consumption. This traditional cold chain is still
dominating the modern cold chain. Refrigeration is being utilised for storage and transport
of perishables: livestock products such as meat and dairy; selected agricultural products such
as flowers, fruit and vegetables; and pharmaceutical products such as vaccines. Here again,
export/import items are the ones that commonly use refrigeration to meet international
standards. Pharmaceuticals are an exception; it is the only category that has to use
refrigeration even locally. Otherwise, for domestic consumption, the vast majority of the
three categories mentioned are all distributed in chilled conditions using crushed ice.
In terms of trucking, the use of refrigerated trucks or reefer containers; twenty-foot
equivalent unit (TEU) and forty-foot equivalent unit (FEU) are in demand mainly from
export/import businesses while the rest depends on ice supply, insulated box trucks and
general freight trucks. A few exceptions are top businesses in retail, hospitality, and other
high-end markets. They are demanded to use modern cold chain facilities to sustain product
quality. That being said, the volume of cold chain demand is described as the sum of domestic
distribution, export and import as in Table 6.2.
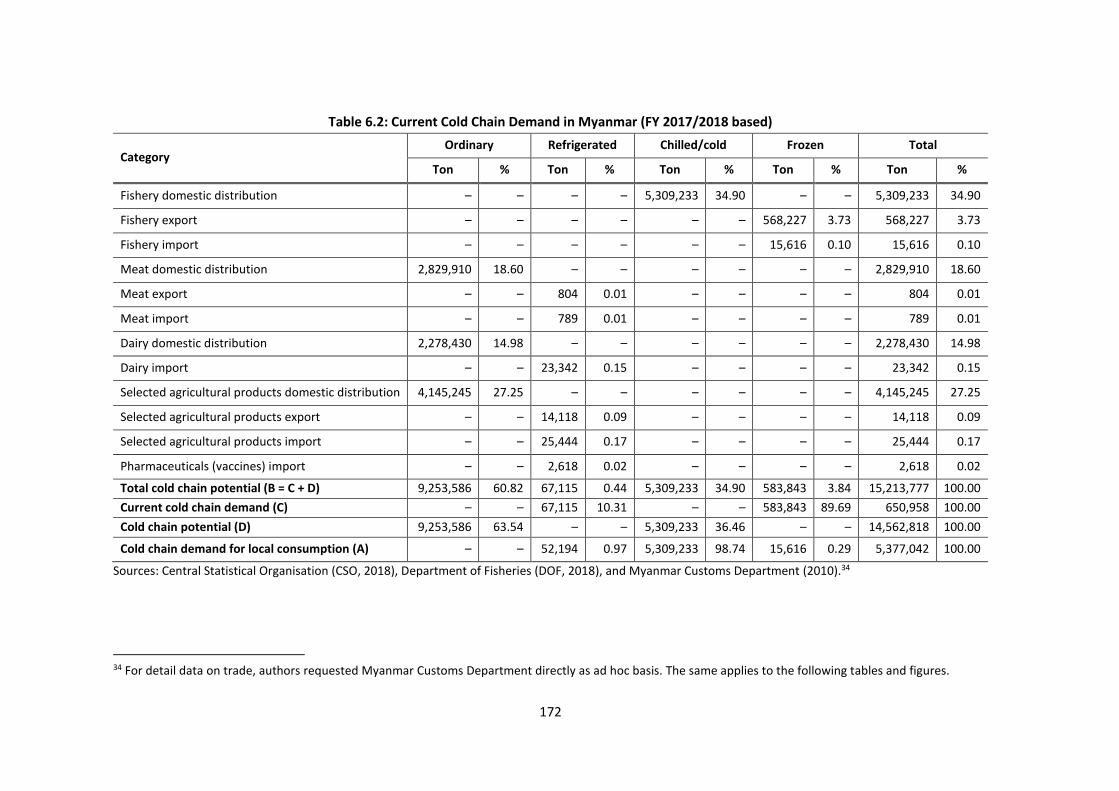
172
Table 6.2: Current Cold Chain Demand in Myanmar (FY 2017/2018 based)
Category Ordinary Refrigerated Chilled/cold Frozen Total
Ton % Ton % Ton % Ton % Ton %
Fishery domestic distribution – – – – 5,309,233 34.90 – – 5,309,233 34.90
Fishery export – – – – – – 568,227 3.73 568,227 3.73
Fishery import – – – – – – 15,616 0.10 15,616 0.10
Meat domestic distribution 2,829,910 18.60 – – – – – – 2,829,910 18.60
Meat export – – 804 0.01 – – – – 804 0.01
Meat import – – 789 0.01 – – – – 789 0.01
Dairy domestic distribution 2,278,430 14.98 – – – – – – 2,278,430 14.98
Dairy import – – 23,342 0.15 – – – – 23,342 0.15
Selected agricultural products domestic distribution 4,145,245 27.25 – – – – – – 4,145,245 27.25
Selected agricultural products export – – 14,118 0.09 – – – – 14,118 0.09
Selected agricultural products import – – 25,444 0.17 – – – – 25,444 0.17
Pharmaceuticals (vaccines) import – – 2,618 0.02 – – – – 2,618 0.02
Total cold chain potential (B = C + D) 9,253,586 60.82 67,115 0.44 5,309,233 34.90 583,843 3.84 15,213,777 100.00
Current cold chain demand (C) – – 67,115 10.31 – – 583,843 89.69 650,958 100.00
Cold chain potential (D) 9,253,586 63.54 – – 5,309,233 36.46 – – 14,562,818 100.00
Cold chain demand for local consumption (A) – – 52,194 0.97 5,309,233 98.74 15,616 0.29 5,377,042 100.00
Sources: Central Statistical Organisation (CSO, 2018), Department of Fisheries (DOF, 2018), and Myanmar Customs Department (2010).34
34 For detail data on trade, authors requested Myanmar Customs Department directly as ad hoc basis. The same applies to the following tables and figures.
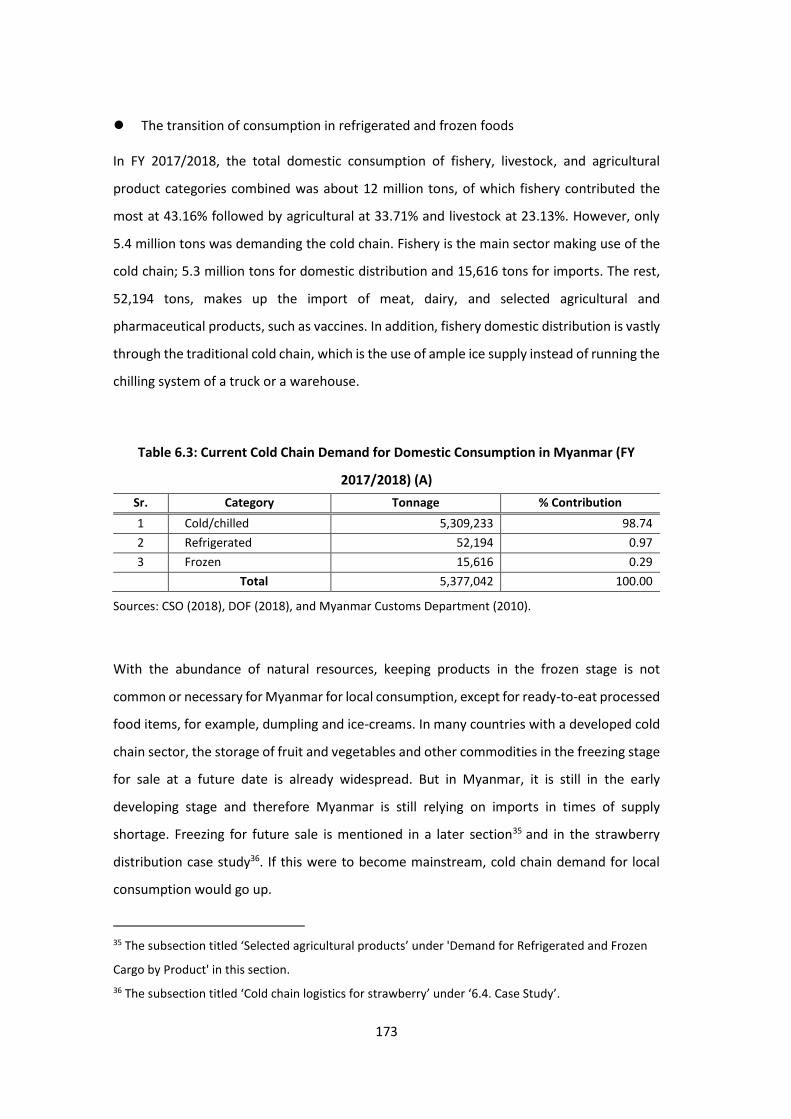
173
⚫ The transition of consumption in refrigerated and frozen foods
In FY 2017/2018, the total domestic consumption of fishery, livestock, and agricultural
product categories combined was about 12 million tons, of which fishery contributed the
most at 43.16% followed by agricultural at 33.71% and livestock at 23.13%. However, only
5.4 million tons was demanding the cold chain. Fishery is the main sector making use of the
cold chain; 5.3 million tons for domestic distribution and 15,616 tons for imports. The rest,
52,194 tons, makes up the import of meat, dairy, and selected agricultural and
pharmaceutical products, such as vaccines. In addition, fishery domestic distribution is vastly
through the traditional cold chain, which is the use of ample ice supply instead of running the
chilling system of a truck or a warehouse.
Table 6.3: Current Cold Chain Demand for Domestic Consumption in Myanmar (FY
2017/2018) (A)
Sr. Category Tonnage % Contribution
1 Cold/chilled 5,309,233 98.74
2 Refrigerated 52,194 0.97
3 Frozen 15,616 0.29
Total 5,377,042 100.00
Sources: CSO (2018), DOF (2018), and Myanmar Customs Department (2010).
With the abundance of natural resources, keeping products in the frozen stage is not
common or necessary for Myanmar for local consumption, except for ready-to-eat processed
food items, for example, dumpling and ice-creams. In many countries with a developed cold
chain sector, the storage of fruit and vegetables and other commodities in the freezing stage
for sale at a future date is already widespread. But in Myanmar, it is still in the early
developing stage and therefore Myanmar is still relying on imports in times of supply
shortage. Freezing for future sale is mentioned in a later section35 and in the strawberry
distribution case study36. If this were to become mainstream, cold chain demand for local
consumption would go up.
35 The subsection titled ‘Selected agricultural products’ under 'Demand for Refrigerated and Frozen
Cargo by Product' in this section.
36 The subsection titled ‘Cold chain logistics for strawberry’ under ‘6.4. Case Study’.

174
⚫ The transition of import of refrigerated and frozen foods
The use of modern cold chain facilities has been increasing along with increasing foreign
trade. Specifically, the import of fresh seafood and these facilities simultaneously gained
momentum after 2015. Fishery imports increased fivefold from 3,014 tons in 2015 to 15,616
tons in 2018. Meat imports are also rising in response to the growth of the hotel and tourism
industry and the entrance of well-known international fast food chains, such as KFC and
Lotteria. The dairy sector saw a gradual decline of trade, yet it seems reasonable when
checking with the steady increase of domestic production. Of the imported dairy items, high-
quality processed products, such as whole and skimmed milk powder and cream milk are
standing at the top, as the local dairy sector still needs a lot of improvement, especially
regarding technical know-how and raw supplies.
In FY 2017/2018, the top seafood exporters into Myanmar were Thailand, Switzerland, and
Indonesia while meat was sourced mainly from Thailand, Brazil, and the Netherlands. Dairy
products are mainly imported from New Zealand, Australia, and Germany. Seafood comes in
the frozen stage, while meat and dairy come with refrigeration. Once arrived at Yangon Ports,
reefer containers carrying these products are plugged in at dedicated charging facilities
powered by the port. After customs procedures, containers are unplugged from charging and
sent to the respective processing plants or factories. Continuous chilling/cooling may not be
guaranteed at all times as the vehicles used are usually not equipped with generators.
However, this is not that of a big issue as it seems given the distance and time; some factories
are located at the industrial zones which are of a short distance from the port and thus take
less time, an hour or so. In this case, reefers are only driven vehicle-powered. Some products
are not even powered throughout the short intercity trip. The vast majority of imports are to
fulfil local demand whereas very few of them, especially seafood, are imported for local
processing and then export back to the countries of origin on Cut-Make-Pack (CMP) basis.
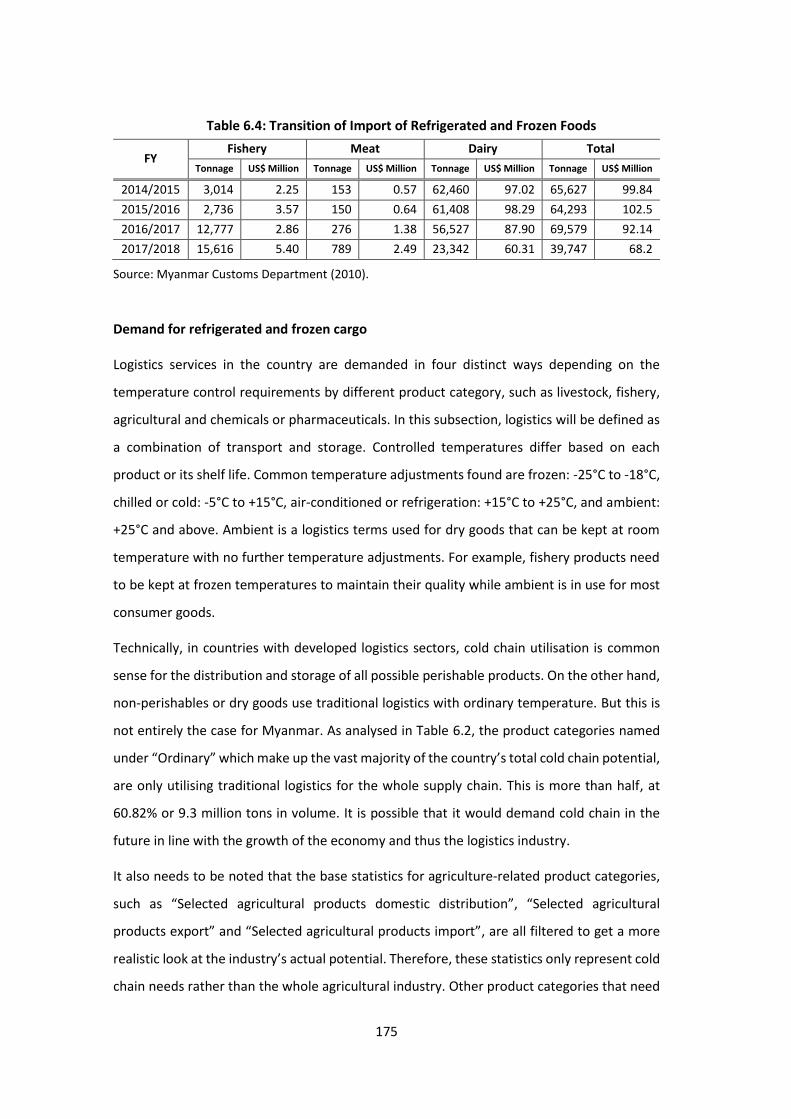
175
Table 6.4: Transition of Import of Refrigerated and Frozen Foods
FY Fishery Meat Dairy Total
Tonnage US$ Million Tonnage US$ Million Tonnage US$ Million Tonnage US$ Million
2014/2015 3,014 2.25 153 0.57 62,460 97.02 65,627 99.84
2015/2016 2,736 3.57 150 0.64 61,408 98.29 64,293 102.5
2016/2017 12,777 2.86 276 1.38 56,527 87.90 69,579 92.14
2017/2018 15,616 5.40 789 2.49 23,342 60.31 39,747 68.2
Source: Myanmar Customs Department (2010).
Demand for refrigerated and frozen cargo
Logistics services in the country are demanded in four distinct ways depending on the
temperature control requirements by different product category, such as livestock, fishery,
agricultural and chemicals or pharmaceuticals. In this subsection, logistics will be defined as
a combination of transport and storage. Controlled temperatures differ based on each
product or its shelf life. Common temperature adjustments found are frozen: -25°C to -18°C,
chilled or cold: -5°C to +15°C, air-conditioned or refrigeration: +15°C to +25°C, and ambient:
+25°C and above. Ambient is a logistics terms used for dry goods that can be kept at room
temperature with no further temperature adjustments. For example, fishery products need
to be kept at frozen temperatures to maintain their quality while ambient is in use for most
consumer goods.
Technically, in countries with developed logistics sectors, cold chain utilisation is common
sense for the distribution and storage of all possible perishable products. On the other hand,
non-perishables or dry goods use traditional logistics with ordinary temperature. But this is
not entirely the case for Myanmar. As analysed in Table 6.2, the product categories named
under “Ordinary” which make up the vast majority of the country’s total cold chain potential,
are only utilising traditional logistics for the whole supply chain. This is more than half, at
60.82% or 9.3 million tons in volume. It is possible that it would demand cold chain in the
future in line with the growth of the economy and thus the logistics industry.
It also needs to be noted that the base statistics for agriculture-related product categories,
such as “Selected agricultural products domestic distribution”, “Selected agricultural
products export” and “Selected agricultural products import”, are all filtered to get a more
realistic look at the industry’s actual potential. Therefore, these statistics only represent cold
chain needs rather than the whole agricultural industry. Other product categories that need
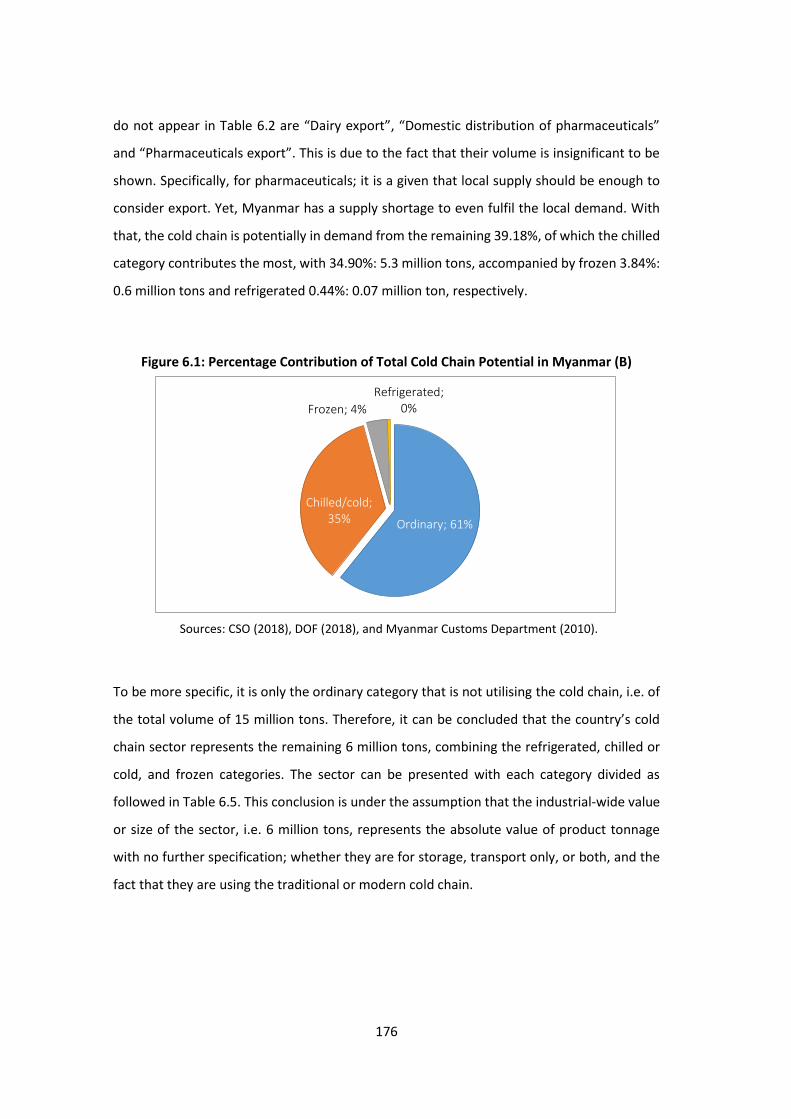
176
do not appear in Table 6.2 are “Dairy export”, “Domestic distribution of pharmaceuticals”
and “Pharmaceuticals export”. This is due to the fact that their volume is insignificant to be
shown. Specifically, for pharmaceuticals; it is a given that local supply should be enough to
consider export. Yet, Myanmar has a supply shortage to even fulfil the local demand. With
that, the cold chain is potentially in demand from the remaining 39.18%, of which the chilled
category contributes the most, with 34.90%: 5.3 million tons, accompanied by frozen 3.84%:
0.6 million tons and refrigerated 0.44%: 0.07 million ton, respectively.
Figure 6.1: Percentage Contribution of Total Cold Chain Potential in Myanmar (B)
Sources: CSO (2018), DOF (2018), and Myanmar Customs Department (2010).
To be more specific, it is only the ordinary category that is not utilising the cold chain, i.e. of
the total volume of 15 million tons. Therefore, it can be concluded that the country’s cold
chain sector represents the remaining 6 million tons, combining the refrigerated, chilled or
cold, and frozen categories. The sector can be presented with each category divided as
followed in Table 6.5. This conclusion is under the assumption that the industrial-wide value
or size of the sector, i.e. 6 million tons, represents the absolute value of product tonnage
with no further specification; whether they are for storage, transport only, or both, and the
fact that they are using the traditional or modern cold chain.
Ordinary; 61%
Chilled/cold; 35%
Frozen; 4%
Refrigerated; 0%
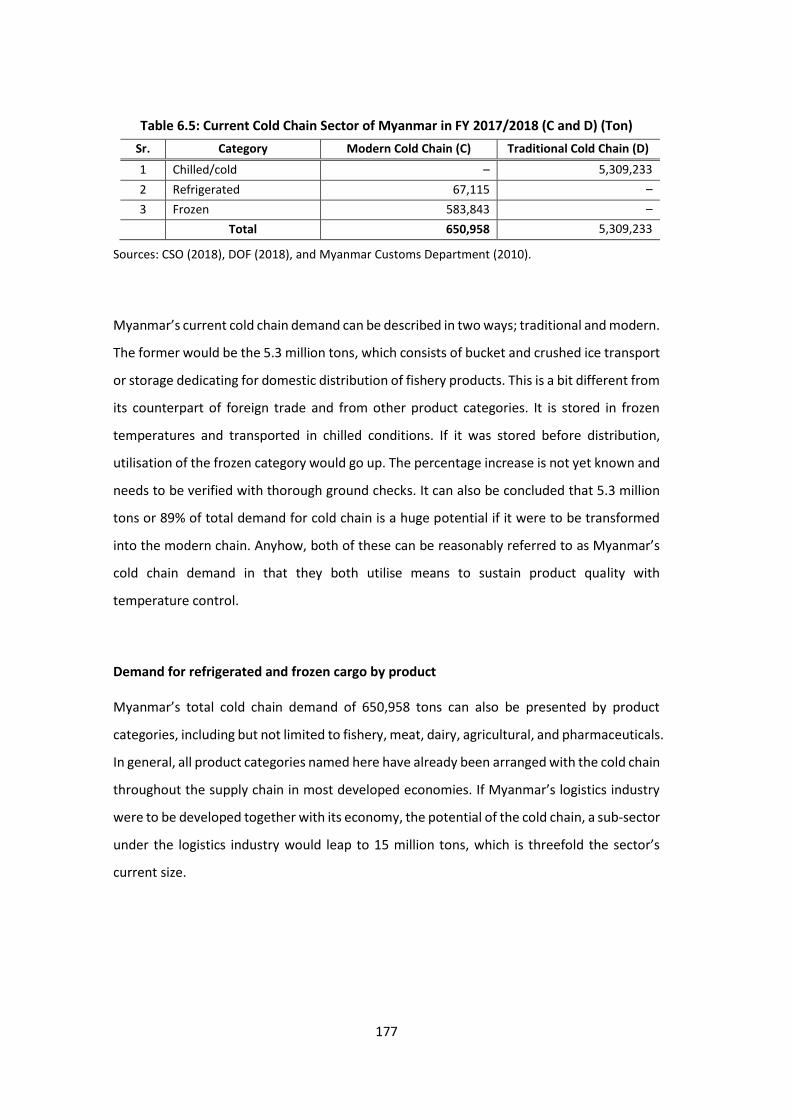
177
Table 6.5: Current Cold Chain Sector of Myanmar in FY 2017/2018 (C and D) (Ton)
Sr. Category Modern Cold Chain (C) Traditional Cold Chain (D)
1 Chilled/cold – 5,309,233
2 Refrigerated 67,115 –
3 Frozen 583,843 –
Total 650,958 5,309,233
Sources: CSO (2018), DOF (2018), and Myanmar Customs Department (2010).
Myanmar’s current cold chain demand can be described in two ways; traditional and modern.
The former would be the 5.3 million tons, which consists of bucket and crushed ice transport
or storage dedicating for domestic distribution of fishery products. This is a bit different from
its counterpart of foreign trade and from other product categories. It is stored in frozen
temperatures and transported in chilled conditions. If it was stored before distribution,
utilisation of the frozen category would go up. The percentage increase is not yet known and
needs to be verified with thorough ground checks. It can also be concluded that 5.3 million
tons or 89% of total demand for cold chain is a huge potential if it were to be transformed
into the modern chain. Anyhow, both of these can be reasonably referred to as Myanmar’s
cold chain demand in that they both utilise means to sustain product quality with
temperature control.
Demand for refrigerated and frozen cargo by product
Myanmar’s total cold chain demand of 650,958 tons can also be presented by product
categories, including but not limited to fishery, meat, dairy, agricultural, and pharmaceuticals.
In general, all product categories named here have already been arranged with the cold chain
throughout the supply chain in most developed economies. If Myanmar’s logistics industry
were to be developed together with its economy, the potential of the cold chain, a sub-sector
under the logistics industry would leap to 15 million tons, which is threefold the sector’s
current size.

178
Table 6.6: Cold Chain Demand by Product Category in FY 2017/2018 (Ton)
No. Category Current Demand Potential Demand Total Demand
Tonnage % Tonnage % Tonnage %
1 Fishery 583,843 89.69 5,309,233 36.46 5,893,076 38.74
2 Meat 1,593 0.24 2,829,910 19.43 2,831,503 18.61
3 Dairy 23,342 3.59 2,278,430 15.65 2,301,772 15.13
4 Selected
agricultural 39,562 6.08 4,145,245 28.46 4,184,807 27.51
5 Pharmaceutical 2,618 0.40 0 0.00 2,618 0.02 Total 650,958 100.00 14,562,818 100.00 15,213,777 100.00
Sources: CSO (2018), DOF (2018), and Myanmar Customs Department (2010).
⚫ Fishery products
Myanmar’s fishery sector has long been accustomed to cold transport, although its way of
the cold chain may not necessarily mean our modern cold chain facilities, such as reefers and
cold storages. The total production of fishery products was 5.9 million tons in FY 2017/2018.
In the same FY, fishery trade worth US$717 million has been conducted, which accounted for
583,843 tons. Of this, 97% was exports and 3% was imports, with each contributing to
US$712 million and US$ 5 million, respectively.
Table 6.7: Annual Statistics of Fishery Products from FY 2015/2016 to FY 2017/2018 (Ton)
FY Production Export Import Consumption
2015/2016 5,591,830 368,971 3,014 5,225,595
2016/2017 5,675,470 438,707 2,736 5,249,540
2017/2018 5,877,460 568,227 12,777 5,324,849
Sources: DOF (2018) and Myanmar Customs Department (2010).
The coastal regions, such as Ayeyarwady, Tanintharyi, Rakhine, Mon, and Yangon, are the
primary sources of various fishery products. Aquaculture farms are also in place and they are
mostly targeted towards locals, unlike sea fisheries which are highly demanded from foreign
importers. Yangon is the main fishery distribution centre in the country distributing fresh
seafood; both wild and farmed from its two main fish markets, namely Central San Pya Fish
Market and Shwe Padauk Fish Market in Yangon, to all parts of Myanmar. The cold chain
brings the finest quality to its users along with its convenient cooling/chilling systems.
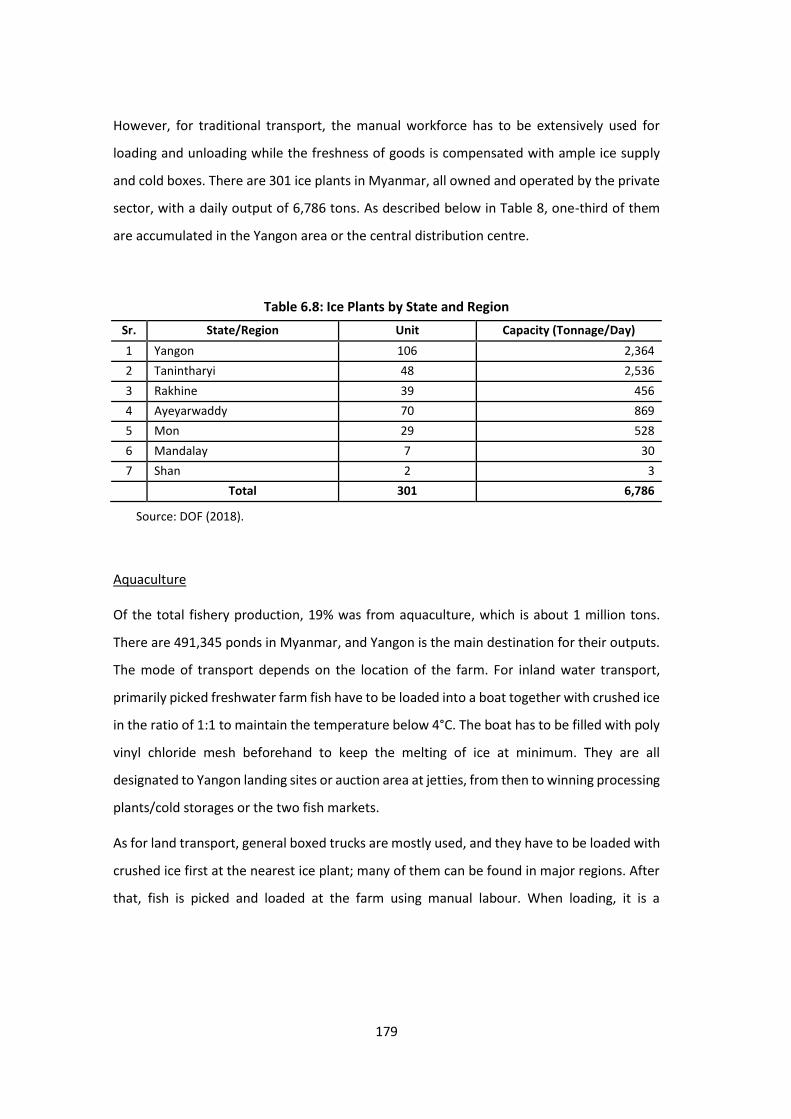
179
However, for traditional transport, the manual workforce has to be extensively used for
loading and unloading while the freshness of goods is compensated with ample ice supply
and cold boxes. There are 301 ice plants in Myanmar, all owned and operated by the private
sector, with a daily output of 6,786 tons. As described below in Table 8, one-third of them
are accumulated in the Yangon area or the central distribution centre.
Table 6.8: Ice Plants by State and Region
Sr. State/Region Unit Capacity (Tonnage/Day)
1 Yangon 106 2,364
2 Tanintharyi 48 2,536
3 Rakhine 39 456
4 Ayeyarwaddy 70 869
5 Mon 29 528
6 Mandalay 7 30
7 Shan 2 3
Total 301 6,786
Source: DOF (2018).
Aquaculture
Of the total fishery production, 19% was from aquaculture, which is about 1 million tons.
There are 491,345 ponds in Myanmar, and Yangon is the main destination for their outputs.
The mode of transport depends on the location of the farm. For inland water transport,
primarily picked freshwater farm fish have to be loaded into a boat together with crushed ice
in the ratio of 1:1 to maintain the temperature below 4°C. The boat has to be filled with poly
vinyl chloride mesh beforehand to keep the melting of ice at minimum. They are all
designated to Yangon landing sites or auction area at jetties, from then to winning processing
plants/cold storages or the two fish markets.
As for land transport, general boxed trucks are mostly used, and they have to be loaded with
crushed ice first at the nearest ice plant; many of them can be found in major regions. After
that, fish is picked and loaded at the farm using manual labour. When loading, it is a
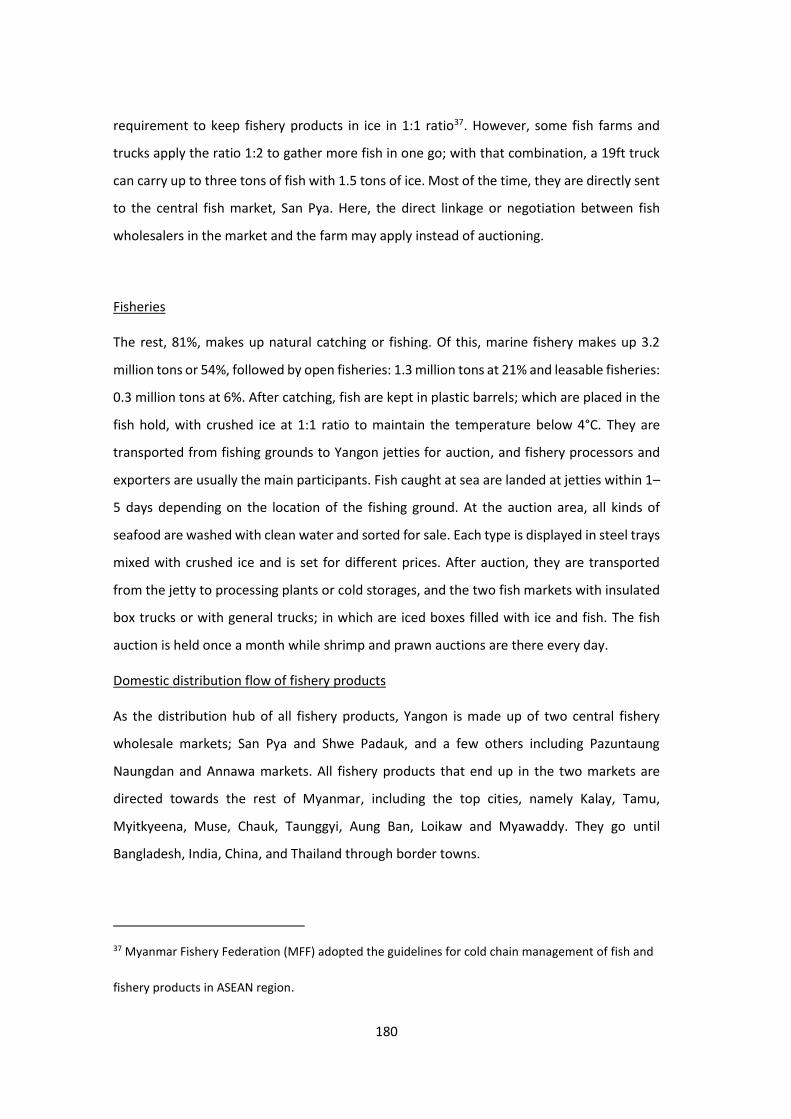
180
requirement to keep fishery products in ice in 1:1 ratio37. However, some fish farms and
trucks apply the ratio 1:2 to gather more fish in one go; with that combination, a 19ft truck
can carry up to three tons of fish with 1.5 tons of ice. Most of the time, they are directly sent
to the central fish market, San Pya. Here, the direct linkage or negotiation between fish
wholesalers in the market and the farm may apply instead of auctioning.
Fisheries
The rest, 81%, makes up natural catching or fishing. Of this, marine fishery makes up 3.2
million tons or 54%, followed by open fisheries: 1.3 million tons at 21% and leasable fisheries:
0.3 million tons at 6%. After catching, fish are kept in plastic barrels; which are placed in the
fish hold, with crushed ice at 1:1 ratio to maintain the temperature below 4°C. They are
transported from fishing grounds to Yangon jetties for auction, and fishery processors and
exporters are usually the main participants. Fish caught at sea are landed at jetties within 1–
5 days depending on the location of the fishing ground. At the auction area, all kinds of
seafood are washed with clean water and sorted for sale. Each type is displayed in steel trays
mixed with crushed ice and is set for different prices. After auction, they are transported
from the jetty to processing plants or cold storages, and the two fish markets with insulated
box trucks or with general trucks; in which are iced boxes filled with ice and fish. The fish
auction is held once a month while shrimp and prawn auctions are there every day.
Domestic distribution flow of fishery products
As the distribution hub of all fishery products, Yangon is made up of two central fishery
wholesale markets; San Pya and Shwe Padauk, and a few others including Pazuntaung
Naungdan and Annawa markets. All fishery products that end up in the two markets are
directed towards the rest of Myanmar, including the top cities, namely Kalay, Tamu,
Myitkyeena, Muse, Chauk, Taunggyi, Aung Ban, Loikaw and Myawaddy. They go until
Bangladesh, India, China, and Thailand through border towns.
37 Myanmar Fishery Federation (MFF) adopted the guidelines for cold chain management of fish and
fishery products in ASEAN region.
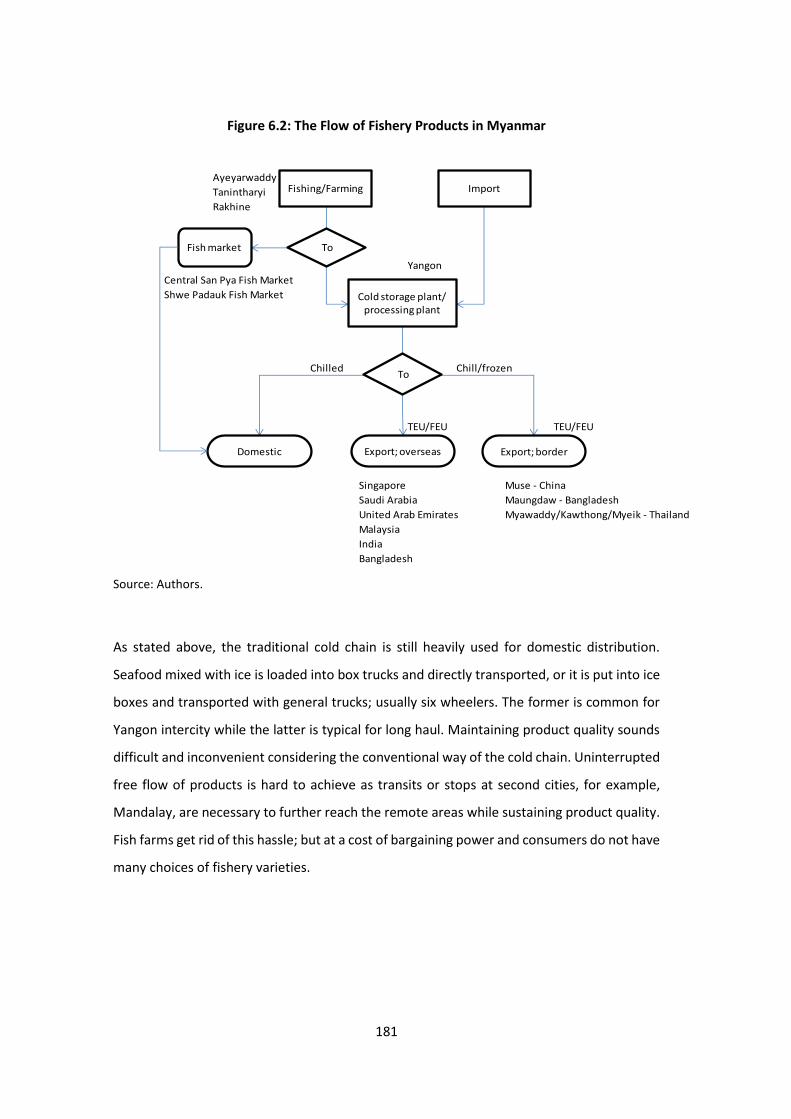
181
Figure 6.2: The Flow of Fishery Products in Myanmar
Source: Authors.
As stated above, the traditional cold chain is still heavily used for domestic distribution.
Seafood mixed with ice is loaded into box trucks and directly transported, or it is put into ice
boxes and transported with general trucks; usually six wheelers. The former is common for
Yangon intercity while the latter is typical for long haul. Maintaining product quality sounds
difficult and inconvenient considering the conventional way of the cold chain. Uninterrupted
free flow of products is hard to achieve as transits or stops at second cities, for example,
Mandalay, are necessary to further reach the remote areas while sustaining product quality.
Fish farms get rid of this hassle; but at a cost of bargaining power and consumers do not have
many choices of fishery varieties.
Ayeyarwaddy
Tanintharyi
Rakhine
Yangon
Central San Pya Fish Market
Shwe Padauk Fish Market
Chilled Chill/frozen
TEU/FEU TEU/FEU
Singapore Muse - China
Saudi Arabia Maungdaw - Bangladesh
United Arab Emirates Myawaddy/Kawthong/Myeik - Thailand
Malaysia
India
Bangladesh
Source: MMRD
To
To Fish market
Export; overseasDomestic
Fishing/Farming Import
Cold storage plant/processing plant
Export; border
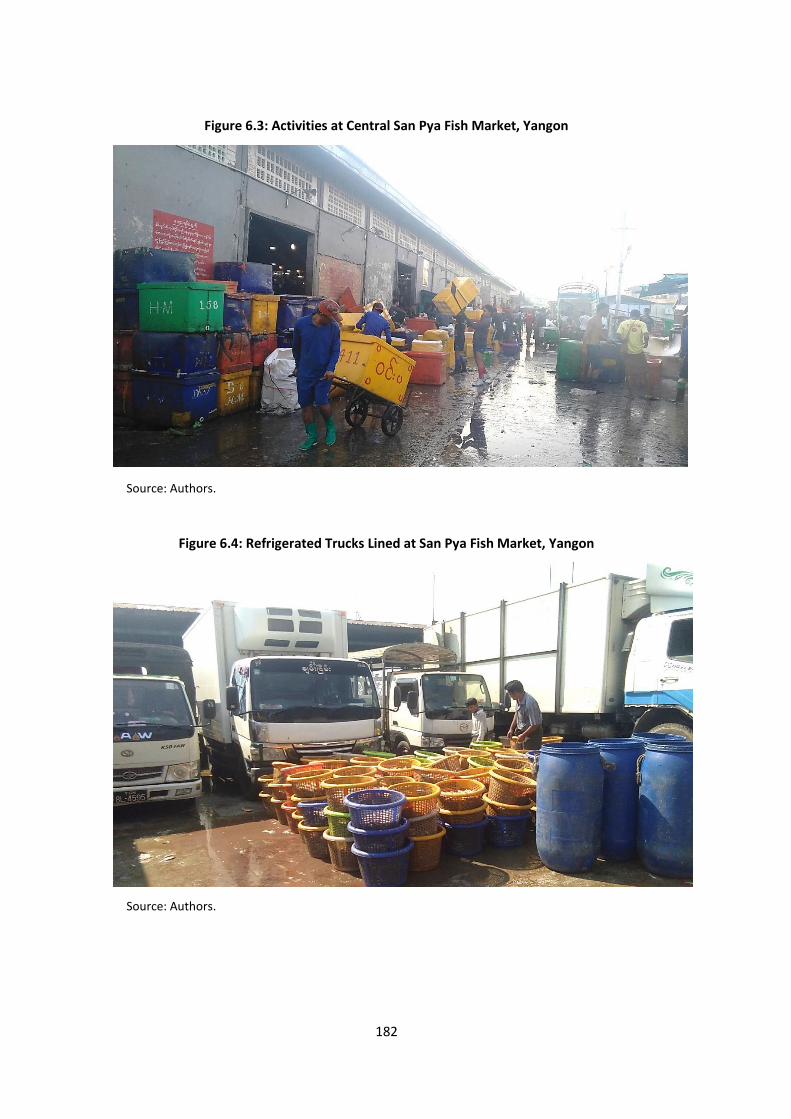
182
Figure 6.3: Activities at Central San Pya Fish Market, Yangon
Source: Authors.
Figure 6.4: Refrigerated Trucks Lined at San Pya Fish Market, Yangon
Source: Authors.
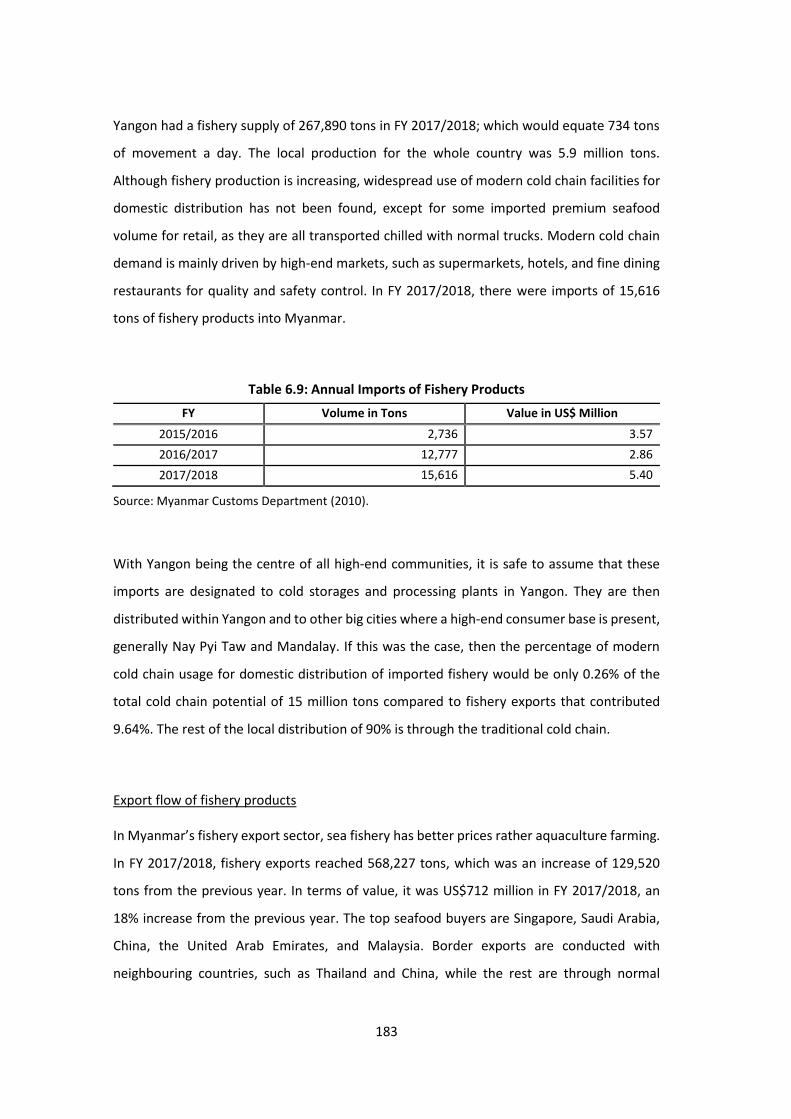
183
Yangon had a fishery supply of 267,890 tons in FY 2017/2018; which would equate 734 tons
of movement a day. The local production for the whole country was 5.9 million tons.
Although fishery production is increasing, widespread use of modern cold chain facilities for
domestic distribution has not been found, except for some imported premium seafood
volume for retail, as they are all transported chilled with normal trucks. Modern cold chain
demand is mainly driven by high-end markets, such as supermarkets, hotels, and fine dining
restaurants for quality and safety control. In FY 2017/2018, there were imports of 15,616
tons of fishery products into Myanmar.
Table 6.9: Annual Imports of Fishery Products
FY Volume in Tons Value in US$ Million
2015/2016 2,736 3.57
2016/2017 12,777 2.86
2017/2018 15,616 5.40
Source: Myanmar Customs Department (2010).
With Yangon being the centre of all high-end communities, it is safe to assume that these
imports are designated to cold storages and processing plants in Yangon. They are then
distributed within Yangon and to other big cities where a high-end consumer base is present,
generally Nay Pyi Taw and Mandalay. If this was the case, then the percentage of modern
cold chain usage for domestic distribution of imported fishery would be only 0.26% of the
total cold chain potential of 15 million tons compared to fishery exports that contributed
9.64%. The rest of the local distribution of 90% is through the traditional cold chain.
Export flow of fishery products
In Myanmar’s fishery export sector, sea fishery has better prices rather aquaculture farming.
In FY 2017/2018, fishery exports reached 568,227 tons, which was an increase of 129,520
tons from the previous year. In terms of value, it was US$712 million in FY 2017/2018, an
18% increase from the previous year. The top seafood buyers are Singapore, Saudi Arabia,
China, the United Arab Emirates, and Malaysia. Border exports are conducted with
neighbouring countries, such as Thailand and China, while the rest are through normal
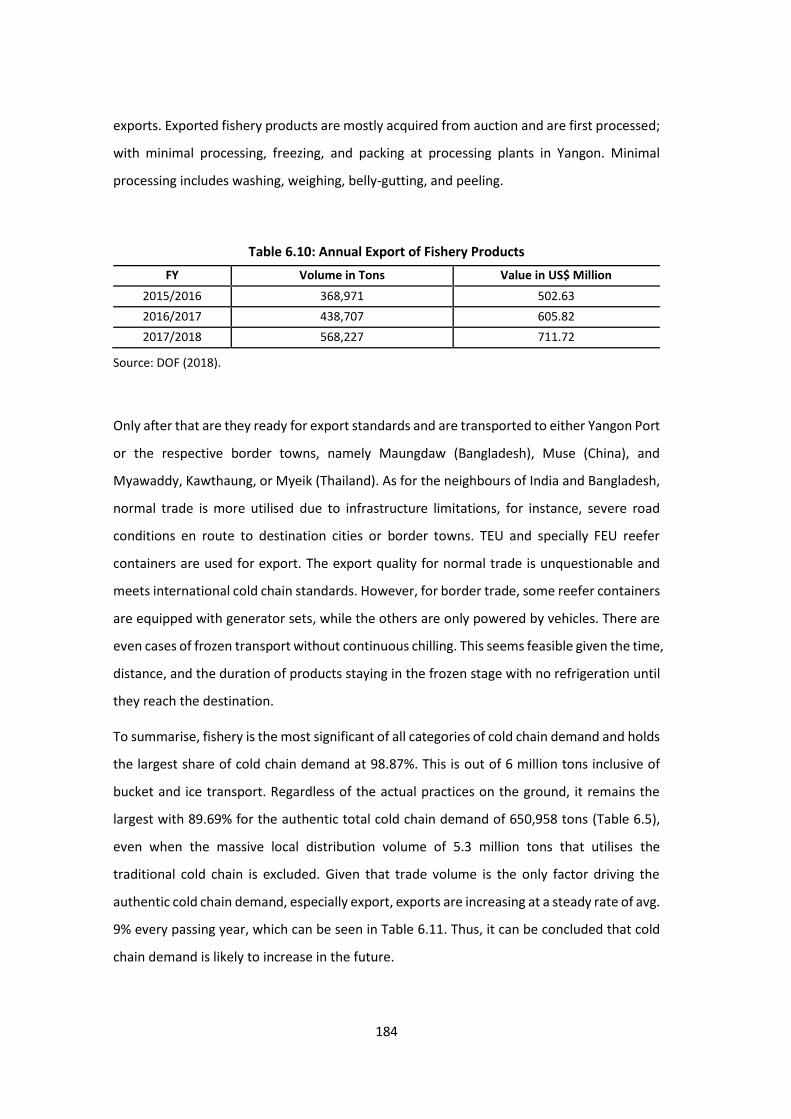
184
exports. Exported fishery products are mostly acquired from auction and are first processed;
with minimal processing, freezing, and packing at processing plants in Yangon. Minimal
processing includes washing, weighing, belly-gutting, and peeling.
Table 6.10: Annual Export of Fishery Products
FY Volume in Tons Value in US$ Million
2015/2016 368,971 502.63
2016/2017 438,707 605.82
2017/2018 568,227 711.72
Source: DOF (2018).
Only after that are they ready for export standards and are transported to either Yangon Port
or the respective border towns, namely Maungdaw (Bangladesh), Muse (China), and
Myawaddy, Kawthaung, or Myeik (Thailand). As for the neighbours of India and Bangladesh,
normal trade is more utilised due to infrastructure limitations, for instance, severe road
conditions en route to destination cities or border towns. TEU and specially FEU reefer
containers are used for export. The export quality for normal trade is unquestionable and
meets international cold chain standards. However, for border trade, some reefer containers
are equipped with generator sets, while the others are only powered by vehicles. There are
even cases of frozen transport without continuous chilling. This seems feasible given the time,
distance, and the duration of products staying in the frozen stage with no refrigeration until
they reach the destination.
To summarise, fishery is the most significant of all categories of cold chain demand and holds
the largest share of cold chain demand at 98.87%. This is out of 6 million tons inclusive of
bucket and ice transport. Regardless of the actual practices on the ground, it remains the
largest with 89.69% for the authentic total cold chain demand of 650,958 tons (Table 6.5),
even when the massive local distribution volume of 5.3 million tons that utilises the
traditional cold chain is excluded. Given that trade volume is the only factor driving the
authentic cold chain demand, especially export, exports are increasing at a steady rate of avg.
9% every passing year, which can be seen in Table 6.11. Thus, it can be concluded that cold
chain demand is likely to increase in the future.

185
Table 6.11: Annual Foreign Trade of Fishery Products
FY Export Import Total Trade
Tons US$ Million Tons US$ Million Tons US$ Million
2015/2016 368,971 502.63 3,014 2.25 371,985 504.88
2016/2017 438,707 605.82 2,736 3.57 441,443 609.39
2017/2018 568,227 711.72 12,777 2.86 581,004 714.58
Sources: DOF (2018) and Myanmar Customs Department (2010)
⚫ Livestock products
Livestock products include meat: pork; beef; mutton, poultry: chicken; duck, and dairy
products. In this subsection, meat refers to both meat products and poultry unless specified,
whereas dairy means dairy products, such as milk, milk powder, cheese, etc. Meat production
is more accessible to the masses, even to far-off regions. Consequently, the extensive use of
storage and transportation facilities for local consumption is with general trucks only. In FY
2017/2018, domestic meat production was 2.8 million tons; this was a decline of 120,302
tons from previous the year. In the same FY, 804 tons worth US$3 million were exported
overseas, largely to Singapore, Malaysia, New Zealand, and the United States.
Table 6.12: Annual Statistics of Meat Products from FY 2015/2016 to FY 2017/2018 (tons)
FY Production Export Import Consumption
2015/2016 2,889,610 197 149 2,889,562
2016/2017 2,951,016 355 276 2,950,937
2017/2018 2,830,714 804 789 2,830,699
Sources: CSO (2018) and Myanmar Customs Department (2010).
Livestock farming
Of the total production, meat contributes 44% and poultry 56%. Large-scale livestock farming
is a major supplier of meat production in Myanmar, while a few small-scale farms are
operated by rural households. They are found in every big city supplying enough for regional
consumption. Live animals are sent with general trucks from the farm to wholesalers for
butchering then to wet markets, or directly to wet markets. The domestication of poultry is
common for rural households and therefore is readily available at all times. Some of those

186
households are sole proprietors in poultry production and distribute the output to nearby
areas or towns on a regular basis or when demanded. For them, transportation is not limited
to trucks, could sometimes be a motorcycle.
Contract farming for the livestock sector is also developed, particularly for poultry, although
they are designated for Yangon. They are mostly located around the Yangon region, such as
Bago, Thikekyi, Inta Gaw, etc. Myanmar C.P. Livestock (MCPL) is one of the market players in
contract farming. From the contracted farm, live birds are transported to the firm’s
butchering factories, and from there to dedicated clients and markets. But, most of the time,
for the vast majority of consumption, meat is produced by local butchering businesses each
day and is transported to wet markets or delivered door-to-door to restaurants. They are
based in every big city and general light trucks are mostly used for commercial distribution
to the mass market. Slaughtering licences are also held by individual butchers and are mostly
for meat such as beef, pork, and mutton.
Figure 6.5: The Flow of Livestock Products in Myanmar
Source: Authors.
Cold chain distribution flow of meat products in Yangon
Again, for Yangon consumption, meat production can be divided into two categories; meat
products, such as beef, pork, and mutton, and poultry, such as chicken and duck. Generally,
the purchase of fresh meat products at supermarkets is not mainstreamed in Myanmar. As a
result, cold chain demand, which is mainly driven by modern supermarket chains, are only
limited to a few percentages compared with the total volume. However, the cold chain is
apparently used for all export/import meat products as it is a minimum requirement for
quality control.
Meat production is mainly handled by Ywar Thar Gyi Slaughter House in East Dagon Township
and two others in Hlaing Thar Yar and Kyeemyindaing. Freshly butchered meat cuts and
Large scale farms
(Live animals with general trucks)
Slaughter house/ individual butcher
Wet markets End consumers
187
carcasses are delivered to wet markets before daybreak with general trucks. Some of them
are sent to City Mart’s warehouse, while a few are ordered by restaurants and hotels. As for
poultry production, Chicken and Duck Market in Mingala Taung Nyunt Township, Myanmar
C.P. Livestock (MCPL) and Japfa Comfeed Myanmar Co., Ltd (Japfa) are the key players.
Chicken and Duck Market is the main poultry wholesale centre in Yangon. Japfa is a leading
supplier of poultry products and its main business is the manufacturing of animal feeds. Japfa
distributes 10,000 whole chicken birds; that is about two tons of meat each day with
refrigerated box trucks. There are five trucks in its ownership with a capacity ranging from
two to four tons. Temperature setting in the truck is chill or air-conditioned.
MCPL is a major user of the cold chain in the livestock sector. They have under them many
lines of business that are closely associated with poultry production, which nearly covers the
whole value chain; from breeding, hatchery and farming to finished goods production. MCPL
is partnering with KOSPA Limited, the second largest 3PL cold chain service provider in terms
of asset, to fulfil its cold chain needs. The cold chain comes into play when the finished goods;
meat and processed foods such as sausage need to be delivered to City Mart. They are loaded
into the three-ton refrigerated box truck using cold boxes. The controlled temperature in the
truck is between 0°C and 10°C. Further information about MCPL can be assessed in detail
under Section 6.3.
Trade of meat products
Premium meat consumption has been on the rise since 2016 in response to the growth of
the hospitality industry and hotels and fine dining restaurants. These high-end markets
demand premium quality at all time, and consequently the cold chain becomes a basic
necessity. In FY 2017/2018, the total foreign trade volume of meat products reached 1,593
tons with each accounting for US$2 million in value. Most imported items were chicken: 111
tons and beef: 66 tons. They were mostly imported from Thailand, Brazil, and the
Netherlands. They can be found largely at City Mart’s Marketplace and fine dining facilities
in hotels and restaurants, such as steak houses. As for exports, pork is the most exported
item with a volume of 386 tons, followed by chicken and beef at 190 tons and 151 tons,
respectively. The top meat importers are Thailand and the Netherlands. The trade is
conducted via land for Thailand and sea for the Netherlands.
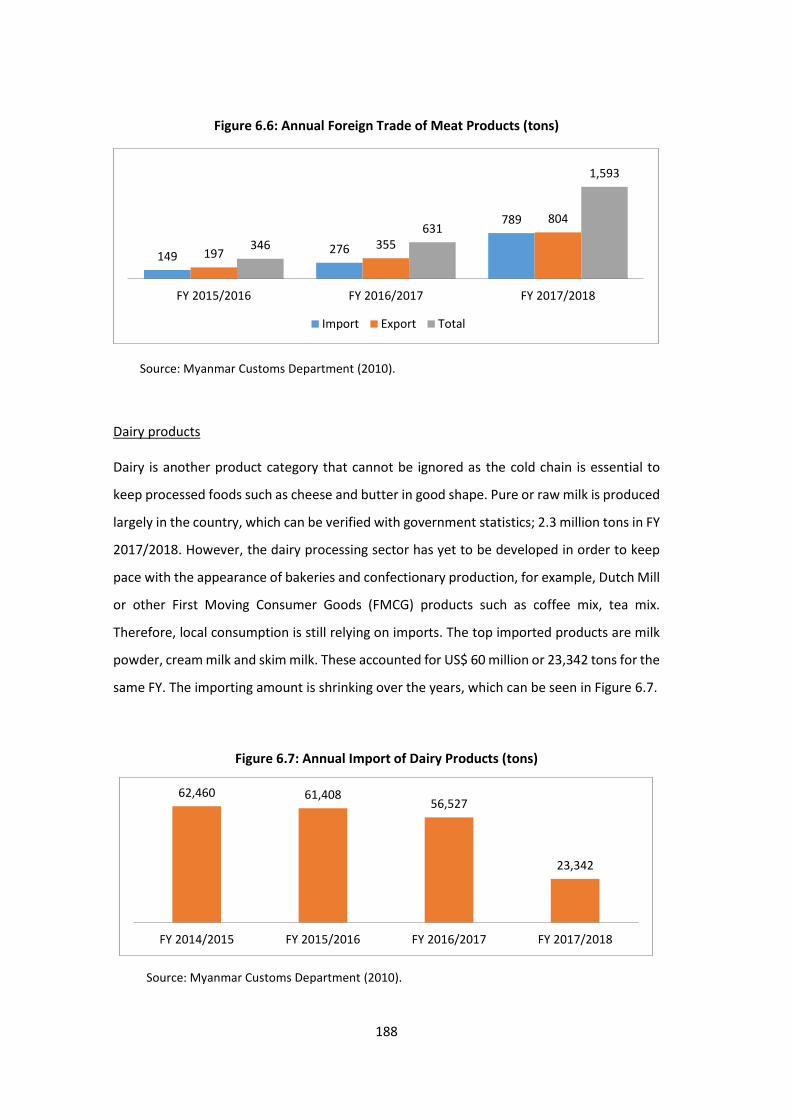
188
Figure 6.6: Annual Foreign Trade of Meat Products (tons)
Source: Myanmar Customs Department (2010).
Dairy products
Dairy is another product category that cannot be ignored as the cold chain is essential to
keep processed foods such as cheese and butter in good shape. Pure or raw milk is produced
largely in the country, which can be verified with government statistics; 2.3 million tons in FY
2017/2018. However, the dairy processing sector has yet to be developed in order to keep
pace with the appearance of bakeries and confectionary production, for example, Dutch Mill
or other First Moving Consumer Goods (FMCG) products such as coffee mix, tea mix.
Therefore, local consumption is still relying on imports. The top imported products are milk
powder, cream milk and skim milk. These accounted for US$ 60 million or 23,342 tons for the
same FY. The importing amount is shrinking over the years, which can be seen in Figure 6.7.
Figure 6.7: Annual Import of Dairy Products (tons)
Source: Myanmar Customs Department (2010).
149 276
789
197 355
804
346 631
1,593
FY 2015/2016 FY 2016/2017 FY 2017/2018
Import Export Total
62,460 61,408 56,527
23,342
FY 2014/2015 FY 2015/2016 FY 2016/2017 FY 2017/2018

189
This means the local industry is catching up, even though at a slower pace, and the sector’s
total production output is still hard to grasp. The top imports of dairy products by country
are New Zealand, Australia, and Germany, with each contributing 36%, 14%, and 12%,
respectively. In the matter of the cold chain, storage appears to be more in demand than
transport. Depending on the product, cold boxes are more widely used for local distribution
rather than refrigerated trucks.
In brief, the livestock sector, a combination of meat and dairy is not using the cold chain for
local distribution, except for foreign trade. On the other hand, on a more positive side, it can
be concluded that the sector has potential given its worth of 5.1 million tons. This is 34% of
the total volume with cold chain potential. The current demand of the cold chain is only
0.42%, which is 24,935 tons or US$ 65 million in value.
⚫ Selected agricultural products
There appear to be very few amounts of agricultural products that demand the cold chain,
largely due to the fact that Myanmar is an agri-based economy with plentiful fresh produce
available all year round. Cold chain demand is only driven by export produce items and
imports of produce that cannot be fully cultivated locally and is demanded, particularly from
the hospitality industry. In FY 2017/2018, the production of agricultural products was 4.16
million tons; of which, fruit comprised 18% and vegetables 82%. In this figure, only the
selected items with cold chain potential as well as the items that are of significant yields are
included.
Table 6.13: Annual Statistics of Selected Agricultural Products (tons)
FY Production Export Import Consumption
2014/2015 4,165,384 – – 4,165,384
2015/2016 4,224,876 – – 4,224,876
2016/2017 4,362,192 10,881 15,571 4,366,882
2017/2018 4,159,363 14,118 25,444 4,159,363
Sources: CSO (2018), Myanmar Customs Department (2010).
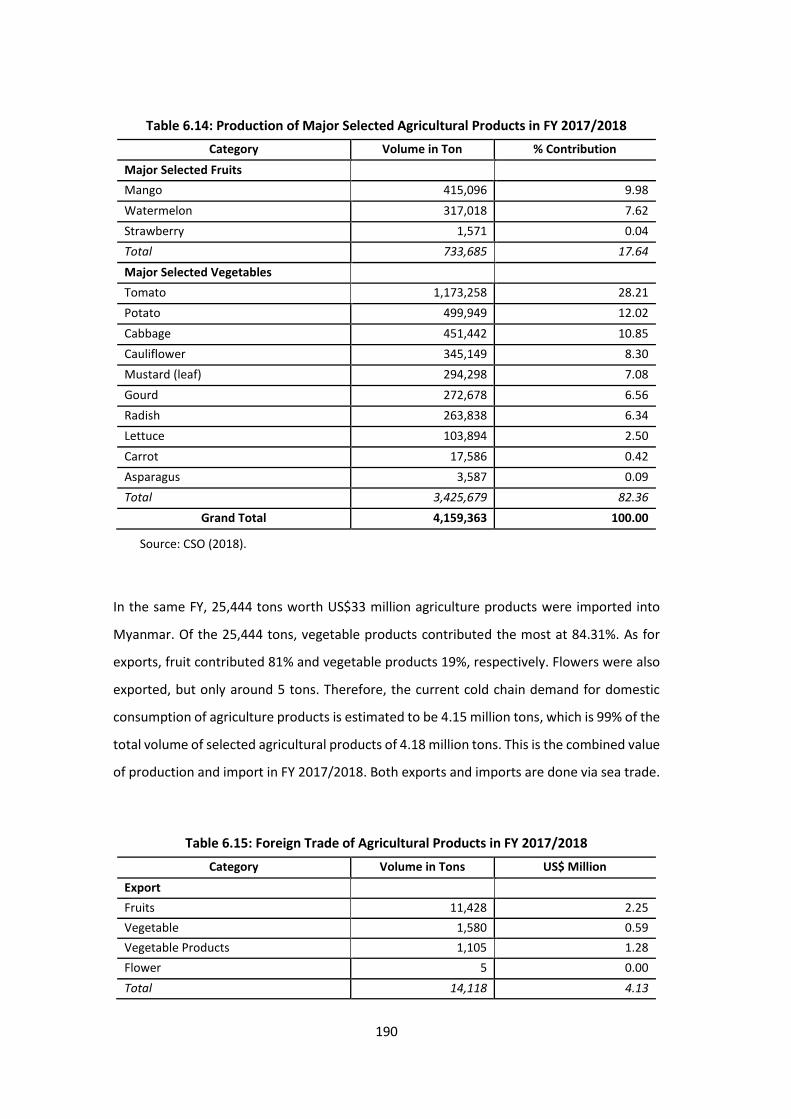
190
Table 6.14: Production of Major Selected Agricultural Products in FY 2017/2018
Category Volume in Ton % Contribution
Major Selected Fruits
Mango 415,096 9.98
Watermelon 317,018 7.62
Strawberry 1,571 0.04
Total 733,685 17.64
Major Selected Vegetables
Tomato 1,173,258 28.21
Potato 499,949 12.02
Cabbage 451,442 10.85
Cauliflower 345,149 8.30
Mustard (leaf) 294,298 7.08
Gourd 272,678 6.56
Radish 263,838 6.34
Lettuce 103,894 2.50
Carrot 17,586 0.42
Asparagus 3,587 0.09
Total 3,425,679 82.36
Grand Total 4,159,363 100.00
Source: CSO (2018).
In the same FY, 25,444 tons worth US$33 million agriculture products were imported into
Myanmar. Of the 25,444 tons, vegetable products contributed the most at 84.31%. As for
exports, fruit contributed 81% and vegetable products 19%, respectively. Flowers were also
exported, but only around 5 tons. Therefore, the current cold chain demand for domestic
consumption of agriculture products is estimated to be 4.15 million tons, which is 99% of the
total volume of selected agricultural products of 4.18 million tons. This is the combined value
of production and import in FY 2017/2018. Both exports and imports are done via sea trade.
Table 6.15: Foreign Trade of Agricultural Products in FY 2017/2018
Category Volume in Tons US$ Million
Export
Fruits 11,428 2.25
Vegetable 1,580 0.59
Vegetable Products 1,105 1.28
Flower 5 0.00
Total 14,118 4.13
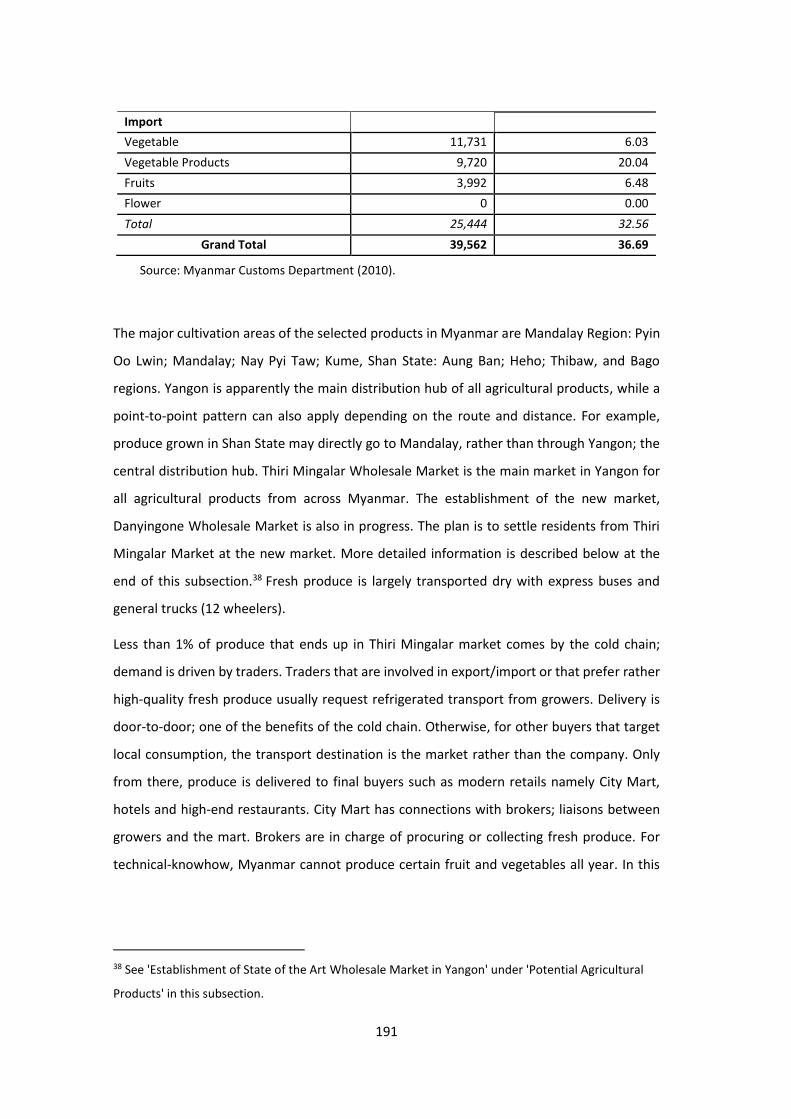
191
Import
Vegetable 11,731 6.03
Vegetable Products 9,720 20.04
Fruits 3,992 6.48
Flower 0 0.00
Total 25,444 32.56
Grand Total 39,562 36.69
Source: Myanmar Customs Department (2010).
The major cultivation areas of the selected products in Myanmar are Mandalay Region: Pyin
Oo Lwin; Mandalay; Nay Pyi Taw; Kume, Shan State: Aung Ban; Heho; Thibaw, and Bago
regions. Yangon is apparently the main distribution hub of all agricultural products, while a
point-to-point pattern can also apply depending on the route and distance. For example,
produce grown in Shan State may directly go to Mandalay, rather than through Yangon; the
central distribution hub. Thiri Mingalar Wholesale Market is the main market in Yangon for
all agricultural products from across Myanmar. The establishment of the new market,
Danyingone Wholesale Market is also in progress. The plan is to settle residents from Thiri
Mingalar Market at the new market. More detailed information is described below at the
end of this subsection.38 Fresh produce is largely transported dry with express buses and
general trucks (12 wheelers).
Less than 1% of produce that ends up in Thiri Mingalar market comes by the cold chain;
demand is driven by traders. Traders that are involved in export/import or that prefer rather
high-quality fresh produce usually request refrigerated transport from growers. Delivery is
door-to-door; one of the benefits of the cold chain. Otherwise, for other buyers that target
local consumption, the transport destination is the market rather than the company. Only
from there, produce is delivered to final buyers such as modern retails namely City Mart,
hotels and high-end restaurants. City Mart has connections with brokers; liaisons between
growers and the mart. Brokers are in charge of procuring or collecting fresh produce. For
technical-knowhow, Myanmar cannot produce certain fruit and vegetables all year. In this
38 See 'Establishment of State of the Art Wholesale Market in Yangon' under 'Potential Agricultural
Products' in this subsection.
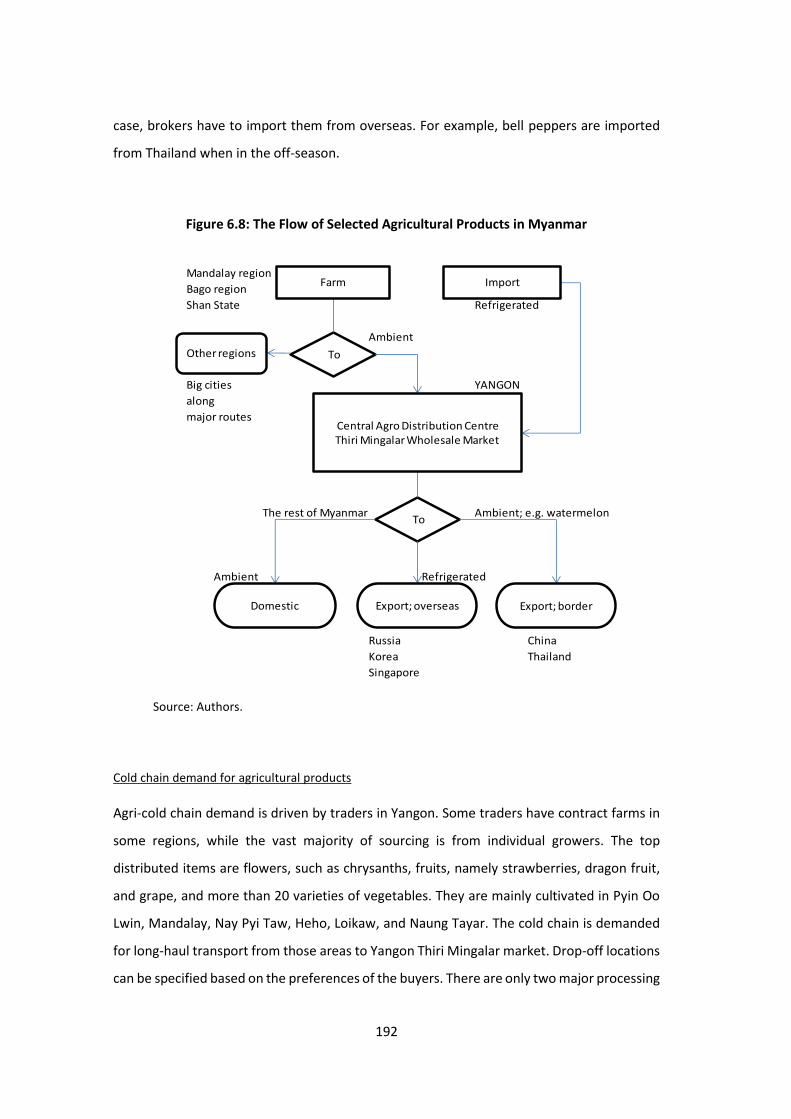
192
case, brokers have to import them from overseas. For example, bell peppers are imported
from Thailand when in the off-season.
Figure 6.8: The Flow of Selected Agricultural Products in Myanmar
Source: Authors.
Cold chain demand for agricultural products
Agri-cold chain demand is driven by traders in Yangon. Some traders have contract farms in
some regions, while the vast majority of sourcing is from individual growers. The top
distributed items are flowers, such as chrysanths, fruits, namely strawberries, dragon fruit,
and grape, and more than 20 varieties of vegetables. They are mainly cultivated in Pyin Oo
Lwin, Mandalay, Nay Pyi Taw, Heho, Loikaw, and Naung Tayar. The cold chain is demanded
for long-haul transport from those areas to Yangon Thiri Mingalar market. Drop-off locations
can be specified based on the preferences of the buyers. There are only two major processing
Mandalay region
Bago region
Shan State Refrigerated
Ambient
Big cities
along
major routes
YANGON
The rest of Myanmar Ambient; e.g. watermelon
Ambient Refrigerated
Russia China
Korea Thailand
Singapore
Source: MMRD
To
To Other regions
Export; overseasDomestic
Farm Import
Central Agro Distribution CentreThiri Mingalar Wholesale Market
Export; border

193
factories in Myanmar for fresh produce; dehydration and freezing. Production output is
about 150 FEUs which is half its actual capacity. They are exported to Japan. Pickup from the
farm is generally done through general light trucks, however refrigerated trucks would be
utilised for the varieties mentioned 2019 onwards to keep the exact quality from harvest.
Figure 6.9: Cold Chain Product Flow for Fresh Produce in Pyin Oo Lwin City, Mandalay Region
Source: Authors.
Go Green is one of the traders in Yangon that has its own fresh produce store. It gathers
organic fresh produce, including flowers from growers throughout Myanmar, especially from
Pyin Oo Lwin and adds value with proper packaging and labelling to make it ready for sale.
The sale is mainly through the store, while the products can also be found on City Mart’s
shelves. Premium Sojitz Logistics (PSL) is the sole third-party cold chain service provider for
the city. PSL deploys two refrigerated trucks to the city unloaded every day which carry back
full truck loads of produce to Yangon. The controlled temperature in the truck depends on
the type of produce, but is about 8°C. The company purchases about 20–30% of flowers from
Collect produce at the farm; e.g. flower
Sent to PSL's truck staion/ packing centre
Initial cleaning & packing for freshly picked produce at the
centre; chinese broccoli
Put fruit and vegetables into stackable basket; e.g. tomato
Initially packed produce in the truck; chinese broccoli and
mustard greens
Isuzu Elf 3ton reefer box truck at the centre, waiting to be sent to PSL's main truck staion in Anee
Sakhan

194
the city with the cold chain. Unlike fruit and vegetables that can be carried together,
dedicated trucks are required for flowers based on seasonality. Stackable moving baskets are
used for loading vegetables, while corrugated cartons are used for flowers and some fruits.
A fruit carton box weights about 10 kg and a vegetable basket about 20 to 30 kg. For flowers,
about 18 bundles can be filled in carton boxes, and up to 100 carton boxes can be loaded
into a refrigerated truck.
Figure 6.10: The Flow of Fresh Produce in Yangon Region
Source: Authors.
Potential agricultural products
Strawberry: Local production of strawberries was 1,571 tons in FY 2017/2018. The
strawberry season starts from November and ends in May, before monsoon. There is a steady
flow of them, about 10 tons each day from Pyin Oo Lwin to Yangon with the cold chain. About
40 tons of them are being frozen at PSL cold store to make up for the off-season. During those
times, they are distributed to cafés and other drink and juice stands in Yangon.
Representatives from Germany also studied about strawberries in Pyin Oo Lwin and Taunggyi.
With the support of GIZ, about 20 acres are getting required certificates for export to the
European Union and other countries. Currently, 20 tons is being grown as an export sample
to Russia. If successful, about 40 acres of strawberry plantation would definitely need the
cold chain.
Carrot: Carrots are in demand all year round, particularly in Yangon as they cannot be grown
in Myanmar for technical reasons. Therefore, carrots have to be imported a lot during
monsoon from China. Each week from August to October, a carrot trader has to import two
truckloads of them with semi-trailers to fill up the demand shortage. Once they reach Yangon,
they are stored in the fish and prawn cold storage. Some traders want to distribute them
Farm
- Mandalay Region
- Bago Region
- Shan State
Central distribution centre
- Thiri Mingalar
Retail
- City Mart
- Ocean
- Wet market
End consumer
- Restaurant
- Hotel
- Household

195
directly from Pyin Oo Lwin to Mandalay without going through Yangon, which is now the case.
Carrots are largely grown in Pyin Oo Lwin and Taunggyi, and its season falls between
December and May, a period of the highest yields bearing the finest quality. But there is not
a single facility in the city to store them for later use to meet the demand. In the future, the
dehydration of carrot and cabbage, the ingredients for instant noodles, will be possible with
the technical support of Korea and factory construction and operation.
Mango: China buys the vast majority of fresh mangoes, but the export is through the border
with general trucks. Only a few of them, about 36 tons, are exported via sea freight with
reefer containers. The major buyers are Russia, Korea, and Singapore. They are grown in the
Nay Pyi Taw and Mandalay region. Dehydration of mangoes is also expected in the near
future. A new solar-powered cold storage has been placed in Palate Township in Mandalay
region for fresh produce. Up to 5 tons of produce can be stored in it. In addition, they are
expected to be exported into Thailand in 2019 with the cold chain.
Dragon fruit: some growers are test-growing the fruit; commercial plantation will be
considered according to its fertility and productivity. It is the cheapest fruit during the season;
about a hundred Kyat39 per unit. Therefore, related stakeholders are planning to add value
to it with dehydration under the support of Taiwan in terms of technical knowhow.
Though it seems like baby steps, the development work in the sector is taking shape steadily.
Some noticeable works are as follows:
Establishment of solar-powered mobile cold rooms at farms for fresh produce: The
Myanmar Fruit, Flower and Vegetable Producer and Exporter Association (MEVP) is drawing
up many plans for the development of the agricultural cold chain sector. One of the many
plans is to construct a cold storage facility for fresh produce in each main city for each region:
Monywar in Sagaing Region; Min Dat in Chin State, Myit Kyee Nar in Kachin State, Dawei in
Tanintharyi Region, etc. Produce will then be consolidated and sent to the two central cold
storage facilities. They will be located in Titar Oo for Upper Myanmar and in Bago or Kyaung
Kone in Ayeyarwaddy for Lower Myanmar. Freight transport is planned to be with reefer
containers only. However, implementation will depend on the funding availability. Therefore,
39 1 Kyat = 1/1500 US$

196
to fulfil current needs in the short term, the association is planning to place a 5-ton solar-
powered reefer container down at the farm with the support of GIZ. When the full
consolidation is reached, an unloaded reefer trailer would be sent to the farm for goods
transhipment.
There are 32 small associations for produce. Capacity building campaigns, including
knowledge sharing of cold chain technologies, are planned to be delivered to those
associations. They in turn will reach the farms for re-sharing. Awareness-raising campaigns
will also be delivered to traders to encourage them to use cold chain logistics for all their
export produce. This will be done by stressing the benefits that cold chain can bring over
traditional logistics such as traders’ produce meeting the international standard or export
quality and therefore, gain the best price.40 Additionally, it is heard that there is a conceptual
plan to build a new agricultural distribution hub in the Nay Pyi Taw and Mandalay region. If
it were to be materialised, current agricultural product flow; shown in Figure 6.10, will
change accordingly.
The private sector is also contributing partly to the sector’s development. In Palate city in the
Mandalay region, a test-running 5-ton mobile cold storage has been provided by Natural
Farm Fresh Myanmar Co., Ltd in collaboration with the Indian Start-up, EcoZen.41 Electricity
would not be a problem as they are solar-powered. The company is a social enterprise as well
as an entrepreneur empowering growers and their direct communities. It is partnering with
Convestro and DEG KfW, for technical and funding support.42 Its main business function is
providing solar drying technologies for produce; initiation with spices such as chilli, turmeric,
and ginger. This technology reduces 30% wastage to upstream final products while adding
value to the low-earning fresh produce for farmers. It is part of a public–private partnership
project called Economic Transformation through Food Security. Myanmar is one of the three
countries that the project is based on. So far, the company has installed 11 solar dryer domes
in Shan State, Yangon, and the Mandalay region, while Thailand has about 600 units. The
finished processed products of chilli, turmeric, and ginger are being exported to overseas
markets, and the cold chain is being used until they reach export markets.43 If the test-
40 Interview to Myanmar Fruit, Flower and Vegetable Producer and Exporter Association. 41 Convestro (n.d.). 42 Phuong (2018) . 43 Natural Farm Fresh Myanmar (2019).

197
running succeeds, hopefully, the steady installation of cold storage will come along just as
solar dryers.
Establishment of a state-of-the-art wholesale market in Yangon: The new Danyingone
Wholesale Market has been developed jointly by Myanmar Agro Exchange Public Limited
(MAEX) and the Yangon City Development Committee (YCDC). The development has three
phases; the opening of the shops in phase 1 and cold storages in phase 2. The final phase is
expected to be completed by the end of 2019. The Yangon Government will take charge of
the operation once it becomes fully functional. So far, phase 1 has been carried out and space
rental started in October 2018. However, it would take some time before residents become
entirely resettled from Thiri Mingalar Market as it is still in progress. Currently, two 40-feet
reefer containers have been placed on the premise for early use prior to phase 2. They are
powered by the facility’s electricity supply and storage is free of charge as of now.
Figure 6.11: Two Reefer Containers Placed at the New Danyingone Wholesale Market
Source: Authors.
Unlike the old Thiri Mingalar Wholesale Market, this newly developed establishment aims to
go beyond its primary function of a wholesale market and provide unparalleled services, i.e.
to promote the entire agricultural supply chain. This includes the enhancement of farm
produce quality that is in line with export standards and providing necessary support until
they reach foreign markets. It is also planning to connect growers directly with end customers.
Given the fact that cold storages are placed at its core phase, the entire agricultural supply
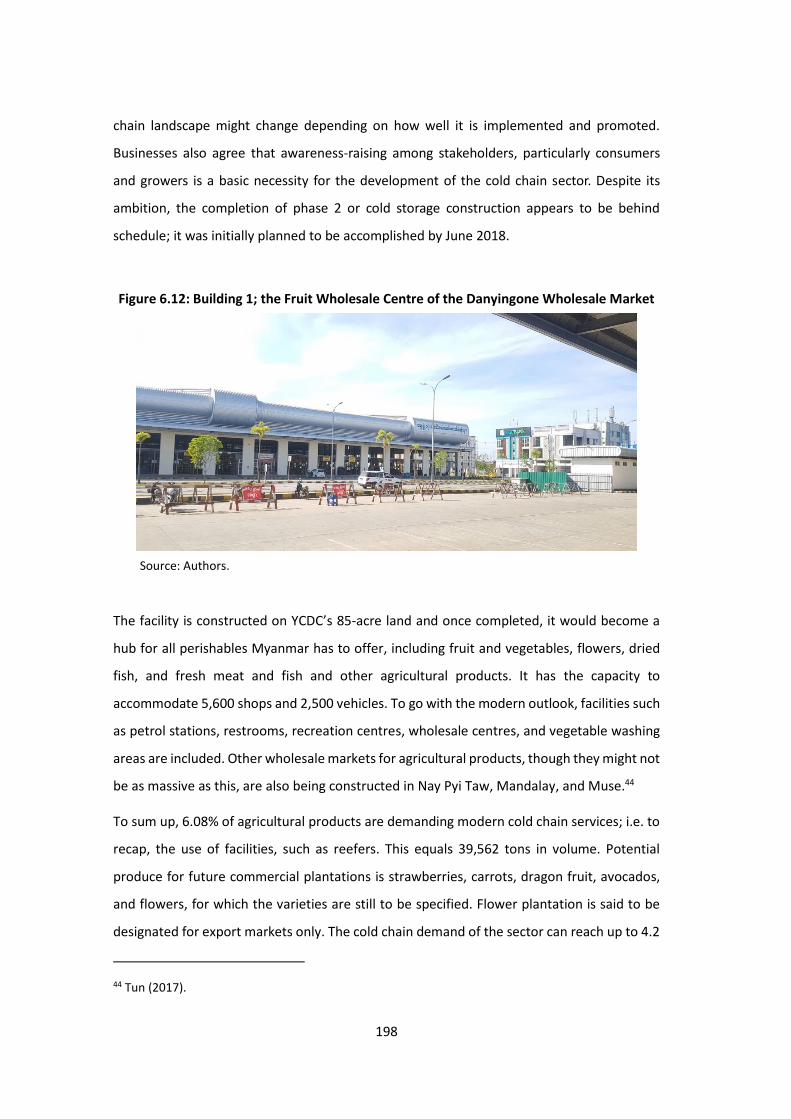
198
chain landscape might change depending on how well it is implemented and promoted.
Businesses also agree that awareness-raising among stakeholders, particularly consumers
and growers is a basic necessity for the development of the cold chain sector. Despite its
ambition, the completion of phase 2 or cold storage construction appears to be behind
schedule; it was initially planned to be accomplished by June 2018.
Figure 6.12: Building 1; the Fruit Wholesale Centre of the Danyingone Wholesale Market
Source: Authors.
The facility is constructed on YCDC’s 85-acre land and once completed, it would become a
hub for all perishables Myanmar has to offer, including fruit and vegetables, flowers, dried
fish, and fresh meat and fish and other agricultural products. It has the capacity to
accommodate 5,600 shops and 2,500 vehicles. To go with the modern outlook, facilities such
as petrol stations, restrooms, recreation centres, wholesale centres, and vegetable washing
areas are included. Other wholesale markets for agricultural products, though they might not
be as massive as this, are also being constructed in Nay Pyi Taw, Mandalay, and Muse.44
To sum up, 6.08% of agricultural products are demanding modern cold chain services; i.e. to
recap, the use of facilities, such as reefers. This equals 39,562 tons in volume. Potential
produce for future commercial plantations is strawberries, carrots, dragon fruit, avocados,
and flowers, for which the varieties are still to be specified. Flower plantation is said to be
designated for export markets only. The cold chain demand of the sector can reach up to 4.2
44 Tun (2017).
199
million tons, which is 28% of the cold chain sector. In fruit variety, mango bears the highest
possibility with 9.98%, accompanied by carrots at 0.42% and strawberries at 0.04%. That
would leave vegetables, which represents 82.36%.
⚫ Chemicals/pharmaceuticals
The cold chain is in demand for health products, such as vaccines and snake antivenom, in
order to sustain constant quality from the day of manufacture to the day of expiry.
Temperature adjustments have to be carefully set, which usually are between 2°C and 8°C,
while ensuring for the temperature does not reach under freezing point. A certain amount of
them are being imported into Myanmar as local supply does not meet the demand. In FY
2017/2018, vaccine imports totalled 2,618 tons with a value of US$ 22.78 million. 86% of
them worth of US$ 17.58 million are dedicated for human needs and they come via air freight.
Between 20 and 30 carton boxes are imported per shipment.
During transit, they have to be lined with frozen ice packs to keep the temperature under
10°C. As for other drugs, such as tablets and pills, they come in general TEU and FEU via sea
and land. Large storage space is not necessary for vaccines as the stock is kept low. Only the
required amount is imported for its expensive nature. It is plenty if the space is 18.5 sqm (200
square feet) wide; about the size of a garage. They are stored in the cold room with the
temperature adjustment between 2°C and 8°C. A general warehouse with below 25°C room
temperature is acceptable for other drugs.
Top vaccines distributors in the field are Mega, AA, DKSH and Capital Diamond Star.
Distribution is with air-conditioned trucks; though it used to be express buses. When
transporting, they have to be put into foam cooler boxes lined with ice packs. These ice packs
can last 24 hours, 36 hours, or 48 hours and are used accordingly based on the distance of
transport. Other drugs are not that temperature-sensitive compared with vaccines.
Therefore, they are mostly distributed with general trucks, except for the top-notch
companies, such as above, that use air-conditioned trucks.

200
⚫ Processed foods
Processed foods are divided into two categories. The first category includes fruit and
vegetable-based processed food, such as jam, jelly, pickles, and syrup. The latter includes
processed seafood and meat, such as meatballs, fillets, and sausages. There are other
categories of processed foods such as dairy, microwave meals, or convenience foods and
many more. The main emphasis here would be the only two mentioned.
Fruit and vegetable-based processed foods
There are many local agri-food processors, but they are all spread out producing small scale,
mainly for some big markets such as Yangon and Mandalay. There is no evidence of cold
chain usage for local consumption or distribution of those products, except for wine with a
trivial amount. However, there are about 150 40-ft reefer containers departing for Japan fully
loaded with processed vegetables every year.
They are the work of Myanmar Belle and Myanmar Agro Foods Companies, the sole
manufacturers of export-quality dehydrated and frozen vegetables in Myanmar. Both
companies are owned by a single entity. The company has a joint venture with a Japanese
logistics company, Logitem, for its cold chain requirements. With Logitem at its side, the
company’s business operations cover nearly the whole agricultural supply chain and the
inbound supply chain, such as contract farming and processing for outbound until export.
The distribution of fresh produce to local supermarkets and restaurants is only through
general logistics or express buses. It also engages in seafood exports, but only agricultural
products will be emphasised here. The dehydration factory is in Taunggyi and the frozen
factory is in Nay Pyi Taw. Raw supplies for dehydration are cabbages, mustard leaves, garlic,
and carrots. They are grown in Shan State, namely Heho and processed in Taunggyi, and
transported directly to the Yangon International Port in FEU reefer containers, owned by the
entity. The products are used as ingredients in instant noodle. Refrigeration temperatures in
the reefers are set below 25°C.
As for frozen vegetables, produce such as ladyfingers, spinach, taro, green beans, and green
soybeans are the inputs. They are sourced in nearby regions of the factory in Nay Pyi Taw,
which is mainly meant for seafood processing. Starting from 2019, leaf-type vegetables, such

201
as mustard leaves, which are grown in Loikaw, Pyin Oo Lwin and Naung Tayar, are going to
use refrigerated trucks for transport from the farm to the factories; transportation of others,
such as cabbages and carrots, will remain as they are with general light trucks. Freezing will
take place in the cold storage in Nay Pyi Taw, which has a capacity between 600 and 800 tons.
After that, products will rest at the temporary 400-ton chilled room before reaching the
certain amount to fill up the FEU. Only after that will the entity deploy an empty reefer
container from Yangon for product pickup. The trailer will then drive directly down to the
port for export. The factory’s full production capacity is 300 FEUs, though only 150 FEUs are
produced each year depending on trade demand. The company is expecting to export frozen
mangoes next year.
Seafood and meat-based processed foods
Processed seafood and meat are contained in this category. The available products in the
market are processed meat, such as chicken fillets, meatballs, and sausages, and processed
seafood, such as fish fillets, fish balls, and artificial crab sticks, etc. They are considered a type
of hearty snack that goes along with different beverages and also are convenient to get.
Therefore, frequent, but fewer amounts of purchases for consumption are common among
the urban population, especially young people. But hotpot restaurants demand a larger
quantity of them as the ingredient. There are very few manufacturers or suppliers of the
product and all of them reside in the Yangon region. But product reachability is considerably
high in comparison to other foodstuffs; they can be found selling as a fast food in a mobile
food cart at every possible corner of the street, as in many tea houses in Myanmar.
Figure 6.13: Processed Meat and Seafood Displayed at Hotpot City Yangon
Source: Authors.
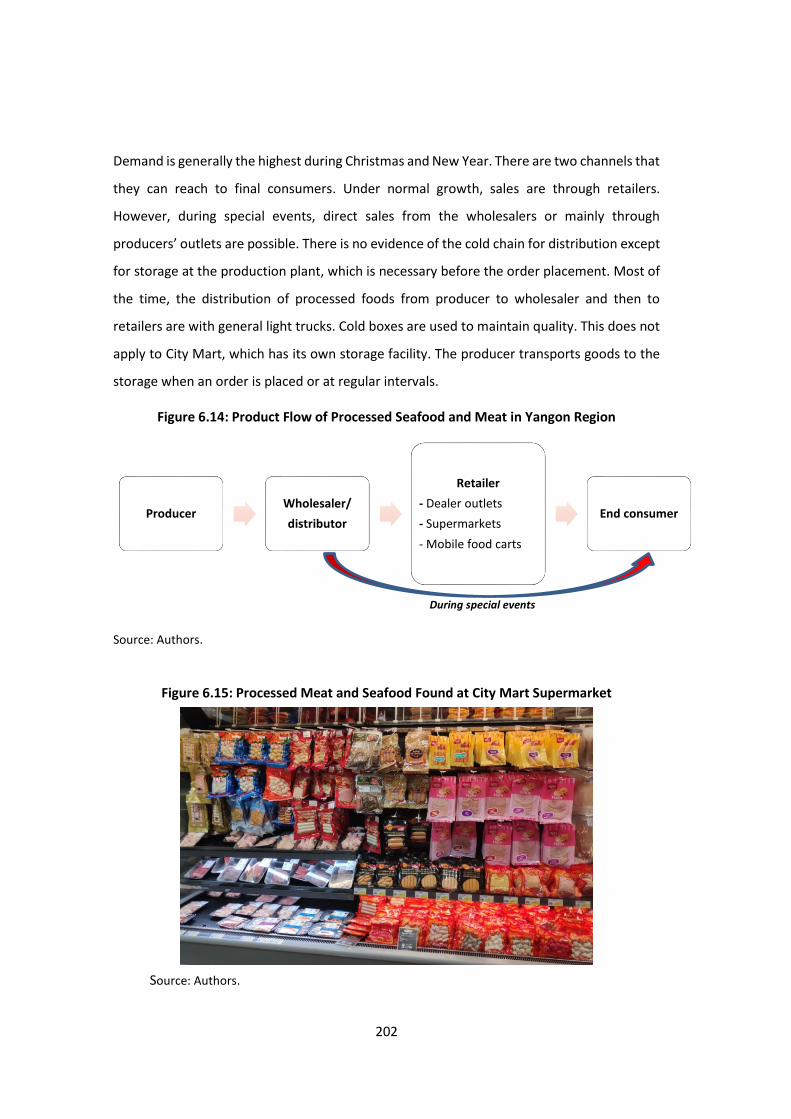
202
Demand is generally the highest during Christmas and New Year. There are two channels that
they can reach to final consumers. Under normal growth, sales are through retailers.
However, during special events, direct sales from the wholesalers or mainly through
producers’ outlets are possible. There is no evidence of the cold chain for distribution except
for storage at the production plant, which is necessary before the order placement. Most of
the time, the distribution of processed foods from producer to wholesaler and then to
retailers are with general light trucks. Cold boxes are used to maintain quality. This does not
apply to City Mart, which has its own storage facility. The producer transports goods to the
storage when an order is placed or at regular intervals.
Figure 6.14: Product Flow of Processed Seafood and Meat in Yangon Region
Source: Authors.
Figure 6.15: Processed Meat and Seafood Found at City Mart Supermarket
Source: Authors.
ProducerWholesaler/
distributor
Retailer
- Dealer outlets
- Supermarkets
- Mobile food carts
End consumer
During special events

203
6.3. Major Players in the Cold Chain
Main players in storage services
Suppliers in cold storage can divided into two; own account operators, and common users of
third-party service providers. In the first category are processing plants and cold storages
monopolised by the fishery sector. Some of them own insulated box trucks or other freight
vehicles, even freezer trucks if it is an exporter. The outsourcing of assets or storage space to
a third party is not common for the sector. However, it is possible for them to rent out space
for storage or transport to small-scale businesses that do not have owned assets and
properties. According to the MFF, Myanmar has 113 cold storage plants with a total capacity
of 54,490 tons in 2018 as described in Table 16 below. A typical operator would have its own
cold processing plant, standalone cold storage, and even an ice plant or possibly an
aquaculture farm, though it is not always the case.
Table 6.16: Registered Cold Storages and Processing Plants in Myanmar (2018)
Sr. Region Unit Capacity in Tons
1 Yangon 69 47,000
2 Tanintharyi 20 2,940
3 Rakhine 9 1,110
4 Ayerwaddy 8 1,100
5 Mon 6 1,340
6 Shan (Muse) 1 1,000
Total 113 54,490
Source: DOF (2018).
As for third-party cold warehousing services, there are not many suppliers; no more than 10
of them in Myanmar. To clarify, third party here means common user facility, which could be
for any type of goods from any sector. Most of the suppliers are joint ventures with Japanese
logistics companies, except Ryobi Myanmar, which is wholly Japanese owned and operated.
It is also the largest 3PL cold store facility in Myanmar. 3PL cold storages can only be found
in Yangon. The profiles of top 3PL logistic service providers can be seen in the Appendix.
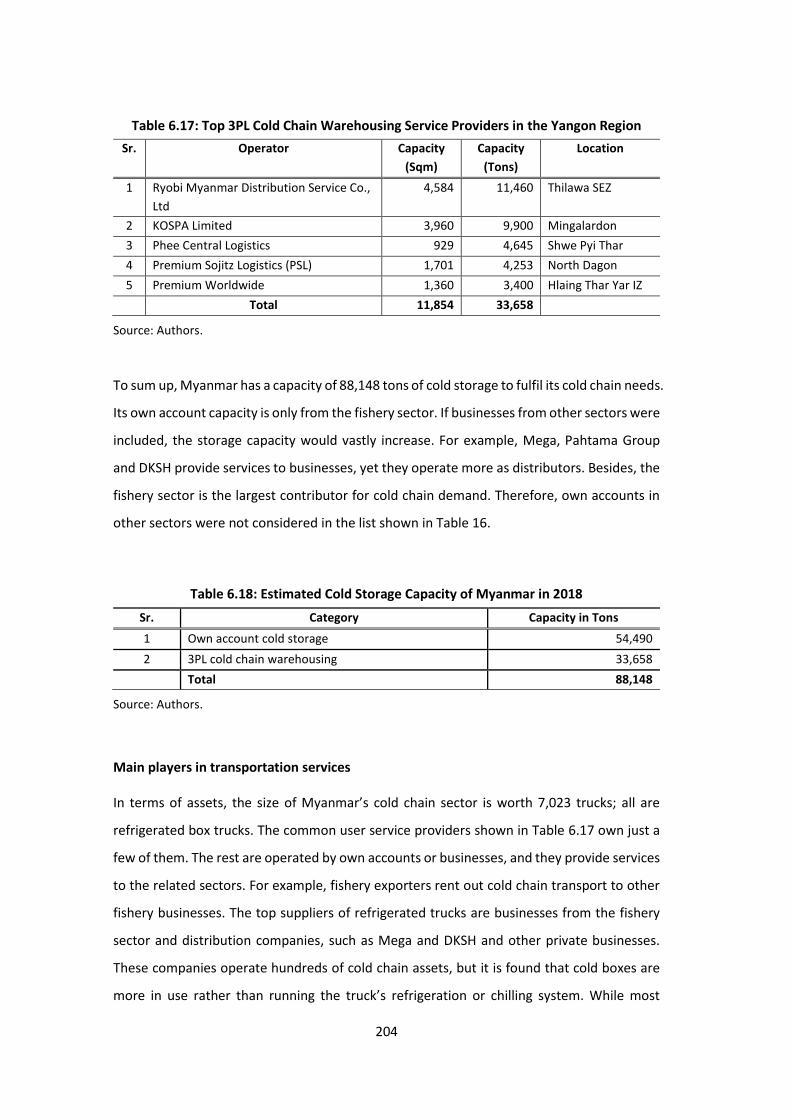
204
Table 6.17: Top 3PL Cold Chain Warehousing Service Providers in the Yangon Region
Sr. Operator Capacity
(Sqm)
Capacity
(Tons)
Location
1 Ryobi Myanmar Distribution Service Co.,
Ltd
4,584 11,460 Thilawa SEZ
2 KOSPA Limited 3,960 9,900 Mingalardon
3 Phee Central Logistics 929 4,645 Shwe Pyi Thar
4 Premium Sojitz Logistics (PSL) 1,701 4,253 North Dagon
5 Premium Worldwide 1,360 3,400 Hlaing Thar Yar IZ
Total 11,854 33,658
Source: Authors.
To sum up, Myanmar has a capacity of 88,148 tons of cold storage to fulfil its cold chain needs.
Its own account capacity is only from the fishery sector. If businesses from other sectors were
included, the storage capacity would vastly increase. For example, Mega, Pahtama Group
and DKSH provide services to businesses, yet they operate more as distributors. Besides, the
fishery sector is the largest contributor for cold chain demand. Therefore, own accounts in
other sectors were not considered in the list shown in Table 16.
Table 6.18: Estimated Cold Storage Capacity of Myanmar in 2018
Sr. Category Capacity in Tons
1 Own account cold storage 54,490
2 3PL cold chain warehousing 33,658
Total 88,148
Source: Authors.
Main players in transportation services
In terms of assets, the size of Myanmar’s cold chain sector is worth 7,023 trucks; all are
refrigerated box trucks. The common user service providers shown in Table 6.17 own just a
few of them. The rest are operated by own accounts or businesses, and they provide services
to the related sectors. For example, fishery exporters rent out cold chain transport to other
fishery businesses. The top suppliers of refrigerated trucks are businesses from the fishery
sector and distribution companies, such as Mega and DKSH and other private businesses.
These companies operate hundreds of cold chain assets, but it is found that cold boxes are
more in use rather than running the truck’s refrigeration or chilling system. While most

205
transported goods are fresh perishables, non-perishables such as consumer goods are also
using insulated box trucks substantially though with no refrigeration, just to keep products
out of rain and dust. More than 90% of these are used trucks imported from Japan. Top
imported brands are Mitsubishi, Daihatsu, Toyota and Nissan. There are also local businesses
that do reconditioning works for assets owners, including the service to make in-truck
compartments for different temperatures. Figure 6.16 shows the import of cold chain trucks
has been on the rise since 2014.
Figure 6.16: Annual Import of Refrigerated Trucks (FY 2012/2013 to FY 2017/2018)
Source: Myanmar Customs Department (2010).
It is said that on average, only 10% of reefer containers are in utilisation for foreign trade. In
terms of prime movers, each trucking operator has between 10 and 30 of them. Some big
operators have a fleet over 200. But, none of them are equipped with generators except for
a few of them, which is said to be about 10, according to a spokesperson from the Myanmar
Container Trucks Association (MCTA). Just as 3PL warehousing, there are no more than 10
cold chain transportation service providers, as listed below in Table 6.19. Some logistics
companies are export-oriented and, consequently, they deploy their own fleet of semi-
trailers which can carry any type of container. Therefore, they are not considered as the key
players even though they own hundreds of assets. To clarify again, 3PL refers to service
providers that are actually using the authentic cold chain for the distribution of products.
They provide services to every business; not limited to a single product category in certain
sectors. There are many 3PLs that are not included in this list as they operate less than three
refrigerated trucks.
51 509 463 781
1,376
3,843
FY 2012/2013FY 2013/2014FY 2014/2015FY 2015/2016FY 2016/2017FY 2017/2018
Nu
mb
er o
f tr
uck
s
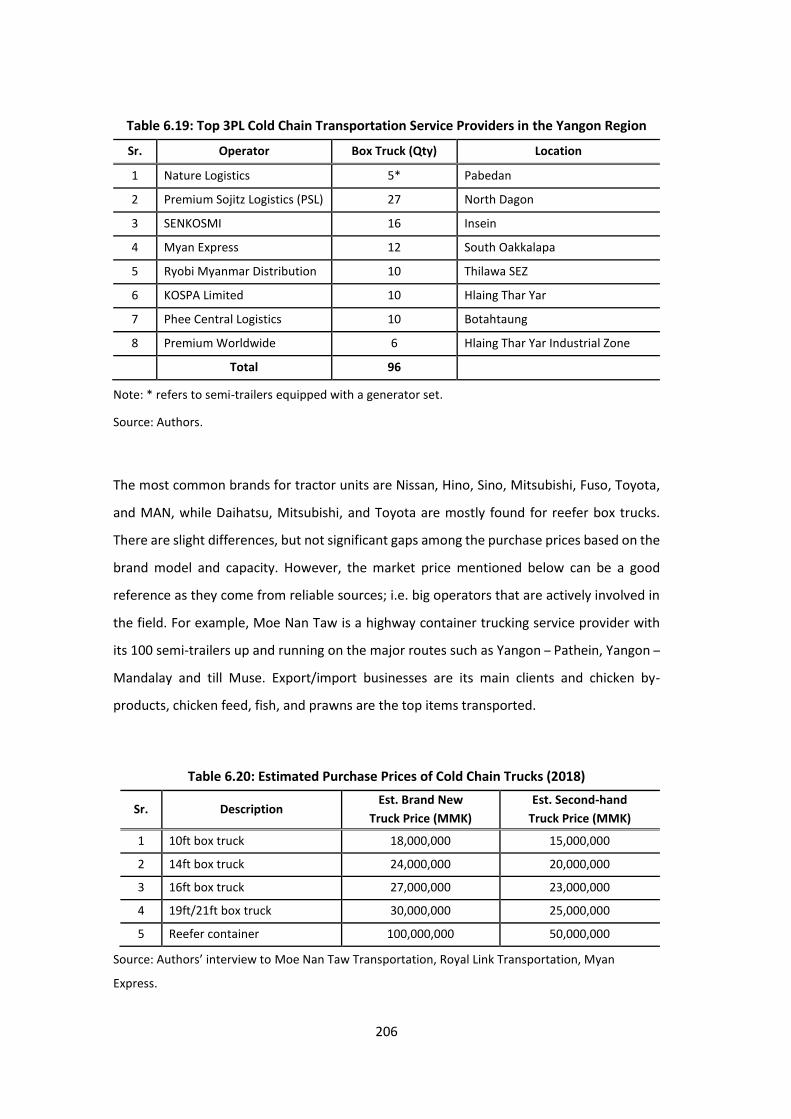
206
Table 6.19: Top 3PL Cold Chain Transportation Service Providers in the Yangon Region
Sr. Operator Box Truck (Qty) Location
1 Nature Logistics 5* Pabedan
2 Premium Sojitz Logistics (PSL) 27 North Dagon
3 SENKOSMI 16 Insein
4 Myan Express 12 South Oakkalapa
5 Ryobi Myanmar Distribution 10 Thilawa SEZ
6 KOSPA Limited 10 Hlaing Thar Yar
7 Phee Central Logistics 10 Botahtaung
8 Premium Worldwide 6 Hlaing Thar Yar Industrial Zone
Total 96
Note: * refers to semi-trailers equipped with a generator set.
Source: Authors.
The most common brands for tractor units are Nissan, Hino, Sino, Mitsubishi, Fuso, Toyota,
and MAN, while Daihatsu, Mitsubishi, and Toyota are mostly found for reefer box trucks.
There are slight differences, but not significant gaps among the purchase prices based on the
brand model and capacity. However, the market price mentioned below can be a good
reference as they come from reliable sources; i.e. big operators that are actively involved in
the field. For example, Moe Nan Taw is a highway container trucking service provider with
its 100 semi-trailers up and running on the major routes such as Yangon – Pathein, Yangon –
Mandalay and till Muse. Export/import businesses are its main clients and chicken by-
products, chicken feed, fish, and prawns are the top items transported.
Table 6.20: Estimated Purchase Prices of Cold Chain Trucks (2018)
Sr. Description Est. Brand New
Truck Price (MMK)
Est. Second-hand
Truck Price (MMK)
1 10ft box truck 18,000,000 15,000,000
2 14ft box truck 24,000,000 20,000,000
3 16ft box truck 27,000,000 23,000,000
4 19ft/21ft box truck 30,000,000 25,000,000
5 Reefer container 100,000,000 50,000,000
Source: Authors’ interview to Moe Nan Taw Transportation, Royal Link Transportation, Myan
Express.
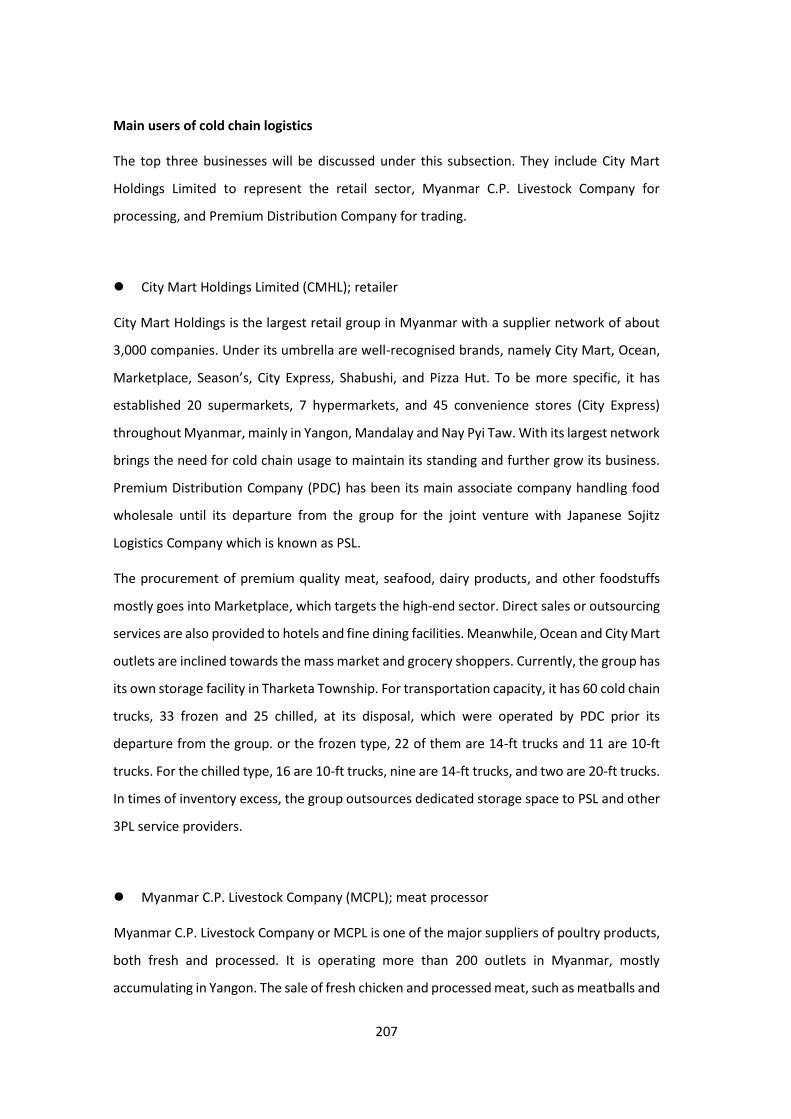
207
Main users of cold chain logistics
The top three businesses will be discussed under this subsection. They include City Mart
Holdings Limited to represent the retail sector, Myanmar C.P. Livestock Company for
processing, and Premium Distribution Company for trading.
⚫ City Mart Holdings Limited (CMHL); retailer
City Mart Holdings is the largest retail group in Myanmar with a supplier network of about
3,000 companies. Under its umbrella are well-recognised brands, namely City Mart, Ocean,
Marketplace, Season’s, City Express, Shabushi, and Pizza Hut. To be more specific, it has
established 20 supermarkets, 7 hypermarkets, and 45 convenience stores (City Express)
throughout Myanmar, mainly in Yangon, Mandalay and Nay Pyi Taw. With its largest network
brings the need for cold chain usage to maintain its standing and further grow its business.
Premium Distribution Company (PDC) has been its main associate company handling food
wholesale until its departure from the group for the joint venture with Japanese Sojitz
Logistics Company which is known as PSL.
The procurement of premium quality meat, seafood, dairy products, and other foodstuffs
mostly goes into Marketplace, which targets the high-end sector. Direct sales or outsourcing
services are also provided to hotels and fine dining facilities. Meanwhile, Ocean and City Mart
outlets are inclined towards the mass market and grocery shoppers. Currently, the group has
its own storage facility in Tharketa Township. For transportation capacity, it has 60 cold chain
trucks, 33 frozen and 25 chilled, at its disposal, which were operated by PDC prior its
departure from the group. or the frozen type, 22 of them are 14-ft trucks and 11 are 10-ft
trucks. For the chilled type, 16 are 10-ft trucks, nine are 14-ft trucks, and two are 20-ft trucks.
In times of inventory excess, the group outsources dedicated storage space to PSL and other
3PL service providers.
⚫ Myanmar C.P. Livestock Company (MCPL); meat processor
Myanmar C.P. Livestock Company or MCPL is one of the major suppliers of poultry products,
both fresh and processed. It is operating more than 200 outlets in Myanmar, mostly
accumulating in Yangon. The sale of fresh chicken and processed meat, such as meatballs and

208
sausages, are through its outlets and City Mart. Whole chicken birds are also distributed to
wet markets in Yangon. MCPL has its own cold storage facility with a capacity of 7 tons; 5
tons for frozen and 2 tons for chilled. Temperature can vary depending on the duration of
storage, from -25°C to 4°C. Storage space and transportation is outsourced during times of
excess demand. Transportation is mainly handled by KOSPA for distribution of chicken to its
main client KFC, which carries out regular inspection every three months or six months for
quality control. Therefore, cold chain usage is necessary. Apart from that, delivery of meat to
its clients including hotels and restaurants are mostly done with company own insulated box
trucks. Cold boxes are largely used during transport to maintain quality.
⚫ Premium Distribution Company (PDC); meat trader
Premium Distribution Co., Ltd is a trader of premium quality meat, seafood, and other
foodstuffs. Its main clients are City Mart, high-end restaurants, and hotels. PDC signed a joint
venture and combined with Japanese Sojitz Logistics Company, which called forth the split-
up with the City Mart holdings. The joint venture (JV), called PSL, is now fulfilling its cold chain
needs for its own joint venture, which is providing third-party cold chain services to
businesses in Myanmar, while PDC shifts its emphasis on the import or trade of premium
quality seafood, meat and various foodstuffs. PSL handles both urban and long-haul city-to-
city cold chain transportation services; it is mentioned under the strawberry case study. PSL’s
cold chain capacity can be assessed in Table A.3.
Table 6.21: Top five Meat Traders in FY 2016/2017
No Meat Exporter Meat Importer
1 Premium Distribution Co., Ltd Premium Distribution Co., Ltd
2 Agri Trade International Ltd. Agri Trade International Ltd.
3 Grand Wynn Enterprises Ltd. Grand Twin Brothers Ltd.
4 Advance Seafood Co., Ltd Top Home-made Foodstuff Trading Co., Ltd
5 Top Home-made Foodstuff Trading Co., Ltd Mandalay Bay Company Limited
Source: Myanmar Customs Department (2010).
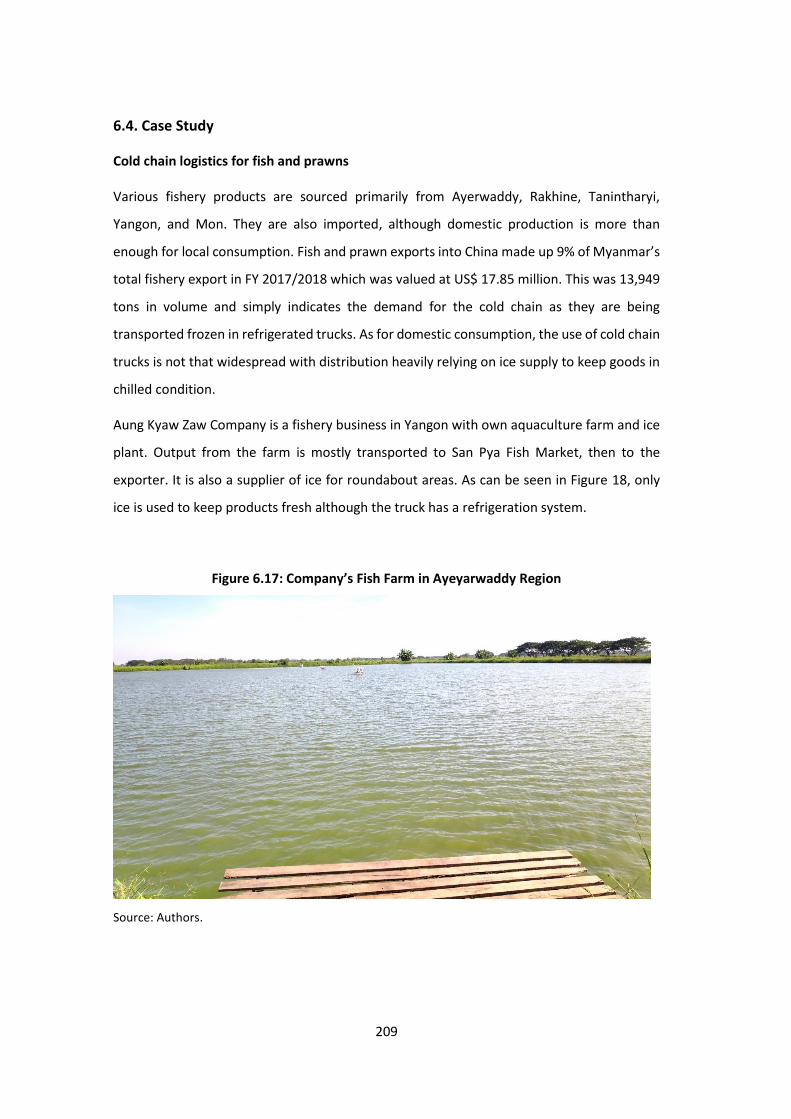
209
6.4. Case Study
Cold chain logistics for fish and prawns
Various fishery products are sourced primarily from Ayerwaddy, Rakhine, Tanintharyi,
Yangon, and Mon. They are also imported, although domestic production is more than
enough for local consumption. Fish and prawn exports into China made up 9% of Myanmar’s
total fishery export in FY 2017/2018 which was valued at US$ 17.85 million. This was 13,949
tons in volume and simply indicates the demand for the cold chain as they are being
transported frozen in refrigerated trucks. As for domestic consumption, the use of cold chain
trucks is not that widespread with distribution heavily relying on ice supply to keep goods in
chilled condition.
Aung Kyaw Zaw Company is a fishery business in Yangon with own aquaculture farm and ice
plant. Output from the farm is mostly transported to San Pya Fish Market, then to the
exporter. It is also a supplier of ice for roundabout areas. As can be seen in Figure 18, only
ice is used to keep products fresh although the truck has a refrigeration system.
Figure 6.17: Company’s Fish Farm in Ayeyarwaddy Region
Source: Authors.

210
Figure 6.18: Aung Kyaw Zaw Ice Plant in the Ayeyarwaddy Region
Source: Authors.
Figure 6.19: Aung Kyaw Zaw Ice Plant in the Ayeyarwaddy Region
Source: Authors.
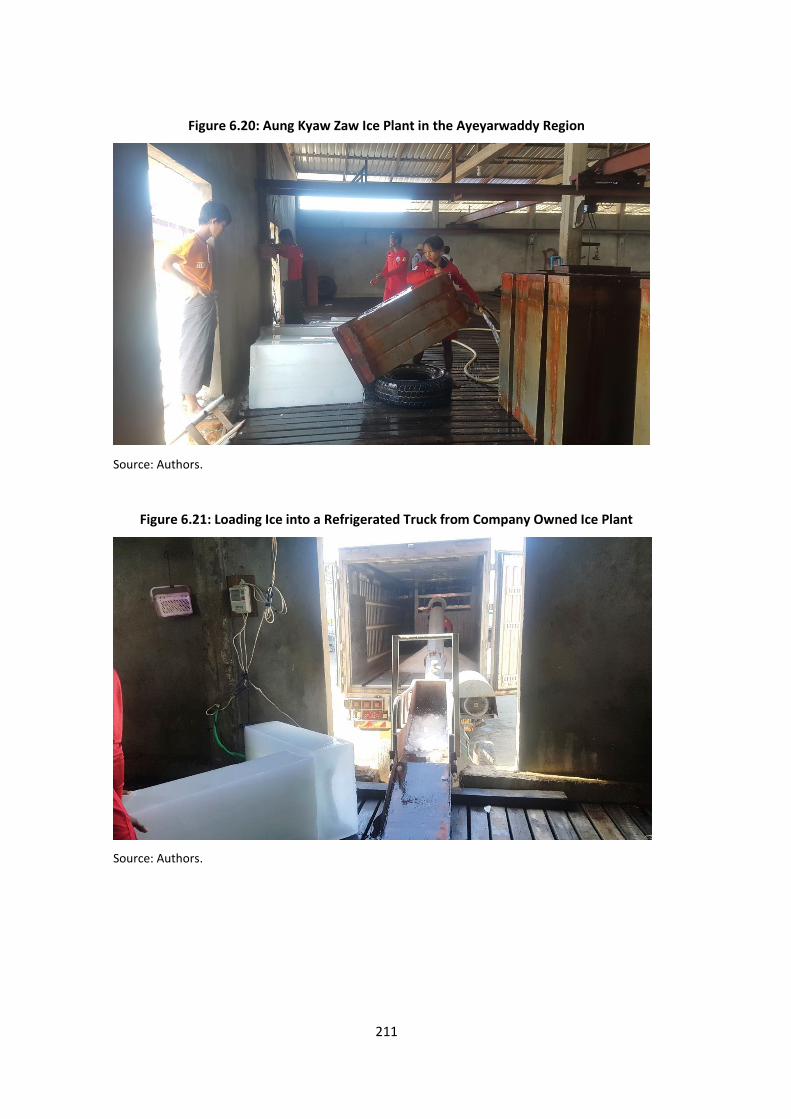
211
Figure 6.20: Aung Kyaw Zaw Ice Plant in the Ayeyarwaddy Region
Source: Authors.
Figure 6.21: Loading Ice into a Refrigerated Truck from Company Owned Ice Plant
Source: Authors.
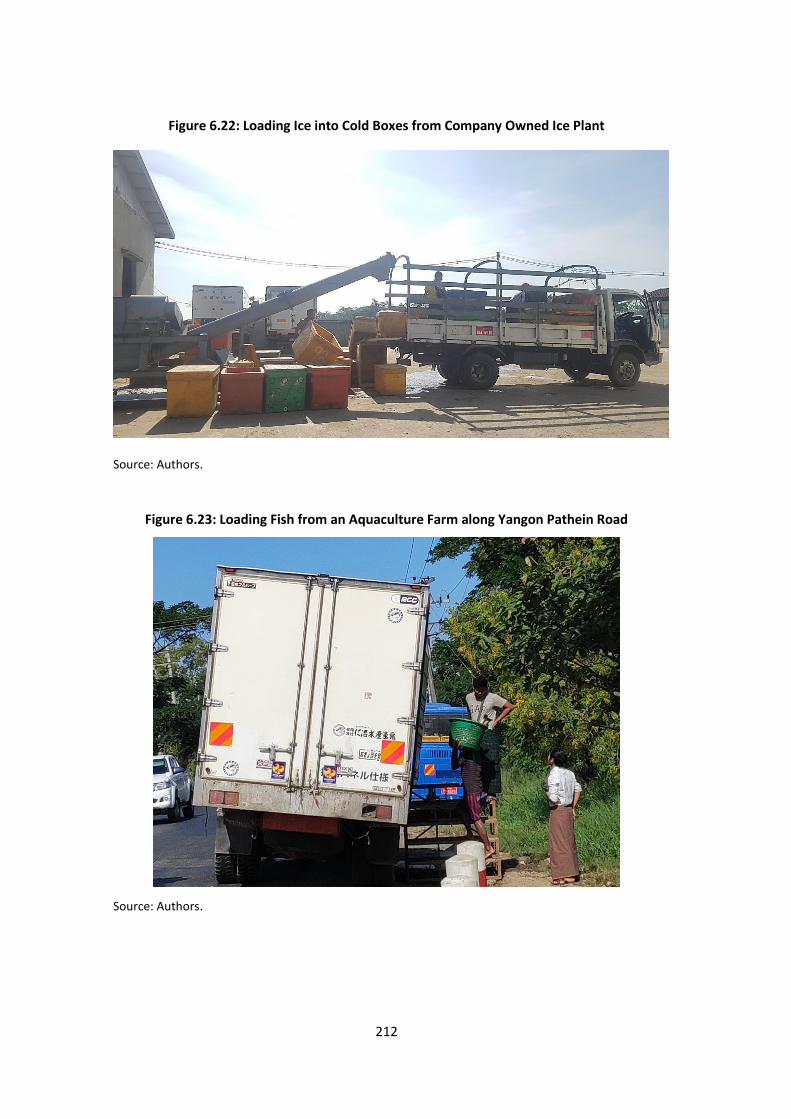
212
Figure 6.22: Loading Ice into Cold Boxes from Company Owned Ice Plant
Source: Authors.
Figure 6.23: Loading Fish from an Aquaculture Farm along Yangon Pathein Road
Source: Authors.
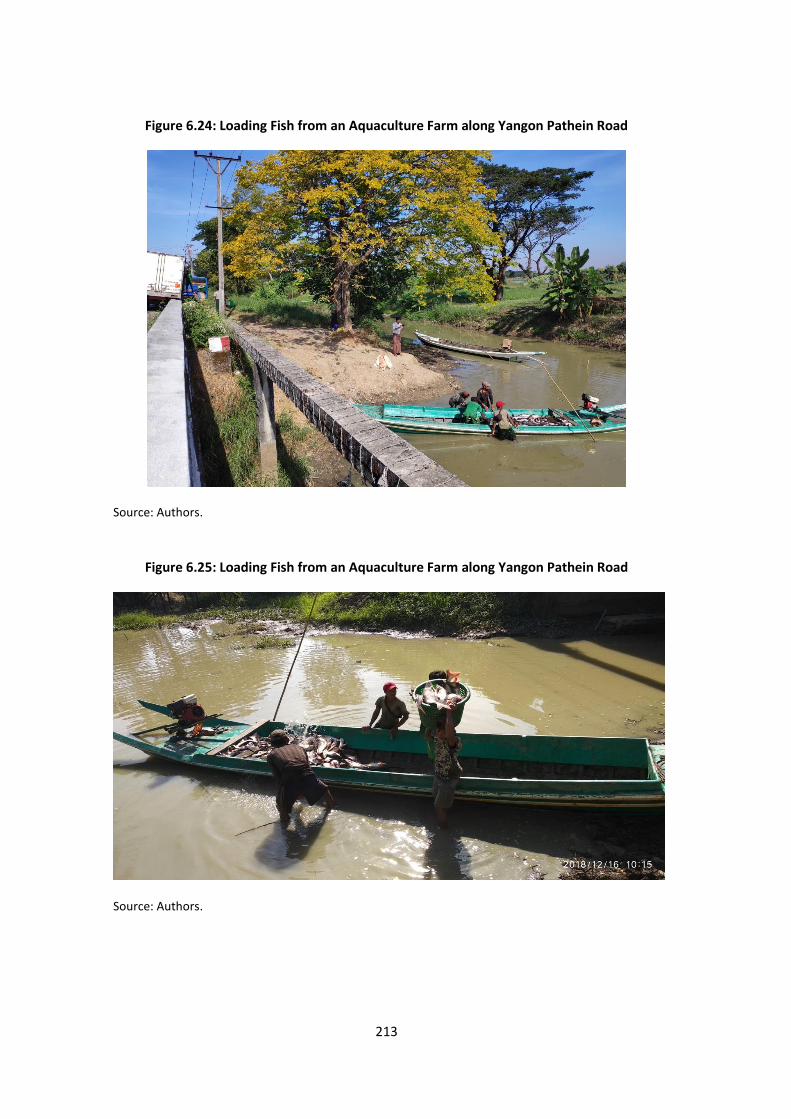
213
Figure 6.24: Loading Fish from an Aquaculture Farm along Yangon Pathein Road
Source: Authors.
Figure 6.25: Loading Fish from an Aquaculture Farm along Yangon Pathein Road
Source: Authors.
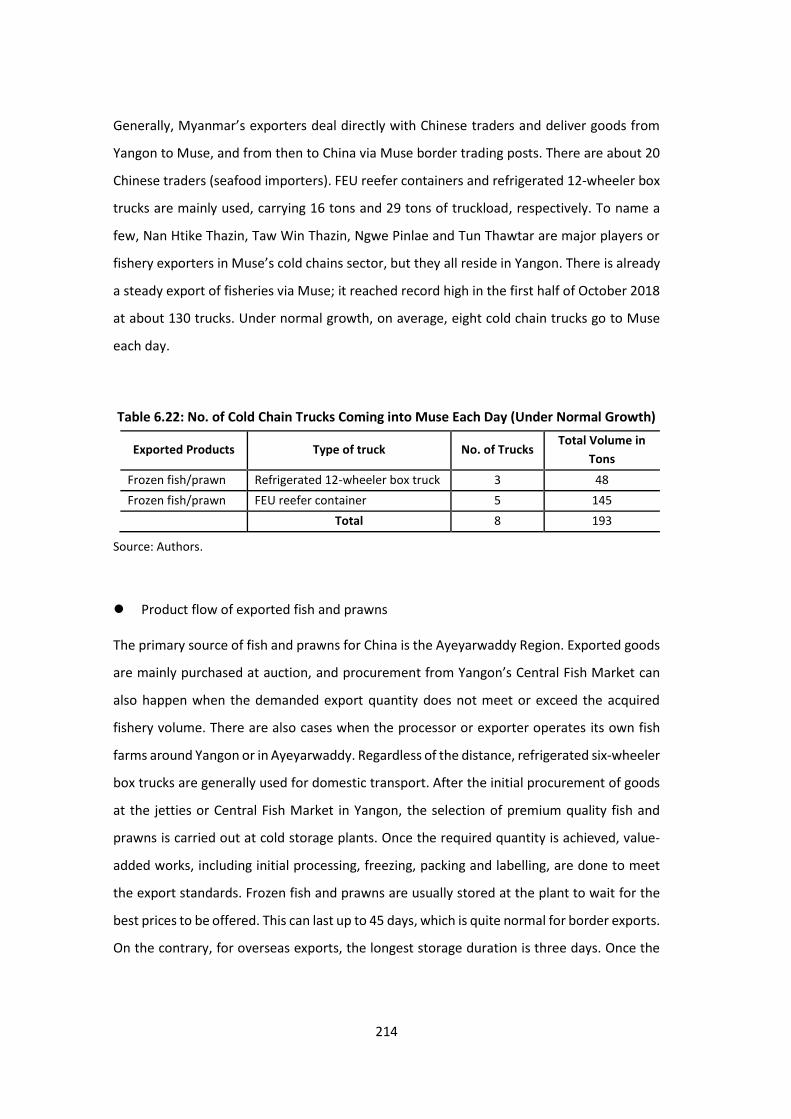
214
Generally, Myanmar’s exporters deal directly with Chinese traders and deliver goods from
Yangon to Muse, and from then to China via Muse border trading posts. There are about 20
Chinese traders (seafood importers). FEU reefer containers and refrigerated 12-wheeler box
trucks are mainly used, carrying 16 tons and 29 tons of truckload, respectively. To name a
few, Nan Htike Thazin, Taw Win Thazin, Ngwe Pinlae and Tun Thawtar are major players or
fishery exporters in Muse’s cold chains sector, but they all reside in Yangon. There is already
a steady export of fisheries via Muse; it reached record high in the first half of October 2018
at about 130 trucks. Under normal growth, on average, eight cold chain trucks go to Muse
each day.
Table 6.22: No. of Cold Chain Trucks Coming into Muse Each Day (Under Normal Growth)
Exported Products Type of truck No. of Trucks Total Volume in
Tons
Frozen fish/prawn Refrigerated 12-wheeler box truck 3 48
Frozen fish/prawn FEU reefer container 5 145
Total 8 193
Source: Authors.
⚫ Product flow of exported fish and prawns
The primary source of fish and prawns for China is the Ayeyarwaddy Region. Exported goods
are mainly purchased at auction, and procurement from Yangon’s Central Fish Market can
also happen when the demanded export quantity does not meet or exceed the acquired
fishery volume. There are also cases when the processor or exporter operates its own fish
farms around Yangon or in Ayeyarwaddy. Regardless of the distance, refrigerated six-wheeler
box trucks are generally used for domestic transport. After the initial procurement of goods
at the jetties or Central Fish Market in Yangon, the selection of premium quality fish and
prawns is carried out at cold storage plants. Once the required quantity is achieved, value-
added works, including initial processing, freezing, packing and labelling, are done to meet
the export standards. Frozen fish and prawns are usually stored at the plant to wait for the
best prices to be offered. This can last up to 45 days, which is quite normal for border exports.
On the contrary, for overseas exports, the longest storage duration is three days. Once the
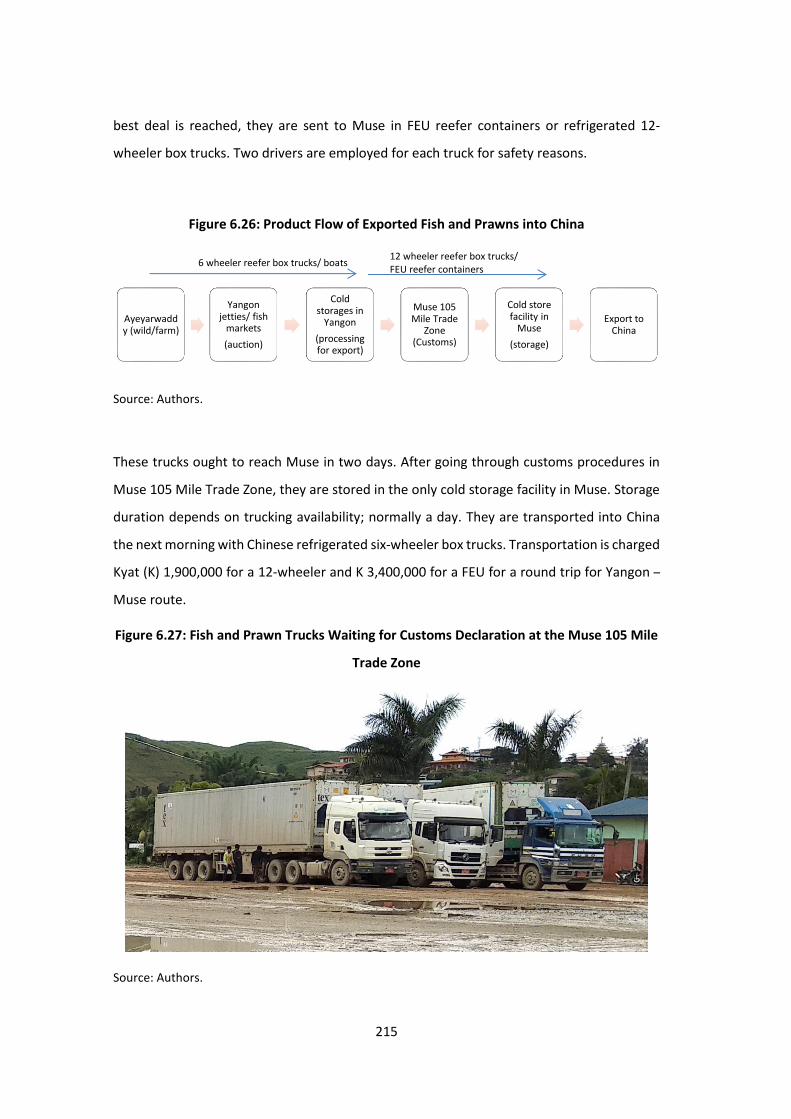
215
best deal is reached, they are sent to Muse in FEU reefer containers or refrigerated 12-
wheeler box trucks. Two drivers are employed for each truck for safety reasons.
Figure 6.26: Product Flow of Exported Fish and Prawns into China
Source: Authors.
These trucks ought to reach Muse in two days. After going through customs procedures in
Muse 105 Mile Trade Zone, they are stored in the only cold storage facility in Muse. Storage
duration depends on trucking availability; normally a day. They are transported into China
the next morning with Chinese refrigerated six-wheeler box trucks. Transportation is charged
Kyat (K) 1,900,000 for a 12-wheeler and K 3,400,000 for a FEU for a round trip for Yangon –
Muse route.
Figure 6.27: Fish and Prawn Trucks Waiting for Customs Declaration at the Muse 105 Mile
Trade Zone
Source: Authors.
Ayeyarwaddy (wild/farm)
Yangon jetties/ fish
markets
(auction)
Cold storages in
Yangon
(processing for export)
Muse 105 Mile Trade
Zone (Customs)
Cold store facility in
Muse
(storage)
Export to China
12 wheeler reefer box trucks/ FEU reefer containers
6 wheeler reefer box trucks/ boats

216
Figure 6.28: Reefer Trailers Found on the Mandalay – Muse Route
Source: Authors.
⚫ Cold storage facility in Muse
There is only one cold store facility in Muse, which is operated by National Prosperity Public
Company Limited. The facility has six storage chambers; one for beef and the rest for frozen
fish and prawn. It has a total capacity of 1,200 tons, and the temperature can be adjusted on
demand as low as -27°C. Goods can be stored for three days at K 20 per kg. After three days,
additional K 3 is added to the original price of K 20 and becomes K 23/kg for each day onwards.
Figure 6.29: National Prosperity's Cold Store Facility in Muse
Source: Authors.
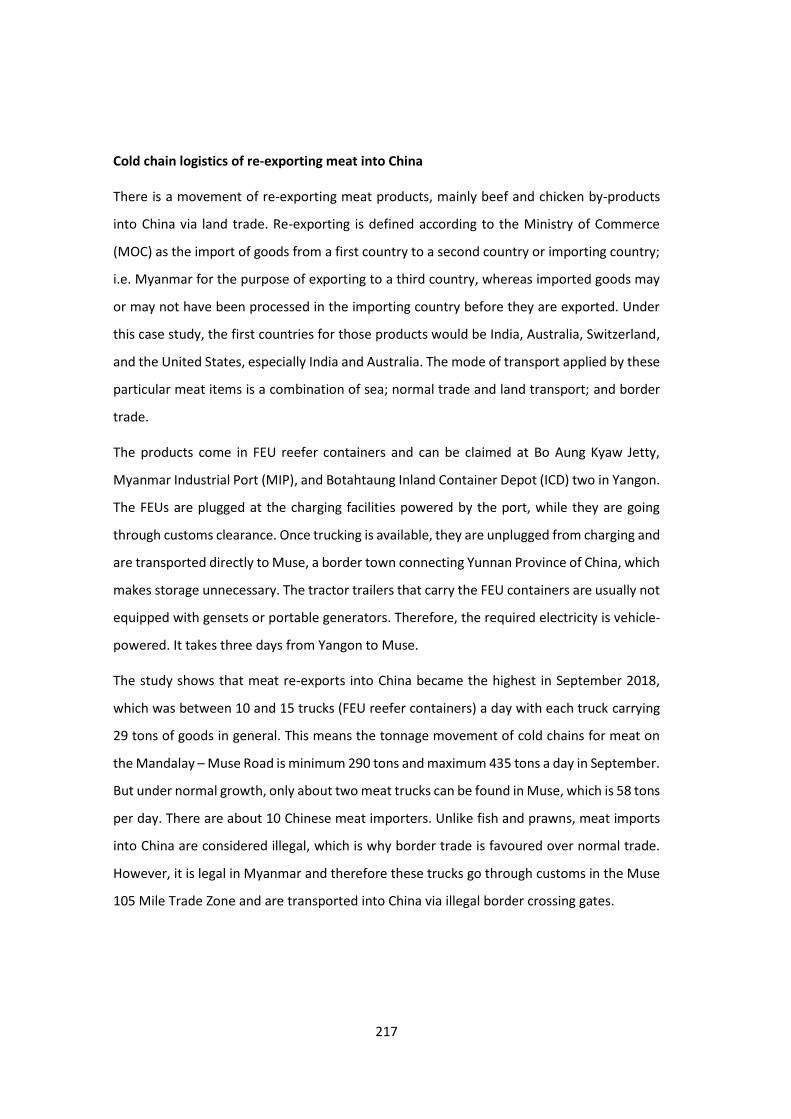
217
Cold chain logistics of re-exporting meat into China
There is a movement of re-exporting meat products, mainly beef and chicken by-products
into China via land trade. Re-exporting is defined according to the Ministry of Commerce
(MOC) as the import of goods from a first country to a second country or importing country;
i.e. Myanmar for the purpose of exporting to a third country, whereas imported goods may
or may not have been processed in the importing country before they are exported. Under
this case study, the first countries for those products would be India, Australia, Switzerland,
and the United States, especially India and Australia. The mode of transport applied by these
particular meat items is a combination of sea; normal trade and land transport; and border
trade.
The products come in FEU reefer containers and can be claimed at Bo Aung Kyaw Jetty,
Myanmar Industrial Port (MIP), and Botahtaung Inland Container Depot (ICD) two in Yangon.
The FEUs are plugged at the charging facilities powered by the port, while they are going
through customs clearance. Once trucking is available, they are unplugged from charging and
are transported directly to Muse, a border town connecting Yunnan Province of China, which
makes storage unnecessary. The tractor trailers that carry the FEU containers are usually not
equipped with gensets or portable generators. Therefore, the required electricity is vehicle-
powered. It takes three days from Yangon to Muse.
The study shows that meat re-exports into China became the highest in September 2018,
which was between 10 and 15 trucks (FEU reefer containers) a day with each truck carrying
29 tons of goods in general. This means the tonnage movement of cold chains for meat on
the Mandalay – Muse Road is minimum 290 tons and maximum 435 tons a day in September.
But under normal growth, only about two meat trucks can be found in Muse, which is 58 tons
per day. There are about 10 Chinese meat importers. Unlike fish and prawns, meat imports
into China are considered illegal, which is why border trade is favoured over normal trade.
However, it is legal in Myanmar and therefore these trucks go through customs in the Muse
105 Mile Trade Zone and are transported into China via illegal border crossing gates.
218
Figure 6.30: Product Flow of Re-export Meat Products
Source: Authors.
After the customs clearance as shown in Figure 6.30, meat is transloaded into Chinese
refrigerated trucks at Swam Saw (Myay Ni Kwin) Truck Compound, which is just beyond the
Man Wein Gate, one of the four main legal border crossing gates in Muse. Transportation
charges vary depending on the season and thus tonnage. Generally, the permitted truckload
for a semi-trailer is 48 tons in monsoon and 50.5 tons in summer. In the matter of re-export
meat transport, FEU reefer containers carry as much as 29 tons. Until September which is the
end of the rainy season, transportation cost for a FEU from Yangon jetties and ICDs to 105
Mile Trade Zone was K3,800,000. In this cost, excess tonnage charge of K400,000 is included.
This charge is dismissed in October and the total transportation charge becomes K3,400,000
throughout the year.
Figure 6.31: A SINO Reefer Trailer Found in Muse
Source: Authors.
Yangon jetties and ICDs (claim goods)
Muse 105 Mile Trade Zone (customs)
Swam Saw truck compound
(transshipment)
China (via illegal border crossing
gates)
FEU reefer containers
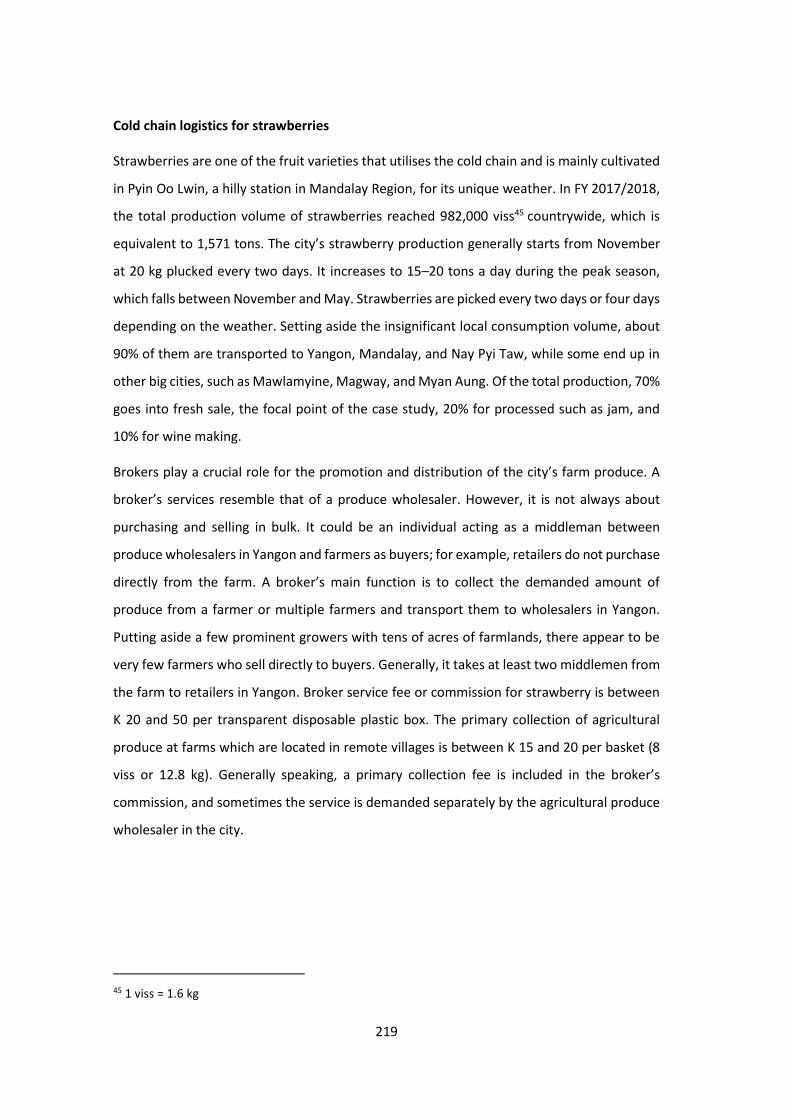
219
Cold chain logistics for strawberries
Strawberries are one of the fruit varieties that utilises the cold chain and is mainly cultivated
in Pyin Oo Lwin, a hilly station in Mandalay Region, for its unique weather. In FY 2017/2018,
the total production volume of strawberries reached 982,000 viss45 countrywide, which is
equivalent to 1,571 tons. The city’s strawberry production generally starts from November
at 20 kg plucked every two days. It increases to 15–20 tons a day during the peak season,
which falls between November and May. Strawberries are picked every two days or four days
depending on the weather. Setting aside the insignificant local consumption volume, about
90% of them are transported to Yangon, Mandalay, and Nay Pyi Taw, while some end up in
other big cities, such as Mawlamyine, Magway, and Myan Aung. Of the total production, 70%
goes into fresh sale, the focal point of the case study, 20% for processed such as jam, and
10% for wine making.
Brokers play a crucial role for the promotion and distribution of the city’s farm produce. A
broker’s services resemble that of a produce wholesaler. However, it is not always about
purchasing and selling in bulk. It could be an individual acting as a middleman between
produce wholesalers in Yangon and farmers as buyers; for example, retailers do not purchase
directly from the farm. A broker’s main function is to collect the demanded amount of
produce from a farmer or multiple farmers and transport them to wholesalers in Yangon.
Putting aside a few prominent growers with tens of acres of farmlands, there appear to be
very few farmers who sell directly to buyers. Generally, it takes at least two middlemen from
the farm to retailers in Yangon. Broker service fee or commission for strawberry is between
K 20 and 50 per transparent disposable plastic box. The primary collection of agricultural
produce at farms which are located in remote villages is between K 15 and 20 per basket (8
viss or 12.8 kg). Generally speaking, a primary collection fee is included in the broker’s
commission, and sometimes the service is demanded separately by the agricultural produce
wholesaler in the city.
45 1 viss = 1.6 kg

220
Figure 6.32: Product Flow of Strawberries
Source: Authors.
There are about 50 to 70 brokers in the city, while seemingly 10 of them hold the most market
share of approximately 70%. Of these 10 brokers, some are a combination of produce grower,
collector or broker, and wholesaler. This gives them a competitive advantage over individual
brokers and farmers as they get rid of middlemen and gain direct contact or bargaining power
with buyers. In-depth interviews were carried out with two out of those ten brokers and a
few small farms to cover the city’s agricultural supply chain while emphasizing on that of
strawberry. One of the respondents was a top primary produce wholesaler while the other
was a pioneer in the cold chain, and both operate tens of acres of farms.
One of the pioneers in the city’s cold chain sector who we interviewed has 20 acres of
farmland, seven for strawberry and the rest for other vegetables such as garlic chives, cilantro,
Chinese broccoli, mustard greens, coriander leaves, etc. Though he is a cold chain user with
required certificates, he still does not have direct contact with the buyer, in this case City
Mart, due to some constraints in the contract, e.g. ongoing supply of produce. Therefore, he
has to deliver produce to wholesalers at Thiri Mingalar Market first, from which City Mart’s
procurement department purchases the finest quality strawberries and produce and display
them on its shelves under its brand name. According to him, the city’s cold chain usage does
not exceed 30% of the total production volume; which has not been published by the
government and needs to be verified with ground checks.
Farm
(Pyin Oo Lwin)
Primary wholesaler/
produce collector
(Pyin Oo Lwin)
Produce wholesaler
(Yangon)
Final buyers (retailers,
exporters, etc.)
3ton reefer box trucks 8ton reefer box trucks/ Express buses/ General trucks (10 or 12 wheelers)
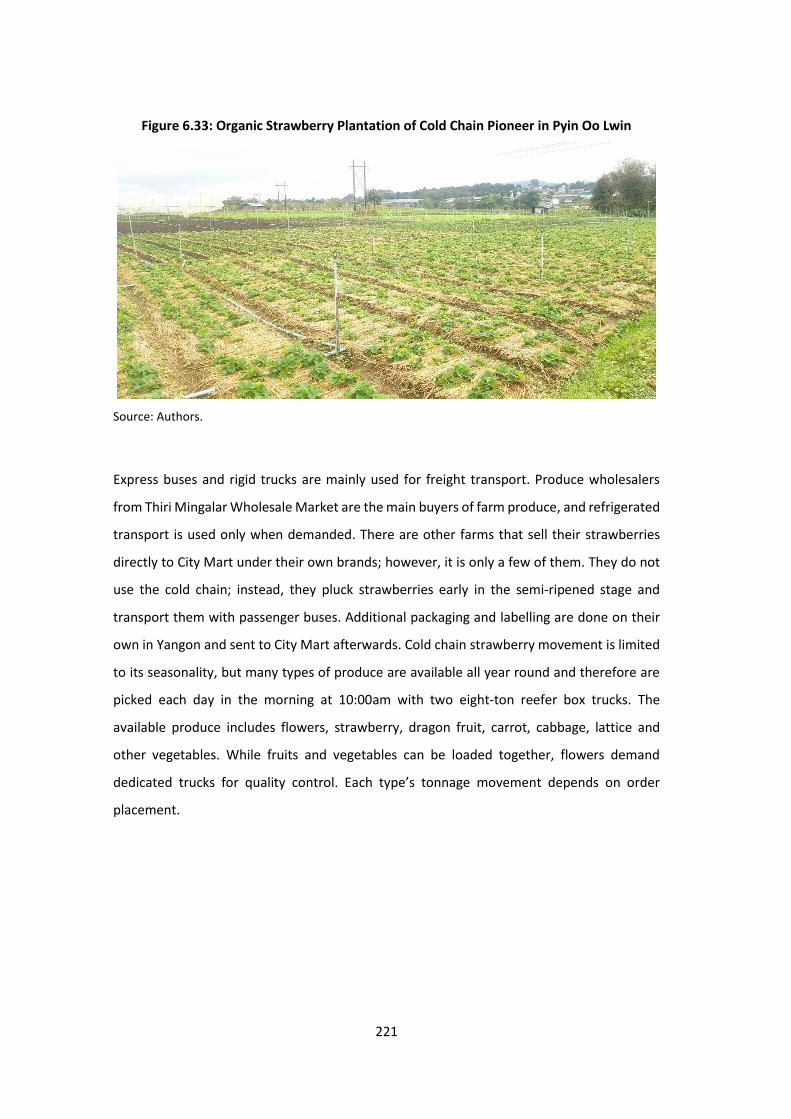
221
Figure 6.33: Organic Strawberry Plantation of Cold Chain Pioneer in Pyin Oo Lwin
Source: Authors.
Express buses and rigid trucks are mainly used for freight transport. Produce wholesalers
from Thiri Mingalar Wholesale Market are the main buyers of farm produce, and refrigerated
transport is used only when demanded. There are other farms that sell their strawberries
directly to City Mart under their own brands; however, it is only a few of them. They do not
use the cold chain; instead, they pluck strawberries early in the semi-ripened stage and
transport them with passenger buses. Additional packaging and labelling are done on their
own in Yangon and sent to City Mart afterwards. Cold chain strawberry movement is limited
to its seasonality, but many types of produce are available all year round and therefore are
picked each day in the morning at 10:00am with two eight-ton reefer box trucks. The
available produce includes flowers, strawberry, dragon fruit, carrot, cabbage, lattice and
other vegetables. While fruits and vegetables can be loaded together, flowers demand
dedicated trucks for quality control. Each type’s tonnage movement depends on order
placement.
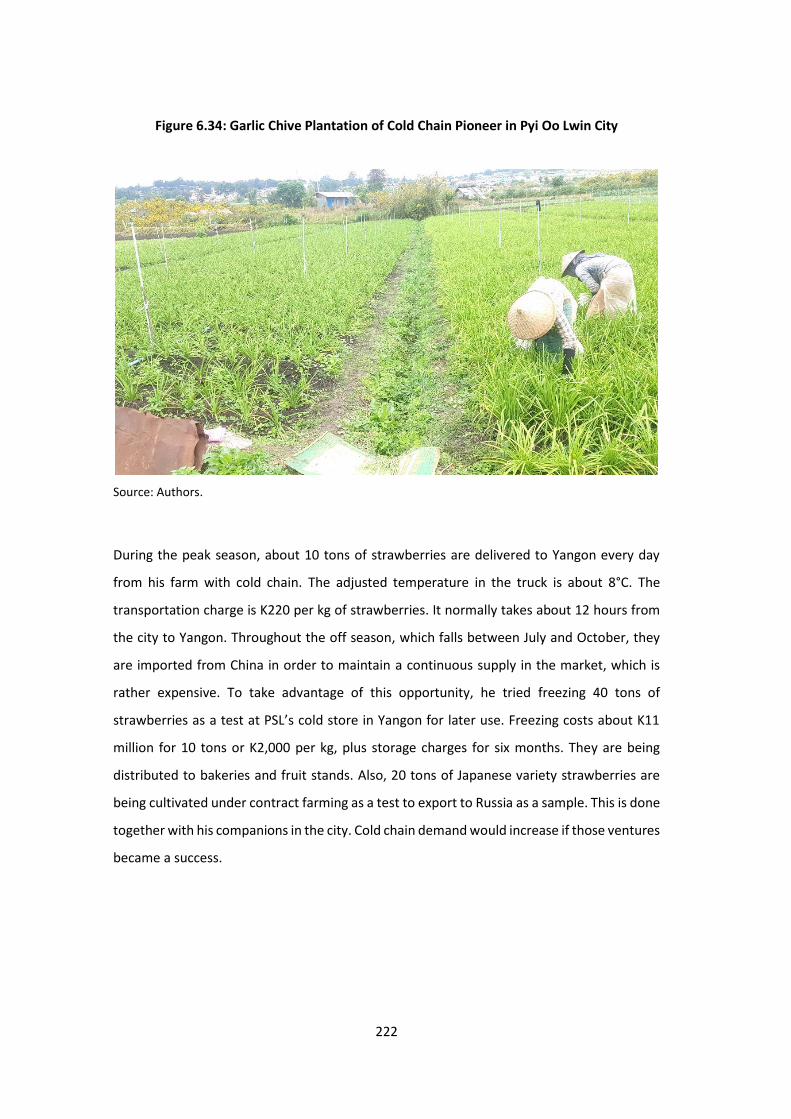
222
Figure 6.34: Garlic Chive Plantation of Cold Chain Pioneer in Pyi Oo Lwin City
Source: Authors.
During the peak season, about 10 tons of strawberries are delivered to Yangon every day
from his farm with cold chain. The adjusted temperature in the truck is about 8°C. The
transportation charge is K220 per kg of strawberries. It normally takes about 12 hours from
the city to Yangon. Throughout the off season, which falls between July and October, they
are imported from China in order to maintain a continuous supply in the market, which is
rather expensive. To take advantage of this opportunity, he tried freezing 40 tons of
strawberries as a test at PSL’s cold store in Yangon for later use. Freezing costs about K11
million for 10 tons or K2,000 per kg, plus storage charges for six months. They are being
distributed to bakeries and fruit stands. Also, 20 tons of Japanese variety strawberries are
being cultivated under contract farming as a test to export to Russia as a sample. This is done
together with his companions in the city. Cold chain demand would increase if those ventures
became a success.
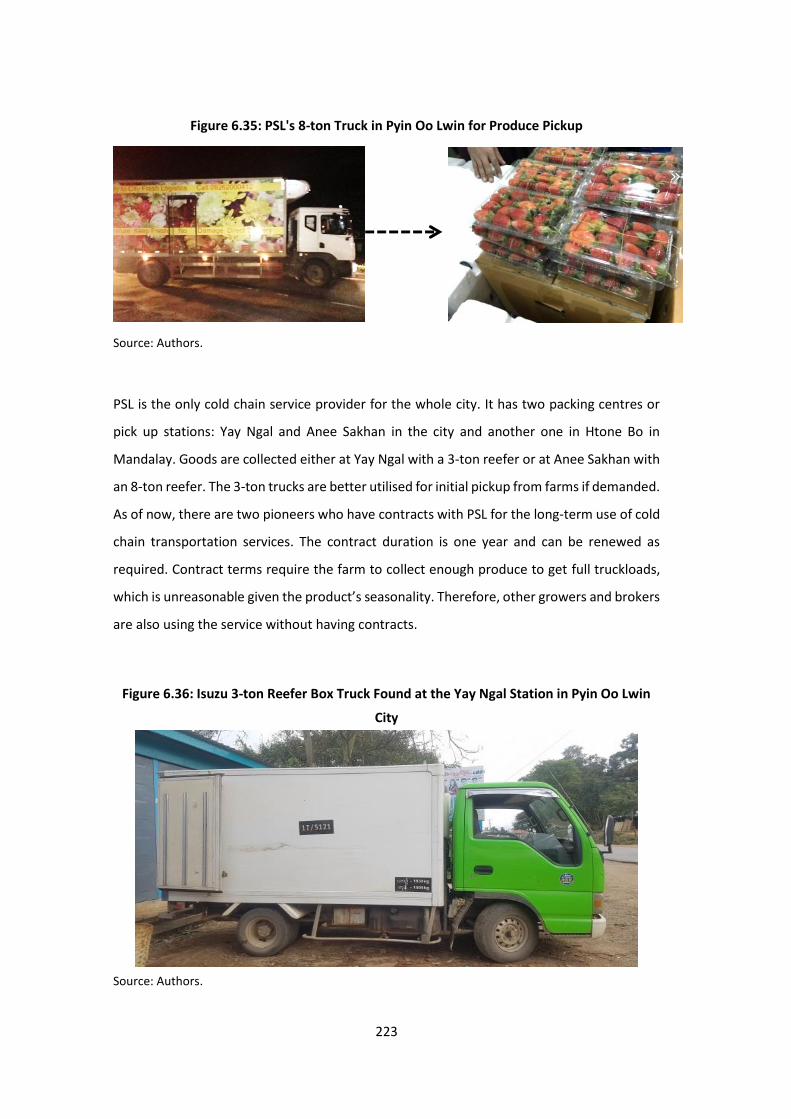
223
Figure 6.35: PSL's 8-ton Truck in Pyin Oo Lwin for Produce Pickup
Source: Authors.
PSL is the only cold chain service provider for the whole city. It has two packing centres or
pick up stations: Yay Ngal and Anee Sakhan in the city and another one in Htone Bo in
Mandalay. Goods are collected either at Yay Ngal with a 3-ton reefer or at Anee Sakhan with
an 8-ton reefer. The 3-ton trucks are better utilised for initial pickup from farms if demanded.
As of now, there are two pioneers who have contracts with PSL for the long-term use of cold
chain transportation services. The contract duration is one year and can be renewed as
required. Contract terms require the farm to collect enough produce to get full truckloads,
which is unreasonable given the product’s seasonality. Therefore, other growers and brokers
are also using the service without having contracts.
Figure 6.36: Isuzu 3-ton Reefer Box Truck Found at the Yay Ngal Station in Pyin Oo Lwin
City
Source: Authors.

224
Figure 6.37: PSL's Yay Ngal Truck Station in Pyin Oo Lwin City, Mandalay Region
Source: Authors.
Cold chain demand is also driven by bakeries, namely My Apple Cake Café in Yangon,
although its demand is quite small. Although the cold chain is not being used, another
cafeteria chain, namely Shwe Pazun, is also buying strawberries and, therefore, could
become a potential user of the cold chain. Its business nature requires a considerable volume
of strawberries as a crucial supply, both raw and processed. Therefore, there is a regular pick
up of strawberries at the wholesaler; one of the respondents, in the city. Every other day
during the peak season, Shwe Pazun’s own light truck loaded with moving baskets would
come and get strawberries, whereas each basket can be filled with 8kg strawberries. From
this wholesaler, between 2,500 baskets (32 tons) and 3,000 baskets (38.4 tons) of
strawberries are delivered to Yangon and other big cities every day. It takes three days for
strawberries to reach Yangon: one night at farms; one night at the wholesaler for primary
packing; and one night for the trip to Yangon.
Apart from those, more than 70% of strawberry transport is through trucks and mostly
express buses: Mandalar Min, Tat Lan, Shwe Sin Sakyar and Elite, just to name a few. They
are all located at the bus terminal Myo Thit Padathar. Strawberries are first put into the
transparent disposable plastic box and then into the corrugated carton that weighs about
10kg. Forty plastic boxes can be placed into the carton. The transportation charges are mostly
paid by buyers and they vary depending on the destination; K2,000 per carton from Myo Thit
Padathar to Aung Mingalar Bus Terminal and K2,500 to Aung San Bus Terminal.
Unsurprisingly, refrigerated transport is more costly at K5,000, which is one of the major

225
factors hindering the growth of the cold chain. Initial dry transport from the farm to the city’s
bus station is K3,000 with mini-truck (Hijet), up to 15 cartons of strawberries can be loaded.
According to a spokesperson from the MOC, there is a plan for the development of value-
added processing zone or industrial zone in Pyin Oo Lwin, Mandalay Region for agricultural
products. In the new zone, cold storages will be constructed for fresh produce such as fruits,
flowers and vegetables for export purpose. Once completed, cold chain demand of the city
and its surrounding areas would tremendously go up.46
Cold chain logistics for processed food
Myanmar C.P. Livestock Company or MCPL was founded in 1997 by the Charoen Pokphand
Group (CP), a conglomerate based in Thailand. It is a pioneer as well as a leader in livestock
feed, farm, and food production and distribution in Myanmar. Its breeder farms are located
in Bago, Ye’ Mon, Thar Yar Gone, Inta Gaw, and Sint Kine, while hatcheries are based in
Yangon and Mandalay. It is also a manufacturer of animal health products, such as vitamins,
vaccines, antibiotics, disinfectant, injections, and other miscellaneous products. MCPL is
marketing all its businesses in two distinct ways; one is the B2B approach, and the other is
the B2C approach. Under B2B, it deals directly with restaurants, hotels, bakery food services,
and conventional and modern retail markets. As for the B2C approach, it is running owned
CP outlets, called CP Freshmart. CP Five Star food stations and uncooked fresh chicken and
processed food stores are included in this. At present, it is operating 235 outlets across
Myanmar.47
MCPL has one main processing plant and four slaughtering factories. Live birds are first
transported with 3-ton general trucks from its farms to the four factories in Yangon for
slaughtering. They are also sold to wet markets in Yangon. The production capacity of these
four factories is 8.8 tons per day. Slaughtered chicken is put into cold boxes and sent to the
processing plant with 3-ton box trucks. From the processing plant, meat and processed foods,
such as sausages (European and Chinese style), meatballs, and soft bones, are produced. The
46 Myanmar Alinn (2019).
47 Wai (2016).
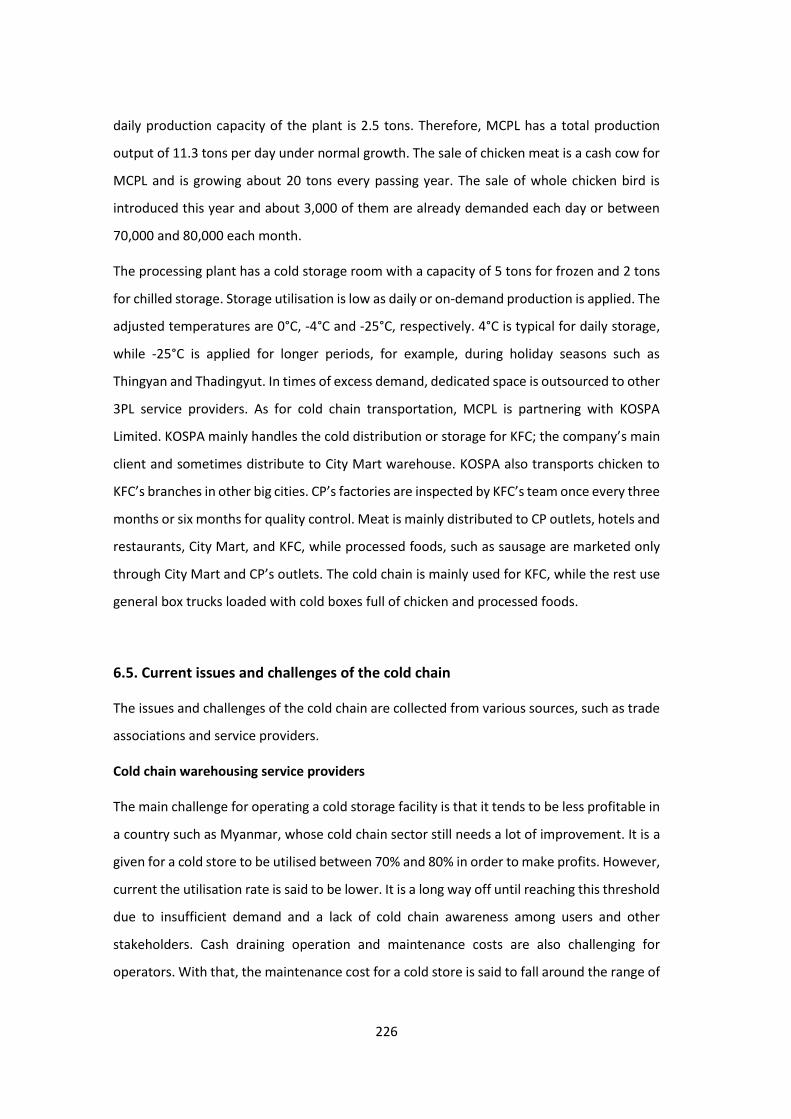
226
daily production capacity of the plant is 2.5 tons. Therefore, MCPL has a total production
output of 11.3 tons per day under normal growth. The sale of chicken meat is a cash cow for
MCPL and is growing about 20 tons every passing year. The sale of whole chicken bird is
introduced this year and about 3,000 of them are already demanded each day or between
70,000 and 80,000 each month.
The processing plant has a cold storage room with a capacity of 5 tons for frozen and 2 tons
for chilled storage. Storage utilisation is low as daily or on-demand production is applied. The
adjusted temperatures are 0°C, -4°C and -25°C, respectively. 4°C is typical for daily storage,
while -25°C is applied for longer periods, for example, during holiday seasons such as
Thingyan and Thadingyut. In times of excess demand, dedicated space is outsourced to other
3PL service providers. As for cold chain transportation, MCPL is partnering with KOSPA
Limited. KOSPA mainly handles the cold distribution or storage for KFC; the company’s main
client and sometimes distribute to City Mart warehouse. KOSPA also transports chicken to
KFC’s branches in other big cities. CP’s factories are inspected by KFC’s team once every three
months or six months for quality control. Meat is mainly distributed to CP outlets, hotels and
restaurants, City Mart, and KFC, while processed foods, such as sausage are marketed only
through City Mart and CP’s outlets. The cold chain is mainly used for KFC, while the rest use
general box trucks loaded with cold boxes full of chicken and processed foods.
6.5. Current issues and challenges of the cold chain
The issues and challenges of the cold chain are collected from various sources, such as trade
associations and service providers.
Cold chain warehousing service providers
The main challenge for operating a cold storage facility is that it tends to be less profitable in
a country such as Myanmar, whose cold chain sector still needs a lot of improvement. It is a
given for a cold store to be utilised between 70% and 80% in order to make profits. However,
current the utilisation rate is said to be lower. It is a long way off until reaching this threshold
due to insufficient demand and a lack of cold chain awareness among users and other
stakeholders. Cash draining operation and maintenance costs are also challenging for
operators. With that, the maintenance cost for a cold store is said to fall around the range of

227
K7,000,000 on average. Additionally, current warehouse designs in Myanmar are based on
the design layout of countries with an already developed cold chain sector. Their warehouse
capacities are usually massive. But, the fact that Myanmar’s cold chain sector is still in its
infancy cannot be overlooked. Therefore, in the future, warehouse designs should be
developed in line with the local market size and its demand.
Cold chain transportation service providers48
With regard to cold chain transportation, electricity or power supply is the major hindrance,
particularly for trucks that are not equipped with generators. This is more important for
highway trucking as running the chilling system of a reefer container with a vehicle’s power
supply is not sustainable. Consequently, cold chain trucks have to charge electricity at every
possible stop, such as refill or truck station along the highway. However, there is not a single
station solely designated for heavy-duty trucks en route to the destination, let alone the
proper charging facilities for the cold chain. On the other hand, trucks with generators are
efficient and convenient, yet they demand a large sum of money compared with general
trucks. There appear to be no more than ten tractor trailers with portable generators in the
market.
As of now, most tractor trailers destined for border trade areas are carrying reefer containers
with no plug on. To cope with this, they drive straight to the border point while keeping a
countdown before goods get damaged. For example, reefer containers loaded with frozen
goods are given the required temperature just before the take-off with which the freezing of
goods might last possibly another eight hours before it starts wearing off. It takes three days
from Yangon to Muse, a border town with China. Therefore, the reefer containers have to be
charged at Mandalay and there will be no more charging en route to Muse. Regardless, this
seems not a good solution yet. If the establishment of charging facilities is expensive, another
way out for this issue is by having a faster route towards the destination so that shipments
reach the end point in the designated time, subsequently eliminating all possible cargo
damages caused by delays. A faster route means making the Yangon – Mandalay Highway
Road accessible for cold chain trucks. This is one of the major factors that need more
48 Interview to MIFFA and MCTA.
228
deliberate considerations from the authorities for the development of the cold chain. In
addition, for infrastructure, the expansion of highway roads should go together with the
expansion of bridges. Truck weight scales in all weight stations should also be uniform, as the
current weight scales are found to indicate different outputs.
Cold chain users49
Cold chain users include all businesses from cultivators to traders. A lack of user awareness
is still the main issue for cold chain development. Myanmar is also still behind its regional
peers in terms of technical knowhow. Therefore, awareness raising programmes should be
organised for all related users, and it is not just traders who ask the most of cold chain
demand but also reach till the most basic level of the supply chain, such as growers. Even the
most basic understanding of the cold chain, such as the required temperature adjustments
for different products, should be fully aware by truck drivers. There appear to be very few
users or more precisely traders that demand the utilisation of the cold chain for the whole
supply chain till export. The undeniable fact is that they gain more profit or better prices as
their products have longer shelf life, better quality, and become value-added.
Operation cost is the main reason behind its unpopularity among users. The cold chain cost
incurred along the supply chain makes the final market price be less attractive for consumers.
In the same sense, higher cost brings higher benefits, such as fresher and longer shelf life,
and, as a result, healthier product choices. The huge price gap between products that utilise
cold chain and traditional logistics can be lower by developing the whole sector. This means
being able to use cold chain services more conveniently for products that need the cold chain.
For example, in produce, non-hard shell fruits require the cold chain for better quality at the
time they reach final consumers. Consumers should be aware of the many benefits of
consuming healthier products and place quality above a few more dollars. Another surprising
fact only found in Myanmar is that consumers pay the same price for produce regardless of
how or what sort of logistics they had to use. This discourages users or sellers to utilise the
cold chain. For this, awareness-raising campaigns for end consumers should be arranged.
49 Interview to Myanmar Fruit, Flower and Vegetables Producer and Exporter Association (MFVP).
229
To clarify a more convenient use of the cold chain, a better example would be a freight
consolidation service. The current cold chain sector is not yet developed, and the result is
that users or pioneers have to use it at a high cost. In the agricultural industry, fresh produce
has many possibilities to use the cold chain in the future, and it is found that the vast majority
of cold chain utilisation for transport is only one way. But, users have to pay double for a
round trip. Also, as there are not many choices among service providers, they have to make
use of what is available at the doorstep even at a higher cost. Therefore, widespread use of
the cold chain would be possible if many 3PL cold chain service providers were to arise and
if the supporting basic infrastructure and facilities, such as electricity, were improved. For
instance, growers should be able to reach the main cold storage facility more easily; the
facility should even be placed at the farm. Yet, farms and the facility are too far from each
other. On top of that, connecting road conditions are severe causing unnecessary delays.
Human resources and others50
The lack of skilled drivers and proper insurance for highly damageable goods are other
challenges that should be addressed. Heavy-duty truck drivers should be properly trained for
different types of vehicles. Only after that should they be granted driving certificates for each
preferred truck, and with that the issuance of a driving licence. This has already been
practised in other developed countries. In Myanmar, drivers holding red licences are all able
to operate any type of commercial vehicles available, be they light duty or heavy duty.
Therefore, what needs to be done immediately is to first provide intensive training for the
operation of heavy-duty trucks. This will allow Myanmar drivers to be certified when
operating in international borders. Their working hours should also be standardised to make
them get used to international standards. In addition, there should be more skilled
professionals for warehouse management and operation to provide services that rival the
international standards demanded by the international audience. Doing so will prepare
Myanmar for any upcoming cross-border agreements in terms of human resources.
50 Interview to MIFFA and MCTA.
230
6.6. Government policy
In the matter of the cold chain, no news about the government policies is heard. Existing
rules and regulations relevant to the logistics industry are cargo restrictions, maximum
truckload limitations, and container truck curfews. Curfews are not applicable to cold chain
trucks as they can operate 24 hours, but they have to propose the operating routes to the
department concerned before transport. However, at the operational level for the cold chain,
there are certain standards that need to be met by cold storages or processing plants. The
standard is based on “the Drafted Regional Guidelines on Cold Chain Management of Fish
and Fishery Products in ASEAN Region”, developed by the Marine Fisheries Research
Department (MFRD) Programmes51. The guidelines are for ASEAN and SEAFDEC member
countries and are in line with Myanmar Regulation promulgated by the DOF.
According to the guidelines adopted by the MFF, fishery products have to be handled at a
temperature below -4°C from post-harvest handling to receiving and processing at
processing plants. This temperature is maintained by placing fish and crushed ice at the ratio
of 1:1. Besides, clean water has to be used both for cleaning and ice-making. At the plant for
packing and labelling, the room temperature is set at about 10°C, and after packing, the cold
storage temperature is about -20°C or -2°C. A first-in-first-out system has to be used for
product movement. As for transport and distribution, the controlled temperature is -18°C in
reefer containers that are destined for the Yangon International Port for normal trade. But
for border trade, frozen products are carried by reefer container at -18°C, chilled products
by carrier boat with crushed ice, and some products with insulated box trucks. For local
consumption, cold boxes and crushed ice are mainly used in a ratio of 1:1. They are
transported by truck and passenger buses to other regions from Yangon.52 Regardless of the
guidelines, there is weak compliance from local businesses for many reasons, such as a lack
of facilities, electricity and containers with no power supply from factory to port, quality and
safety awareness, and training.
51 SEAFDEC (2018).
52 Interview to Myanmar Fisheries Federation.

231
6.7. The mid-term prospect of the cold chain
In the private sector, local logistics-related businesses have voiced themselves regarding the
mid-term prospect of Myanmar’s cold chain sector. According to them, some positive
changes to the cold chain sector will be visible in the next five years if the following factors
are improved:
1. If transportation infrastructure is improved and long-haul cold chain transport
becomes more in demand compared with urban distribution;
2. If much FDI comes to the sector;
3. If the government lifts some export/import restrictions on products that require cold
chain and subsequently increased foreign trade; at present, products such as chicken
and other foodstuffs and vegetables are restricted for import;
4. If the demand of refrigerated storage increases in line with trade growth;
5. If the consumption of foodstuffs from supermarkets becomes widespread;
6. If the number of hotels, restaurants, modern supermarkets, and minimarts increases;
and last but not least
7. If knowledge-sharing workshops, training, and awareness-raising campaigns about
cold chain usage and benefits are delivered to drivers and other stakeholders from the
government level.
On closer inspection, the cold chain sector can potentially be developed in three distinct
ways: boosting foreign trade, especially exports; re-exporting; and transit trade. These would
just be pure optimism unless prerequisite actions are taken. Of the three approaches, re-
exporting and transit trade have some contradicting effects on the sector. While re-exporting
would potentially demand cold chain warehousing services, transit trade might require more
transportation services. Besides, re-exporting shows more promise in the short term than
transit and brings along more competition together with the opportunities arising from
regional transport agreements.
232
Foreign trade
Cold chain demand will most likely be driven in the future by the trade of fresh perishables,
such as fruit and vegetables, fishery products, pharmaceuticals, and seeds. The government
has also taken the necessary steps in terms of rules, regulations, and policies to invite local
and foreign investments for trade development, i.e. the National Export Strategy (NES)
launched in 2015. With the current implementation of the NES, the development of foreign
trade, specifically exports, is reassuring. In the strategy are seven priority sectors and four
cross-sector focuses for development. The seven sectors include fisheries, textiles and
garments, forestry products, beans and pulses and oilseeds, rice, rubber, and tourism. The
four cross-sectors include access to finance, quality management, trade facilitation and
logistics, and trade information and promotion.
Five more sectors were proposed in September 2018 and are still in the negotiation stage.
Among them are two potential sectors; fruits and vegetables, and value-added agricultural
food products that are likely to demand the cold chain.53 Following the NES, the Myanmar
Investment Commission also announced the 10 prioritised areas in June 2017 for investments
as an additional enforcement, and in that list are export promotion sector and logistics
industries. Furthermore, the import substitution sector; agriculture and its related services,
and the value-added production of agricultural products; livestock production, breeding, and
production of fishery products; and the healthcare industry are also included.54 Half of the
lists are the sectors that are contributing to the growth of the cold chain.
Re-exporting
To recap, re-exporting is defined according to the MOC as the import of goods from a first
country to a second country or importing country, i.e. Myanmar for the purpose of exporting
to a third country, whereas imported goods may or may not have been processed in the
importing country before they are re-exported. Re-exporting was first initiated in 2015 with
the approval from the MOC. There are 17 items to date and they are sugar, betel nuts, and
oil, which were permitted in 2015 and the rest such as tyres, sesame (white and black), dried
53 Global New Light of Myanmar (2018).
54 Interview to Myanmar Investment Commission.
233
chilli, groundnut, cotton, soy beans, textiles, fresh fruit, electronic materials, cosmetics,
juices and other groceries, clothes, edible oil and garlic, which were later approved in late
June 2016. Sugar re-exporting reached a record high in 2016, comprising more than 3 million
tons. When China, the major buyer, stopped importing sugar from Myanmar in 2017 in order
to protect its local industries, re-exports of sugar and diesel were also suspended
temporarily.55
According to the specification published by the MOC, there must be a warehouse in place to
store re-export products in order to get the re-export license. Re-exporting has been
practised substantially with China: sugar buyer, Thailand: sugar exporter, and Indonesia:
betel nut exporter, India: betel nut buyer. However, these items only require general
warehouses. Meanwhile, in the newly added items are some perishables that will likely
demand cold chain warehouses in the future, such as dried chilli and fresh fruit. Products
such as dried chilli, fresh fruit, electronics, computer and laptop placed in a dirt-free air-
conditioned chamber, and cosmetics have been found to use the cold chain, although not for
re-exports. If the demand for these items were to increase, demand for cold chain
warehouses would likely increase as well.
Transit trade
When it comes to transit trade, Singapore has been a very good example, benefiting from its
position as a focal point of contact for the East and West. Myanmar also has the potential to
be just as beneficial as Singapore, not entirely through the sea but also focusing on land
transport. This conclusion is reached due to the fact that Myanmar is a major part of many
renowned connectivity projects in Asia, such as the Greater Mekong Sub-region Cross Border
Transport Agreement (GMS CBTA), GMS Economic Corridors, the ASEAN Free Trade Area
(AFTA), India’s Kaladan Multi-Modal Transit Transport Project (KMTT) and India–Myanmar–
Thailand Trilateral Highway Project, and China’s One Belt One Road Initiative (OBOR). Despite
the delays, Myanmar still has a part to play as a transit destination if they are accomplished.
In 2017, the total regional trade value reached US$165,828 million as described in Table 6.23.
The contribution of land transport is thought to be about 20% of the total value compared
55 Wai (2018).

234
with sea transport. In this, Myanmar currently has some involvement as a land transit point
for its neighbours’ trade. Thailand–China trade is done through the Myanmar Tachilek
border point. As for India–China trade, there appear to be both land and multimodal
transports. Land transport is via the Muse (China border) – Mandalay – Tamu (India border)
route, which is part of the GMS Eastern Corridor. A sea route from India to Myanmar i.e. part
of KMTT project would add to this land route to make it multimodal. There is also the India –
Myanmar – Thailand Trilateral Highway Project, which is expected to be accomplished in the
next two years. If this happens, India–Thailand trade has the most possibility with Myanmar
acting as the main transit point.56
Table 6.23: Total Regional Trade in 2017 (Potential of Transit Trade Via Myanmar)
Sr. Description Trade Value (US$ Million)
1 Thailand Export to China 21,426.20
2 China Export to Thailand 32,547.08
3 Thailand Export to India 4,700.59
4 India Export to Thailand 3,653.83
5 Thailand Export to Bangladesh 909.48
6 Bangladesh Export to Thailand 44.83
7 India Export to China 13,333.53
8 China Export to India 76,380.70
9 Viet Nam Export to India 5,018.55
10 India Export to Viet Nam 7,813.08
Total Trade 165,827.86
Sources: MOC (2017), Central Board of Indirect Taxes and Customs (2019), and the Customs
Department (2015).
Apart from these, the vast majority of regional trade is being conducted via sea. However,
when the Trilateral Highway is completed, it would connect with the GMS’s East–West
Economic Corridor (EWEC) that starts from Da Nang, Viet Nam, passes by the Lao PDR and
Thailand, and finally ends in Mawlamyine, Myanmar, in the Myanmar section. However, the
new Myanmar section of the EWEC will be from Myawaddy to Yangon and applied under the
CBTA Agreement in the Myawaddy border. But if it becomes active just like its counterparts,
it would form an easier trade link between Viet Nam and India. In the same way, Bangladesh
56 The Hindu Business Line (2018).

235
– Thailand trade can be conducted through Myanmar via land transit or even port to port.
The only issue is whether Myanmar can improve the required infrastructure in time for the
activation of those agreements. Depending on that, most of the transit fees and other
appealing benefits from the 20% of regional trade will become Myanmar’s.
Goods in transit normally do not require the transhipment of goods or containers; this is
more so if the agreements such as CBTA and AFTA become up and running. The use of the
cold chain is more widespread for regional market leaders, such as Thailand and Viet Nam,
and other prominent trade partners, such as India and China. The agreement allows the free
flow of goods by removing national borders. This includes all tradable goods, so it will include
the items that require the cold chain as well. However, making use of the CBTA pass is likely
to leave warehousing along the border vacant, and the use of cold chain trucks that meet
regional standards set and adhere by all traded partners will become more in demand.
When the agreement becomes active, Thailand’s trucks will pass the borders and come down
to Yangon Thilawa, while Myanmar’s trucks will be able to go until Bangkok. This brings many
benefits, such as trade growth and the resulting cold chain demand. The utilisation of assets,
such as trucks and warehouses, will become higher. However, considering the current
capacity of Myanmar, it is not nearly enough in terms of both soft assets; skilled drivers and
hard assets; and trucks, warehouses, and other tangible assets. According to a spokesperson
from MCTA, Thailand has about 15 times the required assets, including reefer containers.
There will be a downfall for the logistics industry if the same product quality cannot be
guaranteed stemming from insufficient assets and human resources.
If this continues, the potential logistics market share will be seized by a more powerful
counterpart. Myanmar also has an issue with trade deficits, and it is nearly certain that more
imports and therefore the utilisation of foreign assets is more likely rather that of local assets.
This is a loss for the local industry and may cost many potential users. If the local industry
cannot bring forth the demanded quality, there will be a demand shortage for local logistics
services. If there is a demand shortage, local service providers will not be able to fund
themselves in enhancing their capacities to provide better quality. If they cannot provide the
same regional quality standard, the market share will slip away to other regional peers. This
236
forms an endless loop, and to stop it during many uncertainties and possibilities,
infrastructure must come first.57
But if Myanmar can compete with regard to skills and assets, the table will turn, and
Myanmar will benefit the most from transit just as Singapore. The bet is on how fast
Myanmar can develop the current logistics capacities. It is the fresh perishables that have the
most potential to use the cold chain if they acquire access to the vast regional market or
consumer base more easily. To accommodate the demand, more technical training to cold
chain suppliers, most needed from drivers, should be provided. There is also another way to
solve this issue, i.e. the construction of transhipping, material handling and cross-docking
facilities for transit trucks at border points along the corridor. This would reduce the negative
impact on the industry given that no changes were made to the current logistics capacities.
The former solution seems more viable, and if implemented, the development of Myanmar’s
cold chain sector would be unquestionable when the time came.
6.8. Conclusion
In conclusion, there are resources in Myanmar to fulfil current cold chain needs with 88,148
tons of storage capacity, which only represents the fishery sector and a couple of top third-
party service businesses, and more than 7,000 refrigerated trucks to date. But, they are all
underutilised even though the total volume of current demand and potential demand is
about 15 million tons a year. So far, we have seen the market situation in the study. An
example is the use of refrigerated trucks without running chilling systems, not using
generators for continuous chilling, or warehouses with less than 80% of utilisation. When
tracing back to the source of this issue, it is found that what is lacking still are intermediaries
to make the market realise the true usefulness of the cold chain. Intermediaries mean the
emergence of commodity markets in business hubs, such as Yangon, Mandalay, and Nay Pyi
Taw. The government should support the development of commodity markets, such as the
ongoing Danyingone Wholesale Market, the conceptual plan of Mandalay and Pyin Oo Lwin
wholesale market and value-added processing zone. If these facilities enforce the use of the
authentic cold chain, then the market would follow its lead. Other necessities, such as the
57 Interview to Myanmar Food Processors & Exporters Association.
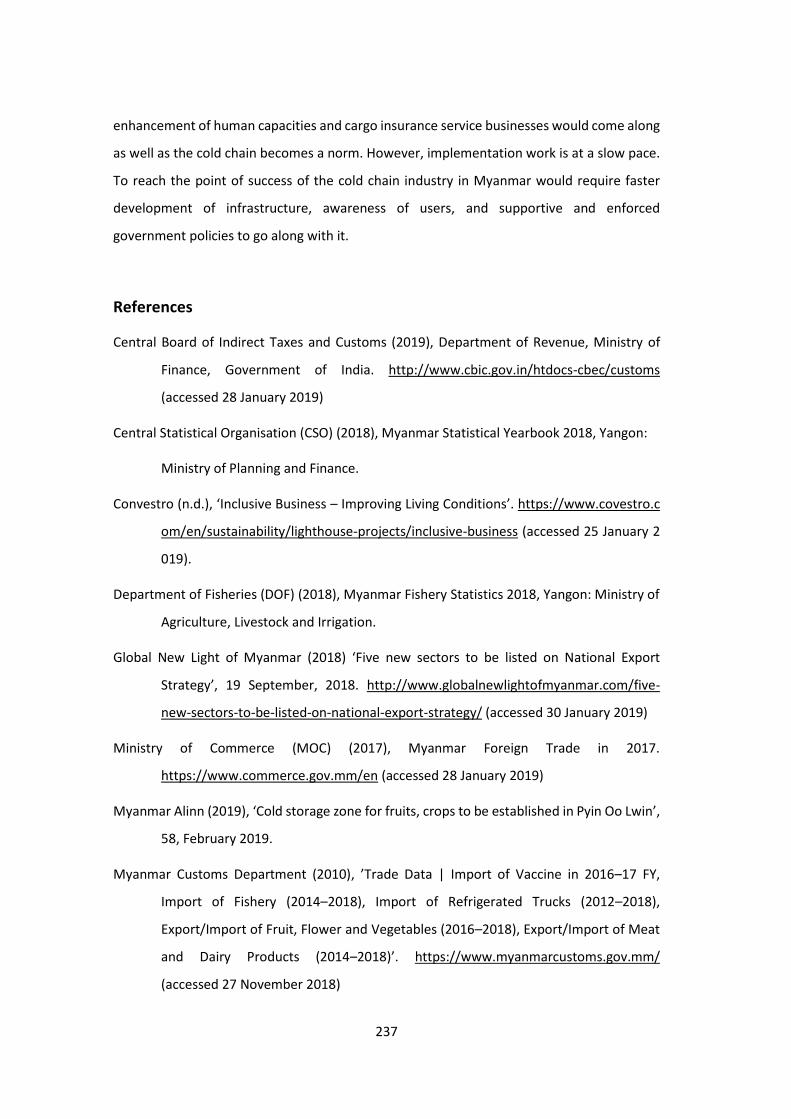
237
enhancement of human capacities and cargo insurance service businesses would come along
as well as the cold chain becomes a norm. However, implementation work is at a slow pace.
To reach the point of success of the cold chain industry in Myanmar would require faster
development of infrastructure, awareness of users, and supportive and enforced
government policies to go along with it.
References
Central Board of Indirect Taxes and Customs (2019), Department of Revenue, Ministry of
Finance, Government of India. http://www.cbic.gov.in/htdocs-cbec/customs
(accessed 28 January 2019)
Central Statistical Organisation (CSO) (2018), Myanmar Statistical Yearbook 2018, Yangon:
Ministry of Planning and Finance.
Convestro (n.d.), ‘Inclusive Business – Improving Living Conditions’. https://www.covestro.c
om/en/sustainability/lighthouse-projects/inclusive-business (accessed 25 January 2
019).
Department of Fisheries (DOF) (2018), Myanmar Fishery Statistics 2018, Yangon: Ministry of
Agriculture, Livestock and Irrigation.
Global New Light of Myanmar (2018) ‘Five new sectors to be listed on National Export
Strategy’, 19 September, 2018. http://www.globalnewlightofmyanmar.com/five-
new-sectors-to-be-listed-on-national-export-strategy/ (accessed 30 January 2019)
Ministry of Commerce (MOC) (2017), Myanmar Foreign Trade in 2017.
https://www.commerce.gov.mm/en (accessed 28 January 2019)
Myanmar Alinn (2019), ‘Cold storage zone for fruits, crops to be established in Pyin Oo Lwin’,
58, February 2019.
Myanmar Customs Department (2010), ’Trade Data | Import of Vaccine in 2016–17 FY,
Import of Fishery (2014–2018), Import of Refrigerated Trucks (2012–2018),
Export/Import of Fruit, Flower and Vegetables (2016–2018), Export/Import of Meat
and Dairy Products (2014–2018)’. https://www.myanmarcustoms.gov.mm/
(accessed 27 November 2018)
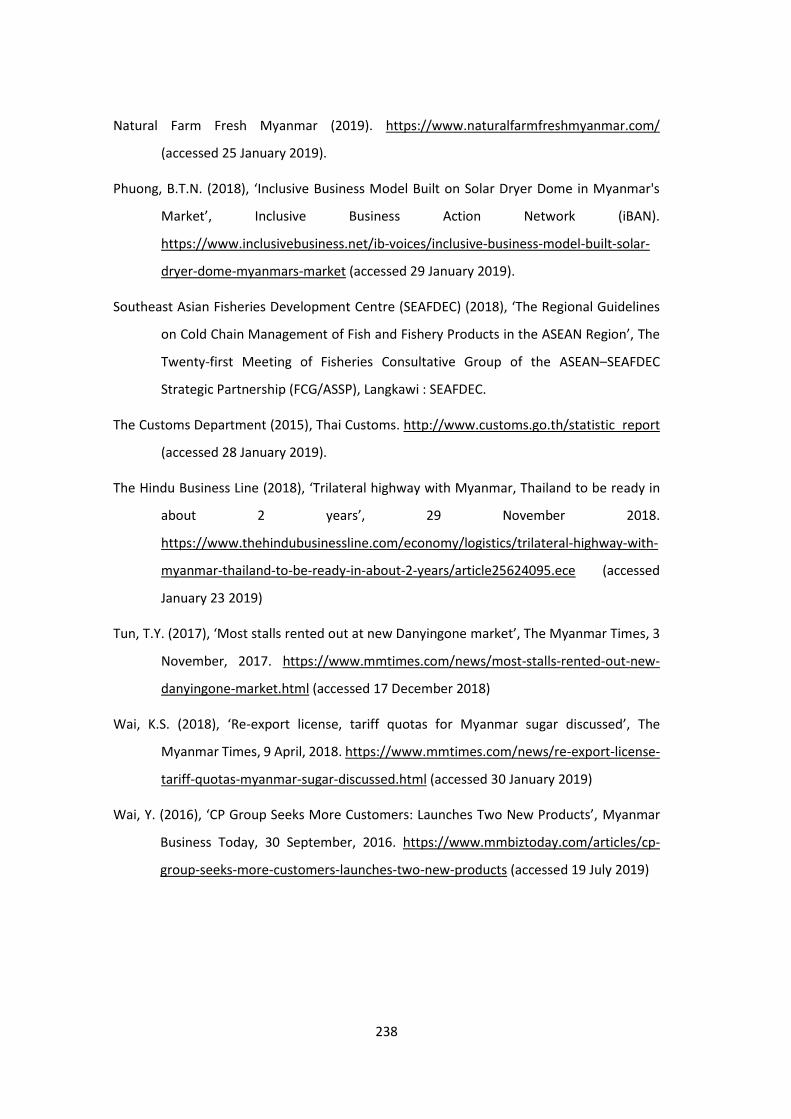
238
Natural Farm Fresh Myanmar (2019). https://www.naturalfarmfreshmyanmar.com/
(accessed 25 January 2019).
Phuong, B.T.N. (2018), ‘Inclusive Business Model Built on Solar Dryer Dome in Myanmar's
Market’, Inclusive Business Action Network (iBAN).
https://www.inclusivebusiness.net/ib-voices/inclusive-business-model-built-solar-
dryer-dome-myanmars-market (accessed 29 January 2019).
Southeast Asian Fisheries Development Centre (SEAFDEC) (2018), ‘The Regional Guidelines
on Cold Chain Management of Fish and Fishery Products in the ASEAN Region’, The
Twenty-first Meeting of Fisheries Consultative Group of the ASEAN–SEAFDEC
Strategic Partnership (FCG/ASSP), Langkawi : SEAFDEC.
The Customs Department (2015), Thai Customs. http://www.customs.go.th/statistic_report
(accessed 28 January 2019).
The Hindu Business Line (2018), ‘Trilateral highway with Myanmar, Thailand to be ready in
about 2 years’, 29 November 2018.
https://www.thehindubusinessline.com/economy/logistics/trilateral-highway-with-
myanmar-thailand-to-be-ready-in-about-2-years/article25624095.ece (accessed
January 23 2019)
Tun, T.Y. (2017), ‘Most stalls rented out at new Danyingone market’, The Myanmar Times, 3
November, 2017. https://www.mmtimes.com/news/most-stalls-rented-out-new-
danyingone-market.html (accessed 17 December 2018)
Wai, K.S. (2018), ‘Re-export license, tariff quotas for Myanmar sugar discussed’, The
Myanmar Times, 9 April, 2018. https://www.mmtimes.com/news/re-export-license-
tariff-quotas-myanmar-sugar-discussed.html (accessed 30 January 2019)
Wai, Y. (2016), ‘CP Group Seeks More Customers: Launches Two New Products’, Myanmar
Business Today, 30 September, 2016. https://www.mmbiztoday.com/articles/cp-
group-seeks-more-customers-launches-two-new-products (accessed 19 July 2019)
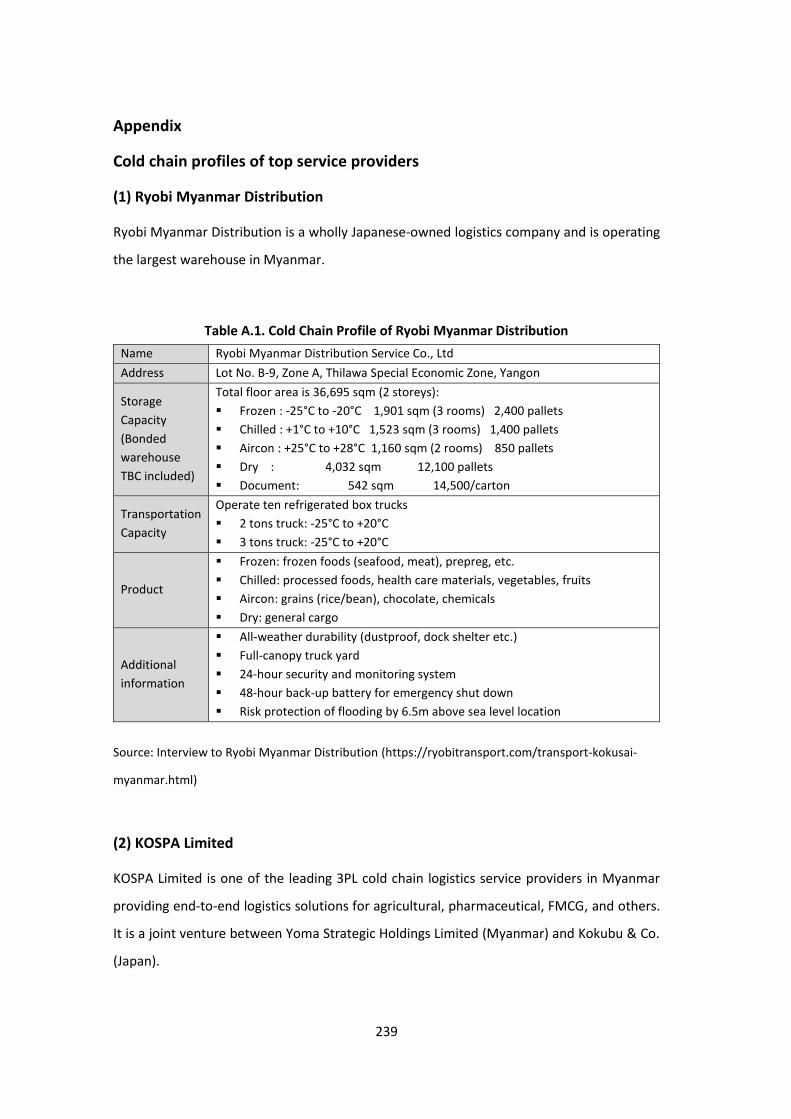
239
Appendix
Cold chain profiles of top service providers
(1) Ryobi Myanmar Distribution
Ryobi Myanmar Distribution is a wholly Japanese-owned logistics company and is operating
the largest warehouse in Myanmar.
Table A.1. Cold Chain Profile of Ryobi Myanmar Distribution
Name Ryobi Myanmar Distribution Service Co., Ltd
Address Lot No. B-9, Zone A, Thilawa Special Economic Zone, Yangon
Storage
Capacity
(Bonded
warehouse
TBC included)
Total floor area is 36,695 sqm (2 storeys):
▪ Frozen : -25°C to -20°C 1,901 sqm (3 rooms) 2,400 pallets
▪ Chilled : +1°C to +10°C 1,523 sqm (3 rooms) 1,400 pallets
▪ Aircon : +25°C to +28°C 1,160 sqm (2 rooms) 850 pallets
▪ Dry : 4,032 sqm 12,100 pallets
▪ Document: 542 sqm 14,500/carton
Transportation
Capacity
Operate ten refrigerated box trucks
▪ 2 tons truck: -25°C to +20°C
▪ 3 tons truck: -25°C to +20°C
Product
▪ Frozen: frozen foods (seafood, meat), prepreg, etc.
▪ Chilled: processed foods, health care materials, vegetables, fruits
▪ Aircon: grains (rice/bean), chocolate, chemicals
▪ Dry: general cargo
Additional
information
▪ All-weather durability (dustproof, dock shelter etc.)
▪ Full-canopy truck yard
▪ 24-hour security and monitoring system
▪ 48-hour back-up battery for emergency shut down
▪ Risk protection of flooding by 6.5m above sea level location
Source: Interview to Ryobi Myanmar Distribution (https://ryobitransport.com/transport-kokusai-
myanmar.html)
(2) KOSPA Limited
KOSPA Limited is one of the leading 3PL cold chain logistics service providers in Myanmar
providing end-to-end logistics solutions for agricultural, pharmaceutical, FMCG, and others.
It is a joint venture between Yoma Strategic Holdings Limited (Myanmar) and Kokubu & Co.
(Japan).
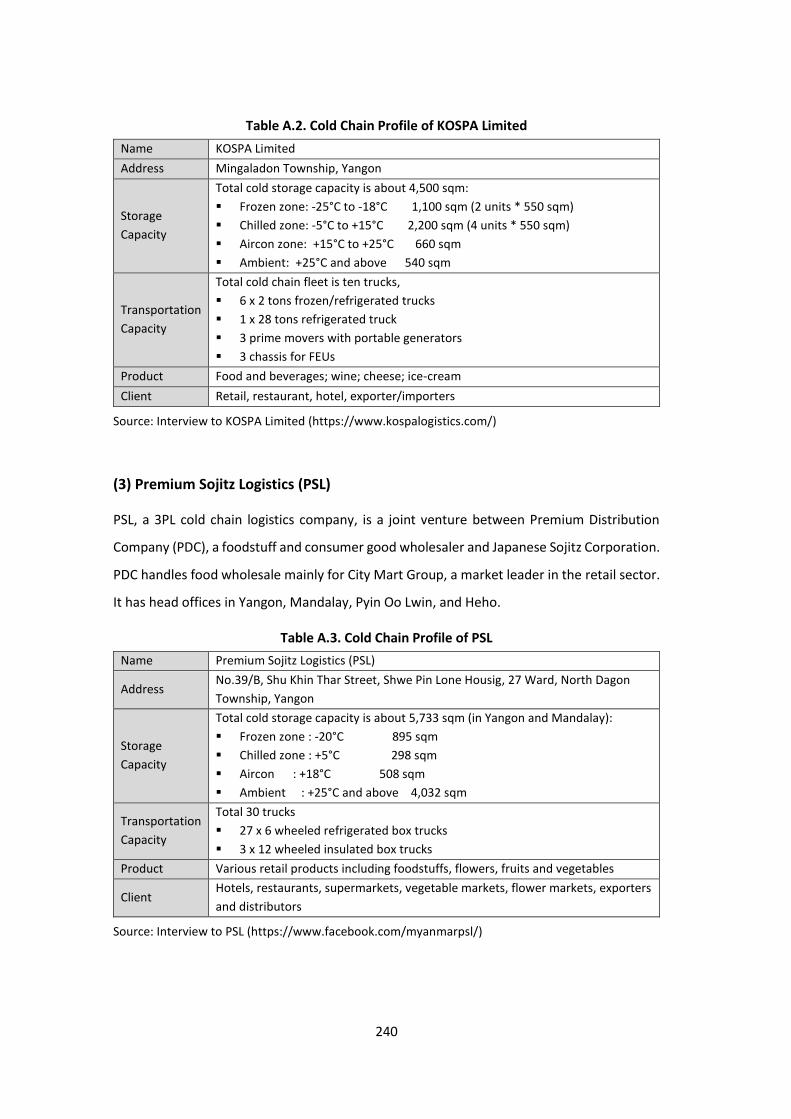
240
Table A.2. Cold Chain Profile of KOSPA Limited
Name KOSPA Limited
Address Mingaladon Township, Yangon
Storage
Capacity
Total cold storage capacity is about 4,500 sqm:
▪ Frozen zone: -25°C to -18°C 1,100 sqm (2 units * 550 sqm)
▪ Chilled zone: -5°C to +15°C 2,200 sqm (4 units * 550 sqm)
▪ Aircon zone: +15°C to +25°C 660 sqm
▪ Ambient: +25°C and above 540 sqm
Transportation
Capacity
Total cold chain fleet is ten trucks,
▪ 6 x 2 tons frozen/refrigerated trucks
▪ 1 x 28 tons refrigerated truck
▪ 3 prime movers with portable generators
▪ 3 chassis for FEUs
Product Food and beverages; wine; cheese; ice-cream
Client Retail, restaurant, hotel, exporter/importers
Source: Interview to KOSPA Limited (https://www.kospalogistics.com/)
(3) Premium Sojitz Logistics (PSL)
PSL, a 3PL cold chain logistics company, is a joint venture between Premium Distribution
Company (PDC), a foodstuff and consumer good wholesaler and Japanese Sojitz Corporation.
PDC handles food wholesale mainly for City Mart Group, a market leader in the retail sector.
It has head offices in Yangon, Mandalay, Pyin Oo Lwin, and Heho.
Table A.3. Cold Chain Profile of PSL
Name Premium Sojitz Logistics (PSL)
Address No.39/B, Shu Khin Thar Street, Shwe Pin Lone Housig, 27 Ward, North Dagon
Township, Yangon
Storage
Capacity
Total cold storage capacity is about 5,733 sqm (in Yangon and Mandalay):
▪ Frozen zone : -20°C 895 sqm
▪ Chilled zone : +5°C 298 sqm
▪ Aircon : +18°C 508 sqm
▪ Ambient : +25°C and above 4,032 sqm
Transportation
Capacity
Total 30 trucks
▪ 27 x 6 wheeled refrigerated box trucks
▪ 3 x 12 wheeled insulated box trucks
Product Various retail products including foodstuffs, flowers, fruits and vegetables
Client Hotels, restaurants, supermarkets, vegetable markets, flower markets, exporters
and distributors
Source: Interview to PSL (https://www.facebook.com/myanmarpsl/)

241
(4) Premium Worldwide
Premium Worldwide Co., Ltd is majority owned and operated by a Singapore Private Limited
Company with Diversified Holdings in Logistics, Information Technology, Trading, Real Estate,
Lifestyle and the Food & Beverage Sectors. Sales Direct is its associate company providing
foodstuffs and general trading services for businesses in Myanmar.
Table A.4. Cold Chain Profile of Premium Worldwide
Name Premium Worldwide Co., Ltd
Address HQ & Central Distribution Hub, 209 & 238 Hlaing Tha Yar Industrial Zone 2, Ka
Naung Min Thar Gyi Road, Yangon
Storage
Capacity
Total cold storage capacity is 3,400 tons
▪ Cold/Chilled zone : 1,600 tons (8 units x 200 tons)
▪ Ambient : 1,800 tons (2 units x 900 tons)
Transportation
Capacity
Has six refrigerated trucks;
▪ 3 x 2 tons trucks
▪ 3 x 3.5 tons trucks
Product
Over 300 items:
Mainly store foodstuffs; cheese, butter, juice, various sauce dressings, tomato
paste, ketchup, etc.
Client Hotels, retail, and restaurant chains; KFC, for example.
Source: Interview to Premium Worldwide (http://www.premiumgroup.com.mm/)
(5) Nature Logistics
Nature logistics is a 3PL logistics service provider focusing on cold chain logistics and
refrigeration services. It provides a full range of logistics services, refrigerated and dry
container sales, and rental and refrigeration engineering services for reefers and cold storage
factories.
Table A.5. Cold Chain Profile of Nature Logistics
Name Nature Cold Chain Logistics and Refrigeration Services Co., Ltd
Address No. 74, Ground Floor, 30th Street, Lower Block, Yangon
Fleet size Operating five tractor trailers; prime-movers and chassis equipped with
generators
Product Chemicals, pharmaceuticals, beef, seeds, flowers, fruits, vegetables, ice-cream,
cheese, etc.
Client Mainly exporters/importers
Source: Interview to Nature Logistics Company (https://www.natureclr.com/)
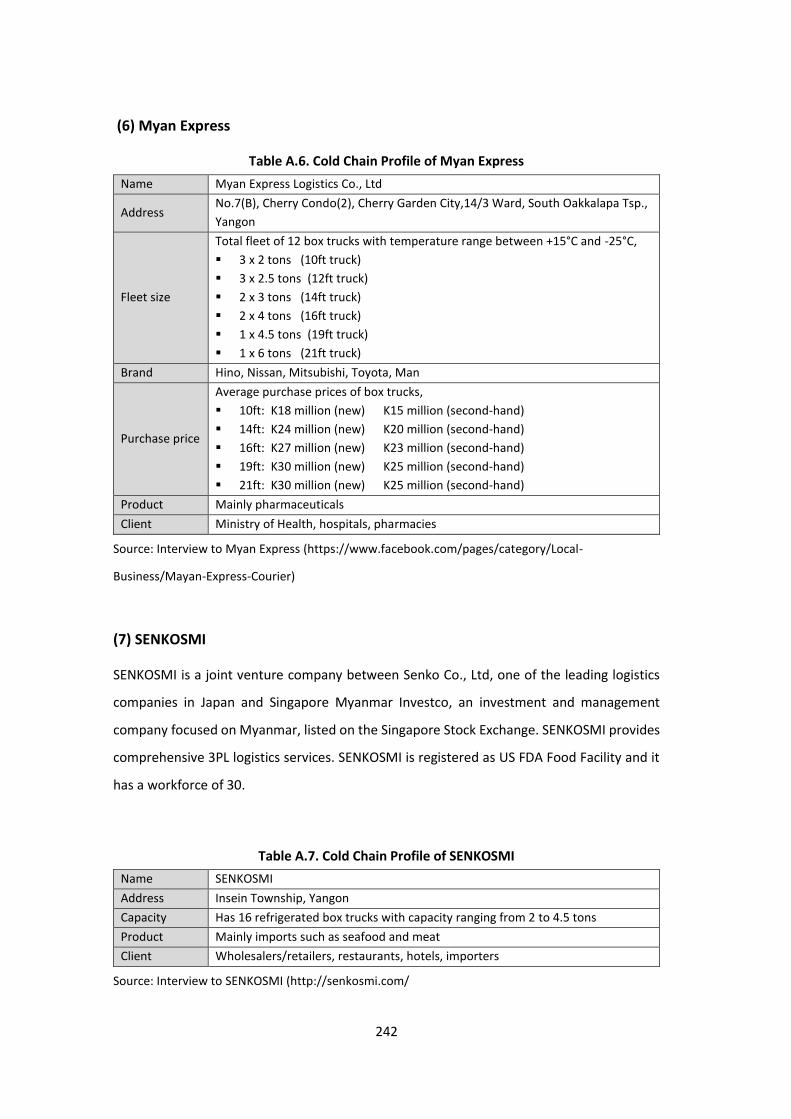
242
(6) Myan Express
Table A.6. Cold Chain Profile of Myan Express
Name Myan Express Logistics Co., Ltd
Address No.7(B), Cherry Condo(2), Cherry Garden City,14/3 Ward, South Oakkalapa Tsp.,
Yangon
Fleet size
Total fleet of 12 box trucks with temperature range between +15°C and -25°C,
▪ 3 x 2 tons (10ft truck)
▪ 3 x 2.5 tons (12ft truck)
▪ 2 x 3 tons (14ft truck)
▪ 2 x 4 tons (16ft truck)
▪ 1 x 4.5 tons (19ft truck)
▪ 1 x 6 tons (21ft truck)
Brand Hino, Nissan, Mitsubishi, Toyota, Man
Purchase price
Average purchase prices of box trucks,
▪ 10ft: K18 million (new) K15 million (second-hand)
▪ 14ft: K24 million (new) K20 million (second-hand)
▪ 16ft: K27 million (new) K23 million (second-hand)
▪ 19ft: K30 million (new) K25 million (second-hand)
▪ 21ft: K30 million (new) K25 million (second-hand)
Product Mainly pharmaceuticals
Client Ministry of Health, hospitals, pharmacies
Source: Interview to Myan Express (https://www.facebook.com/pages/category/Local-
Business/Mayan-Express-Courier)
(7) SENKOSMI
SENKOSMI is a joint venture company between Senko Co., Ltd, one of the leading logistics
companies in Japan and Singapore Myanmar Investco, an investment and management
company focused on Myanmar, listed on the Singapore Stock Exchange. SENKOSMI provides
comprehensive 3PL logistics services. SENKOSMI is registered as US FDA Food Facility and it
has a workforce of 30.
Table A.7. Cold Chain Profile of SENKOSMI
Name SENKOSMI
Address Insein Township, Yangon
Capacity Has 16 refrigerated box trucks with capacity ranging from 2 to 4.5 tons
Product Mainly imports such as seafood and meat
Client Wholesalers/retailers, restaurants, hotels, importers
Source: Interview to SENKOSMI (http://senkosmi.com/
243
Chapter 7
Summary and Policy Implications
Eiichi Kusano58
This report described the current status of the cold chain. mainly focusing on (i) demand for the
cold chain, (ii) the activities of the main players, and (iii) government policies in Thailand, Viet
Nam, Indonesia, the Lao PDR, and Myanmar. We investigated the pathways to improve the cold
chain by detecting choke points and opportunities in each country and obtained various findings
and suggestions. This chapter summarises the abovementioned three key issues as well as policy
implications for the development of the cold chain.
7.1. Demand for the cold chain
Total demand and its trend
In this report, the demand for the cold chain was mainly estimated based on the values or
quantities of agri-food products that are internationally traded. All chapters focused on the
types of products generally needed to be kept under low temperatures, which include fish, fruit
and vegetables, and livestock products, regardless of whether those are fresh, chilled, or frozen.
The chapters on Indonesia and Myanmar estimated the cold chain demand by using different
methods from other countries. Indonesia focused on the supply-demand balance of frozen
products and estimated its quantity of domestic consumption. Indonesia also calculated the
demand for cold storage by multiplying the production quantities and specific rates obtained
from interviews. Myanmar classified circulated products into those that are internationally and
domestically traded and interpreted that the former causes demand for the modern cold chain
using refrigerating or freezing systems. The latter is understood as traditional logistics, which
use crushed ice, insulated box trucks, and general freight trucks, or denoting the potential
demand for the modern cold chain.
58 Economic Research Institute for ASEAN and East Asia (ERIA)/Japan International Research Center for
Agricultural Sciences (JIRCAS).

244
Table 7.1 shows the estimated demand for the cold chain and its change in recent years.
Although the values of different countries are not comparable, we can observe common
features: the growing international trade of many agri-food products requiring the cold chain,
other than decreasing exports of Indonesia and imports of refrigerated and frozen food by
Myanmar. Similarly, domestic consumption also drives demand for the cold chain, which is
suggested from the rapidly expanding consumption of frozen products in Thailand, the
production of livestock products and the number of large farmers in Viet Nam, and the
production of agri-food products in Indonesia. Data on Myanmar imply there is a large potential
that the modern cold chain could expand to the traditional chain or circulation under ordinary
temperatures.
Table 7.1: Demand for the Cold chain and Values and Changes in Circulated Products
Item Demand for cold chain
Annual growth
rate* Table
Year Value Year % No.
Thailand
Frozen food Consumption 2015 US$0.50 billion 2011–2015 10.0 2.10
Cold chain products Export 2018 US$16.05 billion 2012–2018 3.3
2.11 Import 2018 US$10.43 billion 2012–2018 5.3
Viet Nam
Agricultural products Export 2017 US$36.37 billion 2001–2017 12.5 Fig.
3.1 Import 2017 US$27.82 billion 2001–2017 13.6
Pig, cow, and poultry meat Production
2016 4.93 million tons 2000–2016 16.7 Fig.
3.6 Milk 2016 0.80 million litres 2000–2016 6.6
Number of large farms Number 2017 34,050 farms 2011–2017 9.6 Fig.
3.7
Indonesia
Frozen food
Production 2018 6.79 million tons 2014–2018 4.8
4.4 Export 2018 0.57 million tons 2014–2018 -7.4
Import 2018 0.41 million tons 2014–2018 13.5
Production of agri-food
products – 2018 47.3 million tons – –
4.26 Estimated demand for cold
storage – 2018 17.6 million tons – –
Lao PDR
Frozen / chilled / fresh
products Import 2017 US$3.87 billion
FY 2015–
2017** 10.6 5.2
Myanmar
Refrigerated products
(modern) Domestic
distribution,
FY
2017
0.07 million tons – – 6.2
Frozen products (modern) 0.58 million tons – –
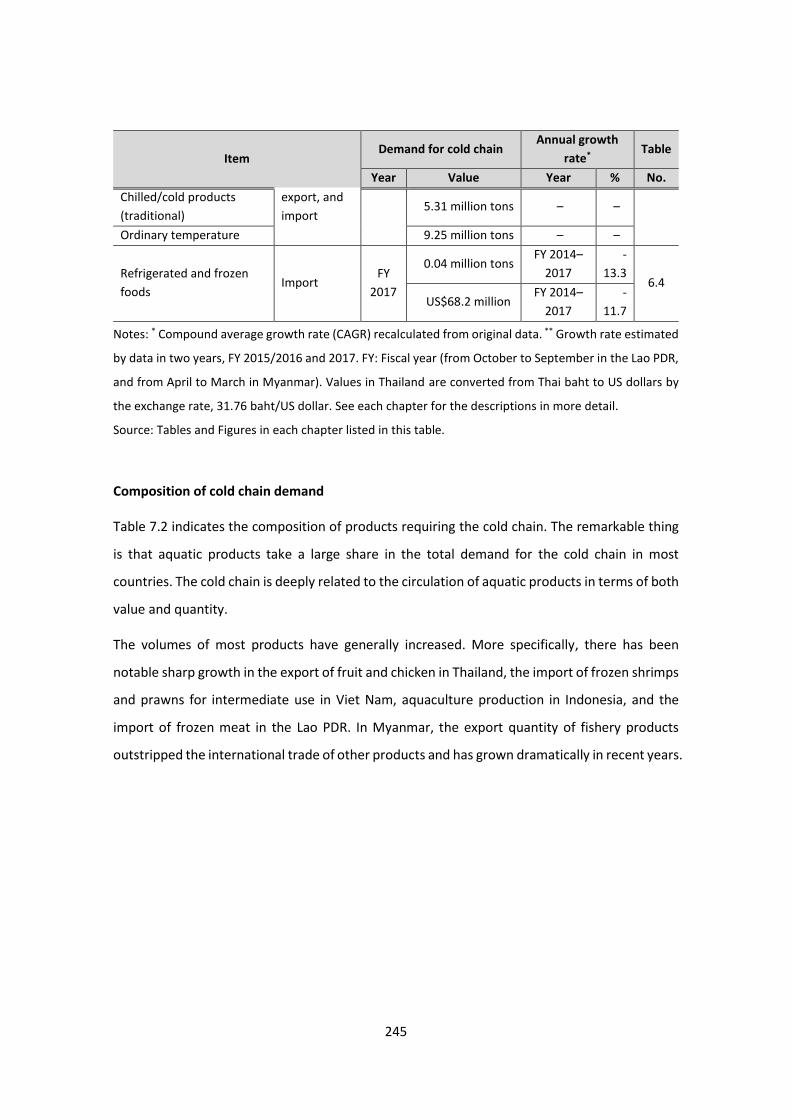
245
Item Demand for cold chain
Annual growth
rate* Table
Year Value Year % No.
Chilled/cold products
(traditional)
export, and
import 5.31 million tons – –
Ordinary temperature 9.25 million tons – –
Refrigerated and frozen
foods Import
FY
2017
0.04 million tons FY 2014–
2017
-
13.3 6.4
US$68.2 million FY 2014–
2017
-
11.7
Notes: * Compound average growth rate (CAGR) recalculated from original data. ** Growth rate estimated
by data in two years, FY 2015/2016 and 2017. FY: Fiscal year (from October to September in the Lao PDR,
and from April to March in Myanmar). Values in Thailand are converted from Thai baht to US dollars by
the exchange rate, 31.76 baht/US dollar. See each chapter for the descriptions in more detail.
Source: Tables and Figures in each chapter listed in this table.
Composition of cold chain demand
Table 7.2 indicates the composition of products requiring the cold chain. The remarkable thing
is that aquatic products take a large share in the total demand for the cold chain in most
countries. The cold chain is deeply related to the circulation of aquatic products in terms of both
value and quantity.
The volumes of most products have generally increased. More specifically, there has been
notable sharp growth in the export of fruit and chicken in Thailand, the import of frozen shrimps
and prawns for intermediate use in Viet Nam, aquaculture production in Indonesia, and the
import of frozen meat in the Lao PDR. In Myanmar, the export quantity of fishery products
outstripped the international trade of other products and has grown dramatically in recent years.

246
Table 7.2: Composition of cold chain demand
Country Item Aquatic
products
Agricultural
products
Livestock
products
Other
products Table
Thailand
(2018)
Export (US$ million) 1,996 2,988 4,198 687 2.13
Import (US$ million) 3,183 2,089 1,526 3,632 2.12
Viet Nam
(2017) Import (US$ million) 813 173 357 –
Fig. 3.2,
3.3, 3.4
Indonesia
(2018)
Estimated demand
(million tons) 12.51 2.90 2.11 0.07 4.26
Lao PDR
(2017)
Import (US$ million) 31 12 14 – 5.6
Import (million tons) 0.003 – 0.015 –
Myanmar
(FY
2017/2018)
Current demand
(million tons) 0.58 0.03 0.04 0.003
5.6 Potential demand
(million tons) 5.31 5.11 4.14 0
Notes: Thailand: Aquatic products; agricultural products; livestock products; and the sum of live plants
and pharmaceutical products. Exported value of canned and processed foods including fruits, vegetables,
and seafood were omitted. Viet Nam: Sum of frozen tuna, salmon, mackerel, cod, shrimps, and prawns
for intermediate use; the sum of fresh apples, grapes, pears, cherries, and kiwifruit; and meat. Indonesia:
Fishery products; fruits and vegetables; beef and chicken; and other products. Lao PDR: Frozen/chilled
salmon/fish; vegetable and fruit; and frozen/chilled meat. Myanmar: Fishery products; selected
agricultural products; meat and dairy products; and imported pharmaceutical products. The values for
Thailand are converted from Thai baht to US dollars by the exchange rate, 31.76 baht/US dollar. See each
chapter for the descriptions in more detail.
Source: Tables and Figures in each chapter listed in this table.
247
7.2. Activities of the main players
Differences in chains and players
Cold warehouse and transportation companies take their roles in selected parts of the
distribution chain split by producer or importer, distribution centre, wholesaler, retailer, and
domestic final consumer or exporter, rather than the whole logistics of the chain. The
transportation distance of each company may be either short or long. For example, domestically
produced products and transit trade may need long-distance transportation runs through the
nation, as shown in Lao PDR and Myanmar. The scale of transportation depends on the part of
the chain. Refrigerated containers of imported products are directly transported to cold storages
as explained in the chapter on Viet Nam. After that, small trucks carry chilled or frozen products
to the next nodal point. Viet Nam reported that motorbikes attached with ice boxes deliver
products to consumers.
The differences in warehouse and transportation equipment by the purpose of the trade is
notable. Modern cold transportation logistics using refrigerated trucks is mainly used for
international trade according to the Lao PDR and Myanmar, although trucks do not necessarily
equip or use the generating system. Meanwhile, traditional methods by using crushed ice and
plastic case are widely used for products targeting the domestic market in those countries. In
the case of the circulation of fishery products in Myanmar, products mixed with ice are loaded
into box trucks and directly transported are common for Yangon intercity, while they are put
into ice boxes and transported with general trucks for the long haul.
Representative companies of cold storage and transportation
Companies using cold storage and transportation can be classified into two types. The first is
food processing companies operating own cold warehouses or transportation, particularly in the
fishery sector accounting for large parts of the cold storage service in Viet Nam, Indonesia, and
Myanmar. Case studies in Myanmar also show that the crushed ice produced by aquaculture
farms is necessary for the traditional way of fish transportation. As well as seafood companies,
the storage capacity of other food processing companies is remarkably large in Thailand, Viet
Nam, and Indonesia.
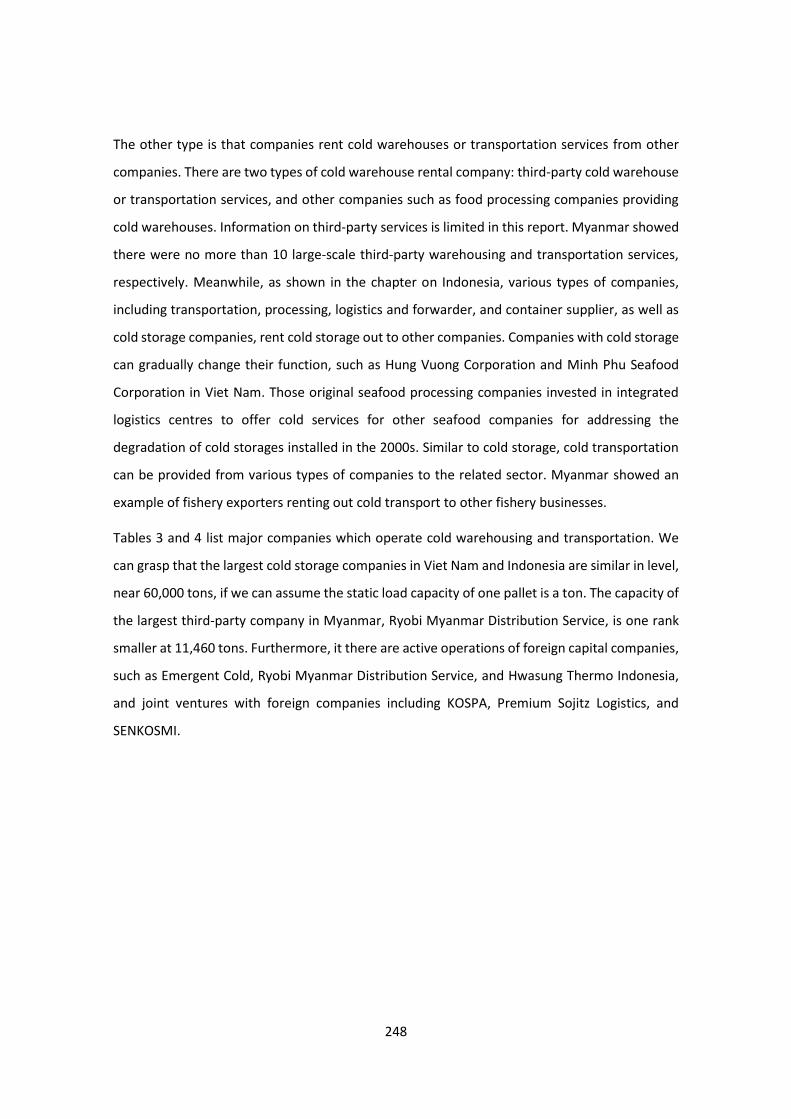
248
The other type is that companies rent cold warehouses or transportation services from other
companies. There are two types of cold warehouse rental company: third-party cold warehouse
or transportation services, and other companies such as food processing companies providing
cold warehouses. Information on third-party services is limited in this report. Myanmar showed
there were no more than 10 large-scale third-party warehousing and transportation services,
respectively. Meanwhile, as shown in the chapter on Indonesia, various types of companies,
including transportation, processing, logistics and forwarder, and container supplier, as well as
cold storage companies, rent cold storage out to other companies. Companies with cold storage
can gradually change their function, such as Hung Vuong Corporation and Minh Phu Seafood
Corporation in Viet Nam. Those original seafood processing companies invested in integrated
logistics centres to offer cold services for other seafood companies for addressing the
degradation of cold storages installed in the 2000s. Similar to cold storage, cold transportation
can be provided from various types of companies to the related sector. Myanmar showed an
example of fishery exporters renting out cold transport to other fishery businesses.
Tables 3 and 4 list major companies which operate cold warehousing and transportation. We
can grasp that the largest cold storage companies in Viet Nam and Indonesia are similar in level,
near 60,000 tons, if we can assume the static load capacity of one pallet is a ton. The capacity of
the largest third-party company in Myanmar, Ryobi Myanmar Distribution Service, is one rank
smaller at 11,460 tons. Furthermore, it there are active operations of foreign capital companies,
such as Emergent Cold, Ryobi Myanmar Distribution Service, and Hwasung Thermo Indonesia,
and joint ventures with foreign companies including KOSPA, Premium Sojitz Logistics, and
SENKOSMI.
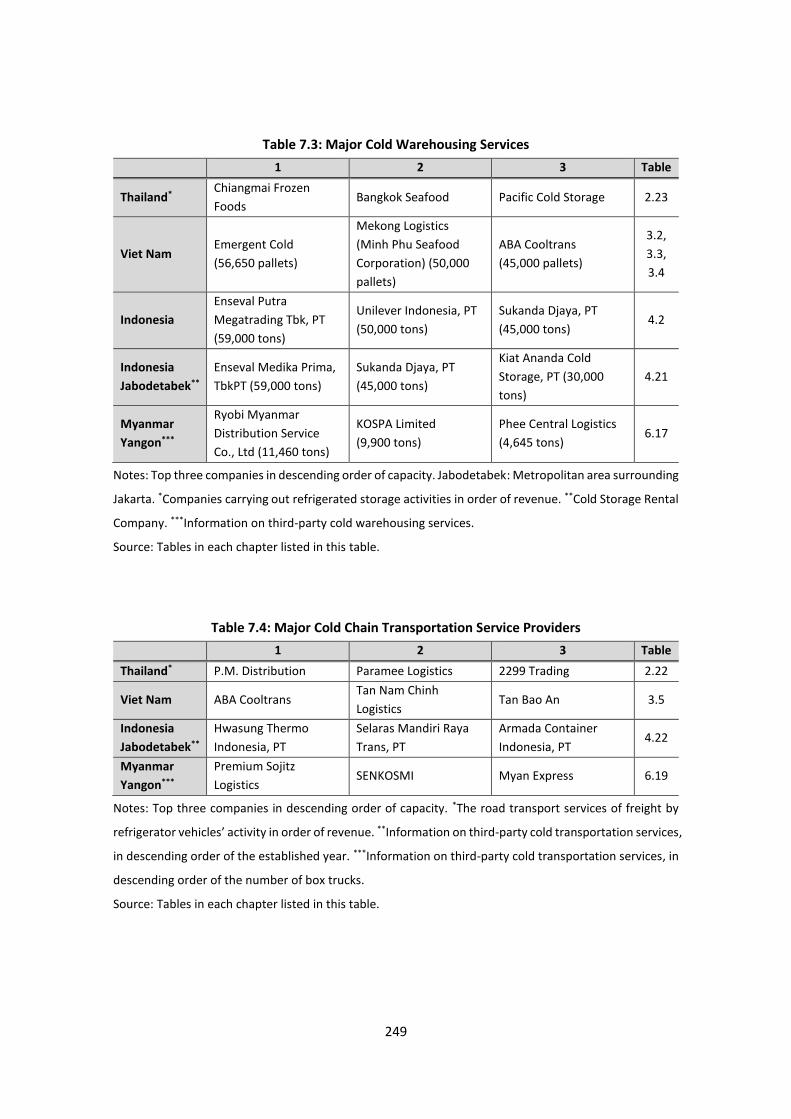
249
Table 7.3: Major Cold Warehousing Services
1 2 3 Table
Thailand* Chiangmai Frozen
Foods Bangkok Seafood Pacific Cold Storage 2.23
Viet Nam Emergent Cold
(56,650 pallets)
Mekong Logistics
(Minh Phu Seafood
Corporation) (50,000
pallets)
ABA Cooltrans
(45,000 pallets)
3.2,
3.3,
3.4
Indonesia
Enseval Putra
Megatrading Tbk, PT
(59,000 tons)
Unilever Indonesia, PT
(50,000 tons)
Sukanda Djaya, PT
(45,000 tons) 4.2
Indonesia
Jabodetabek**
Enseval Medika Prima,
TbkPT (59,000 tons)
Sukanda Djaya, PT
(45,000 tons)
Kiat Ananda Cold
Storage, PT (30,000
tons)
4.21
Myanmar
Yangon***
Ryobi Myanmar
Distribution Service
Co., Ltd (11,460 tons)
KOSPA Limited
(9,900 tons)
Phee Central Logistics
(4,645 tons) 6.17
Notes: Top three companies in descending order of capacity. Jabodetabek: Metropolitan area surrounding
Jakarta. *Companies carrying out refrigerated storage activities in order of revenue. **Cold Storage Rental
Company. ***Information on third-party cold warehousing services.
Source: Tables in each chapter listed in this table.
Table 7.4: Major Cold Chain Transportation Service Providers
1 2 3 Table
Thailand* P.M. Distribution Paramee Logistics 2299 Trading 2.22
Viet Nam ABA Cooltrans Tan Nam Chinh
Logistics Tan Bao An 3.5
Indonesia
Jabodetabek**
Hwasung Thermo
Indonesia, PT
Selaras Mandiri Raya
Trans, PT
Armada Container
Indonesia, PT 4.22
Myanmar
Yangon***
Premium Sojitz
Logistics SENKOSMI Myan Express 6.19
Notes: Top three companies in descending order of capacity. *The road transport services of freight by
refrigerator vehicles’ activity in order of revenue. **Information on third-party cold transportation services,
in descending order of the established year. ***Information on third-party cold transportation services, in
descending order of the number of box trucks.
Source: Tables in each chapter listed in this table.

250
Supply of cold chain services
Table 7.5 shows the supply of cold storage in each country. The capacity of both the public and
private sectors is 940,000 tons in Thailand. The capacity of the private sector in Viet Nam is larger
than 500,000 pallets. The capacities in Indonesia and Myanmar are 370,200 tons and 88,148
tons, respectively, although those indicate only the capacities of major companies. Companies
operating their own cold storage, such as seafood processing companies, have large capacities
for cold storage compared with cold storage companies, including third-party warehouse
companies, at least in Viet Nam, Indonesia, and Myanmar.
The supplied capacity of cold storage shown in Table 7.5 is quite limited compared with the cold
chain demand in Table 7.1. In Viet Nam, the production volume of pig, cow, and poultry meat
account for 4.93 million tons, while cold storage provided from the private sector is 0.5 million
tons when we assume one pallet can load a ton. Similarly, the estimated demand for cold storage
of 17.6 million tons far exceeds the capacity of major cold storage companies of 0.4 million tons
in Indonesia. In Myanmar, the total supplied capacity of major cold storage companies of 0.88
million tons is larger than the demand for modern refrigerated and frozen products of 0.65
million ton, while it is smaller than the demand for the traditional cold chain of 5.31 million tons
and circulation under ordinary temperatures of 5.31 million tons.
The shortage of cold storage supply allows us to two interpretations. First, the demanded
quantities listed in Table 7.5 only indicate the volumes of products that should be circulated
under cold temperatures regardless of the actual storage conditions. Second, the supply of cold
storage in Table 7.3, especially in Indonesia and Myanmar, only shows that of large-scale
companies that can provide modern cold storage services. The large gap between the demand
and supply of cold storage suggest that a substantial part of the cold chain demand is satisfied
with supply from small and medium enterprises or is not fulfilled and has significant potential
for companies to provide cold chain services.
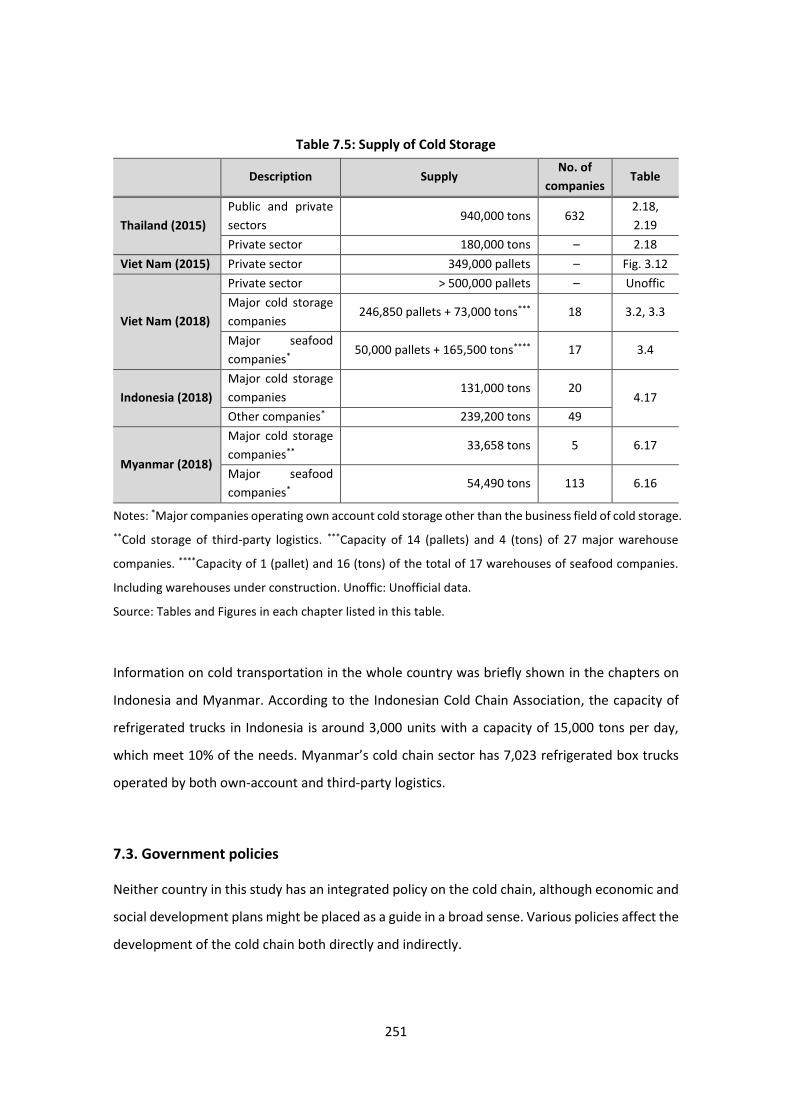
251
Table 7.5: Supply of Cold Storage
Description Supply No. of
companies Table
Thailand (2015)
Public and private
sectors 940,000 tons 632
2.18,
2.19
Private sector 180,000 tons – 2.18
Viet Nam (2015) Private sector 349,000 pallets – Fig. 3.12
Viet Nam (2018)
Private sector > 500,000 pallets – Unoffic
Major cold storage
companies 246,850 pallets + 73,000 tons*** 18 3.2, 3.3
Major seafood
companies* 50,000 pallets + 165,500 tons**** 17 3.4
Indonesia (2018)
Major cold storage
companies 131,000 tons 20
4.17
Other companies* 239,200 tons 49
Myanmar (2018)
Major cold storage
companies** 33,658 tons 5 6.17
Major seafood
companies* 54,490 tons 113 6.16
Notes: *Major companies operating own account cold storage other than the business field of cold storage.
**Cold storage of third-party logistics. ***Capacity of 14 (pallets) and 4 (tons) of 27 major warehouse
companies. ****Capacity of 1 (pallet) and 16 (tons) of the total of 17 warehouses of seafood companies.
Including warehouses under construction. Unoffic: Unofficial data.
Source: Tables and Figures in each chapter listed in this table.
Information on cold transportation in the whole country was briefly shown in the chapters on
Indonesia and Myanmar. According to the Indonesian Cold Chain Association, the capacity of
refrigerated trucks in Indonesia is around 3,000 units with a capacity of 15,000 tons per day,
which meet 10% of the needs. Myanmar’s cold chain sector has 7,023 refrigerated box trucks
operated by both own-account and third-party logistics.
7.3. Government policies
Neither country in this study has an integrated policy on the cold chain, although economic and
social development plans might be placed as a guide in a broad sense. Various policies affect the
development of the cold chain both directly and indirectly.

252
Policies directly affecting the development of the cold chain
A noteworthy voluntary regulation directly affecting cold storage and transportation is the
service quality standard for truck operation, or the Q Mark standard, in Thailand tested in 2019,
which set up a common quality standard of temperature-controlled transport. The evaluation
approach of the standard focuses on four key factors, such as the operation of transport, hygiene,
the standard and maintenance of cold storage, and human resource development. In addition,
the Thailand Professional Qualification Institute is developing a professional cold chain course
to improve the Thai workforce’s competitiveness in terms of skill and knowledge. We can learn
from the advanced efforts of the Thai government to standardise cold transportation and
develop human resources.
Other regulations related to the cold chain include the Warehouse, Silo and Cold Storage Act in
Thailand and Presidential Regulation No. 71 of 2015 in Indonesia for controlling operations in
factories, storage, and transportation that use the cooling system. Rather than regulations, a
guideline about the temperature control of fishery products is adopted by the Myanmar
Fisheries Federation, although there is weak compliance from local businesses.
Temperature control is generally stipulated in food standards in each country. For example, the
Food Safety Law in Viet Nam states the technical requirements for frozen and chilled products,
such as seafood and meat requiring temperature control.
The government can directly support facilities and markets, which can be nodes of the cold chain.
The government in Viet Nam conducted credit support to purchase machinery and equipment,
including refrigerated cargo, machines for producing ice, and cold storage facilities under
Decision 68/2013/QD-TTg, although the accessibility to the support is low for targeted groups.
The Ministry of Maritime Affairs and Fisheries in Indonesia has allocated funds to introduce cold
chain facilities, such as ice flake machines, refrigerated vehicles, cold storage, and fish markets
in recent years. In Myanmar, the government supports the development of commodity markets,
such as the ongoing Danyingone Wholesale Market with modern cold storage.
253
Policies indirectly affecting the development of the cold chain
Several policies examined in each chapter would indirectly affect the improvement in the cold
chain. First is investment promotion for cold chain businesses, such as tax exemptions for
investment and permission for ownership to foreign investors in Thailand. Decree 163/2017/ND-
CP in Viet Nam would have impacts on shaping the investment environment while creating more
room for foreign investors to join logistics services. One of the aims of Directive 21/CT-TTg in
Viet Nam is to attract investment in logistics infrastructure aligned with e-commerce
development. Similarly, the Indonesian government has opened the cold chain, especially the
field of cold storage, to foreign investments, according to Presidential Regulation Number 44 of
2016.
Infrastructure development led by the government would also affect cold logistics. In the
Greater Mekong Subregion, the development of roads and seaports crossing the region is
focused on as a factor largely affecting international transportation. Those initiatives include the
construction of the Eastern Economic Corridor in Thailand, a few projects affecting
transportation in Myanmar, such as India – Myanmar – Thailand Trilateral Highway Project, and
China’s One Belt One Road Initiative, containing the Vientiane – Kunming High-Speed Railway
Project that is expected to change the transportation environment in the Lao PDR.
Customs operations have been improved in many countries as well as investment promotion.
Thailand introduced modern systems, namely the National Single Window, to facilitate the use
of electronic data and information sharing, and the Port Community System to set the electronic
platform to improve processes at seaports and airports. Meanwhile, the Lao PDR pointed out
problems with the regulations on customs that the number is limited and that they miss
regulating principles related to perishable goods. This results in the ambiguity of statements and
non-integrated and weak enforcement.
7.4. Policy implications
Governments have already implemented or considered the countermeasures to issues of cold
chains as shown in the previous section. However, the arguments in each chapter might provide
further insights to improve the cold chain. In this section, we summarise the policy implications
from the aspects of the hard and soft assets of companies, public infrastructure, and

254
connectivity of the chain. These would affect the operation cost of the cold chain, one of the
common and essential issues, as well as the transportation times and quality of products
requiring cold temperatures.
Stimulating the investment of companies in hard assets
Insufficient hard assets, such as warehouses and trucks in specific regions or parts of the chain
in terms of quantity and quality was specifically mentioned in the chapter of Viet Nam. For
example, both refrigerated vehicle resources and refrigerated warehouse space are not enough
in the producing areas of agricultural products. When focusing on farmers, the enhancement of
household-scale cold storage technology and equipment, particularly for perishable products, is
needed. Companies need to update degraded cold storages in specific sectors, such as the
seafood industry, with expanding capacities and by introducing new technologies. Modified cold
vans with attached air-conditioners widely used by small transportation companies have the
room to reinforce equipment to ensure the quality of transported products. As well, home
delivery using cold insulation boxes attached to motorbikes will be demanded according to the
expansion of e-commerce and are thought to be a potential investment area.
Facilities should be designed in line with the local market size and its demand. In the case of
Myanmar, warehouses with massive capacities, designed based on countries having developed
cold chains, are mismatched with local demand and cause a low utilisation rate. Transportation
with modified cold vans and motorbikes reported by Viet Nam, domestic circulation using
crushed ice and insulation box in the Lao PDR and Myanmar, and farmers’ storage utilising
natural cold weather at night in Thailand are economically rational ways with the potential for
investment or improvement, rather than low-technology which should be cast off.
Investment in agriculture and fisheries, which are affected by natural conditions, is risky and
costly. As mentioned in the chapter on Viet Nam, a clear vision of the government showing the
development priorities of the cold chain and the public–private partnership mechanism would
ease investors to make decisions about entry into those sectors.
255
Fulfilment of soft assets or human resources
This report often stressed insufficient soft assets, especially human resources, in the cold chain.
The Lao PDR mentioned the shortage of truck drivers who have experience in the cold chain.
Myanmar argued the need for training for different types of vehicles before issuing driving
licences. More skilled professionals for warehouse management and operation to provide
services demanded by the international audience are also needed. Thailand mentioned drivers’
insufficient English skills and knowledge for working across borders.
In Viet Nam, there are almost no universities offering courses and or with curriculums related to
cold chain logistics and management in agriculture. It is expected for that universities will open
new education programs and short-course training for the staff and managers of companies
involved in the cold chain.
Investment in public infrastructure
The lack in quantity and quality of infrastructure, including roads, railways, waterways, ports,
and electricity supply, cause high logistics costs and damage perishable products. The issue of
roads includes the availability of short-distance roads, the quality of the roads, and traffic
conditions. Regarding short-distance roads in Myanmar, for example, there is a need for
consideration of the opening of the Yangon–Mandalay Highway Road, which is currently
restricted for trucks. This argument contains a wide range of issues, such as investment for
highway equipment, road maintenance, and traffic safety.
Meanwhile, the chapters on Viet Nam and the Lao PDR pointed out the problem of road quality,
as roads are damaged by too many or over-weighted trucks. Thailand mentioned that traffic
congestion, which can be caused by road construction, would result in delivery delays. There is
room for further discussion about traffic control, substitutional transportation modes, and the
method of road construction for routes important for cold chain.
Stable electricity supply in the routes of the cold chain is also needed to reduce the costs of cold
storage and transportation. This might reduce the need for backup batteries in cold warehouses
for power outages as considered by Viet Nam. In the case of Myanmar, the construction of
stations with proper charging facilities designed for long-distance transport vehicles would
benefit transportation by trucks, which do not equip portable generators for the chilling systems
of the reefer containers.
256
Improvement of connectivity of the chain
Integrative management of the cold chain would decrease the risks and costs during the
preservation and transportation of products. Cold chains in Viet Nam, other than that for the in-
house seafood chain, are evaluated as highly fragmented in all stages. Strengthening the vertical
relationship between companies, or further vertical integration, could be a measure to realise
such integrative management. Another essential factor is individual technologies, such as the
sensor and transmitter system that is used to send data, and communication networks between
the actors of supply chains, which are mentioned as technologies for the fishery chain in the
chapter on Indonesia.
Connectivity in terms of international trade through customs is also a notable issue. In particular,
the Lao PDR and Myanmar examined transit trade as a key driver to develop the cold chain since
it can expand without being restricted by the scale of domestic production. Although the high
connectivity of international trade requires efficient customs operations, there are still several
issues in customs in the reported countries. Thailand mentioned the inconvenient and
complicated import declaration process and the inconsistent clarification of exported products.
Similarly, the Lao PDR argued the need to decrease customs procedures and release clear
statements about the times and fees of customs operations. These measures would improve
competitiveness in terms of transportation time and the freshness of carried products.
We should note the warning in the chapter on Myanmar about the necessity of
countermeasures to prepare for international competition, particularly in the field of transit-
trade. There will be a downfall for the logistics industry if the cost, time, and quality of the cold
chain cannot be guaranteed as neighbouring countries under the condition of high international
or regional connectivity. The cold chain should be promptly improved from various aspects since
the progress of international connectivity suggests an intensification of international
competition in cold chain industries.