eight-year license renewal: trump indiana, inc. · eight-year license renewal: trump indiana, inc....
TRANSCRIPT

Eight-Year License Renewal: Trump Indiana, Inc.
Drew Klacik Laura Littlepage
Seth Payton
Larry DeBoer Purdue University
Charlene Sullivan Purdue University
© 2004 Center for Urban Policy and the Environment 04-C12
342 North Senate Avenue, 3rd Floor Indianapolis, Indiana 46204-1708


i
Eight-Year License Renewal: Trump Indiana, Inc.
July 2004 04-C12
Authors
Drew Klacik Laura Littlepage
Seth Payton
Larry DeBoer Purdue University
Charlene Sullivan Purdue University
Editor Tami Barreto
Executive Summary .......................................................................................................................1
Economic and Fiscal Activity......................................................................................................1 Community Impacts....................................................................................................................1 Employment ...............................................................................................................................1 Business Climate Impacts ..........................................................................................................2 Current Financial Position and Future Plans .............................................................................2
Introduction ...................................................................................................................................3 Economic and Fiscal Activity .........................................................................................................5
Tax Restructuring and Riverboat Tax Payments to Local Governments ......................................5 Admissions Tax ................................................................................................................5 Wagering Tax ...................................................................................................................7
Fiscal Impacts .................................................................................................................................10 Property Tax ..................................................................................................................13
Incentive Payments ..................................................................................................................15 Incentive Payment Certificate Compliance .....................................................................15 Tax Revenue Collected....................................................................................................16
Economic Impact of the Spending of Gaming-Related Local Taxes and Incentive Payments .....16 Economic Impact of the Expenditure of Gaming-Related
Local Taxes and Incentive Payments 2001-2003....................................................17 An Expenditure Category Analysis of Economic Impact..................................................18 Indirect Impact as a Share of Total Impact.....................................................................20 Direct Expenditures and New Wages..............................................................................21 Direct Expenditures and New Jobs.................................................................................22
Community Impacts .....................................................................................................................23 Local Spending and Contributions ............................................................................................23 Community Input......................................................................................................................23 Other Issues.............................................................................................................................24
Employment .................................................................................................................................25 Trump’s Workforce: A Survey of Employees ............................................................................25
An Overview of the Respondents ....................................................................................25 Employment History Prior to Beginning Work at Trump.................................................27 Beginning Work at Trump...............................................................................................30 Current Experience........................................................................................................33
Business Climate Impacts ............................................................................................................39 Data Used for Industry Analysis ...............................................................................................40 Changes in Total Jobs, Establishments, and Wages ..................................................................41 Changing Industry Mix .............................................................................................................44 Inter-Industry Business Climate Change ..................................................................................46

ii
Amusement, Gambling, and Recreation Industry ............................................................48 Other Industries in Lake County Experiencing Considerable Change........................................48 Change in Employment near Trump .........................................................................................53 Summary of Business Impacts .................................................................................................53
Current Financial Position and Future Plans ...............................................................................57 Trump Hotel and Casino Resorts: Description and Strategy ....................................................57 Trump Indiana..........................................................................................................................58 THCR Trends vs. Trump Indiana ...............................................................................................60 Trump Indiana: Historic Performance .....................................................................................60 Trump Indiana Relative to Competitors ....................................................................................62 Summary of Financial Position and Future Plans.....................................................................63
Appendix I: Description of SIC Codes ..........................................................................................65

iii
Index of Figures Figure 1: Turnstile and Multiple Excursion Admissions, July 1998-March 2004 ................................................................................................................ 6 Figure 2: Estimated Adjusted Gross Receipts, Trump, July 1998 - June 2003................................................................................................................... 8 Figure 3: Estimated Expenditure by Type of Public Investment..................................................................................................................................... 18 Figure 4: Direct and Total Economic Activity by Type of Public Investment ..................................................................................................................... 19 Figure 5: Indirect and Induced Impact as a Share of Total Impact (Direct, Indirect, and Induced) by Category ..................................................................... 20 Figure 6: Direct Expenditures per $1 of New Employee Compensation.......................................................................................................................... 21 Figure 7: Direct Expenditures per New Job Created .................................................................................................................................................... 22 Figure 8: Total Number of Individuals in Household ................................................................................................................................................... 26 Figure 9: Highest Level of Education ....................................................................................................................................................................... 27 Figure 10: Employment Status Prior to Beginning Work at Trump ................................................................................................................................ 28 Figure 11: Sector of Employment Prior to Beginning Work at Trump ............................................................................................................................ 29 Figure 12: Reasons for Beginning Work at Trump ..................................................................................................................................................... 30 Figure 13: Beginning Wage at Trump...................................................................................................................................................................... 31 Figure 14: Total Increase in Annual Wage from Previous Job to Start at Trump .............................................................................................................. 32 Figure 15: Current Annual Wages of Trump Employees .............................................................................................................................................. 33 Figure 16: Years Worked at Trump......................................................................................................................................................................... 34 Figure 17: Number of Hours Worked per Week ........................................................................................................................................................ 35 Figure 18: Training and Education Opportunities for Trump Employees.......................................................................................................................... 36 Figure 19: Training Received by Trump Employees by Level of Education ...................................................................................................................... 38 Figure 20: Unemployment Rates for Lake County and Indiana..................................................................................................................................... 40 Figure 21: Comparison of Trends in Total Jobs.......................................................................................................................................................... 42 Figure 22: Comparison of Trends in Total Number of Establishments ............................................................................................................................ 43 Figure 23: Comparison of Trends in Average Wage.................................................................................................................................................... 44 Figure 24: Actual and Scenario-Based Wage Change Comparisons, 1991-2003............................................................................................................. 46 Figure 25: Lake County Trends in Amusement, Gambling, and Recreation Industry (1991-2001) ..................................................................................... 48 Figure 26: A Comparison of Stock Prices between Argosy, Boyd, and Trump.................................................................................................................. 64

iv
Index of Tables Table 1: Graduated Wagering Tax Rates .................................................................................................................................................................... 8 Table 2: Lake County Admissions Tax...................................................................................................................................................................... 11 Table 3: Gary Admissions Tax ................................................................................................................................................................................ 11 Table 4: Gary Wagering Tax .................................................................................................................................................................................. 12 Table 5: Gary Total Revenue, Wagering, and Admissions Taxes ................................................................................................................................... 12 Table 6: Trump Riverboat Property Tax Payments, 1998-2002 ................................................................................................................................... 14 Table 7: Schedule and Description of Incentive Payments ........................................................................................................................................... 15 Table 8: State Direct Taxes.................................................................................................................................................................................... 16 Table 9: Local Direct Taxes .................................................................................................................................................................................... 16 Table 10: Local Spending, Sponsorship, and Contributions.......................................................................................................................................... 23 Table 11: Trump’s Efforts to Prevent Underage Gambling ........................................................................................................................................... 24 Table 12: Employment and Wages ......................................................................................................................................................................... 25 Table 13: Employment Status Prior to Beginning Work at Trump ................................................................................................................................. 27 Table 14: Training and Education by Job Tenure........................................................................................................................................................ 37 Table 15: Proportional Shift in Lake County by Sector................................................................................................................................................ 45 Table 16: Identified Industries and Summary of Changes ........................................................................................................................................... 49 Table 17: Actual Employment in Lake County 2001 Relative to Other Trends................................................................................................................. 50 Table 18: Actual Number of Establishments in Lake County 2001 Relative to Other Trends .............................................................................................. 51 Table 19: Actual Wage in Lake County 2001 Relative to Other Trends.......................................................................................................................... 52 Table 20: Shifts in Employment, Establishments, and Wages near Trump...................................................................................................................... 53 Table 21: Summary of Relative Change by Selected Industries .................................................................................................................................... 55 Table 22: Basic Data 2003 (dollars in millions)........................................................................................................................................................ 60 Table 23: Trump Indiana as Percent of Total Consolidated THCR .................................................................................................................................. 60 Table 24: Operating Performance History, Trump Indiana 2000-2003 (dollars in millions) .............................................................................................. 61 Table 25: Trump Indiana Relative to Peer Operations................................................................................................................................................. 61 Table 26: Trump Indiana Relative to Majestic Star and Horseshoe................................................................................................................................ 62 Table 27: Financial Indicators: A Comparison between Harrah’s, Trump, Boyd, and Aztar................................................................................................ 63

1
Executive Summary
Economic and Fiscal Activity Trump has had a positive fiscal impact on Gary and Lake County. The new tax revenue generated by Trump dramatically exceeds the cost of providing additional services. The changes brought about by tax restructuring—flexible boarding, lower admissions counts, graduated wagering tax rates, limits and floors on riverboat tax revenue—have not affected the local positive fiscal impact. The current lawsuit over property tax issues in Lake County precludes a comprehensive analysis of the fiscal impact of property taxes. Because of this, the impact on schools, which receive only property taxes, cannot be determined, but if it is similar to past trends, it may well be positive, especially if the Gary School Corporation has the excess capacity to serve the few new riverboat pupils at little or no extra cost. Since opening, the spending of local gaming-related taxes and incentive payments has contributed over $274 million of new economic activity in Lake County. Included within this economic impact are an estimated 4,200 jobs and $94 million in local wages. While the short-term economic contributions of the spending of gaming-related taxes and incentives are important, the long-term contributions to the quality of life from investments by the city of Gary in capital equipment, new construction, landscaping, and infrastructure improvements, as well as programs and scholarships, should benefit residents and increase the economic competitiveness of local businesses.
Community Impacts Trump is perceived as a good corporate citizen, spending over $75 million in the area and attracting new visitors to the community. Additionally, Trump has impacted the Gary area through close to a million dollars in sponsorships and contributions to local area organizations. Center staff conducted focus groups with local community and business leaders and social services providers. While there were some differences among the groups, overall the results were positive. They reported that Trump has been a positive addition to the community. It provides well-paying jobs with good benefits as well as economic diversity in a time when steel mill and manufacturing jobs are declining. It provides revenues to local governments that can be used for infrastructure improvement. While it has had a positive environmental impact, assisting in reclamation of the lakefront, some felt that the local communities are parochial and do not provide adequate environmental. They felt that the local communities should get together and form a regional plan for the lakefront and surrounding area and have a long-term strategy. In Gary, there was concern expressed because the mayor was able to change the local agreement without the input of the City Council. There is some concern that the funds have been misspent, and that a stadium was not the best investment.
Employment Trump has provided new employment opportunities for local residents. Trump had 970 employees as of December 31, 2003, and has paid $221 million in wages since opening. In January and February the Center surveyed Trump employees and found that for many employees the employment opportunity at the riverboat provided an increased sense of economic security. For example, 29 percent of the survey respondents were unemployed prior to beginning work at Trump; and over half of those that were employed reported receiving a raise upon beginning work at Trump. The average length of employment

2
was three years and seven months, and 97 employees felt secure enough to move from rental housing to homeownership. While more than half of the employees reported job-related training, fewer employees reported tuition reimbursement opportunities or paying for their own training.
Business Climate Impacts Overall, the numbers of jobs, number of establishments, and average wage per job in Lake County have lagged compared to the trends in the aggregate of the non-riverboat counties. The lagged growth in jobs and establishments began well before the commencement of gaming. The divergence in wage growth relative to the aggregate of non-riverboat counties began approximately the same time as gaming in the county. However, this change is likely due more to the changing industry mix than the inducement of gaming employment in the area. Nineteen out of 100 industries met the criteria for analysis and showed considerable observable change in employment, number establishments, or wages near the time gaming commenced. Most of those industries were in the Manufacturing and Retail Sectors. It is impossible to argue that all of the observable changes documented here occurred because riverboats opened during that time period. Causal relationship between gaming commencement and other industry change is beyond the scope of this report, but it does provide an understanding of the business climate in a county that receives fairly large investments and much attention as a result of gaming in the community. The Executive, Legislative, and other General Government Support, within the Public Administration Sector, was the only industry to have increased faster than both of the other scenarios in employment, number of establishments, and wages.
Current Financial Position and Future Plans The owner of this license is experiencing financial difficulties and, unless the proposed restructuring is completed, is likely to continue facing a serious threat to its economic viability in the coming years. In the immediate future, all the Trump facilities face severe competitive challenges and may suffer from associated cash flow problems, especially if a restructuring of its high cost debt is not successful. The vulnerability of the parent is substantial in the near term. The parent company was extraordinarily levered at the end of 2003 and had the lowest level of revenues relative to assets. Relative to the peer companies, TCHR had an especially low level of cash flow profitability given the amount of debt it had to service, with a fixed charge coverage ratio of only 1:1. The success of the recapitalization is critical to the continued viability of the business. While the financial viability of THCR is at significant risk until the recapitalization of the parent is completed, the successful recapitalization should put the whole THCR operation on much stronger footing. Tight cash flows and a larger exposure to property deterioration in Atlantic City could cause available cash flow to be diverted to those properties or even to the development of new properties such as that in French Lick, Indiana, rather than to the maintenance and upgrading of the Gary facility.

3
Introduction On December 9, 1994, the Commission issued a Certificate of Suitability1 for a Riverboat Owner’s License for two riverboats to be docked in Gary, Indiana. Trump Indiana, Inc. (Trump) opened on June 11, 1996. The Riverboat Gambling Act, effective July 1, 1993, specifies that a licensed owner, after their license is renewed at year five, shall undergo a complete investigation every three years to determine that the licensed owner remains in compliance. The Commission asked the Center for Urban Policy and the Environment (Center) of Indiana University’s School of Public and Environmental Affairs to assist the Commission in performing economic impact, fiscal impact, financial, management, and other analyses to assist the Commission in renewing the riverboat casino licenses. The Center prepared annual evaluation reports for Trump’s first four years of operation as well as a report that analyzed Trump’s first five-years of operation. These reports are available on the Indiana Gaming Commission’s website (www.in.gov/gaming/reports/). This report contains an analysis of Trump’s first eight years of operation. Because this analysis must be completed before the completion of Trump’s eighth year of operations, for year eight, data are shown as 2003.
1 The Certificate of Suitability (Certificate) was the agreement between Trump Indiana and the Indiana Gaming Commission that
gave Trump Indiana its license. The Certificate specified certain levels of project development and incentive payments to be made by Trump Indiana as well as specifying that Trump Indiana abide by agreements made with the local governments.

4
5
Economic and Fiscal Activity The following sections examine the changes brought about by tax restructuring—flexible boarding, lower admissions counts, graduated wagering tax rates, and limits and floors on riverboat tax revenue. They also provide detail regarding the compliance of Trump’s voluntary and mandatory contributions and provide a preliminary analysis to identify and quantify the immediate economic benefits enjoyed by Lake County as a result of the investment of the voluntary and tax contribution of Trump.
Tax Restructuring and Riverboat Tax Payments to Local Governments The Indiana General Assembly passed tax restructuring in its June 2002 special session. Restructuring made a number of dramatic changes in state and local taxation.
• It increased the sales tax and the cigarette tax. • It reformed the corporate income taxes. • It revised the local property tax controls. • It delivered hundreds of millions of dollars in additional property tax relief. • It raised hundreds of millions of dollars to help fill in Indiana’s state budget gap.
In addition, tax restructuring made several changes that affected the taxation of riverboat admissions, wagering receipts and property.
• It allowed riverboats to adopt flexible boarding, also known as dockside gaming, rather than requiring two-hour excursions throughout the day.
• It adopted new, higher graduated tax rates for the wagering tax. • It capped the revenue that host cities and towns could receive from the wagering tax, at the
amount received during the state’s fiscal year 2001-02. • It put a floor on the revenue that host cities, towns and counties could receive from the admissions
tax, at the amount received during the state’s fiscal year 2001-02. • It designated the first $33 million in wagering taxes collected in each state fiscal year for
distribution to non-riverboat counties, cities and towns. • And, it effectively committed Indiana to market value property tax assessment, which affected the
tax rates applied to the assessed value of riverboat property. This section of the report will look at the effect of these changes on the tax revenues paid by the Trump riverboat to Lake County and the city of Gary.
Admissions Tax Tax restructuring left admissions tax rates unchanged at $3 per admission, but allowed riverboats to adopt flexible boarding. Prior to this, riverboats were required to cruise, or operate as if they cruised and were charged admission tax for each cruise. The casino’s doors were closed to entrants for the length of the cruise, whether or not the boat left the dock. With flexible boarding, the riverboat is allowed to remain dockside with its doors open. Patrons may enter at any time they wish. This increased convenience was expected to increase attendance and wagering, and it appears to have done so for most boats.

6
By the first week of August 2002, all of Indiana’s riverboats had applied for and been granted permission to use flexible boarding. Trump began flexible boarding on August 5, 2002. Prior to flexible boarding, all the patrons of each cruise were counted as new admissions, even if the patron simply remained on the boat for more than one cruise. Flexible boarding ended this practice. This meant that the number of admissions, as counted, declined with the advent of flexible boarding, even if the number of patrons increased. Figure 1 shows monthly admissions for the Trump riverboat, July 1998 through March 2004. Figure 1: Turnstile and Multiple Excursion Admissions, July 1998-March 2004
-
50
100
150
200
250
300
350
1998.07 1999.01 1999.07 2000.01 2000.07 2001.01 2001.07 2002.01 2002.07 2003.01 2003.07 2004.01
Thou
sand
s
FlexibleBoarding
Starts
Turnstile Admissions
Multiple Excursions
Turnstile admissions show the actual number of patrons entering the riverboat. Multiple excursions are the added count of these patrons as extra admissions because they took more than one cruise. In August 2002 multiple excursion admissions disappear (Trump continued to count multiple excursions for four days in August 2002). The total number of counted admissions (including multiple excursions) dropped from a monthly average of 275,836 for July 1998 through July 2002, to 141,438 for August 2002 through March 2004, a 48 percent decline. The Trump riverboat does not appear to have seen the expected boost in turnstile admissions from flexible boarding. The average number of turnstile admissions for the four years before flexible boarding was 155,931, and for the period since, 141,438. Flexible boarding would have cost Lake County local units 48 percent of their admissions tax revenue from the Trump riverboat, had the old tax structure remained unchanged. Perhaps in response to this difficulty, the General Assembly fixed the amount of admissions tax revenue to be distributed to riverboat local units at the state fiscal year 2001-02 amount. Indiana Code 4-33-12-6 reads (in part):

7
(h) . . . The treasurer of state shall determine the total amount of money paid by the treasurer of state to an entity subject to this subsection during the state fiscal year 2002. The amount determined under this subsection is the base year revenue. . . . The treasurer of state shall certify the base year revenue determined under this subsection to each entity subject to this subsection. (j) For state fiscal years beginning after June 30, 2002, the total amount of money distributed to an entity under this section during a state fiscal year may not exceed the entity's base year revenue as determined under subsection (h). . . . If the treasurer of state determines that the total amount of money distributed to an entity under this section during a state fiscal year is less than the entity's base year revenue, the treasurer of state shall make a supplemental distribution to the entity under IC 4-33-13-5(g).
And IC 4-33-13-5(g) (version b) reads (in part):
Before September 15 of 2003 and each year thereafter, the treasurer of state shall determine the total amount of money distributed to an entity . . . during the preceding state fiscal year. If the treasurer of state determines that the total amount of money distributed to an entity . . . during the preceding state fiscal year was less than the entity's base year revenue. . . , the treasurer of state shall make a supplemental distribution to the entity from taxes collected under this chapter and deposited into the property tax replacement fund. The amount of the supplemental distribution is equal to the difference between the entity's base year revenue. . . and the total amount of money distributed to the entity during the preceding state fiscal year under IC 4-33-12-6.
For state fiscal year 2003, the State Treasurer certified base year revenue for Lake County at $17,588,954 for all of the county’s riverboats. Of this amount, $13,339,010 was paid from admissions taxes, and the remainder was paid from a distribution from the property tax replacement fund (PTRF). The city of Gary’s certified base year revenue was $6,312,402 from both its riverboats. Of this amount, $4,482,070 was paid from admissions taxes, and the remainder from the PTRF. In addition, the Lake County Convention and Visitor’s Bureau received certified base year revenue of $1,758,880—$1,200,512 from the admissions tax—and the remainder from the PTRF, and the Northwest Indiana Law Enforcement Training Academy received $133,377 in admissions taxes. Trump’s share of Lake County’s admission tax receipts was $2.2 million. Trump’s prorated share of the state PTRF distribution was $1 million. Trump’s share of Gary’s admission tax receipts is the same as for the county, $2.2 million, and its prorated share of the state PTRF was $1 million.
Wagering Tax Tax restructuring allowed riverboats to adopt flexible boarding, which was expected to increase wagering revenue. However, riverboats that adopted flexible boarding (as they all did) would pay wagering taxes under a new set of graduated tax rates. Prior to restructuring the wagering tax rate was a flat 20 percent of adjusted gross receipts (AGR). After restructuring, the rates were set for flexible boarding riverboats as shown in Table 1. The initial rate is 15 percent, less than the old flat rate, but this applies only to the first $25 million of AGR. A 20 percent rate applies to AGR from $25 to $50 million. Above $50 million, rates higher than the pre-restructuring 20

8
percent flat rate apply. The Trump riverboat began paying the 20% rate on October 12, 2002, the 25 percent rate on December 29, 2002, and the 30 percent rate on March 7, 2003.2 Clearly, the new graduated tax rates represent an increase in wagering taxes at Trump.
Table 1: Graduated Wagering Tax Rates
From AGR Amount To AGR Amount Tax Rate $0 $25 million 15%
$25 million $50 million 20% $50 million $75 million 25% $75 million $150 million 30% $150 million And above 35%
Flexible boarding was expected to increase adjusted gross receipts, and a slight increase is apparent for the Trump riverboat. Figure 2 shows the estimated monthly AGR for the period July 1998 through June 2003 (the end of the 2003 state fiscal year). Aside from the jump in AGR in August 2002, the first month of flexible boarding, the range of monthly AGR was $9.8 to $11.6 million, averaging (after August) $10.5 million. In the previous two state fiscal years before the advent of flexible boarding, the range of monthly AGR was lower, $8.1 to $11.5 million, as was the monthly average, $10.2 million. Figure 2: Estimated Adjusted Gross Receipts, Trump, July 1998 - June 2003
$8.0
$9.0
$10.0
$11.0
$12.0
$13.0
$14.0
1998.07 1999.01 1999.07 2000.01 2000.07 2001.01 2001.07 2002.01 2002.07 2003.01
Millio
ns
FlexibleBoarding
Starts
2 There was confusion about when to start counting AGR to determine which graduated rate to use. The fiscal year
began in July, but flexible boarding began in August. Did the AGR in July count towards determining which graduated rate to use? This was cleared up in the 2003 budget bill, which added language to the Indiana Code saying that in any year that flexible boarding was adopted, the AGR shall be counted from the beginning of that fiscal year [(see IC 4-33-13-1.5(g) (version a)].

9
The city of Gary receives a share of wagering tax revenue. Counties do not receive such revenue. Prior to restructuring, Gary received one-quarter of the wagering taxes collected under the flat 20% rate. This share was unchanged by tax restructuring. However, two features were added to the distribution of wagering taxes to local governments which reduce the amount of revenue that Gary realizes from the wagering tax. One, the legislature designated the first $33 million from statewide wagering taxes to be distributed to non-riverboat counties, cities, and towns. The collection of the $33 million starts with the beginning of the state fiscal year in July. Indiana Code 4-33-13-5 (a) reads (in part):
(1) The first thirty-three million dollars ($33,000,000) of tax revenues collected under this chapter shall be set aside for revenue sharing under subsection (e). (2) Subject to subsection (c), twenty-five percent (25%) of the remaining tax revenue remitted by each licensed owner shall be paid:
(A) to the city that is designated as the home dock of the riverboat from which the tax revenue was collected. . . .
Subsection (e) referred to in part (1) describes how the revenue is to be divided up among non-riverboat counties, cities, and towns. In fiscal 2003, the $33 million was not distributed to cities and towns, but was transferred to the state general fund to help balance the state budget. Gary receives 25 percent of wagering tax revenue, after the $33 million has been collected at the beginning of the state fiscal year in July. Trump collects about 5 percent of statewide AGR, so its share of the $33 million is about $1,650,000. Two, the legislature fixed a maximum amount that a city can receive from wagering taxes, at the amount received during the state fiscal year 2001-02. Subsection (c) referred to in section (2) above reads (in part):
. . . The treasurer of state shall determine the total amount of money paid by the treasurer of state to the city or county during the state fiscal year 2002. The amount determined is the base year revenue for the city or county. The treasurer of state shall certify the base year revenue determined under this subsection to the city or county. The total amount of money distributed to a city or county under this section during a state fiscal year may not exceed the entity's base year revenue
The State Treasurer certified base year revenue for Gary at $12,269,626, from both its riverboats. Gary’s wagering tax collections reached this amount by the end of April 2003. The revenue that would have gone to Gary in May and June without this limit was instead deposited in the state’s property tax replacement fund, an amount equal to approximately $2.3 million. Of the total $12.3 million distribution to Gary, approximately $5.3 million was generated by the Trump riverboat. Trump’s wagering taxes contributed about $1 million to the state’s PTRF in May and June 2003.

10
Fiscal Impacts Fiscal impact analysis attempts to determine how a change in policy has affected the revenues and expenditures of a government. How has gaming tax restructuring affected the budgets of Lake County and the city of Gary? We compare three scenarios. First, suppose the policies in effect in 2002 had continued. Suppose there was no flexible boarding, no graduated wagering tax, and no limits or floors on admissions and wagering tax revenue. Riverboats would continue to cruise, with taxable admissions equal to turnstile plus multiple excursion admissions. The wagering tax would remain at a flat 20 percent of adjusted gross receipts. Call this the Old scenario. Second, suppose that flexible boarding and the graduated wagering tax had been adopted without the limits or floors on admissions and wagering tax revenues. Call this the No-Limits scenario. Third, consider what was actually adopted, flexible boarding, turnstile admissions, a graduated wagering tax, a floor on admissions tax revenue and a limit on wagering tax revenue. Call this the Actual scenario. The key to the no-restructuring Old scenario are the assumptions about what would have happened to admissions and adjusted gross receipts. Flexible boarding apparently increased both for most boats, but would either of these tax bases have increased had flexible boarding not been adopted? There appears to have been no clear upward or downward trend in total admissions for the Trump riverboat before flexible boarding. Total admissions were 3.3 million in state fiscal year 2000, 3.0 million in 2001, and 3.2 million in 2002. For the Old scenario, assume 2003 total admissions would have been the same as in 2002. The Majestic and Horseshoe riverboats also are assumed to show no upward admissions trend for the Old scenario. The Harrah’s riverboat is assumed to show a 4.1 percent admissions increase in 2003 for the Old scenario. There appears to have been no clear upward or downward trend in adjusted gross receipts for the Trump riverboat prior to flexible boarding. AGR was $130 million in state fiscal year 2000, $119 million in 2001 and $126 million in 2002. Again, assume 2003 AGR would have been the same as in 2002, for the Old scenario. The Trump riverboat is assumed to increase its AGR 1.9 percent in 2003 for the Old scenario. Tables 2 through 5 show the revenue estimates for the three scenarios for Lake County and Gary. Results are shown for all riverboats in the county and city, since the admissions tax floor and wagering tax ceilings under tax restructuring are calculated based on total receipts to the local unit.

11
Table 2: Lake County Admissions Tax
Old No Limits Actual Trump $3,231,964 $2,233,525 $2,233,525 Majestic 3,080,438 2,248,545 2,248,545 Horseshoe 5,294,238 4,334,603 4,334,603 Harrah's 6,227,589 4,522,337 4,522,337
Tax Revenue
Total $17,834,229 $13,339,010 $13,339,010 Trump 0 0 998,439 Majestic 0 0 831,893 Horseshoe 0 0 959,635 Harrah's 0 0 1,459,977
Plus Supplemental*
Total $0 $0 $4,249,944 Trump 3,231,964 2,233,525 3,231,964 Majestic 3,080,438 2,248,545 3,080,438 Horseshoe 5,294,238 4,334,603 5,294,238 Harrah's 6,227,589 4,522,337 5,982,314
Total Revenue
Total $17,834,229 $13,339,010 $17,588,954 *Amount of the supplemental distribution to cities and counties by the State Treasurer, to bring admissions receipts up to the 2002 level.
Table 3: Gary Admissions Tax
Old No Limits Actual Trump $3,231,964 $2,233,525 $2,233,525 Majestic 3,080,438 2,248,545 2,248,545 Tax Revenue Total $6,312,402 $4,482,070 $4,482,070 Trump 0 0 998,439 Majestic 0 0 831,893 Plus Supplemental* Total $0 $0 $1,830,332 Trump 3,231,964 2,233,525 3,231,964 Majestic 3,080,438 2,248,545 3,080,438 Total Revenue Total $6,312,402 $4,482,070 $6,312,402
*Amount of the supplemental distribution to cities and counties by the State Treasurer, to bring admissions receipts up to the 2002 level.

12
Table 4: Gary Wagering Tax
Old No Limits Actual
Trump $126,000,000 $128,907,546 $128,907,546 Majestic 124,500,000 139,018,797 139,018,797 AGR Total $250,500,000 $267,926,343 $267,926,343 Trump 6,300,000 6,289,008 6,289,008 Majestic 6,225,000 8,280,277 8,280,277 Tax Revenue Total $12,525,000 $14,569,286 $14,569,286 Trump 0 0 992,676 Majestic 0 0 1,306,984 Less Over Limit Total $0 $0 $2,299,660 Trump 6,300,000 6,289,008 5,296,332 Majestic 6,225,000 8,280,277 6,973,294 Total Revenue Total $12,525,000 $14,569,286 $12,269,626
Table 5: Gary Total Revenue, Wagering, and Admissions Taxes
Old No Limits Actual Total Revenue Trump $9,491,964 $8,522,533 $8,528,296 Wagering & Admissions Taxes Majestic 9,305,438 10,528,823 10,053,732 Total $18,797,402 $19,051,356 $18,582,028
Table 2 shows the total riverboat admission tax revenues received by Lake County under each scenario. The Actual scenario does not deliver the most revenue to Lake County. For Lake, the Old scenario delivers slightly more revenue than the Actual scenario. This result depends entirely on the assumption that total admissions was trending upward before flexible boarding (the upward trend for Harrah’s). If there were no upward trend, the Old and Actual scenarios would deliver the same revenue. Further, the certainty with which the revenue would be delivered under the Actual scenario—with any variations in admissions taxes offset by the state’s supplemental distribution—might make it the preferred scenario. Declines in admissions would reduce admissions tax revenue under the Old scenario, but not under the Actual scenario. Flexible boarding is a fact, and without the multiple excursion admissions, Lake would have suffered an enormous $4.3 million loss of revenue had the minimum distribution not been put in place. This is shown in the No-Limits scenario. (Table 2) If turnstile admissions trend upward under flexible boarding, the size of the state’s supplemental distribution will fall. Turnstile admissions under flexible boarding are unlikely to grow enough to match the old total admissions with multiple excursions in the near future, however. Table 5 shows that Gary receives the most combined wagering and admissions tax revenue under the No-Limits scenario, and the Actual scenario delivers the smallest revenue of the three. Gary receives the same admissions tax revenue from each riverboat as Lake County, so the Lake analysis also applies to the city (see Table 3). The Old scenario delivers the same revenue as the Actual scenario to Gary because neither the Trump nor Majestic boats are assumed to have had an upward trend in admissions before restructuring. Since the revenues are the same, the greater certainty of the Actual revenues makes this scenario preferable

13
to the uncertainty of the Old revenues. Table 4 shows that wagering tax receipts under the Actual scenario are slightly less than under the Old scenario. This is because of the assumed increase in AGR (for the Majestic riverboat) in the Old scenario. Gary would receive $2.3 million more in wagering tax revenue under the No Limits scenario than it actually did in 2003. This is because of the upper limit that restructuring placed on wagering tax revenue. The increased AGR due to flexible boarding does not benefit the city because of this limit. In total for Gary, actual revenue is about half a million dollars less than the revenue that would be received under the No Limits scenario. Like Lake, Gary would suffer large losses in admissions tax revenue if flexible boarding were adopted without the state’s revenue floor. The benefit of flexible boarding, however, is in the added AGR, and the state’s limit on wagering tax receipts costs Gary over two million dollars a year. This would more than offset the loss of admissions tax revenue. The difference between the No Limits and Actual scenarios is small for Gary, however, and the added certainty in the Actual scenario may make it the preferred alternative. A formal analysis of costs is not included. Increased attendance might add to city and county costs, through added traffic control requirements, for example. On the other hand, the end of cruises may spread traffic more evenly throughout the day, replacing big increases in traffic every two hours. The effect of flexible boarding on costs is unclear, but is likely to be small. Previous analyses have shown that Indiana’s riverboat taxes are quite generous for the counties and cities hosting riverboats, a fact that tax restructuring has not changed. Riverboats have a positive fiscal impact for host counties and cities. The move to flexible boarding had the potential to make riverboats much less generous for counties, and more generous for cities. The state avoided both possibilities by fixing future revenues at their 2002 levels. Tax restructuring effectively reserved the revenue benefits of added wagering taxes for the state, and for non-riverboat counties, cities and towns.
Property Tax In December 1998, the Indiana Supreme Court found Indiana’s real property tax assessment system to be unconstitutional. Indiana had been assessing real property—land and buildings—for tax purposes using a unique system based on construction costs and depreciation by age. The court found that this system lacked a sufficient relationship to property wealth and was not based on objectively verifiable data. The court did not decide explicitly that Indiana must use a market value system, that is, to assess based on a property’s predicted selling price. In 2002, the State Tax Board (later renamed the Department of Local Government Finance) proposed a non-market value assessment system that (it hoped) would meet the court’s requirements. However, the tax restructuring passed by the General Assembly in the June 2002 special session threw out the main non-market value element of the Tax Board’s proposal.3 Indiana effectively became a market value state. In addition, the legislature increased the amount of state funds devoted to property tax relief. The funds were derived from the increases in the sales tax, cigarette tax,
3 This non-market value element was the “shelter allowance,” which was a fixed dollar amount to be subtracted
from the predicted selling price of each owner-occupied home as part of the assessment calculation. The allowance varied by county. The legislature replaced the shelter allowance with a higher homestead exemption, which is applied after assessments are set.

14
and the higher graduated riverboat wagering tax. Most of the added tax relief was delivered through a higher property tax replacement credit (PTRC) rate. Lake County has not yet completed tax billing for the 2003 calendar year. A private firm was assigned by the state to assess real property in Lake County. This assessment was completed early in 2004. Tax bills were to have been issued in May 2004. However, on May 7 a Lake Superior Court judge halted the tax billing process, based on a finding that the reassessment was unconstitutional. The state appealed to the Supreme Court and on May 28 the Indiana Supreme Court stayed the May 7 decision, allowing Lake County property tax bills to go out based on the reassessment. As of mid-June 2004, the court has scheduled oral arguments, leaving open the possibility it could find the reassessment unconstitutional. Table 6 shows the property tax payments made by the Trump riverboat to all Lake County local governments from 1998 to 2002. With so much uncertainty about tax payments, however, it may be premature to make a formal analysis of the Trump riverboat’s property tax payments under reassessment and tax restructuring.
Table 6: Trump Riverboat Property Tax Payments, 1998-2002 Year Tax Payment 1998 1,588,784 1999 1,632,995 2000 2,102,357 2001 2,602,904 2002 2,595,928
Some general observations can be made based on events in other counties. How a particular taxpayer fares under reassessment depends on how much the taxpayer’s property’s assessed value increases, how much the tax rate falls, and how much property tax relief the taxpayer’s property is eligible for. It appears that reassessment is increasing the assessed values of older residential property, rental property, and farm land more, while the assessed values of other commercial, industrial, and utility property are increasing less. This implies that property taxes will shift from businesses to homeowners, landlords, and farmers. Lake County has some unique features. Its residential property has been historically underassessed, so residential assessments are likely to rise more in Lake than elsewhere. A very large share of Lake County real property has been its steel mills. This industrial property is likely to see smaller real property assessments under any new assessment scheme. The difficulties the steel industry are experiencing make its property worth less. Thus, the tax shifts from industry to homeowners are likely to be larger in Lake than in any other county. Riverboats are commercial property. In most counties owners of such property would pay less after reassessment and restructuring. Tax rates would fall more than assessments would rise, and added tax relief would further reduce tax payments. In Lake County, however, the fall in industrial assessments may make for a relatively small decline in tax rates. Property tax payments by riverboats are likely to decline less in Lake than elsewhere. They may even increase.

15
Incentive Payments The largest impact of Trump in the Gary area (outside of taxes) has been through incentive payments. These payments are the result of agreements that were made with Gary as part of their application process. In its Certificate of Suitability, Trump agreed to provide incentive payments, as detailed below.
Incentive Payment Certificate Compliance As Table 7 illustrates, Trump has provided over $60 million in incentive payments since inception, with the majority falling in the first five years of operation. The economic impact of these contributions to the Lake County economy is discussed in the section below.
Table 7: Schedule and Description of Incentive Payments Category 1996-00 2001 2002 2003 Total Developer’s payment $2,705,000 $0 $0 $0 $2,705,000 Developer’s payment (ninety days after opening) $2,500,000 $0 $0 $0 $2,500,000 Stadium and roadway development $1,857,177 $7,231,887 $4,793,221 $0 $13,882,285 Additional wagering taxes (3% plus 1% of AGR) $24,387,974 $4,167,445 $5,140,297 $5,382,371 $39,078,087 Donation to Trump Foundation $1,300,000 $100,000 $100,000 $100,000 $1,600,000 Donation of police cars $246,950 $0 $0 $0 $246,950 TOTAL $32,997,101 $11,499,332 $10,033,518 $5,482,372 $60,012,322

16
Tax Revenue Collected As Table 8 illustrates, Trump has paid almost $174 million in direct taxes to the state of Indiana since it opened.
Table 8: State Direct Taxes
Category FY1996-02 FY 2003 Total Gaming Tax (State Share) $123,121,105 $23,997,426 $147,118,531 Admission Tax (State Share) $24,331,775 $903,884 $25,235,659 Sales and Use Tax $1,317,971 $312,917 $1,630,888 TOTAL $148,770,851 25,214,227 $173,985,078
In addition, as Table 9 shows, Trump as paid almost $97 million in direct taxes (gaming, admission, and property taxes) to the local area (city and county) since it opened.
Table 9: Local Direct Taxes
Category FY1996-02 FY 2003 Total Gaming Tax (City Share) $35,883,343 $6,134,813 $42,018,156 Admission Tax (County Share) $19,039,561 $2,241,035 $21,280,596 Admission Tax (City Share) $19,039,561 $2,241,035 $21,280,596 Property Tax $10,522,968 $1,672,318 $12,195,286 TOTAL $84,485,432 $12,289,201 $96,774,633
Economic Impact of the Spending of Gaming-Related Local Taxes and Incentive Payments As part of the five-year evaluation, we estimated the economic impact of local gaming-related taxes and incentive revenue spent by local governments and community foundations. As part of the eight-year evaluation, we will present the total eight-year economic impact of expenditures of gaming-related tax and incentive payments and provide a detailed analysis of the economic impact that has occurred since the five-year report. The city of Gary places all gaming-related revenue, including taxes and negotiated contributions from both Trump and Majestic Star into one fund. As a result, this study cannot separately address the economic benefits of each individual boat. Thus this study analyzes the aggregate benefit derived from the spending of locally collected tax dollars and negotiated incentive payments from both Trump and Majestic Star. From Trump and Majestic Star’s opening in June 1996, through December 31, 2003, the estimated economic impact of expenditures of local gaming-related taxes and incentive payments made by the city of Gary have generated:
• $273,699,275 in economic impact, • $94,085,613 of employee compensation, and • 4,187 new jobs (full-time equivalents).
17
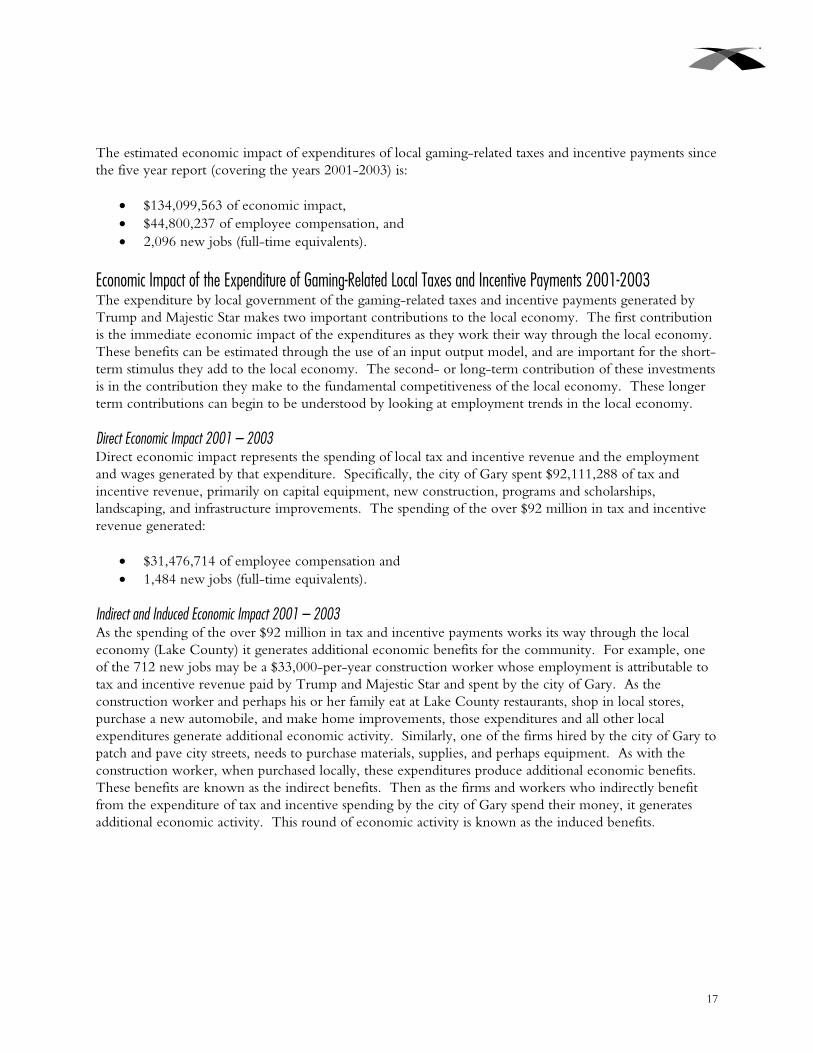
The estimated economic impact of expenditures of local gaming-related taxes and incentive payments since the five year report (covering the years 2001-2003) is:
• $134,099,563 of economic impact, • $44,800,237 of employee compensation, and • 2,096 new jobs (full-time equivalents).
Economic Impact of the Expenditure of Gaming-Related Local Taxes and Incentive Payments 2001-2003 The expenditure by local government of the gaming-related taxes and incentive payments generated by Trump and Majestic Star makes two important contributions to the local economy. The first contribution is the immediate economic impact of the expenditures as they work their way through the local economy. These benefits can be estimated through the use of an input output model, and are important for the short-term stimulus they add to the local economy. The second- or long-term contribution of these investments is in the contribution they make to the fundamental competitiveness of the local economy. These longer term contributions can begin to be understood by looking at employment trends in the local economy. Direct Economic Impact 2001 – 2003 Direct economic impact represents the spending of local tax and incentive revenue and the employment and wages generated by that expenditure. Specifically, the city of Gary spent $92,111,288 of tax and incentive revenue, primarily on capital equipment, new construction, programs and scholarships, landscaping, and infrastructure improvements. The spending of the over $92 million in tax and incentive revenue generated:
• $31,476,714 of employee compensation and • 1,484 new jobs (full-time equivalents).
Indirect and Induced Economic Impact 2001 – 2003 As the spending of the over $92 million in tax and incentive payments works its way through the local economy (Lake County) it generates additional economic benefits for the community. For example, one of the 712 new jobs may be a $33,000-per-year construction worker whose employment is attributable to tax and incentive revenue paid by Trump and Majestic Star and spent by the city of Gary. As the construction worker and perhaps his or her family eat at Lake County restaurants, shop in local stores, purchase a new automobile, and make home improvements, those expenditures and all other local expenditures generate additional economic activity. Similarly, one of the firms hired by the city of Gary to patch and pave city streets, needs to purchase materials, supplies, and perhaps equipment. As with the construction worker, when purchased locally, these expenditures produce additional economic benefits. These benefits are known as the indirect benefits. Then as the firms and workers who indirectly benefit from the expenditure of tax and incentive spending by the city of Gary spend their money, it generates additional economic activity. This round of economic activity is known as the induced benefits.

18
The indirect and induced economic impact of the spending of gaming-related local tax and incentive payments made by Trump and Majestic Star is estimated to have generated an additional:
• $41,988,275 in indirect economic activity, • $13,323,523 in indirect employee compensation, and • 612 indirect new jobs (full-time equivalents).
An Expenditure Category Analysis of Economic Impact While the city of Gary has not been able to provide documentation of how local gaming-related tax and incentive revenue was spent between 2001 and 2003, if the revenue was spent in a similar fashion to spending in the first five years, the vast majority would have been spent on infrastructure (streets, roads, sewers, etc.). Figure 3 projects spending by category based on the assumption that expenditure patterns in the past three years were similar to expenditure patterns of the first five. The remainder of this section of the report will estimate the short-term economic value of each category of investment and compare the indirect benefits (investment, wages, and jobs) of each spending category. Figure 3: Estimated Expenditure by Type of Public Investment
Infrastructure $37,765,628
41%
Equipment $12,895,580
14% Construction$24,870,048
27%
Programs$10,132,242
11%
Parks/Landscaping $6,447,790
7%
Construction Programs Parks/Landscaping Infrastructure Equipment

19
Figure 4 displays the direct and total economic activity estimated to be generated by each category of public expenditure. Figure 4: Direct and Total Economic Activity by Type of Public Investment
$24,870,048
$10,132,242
$6,447,790
$37,765,628
$12,895,580
$35,597,219
$16,044,785
$8,877,690
$55,560,901
$18,018,968
$0 $10,000,000 $20,000,000 $30,000,000 $40,000,000 $50,000,000 $60,000,000
Construction
Programs
Parks/Landscaping
Infrastructure
Equipment
Direct Total

20
Indirect Impact as a Share of Total Impact As in the stock market, different investments in Gary’s local economy will have different rates of return (as measured by share of indirect impact). Figure 5 displays indirect and induced impact as a share of total impact in each category. The share of indirect impact will vary because different types of expenditures engender different local spending behaviors. For example, most programs are very labor intensive and generate much local spending in terms of wages, resulting in a 58 percent rate of return. This means that for every one dollar of gaming-related revenue spent on programs an additional 58 cents of economic activity is generated. Infrastructure investments in Gary generate a 47 percent share of indirect investment, likely losing some value because of the need to purchase supplies from non-local firms, many, and thus having a lower rate of short-term economic return. However, many studies indicated that the long-term benefits of infrastructure investment include higher wages, more jobs, and increased property value. Figure 5: Indirect and Induced Impact as a Share of Total Impact (Direct, Indirect, and Induced) by Category
43%
58%
38%
47%
40%
$-
$0.10
$0.20
$0.30
$0.40
$0.50
$0.60
$0.70
Construction Programs Parks/Landscaping Infrastructure Equipment

21
Direct Expenditures and New Wages Figure 6 displays the amount of direct expenditures required to produce $1 of new local wages. This amount varies because wages vary by industry and because the industry sectors have differing wage versus material and capital equipment expenditure rates. In Gary and Lake County, program expenditures are the most efficient in generating new wages, with only $1.774 of new investment required to generate $1 of new wages. Infrastructure and construction investments, which require a high share of material and equipment expenditures, each require over $2.00 in new expenditures to generate $1 of new wages. Figure 6: Direct Expenditures per $1 of New Employee Compensation
$2.19
$1.77 $1.78
$2.23
$1.80
$-
$0.50
$1.00
$1.50
$2.00
$2.50
Construction Programs Parks/Landscaping Infrastructure Equipment
4 While the same input/output model is used for the Gary and Hammond boats, outputs can vary primarily because of different purchases within aggregated category. For example, the city of Hammond spent a greater share of its equipment purchases on vehicles, which have a higher wage rate than other types of capital investments/capital equipment purchases.

22
Direct Expenditures and New Jobs Figure 7 displays the amount of new expenditures by economic sector required to produce a new job in the local economy. Much of the variance is attributable to the varying degree of labor intensity by economic sector. It is important to understand that while it only requires $19,788 of direct expenditures to create a new landscaping job as compared to over $70,000 to create an infrastructure job, the average wage for a landscaping job is $11,134 while the average wage for an infrastructure related job is $31,364. Figure 7: Direct Expenditures per New Job Created
$65,794
$35,803
$19,778
$70,066
$22,624
$-
$10,000
$20,000
$30,000
$40,000
$50,000
$60,000
$70,000
$80,000
Construction Programs Parks/Landscaping Infrastructure Equipment

23
Community Impacts
Local Spending and Contributions Trump has spent money locally for both capital and operating expenses as well as through sponsorships and contributions. As Table 10 illustrates, since opening, Trump has spent $75 million locally (in Gary). Additionally, Trump has impacted the Gary area through $833,381 in sponsorships and contributions to local area organizations. This figure excludes any contributions that were part of the local development agreement, which are discussed under Incentive Payments.
Table 10: Local Spending, Sponsorship, and Contributions
1996-00 2001 2002 2003 Total Local Spending $47,268,098 $9,286,458 $9,952,073 $8,883,777 $75,390,406 Sponsorships/Contributions $419,000 $119,309 $172,271 $122,801 $833,381
Community Input Another way to determine impact in the local community is to listen to the views of members of the local community. Center staff conducted several focus groups in Lake County with:
• Community leaders from Gary, • Local business leaders (retail, restaurant, hotel, convention from Lake County), and • Social services providers from Lake County.
The questions asked were broad to allow the participants to raise issues of importance to them and covered positive and negative impacts, strengths and weaknesses, and opportunities and threats. While there were some differences among the groups, overall the following themes resonated with all three groups:
• The riverboat casinos have been a positive addition to the community. They: - provide thousands of well-paying jobs with good benefits as well as economic diversity in a
time when steel mill and manufacturing jobs are declining. Some of these jobs are filled by minorities, single parents, and former battered women. In addition, there are constructions jobs that continue to be filled because of continuous improvements at the facilities.
- provide revenues to local governments that can be used for infrastructure improvements. - are good corporate citizens, serving on boards, providing funds for programs, funding
community foundations, have a can-do attitude with current management of boats, creative management willing to try new ideas, companies are sensitive to the downside of gambling.
- provide a safe, comfortable gathering place for seniors in the community. - bring tourists by their presence, as well the marina and golf course. - have a positive environmental impact, assisting in reclamation of the lakefront.
• Small businesses have not seen the positive spin-offs they thought they would. • Bankruptcies and home foreclosures have increased as have the number of pawnshops and payday
loan businesses.
24
• People, including state legislators, think the local government has an abundance of funds, when it still has needs.
• Local communities are parochial and don’t have the best planning. They should get together and form a regional plan for the lakefront and surrounding area and have a long-term strategy.
• In Gary, the mayor was able to change the local agreement without the input of the City Council. There is some concern that the funds have been misspent, that a stadium was not the best investment. There was a discussion of the Gaming Commission taking a more active role in the local agreement process.
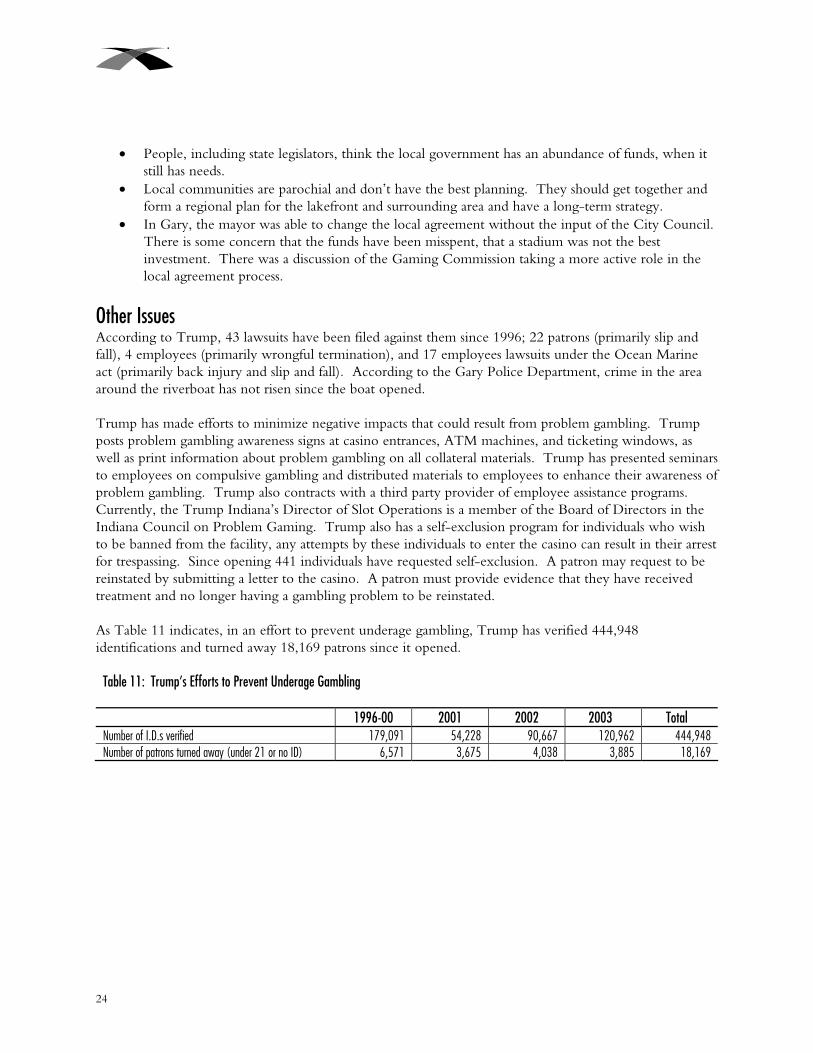
Other Issues According to Trump, 43 lawsuits have been filed against them since 1996; 22 patrons (primarily slip and fall), 4 employees (primarily wrongful termination), and 17 employees lawsuits under the Ocean Marine act (primarily back injury and slip and fall). According to the Gary Police Department, crime in the area around the riverboat has not risen since the boat opened. Trump has made efforts to minimize negative impacts that could result from problem gambling. Trump posts problem gambling awareness signs at casino entrances, ATM machines, and ticketing windows, as well as print information about problem gambling on all collateral materials. Trump has presented seminars to employees on compulsive gambling and distributed materials to employees to enhance their awareness of problem gambling. Trump also contracts with a third party provider of employee assistance programs. Currently, the Trump Indiana’s Director of Slot Operations is a member of the Board of Directors in the Indiana Council on Problem Gaming. Trump also has a self-exclusion program for individuals who wish to be banned from the facility, any attempts by these individuals to enter the casino can result in their arrest for trespassing. Since opening 441 individuals have requested self-exclusion. A patron may request to be reinstated by submitting a letter to the casino. A patron must provide evidence that they have received treatment and no longer having a gambling problem to be reinstated. As Table 11 indicates, in an effort to prevent underage gambling, Trump has verified 444,948 identifications and turned away 18,169 patrons since it opened.
Table 11: Trump’s Efforts to Prevent Underage Gambling
1996-00 2001 2002 2003 Total Number of I.D.s verified 179,091 54,228 90,667 120,962 444,948 Number of patrons turned away (under 21 or no ID) 6,571 3,675 4,038 3,885 18,169

25
Employment In its application, Trump’s goal was to employ 52 percent female employees, 70 percent minority employees, and 90 percent of employees from Lake County. In addition, with the issuance of the riverboat license in Gary, it was expected that the riverboat would have positive employment impacts on its workforce. As of December 31, 2003, 58 percent of Trump’s employees were women, 69 percent were minorities, 44 percent were from Gary, 82 percent from Lake County, with a total of 90 percent from Indiana. As Table 12 indicates, as of December 31, 2003, Trump had employment of 970 persons in both the casino and hotel (including half of Buffington Harbor), below their eight-year average of 1,071. For 2003, salaries and wages were $26.8 million, including tips to dealers (but not to bar and wait staff), and since opening, Trump has paid $221 million in wages, tips, and benefits.
Table 12: Employment and Wages
Category 1996-2000 2001 2002 2003 Average/Total Total Employment 1,222 1,115 975 970 1,071 Wages, tips and benefits $137,095,548 $29,208,962 $28,087,662 $26,834,992 221,227,164 Average wages, tips and benefits per employee $24,931 $26,196 $28,808 $27,665 $27,542
Trump’s Workforce: A Survey of Employees To assist in the eight-year license evaluation of the Trump riverboat casino the Center for Urban Policy and the Environment in January and February 2004 conducted a survey of current Trump employees. Previously, in 2001, the Center conducted a survey of Trump employees for the five-year licensure hearing. The survey and accompanying analysis is intended to assist the Indiana Gaming Commission determine the impact of Trump on the local workforce. The analysis is divided into four topic areas:
1. A brief description of the respondents and their history 2. The respondents employment history prior to beginning work at Trump 3. The initial experience of the respondents upon beginning work at Trump 4. The respondents’ current situation
An Overview of the Respondents Seven hundred sixty-one of Trump’s 970 employees completed the survey. Of those who responded to the question, 311 were male and 417 were female. The average age of those who responded was 33 years and 1 month; the oldest respondent was 77 and the youngest 19. Six hundred fifty-six responded to the question regarding how long they have lived in northwest Indiana. The respondent’s average length of time living in the area was 27 years and 6 months. Only 24 of the respondents had lived in northwest Indiana less than two years and 142 respondents reported living in northwest Indiana for 40 years or more.

26
The most common number of individuals in the respondents’ households was three (27 percent). An additional 37 percent of those responding lived in either one- or two-person households. Figure 8 shows the total number of persons per household. Figure 8: Total Number of Individuals in Household
83
180
196
145
66
24
12
9
0 50 100 150 200 250
1
2
3
4
5
6
7
8 or more
Hous
ehold
Size
Number of Respondents

27
Nearly 84 percent of the respondents reported having earned a high school diploma or having attended some college as their highest level of education. An additional 13 percent reported receiving a college degree. Figure 9 summarizes the educational achievement of all respondents. Figure 9: Highest Level of Education
6
265
366
97
19
0 50 100 150 200 250 300 350 400
Primary school
High school
Some college
Undergraduate degree
Advanced college degree
Employment History Prior to Beginning Work at Trump Based on responses to the eight-year survey, 59 percent were employed full-time prior to beginning work at Trump while 29 percent were unemployed prior to beginning to work at Trump (Table 13).
Table 13: Employment Status Prior to Beginning Work at Trump
Employed full-time prior to beginning work at Trump 59 percent Employed part-time prior to beginning work at Trump 12 percent Unemployed prior to beginning work at Trump 29 percent

28
Figure 10 displays the responses from the eight-year survey as well as responses from the five-year survey. Responses to the eight-year survey are separated into employees who began work since the last survey and evaluation (those who began work less than four years ago) and those who were working at the time of the last survey and evaluation (began work at least four years ago). The comparison suggests that Trump’s hiring practices have remained relatively consistent. Figure 10: Employment Status Prior to Beginning Work at Trump
59%
12%
29%
59%
29%
65%
11%
24%
12%
0% 10% 20% 30% 40% 50% 60% 70% 80% 90% 100%
Full-time
Part-time
Unemployed
Began work in last 4 years Began work at least 4 years ago Responses to previous survey
29
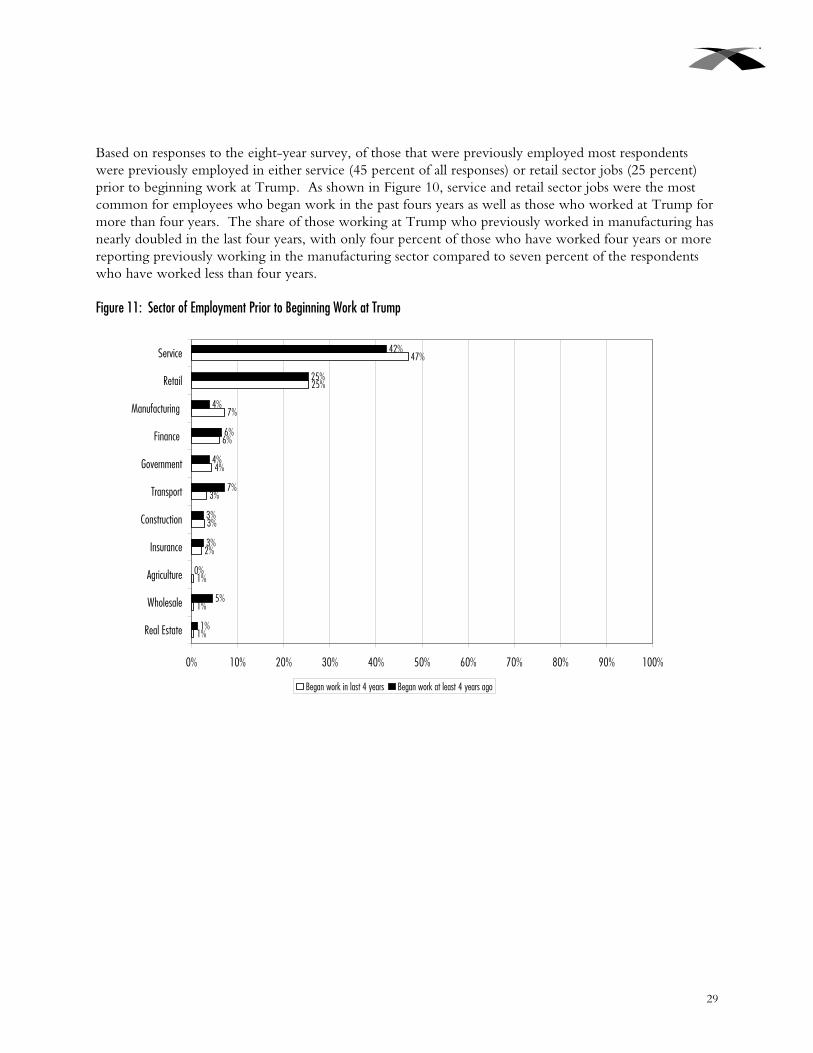
Based on responses to the eight-year survey, of those that were previously employed most respondents were previously employed in either service (45 percent of all responses) or retail sector jobs (25 percent) prior to beginning work at Trump. As shown in Figure 10, service and retail sector jobs were the most common for employees who began work in the past fours years as well as those who worked at Trump for more than four years. The share of those working at Trump who previously worked in manufacturing has nearly doubled in the last four years, with only four percent of those who have worked four years or more reporting previously working in the manufacturing sector compared to seven percent of the respondents who have worked less than four years. Figure 11: Sector of Employment Prior to Beginning Work at Trump
1%
1%
1%
2%
3%
3%
4%
6%
7%
25%
47%
1%
0%
3%
3%
7%
4%
6%
4%
25%
42%
5%
0% 10% 20% 30% 40% 50% 60% 70% 80% 90% 100%
Real Estate
Wholesale
Agriculture
Insurance
Construction
Transport
Government
Finance
Manufacturing
Retail
Service
Began work in last 4 years Began work at least 4 years ago

30
Beginning Work at Trump As shown in Figure 12, the most common reason for beginning work at Trump remains more money. This was true for those who began work less than four years ago (36 percent of all less than four years responses) as well as for those that have worked at Trump for four or more years (46 percent of all four years or more responses). It was also true for the employees that responded to the five-year survey, where 52 percent of all respondents identified more money as the principal reason they began work at Trump. Interestingly, better advancement opportunities received a much higher share of responses from those working less than four years at Trump (26 percent compared to 13 for those that have worked four or more years and 18 percent of those that responded to the five-year survey). This suggests a possible change in local economic conditions or a change in the perception of opportunities at Trump. Figure 12: Reasons for Beginning Work at Trump
154
32
111
67
57
129
19
36
51
46
274
29
97
56
76
0 50 100 150 200 250 300
More Money
Better hours
Advancement opportunity
Better benefits
Closer to home
Less than 4 4 or more Previous Survey

31
There were 545 employees who reported that they work full time and provided a starting annual income for the first year they worked at Trump. The average annual salary for these individuals was $24,605. Two hundred eighty-two or 52 percent reported a beginning annual income of less than $20,000 and an additional 38 percent (or 206) reported a beginning annual income of between $20,000 and $39,999 (Figure 13). Figure 13: Beginning Wage at Trump
282
206
36
21
0 50 100 150 200 250 300
Less than $20,000
$20,000 - $39,999
$40,000 - $59,999
$60,000 or more
Number of Respondents

32
While 48 percent of the 385 respondents that reported both a final wage prior to beginning work at Trump and a beginning wage at Trump reported either no raise or receiving an initial cut in pay, the average increase in wages for all employees who reported both figures upon beginning work at Trump was $2,659. The median increase was $1,000. The much higher average increase was a result of four individuals reporting initial raises of over $50,000. Of the 53 percent that reported receiving raises, 72 or 19 percent reported an initial increase in wages of between $1 and $4,999. An additional 129 individuals reported receiving a raise of $5,000 or more (34 percent) (Figure 14). Figure 14: Total Increase in Annual Wage from Previous Job to Start at Trump
135
49
72
129
0 20 40 60 80 100 120 140 160
Less than $0
$0
$1 - $4,999
$5,000 or more
Number of Respondents

33
Current Experience Five hundred sixty-eight employees who worked 35 hours or more per week provided a current annual salary. Their average wage was $28,863 and the median was $25,000. As shown in Figure 15, 194 or 34 percent make less than $20,000 per year and an additional 272 or 48 percent make between $20,000 and $49,999. In 2001 (the latest date available), the Bureau of Economic Analysis reported that the per capita income in Lake County was $27,521. The 2000 Census reported the median household income in Lake County to be $41,289. Figure 15: Current Annual Wages of Trump Employees
194
272
75
27
0 50 100 150 200 250 300
Less than $20,000
$20,000 to $39,999
$40,000 to $59,999
$60,000 or more
Number of Respondents

34
The average length of employment at Trump for the 707 employees responding to this question was three years and seven months. Figure 16 displays the number of employees and years worked. Over 26 percent have worked at Trump for seven years or more and 42 percent have worked at Trump for 2 years or less. Figure 16: Years Worked at Trump
189
111
59
68
51
44
185
0 20 40 60 80 100 120 140 160 180 200
Less than 1 year
1-2 years
2-3 years
3-4 years
4-5 years
5-6 years
More than 6 years
Number of Respondents

35
As shown in Figure 17, only nine percent or 64 of the 741 respondents to this question reported working less than 35 hours per week at Trump. The vast majority of the respondents (88 percent) are full-time employees, reporting they work between 35 and 50 hours. A small number (26 or four percent) reported working more than 50 hours. Figure 17: Number of Hours Worked per Week
64
522
129
26
0 100 200 300 400 500 600
Less than 35
35 - 40
41 - 50
51 or more
Number of Respondents
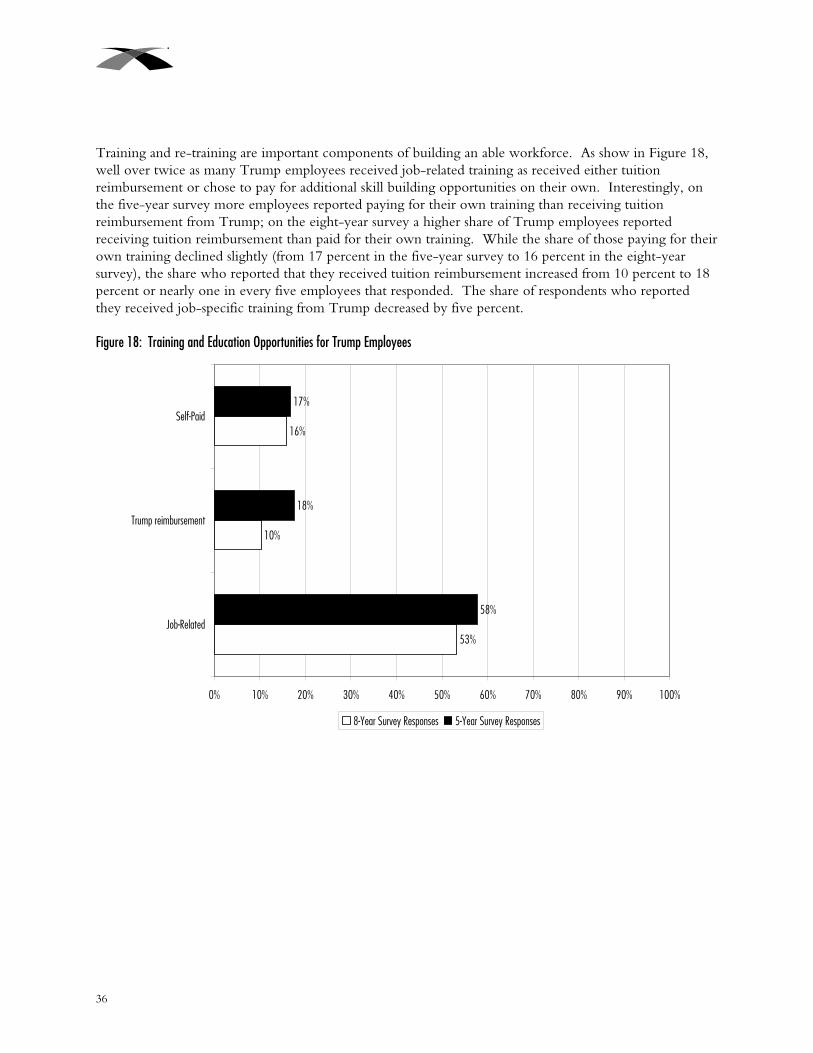
36
Training and re-training are important components of building an able workforce. As show in Figure 18, well over twice as many Trump employees received job-related training as received either tuition reimbursement or chose to pay for additional skill building opportunities on their own. Interestingly, on the five-year survey more employees reported paying for their own training than receiving tuition reimbursement from Trump; on the eight-year survey a higher share of Trump employees reported receiving tuition reimbursement than paid for their own training. While the share of those paying for their own training declined slightly (from 17 percent in the five-year survey to 16 percent in the eight-year survey), the share who reported that they received tuition reimbursement increased from 10 percent to 18 percent or nearly one in every five employees that responded. The share of respondents who reported they received job-specific training from Trump decreased by five percent. Figure 18: Training and Education Opportunities for Trump Employees
53%
16%
58%
18%
17%
10%
0% 10% 20% 30% 40% 50% 60% 70% 80% 90% 100%
Job-Related
Trump reimbursement
Self-Paid
8-Year Survey Responses 5-Year Survey Responses

37
Job-related training was by far the most common form of training received by survey respondents. Forty-seven percent of the respondents working less than four years received job specific training and 64 percent of those working at Trump for four or more years reported receiving job-related training. Tuition-reimbursement programs were the least frequently utilized form of training according to the eight-year survey results, and as might be expected, the likelihood of receiving tuition reimbursement from Trump increased as the number of years worked increased. As shown in Table 14, while eight percent of the respondents that worked less than four years reported receiving tuition reimbursement, 15 percent of those working four or more reported receiving tuition reimbursement. Furthermore, only four percent of respondents who have worked less than one year received training reimbursement from Trump. The likelihood of receiving any form of training increased as the number of years worked at Trump increased.
Table 14: Training and Education by Job Tenure Less than 4 years 4 or more years Job-related 47% 64% Tuition Reimbursement 8% 15% Self-paid 15% 18%

38
When access to training is compared by highest level of educational attainment, it becomes clear that access to all types of training increases as the level of educational attainment increases. For example, the share of those receiving job-related training increased from 50 percent for those with a high school degree to nearly 70 percent for those with a graduate degree or more (there were only six respondents reporting a primary school education). This pattern suggests the possibility of both consumption and provision issues. (Figure 19) Figure 19: Training Received by Trump Employees by Level of Education
50.2%
6.4%
7.5%
56.3%
19.7%
56.7%
16.5%
22.7%
68.4%
26.3%
31.6%
11.2%
0.0% 10.0% 20.0% 30.0% 40.0% 50.0% 60.0% 70.0% 80.0%
Job-related
Tuition reimbursement
Self paid
High School Some College College Graduate Degree
Finally, survey respondents were asked to respond to series of questions designed to provide insight into their sense of economic security. Moving from rental housing to homeownership is a good example of a behavior that exhibits a sense of financial security and 97 respondents reported moving from renter to homeowner since beginning work at Trump. An additional 68 respondents indicated that they moved from one home to another and 125 reported that they made significant home improvements (remodeling/maintenance). The purchase of a car or van is another indicator of economic security and 386 respondents reported they have purchased such a vehicle since beginning work at Trump.
39
Business Climate Impacts Advocates of legalizing Indiana riverboats argued that riverboats would contribute to local economies of stressed areas through newly created job opportunities and promises for increased wages. Advocates also contended that private local business establishments would benefit through increased consumption of goods and services from the influx of casino patrons and employees. Others argued that riverboats would have detrimental effects through cannibalization of existing business establishments. That is, opponents argued that riverboats with attached hotels and restaurants would provide a substitute for local consumption within local riverboat communities. As riverboats provide relatively higher paying jobs, some existing local establishments may not be able to compete for labor. A study released by the Indiana Gambling Impact Study Commission in 1999 found that all Indiana riverboat counties were suffering from lower than normal economic conditions prior to riverboats beginning operations. Following the introduction of riverboats in these counties, the overall employment, wages and number of firms generally were higher or comparable to statewide trends. As Figure 20 illustrates, the unemployment rate in Lake County has been consistently higher than the statewide trend. This analysis expands upon the 1999 Indiana Gambling Impact Study Commission report, focusing on county level employment, wage, and number of establishments by industry using a special aggregation of ES202 data provided by the Indiana Business Research Center.5 This section also shows employment patterns within the direct vicinity of the riverboat location.
5 The ES-202 program produces a comprehensive tabulation of employment and wage information for workers covered by state unemployment insurance laws. Publicly available files include data on the number of establishments, monthly employment, and quarterly wages, by industry, at the three-digit level North American Industry Classification System, by county, by ownership sector, for the entire United States.

40
Figure 20: Unemployment Rates for Lake County and Indiana
7.7%
7.2%
6.6%
5.7%
4.5%4.2% 4.3%
4.6%
5.3%
6.8%
6.0%
5.3%
4.8% 4.7%
4.1%
3.5%3.1% 3.0%
3.2%
4.4%
5.1% 5.1%
0.0%
1.0%
2.0%
3.0%
4.0%
5.0%
6.0%
7.0%
8.0%
9.0%
1993 1994 1995 1996 1997 1998 1999 2000 2001 2002 2003
Lake CountyIndiana
This section complements the economic impact study in this evaluation. The economic benefits measured in that section show direct and total investment of dollars from tax revenues and incentive payments. This section adds a broader perspective of industry change to the discussion. This section identifies industries that have experienced observable changes soon after the commencement of gaming in Lake County. It also shows the total change in employment, number of establishments, and wage change near the riverboat. It is simply a descriptive analysis focused on industry change before and after the commencement of gaming operations. It does not attempt to provide a causal relationship between the establishment of Buffington Harbor (Trump and Majestic Star) and the change in other industries operating in Lake County. In fact, there is evidence that some change is simply a result of changes in industry mix.
Data Used for Industry Analysis The United States Bureau of Labor Statistics (BLS) divides the employment and earnings into industries. Since 2000, the North American Industry Classification System (NAICS) has been the coding structure. The NAICS coding structure allows for hierarchical aggregation based on a six-digit system. All industries can be aggregated to the sector level (two-digit level). There are 21 sectors for which industries are assigned. These sectors can be grouped further into two production categories: Goods Producing and Service Producing. While the coding system allows for six-digit desegregation, the three-digit industry level is the most detailed level of analysis that will be performed in this report. That is the level just below the sector aggregation. For the purposes of this report, the three-digit level will be referred to as the industry level.

41
The data used for this report in years prior to 2001 are a special tabulation provided by the Indiana Business Research Center. These data were recoded from the former Standard Industrial Classification (SIC) coding scheme used during those years. The use of these data is limited, but it is the only source that is available for the trend analyses prepared in this section of the report.
Changes in Total Jobs, Establishments, and Wages Figures 21, 22, and 23 compare trends in total number of jobs, total number of establishments, and average wage per employee between Lake County and the aggregate of non-riverboat counties for the 13- year period beginning in 1991 and ending in 2003. These data reflect third quarter figures. The trend lines take 1991 as the base year and compare each of the following years to those levels. Thus, 1991 as the base year is set to 100, and the subsequent years can be read as annual percentage changes from the base year, much like the consumer price index. The focus on the analysis is on whether or not there are observable changes that occurred after gaming commenced in Lake County and whether or not those changes are divergent from trends during the same time period in the aggregate of non-riverboat counties. While this report focuses on the Trump opening in 1996, it is also important to understand that three other riverboats also began riverboat gaming operations in Lake County in the late 1990s.
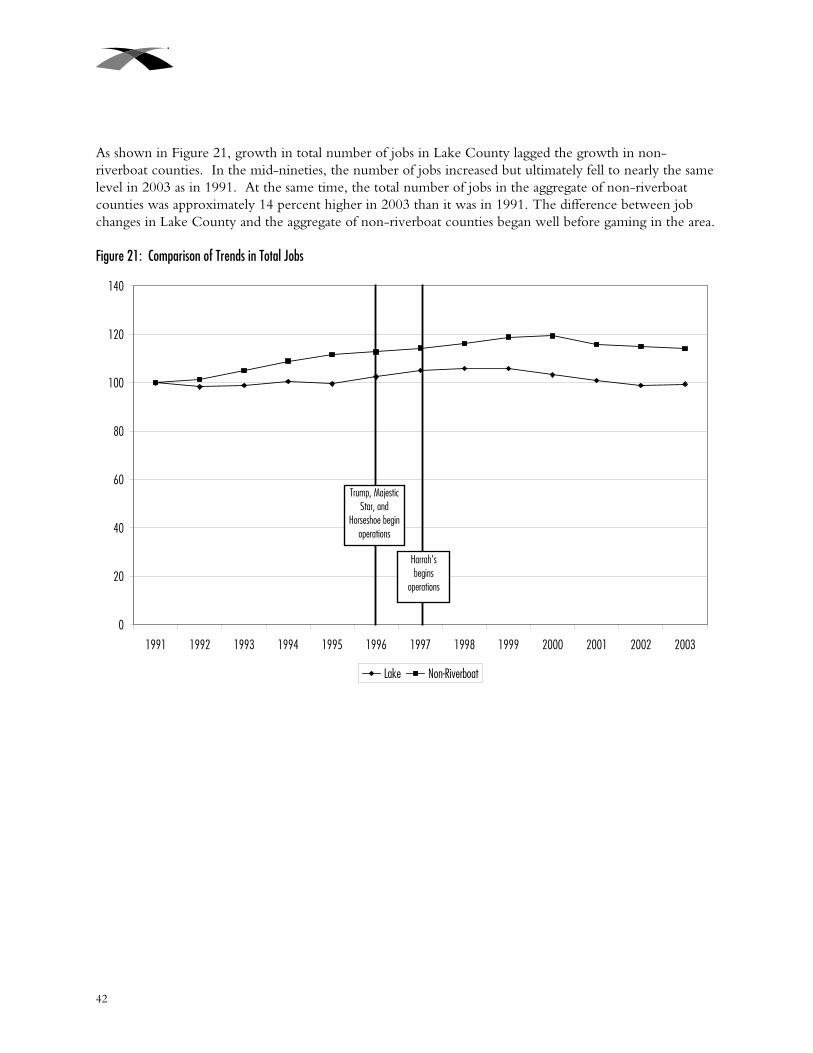
42
As shown in Figure 21, growth in total number of jobs in Lake County lagged the growth in non-riverboat counties. In the mid-nineties, the number of jobs increased but ultimately fell to nearly the same level in 2003 as in 1991. At the same time, the total number of jobs in the aggregate of non-riverboat counties was approximately 14 percent higher in 2003 than it was in 1991. The difference between job changes in Lake County and the aggregate of non-riverboat counties began well before gaming in the area. Figure 21: Comparison of Trends in Total Jobs
0
20
40
60
80
100
120
140
1991 1992 1993 1994 1995 1996 1997 1998 1999 2000 2001 2002 2003
Lake Non-Riverboat
Trump, Majestic Star, and
Horseshoe begin operations
Harrah's begins
operations

43
Figure 22 shows that the total number of establishments in Lake County was five percent greater in 2003 than in 1991. However, that number is less than half of the 12 percent increase in the number of establishments reported in the aggregate of non-riverboat counties over the same time period. The divergence of the Lake County trend from the aggregate non-riverboat county trend began in 1994, two years prior to the opening of the first riverboats in the area. Figure 22: Comparison of Trends in Total Number of Establishments
92
94
96
98
100
102
104
106
108
110
112
114
1991 1992 1993 1994 1995 1996 1997 1998 1999 2000 2001 2002 2003
Lake Non-Riverboat
Trump, Majestic Star, and
Horseshoe begin operations
Harrah's begins
operations

44
While the average wage increased fairly consistently each year in Lake County during the 13-year period, Figure 23 indicates that it began slowing relative to the aggregate of non-riverboat counties around 1996. Even though the slower growth in wages began during the same year as riverboat gaming began, it does not prove causality. It is possible that the slowed job growth and loss in the number of establishments that began early during the study period reflects a relatively less than optimal business climate that began prior to the commencement of gaming. The average wage trend also likely reflects the change in industry mix in the area. Figure 23: Comparison of Trends in Average Wage
0
20
40
60
80
100
120
140
160
1991 1992 1993 1994 1995 1996 1997 1998 1999 2000 2001 2002 2003
Lake Non-Riverboat
Trump, Majestic Star, and
Horseshoe begin operations
Harrah's begins
operations
Changing Industry Mix The industrial mix in employment has changed dramatically over the past few decades. Across the country, the composition of employment has shifted from goods producing industries to service industries. This is also true in Indiana.

45
Table 15 compares the proportional shift in employment in Lake County to the aggregate of non-riverboat counties for the 13-year period beginning in 1991 (five years before riverboat gaming began in Lake County) through 2003. Like the aggregate of non-riverboat counties, Lake County has experienced a shift from manufacturing to service sector employment. However, that shift was five percent greater in Lake County. The greatest negative shift occurred in the Manufacturing Sector of the Goods Producing category. The Health Care and Social Services and the Arts, Entertainment, and Recreation sectors shifted positively in the industry mix. Additional negative shifts occurred in the Finance and Insurance and Transportation and Warehousing sectors. These industry shifts have contributed to the changing wage trends.
Table 15: Proportional Shift in Lake County by Sector Proportion in 2003 Proportional Shift from 1991 to 2003 Lake Non-Riverboat Lake Non-Riverboat Goods Producing 22% 28% -8% -3% Construction 7% 5% -1% 1% Manufacturing 15% 22% -7% -4% Agriculture, Forestry, Fishing, and Hunting 0% 0% 0% 0% Mining 0% 0% 0% 0% Service Producing 78% 72% 8% 3% Health Care and Social Services 14% 12% 3% 2% Educational Services 7% 6% 1% 1% Real Estate and Rental and Leasing 1% 1% 0% 0% Finance and Insurance 3% 4% -2% 0% Information 1% 2% 0% 0% Arts, Entertainment, and Recreation 4% 1% 4% 0% Accommodation and Food Services 8% 8% 0% 1% Other Services (Except Public Administration) 4% 3% 0% 0% Administrative and Support and Waste Management and Remediation Services 5% 5% 1% 1% Professional, Scientific, and Technical Services 3% 3% 0% 0% Management of Companies and Enterprises 1% 1% 0% 0% Public Administration 6% 5% 1% 0% Utilities 1% 0% 1% 0% Retail Trade 13% 12% 0% -1% Wholesale Trade 3% 4% -1% 0% Transportation and Warehousing 4% 4% -2% 0% Unallocated 0% 0% 0% 0%

46
Figure 24 shows comparisons of actual change in wages during the 13-year period relative to the actual aggregate of non-riverboat counties and two other scenarios. Scenario 1 shows the wage increase that would have occurred if there had not been a change in industry mix since 1991. Scenario 2 indicates the increase in wages that would have occurred if the industry mix was the same in Lake County as in the non-riverboat counties in 2003. As shown, if the industry mix had remained the same in Lake County as in 1991, the average wage would have increased by 47 percent rather than the actual 38 percent. That scenario also would have increased faster than the expected wage increase if the 2003 industry mix of Lake County was the same as the aggregate of non-riverboat counties. Due to the wage structure of the Lake County’s economy, none of the scenarios would have provided an increase equal to the aggregate of non-riverboat counties. Figure 24: Actual and Scenario-Based Wage Change Comparisons, 1991-2003
47%46%
38%
0
0.1
0.2
0.3
0.4
0.5
0.6
Actual Same as 91 Same as Non-riverboat
Lake County Non-riverboat
Inter-Industry Business Climate Change This section of the analysis provides a perspective of the business climate at the major industry level. This perspective offers insight into whether or not specific industries within previously outlined sectors have experienced substantial changes in number of jobs, number of establishments, and average wage per job after the commencement of gaming. While more insightful, analyzing the data at the industry level is also much more complex. Most of the complexity exists because of data suppression. The ES202 data are suppressed if an industry has less than three firms or if one firm accounts for over 80 percent of industry employment. Data are suppressed to protect the privacy of individual firms. Even when all data are disclosed, some industries are too small and

47
volatile to recognize any consistent trends. As a result of these complexities, specific industries had to meet two criteria before being included in the analysis.
• Criterion 1: Data for specific industries had to be disclosed in at least two of the years between 1996 and 2001. To be included in the aggregate of non-riverboat county comparison, a specific industry within a given county had to be disclosed for every year between 1991 and 2001.
• Criterion 2: In addition to criterion 1, the number of jobs or establishments within specific industries had to account for at least 0.5 percent of the total for the county in at least one of the years between 1991 and 2001.
After meeting these criteria, the analysis began with a comparison of change in industry employment from 1991 to 1996 (before the riverboat), 1996 to 2001 (change after gaming). Based on the change during these time periods, a comparability index was constructed. The comparability index is equal to the percentage change in employment in Lake County from one time period to the next time period minus the percentage change during the same time periods in the non-riverboat counties. This index measures whether or not an industry in Lake County experienced comparable employment trends following the operation of the Buffington Harbor riverboats (Majestic Star and Trump) in Gary. If an industry had an index score less than -5 or greater than 5 between 1996 and 2001, it was examined further. Further examination of those industries focused on whether or not each showed observable change before and after 1996. Again, the focus of this analysis is on trends that show observable divergence from the aggregate non-riverboat comparison before and after the commencement of gaming activities. It is not a study of causal relationships of riverboat gaming.

48
Amusement, Gambling, and Recreation Industry The Amusement, Gambling, and Recreation Industry was one of the industries that experienced considerable change in Lake County in 1996.6 It deserves special attention because it is the industry in which the riverboat operations are assigned. Much of the change in this industry is certainly due to the addition of the riverboats in the county. As Figure 25 indicates, there was a very large increase in employment (up over 8,000 by 2001) while the number of establishments did not fluctuate as much. Wages also increased fairly drastically in 1996, the first year of riverboat gaming in Lake County. Figure 25: Lake County Trends in Amusement, Gambling, and Recreation Industry (1991-2001)
0
100
200
300
400
500
600
700
1991 1992 1993 1994 1995 1996 1997 1998 1999 2000 2001
Jobs Establishments Wage
Other Industries in Lake County Experiencing Considerable Change Eighteen other industries were found to have observable changes in 1996 that were not comparable to trends in the aggregate of non-riverboat counties.7 Table 16 identifies those industries. It also indicates the sector in which each industry is categorized and the absolute change in employment, number of establishments, and average wage from 1996 to 2001. Most of the industries that experienced divergent trends were within the manufacturing sector (seven industries). All of those industries experienced a negative change in employment and only two of those industries did not lose establishments. The Food Service and Drinking Places, Food and Beverage Stores, Wholesale Electronic Markets and Agents and
6 The trend lines take 1991 as the base year and compare each of the following years to those levels. Thus, 1991 as the base year is set to 100, and the subsequent years can be read as annual percentage changes from the base year, much like the consumer price index. 7 See Appendix I for description of each industry

49
Brokers, and Motor Vehicle and Parts Dealers also lost employment and establishments. The Nonstore Retailer industry was the only industry in which the wage was lower in 2001 than in 1996. Selected industries in which employment grew relatively more quickly after 1996 include, Nursing and Residential Care Facilities; General Merchandise Stores; and Executive, Legislative, and other General Government Support.
Table 16: Identified Industries and Summary of Changes
Wage Change 1996-2001
Industry
Employment Change
1996-2001
Establishment Change
1996-2001 Weekly Average
Annual Average
Manufacturing Sector Transportation Equipment Manufacturing -709 -2 $187 $9,724 Machinery Manufacturing -537 2 $86 $4,472 Food Manufacturing -365 -5 $217 $11,284 Chemical Manufacturing -344 -1 $151 $7,852 Nonmetallic Mineral Product Manufacturing -52 2 $113 $5,876 Printing and Related Support Activities -45 -2 $155 $8,060 Paper Manufacturing -13 -1 $181 $9,412 Wholesale Trade Sector Wholesale Electronic Markets and Agents and Brokers -298 -32 $145 $7,540 Retail Trade Sector Food and Beverage Stores -521 -18 $29 $1,508 Motor Vehicle and Parts Dealers -313 -15 $146 $7,592 Nonstore Retailers 8 -10 -$156 -$8,112 Health and Personal Care Stores 59 -8 $54 $2,808 General Merchandise Stores 755 0 $55 $2,860 Health Care and Social Assistance Sector Hospitals 59 -1 $117 $6,084 Nursing and Residential Care Facilities 437 3 $60 $3,120 Accommodation and Food Services Food Services and Drinking Places -941 -53 $37 $1,924 Accommodation 7 6 $86 $4,472 Public Administration Executive, Legislative, and Other General Government Support 1,440 6 $108 $5,616

50
Table 17 indicates the changes in employment in more detail for the selected industries. The first column after the industry name shows the actual employment in 2001. The next two columns show what employment in 2001 would be for each of the industries if: (1) each industry followed the same trend after 1996 as experienced from 1991 to 1996 and (2) each industry followed the same trend between 1996 and 2001 as did the aggregate of non-riverboat counties. The last two columns show the difference between the actual employment and the employment under the other scenarios, respectively. If the numbers in the last two columns are positive, then Lake County is better off than it would be under either of the other scenarios. If the same numbers are negative, then that industry is worse off.
Table 17: Actual Employment in Lake County 2001 Relative to Other Trends
Total Employment if Change in
Employment Was Equal to: Difference between
Actual and:
Industry Actual
Average 1991-1996 Trend in Lake County
Trend in Aggregate Non-Riverboat
Counties 1996-2001 1991-1996
Trend Non-Riverboat
Trend Hospitals 11,111 12,357 12,350 -1,246 -1,239 Food Services and Drinking Places 13,671 15,903 14,902 -2,232 -1,231 Transportation Equipment Manufacturing 1,011 2,770 1,612 -1,759 -601 Machinery Manufacturing 8,79 2,025 1,284 -1,146 -405 Food Manufacturing 1,242 1,611 1,496 -369 -254 Nonmetallic Mineral Product Manufacturing 1,097 1,320 1,208 -223 -111 Chemical Manufacturing 1,352 1,560 1,445 -208 -93 Health and Personal Care Stores 1,932 1,778 2,020 154 -88 Motor Vehicle and Parts Dealers 3,164 4,398 3,241 -1,234 -77 Wholesale Electronic Markets and Agents and Brokers 486 829 520 -343 -34 Printing and Related Support Activities 402 526 402 -124 0 Accommodation 1,275 1,553 1,264 -278 11 Paper Manufacturing 286 84 245 202 41 Nonstore Retailers 510 361 413 149 97 Food and Beverage Stores 5,006 5,323 4,837 -317 169 General Merchandise Stores 4,858 4,348 4,417 510 441 Nursing and Residential Care Facilities 4,328 5,768 3,736 -1,440 592 Executive, Legislative, and Other General Government Support 9,070 7,309 8,281 1,761 789
As shown, Hospitals and Food Services and Drinking Places were the largest employers of the identified industries in 2001. Using the non-riverboat trend as the comparison, those industries also experienced the largest absolute difference between actual employment and what employment would have been under the other two scenarios. If the Hospital industry had grown at the same rate between 1996 and 2001 as it did between 1991 and 1996 (12,357 jobs), it would have kept pace with the trends experienced in the aggregate of non-riverboat counties (12,350 jobs). Three of the selected industries that performed worse than if trends had been the same as from 1991 to 1996 in Lake County, still performed better than the aggregate of non-riverboat counties. Those industries include: Accommodation; Food and Beverage Stores; and Nursing and Residential Care Facilities.

51
Four industries performed better than under either scenario. One of those industries was government support, technically coded as Executive, Legislative, and Other General Government Support. The other industries include, Paper Manufacturing; Nonstore Retail; and General Merchandise Stores. Table 18 compares the number of establishments for the selected industries. Twelve of the 18 selected industries had fewer firms in 2001 than if change had occurred at the same pace as between 1991 and 1996. Nine industries had fewer establishments than if they had changed at the same rate as the aggregate of non-riverboat communities. The Food Services and Drinking Places industry faired the worst relative to the other two scenarios. Other industries that slowed relative to both other scenarios include: Motor Vehicle and Parts Dealers; Health and Personal Care Stores; Wholesale Electronic Markets and Agents and Brokers; General Merchandise Stores; Nonstore Retailers; Transportation Equipment Manufacturing; Paper Manufacturing; and Hospitals. The industries that have more establishments than if they had performed like the aggregate of non-riverboat counties include: Chemical Manufacturing; Machinery Manufacturing; Accommodation; Nursing and Residential Care Facilities; Printing and Related Support Activities; Executive, Legislative, and other General Government Support; and Food and Beverage Stores.
Table 18: Actual Number of Establishments in Lake County 2001 Relative to Other Trends
Total Employment if Change in
Employment Was Equal to: Difference Between
Actual and:
Industry Actual
Average 1991-1996 Trend in Lake County
Trend in Aggregate Non-Riverboat
Counties 1996-2001 1991-1996
Trend Non-Riverboat
Trend Food Services and Drinking Places 743 935 788 -192 -45 Motor Vehicle and Parts Dealers 176 192 187 -16 -11 Health and Personal Care Stores 115 122 122 -7 -7 Wholesale Electronic Markets and Agents and Brokers 86 118 92 -32 -6 General Merchandise Stores 55 57 59 -2 -4 Nonstore Retailers 30 33 33 -3 -3 Transportation Equipment Manufacturing 9 10 10 -1 -1 Paper Manufacturing 5 6 6 -1 -1 Hospitals 9 11 10 -2 -1 Food Manufacturing 26 25 26 1 0 Nonmetallic Mineral Product Manufacturing 36 30 36 6 0 Chemical Manufacturing 23 27 22 -4 1 Machinery Manufacturing 41 41 38 0 3 Accommodation 38 29 35 9 3 Nursing and Residential Care Facilities 58 86 54 -28 4 Printing and Related Support Activities 41 41 37 0 4 Executive, Legislative, and Other General Government Support 37 28 31 9 6 Food and Beverage Stores 205 227 197 -22 8

52
Table 19 compares the average wage per job for the selected industries. The Nonstore Retailers; Nursing and Residential Care Facilities; Food and Beverage Stores; Nonmetallic Mineral Product Manufacturing; Machinery Manufacturing; Health and Personal Care Stores; Accommodation; and Chemical Manufacturing were the only identified industries that paid less on average than if the growth in wage per job had continued at the same rate as between 1991 and 1996. Seven of the 19 industries did not keep pace with wages of the aggregate of non-riverboat counties.
Table 19: Actual Wage in Lake County 2001 Relative to Other Trends
Total Employment if Change in
Employment Was Equal to: Difference Between
Actual and:
Industry Actual
Average 1991-1996 Trend in Lake County
Trend in Aggregate Non-Riverboat
Counties 1996-2001 1991-1996
Trend Non-Riverboat
trend Nonstore Retailers $30,732 $67,324 $51,148 $(36,592) $(20,416) Hospitals $34,164 $34,075 $36,537 $89 $(2,373) Nursing and Residential Care Facilities $19,188 $19,547 $21,186 $(359) $(1,998) Food and Beverage Stores $15,288 $16,751 $16,349 $(1,463) $(1,061) Nonmetallic Mineral Product Manufacturing $39,156 $39,443 $40,005 $(287) $(849) General Merchandise Stores $15,236 $13,208 $15,653 $2,028 $(417) Machinery Manufacturing $36,816 $41,395 $36,998 $(4,579) $(182) Food Services and Drinking Places $9,932 $9,414 $9,514 $518 $418 Executive, Legislative, and Other General Government Support $26,728 $26,212 $26,116 $516 $612 Health and Personal Care Stores $23,920 $27,650 $23,301 $(3,730) $619 Motor Vehicle and Parts Dealers $34,528 $29,814 $33,292 $4,714 $1,236 Accommodation $16,900 $18,564 $15,289 $(1,664) $1,611 Chemical Manufacturing $61,776 $63,400 $59,585 $(1,624) $2,191 Wholesale Electronic Markets and Agents and Brokers $45,760 $45,309 $43,165 $451 $2,595 Printing and Related Support Activities $30,472 $25,897 $26,627 $4,575 $3,845 Transportation Equipment Manufacturing $39,000 $35,446 $33,950 $3,554 $5,050 Paper Manufacturing $43,680 $43,014 $38,440 $666 $5,240 Food Manufacturing $38,688 $32,454 $31,640 $6,234 $7,048 Three of the industries in which the average wage was less than it would have been if it had experienced the same growth between 1996 and 2001 as occurred during 1991 through 1996, still performed better than if they had mirrored the aggregate non-riverboat county wage growth. Those industries included: Health and Personal Care Stores; Accommodation; and Chemical Manufacturing. Eight industries experience greater actual average wage increases than if they had experienced the same change under either of the other scenarios. Those industries include: Food Services and Drinking Places; Executive, Legislative, and Other General Government Support; Motor Vehicle and Parts Dealers; Wholesale Electronic Markets and Agents and Brokers; Printing and Related Support Activities; Transportation Equipment Manufacturing; Paper Manufacturing; and Food Manufacturing.

53
Change in Employment near Trump The comparable industry trend data do not exist for geographic boundaries lower than the county level. However, there are data that allow for comparisons to total employment, total number of establishments, and total wage by ZIP code. These data, taken from the U.S. Bureau of the Census ZIP Business patterns, were used in this analysis to estimate the total for each of those indicators within 1-mile, 2-mile, 3-mile, 4-mile, and 5-mile radii around the Buffington Harbor. The estimates are calculated by the percentage of the area of each ZIP code within the respective radii. Table 20 shows that an estimated 8.2 percent of all jobs and 4.9 percent of all establishments are located within a 5-mile radius around the riverboat. Most of those jobs and establishments are between three and five miles from the riverboat. Almost 11 percent of all wages paid in Lake County were within five miles of the Buffington Harbor. As might be expected from the observation of jobs and establishments, most of that 11 percent is paid to jobs within three and 5 miles from the riverboat. Proportionally, there has been a shift of employment, establishments, and wages away from the studied area. Due to lack of data, it is not yet possible to determine the industries in which these shifts have occurred.
Table 20: Shifts in Employment, Establishments, and Wages near Trump
2001 Proportion Shift 1996-2001 Cumulative Proportions Shift Employment < 1 mile 0.4% -0.1% 0.4% -0.1% 1-2 mile 0.5% -0.1% 0.9% -0.2% 2-3 mile 0.8% -0.2% 1.7% -0.5% 3-4 mile 2.4% -0.3% 4.1% -0.7% 4-5 mile 4.2% -0.3% 8.2% -1.0% > 5 mile 91.8% 1.0% 100% Establishments < 1 mile 0.4% 0.0% 0.4% 0.0% 1-2 mile 0.5% 0.0% 0.9% 0.0% 2-3 mile 0.9% 0.0% 1.8% 0.0% 3-4 mile 1.4% -0.1% 3.2% -0.1% 4-5 mile 1.8% -0.2% 4.9% -0.3% > 5 mile 95.1% 0.3% 100% Wage < 1 mile 0.5% -0.2% 0.5% -0.2% 1-2 mile 0.6% -0.2% 1.0% -0.4% 2-3 mile 1.0% -0.4% 2.0% -0.8% 3-4 mile 3.0% -0.8% 5.0% -1.6% 4-5 mile 5.6% -1.4% 10.7% -2.9% > 5 mile 89.3% 2.9% 100%
Summary of Business Impacts Overall, the numbers of jobs, number of establishments, and average wage per job in Lake County have lagged compared to the trends in the aggregate of the non-riverboat counties. The lagged growth in jobs and establishments began well before the commencement of gaming. The divergence in wage growth relative to the aggregate of non-riverboat counties began approximately the same time as gaming in the

54
county. However, this change is likely due more to the changing industry mix than the inducement of gaming employment in the area. Amusement, Gambling, and Recreation Industry was one of the industries that showed considerable change after gaming began in Lake County in 1996. Obviously, the change is due to the addition of riverboats in the area. Employment and wages grew very rapidly in that industry post riverboat gaming. Eighteen other industries met the criteria for analysis and showed considerable observable change in employment, number establishments, or wages near the time gaming commenced. Most of those industries were in the Manufacturing and Retail Sectors. It is impossible to argue that all of the observable changes documented here occurred because riverboats opened during that time period. Causal relationship between gaming commencement and other industry change is beyond the scope of this report. This study, however, provides an understanding of what the business climate is in a county that receives fairly large investments and much attention as a result of gaming in the community. Table 21 provides a summary of change in selected industries, which exhibited considerable change around the same time as the commencement of gaming. Specifically, the table shows whether or not an industry had positive change after the commencement of gaming relative to the change in only Lake County five years prior (Lake), relative to only the aggregate of non-riverboat counties (non-riverboat), relative to both the change in the county five years prior and the change five years after in the non-riverboat counties (both), or positive change relative to neither of the two scenarios (neither). The bottom section of the table shows the count by employment, establishment, and wage. The table also scores each industry. The score is the sum of the three indicators based on the following conditions: Lake (1 point), Non-riverboat (1 point), Both (2 points), and Neither (-2 points).

55
Table 21: Summary of Relative Change by Selected Industries
Industry Jobs Establishments Wage Score Nonmetallic Mineral Product Manufacturing Neither Lake Neither -3 Hospitals Neither Neither Non-Riverboat -3 Nonstore Retailers Both Neither Neither -2 Machinery Manufacturing Neither Both Neither -2 Food Services and Drinking Places Neither Neither Both -2 Motor Vehicle and Parts Dealers Neither Neither Both -2 Transportation Equipment Manufacturing Neither Neither Both -2 Wholesale Electronic Markets and Agents and Brokers Neither Neither Both -2 Health and Personal Care Stores Lake Neither Non-Riverboat 0 Food and Beverage Stores Lake Non-Riverboat Neither 0 Chemical Manufacturing Neither Non-Riverboat Non-Riverboat 0 Nursing and Residential Care Facilities Non-Riverboat Lake Neither 0 General Merchandise Stores Both Neither Lake 1 Food Manufacturing Neither Lake Both 1 Paper Manufacturing Both Neither Both 2 Printing and Related Support Activities Neither Both Both 2 Accommodation Lake Both Non-Riverboat 4 Executive, Legislative, and Other General Government Support Both Both Both 6 Both 4 4 8 Lake 3 3 1 Non-Riverboat 1 2 4 Neither 10 9 5
Most of the selected industries grew at a slower rate after the beginning of gaming operations and slower than the non-riverboat trend for the same time period (Neither in table above). Four industries performed better than both before gaming operations in the county began and the non-riverboat trend. Most of the industries’ wages per job grew faster than they would have in the scenarios (trend in Lake County before gaming and trend of non-riverboat gaming). The Executive, Legislative, and other General Government Support, within the Public Administration Sector, was the only industry to have increased faster than both of the other scenarios in employment, number of establishments, and wages. Others that placed positively on the positive growth score were General Merchandise Stores, Food Manufacturing, Paper Manufacturing, Printing and Related Support Activities, and Accommodation. Eight of the industries received negative placing under the scoring system. The industries that received negative competitive scores were Nonmetallic Mineral Product Manufacturing, Hospitals, Nonstore Retailers, Machinery Manufacturing, Food Services and Drinking Places, Motor Vehicle and Parts Dealers, Transportation Equipment Manufacturing, and Wholesale Electronic Markets and Agents and Brokers. Eight percent of jobs, five percent of establishments, and almost 11 percent of wages in Lake County are located within a 5-mile radius of Buffington Harbor. Most of that activity is between three and five miles from the riverboat. Since 1996, there has been a shift of jobs away from this area. Future data availability

56
will allow for more detailed analyses that indicate which industries are experiencing those shifts, either positively or negatively.

57
Current Financial Position and Future Plans Trump Hotel and Casino Resorts, Inc. has applied for a renewal of its gaming license in Gary, Indiana. The purpose of this report is to provide the Indiana Gaming Commission with assessments of the financial position of the parent, Trump Hotel and Casino Resorts (THCR) and the financial viability of Trump Indiana, Inc., for the period from 2004-2006.
Trump Hotel and Casino Resorts: Description and Strategy Trump Hotel and Casino Resorts (THCR) is a publicly traded gaming company, formed in June 1995 that owns and/or manages five casino properties, three of which are located in Atlantic City, New Jersey with the fourth located in Indiana, approximately 25 miles from Chicago. The company manages a casino in Coachella, California, called Trump 29. In total, THCR properties include 451,276 square feet of gaming space with 13,736 slot machines and 435 gaming tables. At December 2003, the company employed 8,564 full-time equivalent employees. In 2003, THCR’s Atlantic City casino operations lost market share to new entrants, a development that threatened the economic viability of the whole company. The Borgata, a joint venture between MGM Grand and Boyd Gaming, become the first new casino in Atlantic City in 13 years and is the first of several planned developments in Atlantic City. THCR incurred an operating loss of $87.3 million on $1.2 billion in revenues in 2003. This was the third consecutive year of operating losses for the company. In its 2003 annual report the THCR audit firm attached a note saying that Trump Hotel’s financial condition raises “substantial doubt about the company’s ability to continue as a going concern.” THCR has substantial long-term debt; at $1.8 billion with little equity cushion ($5.6 million in book value at the end of 2003). Consequently losses associated with new competitive threats in Atlantic City have made it so that THCR properties have not been renovated or kept to a competitive standard. Additionally, the company states that it has no short-term debt capacity available. In the last two years, most capital expenditures completed by the company have involved capital leases. At the end of 2003, the company’s long-term debt outstanding relative to its operating performance, measured as EBITDA, exceeded a multiple of 5.3. This development triggered a re-pricing clause in the TAC note contract, which caused the interest rate on the Trump Atlantic City (TAC) note to increase by 1 percent. The rate increase came at the same time that the THCR entity was suffering from increased competition in the Atlantic City market. Operating cash flow (EBITDA) for the year was $253.4 million but interest expense for the year was $221 million. The higher interest expense anticipated for 2004 and intense competition in Atlantic City forced THCR into a position of seeking the recapitalization of its debt with the proposed infusion of equity capital. The interest obligation payable on the TAC debt, due on May 2004 and November 2004, is $73.1 million semi annually. In February 2004, THCR entered into an exclusivity agreement with DLJ Merchant Banking Partners III, LP in connection with a proposed $400 million cash investment by DLJ for a controlling equity position in THCR. At the time of the announcement of the agreement, THCR had a total market value of equity of $76.3 million and Donald J. Trump had a 54.5 percent equity stake in the firm. The company had $1.845 billion in long-term debt outstanding with $1.3 billion due in 2006 (the TAC note). At December 31, 2003, the company had $95.7 million in cash and cash equivalents.

58
THCR is a holding company with two main operating subsidiaries: Trump Atlantic City (TAC) and Trump Casino Holdings (TCH). TCH generated revenue of $383 million in 2003, had interest expense of $72 million and total assets of $633 Million. TCH has total debts of $510.8 million and total operating cash flow of $78.4 M in 2003. The TCH debt was refinanced in March 2003. TCH holds Trump Marina, and Trump Indiana. The second subsidiary is Trump Atlantic City Associates with $778.7 million in revenues in 2003, assets of $1.4 billion and long-term debt of $1.3 billion. Operating cash flow in 2003 was $180.3 million. In 2003, annual interest expense on TAC debt was $158 million. The current debt contracts of the two entities are such that cash flows from one subsidiary are not available to service the debts of the other entity. The proposed new debt contract would be collateralized by all the assets and cash flows of both subsidiaries of the corporation. Under the existing structure of THCR, a separate subsidiary called THCR Management Services charged the other subsidiaries for management services and for the use of the Trump name. With the recapitalization, the separate management agreements with Mr. Trump will be terminated and he is to be offered a number of shares such that his total equity ownership in the new entity will be 17.5 percent. At current market prices, the shares Mr. Trump will receive in exchange for the termination of his management contracts with the various gaming properties would be valued at about $46 million. THCR was able to make the bond payment in May 2004, just before the end of the 30-day grace period provided by creditors. However, the casinos in Atlantic City continued to lose market share in the first quarter of 2004. Trump Plaza reported a 15 percent decline in operating profit and Trump Taj Mahal reported a 7.4 percent decline relative to the same quarter in 2003. In the three-month period ending in March 2004, THCR generating $27.8 million in operating income (Earnings before interest and taxes) on net revenue of $276 million. Interest expenses drove net income to a negative $48.7 million for the quarter. Capital expenditures for the period, at $21.1 million, primarily involved capital leases at $21.2 million and were primarily for slot machines.
Trump Indiana In December 1994, a Certificate of Suitability for a Riverboat Owner’s License was issued for Trump Indiana and the facility was opened in June 1996. Trump Indiana and Majestic Star, the other licensed riverboat gaming facility in Gary, share the investment required and maintenance expense of the 90,000 square foot pavilion called Buffington Harbor Riverboats L.L.C., which has a total asset base of about $60 million with total liabilities of $7.6 million. Trump opened a 300-room hotel in September 1998. In total, the initial investment in Trump Indiana, including the hotel, was $145.1 million. In September 2000, another joint venture involving the two Gary licenses, Buffington Harbor Parking Associates acquired 14 acres of land for the purpose of constructing a 2,000-space parking garage. The venture has a total asset value of $38 million with long-term debt of $17 million. Trump Indiana is obligated under a long-term lease agreement to make monthly payments to Buffington Harbor Parking Associates equal to 50 percent of the debt service on the $17 million of debt. The riverboat in Buffington Harbor has 43,000 square feet of gaming space, 1,662 slot machines and 42 gaming tables, making the Indiana facility slightly more than 10 percent of the gaming capacity of the parent company. There are 864 FTE employees in the facility. The strategy for the Indiana property is to

59
focus on the middle market. The middle market “makes up the majority of the gaming population in the 200-mile radius of Buffington Harbor.” The middle market is “the broad segment of casino patrons who come for exciting recreation and entertainment and who typically wager less than high-end patrons.” THCR emphasizes the slot business and provides the latest themed slot machines and gaming technology. Trump Indiana has about 1,700 slot machines with 76 percent being Ticket In-Ticket Out (TITO) machines. These machines pay out with a ticket rather than cash. These machines operate with less overhead, labor, and other costs associated with a regular slot operation. Trump Indiana uses targeted marketing and promotion and claims that 59 percent of its revenue for Trump Indiana comes from rated players or players in the company database that have been targeted for promotional programs. In 2003, Trump Indiana had total assets of $113.7 million and total revenues of $134.9 million. Cash flow in the operation in 2003 (EBITDA or Earnings before Interest, Taxes, Depreciation, and Amortization) was $17 million. Total long-term debt on the balance sheet was $71.5 million. In the first quarter of 2004, Trump Indiana had net revenue of $37 million, 21 percent higher than for the previous year in the same quarter. However, sharply higher casino, general and administrative, interest, and income tax provisions drove the quarterly results for Trump Indiana into negative territory with net income of negative $16 million. An income tax provision of $19.1 million was charged to the first quarter operations and reflected the potential impact of a tax ruling in the Indiana Tax Court that involves all of the riverboat license holders in Indiana. While in the previous year, all the THCR properties except Trump Indiana had produced negative results, the Indiana property, loaded with higher administrative, interest and tax expenses, also showed a loss. On a more detailed level, the first quarter results also indicate that Trump Indiana is experiencing intensified competitive threats in the Chicago market. While the table drop (total amount wagered) increased by 22 percent over the previous year, table win declined as a percent and table revenue increased by only eight percent. Similarly, slot handle (total amount wagered) increased by 20 percent, year-over-year, but slot win increased by only 15 percent. The slot win percentage declined from 8.2 percent to 7.8 percent in the most recent quarter.

60
THCR Trends vs. Trump Indiana Basic data presented in Table 22 provide a snapshot of the financial position and operating performance of THCR and Trump Indiana for 2003. Trump Indiana represents about 10 percent of gaming capacity of the parent, 5.5 percent of the total assets of THCR but generated about 11.6 percent of total revenue in 2003. Trump Indiana generated a substantially higher level of revenue per dollar of asset investment than the consolidated parent company did in 2003 at 1.18 dollars of revenue per dollar of asset relative to 0.57 for the parent. But the cash flow profitability (EBITDA to Revenue) of Trump Indiana was substantially below that of the parent in 2003, at 12.6 percent versus 21.96 percent for the parent.
Table 22: Basic Data 2003 (dollars in millions) THCR Trump Indiana Total Assets $ 2,031.0 $ 113.7 Revenue 1,161.0 134.9 EBITDA 254.9 17.0 Long Term Debt (LTD) 1,845.9 71.5 Interest Expense 228.5 7.0 Ratios Revenue/Total Assets 0.57 1.18 EBITDA/Revenue 21.96% 12.6% LTD/EBITDA 7.2 4.21 EBITDA/Interest Expense 1.12 2.43
Data in Table 23 summarize the role of Trump Indiana in the operations of the parent. The Buffington Harbor facility consistently generates about 9-10 percent of the consolidated revenues of the parent with only about 5.5 percent of the total consolidated assets. Between 2000 and 2003, the operating performance of Trump Indiana did improve substantially relative to the parent, due to the advent of dockside gaming in Indiana, and the decline of Trump properties in the Atlantic City market. In the first full year of dockside gaming, Trump Indiana realized a 4.8 percent increase in net revenue but experienced a substantial decline in EBITDA as general and administrative costs increased sharply. However, the parent company in total fared much worse. Relative to the parent, Trump Indiana has 14.3 percent of slots but only 13.6 percent of slot revenue and 5.7 percent of table revenue.
Table 23: Trump Indiana as Percent of Total Consolidated THCR 2000 2003 Revenue 8.80% 9.77% Total Assets 5.40% 5.60% EBITDA 3.90% 6.60%
Trump Indiana: Historic Performance Between 2000 and 2003, Trump Indiana achieved a 13 percent total increase in net revenues as management became more focused on slot machines and the Indiana legislation was changed to allow open boarding with dockside operations. The cash flow profitability of Trump Indiana improved substantially between 2000 and 2002 but fell in 2003 with a sharp increase in general and administration expenses and

61
casino costs (Table 24). Low profit and high debt service constrained the company’s ability to fund capital expenditures. In the last two years, capital expenditures for Trump Indiana were $10.02 million and $6.6 million in 2002 and 2003. In 2003, the bulk of the capital expenditure involved lease contracts.
Table 24: Operating Performance History, Trump Indiana 2000-2003 (dollars in millions) 2000 2001 2002 2003 Net Casino Revenue $119.2 $123.6 $128.7 $134.9 Casino Costs 62.1 65.4 63 68.3 General & Administrative 31.7 28.1 27.9 36.6 EBITDA/Net Revenue 7.2% 16.8% 20.7% 12.6% EBITDA/Interest Expense 1.52 3.89 6.83 2.43
Over the last three years, improved cash flow generated by Trump Indiana resulted in some improvement in an important measure of credit quality, the fixed charge coverage ratio or EBITDA/Interest Expense. The higher this ratio, the more comfortable lenders are that debts on the balance sheet can be serviced from operating cash flows. And relative to its peers in the Chicago market (Table 25), Trump Indiana demonstrated a stronger Fixed Charge Coverage ratio in the 2002-2003 periods. This characteristic was reversed in the first quarter of 2004 when interest expense charged to the Indiana facility increased sharply. The EBITDA to Interest Expense ratio fell to 3.42 in the most recent quarter.
Table 25: Trump Indiana Relative to Peer Operations
Trump Majestic Star Horseshoe 2002 Revenue 100% 100% 100% Casino Costs 48.9% 50.7% 51.6% General and Administration 21.6% 10.5% 13.7% EBITDA/Revenue 20.7 17.43 24.23 EBITDA/Interest Expense 6.83 1.70 1.74 2003 Revenue 100% 100% 100% Casino Costs 50.6% 55.3% 59.4% General and Administration 27.1% 11.16% 11.9% EBITDA/Revenue 12.6 15.02 17.2 EBITDA/Interest Expense 2.43 1.21 1.85

62
Trump Indiana Relative to Competitors To summarize the potential operating and financial strengths or weaknesses of Trump Indiana, we contrasted its operating and financial ratios to those of Majestic Star and Horseshoe for the period 2002-2003 (Table 26).
Table 26: Trump Indiana Relative to Majestic Star and Horseshoe 2002 2003 Trump Indiana Revenue/Total Assets 1.15 1.18 EBITDA/Revenue % 20.7 12.6 Long-term Debt/EBITDA 2.62 4.21 Majestic Star Revenue/Total Assets 1.2 1.21 EBITDA/Revenue % 17.43 15.02 Long-term Debt/EBITDA 4.83 7.67 Horseshoe Revenue/Total Assets 0.765 0.781 EBITDA/Revenue % 21.2 17.2 Long-term Debt/EBITDA 5.84 6.7
While the Gary facilities dominate Horseshoe in terms of productivity of assets, both fell below the Horseshoe facility in terms of cash flow profitability in 2003. The two boats in Gary represent a combined asset base in excess of $250 million versus the Horseshoe, which has an asset base of $435 million. But Horseshoe generated a cash flow margin on revenue at greater than 19 percent in the last two years while the Gary facilities were closer to 16 percent. The location of the Gary boats in terms of distance from Chicago and the large investment associated with two boats that share the same boarding facility are conditions that perhaps hinder the profit potential of the Gary facilities. As indicated earlier, the Trump facility was substantially less levered than its two peer operations (Long-term Debt to EBITDA). However, with the proposed recapitalization, the Indiana facility along with all the other Trump properties will all be listed as collateral on the remaining debts of the company. This will likely increase the difficulty of funding improvements in Indiana with the cash flow that is generated in Indiana. Trump Indiana is the smallest riverboat in Indiana, with 37,000 square feet of casino space versus an average of 50,573 square feet of space for the other boats, and generated a relatively low level of gaming revenue in fiscal year 2003 at $128.6 million versus an average for the other boats in excess of $220 million. Only two other Indiana boats had a lower level of gaming revenue in that period. Trump Indiana is one of two boats that experienced the lowest WIN per admission in fiscal year 2003 at $72. This compares to the highest WIN per admission of $100 achieved by the Argosy facility in Lawrenceburg and an average for the other boats of $90.97. Relative to two of its peers in the Chicago market (Table 26), Trump Indiana had higher general and administrative expenses as a percent of revenue and lower cash flow profitability in 2003. However, the Trump Indiana facility has better fixed charge coverage ratios than the peer facilities. All three competitors experienced a decline in cash flow profitability from 2002 to 2003 due to higher casino costs. However,
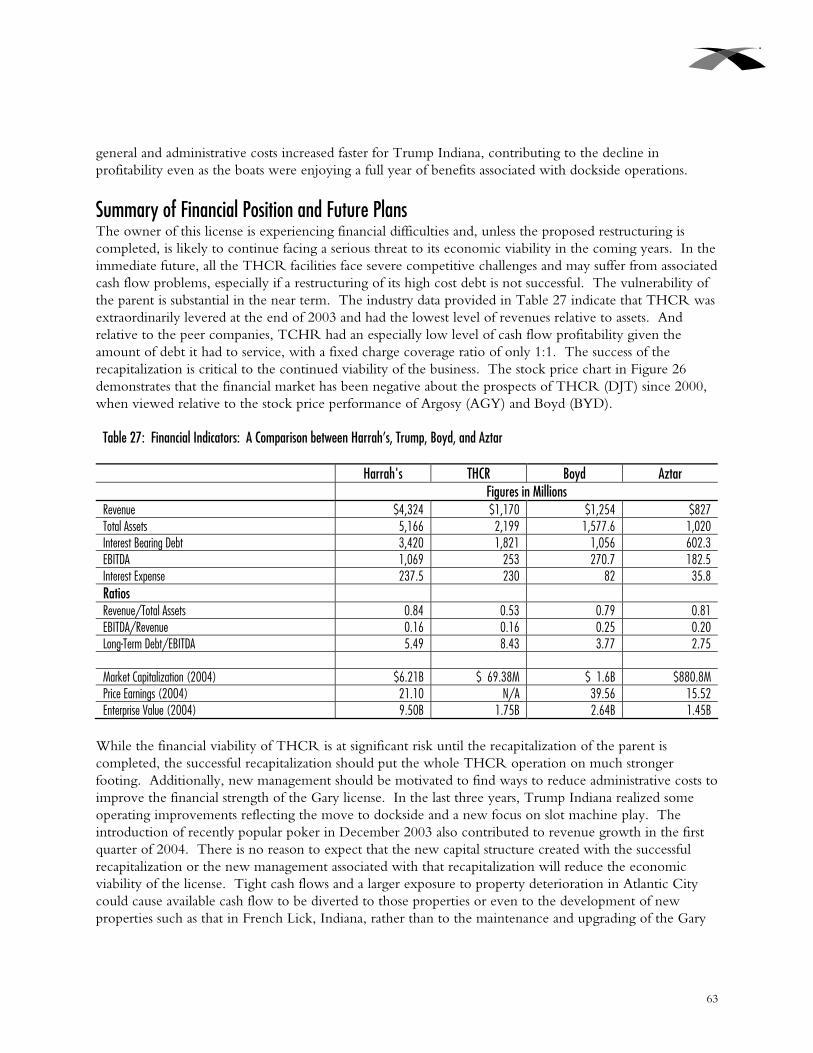
63
general and administrative costs increased faster for Trump Indiana, contributing to the decline in profitability even as the boats were enjoying a full year of benefits associated with dockside operations.
Summary of Financial Position and Future Plans The owner of this license is experiencing financial difficulties and, unless the proposed restructuring is completed, is likely to continue facing a serious threat to its economic viability in the coming years. In the immediate future, all the THCR facilities face severe competitive challenges and may suffer from associated cash flow problems, especially if a restructuring of its high cost debt is not successful. The vulnerability of the parent is substantial in the near term. The industry data provided in Table 27 indicate that THCR was extraordinarily levered at the end of 2003 and had the lowest level of revenues relative to assets. And relative to the peer companies, TCHR had an especially low level of cash flow profitability given the amount of debt it had to service, with a fixed charge coverage ratio of only 1:1. The success of the recapitalization is critical to the continued viability of the business. The stock price chart in Figure 26 demonstrates that the financial market has been negative about the prospects of THCR (DJT) since 2000, when viewed relative to the stock price performance of Argosy (AGY) and Boyd (BYD).
Table 27: Financial Indicators: A Comparison between Harrah’s, Trump, Boyd, and Aztar
Harrah's THCR Boyd Aztar Figures in Millions
Revenue $4,324 $1,170 $1,254 $827 Total Assets 5,166 2,199 1,577.6 1,020 Interest Bearing Debt 3,420 1,821 1,056 602.3 EBITDA 1,069 253 270.7 182.5 Interest Expense 237.5 230 82 35.8 Ratios Revenue/Total Assets 0.84 0.53 0.79 0.81 EBITDA/Revenue 0.16 0.16 0.25 0.20 Long-Term Debt/EBITDA 5.49 8.43 3.77 2.75 Market Capitalization (2004) $6.21B $ 69.38M $ 1.6B $880.8M Price Earnings (2004) 21.10 N/A 39.56 15.52 Enterprise Value (2004) 9.50B 1.75B 2.64B 1.45B
While the financial viability of THCR is at significant risk until the recapitalization of the parent is completed, the successful recapitalization should put the whole THCR operation on much stronger footing. Additionally, new management should be motivated to find ways to reduce administrative costs to improve the financial strength of the Gary license. In the last three years, Trump Indiana realized some operating improvements reflecting the move to dockside and a new focus on slot machine play. The introduction of recently popular poker in December 2003 also contributed to revenue growth in the first quarter of 2004. There is no reason to expect that the new capital structure created with the successful recapitalization or the new management associated with that recapitalization will reduce the economic viability of the license. Tight cash flows and a larger exposure to property deterioration in Atlantic City could cause available cash flow to be diverted to those properties or even to the development of new properties such as that in French Lick, Indiana, rather than to the maintenance and upgrading of the Gary

64
facility. Of course, this will not contribute to the productivity and attractiveness of the Trump Indiana facility or to that of its partner facility in Gary. Figure 26: A Comparison of Stock Prices between Argosy, Boyd, and Trump

65
Appendix I: Description of SIC Codes

66
Standard Industrial Classification (SIC) descriptions were taken from http://www.census.gov/epcd/ec97brdg/
20 Food and Kindred Products This major group includes establishments manufacturing or processing foods and beverages for human consumption, and certain related products, such as manufactured ice, chewing gum, vegetable and animal fats and oils, and prepared feeds for animals and fowls. Products described as dietetic are classified in the same manner as non-dietetic products (e.g., as candy, canned fruits, cookies). 27 Printing, Publishing, and Allied Industries This major group includes establishments engaged in printing by one or more common processes, such as letterpress; lithography (including offset), gravure, or screen; and those establishments which perform services for the printing trade, such as bookbinding and plate-making. This major group also includes establishments engaged in publishing newspapers, books, and periodicals, regardless of whether or not they do their own printing. 30 Rubber and Miscellaneous Plastics Products This major group includes establishments manufacturing products, not elsewhere classified, from plastics resins and from natural, synthetic, or reclaimed rubber, gutta percha, balata, or gutta siak. Numerous products made from these materials are included in other major groups, such as boats in major group 37, and toys, buckles, and buttons in major group 39. This group includes establishments primarily manufacturing tires, but establishments primarily recapping and re-treading automobile tires are classified in Services, industry 7534. Establishments primarily engaged in manufacturing synthetic rubber and synthetic plastics resins are classified in industry group 282. 32 Stone, Clay, Glass, and Concrete Products This major group includes establishments engaged in manufacturing flat glass and other glass products, cement, structural clay products, pottery, concrete and gypsum products, cut stone, abrasive and asbestos products, and other products from materials taken principally from the earth in the form of stone, clay, and sand. When separate reports are available for mines and quarries operated by manufacturing establishments classified in this major group, the mining and quarrying activities are classified in Division B, Mining. When separate reports are not available, the mining and quarrying activities, other than those of industry 3295, are classified herein with the manufacturing operations. If separate reports are not available for crushing, grinding, and other preparation activities of industry 3295, these establishments are classified in Division B, Mining. 35 Industrial and Commercial Machinery and Computer Equipment This major group includes establishments engaged in manufacturing industrial and commercial machinery and equipment and computers. Included are the manufacture of engines and turbines; farm and garden machinery; construction, mining, and oil field machinery; elevators and conveying equipment; hoists, cranes, monorails, and industrial trucks and tractors; metalworking machinery; special industry machinery; general industrial machinery; computer and peripheral equipment and office machinery; and refrigeration and service industry machinery. Machines powered by built-in or detachable motors ordinarily are included in this major group, with the exception of electrical household appliances. Power-driven hand tools are included in this major group, whether electric or otherwise driven. Establishments primarily

67
engaged in manufacturing electrical equipment are classified in major group 36, and those manufacturing hand tools, except powered, are classified in major group 34. Electric, Gas, and Sanitary Services (SIC Major Group 49) This major group includes establishments primarily engaged in the generation, transmission, and/or distribution of electricity or gas or steam. Such establishments may be combinations of any of the above three services and also include other types of services, such as transportation, communications, and refrigeration. Water and irrigation systems, and sanitary systems engaged in the collection and disposal of garbage, sewage, and other wastes by means of destroying or processing materials are also included. If one service of a combination system does not constitute 95 percent or more of revenues, the establishment should be classified as a combination in Industry Group 493, with the subgroup being determined by the major service supplied. Nondurable Goods (SIC Major Group F51) This major group includes establishments primarily engaged in the wholesale distribution of paper and paper products (SIC Industry Group 511);drugs, drug proprietaries, and druggists' sundries (SIC Industry Group 512);apparel, piece goods, and notions (SIC Industry Group 513); groceries and related products (SIC Industry Group 514); farm-product raw materials (SIC Industry Group 515); chemicals and allied products (SIC Industry Group 516);petroleum and petroleum products (SIC Industry Group 517); beer, wine, and distilled alcoholic beverages (SIC Industry Group 518); and miscellaneous nondurable goods (SIC Industry Group 519). Building Materials, Hardware, Garden Supply, and Mobile Home Dealers (SIC Major Group 52) This major group includes retail establishments primarily engaged in selling lumber and other building materials; paint, glass, and wallpaper; hardware; nursery stock; lawn and garden supplies; and manufactured (mobile) homes. It includes lumber and other building materials dealers and paint, glass, and wallpaper stores selling to the general public, even if sales to contractors account for a larger proportion of total sales; these establishments are known as retail in the trade. Establishments primarily selling these products but not selling to the general public are classified in wholesale trade. General Merchandise Stores (SIC Major Group 53) This major group includes retail stores which sell a number of lines of merchandise, such as dry goods, apparel and accessories, furniture and home furnishings, small wares, hardware, and food. The stores included in this group are known as department stores, variety stores, general merchandise stores, catalog showrooms, warehouse clubs, and general stores. Establishments primarily engaged in selling used general merchandise are classified in SIC 593, and those selling general merchandise by mail, vending machine, or direct selling are classified in SIC 596. Food Stores (SIC Major Group 54) This major group includes retail stores primarily engaged in selling food for home preparation and consumption. Establishments primarily engaged in selling prepared foods and drinks for consumption on the premises are classified in major group 58, and stores primarily engaged in selling packaged beers and liquors are classified in SIC 5921.

68
Depository Institutions (SIC Major Group 60) This major group includes institutions that are engaged in deposit banking or closely related functions, including fiduciary activities. Insurance Carriers (SIC Major Group 63) This major group includes carriers of insurance of all types, including reinsurance. Agents and brokers dealing in insurance and organizations rendering services to insurance carriers or to policy holders are classified in Major Group 64. Hotels, Rooming Houses, Camps, and Other Lodging Places (SIC Major Group 70) This group includes establishments engaged in providing lodging, or lodging and meals, and camping facilities. Hotels which provide accommodations for permanent residents (e.g., apartment hotels) and residential mobile home parks are classified in Real Estate, Major Group65. Personal Services (SIC Major Group 72) This group includes establishments primarily engaged in providing services generally to individuals, such as barber and beauty shops, dry-cleaning plants, laundries, and photographic studios. For establishments classified in Industry Group 721, collecting and distributing units (branch outlets, pickup stations, terminals, or depots) owned and operated by a firm which does its own laundry work are not classified as separate establishments. Data for these units are merged with data for the plant where the work is done. Miscellaneous Repair Services (SIC Major Group 76) This group includes establishments primarily engaged in miscellaneous repair services, not elsewhere classified. Repair departments of retail dealers or manufacturers are not included unless operated as separate establishments and reported as such. This group does not include some repair services of which the more important are: repair to structures (classified in Construction); garment and shoe repair (classified in Major Group 72); automotive repair services (classified in Major Group 75); electronic computer and computer peripheral equipment repair services (classified in Industry 7378); ship and boat repair (classified in Manufacturing); and railroad repair (classified in Manufacturing). Motion Pictures (SIC Major Group 78) This group includes establishments producing and distributing motion pictures, exhibiting motion pictures in commercially operated theaters, and furnishing services to the motion picture industry. The term "motion pictures" includes similar productions for television or other media using film, tape, or other means. Amusement and Recreational Services, except Motion Pictures and Museums (SIC Major Group 79) This group includes establishments primarily engaged in providing amusement, recreation, or entertainment services, not elsewhere classified. Gambling businesses, where legal, are also included in this Major Group; however, combined gambling and lodging facilities with 25 guestrooms or more are classified in Industry 7011. Establishments primarily engaged in operating museums, art galleries, arboreta, and botanical and zoological gardens are classified in Major Group 84. Health Services (SIC Major Group 80)
69
This group includes establishments primarily engaged in furnishing medical, surgical, and other health services to persons. Associations or groups, such as Health Maintenance Organizations (HMO's), primarily engaged in providing medical or other health services to members are included, but those which only provide insurance covering hospitalization or medical costs are classified in Insurance, Major Group 63. Hospices providing medical services are also included in this Major Group and are classified according to the primary service provided. Healthcare facilities were primarily coded based on self-designation. Where multiple levels of care were indicated but were not apparently separate operations, the facility was generally classified based on the highest level of care provided. Veterinarians are classified in Agriculture, Industry Group 074.