eia study of proposed expansion of votl jetty at...
TRANSCRIPT
NIO/CON-12/2009 (CNP2190)
DISTRIBUTION RESTRICTED
EIA Study of Proposed Expansion of VOTL Jetty at Pathfinder Inlet near Vadinar (Gujarat)
SPONSORED BY Vadinar Oil Terminal Limited Mumbai
FEBRUARY 2010

EIA Study of Proposed Expansion of VOTL Jetty at Pathfinder Inlet near Vadinar (Gujarat)
Project Leader
R.V.Sarma
Associate Project Leaders
Soniya Sukumaran M.A.Rokade
FEBRUARY 2010

CONTENTS
Project team i Executive summary ii List of tables xvii List of figures xix
1
INTRODUCTION 1
1.1 Background 1 1.2 Terms of Reference (ToR) and Public Hearing 2 1.2.1 ToR proposed by NIO 2 1.2.2 Additional ToR 5 1.2.3 Public Hearing 5 1.3 Approach 5 1.3.1 Marine environment 5 1.4 Terrestrial air and noise environment 6 1.5 Data presentation 6 2 PROJECT DESCRIPTION 9
2.1 Project development basis 9 2.2 Project scope 10 2.3 Site attributes 11 2.3.1 Location 11 2.3.2 Environmental parameters 11 2.3.3 Site selection 12 2.4 Design criteria and requirements 13 2.4.1 Berths 13 2.4.2 Approach bridge 14 2.4.3 Design capacities 14 2.4.4 Dredging and reclamation 14 2.5 Implementation plan and construction methodology 14 2.6 Pollution control 15 2.6.1 Solid waste 16 2.6.2 Oily waste 16 2.6.3 Sewage 16 2.7 Oil Spill Disaster Contingency Plan (OSDCP) 17 2.8 Overall project schedule 17 3 GULF ENVIRONMENT 18
3.1 Land environments 18 3.2 Metrological conditions 18 3.3 Marine environments 19 3.3.1 Physical processes 19 3.3.2 Water quality 20 3.3.3 Sediment quality 21 3.3.4 Flora and fauna 22
4 SITE SPECIFIC MARINE ENVIRONMENT 26
4.1 Physical processes 26 4.1.1 Tides 27 4.1.2 Currents and circulation 28 4.1.3 Bathymetry 29 4.2 Water quality 29 4.2.1 Temperature 30 4.2.2 pH 30 4.2.3 Suspended Solids 31 4.2.4 Salinity 32 4.2.5 DO and BOD 33 4.2.6 Phosphorus and nitrogen compounds 36 4.2.7 PHc 38 4.2.8 Phenols 39 4.3 Sediment quality 40 4.3.1 Texture 40 4.3.2 Heavy metals 41 4.3.3 PHc 42 4.3.4 Organic carbon 43 4.3.5 Phosphorus 44 4.4 Flora and fauna 44 4.4.1 Pathogenic bacteria 45 4.4.2 Phytoplankton 46 4.4.3 Seaweeds and seagrasses 48 4.4.4 Mangrove ecosystem 49 4.4.5 Zooplankton 51 4.4.6 Macrobenthos 54 4.4.7 Fishery 56 4.4.8 Corals 57 4.4.9 Reptiles and mammals 59 4.4.10 Birds 59 4.5 Comparative study of marine environment 60 4.5.1 Water quality 60 4.5.2 Sediment quality 65 4.5.3 Biological characteristics 65
5 SITE SPECIFIC AIR AND LAND ENVIRONMENT 70
5.1 Micrometerology 70 5.2 Air quality 70 5.3 Water quality 71 5.4 Sediment characteristics 72 5.5 Flora and fauna 72 5.6 Noise 73 5.7 Land use pattern 74 5.8 Socio-economic environment 74

6 POTENTIAL IMPACTS DURING CONSTRUCTION PHASE 76
6.1 Marine structures and constructions 77 6.1.1 Hydrodynamic characteristics 77 6.1.2 Water quality 78 6.1.3 Sediment quality 79 6.1.4 Flora and fauna 79 6.2 Dredging 80 6.3 MNP/MS 81 6.4 Miscellaneous 81
7 POTENTIAL IMPACTS DURING OPERATIONAL PHASE 83
7.1 Escapement of cargo 83 7.2 Berth related wastes 83 7.3 Ship generated wastes 83 7.4 Spills of petroleum 83 7.4.1 Spill quantities 84 7.4.2 Fate of petroleum spills 85 7.4.3 Oil spill modelling 85 7.4.4 Impact of flora and fauna 88 7.5 Risk of ship accidents 89 7.5.1 Traffic estimates 90 7.5.2 Ship collision frequency 91 7.5.3 Ship grounding frequency 91 7.6 Impacts on MNP/MS 92 7.7 Impact on fisheries 92 8 MANAGEMENT OF ENVIRONMENT 93
8.1 Design considerations 93 8.2 Construction phase 93 8.2.1 Pilling 94 8.2.2 Concreting and erection of structures 94 8.2.3 Miscellaneous 94 8.3 Operational phase 95 8.3.1 Navigation and traffic management 95 8.3.2 Management of ship related wastes 96 8.3.3 Management of berths- related wastes 96 8.4 Oil spill contingency plan 96 8.4.1 Tier-1 response plan 97 8.4.2 Tire-2 response 97 8.5 Emergency Preparedness and Response Plan (EPRP) 97 8.6 General considerations 98 8.7 Restoration and management of mangroves 99 8.8 Impact minimization on coral reefs and associated biodiversity 99 8.9 Post project monitoring on marine environment 100 8.9.1 Baseline quality 100

8.9.2 Parameters to be monitored 100 8.9.3 Monitoring schedule 101 8.9.4 Assessment 101 8.10 Post-project monitoring of air environment 102 8.11 Post-project monitoring of noise 102 8.12 Inspection of marine facilities 102 8.13 Institutional arrangement 102 8.14 Socio-economic environment 103

i
PROJECT TEAM R.V.Sarma Soniya Sukumaran M.A.Rokade S.N.Gajbhiye A.N.Kadam Jiyalal Ram M.Jaiswar V.S.Naidu Anirudh Ram A.V.Mandalia Prashant Sharma Rajvardhan M.Kapshikar G.K.Chauhan D.S.Bagde B.G.Patel Mohammed Ilyas Jairam G.Oza Jeju J. Dhiraj Koli Priti Kubal Rahul Kumar Tailor Rajashree Sanadi
ii
EXECUTIVE SUMMARY
1 Background
Vadinar Oil Terminal Limited (VOTL), an Essar Group company, has entered
into the Petroleum Handling Agreement (PHA) with Essar Oil Limited (EOL) for their
product evacuation facility via its Jetty Terminal on the Pathfinder Inlet. The
Refinery which is operating at 10.5 miilion tons per annum (Mtpa) is undergoing
expansion and upgradation, in phases, to the ultimate capacity to process 60 Mtpa
of crude oil input. In the first instance the refining capacity will be increased to 32
Mtpa. The facilities at the Jetty Terminal are set-up to match the Refinery capacity
of 10.5 Mtpa and at present, the berths occupancy is about 60-65%. Hence, for the
expanded refining capacity, at least two additional berths would be required to meet
the increased production from EOL. VOTL, therefore proposes to expand the
product evacuation capacity by adding two more berths termed as Berth C and
Berth D.
This report is prepared by the National Institute of Oceanography (NIO) with
the objectives of (a) establishing the prevailing water quality, sediment quality and
biological characteristics of the project area, (b) assessing probable impacts of
proposed expansion by adding Berths C and D and subsequent handling of
petroleum, on marine ecology, and (c) suggesting adequate marine environment
management plan to minimize adverse impacts identified.
2 Project description
The existing VOTL Jetty Terminal is located at Latitude 22o26.9’ N and
Longitude 69o40.18’ E at the Pathfinder Inlet, a natural creek of the Gulf of Kachchh
at Vadinar.
2.1 Design criteria and requirements
The additional Berths C and D which will be oriented in the North – South
direction in line with the existing berths, are planned for the prevailing bathymetry of
the Pathfinder Inlet and no dredging will be required. Central Water Power
Research Station (CWPRS) had examined the proposed expansion and have
concluded that subsequent to the construction of Berths C and D (a) there would
not be significant modification in the dynamics of the Pathfinder Inlet, (b)
modification and changes in shoreline configuration in terms of erosion and

iii
accretion was not expected, and (c) safe manoeuvrability of ships in the Pathfinder Inlet
and their berthing/un-berthing at Berths C and D would be possible throughout the
year except during cyclones.
Berths C and D will be of open type pile construction and designed to receive
ships of sizes between 25000 and 105000 dwt. The berths will be complete with
main platform, mooring dolphins, breasting dolphins, fendering system, Quick
Release Marine Hooks (QRMHs), Bollards etc. All the product lines now terminated
in the existing berths will be extended to the new berths. In addition the 48” crude
line from the SPM-2 will rise on Berth D through a riser and will travel across the
Jetty to the COT area. The top side equipments and auxiliary facilities will comprise
of piled approach for pipelines and walk ways from existing berths to the proposed
Berths C and D; pipelines; marine loading/unloading arms equipped with hydraulic
coupler, Powered Emergency Release Coupling (PERC) and Emergency Shut
Down (ESD); piping headers/manifolds; safety valves; slop tank; surge vessel; fire
water supply, distribution network and associated fire fighting facilities; navigation
system/aids; pedestal crane; control systems; communication systems; utilities etc.
The products proposed to be handled at the berths are motor spirit, HSD, Naphtha,
ATF/SKO and VGO/FO.
2.2 Implementation plan and construction methodology
VOTL have appointed M/s Howe (India) Private Limited (HIPL) to provide
necessary services in the area of basic design, detailed engineering, procurement
and rendering assistance for proposed berths, marine structures etc. A project
schedule of about 16 months duration has been proposed for implementation of the
project up to mechanical completion.
Civil package for the jetty construction will consist of piling, pre-cast beams,
muffs, structural members, approach/pipe trestles, etc as required. The pre-cast
elements for the super structure will be cast in the casting yard on land and the
elements will be transported to the site by trailers using the jetty corridor or by sea.
The in-situ deck concreting will be carried out by concrete pumps.

iv
2.3 Pollution control
The constructions will be beyond 10 m depth contour and the intertidal area
will be completely free from any activity. The region will be declared as no waste
release zone and the same will be enforced strictly. Comprehensive planning will be
made to provide state-of-the-art facilities to ensure control of pollution due to ship
generated garbage / solid waste / liquid waste. Ships will not be permitted to
discharge oily wastes and solid wastes to the sea.
VOTL has an Oil Spill Disaster Contingency Plan (OSDCP) made in line with
the National Oil Spill Disaster Contingency Plan (NOS-DCP) and wetted by the
Indian Coast Guards. OSDCP will be suitably modified to include operations at
Berths C and D.
3 Site-specific marine environment
Pathfinder Inlet is a minor creek along the southern shore of the Gulf
connected to the adjacent Salaya Creek through the narrow and shallow Blunt
Channel. The two creeks are separated by Kalubhar Tapu. Narara reef which forms
the eastern bank of Pathfinder Inlet and Kalubhar reef have stretches of mangroves
and patches of corals. Selected areas of the Narara and Kalubhar reefs form part of
MNP/MS. The proposed Berths C and D are away from these protected areas.
3.1 Physical parameters
Pathfinder Inlet is under fairly high tidal influence with spring and neap tide
ranges of about 6 and 4 m respectively. The currents are tide-induced and
maximum speeds were in the range 0.8 – 1.0 m/s. The circulation is elliptical with
excursion lengths of 3 – 5 km.
3.2 Water quality
The average seawater temperature in the region varied from 26.0 – 29.5o C
and the average pH was 7.7 – 8.3 as expected. The average SS in water was
relatively low (21 – 42 mg/l) and resulted from the dispersion of sediment in water
by tidal movements. The average salinity varied in 35.2 – 36.9 ppt range as
expected for the region.

v
The average DO was above 4.0 ml/l and the average BOD was low (0.8 –
4.4 mg/l) indicating waters free from organic pollution. The average concentrations
of nutrients varied considerably but were of the order expected for uncontaminated
zones of the Gulf. The concentrations of Petroleum Hydrocarbons (PHc) in the
region (10.5 – 39.7 µg/l) were low though large volume of crude oil is unloaded off
Vadinar. The average concentrations of phenols in water were also low.
3.3 Sediment quality
The concentrations of chromium, cobalt, nickel, copper, zinc, cadmium, lead
and mercury in sediment off Vadinar-Salaya varied widely but represented a
natural background. The PHc, organic carbon and phosphorus contents in
sediment were low and in expected ranges for the coastal area of India.
3.4 Flora and fauna
Total Coliform and Faecal Colifom counts in the coastal water off Vadinar-
Salaya were relatively high probably due to defecation on the intertidal area by
nearby villagers and sewage releases from fishing vessels and ships.
The average low concentration of chlorophyll a (0.2 – 1.7 mg/m3) in the
region was probably because of waters deficient in nitrate coupled with high grazing
pressure. The average concentration of phaeophytin was also low (0.2 – 1.7
mg/m3). Phytoplankton generic diversity, particularly in the Pathfinder Inlet, was
high with the dominance of Nitzschia, Navicula, Guinardia, Rhizosolenia and
Thalassiosira. A total of 62 species of algae and 3 species of sea grasses were
recorded from this region. The intertidal expanse at Vadinar-Salaya harboured
extensive mangrove habitats; Avicennia marina being the dominant species.
The overall zooplankton biomass in the Vadinar-Salaya region was low (av
1.7 – 20.0 mg/100m3) but their composition was fairly diverse with the dominance of
copepods, decapods and gastropods. A good number of fish eggs and fish larvae
though at a low percentage was encountered among zooplankton. The average
biomass and population of the intertidal macrobenthos were relatively high with high
diversity. The standing stock of macrobenthos in the subtidal area was however low
in line with the general observation for the Gulf.
vi
Of the total active fishermen in the Jamnagar District, about 25% resided at
Salaya and Vadinar with about 680 mechanized fishing vessels registered at these
centres. The Vadinar-Salaya region however has no established trawling grounds
for fish.
Narara and Kalubhar reefs sustained live corals in patches. Extensive reef
flats of intertidal zone were exposed at low water with deposits of sediment covering
large tracks of the reefs particularly at the inshore areas. The live corals were
largely confined to lower intertidal and lagoon segments as well as in the nearshore
subtidal zone facing the open Gulf. The size and growth of corals in this area were
poor as expected for the Gulf. Soft corals were limited in the region and only three
species were recorded. Available information indicated the absence of corals in
water depths more than 10 m. The reefs supported diverse biota including
seaweeds, sponges, gorgonians, molluscs, coelenterates etc.
The region provided an assemblage of micro-habitats to a variety of
waterfowls and other birds and wintering habitat for several migratory birds.
3.5 Pre- and post-refinery assessment of marine environment
Water quality parameters of the period 1994 – 2006 when the Refinery had
not gone into production when compared with the 2007 – 08 datasets (post-
operational period of the Refinery) indicated that the water quality had not changed
within the natural variability inherent to dynamic coastal areas, due to the impacts of
the Refinery operations. Similar comparison revealed no significant changes in the
sediment burden of trace metals, Corg, phosphorus and PHC in the post-operational
phase of the Refinery.
The concentrations of Chlorophyll a as well as phaeophytin and
phytoplankton genera varied considerably and randomly, however, they were more
or less in the expected ranges during the pre- and post-operational periods of the
Refinery. The available information suggested that the mangrove area in the
Salaya-Vadinar zone had increased in recent years due to plantations made by the
Forest Department. As in the past, the Vadinar-Salaya region continued to sustain

vii
rich and diverse seaweed flora and their habitat had not been adversely influenced
due to Refinery operations.
Zooplankton standing stock and faunal diversity during pre- as well as post-
operational periods of the Refinery varied considerably without discernible trends,
but, the overall results did not indicate any changes in the zooplankton community
structure subsequent to Refinery operations. The standing stock of macrobenthos
varied in a random manner, spatially as well as temporally; however, there was no
evidence for changes in the macrobentic standing stock in the post-operational
period of the Refinery. The fish landing at centres in the project vicinity did not
indicate any definite trend over the decade but their contribution to the total catch of
the district was low with Vadinar contributing barely 1 %.
4 Site-specific air and land environment
The proposed expansion project is essentially confined to the marine zone
of the Pathfinder Inlet with no terrestrial constructions as well as the intertidal zone.
The concentrations of SO2, NOX and NH3 were low and well within the
stipulated standards. Comparatively high concentration of particulate matter in the
area was due to dry and arid land cover and was largely of natural origin. There is
no perennial river in the Vadinar-Salaya region though there are a few seasonal
streams. The quality of water of Sinhan Talav which is in the vicinity was good. The
intrusion of seawater had affected the groundwater.
The total household in the 8 villages in the vicinity of the project site was
1924 with the total population of about 11600. The main occupation of the people
was agriculture, fishing and allied activities.
5 Potential impacts during construction phase
The Vadinar-Salaya marine zone is ecologically important due occurrence of
mangroves and coral habitats with several sites protected under MNP/MS.
The hydrodynamic model studies carried out at CWPRS indicated that the
constructon of Berths C and D would not interfere significantly with the prevailing

viii
flow conditions as well as accretion / erosion trends in the Pathfinder Inlet. Hence,
the impacts of construction of the Berths, if any, would be minor and local in this
dynamic coastal environment.
Additional SS generated due to construction activities would render the
water turbid in the vicinity of the piling sites, though the impact on a larger area is
unlikely. An increase in turbidity could influence photosynthesis however the
impact, if any, would be local and minor. Zooplankton standing stock may also be
influenced locally though the impact would be negligible and temporary. The
probable impact on MNP/MS areas could mainly be due to SS generated during
piling which if the circulation is favourable could be transported to MNP/MS. Corals
which are sensitive to SS would come under stress if SS settles on them. The
impact was predicted to be minor since the pile sites were sufficiently away from
MNP/MS and the SS generated during piling would be localized and small in
volume. Mangrove habitats are unlikely to be influenced because of the distance
and mangroves and associated biota can tolerates certain amount of silt
deposition.
An accident involving construction barges, cranes, ships etc. may lead to
loss of onboard construction material and/or fuel. While material may sink to the
bed, the fuel spill could deteriorate the water quality of the affected area. The
impact would depend on the type and the quantity of fuel spilled.
If proper sanitation is not provided the workers engaged for construction
may use the intertidal area for defecation which would locally degrade the intertidal
sediment. The impact though temporary and minor, is not desirable.
The total loss of biomass and population at the foot prints of piles was
estimated at 3.2 kg (wet wt) and 9.1x10⁵ no respectively. This loss is insignificant
as compared to the standing stock associated with the creek. Moreover,
submerged structures such as piles, cross-beams etc would create new
substratum for selective benthic organisms to settle and grow. The noise during
construction may disturb birds at nearby mudflats and salt works.

ix
The workers would be tempted to cut mangroves for firewood if proper fuel
was not provided to them. Similarly, if their colonies were not located sufficiently
away from the HTL they could cause disturbance to the MNP/MS areas. Left-over
solid waste and that generated during construction would be a source of nuisance
if not cleared from the site. If the construction activity was prolonged due to time-
overruns or improper planning, the negative influence on marine ecology would
increase accordingly.
6 Potential impacts during operational phase
The negative impact on marine environment due to operations at the Berths
C and D could be due to several factors such as oil spills, waste generated at
berths, and wastes from ships.
6.1 Oil spills
The major concern during operations at Berths C and D would be accidental
release of petroleum products in quantities that could be harmful to marine biota.
As petroleum products at the berths would be handled via loading arms with PERC
and ESD, the operational spills are unlikely. Nevertheless, if a spill occurred if
PERC got activated in an unforeseen rare event, the quantity spilled would be
small that would be collected on the tanker and unlikely to enter the sea.
Though rare, bulk releases of petroleum product / fuel could result due to
accidents. Hypothetical spills of crude oil and HSD off Vadinar have been modelled
for quantities varying from 56 to 25000 t for various meteorological and
hydrological conditions. The time taken for the landfall and the quantity of spill lost
due to weathering for different scenarios of tide during premonsoon, monsoon and
postmonsoon have been estimated. In the worst case scenario a spill of HSD if
occurred in the vicinity of the jetty, the partially weathered mass would land on the
coast within 3 h.
The impact of a spill on marine biota would largely depend on location of the
spill, the area affected and the nature and the quantity of the oil spilled. Oil may
harm the mangroves and the subsequent recovery would be slow. Algae if covered
with oil would die but would re-establish once the oil was weathered. An increase in

x
concentrations of dissolved PHc in water subsequent to a spill would lead to
plankton kills. The recovery of plankton would be however fast through
repopulation of the community by fresh recruits from adjacent areas not affected by
oil.
If the weathered oily mass spreads on intertidal areas, mortalities of
organisms in the zones of physical contact would result. The benthic organisms of
exposed shores would recover much faster than of sheltered habitats like lagoons,
mangrove swamps, marshes etc. The oil floating above corals may not cause
severe damage but if it settles on them during exposed condition they may be
severely affected. The recovery of the oiled corals would be slow.
A large oil spill could temporarily reduce fish catch as fish might migrate
from the affected zone. Limited mortality may also occur. Birds are highly sensitive
to oil spills and get particularly affected if their habitats are oiled. Marine turtles and
mammals are highly sensitive to oil spills and may temporarily migrate from the
spill site. Hence, no serious damage to turtles and mammals due to an oil spill was
expected.
6.2 Berth related wastes
The wastes generated at berths in normal operations include domestic
effluent, garbage and solid wastes (debris, leftover plastic items, boxes, containers
etc). The release of such wastes could locally degrade the marine area.
6.3 Ship generated wastes
The main wastes generated by ships include garbage, solids, bilge water
etc. Local creek environment may be affected if this waste was disposed to the
sea particularly when a vessel remained at the berth for longer duration. Untreated
sewage if released by ships while at anchorage could potentially have negative
impact on local marine ecology.
6.4 Risk of ship accidents
Based on the rough estimates of traffic in the Gulf and casualty statistics
maintained at UK ports the probability of ship collision was estimated at one in

xi
every 43 years. The ship grounding frequency in the channel between the Deep
water Route of the Gulf and the Berths C and D was estimated as one in every 6.6
years. The database of International Tank Owners Pollution Federation Limited
indicated that the vast majority of spills (83%) fell in the smallest category (<7 t) and
<3% of accidents resulted in large spills. Hence, the probability of a large spill due
to accident involving a ship in the Gulf was very low.
The large scale handling of crude oil in the Gulf dates back to late nineteen
seventies when the first SPM was set-up off Vadinar. Till date no serious accident
involving a tanker leading to an oil spill has been reported.
7 Management of environment
General features of the region, presence of MNP/MS in the vicinity and
probable impacts due to Berths C and D were considered to suggest conceptual
EMP in the following sections.
7.1 Design considerations
• The Gulf region is seismically active. Hence, the structures, pipelines and
foundations should be designed for specified seismic loads.
• The region is prone to occasional cyclones. Therefore, the berths and
associated structures must be designed for expected storm surge.
• The design and operating philosophy of the terminal must be "No leak" as
proposed and handling of liquids at the Berths should be through loading
arms equipped with hydraulic coupler, PERC and ESD. If the operating
conditions deviate beyond the preset norms, the pumping should
automatically stop till normal conditions are reset.
• Internationally accepted codes and practices should be followed for
designing structures, pipelines, valves, loading arms etc and their
compliance should be guaranteed.
7.2 Construction phase
• Piling should be done in a controlled manner to minimize silt dispersion in
water.

xii
• Water quality should be monitored for SS/turbidity and DO at the MNP/MS
boundary nearest to the piling site during flood tide and if sustained increase
is recorded, the piling must be moderated.
• Extra care is warranted to ensure no spillages of construction material
particularly during concreting that can increase turbidity.
• Transport and erection of prefabricated girders, beams, slabs, railings etc
should be watchfully done to avoid accidents.
• Construction should be completed within the stipulated period and time-
overrun should be avoided.
• Major pre-fabrication jobs should be undertaken in a yard on land and the
transfer of materials to the site should be through the existing jetty or via the
sea route.
• Good sanitation and water supply facilities should be made available to the
work force. Adequate fuel also should be provided to them.
• Labour colonies should be set-up landward of the HTL.
• The operational noise level should be kept to a minimum through proper
lubrication, muffling and modernisation of equipment.
• Regular preventive maintenance of equipment used for construction should
be practiced.
• General clean-up of the site should be taken-up and discarded materials
should be cleared from the site.
7.3 Operational phase
Navigation and traffic management
• GMB in collaboration with the Department of Lighthouses & Lightships and
KPT is setting-up a state-of-the-art Vessel Traffic System (VTS) in the Gulf.
VOTL should cooperate for successful implementation of this plan.
• Navigational channel between the Deep Water Route and the Berths should
be demarcated with proper navigational aides.
• Depth availability in the local navigational channel must be ascertained
through periodic bathymetry surveys.
• Prevailing practice of navigating ships for berthing and during return voyage
by experienced pilots must be followed at all times.

xiii
Management of ship-related wastes
• It should be ensured that the deep-sea ships visiting the Berths have
functional onboard sewage treatment facility.
• There should be a mechanism to ascertain compliance to no release of oily
waste, untreated sewage and solid waste by ships while berthed at Berths
and also in the navigational channel.
• Arrangement for evacuation of liquid wastes must be made if the ship
remains at berth for longer duration. Management and disposal of such
wastes must be clearly defined.
• There must be facility to evacuate solid waste from ships, if required.
Facilities should be created to treat and dispose this waste suitably.
Management of berths-related wastes
• Wastewater other than sewage generated at the Berths should be collected
in a settling pond and released to marine environment only after
ascertaining that it is free from oil and SS.
• The toilets at the Berths should have compact sewage treatment modules.
• The solid waste generated at the berths must be collected and disposed
suitably on land.
Oil spill contingency plan
• VOTL has an oil spill contingency plan at the Tier-1 level. This plan should
be suitably modified to include operations at the Berths C and D.
• The modified contingency plan should be integrated with the oil spill
contingency plan of EOL.
• VOTL should participate as and when Tier-2 level contingency plan for the
Gulf is conceived and operationalized.
7.4 Emergency Preparedness and Response Plan (EPRP)
• VOTL must prepare an EPRP to react promptly to natural and man-made
disasters. This plan should be integrated with the EPRP of EOL as well as
that of the Kandla Port and should include detailed response procedures in
the event of cyclone, earthquake, large oil spills, fire or explosion on vessels
or shore facilities etc.

xiv
7.5 General considerations
• Good preventive and predictive maintenance practices should be adopted
for all equipments.
• Accidental bulk spillages must be avoided by proper navigational safe
guards, training of personnel and vessel traffic management practices.
• The port area should be declared as no waste discharge zone by ships and
vessels.
• The operators and other personnel at jetties should be trained and equipped
for handling emergencies safely and in an ecologically sound manner.
• Manual detailing management of incoming and outgoing traffic of vessels
must be prepared and implemented through trained personnel.
• Special emergency drills should be conducted.
• Noise level in the operational areas and around should be maintained within
permissible limits through regular monitoring.
7.6 Restoration and management of mangroves
• VOTL should support mangrove restoration programme by way of
plantations along creeks and other appropriate areas in the adjacent
mudflats in consultation with the Forest Department (GoG).
7.7 Post project monitoring of marine environment
Post-project monitoring of the marine area must be undertaken as detailed
in Section 8.9 of this Report. The monitoring schedule can be as follows:
• Just prior to the commencement of operations at the Berths C and D.
• After 6 months of commencement of operations.
• Once a year from the commencement of operations.
The results of each monitoring should be carefully evaluated to identify
significant changes if any, compared to the baseline. Gross deviation from the
baseline may require a thorough review of operations at the Jetty Terminal to
identify the causes leading to these deviations and accordingly, corrective
measures to reverse the trend would be necessary.

xv
7.8 Post-project monitoring of air and noise
As a good management practice air quality should be routinely monitored for
standard air quality parameters at the terminal in view of increasing developmental
activities around the southern Gulf and presence of eco-sensitive areas in the
vicinity. The noise also should be periodically monitored and results used to keep
the levels below required norms for eco-sensitive areas.
7.9 Inspection of marine facilities
A comprehensive protocol for inspection of marine structures, pipelines,
valves, safety devices, fire fighting facility, oil spill combating equipment etc should
be prepared as per the internationally accepted practices. The records of all
inspections should be maintained as a part of the overall record system. All these
records should be available for scrutiny, if required.
7.10 Institutional arrangement
• VOTL should set-up an Environment Management Cell (EMC) with a group
of personnel well-trained in environmental and ecological monitoring and in
combating oil spills upto 100 t.
• Post-project monitoring of the marine area is a specialised field and hence
should be conducted through a third party.
• Detailed inspection of marine structures, pipelines, loading arms, hoses,
valves etc would also require external expertise.
• Routine air and noise monitoring may be conducted in-house if such
facilities are available with VOTL.
• EMC should be made responsible for arranging training programmes,
refresher courses, mock rehearsals etc.
7.11 Socio-economic environment
• Locally available workers should be given priority for employment depending
upon their qualifications and suitability.
• VOTL should consider on job training to local youth to enhance their
suitability for employment.

xvi
• Other social measures such as support to primary and secondary education,
medical facilities, supply of drinking water etc to nearby villages should be
taken.

xvii
LIST OF TABLES
3.2.1 Records of severe cyclonic storms which formed over the Arabian Sea and made landfall at the Gujarat coast (1970-2008).
3.2.2 Wind speed and direction at Jamnagar based on long-term observations.
4.2.1 Water quality at station A off Vadinar-Salaya during premonsoon.
4.2.2 Water quality at station B off Vadinar-Salaya during premonsoon.
4.2.3 Water quality at station C off Vadinar-Salaya during premonsoon.
4.2.4 Water quality at station D off Vadinar-Salaya during premonsoon.
4.2.5 Water quality at station E off Vadinar-Salaya during premonsoon.
4.2.6 Water quality at station F off Vadinar-Salaya during premonsoon.
4.2.7 Water quality at station G off Vadinar-Salaya during premonsoon.
4.2.8 Water quality at station H off Vadinar-Salaya in April 2007.
4.3.1 Sediment quality of Gulf off Vadinar-Salaya (Values in dry weight basis except for PHc which are on wet weight basis).
4.4.1 Microbial counts in water (Plate; no/ml) off Vadinar-Salaya during November
2004. 4.4.2 Microbial counts in sediments (Plate no/g; dry wt) off Vadinar-Salaya during
November 2004. 4.4.3 Range and average (Parenthesis) of phytopigment off Vadinar-Salaya during
April 2007 and 2008. 4.4.4 Range and average (parenthesis) of phytoplankton population off Vadinar-Salaya during April 2007. 4.4.5 Range and average of phytoplankton population off Vadinar-Salaya
during April 2008. 4.4.6 Abundance of phytoplankton population off Vadinar/Salaya during April 2007. 4.4.7 Abundance of phytoplankton genera off Vadinar-Salaya during April 2008. 4.4.8 Marine algae at Kalubhar and Narara Island recorded during premonsoon (I)
and postmonsoon (II) of 2006-07. 4.4.9 Range and average (parenthesis) of zooplankton off Vadinar-Salaya during April 2007 and 2008. 4.4.10 Abundance of zooplankton off Vadinar-Salaya during April 2007.

xviii
4.4.11 Abundance of zooplankton off Vadinar during April 2008. 4.4.12 Distribution of decapod larvae, Acetes sp and Lucifer sp off Vadinar-Salaya
during April 2007. 4.4.13 Distribution of fish eggs, and fish larvae off Vadinar/Salaya during April 20007. 4.4.14 Range and average of intertidal macrobenthic fauna at Vadinar during April
2008. 4.4.15 Percentage composition of intertidal macrobenthos at Vadinar during April
2008. 4.4.16 Range and average (parenthesis) of subtidal macrobenthic fauna off Vadinar-
Salaya during April 2007 and 2008. 4.4.17 Percentage composition of subtidal macrobenthos off Vadinar during May
2008. 4.4.18 Marine fish landings (t) for Gujarat State, Jamnagar District and centres
around Salaya. 4.4.19 Specieswise composition of Gujarat state and Jamnagar district during 2004-
05. 4.4.20 Species wise fish landings of Jamnagar District (t) from 2000-2008. 4.4.21 Results of experimental fishing conducted around Vadinar-Salaya during April
2007. 4.4.22 Results of experimental trawling conducted by NIO off Vadinar-Salaya - Sikka
during 1993-2007. 4.4.23 Distribution of corals in the Gulf of Kachchh*.
4.4.24 Species of corals at Vadinar-Salaya region based on available information for
the period 1988–2008.
4.4.25 List of water-birds in the Gulf area.
4.5.1 Sediment quality off Vadinar-Salaya during 1994-2006.
5.3.1 Water quality of surface water (SW), ground water (GW) and dug wells (DW) at Vadinar-Salaya.

xix
LIST OF FIGURES 1.1.1 Essar’s establishments at Vadinar along southern Gulf of Kachchh. 1.1.2 Existing marine facilities of VOTL at Vadinar and proposed expansion. 1.2.1 Locations of sampling conducted in 2007 and 2008 off Vadinar-Salaya. 4.1.1 Current speed and direction in Salaya Creek measured from 16th to 24th May
2007. 4.1.2 Drogue trajectory (flood-ebb) off port terminal in Pathfinder Inlet on 13 April
2007. 4.1.3 Drogue trajectory (ebb - flood) off port terminal in Pathfinder Inlet on 17 April
2007. 4.1.4 Drogue trajectory (flood - ebb - flood) in Salaya Creek 12 April 2007. 4.4.1 Satellite based mangrove zonation map of Vadinar-Salaya region. 5.2.1 Sampling locations for air quality and water quality. 7.5.1 Typical trajectory of HSD spill (100 t) in January at Berths C and D. 7.5.2 Typical trajectory of crude oil spill (500 t) in January at SBM. 7.5.3 Typical trajectory of crude oil spill (25000 t) in January in Navigation Channel. 7.5.4 Typical trajectory of HSD spill (100 t) in July at Berths C and D. 7.5.5 Typical trajectory of crude oil spill (500 t) in July at SPM-2.

1 INTRODUCTION
1.1 Background
Essar Global Limited (EGL) is a diversified business group straddling the
manufacturing and services sectors of steel, energy, power,
telecommunications, shipping & logistics and projects. EGL has an enterprise
value of approximately USD 50 billion (INR 200,000 Crore) and employs
30,000 people worldwide. The Company has operations and investments in
India, Canada, USA, Africa, the Middle East, the Caribbean and South East
Asia.
Essar Energy Holdings Limited (EEHL) drives EGL’s energy business.
Essar Oil Limited (EOL) under EEHL operates a 10.5 Mtpa (Million tons per
annum) refinery at Vadinar on the southern coast of the Gulf of Kachchh (Gulf)
in the Jamnagar District of Gujarat (Figure 1.1.1). The refinery is undergoing
expansion and upgrade in phases from the existing capacity of 10.5 Mtpa to the
ultimate facility to process 60 Mtpa of crude oil for which EOL has already
received the Environmental Clearance from the Ministry of Environment and
Forests (MoEF). In the first instance it is proposed to increase the refining
capacity from 10.5 Mtpa to 32 Mtpa.
Essar Shipping & Logistics Limited (ESLL) is an end-to-end logistics
provider with sea and surface transportation services, oilfield drilling services,
dry and liquid terminals and tankage and associated pipelines. ESLL has
formed a subsidiary namely Vadinar Oil Terminal Limited (VOTL) for handling
imported cargo of crude oil and dispatching finished products from the refinery
by sea and land route. VOTL has entered into the Petroleum Handling
Agreement (PHA) with EOL for their existing 10.5 Mtpa and provides crude oil
receipt, oil storage, product storage, and dispatch facilities like Single Point
Mooring (SPM), pipelines, Crude Oil Tankage (COT), product and intermediate
tankage, rail and road gantries and a deep port jetty. These facilities were
planned and constructed for the base refinery capacity of 10.5 Mtpa.

2
At the present refinery production capacity of 10.5 Mtpa, the jetty
occupation is already 60-65%. Evidently, for expanded refining capacity which
is more than three times the existing capacity, at least two additional berths are
required for the projected expansion to 32 Mtpa. Hence, VOTL proposes to
expand the product evacuation capacity by adding two more berths termed as
Berth C and Berth D. These berths will be extended in the same line with the
existing berths as illustrated in Figure 1.1.2.
This report prepared by the National Institute of Oceanography examines
the impacts of the proposed expansion by adding additional berths, on marine
ecology off Vadinar and in particular Marine National Park (MNP) and Marine
Sanctuary (MS).
1.2 Terms of Reference (ToR) and Public Hearing
The Expert Appraisal Committee for environmental appraisal of
Infrastructure Development and Miscellaneous projects (EAC) of the MoEF,
approved the ToR suggested by NIO and also prescribed additional ToR vide
letter No.10-121/2008-IA-III dated 6 November, 2008 (Appendix 1).
1.2.1 ToR proposed by NIO
EIA studies will be conducted keeping in view the requirements of the EIA
Notification of 2006 and will be designed to meet the following objectives:
(a) Objectives
• To establish the prevailing water quality, sediment quality and biological
characteristics of the project area including the Pathfinder Inlet and the
Gulf off Vadinar.
• To assess probable impacts of proposed expansion by adding Berths C
and D and subsequent handling of petroleum, on marine ecology.
• To suggest adequate marine environment management plan to minimize
adverse impacts identified.

3
(b) Field data
NIO has been periodically monitoring the coastal area of Vadinar including
the Pathfinder Inlet. The recent monitoring was conducted during April-May 2007
and 2008 at locations illustrated in Figure 1.2.1. Earlier, NIO has conducted field
studies off Vadinar in 1994-95 (Pre- and post-monsoon), 1996 (Premonsoon),
2000 (Postmonsoon), 2004 (Postmonsoon) and 2006 (Pre- and post-monsoon).
The data pertaining to 1994-95, 2000 and 2004 is for the period prior to the
commencement of the commercial operations at the VOTL Jetty Terminal.
Hence, considering the availability of adequate database no fresh field study
except for reconnaissance survey is proposed.
(c) Report
As mentioned, the EIA report will be prepared based on the database of
NIO for the Gulf of Kachchh in general and Vadinar-Salaya (Including Pathfinder
Inlet) in particular. The Report will be structured as given in the Appendix III of
the EIA Notification SQ 1533 dated 14 September, 2006. The important Sections
in the Draft Report will be following apart from introduction, project description,
summary and conclusion etc.
Gulf of Kachchh environment:
Brief description of the coastal and marine area of the Gulf will be
discussed based on the database of NIO and other published information.
Prevailing site-specific marine environment:
Based on the field data collected by NIO during 2006-08, site-specific status
of the project site (Pathfinder Inlet, Salaya Creek, coastal area off Vadinar upto
40 m depth contour, associated intertidal area etc) will be established as follows:
Physical processes: The information on tides, currents and circulation available
for the project site will be assessed to establish the dynamics of the coastal
system.
Water quality: Water quality will be assessed based on temperature, salinity,
suspended solids, pH, Dissolved Oxygen (DO), Biochemical Oxygen Demand

4
(BOD), phosphate, nitrate, nitrite, ammonia, Petroleum Hydrocarbons (PHc) and
phenols. Tidal variability of water quality in creeks and off Vadinar will also be
assessed.
Sediment quality: Sediment quality will be assessed based on texture, organic
carbon, phosphorus, PHc and selected metals (aluminium, chromium,
manganese, iron, cobalt, nickel, copper, zinc, lead, cadmium and mercury).
Biological characteristics: Flora and fauna of the project site will be assessed
based on primary productivity; phytoplankton population and generic diversity;
standing stock of zooplankton and their diversity; standing stock of intertidal and
subtidal macrobenthos and their diversity; mangroves and their diversity; corals
and their diversity; marine reptiles; marine mammals; sea birds etc. The fishery
of the region will be assessed based on data from Department of Fisheries,
Government of Gujarat.
Assessment of impacts:
Based on the project information made available by VOTL and prevailing
marine ecology off Vadinar, probable impacts on marine ecology (including
marine protected areas) during construction and operational phases will be
assessed and documented.
Mitigation measures:
Suitable mitigation measures will be suggested to minimize the negative
impacts identified. A major concern at oil terminals is accidental spillage of the
liquid under transfer. This issue will be comprehensively addressed.
Environment Management Plan (EMP)
A suitable EMP aimed at protecting marine ecology of the Gulf will be
suggested. The EMP will describe the environmental practices and procedures
which are to be systemically applied by the project proponent during planning,
construction, operation and maintenance in order to manage potential negative
environmental and other effects.

5
The EMP will also include strategy for monitoring the marine environment to
identify changes in any due to the proposed developments so that suitable
corrective measures can be taken, if required.
1.2.2 Additional ToR
The EAC vide above referred letter prescribed following additional ToR that
needed to be considered in the EIA report: (i) Details of the impact of the project
on the MNP. (ii) Details of the clearance from the wildlife Departments with
regard of the proximity of the project to the MNP and compliance to the court
orders, if any. (iii) Study to be carried out on the biodiversity in consultation with
the Wildlife Research Institute, Dehradun. (iv) Details of the changes in the
environment (marine) since 2002. (v) Details of the oil slick and accidents
scenario. (vi) Details of the distance from the existing jetty. (vii) Details of the ship
manoeuvrability study. (viii) Details of the tranquillity study. (ix) Details of the
measures to minimize the impact of the project on the coral reefs and the
biodiversity. (x) Details of the Coastal Regulation Zone clearance. (xi) Details of
the navigational safety. (xii) A comparative study of the environmental
parameters with respect to 1995, 2001 and the recent data.
1.2.3 Public Hearing
The Public Hearing of the proposed jetty expansion was conducted at
Vadinar on 1 December 2009. A copy of the proceedings of the Public Hearing
was made available by VOTL to NIO. It was clear from the proceedings that no
major issue pertaining to the EIA was raised during Public Consultation and
whatever minor changes required are incorporated in this Final EIA report.
1.3 Approach
1.3.1 Marine environment
The Pathfinder inlet where the project is located is a tributary of the Gulf
along its southern shore and is significantly influenced by the dynamics of the
Gulf. Hence, the general features of the Gulf are briefly described in Section 2 of
this report. This discussion is based on a large number of site-specific studies
conducted by NIO over the period 1985 – 2008.

6
NIO had conducted detailed field studies in the Vadinar –Salaya segment of
the Gulf during 1993–94 to establish the then prevailing marine environmental
status in connection with EIA of the EOL Refinery. Thus, these data represent
pre-refinery baseline. Except for an SPM belonging to the Indian Oil Corporation
Limited (IOC) which was in operation and salt works, no other major industrial
activity was there at Vadinar when these studies were conducted.
Subsequently, NIO conducted studies off Vadinar in 1996 (Premonsoon),
2000 (Postmonsoon), 2004 (Postmonsoon), 2006 (Premonsoon), 2007
(Premonsoon) and 2008 (Premonsoon); the last two monitoring programmes
being undertaken in the post-operational phase of the VOTL Jetty Terminal.
Thus a series of data sets are available for the Vadinar-Salaya region spanning
over a decade which are used in this report to describe the site-specific
environment and also to assess changes if any in marine environmental quality
subsequent to the operations at the Jetty Terminal and the EOL Refinery.
1.4 Terrestrial air and noise environment
The proposed expansion is essentially confined to the marine zone and
there will be no project related development at the land area. Nevertheless,
terrestrial and air environment is briefly discussed for completeness of the EIA.
The National Environmental Engineering Research Institute (NEERI) had
studied the environmental status of the refinery and the area within 10 km radius
around during 2005-06. The area coverage also includes the villages in the
vicinity of the Jetty Terminal. The findings are presented in the report
“Environmental Impact Assessment for the Proposed Debottlenecking,
Modification and Expansion at Essar Refinery Vadinar, Gujarat”. This report was
made available by VOTL to NIO and used for describing the terrestrial, air, noise
and social environment.
1.5 Data presentation
In order to identify significant differences, if any, in the ecological status of
different zones such as the Pathfinder Inlet, Salaya Creek and the Gulf proper
the stations operated during 2007 and 2008 were spread in creeks as well as the

7
Gulf upto 40 m water depth (Figure 1.2.1) to represent the segments as
illustrated in the following table:
Site Station
Pathfinder Inlet (Outer) B
Pathfinder Inlet (Inner) A
Blunt Channel H
Salaya Creek G
Effluent release site C
SPM site D
Gulf (20 m depth contour) F
Gulf (40 m depth contour) E
The proposed Berths C and D will be constructed in the segment termed as
Pathfinder Inlet (Outer). The Blunt Channel is a minor and shallow offshoot that
connects the Pathfinder Inlet to the adjoining Salaya Creek (Figure 1.2.1).
Salaya Creek is relatively free from any developmental activities except for the
fishing harbour and a traditional boat-building yard. The ecological impact, if any,
due to loading operations of petroleum products at the jetty and other activities
would be largely confined to the Pathfinder Inlet. If so, its ecology could differ
from that of the Salaya Creek which is free from any major industrial activity.
The EOL refinery went into commercial production in late 2006. The major
factors which could impact marine ecology of the Vadinar-Salaya zone are
unloading of crude oil at the SPM and its transport to the COT, loading of
petroleum products at the VOTL Jetty Terminal on the Pathfinder Inlet, release of
warm and high density return seawater and the increase in traffic of ships. To
evaluate ecological changes, if any, due to refinery operations, the results of
1994-95, 2000, 2004 and 2006 all prior to the commissioning of the Refinery, are
compared with the data sets of 2007 and 2008.
To meet some of the additional ToR stipulations, VOTL commissioned
additional studies as listed in the following table:

8
Study Agency
Biodiversity Centre for Advanced Study in Marine Biology, Annamalai University, Chidambaram
Ship manoeuvrability and tranquillity
Water and Power Consultancy Services, Pune
Oil slick and accident scenarios
Environ Software Private Limited, Bangalore
Risk analysis Det Norske Veritas As (DNV), Hyderabad
Findings emerging from these studies are used in this report with adequate
reference wherever necessary.

9
2 PROJECT DESCRIPTION
The project envisages extension of the existing jetty of VOTL at the
Pathfinder Inlet by constructing additional Berths C and D with necessary
topside equipment.
2.1 Project development basis
EOL refinery at Vadinar has been commissioned in late 2006 and is
operating at its designed capacity of 10.5 Mtpa. The refinery is undergoing an
expansion and upgrade from the existing capacity of 10.5 Mtpa of crude oil in
phases with the ultimate capacity of 60 Mtpa. In the first instance it is proposed
to increase the refining capacity from 10.5 to 32 Mtpa. The overall expansion
program will also include new secondary processing units apart from enhancing
the capacity of crude distillation and vacuum distillation units that will allow the
refinery to process lower cost heavy sour crude and produce higher quality
products conforming to most recent specifications of Euro III and Euro IV.
VOTL is providing to EOL, the crude oil receipt, oil and product storage,
and dispatch facilities like SPM, pipelines, COT, product and intermediate
tankages, rail and road gantries and Jetty Terminal according to PHA. These
facilities were planned and constructed for the base refinery capacity of 10.5
Mtpa. After refinery starts producing 32 Mtpa of products, there will be need to
augment marine facilities so as to provide enough flexibility to refinery
operations for import of crude oil and evacuation of petroleum products via the
sea route.
At the present production capacity of the refinery at 10.5 Mtpa, the jetty
occupation is already 60-65%. Hence, when the refinery undergoes expansion
to 32 Mtpa which is more than three times the existing production, additional 2
berths are the minimum requirement. The project therefore envisages the
expansion of the Jetty Terminal by providing two additional berths (Berths C
and D) to the north of the existing berths as shown in Figure 1.1.2.

10
Essar has planned separate marine facilities in the adjacent Salaya Creek
that will include liquid handling berths which will cater for the refinery expansion
from 32 to 60 Mtpa.
All the product lines now terminated in the existing berths will be
extended to the new berths. In addition the 48” crude line from the SPM-2 will
rise on Berth D through a riser and will travel across the Jetty to the COT area
through the Jetty Terminal. Loading / unloading points of crude will be provided
in Berth B.
2.2 Project scope
The proposed additional berths, top side equipments and auxiliary
facilities will comprise of the following:
• Two single berths and associated marine structures. This will cover
additional 600 m water front towards the north end of the Berth B.
• Mooring and breasting dolphins.
• Mooring and fendering system i.e. fenders, Quick Release Marine Hooks
(QRMH), Bollards etc.
• Piled approach for pipe lines and walk ways from existing berths to the
proposed Berths C and D.
• Petroleum pipelines with future provisions for additional lines on these
berths.
• State-of-the-art marine loading/unloading arms, piping headers/manifolds,
Mechanically Operated Valves (MOVs), safety valves etc.
• Slop draining, collection and transfer facilities such as slop tanks, surge
vessel, slop transfer pump etc.
• Fire water supply and distribution network and associated fire fighting
facilities including foam/water, tower monitors, ground monitors, hydrants,
jumbo curtain nozzles, hose boxes, portable fire extinguishers etc.
• Navigation system/aids.
• Pedestal crane for lifting/shifting of the equipments and maintenance
assistance.
• Electrical power supply, distribution and other associated systems.
• Instrumentation and control systems.

11
• Communication systems.
• Utilities.
2.3 Site attributes
2.3.1 Location
The existing VOTL Jetty Terminal is located at Narara reef (Lat 22o26.9’ N,
Long 69o40.18’ E) in the Pathfinder Inlet, a natural creek of the Gulf at Vadinar.
The KPT jetty, operational for more than three decades, is located just to the
south of the VOTL Jetty Terminal (Figure 1.1.2). The Pathfinder Inlet is well-
sheltered from monsoon waves and thereby permits uninterrupted navigation
for ships approaching the berths except during cyclones which occasionally
strike the Gujarat coast. .
The channel of the Pathfinder Inlet at the proposed berths has natural
depths of 15-17 m as evident from the bathymetry given in Figure 1.1.2. The
Inlet shoals in the inner regions and joins the adjacent Salaya Creek through
the shallow Blunt Channel.
2.3.2 Environmental parameters
Environmental parameters such as tides, waves, currents and winds are
important while planning the layout of jetties as well as ship navigation and
safety. The mean spring tidal range of 3.06 m at Okha increases to 5.67 m at
Sikka and further to 6.43 at Navlakhi. Tide recorded for 15 days commencing
from 17 May 2007 at Lat 22°26’18”N; Long 69°33’15”E at Salaya Creek
indicated maximum and minimum tidal ranges of 5.5 and 3.5 m respectively.
The Gulf experiences rough sea conditions during monsoon with wave
heights of 1.5 m and more in spells when south-westerly winds are strong. The
waves and swells from the Arabian Sea propagating into the Gulf seldom
penetrate into the Pathfinder Inlet due to the mainland of Saurashtra to the
southwest and many shoals and banks strewn in the Gulf. Wave conditions at
the project site are therefore mainly influenced by locally generated wind
waves. Several years of experience of operations of the KPT Jetty in the
Pathfinder Inlet indicates fairly tranquil conditions in the region for safe
12
navigation and cargo handling throughout the year. Currents in the Pathfinder
Inlet are largely tide induced with maximum speeds of 0.5 – 1 m/s.
Average wind speeds are typically 15 to 20 km/h (SW-W) in the summer
and monsoon periods (April – September) and 10 km/h (SE-E-NE) at other
times of the year. Normal annual maximum wind speed for the area is in the
region of 40 km/h and occurs during SW monsoon season. Extreme wind
speeds occur in cyclone storms (average hourly wind exceeding about 60
km/h) approximately once every 5 years but extreme (average hourly) wind
speed of 100 km/h are rare.
2.3.3 Site selection
Following are the major factors influencing selecting the location for
expansion of the marine facilities adjacent to the existing VOTL Jetty Terminal
at Vadinar:
• The proposed location for expansion of the marine facilities is adjoining the
existing jetty and in the vicinity of the SPM making it possible to integrate
the entire operations through the centralized control room and monitoring
stations already built and being operated at present.
• When Berths C and D and associated structures are constructed adjacent
to the existing berths there will be no need of constructing additional trestle
and Bund to connect them to the shore thereby avoiding constructions in
the intertidal area.
• The existing jetty has been designed considering the presence of MNP/MS
in the vicinity. Accordingly, loading/unloading operations at the jetty are
clear of the protected areas. The expansion facilities will also be designed
on the same line and all the operations will be outside the marine protected
zones.
• The expansion of berthing facilities in the Pathfinder Inlet will also facilitate
utilization of all integrated resources at single point location.
• Logistically addition of 2 berths is advantageous as the site is near to all the
existing facilities, and refinery.
• Prevailing fair weather and marine conditions due to natural deep draft
formation enhance the safety of marine operations.

13
2.4 Design criteria and requirements
The expansion of the Jetty Terminal by having two additional berths is
planned for the prevailing natural bathymetry in the mouth zone of the
Pathfinder Inlet. The Berths C and D will be oriented in the North – South
direction in line with the existing berths.
CWPRS (Central Water Power Research Station, Pune) had examined
the proposed addition of Berths C and D North of the existing berths and have
concluded the following:
• There will not be significant modification in the dynamics of the Pathfinder
Inlet with respect to tides, currents and circulation subsequent to the
construction of additional Berths.
• Modification and changes in shoreline configuration in terms of erosion
and accretion is not expected due to proposed Berths C and D.
• Safe manoeuvrability of ships in the Pathfinder Inlet and their berthing /
un-berthing at Berths C and D will be possible throughout the year except
during cyclones.
2.4.1 Berths
Berths C and D will be of open type pile construction. This type of
construction envisages large diameter vertical RCC bored piles spaced at
suitable distances and connected by a RCC grillage of cross and longitudinal
beams and slab to support the top side facilities.
A pile berth is a flexible structure and, therefore, absorbs the berthing
energy of the ship by horizontal deflection. Accordingly, the piles will be
designed for combined vertical and horizontal loads and will be socketted in the
hard bed rock which exists at the proposed site.
The berths will be complete with main platform, mooring dolphins,
breasting dolphins, fendering system, QRMH, Bollards etc as per the norms of
the Oil Companies International Marine Forum (OCIMF).

14
2.4.2 Approach bridge
The berths will be connected with the help of an approach bridge from the
existing berths. This approach bridge will be of open piled construction with
RCC bored piles similar to those adopted for the piled berths.
2.4.3 Design capacities
The terminal will be designed in conformance with requirements to
evacuate 32 Mtpa refinery products. The products proposed to be handled at
the berths are Motor spirit Grade-1, Motor spirit Grade-2, HSD Grade-1, HSD
Grade-2, Naphtha, ATF/SKO and VGO/FO. In addition, there will be provisions
for new products depending on refinery output.
The Berth C and D will be designed to receive ships of sizes between
25000 to 105000 dwt and 25000 to 60000 dwt respectively. There will be 3X24”
diameter and 3X32” diameter pipelines connected with the marine loading arms
for delivering products from refinery storage tanks. Additionally, one crude oil
line from the SPM-2 will pass through these berths. Provisions will be made for
additional product lines and marine loading arms on the proposed berths to
meet future requirement/expansion plan. The present rate of filling at the berth
is envisaged to be 2000 to 5000 kl/h. This may be further augmented in future
depending on need / technological advances.
The 48” on shore crude oil pipe line from the COT extending to SPM-2 will
have riser and tie-up with the 48” offshore pipe line at Berth D from where there
will be sub-sea crude pipe line up to the SPM-2.
2.4.4 Dredging and reclamation
The Berths C and D are designed for the prevailing bathymetry of the
Pathfinder Inlet. Hence, no dredging will be required to navigate or berth the
design ship. The expansion does not envisage any reclamation.
2.5 Implementation plan and construction methodology
VOTL have appointed M/s Howe (India) Private Limited (HIPL) to provide
necessary services in the area of basic design, detailed engineering,

15
procurement and rendering assistance for jetty, marine structures etc. A project
schedule of about 16 months duration has been proposed for implementation of
the project facilities up to mechanical completion.
Each berth will consist of a central platform and two mooring and berthing
dolphins on either sides of the central platform with the overall length of about
300 m each from North – South ends. The piling will be done using piling
gantries.
Civil package for the offshore jetty construction will consist of piling, pre-
cast beams, muffs, structural members, approach/pipe trestles, etc as required.
The pre-cast elements for the super structure will be cast in the casting yard on
land away from the High Tide Line (HTL). The elements will be transported to
the site by trailers using the jetty corridor. If required, the pre-cast elements will
be transported by barges from the shore to the erection location and placed in
position by floating crane/erection gantry. The in-situ deck concreting will be
carried out by concrete pumps.
The berths will have breasting dolphins with fenders to cater to berthing of
the vessels. The breasting dolphins will be concrete structures. Rubber fenders
protected by steel panels with high density polyethylene rubbing surface board
in the front, will be provided at the berths. The panel length will be sufficiently
long to allow for large tide variation. Bollards and mooring hooks will also be
provided along the berthing face for securing the vessels. The berths will have
other standard gears such as life-saving and fire fighting system, fire water
lines and fire pumps, etc.
2.6 Pollution control
The constructions will be beyond 10 m depth contour and the intertidal
area will be completely free from any activity. The expansion area will be
declared as no sewage and garbage release zone and the same will be
enforced strictly. Comprehensive planning will be made to provide state-of-the-
art facilities to ensure control of pollution due to ship generated garbage / solid
waste / sewage. Fresh water requirement will be met from shore end.
16
The major pollutants generated in the normal day-to-day operations of
ships include garbage, solid waste, sewage and bilge water.
2.6.1 Solid waste
The common practice by ships alongside the berths is to accumulate
garbage and solid waste on the offshore side of the vessel. With relatively
short ship turnaround time expected at the Berths, most ships will not be
required to dispose their garbage and solid waste while at berth. For
occasions, when ships for some reason remain at berth for a longer duration,
facilities for pickup of garbage and solid waste from such a vessel will be
provided. This waste will be disposed suitably.
2.6.2 Oily waste
Ships generate bilge during their normal operations. This waste will not be
permitted to be released to the marine environment while navigating or when at
the berths. They will have to store the oily waste onboard and evacuate it to a
suitable port of call later where reception facilities for oily waste are available.
However, during unusual situations warranting evacuation of oily waste from a
ship at berth, vessel equipped with suitable liquid carrying equipment, or tank
truck will be made available. These wastes will be transported to the treatment
facility either at the refinery or at the designated place for treatment and
disposal.
2.6.3 Sewage
The deep-sea ships visiting the berths will have onboard sewage
treatment facility or holding tank for collection and storage of sewage while at
the berth. Hence, there will not be any release of untreated sewage from ships
in the Pathfinder Inlet. Availability of onboard sewage treatment plant will be
ensured before the ship is allowed to berth.
The operations at the jetty will be fully mechanized needing only limited
manpower. Toilets with waste treatment modules have been already provided
at the Jetty Terminal for the operational staff.

17
2.7 Oil Spill Disaster Contingency Plan (OSDCP)
VOTL has an OSDCP made in line with the National Oil Spill Disaster
Contingency Plan (NOS-DCP) and is wetted by the Indian Coast Guards.
OSDCP will be suitably modified to include operations at Berths C and D.
2.8 Overall project schedule
VOTL has entered in to PHA with EOL for handling their cargo of crude oil
and finished products of their 10.5 Mtpa refinery. This PHA is being amended
for the proposed refinery expansion. Considering the comprehensive
completion schedule for the refinery expansion by the first quarter of 2011, all
these marine facilities have to be commissioned and ready for operation by
2010.
The construction of jetties including the entire cargo handling system is
proposed to be completed within 16 months from the start date.

18
3 GULF ENVIRONMENT
The ecology of the Pathfinder Inlet and the Salaya Creek is intimately
linked with that of the Gulf hence it is necessary to understand Gulf and its
environs for comparing the site-specific environmental conditions with that of the
parent body.
3.1 Land environment
The coastal area of the Gulf is generally flat with sparse vegetation.
Cotton is the dominant crop along the northern coast while it is oil seeds in the
southern belt. Bajra, pulses, wheat, sugarcane etc are the other common crops
in the region. The general vegetation is scattered and of tropical dry mixed
deciduous scrub and desert thorn type belonging to the xerophytic group. Due to
erratic rainfall in the region, ground water is a more reliable source of water for
domestic as well as agricultural needs. However, uncontrolled and indiscriminate
withdrawal of ground water has resulted in a sharp decline in water table in the
coastal belt causing ingress of salinity.
The coastal region of the Gulf is industrially less developed and the
majority of large-scale industries including the refineries is located in the
Jamnagar District. Kachchh District is industrially backward and except for lignite
mining, a thermal power plant, a fertilizer plant and the Mundra and Kandla Ports,
there are no major industries in the district. The Jamnagar District has
population density of 135 persons/km2 which is low as compared to 258
persons/km2 of the state.
3.2 Meteorological conditions
The climate of the Jamnagar District is hot in summer and pleasant in
winter. The summer season extends from March to June and the monsoons are
from July to September. The summer temperature ranges from 24 to 42o C and
winter temperature varies from 10 to 24o C. Winter season sets-in during October
and extends till February. The Gulf is a semi-arid region with weak and erratic
rainfall confined largely to the June-October period. The Jamnagar District
receives an average rainfall of 555 mm though in 2006 the rainfall was 766 mm.
The average rainfall at Mundra and Mithapur is 414 and 490 mm/y respectively.

19
Gulf and Saurashtra coasts are occasionally hit by cyclones some of severe
intensity (Tables 3.2.1). In association with cyclonic storms or depressions in the
postmonsoon months and to a lesser extent in May and June, the district
experiences strong winds and widespread rain. Thunder storms occur in June
and July. Occasional fog occurs in the cold season.
The predominant wind direction in the Gulf region changes seasonally with
predominant west-south-westerly in June-September and north-north-easterly in
December-March (Table 3.2.2). The mean wind speed varies between 2.5 and
3.0 m/s in September-March and increases to 4.0-5.5 m/s in May-August.
The relative humidity is high during June-September (60-85 %) and
marginally decreases during rest of the year (30-80 %). The sky is generally
clear or lightly clouded excepting during monsoon period. Visibility is good
throughout the year but visibility of less than 1 km can be expected for a few
days during the winter months.
3.3 Marine environment
The Gulf has maximum depth that varies from 20 m at the head (Kandla -
Navlakhi) to 60 m in the outer regions (Okha). The actual fairway however is
obstructed due to the presence of several shoals, needing periodic dredging in
some areas, to facilitate navigation to the Kandla Port. The high tidal influx
covers low-lying areas of about 1500 km2 comprising a network of creeks and
alluvial marshy tidal flats in the interior region. All along the coast, very few rivers
drain into the Gulf and they carry only a small quantity of freshwater, except
during brief monsoon. The southern shore has numerous islands and inlets
covered with mangroves and surrounded by coral reefs. The northern shore is
predominantly sandy or muddy confronted by numerous shoals.
3.3.1 Physical processes
Tides in the Gulf are mixed, predominantly semidiurnal type with a large
diurnal inequality. The tidal front enters the Gulf from the west and due to
shallow inner regions and narrowing cross-section, the tidal amplitude increases
considerably, upstream of Vadinar. Thus the mean spring tidal range of 3.0 m at

20
Okha increases to 4.7 m at Sikka and further to 6.4 m at Navlakhi along the
southern shore of the Gulf. The phase lag between Okha and Navlakhi it is 180-
200 min.
Circulation in the Gulf is mainly controlled by tidal flows and bathymetry,
though wind effect also prevails to some extent. The maximum currents are
moderate (0.7-1.4 m/s) and surface to bottom variations are minor.
3.3.2 Water quality
The water quality of the Gulf has been investigated through many site-
specific studies during 1985 – 2008. Most of these investigations were not
conducted simultaneously covering the Gulf but as and when required for a
specific project. The relevant results emerging from these studies are
summarized in the following table for the premonsoon season at specific
locations along the southern Gulf:
Parameter Okha Vadinar Sikka Navlakhi
Temp (oC) 24.9-27.5 25.0-29.2 24.4-28.7 25.9-30.5
pH 8.0-8.2 7.8-8.3 8.0-8.4 8.0-8.3
SS (mg/l) 27-31 9-35 6-50 18-385
Salinity (ppt) 36.2-38.5 36.4-38.6 36.9-39.4 38.5-45.0
DO (mg/l) 3.1-7.4 4.6-7.9 2.3-8.0 2.9-7.1
BOD (mg/l) 0.2-4.2 0.2-3.3 0.2-4.1 0.3-3.5
PO43--P (µmol/l) 0.3-2.2 <0.1-3.1 0.2-4.1 0.2-4.1
NO3--N (µmol/l) 1.2-10.7 0.7-8.4 0.1-7.6 0.6-15.1
NO2--N (µmol/l) 0.1-0.7 <0.1-0.6 0.1-0.5 0.1-1.1
NH4+-N (µmol/l) <0.1-2.9 <0.1-2.9 <0.1-2.0 0.1-1.9
PHc (µg/l) 1-13 4-12 <1-18 1-6
Phenols (µg/l) 134-190 9-48 5-168 1-114
The annual variation of water temperature is between 24 and 30o C though
the air temperatures can exceed 40o C during summer. Localised higher water
temperatures upto 35o C however have been reported in isolated water pools
formed in shallow intertidal depressions, during low tide.
SS is highly variable (6-385 mg/l), spatially as well as temporally, and
largely result from the dispersion of fine sediment from the bed and the intertidal
mudflats, by tidal movements. Evidently, nearshore shallow regions invariably
sustain higher SS as compared to the central portions of the Gulf. The region

21
between Okha and Sikka has low SS varying within a narrow range (6 – 50 mg/l)
whereas the inner Gulf areas sustain markedly higher SS, sometimes in excess
of 100 mg/l.
Average pH of the Gulf water is remarkably constant (7.8-8.3) and is
within the range expected for the coastal tropical seas. The evaporation exceeds
precipitation leading to salinities markedly higher than that of the typical seawater
(35.5 ppt). This is particularly evident in the inner Gulf where salinities as high as
40 ppt commonly occur off Kandla and Navlakhi. Although the salinities
decrease considerably for a brief period in some creeks of the Little Gulf of
Kachchh under the influence of monsoonal runoff, the impact of this decrease in
the Gulf proper is small and salinities exceed 36 ppt off Okha and Sikka during
normal monsoon periods.
The average DO is fairly high (4 - 7 ml/l) and the BOD is low (<0.1 - 4
mg/l) indicating good oxidising conditions. Hence, the organic load in the water
column is considered to be effectively oxidised. The nutrients (PO43--P, NO3
--N,
NO2--N, NH4
+-N) are variable but generally low and of the order expected for
natural coastal waters. Their levels however are marginally high in the Kandla-
Navlakhi segment. The networks of creeks of the Little Gulf of Kachchh sustain
relatively high natural concentrations of nutrients perhaps due to high
regeneration rates. As expected for an unpolluted coastal environment, the
concentrations of PHc and phenols are low.
3.3.3 Sediment quality
Channel portion of the Gulf extending from the mouth to upstream of Sikka
is rocky with sediments confined only to the margins. The nearshore sediment
that consists of light grey silt and clay and fine sand with patches of coarse sand
in-between, is poorly sorted with highly variable skewness. The major source of
this sediment is considered to be the shore material and the load transported by
the Indus River. The portion of sediment derived from the hinterland is
considered to be small because of the low run-off. Moreover, the streams
discharging in the Gulf (during brief monsoon season) are short with dams
constructed on many of them.

22
The concentrations of heavy metals such as chromium, manganese,
cobalt, nickel, copper, zinc, mercury, lead and cadmium as well as organic
carbon and phosphorus in the sediment of the Gulf based on the available
information are summarised in the following table:
Constituent Okha Vadinar Sikka Kandla
Al (%) 0.8-8.1 3.7-9.6 1.5-8.4 1.7-7.9
Cr (µg/g) 12-112 30-87 6-127 9-103
Mn (mg/g) 0.2-1.7 0.5-1.2 0.4-3.0 0.4-1.3
Fe (%) 0.9-4.4 1.4-4.9 1-9.8 0.9-6.2
Co (µg/g) 1-29 2-78 9-47 9-32
Ni (µg/g) 10-60 31-70 11-47 15-60
Cu (µg/g) 5-34 31-70 21-112 11-51
Zn (µg/g) 13-92 44-134 15-109 18-89
Hg (ng/g) 9-120 8-130 <5-260 70-260
Pb (µg/g) 11-36 1-62 <2-21 7-17
Cd (µg/g) 0.04-0.2 0.05-0.6 0.1-1.2 0.04-1.1
C (%) 0.1-0.7 0.1-1.1 0.1-1.0 0.2-1.5
P (%) 349-746 234-1188 210-953 318-845
PHc (µg/l) <0.1-3.1 0.2-2.3 <0.1-1.0 <0.1-21.6
These results indicate wide variations in the concentrations of metals.
Such variations are often observed for coastal sediments mainly because of wide
changes in sediment texture and contents of aluminium and iron with which the
trace constituents are frequently associated. The concentrations of PHc are also
low though large quantities of petroleum crude and its products are handled at
Vadinar, Sikka, Mundra and Kandla.
3.3.4 Flora and fauna
The Gulf abounds in marine wealth and is considered as one of the
biologically rich marine habitat along the west coast of India. The marine flora is
highly varied, which includes sand dune vegetation, mangroves, seagrasses,
macrophytes and phytoplankton. The dominant species of sand dune flora are
Euphorbia caudicifolia, E.nerifolia, Aloevera sp, Ephedra foliata, Urochodra
setulosa, Sporobolus maderaspatenus, Eragrostis unioloides, Calotropis procera,
Fimbristylis sp, Indigofera sp and Ipomoea pescaprae. The common seagrasses

23
found growing on the mud flats are Halophila ovata, H.beccarii and Zostrea
marina.
The most common marine algal species are Ulva fasciata, U.reticulata,
Enteromorpha intenstinalis, Dictyota sp, Hypnea musciformis, Sargassum
tennerimum, S.ilicifolium, Gracilaria corticata, Cystocera sp, Padina
tetrastomatica, Corallina sp, Laurencia sp, Caulerpa racemosa, C.peltata,
Bryopsis sp, Turbinaria sp, Ectocarpus sp, Acanthophora sp, Chondria sp, and
Codium sp.
The primary production of the water column as assessed from chlorophyll
a concentrations is relatively high in the outer Gulf but decreases in the inner
regions. The major phytoplankton genera are Rhizosolenia, Synedra,
Chaetoceros, Navicula, Nitzschia, Pleurosigma, Thalassiothrix, Biddulphia,
Stauroneis, Coscinodiscus and Skeletonema.
The Gulf has a vast intertidal area with rich biota. Sheltered bays, creeks
and mud flats provide ideal sites for mangrove vegetation over an estimated area
of about 965 km2. The formations are of open scrubby type, with isolated and
discontinuous distribution from Kandla- Navlakhi in the northeast to Jodia,
Jamnagar, Sikka, Salaya and Okha in the southwest, as also at Pirotan, Positra,
Dohlani and Dwarka. Vast stretches of mangroves also exist along the northern
shore of the Gulf. The dominant species of mangroves are Avicennia marina var
acutissima, A officinalis, Bruguiera parviflora, B gymnorphiza, Rhizophora
mucronata, R apiculata, Ageiceros corniculata and Sonneratia apetata alongwith
the associated species of Salicornia brachiata, Sueda fruticosa, Artiplex stocksii
and a lichen, Rosella montana.
The marine fauna of the Gulf is rich, both in variety and abundance.
Sponges having an array of colours are seen, both in the intertidal and subtidal
biotopes. The common species of sponge is Adocia sp, associated with coral
reef fauna. In sandy and silty mud shores, Tetilla dactyloidea (Carter) is
common. The most frequently encountered hydrozoans are Sertularia sp and
Plumularia sp. The giant sea anemone (Stoichactis gigantum) is a common sight
24
in the coral ecosystem. Sea anemones, belonging to Anemonia, Bunodactis,
Paracondylactis, Anthopleura and Metapeachia, are wide spread. A zoantharian,
Gemmaria sp, is found forming extensive hexagonal green mats in the coral
pools. Another interesting actiniarian is the Cerianthus sp, found in tubes in the
soft mud.
One of the most interesting biotic features of the Gulf is the presence of
living corals, thriving as patches, rather than reefs, either on the intertidal sand
stones or on the surface of wave-cut, eroded shallow banks along the southern
shore of the Gulf. The species diversity however is poor with identification of 44
species of Scleractinian and 12 species of soft corals.
A number of polychaete worms, both sedentaria and errantia, with the
dominant genera of Eurythoe, Terebella, Polynoe, Iphione and Nereis are rather
common. Amongst a variety of sipunculid and echiuroid worms, the dominant
species are Dendrosromum sp, Asphidosiphon sp and Ikadella misakiensis
(Ikeda). The intertidal crustacean fauna is very rich and equally diverse.
Amongst the invertebrates, the molluscs have the highest representatives.
As many as 92 species of bivalves, 55 species of gastropods, 3 species of
cephalopods and 2 species each of scaphopods and amphineurans have been
reported. The most notable members of the molluscan fauna are octopus, pearl
oyster and a variety of chanks, including the sacred chank.
The Gulf has a variety of exploitable species of finfishes and shellfishes.
The scienides, polynemids, perches, eels, cat-fishes, elasmobranchs and prawns
are commercially important groups with an average catch of 1.4x10⁵ t/y. Fishing
grounds for Ghol, Karkara, Khaga, Dhoma, Magra and Musi exist in the Gulf.
The Gulf region offers plenty of facilities for feeding, breeding and shelter
to a variety of birds. A large number of migratory birds passes through the Gulf
and a small population of most species comprising mainly of juveniles and non-
breeding adults take shelter in this area during summer. Salt works spread-out
along the coast, are also important for feeding and breeding of birds.

25
Because of its high biogeographical importance and rich flora and fauna,
several areas along the southern Gulf are notified under the Marine National
Park (MNP) (16,289 ha) and the Marine Sanctuary (MS) (29,503 ha).

26
4 SITE SPECIFIC MARINE ENVIRONMENT
Pathfinder Inlet is a minor creek along the southern shore of the Gulf
where VOTL has its Jetty Terminal to the North of the KPT’s service jetty.
Pathfinder Inlet is connected to the adjacent Salaya Creek through the narrow
and shallow Blunt Channel (Figure 1.2.1). By virtue of high tidal ranges and flat
land topography, the seawater spreads through an intricate network of tidal
channels to these main waterways of the Vadinar-Salaya region inundating large
intertidal tracks. The fishing jetty of Salaya is located on one such inlet of the
Salaya Creek. Kalubhar Reef which separates Pathfinder and Salaya Creeks has
stretches of mangroves and wave cut bank which sustain corals. A gas-lit
lighthouse is set-up at the north-west side of the Kalubhar Tapu. The eastern
shore of the Pathfinder Inlet, where the VOTL Jetty Terminal is located, is
bordered by the Narara Reef which also sustains living corals in patches
particularly at the zone open to the Gulf.
The intertidal segments which in places have an expanse of more than 4
km generally averages around 1-2 km. The intertidal area consists of mudflats
formed due to the settlement of mud on hard substratum. Some of these
mudflats and creeks have mangrove habitats in patches. Selected areas of the
Narara and Kalubhar Reefs fall under MNP/MS. The proposed Berths C and D
are away from these protected areas.
Due to the occurrence of deep and sheltered waters along the southern
coast of the Gulf between Salaya and Sikka, the region is attractive for unloading
of crude oil from Very Large Crude Carriers (VLCCs) via SPMs. Five such SPMs
are operational off Salaya-Sikka and a few more are planned including the SPM-2
of VOTL.
4.1 Physical processes
Tides, currents and circulation are the important physical processes which
govern the flushing characteristics of shallow coastal water bodies.

27
4.1.1 Tides
Tides in the Gulf are of mixed, predominantly semidiurnal type with a large
diurnal inequality. The tidal front enters the Gulf from the west and due to
shallow inner regions and narrowing cross-section, the tidal amplitude increases
considerably, upstream of Vadinar. The tidal elevations (m) along the Gulf are as
follows:
Location MHWS MHWN MLWN MLWS MSL
Okha 3.47 2.96 1.20 0.41 2.0
Sikka 5.38 4.35 1.74 0.71 3.0
Rozi 5.87 5.40 1.89 1.0 3.6
Kandla 6.66 5.17 1.81 0.78 3.9
Navlakhi 7.21 6.16 2.14 0.78 4.2
Navinal 6.09 5.65 1.81 0.37 3.4
Pathfinder Inlet is also under fairly high tidal influence with spring and
neap tide ranges of about 6 and 4 m respectively. Tide recorded for 15 days
commencing from 17 May 2007 in the Salaya Creek (Lat 22°26’18”N; Long
69°33’15”E) indicated maximum and minimum tidal ranges of 5.5 and 3.5 m
respectively during the period of measurements. The NHO Chart No 2051 gives
the following tidal information for the Salaya Creek:
Mean High High Water (m) 5.4
Mean Low High Water (m) 5.0
Mean High Low Water (m) 2.5
Mean Low Low Water (m) 1.6
Mean Sea Level (m) 3.6
The following table compares the tidal elevations (m) and phase lag (h)
for the spring tide (1 February 1999) and neap tide (10-11 February 1999) at
Vadinar and Bedi Bandar, which are located 18 km and 50 km respectively to the
east of Salaya.
Spring Neap
Vadinar Bedi Bandar Vadinar Bedi Bandar
Time Height Time Height Time Height Time Height
0236 5.83 0218 6.23 2224 4.62 2154 4.86
0848 0.88 0833 1.21 0430 2.27 0407 2.48
1430 4.94 1423 5.34 1018 3.96 0947 4.46
2042 -0.28 2031 0.68 1624 1.00 1619 1.55
Thus the tide at Vadinar which is comparable with the tide at the Salaya
Creek is lower than the tide at Bedi Bandar.

28
4.1.2 Currents and circulation
Currents in the Pathfinder Inlet are mainly tide-induced and vary
considerably with the tidal phase. The measurements made in the mouth
segment of the Pathfinder Inlet indicated maximum currents of 0.8 – 1.0 m/s. The
currents were predominantly along the axis of the inlet that is in the North (Flood)
– South (Ebb) direction as expected and cross flows were weak except during
spring tide (0.4 m/s; max). Variations in surface and bottom speeds at a given
time were minor. The currents recorded at Salaya Creek from 11 to 21 April
2007 (Figure 4.1.1) indicated maximum current speeds of 0.3-0.7 m/s averaging
at 0.4 m/s.
In the Gulf proper off Vadinar the surface currents (0.8 m/s) were in the
east-northeast direction during flood and in the west direction during ebb
indicating predominant East-West flow.
Circulation in the Pathfinder Inlet as well as the Salaya Creek was
evaluated through float trajectories. In these measurements a neutrally buoyant
float was released at the predetermined location and was tracked over several
hours to obtain the trajectory by plotting its position with time. Representative
trajectories for the Pathfinder Inlet and the Salaya Creek are illustrated in Figures
4.1.2 to 4.1.4. Such trajectories give an indication of probable circulation in the
water body with the progress of the tide.
The float released to the South of the Jetty Terminal during different tidal
phases was tracked for a full tide cycle on two occasions (Figures 4.1.2 and
4.1.3). The results indicated an elliptical circulation in the inlet during neap as
well as spring with excursion lengths of 3.1 and 4.7 km respectively. The
trajectory (Figure 4.1.4) in the Salaya Creek also indicated an elliptical circulation
with the major axis of the ellipse of about 3.4 km. The circulation trajectories
suggested that the exchange of water between the Pathfinder Inlet and the
Salaya Creek through the Blunt Channel was not dominant with the flow through
the main Gulf governing the circulation in these creeks. The significantly high
29
tidal ranges and high tidal excursion suggested good flushing characteristics of
the two creeks.
The general surface circulation in deeper area off Vadinar (20 – 40 m
depth contour) was predominantly elliptical over a tidal cycle with the major axis
of the ellipse varying between 5 and 15 km depending on the tidal stage.
4.1.3 Bathymetry
The general bathymetry of the Pathfinder Inlet and the adjacent Gulf area
is available in the Hydrographic Chart 669 published in 2004. Detailed
bathymetry of the Pathfinder Inlet North of the Nichoni Creek was also charted by
VOTL in 2007 and is illustrated in Figure 1.1.2. The outer creek is fairly deep with
the 20 – 25 m water depth in the central portion. The 20 m depth contour is in the
vicinity of the eastern shore where the Berths C and D will be constructed.
Hence, no dredging is required for navigating the ships to the proposed berths.
4.2 Water quality
The KPT jetty at the Pathfinder Inlet is operational for more than two
decades and its primary function has been to provide support vessels for
operations of IOC’s SPMs. VOTL Jetty Terminal has been established only
recently and has been operating since 2007. Hence, activities which could
potentially influence the water quality of the Pathfinder Inlet are essentially
related to movement of ships, loading – unloading at jetties and ship and jetty
related wastes. These perturbations are expected to be minor. In view of
discussion in Section 4.1.2, the activities in the adjacent Salaya Creek are
unlikely to influence the water quality of the Pathfinder Inlet.
During 2007 – 08 the water quality was assessed at several stations
(Figure 1.2.1) covering the Pathfinder Inlet, Salaya Creek, and the coastal Gulf
off Vadinar. The results are presented in Tables 4.2.1 to 4.2.8. The individual
water quality parameter is discussed below.

30
4.2.1 Temperature
Since most aquatic animals are cold blooded, water temperature
regulates their metabolism and ability to survive and reproduce effectively.
Hence artificially induced changes such as those by warm water releases may
alter indigenous ecosystems.
From Tables 4.2.1 to 4.2.8 it is evident that the water temperature in the
region varied in 26.0 – 29.5o C range during premonsoon of 2007-08 though
variations from 19 to 31o C have been recorded off Vadinar attributed to seasonal
changes in the air temperature. The average variations in temperature in the
region recorded during the recent study were as follows:
Temperature (oC) Site
Apr 07 Apr 08
Pathfinder Inlet (Outer) 27.5 28.5
Pathfinder Inlet (Inner) 27.8 28.6
Blunt Channel 28.5 28.5
Salaya Creek 29.0 29.0
Effluent release site 27.5 27.6
SPM site 27.2 27.8
Gulf (20 m depth contour) 27.5 28.9
Gulf (40 m depth contour) 26.8 28.3
The minor variations in temperature were due to measurements
conducted during different time of the day. On several occasions the surface
waters had a marginally higher value than at the bottom at a given time
particularly at deeper zones due to the differential effect of solar heating. High
tidal movements and swift currents rendered the waters thermally well-mixed
vertically as well as laterally.
4.2.2 pH
The principal systems that regulate the pH of seawater are the carbonate
system consisting of CO2, H2CO3, HCO3- and CO3
2-; salt content; and alkalinity
due to borates. Because of the buffering capacity of seawater, generally
seawater pH has limited variability (7.8-8.3). In shallow, biologically active
tropical waters, large diurnal pH changes - from 7.3 to 9.5, may occur naturally
because of photosynthesis. Though pH range of 5 to 9 is not directly harmful to
the aquatic life, such changes can make many common pollutants more toxic.

31
For instance pH range of 5 to 6 may become lethal when CO2 is liberated from
bicarbonates in water.
During the present monitoring the pH of water off Vadinar varied in 7.6 –
8.3 range with the average variations at different areas given in the following
table:
pH Site
Apr 07 Apr 08
Pathfinder Inlet (Outer) 7.7 8.2
Pathfinder Inlet (Inner) 7.8 8.2
Blunt Channel 7.9 -
Salaya Creek 8.0 8.1
Effluent release site 7.7 8.2
SPM site 7.9 8.3
Gulf (20 m depth contour) 7.9 8.2
Gulf (40 m depth contour) 7.8 8.2
Thus the average pH off of the Gulf off Vadinar was in the range expected
for seawater with the absence of significant spatial variations. These values
compare well with the pH of the Gulf in general.
4.2.3 Suspended Solids
For nearshore areas, clay, silt and plankton form important component of
SS. Anthropogenic discharges add a variety of SS depending upon the source.
Since the major contribution comes from the disturbance of bed and shore
sediment, energy of the region, such as currents, is the vital influencing factor for
SS and typically leads to high values in the bottom water.
The immediate effect of SS is an increase in turbidity which reduces light
intensity and the depth of photic zone leading to decrease in primary production
and fish food. SS in the water column also adversely affects certain sensitive
populations through mortality, reducing growth rate and resistance to diseases,
preventing proper development of fish eggs and larvae, modifying natural
movement and migration and reducing abundance of available food. SS settling
on the bed can damage the benthic invertebrate population, block spawning etc.
If SS contains organic matter then it increases oxygen demand in the water
column and its settlement on the bed can make the sediment deficient in DO.

32
The concentration of SS off Vadinar varied in 18 – 86 mg/l range during
2007 – 08 without any spatial and temporal trends though the content was often
high in the bottom water as expected. The average variations in SS (mg/l) at
different sites off Vadinar were as follows:
SS (mg/l) Site
Apr 07 Apr 08
Pathfinder Inlet (Outer) 21 31
Pathfinder Inlet (Inner) 28 41
Blunt Channel 32 -
Salaya Creek 42 28
Effluent release site 21 23
SPM site 30 38
Gulf (20 m depth contour) 29 42
Gulf (40 m depth contour) 21 21
The above table indicated relatively low SS in seawater of the region as
expected for the outer Gulf (Section 3.3.2). Though the Pathfinder Inlet and
Salaya Creek have extensive mudflats, the SS in water was closely comparable
to that recorded in the open Gulf.
4.2.4 Salinity
Salinity is an important parameter that indicates the inflow of freshwater in
marine areas. Normally seawater salinity is 35.5 ppt which may vary depending
on competition between evaporation and precipitation and freshwater addition.
Thus for instance, during premonsoon evaporation exceeds precipitation leading
to salinities higher than 35.5 ppt, while, during monsoon and postmonsoon the
salinities can be markedly lower along the west coast of India.
Biota is generally acclimatized to a certain range of salinity where they
thrive. Hence, wide changes in salinity can result in adoption with modification
and dominance of selected species in the lower order while higher order biota
may migrate. Sudden changes in salinity may even kill certain biota including
sensitive fish stocks due to inability of these organisms to adapt to abrupt salinity
changes.
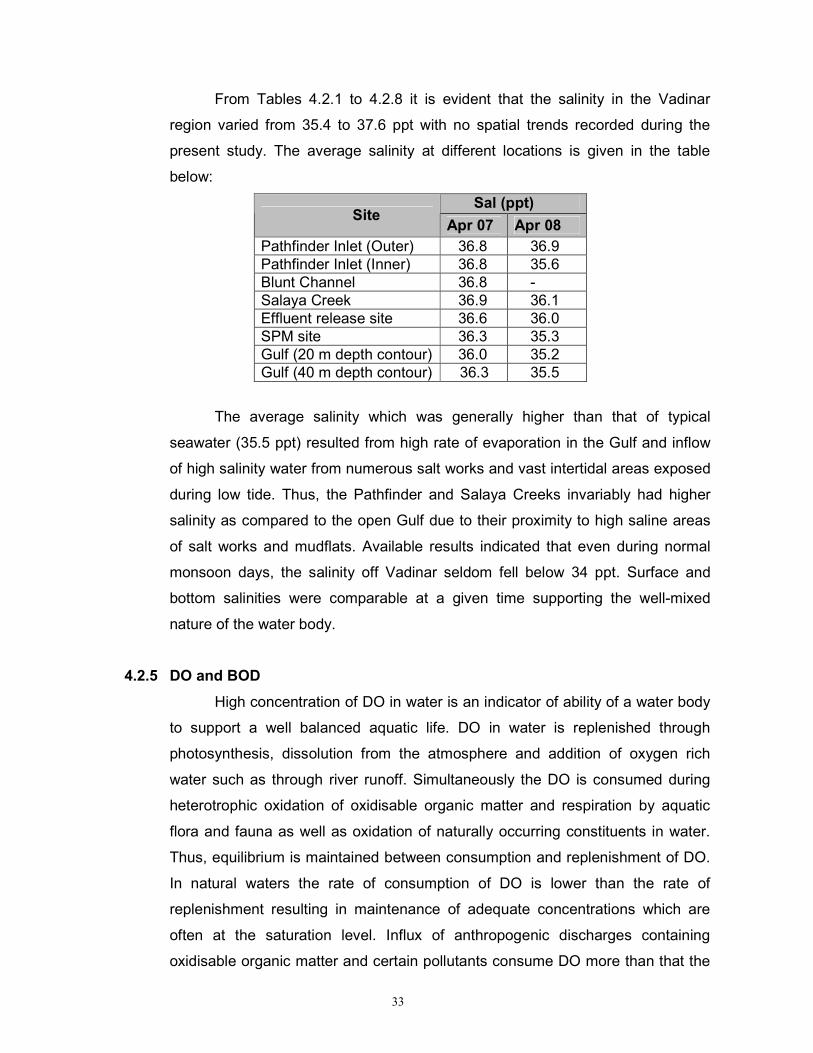
33
From Tables 4.2.1 to 4.2.8 it is evident that the salinity in the Vadinar
region varied from 35.4 to 37.6 ppt with no spatial trends recorded during the
present study. The average salinity at different locations is given in the table
below:
Sal (ppt) Site
Apr 07 Apr 08
Pathfinder Inlet (Outer) 36.8 36.9
Pathfinder Inlet (Inner) 36.8 35.6
Blunt Channel 36.8 -
Salaya Creek 36.9 36.1
Effluent release site 36.6 36.0
SPM site 36.3 35.3
Gulf (20 m depth contour) 36.0 35.2
Gulf (40 m depth contour) 36.3 35.5
The average salinity which was generally higher than that of typical
seawater (35.5 ppt) resulted from high rate of evaporation in the Gulf and inflow
of high salinity water from numerous salt works and vast intertidal areas exposed
during low tide. Thus, the Pathfinder and Salaya Creeks invariably had higher
salinity as compared to the open Gulf due to their proximity to high saline areas
of salt works and mudflats. Available results indicated that even during normal
monsoon days, the salinity off Vadinar seldom fell below 34 ppt. Surface and
bottom salinities were comparable at a given time supporting the well-mixed
nature of the water body.
4.2.5 DO and BOD
High concentration of DO in water is an indicator of ability of a water body
to support a well balanced aquatic life. DO in water is replenished through
photosynthesis, dissolution from the atmosphere and addition of oxygen rich
water such as through river runoff. Simultaneously the DO is consumed during
heterotrophic oxidation of oxidisable organic matter and respiration by aquatic
flora and fauna as well as oxidation of naturally occurring constituents in water.
Thus, equilibrium is maintained between consumption and replenishment of DO.
In natural waters the rate of consumption of DO is lower than the rate of
replenishment resulting in maintenance of adequate concentrations which are
often at the saturation level. Influx of anthropogenic discharges containing
oxidisable organic matter and certain pollutants consume DO more than that the

34
water body can replenish creating undersaturation which, in extreme cases, may
lead to onset of septic conditions with mal-odorous emissions thereby degrading
the ecological quality.
It is difficult to arrive at the threshold limit of DO for aquatic life, since the
existent composite aquatic life has variable demand for DO depending on their
composition, age, activity, nutritional status etc. Nevertheless, it has been
observed that below 2 ml/l concentration of DO, good and diversified aquatic life
may not be maintained since feeding of many organisms is diminished or
stopped and their growth is retarded at low DO levels. Although there is no
unanimity on the level of DO to be maintained in coastal waters and estuaries
conducive to biota, it is considered that the level should not fall below 3 ml/l for
prolonged periods.
The DO off Vadinar varied from 2.8 to 5.9 ml/l with 98 % of values
exceeding 4 ml/l. The average DO within the project area varied as follows:
DO (ml/l) Site
Apr 07 Apr 08
Pathfinder Inlet (Outer) 4.6 4.2
Pathfinder Inlet (Inner) 4.4 4.4
Blunt Channel 4.4 -
Salaya Creek 4.1 4.5
Effluent release site 4.7 4.6
SPM site 5.0 4.2
Gulf (20 m depth contour) 4.5 4.6
Gulf (40 m depth contour) 5.2 4.5
Depending on the type of uses and activities, the Central Pollution Control
Board (CPCB) has specified water quality criteria for marine coastal waters to
determine its suitability for a particular purpose. The following criteria are
specified for salt pans, shell fishing, mariculture and ecologically sensitive zones:

35
Parameter Standard
pH range 6.5 – 8.5
DO 5.0 mg/l or 60 % saturation value whichever is higher
Colour and odour No noticeable colour or offensive odour
Floating matter Nothing obnoxious or detrimental for use purpose
Suspended solids None from sewage or industrial waste origin
Oil & grease (including petroleum products)
0.1 mg/l
Heavy metals: Hg, Pb, Cd
0.01 mg/l for each metal
The average DO off Vadinar fell in the range 4.1 – 5.2 ml/l (5.8 – 7.4 mg/l)
and was generally saturated to the extent of 95 – 110 % indicating suitability of
the area to sustain diversified and healthy ecology. Tables 4.2.1 – 4.2.8 indicate
occurrence of high DO throughout the water column with the bottom values
comparable to that at the surface. It therefore appears that the operations of EOL
including functioning of Jetty Terminal had not influenced the DO levels in the
Pathfinder Inlet as well as the coastal Gulf off Vadinar.
Consumption of DO during heterotrophic degradation of oxidisable organic
matter creates oxygen demand popularly termed as the BOD. Presence of
sufficient DO through replenishment keeps this demand low. However, input of
oxidisable organic matter more than that a water body can assimilate enhances
BOD which is the indicator of unfavourable conditions for aquatic life and
aesthetic quality. The BOD of 1-3 mg/l is common for coastal and inshore waters
and can be upto 5 mg/l in areas of high biological productivity such as the Gulf.
This is because all natural waters contain some oxidizable organic matter of
natural origin that includes a variety of organic compounds in minute quantities,
some of which is derived from the land drainage. The average BOD of the study
area was as follows:
BOD (mg/l) Site
Apr 07 Apr 08
Pathfinder Inlet (Outer) 2.0 0.8
Pathfinder Inlet (Inner) 4.4 2.1
Blunt Channel 2.5 -

36
BOD (mg/l) Site
Apr 07 Apr 08
Salaya Creek 2.7 2.2
Effluent release site 2.4 2.4
SPM site 3.2 3.1
Gulf (20 m depth contour) 1.5 -
Gulf (40 m depth contour) 3.4 -
Thus, the BOD of the creeks as well as the coastal Gulf of Vadinar was
low and was comparable with the other areas of the Gulf (Section 3.2.2).
4.2.6 Phosphorus and nitrogen compounds
Dissolved inorganic phosphorus and nitrogen compounds though present
in low concentrations in natural surface waters, they play an important role in
controlling the production at the primary level and in turn the fishery potential of
the area. However, their high concentrations like those resulting from release of
sewage and industrial effluents rich in their compounds in areas of restricted
water exchange such as some estuaries and creeks, can result in an excessive
growth of algae creating an unhealthy environment.
The major dissolved inorganic species of phosphorus in water is
orthophosphate. The average concentrations of phosphate-phosphorus off
Vadinar were as follows:
PO43--P (µµµµmol/l)
Site Apr 07 Apr 08
Pathfinder Inlet (Outer) 2.9 3.3
Pathfinder Inlet (Inner) 4.1 1.1
Blunt Channel 4.9 -
Salaya Creek 5.1 0.8
Effluent release site 2.7 1.1
SPM site 3.1 0.9
Gulf (20 m depth contour) 4.3 1.5
Gulf (40 m depth contour) 7.6 0.6
These results indicated fairly high concentrations of phosphate off Vadinar
during April 2007 as compared to April 2008. The source of these high values
could not be ascertained. The concentrations recorded during April 2008 were
however of the order expected for the outer Gulf. Relative high concentrations of
phosphorus in the bottom water (Tables 4.2.1-4.2.8) in many samples suggested

37
release of phosphorus from the bed sediment. This has also been reported for
other areas of the Gulf.
Nitrate, nitrite and ammonia are the major species of nitrogen of which
nitrate is generally dominant. Nitrite is thermodynamically unstable and ammonia
is biochemically oxidized to nitrate via nitrite apart from being directly assimilated
by algae. Hence, concentrations of nitrite and ammonia are often very low in
natural waters. In well-oxygenated coastal waters, nitrate-nitrogen is the
dominant species of nitrogen. Its concentration off Vadinar varied as follows:
NO3--N (µµµµmol/l)
Site Apr 07 Apr 08
Pathfinder Inlet (Outer) 1.2 1.3
Pathfinder Inlet (Inner) 1.7 2.1
Blunt Channel 5.6 -
Salaya Creek 6.2 4.0
Effluent release site 1.9 4.7
SPM site 4.1 4.6
Gulf (20 m depth contour) 10 4.5
Gulf (40 m depth contour) 3.3 3.8
The nitrogen : phosphorus molar ration in natural seawater is known to be
around 16. Based on this ratio much higher concentrations of nitrate-nitrogen
were expected off Vadinar. The observed low concentrations probably suggest
that waters off Vadinar were deficient in nitrogen and hence the controlling
nutrient for primary productivity.
The concentrations of nitrite-nitrogen in water off Vadinar varied as
follows:
NO2--N (µµµµmol/l)
Site Apr 07 Apr 08
Pathfinder Inlet (Outer) 0.6 0.3
Pathfinder Inlet (Inner) 0.3 0.4
Blunt Channel 0.2 -
Salaya Creek 0.2 0.5
Effluent release site 0.2 0.6
SPM site 0.2 0.4
Gulf (20 m depth contour) 0.5 0.6
Gulf (40 m depth contour) 0.3 0.4

38
These concentrations were low and in the range expected for other areas
of the Gulf.
The concentrations of ammonia-nitrogen in the Gulf off Vadinar varied as
given in the following table:
NH4+-N (µµµµmol/l)
Site Apr 07 Apr 08
Pathfinder Inlet (Outer) 0.2 0.6
Pathfinder Inlet (Inner) 1.0 0.7
Blunt Channel 0.3 -
Salaya Creek 1.3 0.2
Effluent release site 1.4 0.3
SPM site 3.1 0.3
Gulf (20 m depth contour) 0.6 0.1
Gulf (40 m depth contour) 0.3 0.2
These levels were low and in the range commonly observed for unpolluted
coastal waters including other areas of the Gulf.
4.2.7 PHc
Oil enters the marine environment by a number of different routes as a
result of both human activities and natural processes. By far, the biggest
contribution comes from terrestrial sources, mainly in the form of municipal and
industrial wastes. The heavy components of crude oil are virtually insoluble in
seawater whereas lighter compounds, particularly aromatic hydrocarbons such
as benzene and toluene, are slightly soluble. However these components are
also the most volatile and so are lost very rapidly by evaporation. Concentrations
of dissolved hydrocarbons thus rarely exceed 1 mg/l even in areas receiving their
fluxes.
The concentrations of PHc in in water off the Vadinar region are given in
the following table:
PHc (µµµµg/l) Site
Apr 07 Apr 08
Pathfinder Inlet (Outer) 15.0 27.8
Pathfinder Inlet (Inner) 9.0 24.3
Blunt Channel 15.0 15.0
Salaya Creek 10.5 25.0

39
PHc (µµµµg/l) Site
Apr 07 Apr 08
Effluent release site 27.9 28.5
SPM site 19.7 39.7
Gulf (20 m depth contour) 18.2 22.2
Gulf (40 m depth contour) 10.5 19.4
These results indicated a variable trend in the concentration of PHc. The
levels however were much below the concentration of oil & grease recommended
(100 µg/l) for salt pans, shell fishing and ecologically sensitive zones by the
CPCB. The variable concentrations of PHc often occur in areas of shipping lanes
because the petroleum being sparingly soluble in water, its distribution is often
patchy when it enters the aquatic environment.
4.2.8 Phenols
Phenols in marine environment generally originate through land-based
anthropogenic discharges. They are generated as by-products in manufacturing
processes of coke, paper and pulp processing, coal gas liquefaction and
produced from hydrocarbons in petrochemical industries. They are used on
large scale in fungicides, antimicrobials, wood preservatives, pharmaceuticals,
dyes, pesticides, resins etc. Hence they become important constituent of
domestic and industrial effluents.
The concentrations of phenols in the Pathfinder Inlet, Salaya Creek and the
Gulf off Vadinar varied as follows:
Phenols (µµµµg/l) Site
Apr 07 Apr 08
Pathfinder Inlet (Outer) 44 56
Pathfinder Inlet (Inner) 31 51
Blunt Channel 24 24
Salaya Creek 22 21
Effluent release site 31 27
SPM site - 45
Gulf (20 m depth contour) 17 19
Gulf (40 m depth contour) 46 37
These concentrations were low and of the order recorded in the other
parts of the Gulf.

40
The overall assessment indicates that the water quality of the Salaya
Creek, Pathfinder Inlet and the Gulf off Vadinar is comparable without marked
spatial trends.
4.3 Sediment quality
Determination of trace pollutants such as heavy metals and organic
compounds in water often reveals fluctuations as the concentrations depend on
the location and time of sampling, nature of pollutant and chemical
characteristics of water. Moreover, several pollutants get rapidly fixed to
particulate suspended matter and/or hydrolysed and thus removed from the
water column. In several instances, it is observed that even close to a location of
effluent release, the metal content in the receiving water often decreases to a
normal value making assessment of contamination through analysis of water, a
difficult task.
The pollutants adsorbed by the particulate matter are ultimately
transferred to the bed sediment on settling. Evidently, concentrations of
pollutants in sediment increase over a period of time in regions receiving their
fluxes. Hence, sediment can serve as a useful indicator of certain trace
pollutants such as heavy metals and PHc.
4.3.1 Texture
The bed sediment of the Pathfinder Inlet, Salaya Creek and the Gulf off
Vadinar was heterogeneous with variable texture as reflected in the following
table:
Percent Site
Sand Silt Clay
Pathfinder Inlet (Outer) 66.6 28.0 5.4
Pathfinder Inlet (Inner) 2.8 90.8 6.4
Blunt Channel 90.2 4.2 5.6
Salaya Creek 28.1 63.1 8.8
Effluent release site 18.5 75.3 6.2
SPM site 3.2 90.8 6.0
Gulf (20 m depth contour) 12.9 79.3 7.8
Gulf (40 m depth contour) 44.0 50.6 5.4

41
The sediment texture of the mouth area of the Pathfinder Inlet was
dominated by sandy substratum but the bed material of the inner creek was
largely silt with low percentage of sand and clay. The surface sediment of the
Vadinar region was generally silty or sandy with the clay content of less than 10
% (Table 4.3.1).
4.3.2 Heavy metals
The bed sediments of coastal marine areas are mainly derived from the
adjacent land and hence generally have similar lithogenic composition. Apart
from the source rock concentrations of trace metals in natural marine sediments
are also dependant on the concentrations of aluminium and iron and sometimes
manganese due to their association with these metals. The concentrations of
aluminium, iron and manganese varied as follows off Vadinar.
Percent Mn
Site Al Fe (µµµµg/g)
Pathfinder Inlet (Outer) 3.8-4.6 2.5-2.6 492-554
Pathfinder Inlet (Inner) 7.2-7.4 4.1-5.1 613-795
Blunt Channel 4.9 0.6 1295
Salaya Creek 6.4-7.3 4.0-6.2 667-760
Effluent release site 6.7-8.7 4.2-5.1 701-1077
SPM site 7.3-7.4 3.8-4.8 709-1025
Gulf (20 m depth contour) 3.5 -7.0 1.8-4.6 582-597
Gulf (40 m depth contour) 6.0-6.5 3.7-5.2 720-816
Intertidal 0.1-0.3 0.3-0.6 107-154
Thus the concentrations of aluminium, iron and manganese in the
sediments of Vadinar were quite variable. Such variations are common to coastal
sediments due to their general heterogeneity. Hence, the concentrations of trace
metals in these sediments were also expected to vary spatially. The average
concentrations of trace metals in sediment off Vadinar-Salaya are given in the
following table:
(µµµµg/g) Site
Cr Co Ni Cu Zn Hg Pb Cd
Pathfinder Inlet (Outer) 61 26 64 30 64 0.03 23 0.15
Pathfinder Inlet (Inner) 95 34 59 48 75 0.03 18 0.12
Blunt Channel 10 45 73 55 62 0.03 - -
Salaya Creek 91 40 68 58 83 0.02 17 0.14
Effluent release site 10 33 59 43 78 0.03 19 0.13

42
(µµµµg/g) Site
Cr Co Ni Cu Zn Hg Pb Cd
SPM site 97 33 55 42 73 0.03 15 0.18
Gulf (20 m depth contour) 80 29 5 37 49 0.01 5 0.24
Gulf (40 m depth contour) 10 33 50 43 71 0.03 13 0.22
Intertidal 24 20 8 6 19 ND 3.0 0.38
These results indicated that though the concentrations of trace metals
were variable they were in the range expected for the Gulf and represent
baseline concentrations associated with lithogenic sediment.
4.3.3 PHc
The concentration of PHc in sediments off Vadinar is a vital parameter in
the present context due to refinery operations and loading of petroleum products
at the Jetty Terminal. Though large accidental releases of oil are easily sighted
as slicks on the sea surface, minor chronic releases often go unnoticed. Being
immiscible with water, distribution of petroleum is patchy and assessment of
environmental quality through the analysis of water often provides ambiguous
results with concentrations varying widely in the same area depending upon the
PHc captured in the sample. Moreover, petroleum in the marine environment
undergoes weathering leading to its removal from the sea surface thereby
influencing the results of water quality. The residue left after the petroleum
weathers, is adsorbed by SS and ultimately transferred to the sediment. Hence,
sediment of marine areas influenced by refinery operations serves as a useful
indicator of cumulative effect of oil contamination.
The PHc content of the subtidal sediment off Vadinar (Table 4.3.1) varied
as follows:
Site PHc (µµµµg/g; wet)
Pathfinder Inlet (Outer) 0.3-2.7
Pathfinder Inlet (Inner) 0.3-3.0
Blunt Channel 0.1
Salaya Creek 0.2-0.4
Effluent release site 0.6-5.6
SPM site 0.4-4.0
Gulf (20 m depth contour) 0.5-0.8
Gulf (40 m depth contour) 0.5-6.3
Intertidal 0.3-0.4
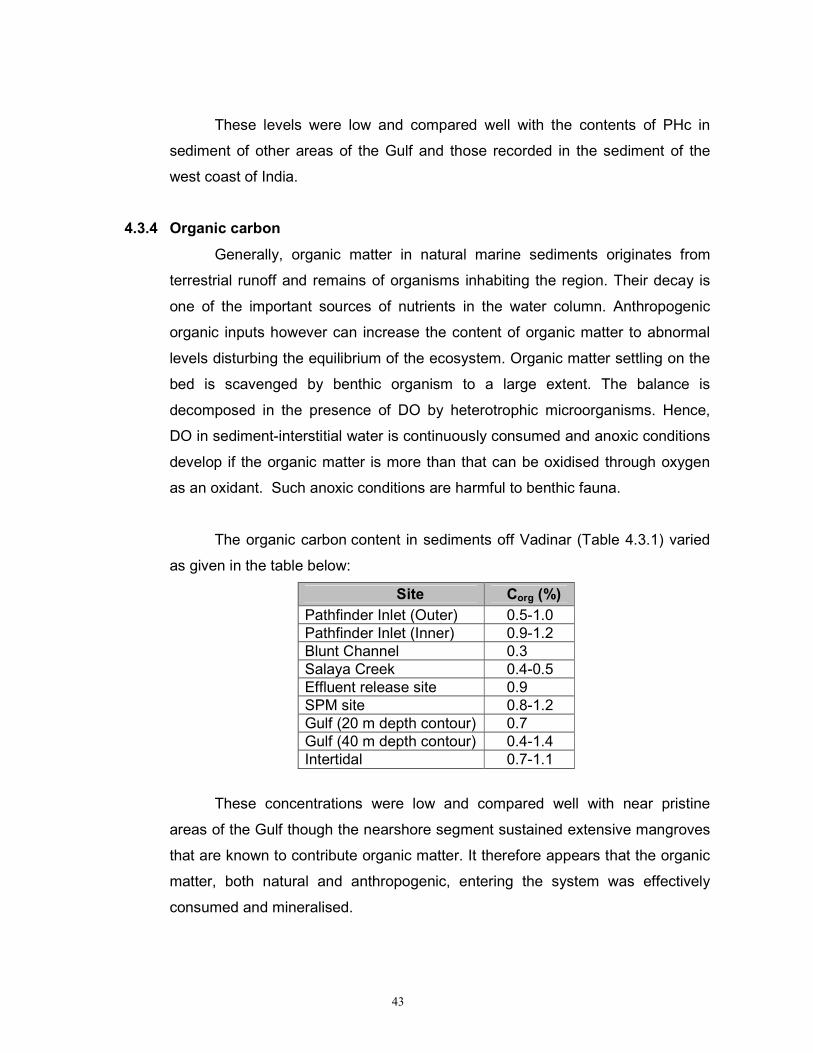
43
These levels were low and compared well with the contents of PHc in
sediment of other areas of the Gulf and those recorded in the sediment of the
west coast of India.
4.3.4 Organic carbon
Generally, organic matter in natural marine sediments originates from
terrestrial runoff and remains of organisms inhabiting the region. Their decay is
one of the important sources of nutrients in the water column. Anthropogenic
organic inputs however can increase the content of organic matter to abnormal
levels disturbing the equilibrium of the ecosystem. Organic matter settling on the
bed is scavenged by benthic organism to a large extent. The balance is
decomposed in the presence of DO by heterotrophic microorganisms. Hence,
DO in sediment-interstitial water is continuously consumed and anoxic conditions
develop if the organic matter is more than that can be oxidised through oxygen
as an oxidant. Such anoxic conditions are harmful to benthic fauna.
The organic carbon content in sediments off Vadinar (Table 4.3.1) varied
as given in the table below:
Site Corg (%)
Pathfinder Inlet (Outer) 0.5-1.0
Pathfinder Inlet (Inner) 0.9-1.2
Blunt Channel 0.3
Salaya Creek 0.4-0.5
Effluent release site 0.9
SPM site 0.8-1.2
Gulf (20 m depth contour) 0.7
Gulf (40 m depth contour) 0.4-1.4
Intertidal 0.7-1.1
These concentrations were low and compared well with near pristine
areas of the Gulf though the nearshore segment sustained extensive mangroves
that are known to contribute organic matter. It therefore appears that the organic
matter, both natural and anthropogenic, entering the system was effectively
consumed and mineralised.

44
4.3.5 Phosphorus
Lithogenic phosphorus in marine sediments is derived from the geological
sources, while, the anthropogenic phosphorus is the result of sewage and
industrial discharges, agricultural runoff etc. The concentration of phosphorus in
sediments off Vadinar (Table 4.3.1) varied as follows:
Site Phosphorus (µg/g)
Pathfinder Inlet (Outer) 144-858
Pathfinder Inlet (Inner) 230-891
Blunt Channel 1037
Salaya Creek 656-1017
Effluent release site 451-914
SPM site 234-905
Gulf (20 m depth contour) 798-843
Gulf (40 m depth contour) 435-843
Intertidal 752-878
The concentrations varied considerably but were comparable to those
recorded in the sediment of other areas of the Gulf and did not indicate its
enrichment in the region.
4.4 Flora and fauna
Despite many changes in the physico-chemical properties of the water
body and seabed sediment, the ultimate consequences of pollutants may be
reflected on the biological system. Hence, the investigations of different
communities inhabiting the marine area that could be disturbed constitute an
important component of an EIA study. This can be achieved by selecting a few
reliable parameters from a complex community structure.
The living community of an ecosystem comprises of producers,
consumers, and decomposers and related non-living constituents interacting
together and interchanging materials as a whole system. The basic process in
an aquatic ecosystem is its primary productivity. The transfer of energy from the
primary source through a series of organisms (defined as the food chain) is of
two basic types; the grazing food chain and the detritus food chain. The
environmental stress may cause the communities to exhibit low biomass and
high metabolism. In addition, due to depressed functions of less tolerant
predators, there may be also a significant increase of dead organic matter

45
deposited in sediments of ecosystems modified under stress. Depending upon
the type, strength and extent of a stress factor, the ecosystem will react to either
re-establish the previous equilibrium or establish a new one, or it may remain
under prolonged disequilibrium.
The Vadinar-Salaya segment of the Gulf harbours a variety of ecosystems
and habitats, in areas such as creeks; mangroves; intertidal foreshore-rocky,
sandy and muddy zones; coastal lagoons; coral reefs; seagrass beds and
islands. The biological information emerging from the field studies conducted off
Vadinar during April 2007 is compiled in Tables 4.4.1 to 4.4.25.
4.4.1 Pathogenic bacteria
The principal source of waterborne diseases such as cholera, typhoid and
hepatitis is due to contamination of water by sewage and animal wastes. Apart
from potable water, bacterial contamination occurs in surface waters such as
those used for shell fishing areas, beaches, fisheries and recreational facilities.
Though 90 % of the intestinal bacterial population die off within 2 days in natural
waters, the remaining 10 % decline much more slowly. Coliform bacteria such as
Escherichia coli and faecal streptococci (genus Straptococcus) are the 2 most
important groups of non-pathogenic bacteria found in sewage. Because of
number of problems associated with the determination of populations of
individual pathogens, non-pathogenic bacteria (such as coliforms) are used as
indicators of water pollution. Untreated domestic wastewater has about 3 million
coliforms per 100 ml. Because pathogens originate from the same source, the
presence of coliforms indicates potential danger.
TC (ND-143 no/ml) and FC (ND-105 no/ml) counts in water off Vadinar
(Table 4.4.1) were often higher than recommended. The US (EPA) standard for
potable water is less than or equal to 1/100ml of total coliform and 0 fecal
coliform for treated water. For waters used for swimming and recreation, the
standard is 200/100 ml of fecal coliform or 1000/100ml of total coliform. The
primary water quality criteria for coastal waters for bathing, contact water sports
and commercial fishing of the Central Pollution Control Board, India is 100/100
ml of fecal coliform and the average value not to exceed 200/100 ml in 20 % of
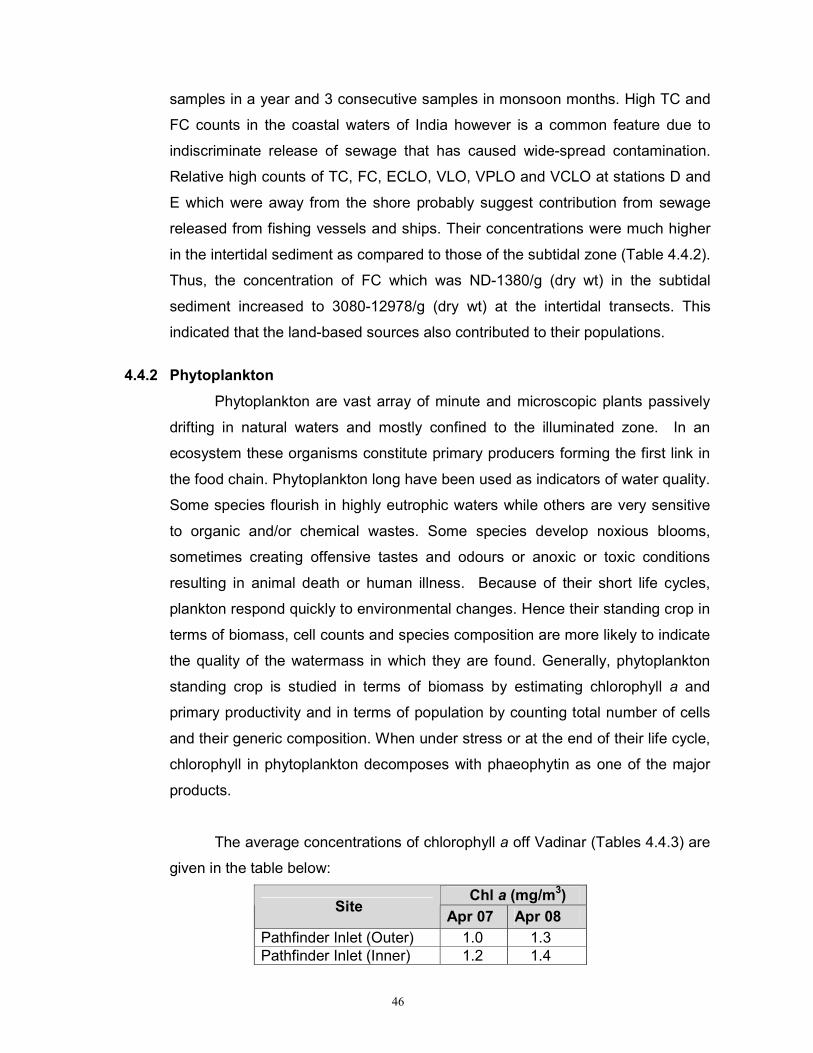
46
samples in a year and 3 consecutive samples in monsoon months. High TC and
FC counts in the coastal waters of India however is a common feature due to
indiscriminate release of sewage that has caused wide-spread contamination.
Relative high counts of TC, FC, ECLO, VLO, VPLO and VCLO at stations D and
E which were away from the shore probably suggest contribution from sewage
released from fishing vessels and ships. Their concentrations were much higher
in the intertidal sediment as compared to those of the subtidal zone (Table 4.4.2).
Thus, the concentration of FC which was ND-1380/g (dry wt) in the subtidal
sediment increased to 3080-12978/g (dry wt) at the intertidal transects. This
indicated that the land-based sources also contributed to their populations.
4.4.2 Phytoplankton
Phytoplankton are vast array of minute and microscopic plants passively
drifting in natural waters and mostly confined to the illuminated zone. In an
ecosystem these organisms constitute primary producers forming the first link in
the food chain. Phytoplankton long have been used as indicators of water quality.
Some species flourish in highly eutrophic waters while others are very sensitive
to organic and/or chemical wastes. Some species develop noxious blooms,
sometimes creating offensive tastes and odours or anoxic or toxic conditions
resulting in animal death or human illness. Because of their short life cycles,
plankton respond quickly to environmental changes. Hence their standing crop in
terms of biomass, cell counts and species composition are more likely to indicate
the quality of the watermass in which they are found. Generally, phytoplankton
standing crop is studied in terms of biomass by estimating chlorophyll a and
primary productivity and in terms of population by counting total number of cells
and their generic composition. When under stress or at the end of their life cycle,
chlorophyll in phytoplankton decomposes with phaeophytin as one of the major
products.
The average concentrations of chlorophyll a off Vadinar (Tables 4.4.3) are
given in the table below:
Chl a (mg/m3) Site
Apr 07 Apr 08
Pathfinder Inlet (Outer) 1.0 1.3
Pathfinder Inlet (Inner) 1.2 1.4

47
Chl a (mg/m3) Site
Apr 07 Apr 08
Blunt Channel 1.8 -
Salaya Creek 0.8 1.1
Effluent release site 0.9 1.4
SPM site 0.9 1.3
Gulf (20 m depth contour) 0.2 1.3
Gulf (40 m depth contour) 1.1 1.7
Thus, the average concentration of chlorophyll a was barely 1 mg/m3 with
the absence of any discernible trends but comparable for the two sampling
events. The low concentration of chlorophyll a was probably due to waters
deficient in nitrate coupled with high grazing pressure.
The average concentration of phaeophytin in the Pathfinder Inlet, Salaya
Creek and off Vadinar (Table 4.4.3) varied as follows:
Phaeo (mg/m3) Site
Apr 07 Apr 08
Pathfinder Inlet (Outer) 1.9 0.4
Pathfinder Inlet (Inner) 0.9 0.3
Blunt Channel 1.1 -
Salaya Creek 2.7 0.3
Effluent release site 1.8 0.3
SPM site 3.8 0.3
Gulf (20 m depth contour) 0.9 0.8
Gulf (40 m depth contour) 4.2 0.2
Thus, the concentrations of phaeophytin were often higher than the
corresponding value of chlorophyll a in April 2008. This is unusual for the Gulf
waters. It is possible that the field studies coincided with the death cycle of
phytoplankton that generated excess phaeophytin. The measurements made in
April 2009, on the contrary, indicate low chlorophyll a:phaeophytin ratios (Table
4.4.3) as expected for the Gulf waters.
The population density of phytoplankton varied widely (Tables 4.4.4 and
4.4.5) off Vadinar-Salaya as evident from the following averages:
Phytoplankton (nox103/l) Site
Apr 07 Apr 08
Pathfinder Inlet (Outer) 113 44
Pathfinder Inlet (Inner) 142 61

48
Phytoplankton (nox103/l) Site
Apr 07 Apr 08
Blunt Channel 243 -
Salaya Creek 80 21
Effluent release site 110 28
SPM site 90 68
Gulf (20 m depth contour) 38 50
Gulf (40 m depth contour) 109 76
Wide variations in the population of phytoplankton are common to coastal
waters including the Gulf due to patchiness in their distribution. The total groups
and generic diversity also varied in the region (Table 4.4.4 to 4.4.7) as given in
the table below:
Phytoplankton Genera (no) Site
Apr 07 Apr 08
Pathfinder Inlet (Outer) 25 16
Pathfinder Inlet (Inner) 25 18
Blunt Channel 25 -
Salaya Creek 22 15
Effluent release site 21 15
SPM site 21 17
Gulf (20 m depth contour) 18 15
Gulf (40 m depth contour) 20 19
These results indicated a good phytoplankton generic diversity particularly
in the Pathfinder Inlet. Nitzschia, Navicula, Guinardia, Rhizosolenia and
Thalassiosira were common and occurred in majority of samples.
4.4.3 Seaweeds and sea grasses
Seaweeds, which are known as a source of food, fodder and manure, are
mostly found attached to substratum of coral or rock and play a significant role in
enriching the sea by adding dissolved organic matter, nutrients and detritus
besides serving as nursery areas for the larvae and juveniles of several marine
organisms. Some green seaweeds are edible, red algae are the important source
of agar and some of the brown algae are used for manufacturing algin and alginic
acid.
The algal zone of the Vadinar/Kalubar/Salaya was confined to 1.2-2.5 km
width of the intertidal segment. A total of 62 species of algae and 3 species of

49
sea grasses were recorded from this region (Table 4.4.8). Among them
Lyngbya, Caulerpa cladophora, Ulva cystoseira, Dictyota, Hydroclathrus, Padina,
Sargassum, Acanthopora, Amphiroa, Champia, Centraceros, Gracilaria, Hypnea
and Polysiphonia were common with the dominance of Padina and Gracilaria at
the lower reef flat. The open mudflats were dominated by algae like
Enteromorpha, Ulva, Lyngbya and Polysiphonia, while, the upper sandy shore
and mangrove areas were associated with Enteromorpha and Ulva. Seagrasses
such as Halophila ovata and Halodule uninervis were common in patches on
sandy regions of the reef, while, Halophila beccarii occasionally occurred on
mudflats along the tidal channels.
The intertidal zone of Kalubhar harbours 47 species of marine algae and
three species of seagrasses (Table 4.4.8). The reef areas are dominated by
Dictyota, Gracilaria, Padina, Hydroclathrus, Ulva and Hypnea. The open
mudflats and sandy areas at the upper intertidal are preferred by Enteromorpha,
Ulva, Lyngbya and Polysiphonia. The sandy region of the reef flat supports
seagrasses like Halophila and Halodule.
4.4.4 Mangrove ecosystem
Mangrove swamps are complex and highly productive ecosystems that
form an important interface between land and sea. In the past, mangrove
habitats were viewed as economically unproductive and, as a consequence, they
were felled to provide timber and fuel wood and create areas for mariculture and
agriculture, which often proved unsustainable. Ecological and economic values of
mangroves are now recognised world-over and several conservation
programmes are in progress to halt their degradation.
Mangrove cover and mudflat areas (km2) in Jamnagar, Lalpur, Khambalia
and Kalyanpur Talukas estimated based on satellite data are as follows:
Taluka Mangroves (Dense)
Mangroves (Sparse)
Mudflats (low tide)
Jamnagar 12.0 23.9 83.5
Lalpur 1.9 3.9 50.5
Khabbalia 3.8 11.5 101.9
Kalyanpur <0.1 0.<0.1 0.8

50
By virtue of high tidal ranges, flat topography and numerous creeks, the
region between Dhani Bet and Sikka has wide intertidal expanse (2-4 km) where
the conditions are suitable for mangroves to flourish. Based on the IRS-P6 LISS
III satellite data acquired on 8 January, 2007 and 28 October, 2006, INCOIS
(Indian National Centre for Ocean Information Services, Hyderabad) has
prepared a mangrove zonation map for the Salaya-Vadinar region illustrated in
Figure 4.4.1. This study has estimated that the mangroves occupied 5802 ha in
the study area out of which 2445 ha were dense and 3357 ha sparse
mangroves. The mangrove area in the Salaya-Vadinar zone had increased in
recent years due to extensive plantations made by the Forest Department. The
status of mangroves of Narara Bet and Kalubhar Tapu is given in the following
table:
Species Narara Bet Kalubhar Tapu
Mangroves
Avicennia marina Dominant Dominant
A.officinalis Common Rare
A.alba Rare Rare
Rhizophora mucronata Rare Rare
Ceriops tagal Rare Rare
Salvadora persica Rare Rare
Obligate halophytes
Salicornia brachiata Rare Common
Sesuvium portulacastrum Rare Common
Suaeda maritima Rare Rare
S.fruticosa Rare Rare
Avicennia marina was the dominant species and species like Rhizophora
mucronata and Ceriop stagal were rarely seen. Salvadora persica, Salicornia
brachiata and Sueda fruticosa were occasionally seen along high saline zones at
the supralittoral and nearby salt pans. The height of A.marina of the region
varied from 0.5 to 2 m. In the mouth region of Salaya Creek, the stand density of
mangroves varied from 5 to 20 plants/100m2 with the seedling density of 5-10
seedlings/m2.
Kalubhar Tapu with intertidal expanse of 3-4 km also sustained
mangroves in good density on mudflats. The south-west zone of the island was
heavily silted, while, the north-east and north-west regions were particularly rich

51
in marine flora and fauna. The mangrove zone, represented by six species was
dominated by A.marina and C.tagal with Salvadora, Salicornia and Suaeda
dominating the supralittoral zone.
The proposed berths C and D would be constructed in the subtidal area
where mangroves are absent. The adjacent intertidal area was also devoid of
mangroves.
4.4.5 Zooplankton
Zooplankton include arrays of organisms, varying in size from the
microscopic protozoans of a few microns to some jelly organisms with tentacles
of several meters long. By virtue of sheer abundance and intermediate role
between phytoplankton and fish, zooplankton are considered as the chief index
of utilization of aquatic biotope at the secondary trophic level.
The average zooplankton biomass off Vadinar-Salaya (Table 4.4.9) varied
in accordance with the data presented in the following table:
Zooplankton biomass (ml/100m3) Site
Apr 07 Apr 08
Pathfinder Inlet (Outer) 28.0 4.5
Pathfinder Inlet (Inner) 5.5 8.9
Blunt Channel 9.3 -
Salaya Creek 17.3 9.1
Effluent release site 1.7 2.2
SPM site 3.3 5.4
Gulf (20 m depth contour) 5.7 2.7
Gulf (40 m depth contour) 3.6 2.8
Thus, the average biomass varied randomly but was distinctly high in the
creeks as compared to the open Gulf zone. The variation of average zooplankton
population off Vadinar-Salaya (Table 4.4.9) was as follows:
Zooplankton population (nox103/100m3) Site
Apr 07 Apr 08
Pathfinder Inlet (Outer) 87.4 63.0
Pathfinder Inlet (Inner) 56.4 26.0
Blunt Channel 68.2 -
Salaya Creek 68.9 68.2

52
Zooplankton population (nox103/100m3) Site
Apr 07 Apr 08
Effluent release site 20.3 11.5
SPM site 6.7 48.4
Gulf (20 m depth contour) 37.8 17.2
Gulf (40 m depth contour) 10.3 70.7
These results indicate wide and random variation in the average
population, with relatively low counts in the Gulf proper as expected on the basis
of biomass. The overall zooplankton standing stock was low off Vadinar-Salaya
which could be due to high grazing pressure. The average faunal diversity and
major groups are given in Tables 4.4.9 to 4.4.11 and summarized below:
Zooplankton faunal diversity (no) Site
Apr 07 Apr 08
Pathfinder Inlet (Outer) 14 15
Pathfinder Inlet (Inner) 15 15
Blunt Channel 16 -
Salaya Creek 15 11
Effluent release site 13 10
SPM site 12 15
Gulf (20 m depth contour) 15 19
Gulf (40 m depth contour) 10 11
The composition of zooplankton was fairly diverse with the community
structure dominated by copepods, decapods and gastropods (Table 4.4.9). The
other common groups were foraminiferans, siphonophores, medusae,
ctenophores, chaetognaths, polychaetes, ostracods, cumaceans, amphipods,
mysids, Lucifer sp, stomatopods, heteropods, lamellibranchs, appendicularians
and isopods.
Fish eggs and fish larvae thought at a low percentage, were represented
in zooplankton collections.
Breeding and spawning
To identify breeding grounds of fishes and crustaceans, extensive field
observations over a long duration are required. This approach was not possible
during the present short term investigations. Hence, alternatively, decapod

53
larvae, fish eggs and fish larvae were studied from zooplankton collections and
taken as indices of probable existence of spawning grounds.
Decapods: This group formed the major constituent of zooplankton and included
the larval stages of commercially important shrimps (Table 4.4.12). The
population density of decapods off Salaya-Vadinar averaged at 1.82 x 10⁴
no/100m3. The population of larvae was relatively high in the creeks; the most
common constituents being crab zoea, stages of Acetes and Lucifer sp, alpheids,
megalopa and porcellenid larvae. The segment-wise averages of decapod larvae
(no/100m3) during April 2007 are summarized below:
Site Decapod larvae
Acetes sp
Lucifer
sp
Pathfinder Inlet (Outer) 71929 2 30
Pathfinder Inlet (Inner) 24684 6 4
Blunt Channel 26735 - 29
Salaya Creek 28739 11 4755
Effluent release site 1852 1 3
SPM site 438 1 38
Gulf (20 m depth contour) 4986 - 1055
Gulf (40 m depth contour) 190 1 9
Commercial penaeid prawns of the Indian waters breed in the sea in
relatively deeper waters in relation to the area of normal habitat of adult prawns.
Metapenus.affinis, M.dobsoni, M.monoceros and Penus.stylifera breed
throughout the year with individually delineated peak breeding period. The
spawning ground of M. dobsoni is reported to be at 20 - 30 m while that of M.
affinis is at still deeper waters. Spawning ground of M. monoceros is reported to
be at 50 - 65 m and that of P. stylifera at 18 - 25 m. Acetes indicus is another
common economically important species of shrimp. During January-April they
form conspicuous aggregations near the shore and are fished on a large scale.
Fishing grounds of these shrimps are mostly located in calm muddy intertidal
zones or waters shallower than 5 m.
The Gulf has a varied representation of prawns and so far 27 species
belonging to Penaeidea and Caridea have been recorded. Out of these, species
like P. penicillatus, M. brevicornis, M. kutchensis and Parapenaeopsis sculptilis
are commercially important. M. brevicornis occur in high number along the

54
northern shore of the Gulf between Mandvi and Luni where the substratum is
sandy. Higher percentages of M. kutchensis are generally confined to the inner
Gulf area because the substratum predominantly contains clayey silt. The Gulf
segment off Vadinar-Salaya has patches of sandy silt which could influence the
distribution of M. kutchensis a very hardy, euryhaline prawn with a probable
preference for clayey silt substratum.
Fish eggs and larvae: Fish eggs (av 72 no/100m3) and larvae (av 72 no/100m3)
though low in number were fairly common among zooplankton (Table 4.4.13).
The relative occurrence and abundance of fish larvae was higher than fish eggs.
The averages of the fish eggs and fish larvae (no/100m3) off Vadinar-Salaya
during April 2007 are summarized in the following table:
Site Fish eggs Fish larvae
Pathfinder Inlet (Outer) 40 64
Pathfinder Inlet (Inner) 602 259
Blunt Channel 12 151
Salaya Creek 13 298
Effluent release site 28 11
SPM site 9 6
Gulf (20 m depth contour) 2 15
Gulf (40 m depth contour) 1 2
As expected, the occurrence and abundance of fish eggs and fish larvae
was more in creek regions than the open Gulf.
4.4.6 Macrobenthos
The organisms inhabiting the sediment are referred as benthos.
Depending upon their size, benthic animals are divided into three categories,
microfauna, meiofauna and macrofauna. Benthic community responses to
environmental perturbations are useful in assessing the impact of anthropogenic
perturbations on environmental quality. Macrobenthic organisms which are
considered for the present study are animal species with body size larger than
0.5 mm. The presence of species in a given assemblage and its population
depends on numerous factors, both biotic and abiotic.
Intertidal:
The intertidal macrofauna was investigated at three transects (Figure
1.2.1) out of which Transects I and II were in the foreshore of location of

55
proposed Berths C and D. The results (Tables 4.4.14 and 4.4.15) revealed good
faunal standing stock though considerable spatial variations were evident. The
faunal group diversity at these transects was more or less comparable. The
faunal group diversity was fairly good with about 18 groups of intertidal
macrobenthos recorded during April 2008. The fauna was mainly contributed by
crustaceans, polychaetes and molluscs.
Subtidal
The distribution of the standing stock of macrobenthos in the subtidal zone
off Vadinar (Tables 4.4.16) was as follows:
Biomass (g/m2; wet wt)
Population (no/m2) Site
2007 2008 2007 2008
Pathfinder Inlet (Outer) 12.0 5.0 2829 1275
Pathfinder Inlet (Inner) 14.5 6.7 5439 1266
Blunt Channel 13.8 - 3717 -
Salaya Creek 5.0 5.5 4081 1300
Effluent release site 1.7 1.5 764 375
SPM site 0.2 5.0 427 1542
Gulf (20 m depth contour) 3.6 3.6 2050 423
Gulf (40 m depth contour) 6.7 1.0 702 583
As in the case of phytoplankton and zooplankton, the standing stock of
macrobenthos also varied in a random manner. The results indicated relatively
low standing stock of macrobenthos in the open Gulf as compared to the
creeks in line with the general observation for the region. As expected, high
biomass was invariably associated with high population of macrofauna. The
number of average macrofaunal groups (Table 4.4.16) is summarized in the
following table:
Macrobenthic faunal diversity (no) Site
2007 2008
Pathfinder Inlet (Outer) 10 5
Pathfinder Inlet (Inner) 7 6
Blunt Channel 7 -
Salaya Creek 9 6
Effluent release site 5 5
SPM site 6 7
Gulf (20 m depth contour) 6 4
Gulf (40 m depth contour) 6 5

56
In all about 20 groups of macrobenthos have been reported off Vadinar
with the populations dominated by polychaetes, amphipods and pelecypods
(Table 4.4.17).
4.4.7 Fishery
The Gulf region contributed more than 20% to the marine fish catch of
Gujarat; the share of the Jamnagar District being 6 - 14 % (Table 4.4.18).
Species-wise composition of Gujarat state and Jamnagar district (Table 4.4.19)
indicated dominance of cat fish (14.8%), small sciaenids (11.9%), molluscsan
(7.2%), shrimp(10.4%), ribbon fish (6.3%), perch (5.2%), seer fish (6.2%), Jew
fish (4.6%), pomfret (4.0%) and clupeids (3.4%). September – November
period was the peak season followed by April – May with June, January and
March as the lean periods.
The species wise fish landing at Jamnagar district from 2000-2008 is
given in Table 4.4.20 which indicated the predominance of seer fish, cat fish,
pomfret, sciaenids and shrimps in the catches. Of the total active fishermen in
the Jamnagar District, about 25% resided at Salaya and Vadinar with about
680 mechanized fishing vessels registered at these centres. The Vadinar-
Salaya region however has no established trawling grounds for fishery
operations due to uneven bottom topography and rock outcrops, hence, the
trawlers operate at other areas for fishing.
Experimental trawling conducted during the present study indicated wide
fluctuations in the catch rate and species composition off Vadinar (Table
4.4.21). The catch consisted of average 15 species of fishes, 3 species of
prawns and 4 other species. The common species were Coilia dussumieri,
Leptucacranthus savala, Johnius glaucus, Thryssa hamilttoni, Pampus sp,
Arius sp, Sillago sihama, Cynoglossus arel, Mugil sp, Polynemus tetradactylus,
Otolithes sp, Parapenaeopsis stylifera and Metapeneasis affinis. In general, the
postmonsoon period sustained higher catch rate - of the order of 4 times more
than that of the premonsoon (Table 4.4.22). Similarly, the species diversity
increased by about 30-40% during postmonsoon as compared to premonsoon.
The increase in fish catch during postmonsoon in the Gulf coincides with the
increased biological productivity.

57
4.4.8 Corals
The term coral refers to the coelenterate (Class: Anthozoa) capable of
secreting a massive calcareous skeleton. Concerted growth of a variety of corals
in a localized habitat gives rise to a coral reef. Coral reefs are the most
productive communities of shallow water benthic environments with high
biodiversity. Primary requirements for good coral growth are a hard substratum,
average water temperature not below 20º C, salinity between 30 and 36 ppt and
low turbidity.
One of the interesting features of the Gulf is the presence of living corals
in patches, rather than reefs either on intertidal sandstones or on face of wave-
cut eroded shallow banks. Several islets along the southern coast of the Gulf
between Jamnagar and Okha have fringing reefs with patches of living corals.
The most northerly coral patches in the Indian Ocean are found at Mungra reef
and Pirotan island (Table 4.4.23). The coral growth in the Gulf is stunted and
patchy with large areas of dead corals. Even in areas normally referred to as
coral reefs living coral cover rarely exceeds 30 % with poor diversity. The
absence of Pacillopora and Acropora in the gulf is also a cause of low diversity. A
total of 37 species have been recorded so far during various studies conducted
by NIO.
Causes for poor state and low diversity of corals in the Gulf are both
natural and man made. Among natural causes, geographic isolation which does
not permit migration of other species from nearby reefs is considered to be the
most serious. The second cause is the extreme variations of environmental
conditions. Though corals are stenotypic, the tolerance is with some limitations.
When corals are expected to withstand much larger amplitude of environmental
conditions such as that in the Gulf only a few species survive and that too only
the hardy forms such as Favites and Porites. Likewise good water circulation is
conducive for coral growth as it renews oxygen and food supply, but, extreme
current velocities are hardly ideal. Siltation is considered to be another major
cause for destruction of corals, and results in selective death of small-polyped
forms which cannot cope up with the deposition of silt, leaving only large-polyped
forms, thus reducing species diversity. This is also the reason for the absence of
small polyped ramose forms like Acropora and Pacillopora in the Gulf. Increase

58
in siltation in the Gulf appears to have been a result of natural changes in the
past and also a consequence of human interference in recent years – mainly due
to destruction of mangroves.
The coral – mangrove ecosystems in the Gulf sustain a variety of marine
fauna comprising of edible and pearl oysters, sponges, polychaetes, sea
anemones, octopuses, crabs, turtles, Bonnelia, dolphins, fishes and sharks.
Narara – Kalubhar region
The Pathfinder Inlet is bordered by Narara and Kalubhar reefs which
sustain live corals in patches. Extensive reef flat of intertidal zone is exposed to
low water with deposits of muddy sediment covering large tracks of the reefs
particularly at the inshore areas. The live corals were largely confined to lower
intertidal and lagoon segments as well as in the nearshore subtidal zones facing
the open Gulf. The list of coral species off Vadinar-Salaya recorded over the
period 1998-2008 is presented in Table 4.4.24. Most of these species were also
recorded during the present study. Stony corals such as Favia favus, Favia
speciosa, Favites complanata, Goniopora nigra, Montipora explanata, Turbinaria
peltala, Platygyra sinersis, Acanthastrea simplex, Porita compressa, Porites lutea
and Cyphastrea serailia occurred at the lower intertidal area, but, were stray and
scattered at the middle of the reef flat. The size and growth of stony corals in this
area was poor. The embayment facing the open Gulf also had good population of
stony corals particularly on the subtidal wave cut banks in a vertical fashion.
These regions also sustained healthy colonies of Turbinaria crater (plate coral),
Symphyllia radians, Porites lichen, Gonipora nigra, Montipora explanta and
Favites melicerun. Ikedella misakiensis a rare endangered species and
Echiuroid bonellia were also seen spreading their black biramous tentacles like
long black ribbons in deeper wave cut bank crevices. Sabellid worms with
colourful fancy crowns were common on the rocks. Discosoma sp and
Stoichactis giganteum a giant green sea anemone with symbiotic tiny coloured
shrimps were recorded on the reef flat and near to the areas of wave cut coral
banks. Soft corals are limited in the region with only three species namely
Dendronephthya dendrophyta, D. brevirama and Astromuricea stellifera being
recorded in the area.

59
Subtidal corals were not investigated during the field study of 2007-08.
Status of live corals and associated biota of the subtidal zone at the northern
periphery of the Naraa Reef was assessed by the NIO in January 2000 and
October-November 2004 through SCUBA diving at a few sites between 1 and 12
m (CD) water depth. The sea bed at the dive sites represented silty-sand, silty-
clay, shell sand, algal beds, reef boulders and associated biota. The density of
live corals was more at shallow depth (2 – 5 m) and decreased substantially as
the depth increased. Corals were absent beyond 10 m water depth. The corals of
the genera Porites, Goniastrea, Platygyra, Siderastrea, Favites, Montipora,
Cyphastrea, Leptastrea, Favia and Turbinaria were dominant in the subtidal area.
Besides corals, the subtidal reef segments supported diverse biota including
seaweeds, sponges, gorgonians, molluscs, coelenterates etc.
4.4.9 Reptiles and mammals
The reptiles are mainly represented by marine turtles Chelonia mydas and
Lepidochelys olivacea which occasionally breed and spawn on the sandy beach
along the Sikka-Vadinar coast as well as on the islands. These however were not
sighted during the field study.
Dolphin (Dolphinus delphis) and whale (Balanoptera spp) are common in
the Gulf. Though occurrence of Dugong (Dugong dugon) in the Gulf, particularly
along the Jamnagar coast, has been reported there are no recent sightings.
4.4.10 Birds
Mangroves, coral reefs, reef vegetation, mudflats, sandy beaches, rocky
shores, islands, tidal creeks, mudflats and marsh vegetation provide an
assemblage of micro-habitats to a variety of waterfowls and other birds at
Vadinar-Salaya and the region around. The area provides wintering habitat for a
variety of migratory water birds of the Arctic and sub-Arctic regions. Besides that,
it also provides a resting site for several water birds migrating through north-west
India to south Indian and south African wintering grounds. A list of water birds of
the Gulf is given in Table 4.4.25.

60
4.5 Comparative study of marine environment
NIO had conducted field studies off Vadinar in 1994-95 (Pre- and post-
monsoon), 1996 (Premonsoon), 2000 (Postmonsoon), 2004 (Postmonsoon) and
2006 (Premonsoon). The data pertaining to 1994-95, 2000 and 2004 is for the
period prior to the commencement of the commercial operations at the VOTL Jetty
Terminal as well as the EOL Refinery. These data are compared with the results of
monitoring conducted in 2006, 2007 and 2008 to evaluate changes if any in the
marine ecology off Vadinar Salaya due to the Refinery operations in the following
sections:
4.5.1 Water quality
With three operating SPMs the Gulf off Vadinar has significant traffic of oil
tankers. The marine area off Vadinar also receives warm and saline effluent
originating from the cooling tower blow down and desalination units of the EOL
Refinery. Hence, the key parameters those could indicate deterioration in water
quality of the study area are temperature, salinity, DO and PHc though others
such as nutrients and BOD can provide supporting data to assess changes in the
water quality compared to the baseline.
Temperature:
The average water temperature (oC) in different segments of the Gulf
during the period 1994-2008 varied as follows:
Period Salaya Creek
Pathfinder Inlet
Gulf off Vadinar
Pre-refinery
1994 (Pre) 27.5 27.0 26.8
1994 (Post)
28.1 28.4 28.7
2000 (post) - 21.6 20.2
2004 (post) - 27.7 27.9
2005 (pre) - 27.0 27.7
2006 (pre) 27.9 28.3 27.8
Post-refinery
2006 (post) 28.0 27.7 28.4
2007 (pre) 29.0 27.5 27.5
2008 (pre) 29.0 28.5 28.9

61
The minor variations in water temperature are mainly due to changes in air
temperature which is the controlling factor in shallow coastal areas. Thus, in the
post-refinery operations the water temperature had remained comparable to the
baseline.
pH:
The average pH of water of the Gulf off Vadinar-Salaya in the pre- and
post-refinery operational phase varied as given in the following table:
Period Salaya Creek
Pathfinder Inlet
Gulf off Vadinar
Pre-refinery
1994 (Pre) 8.0 8.0 8.0
1994 (Post) 8.1 8.1 8.1
2000 (post) - 8.2 8.2
2004 (post) - 8.1 8.1
2005 (pre) - 8.2 8.2
2006 (pre) 8.1 8.1 8.0
Post-refinery
2006 (post) 8.1 8.0 8.1
2007 (pre) 8.0 7.7 7.9
2008 (pre) 8.1 8.2 8.2
As expected for seawater, the pH had remained unaltered off Vadinar-
Salaya subsequent to the operations of the Refinery.
Suspended Solids:
The average results (mg/l) of periodic monitoring of SS off Vadinar-Salaya
are presented in the following table:
Period Salaya Creek
Pathfinder Inlet
Gulf off Vadinar
Pre-refinery
1994 (Pre) 33 33 22
1994 (Post)
25 20 18
2000 (post) - 28 23
2004 (post) - 19 20
2005 (pre) - 49 93
2006 (pre) - 111 20 Post-refinery
2006 (post) 13 22 18
2007 (pre) 42 21 29

62
Period Salaya Creek
Pathfinder Inlet
Gulf off Vadinar
Pre-refinery
2008 (pre) 28 31 42
The SS varied randomly in the region over the period 1994-2008. Such
variations are common to coastal areas because of variable tidal currents and
wind induced turbulence and could be considered as natural changes
comparable to the baseline.
Salinity:
The average salinity (ppt) off Vadinar-Salaya varied as given in the table
below over the period 1994-2008:
Period Salaya Creek
Pathfinder Inlet
Gulf off Vadinar
Pre-refinery
1994 (Pre) 39.2 38.0 37.9
1994 (Post) 34.8 34.6 31.4
2000 (post) - 37.6 37.4
2004 (post) - 37.7 37.7
2005 (pre) - 37.8 37.7
2006 (pre) 38.3 37.4 37.2 Post-refinery
2006 (post) 35.8 35.6 35.7
2007 (pre) 36.9 36.8 36.0
2008 (pre) 36.1 36.9 35.5
These results indicated that the salinity in the region was closely
comparable between the pre- and post-operational phases of the Refinery.
DO and BOD:
The average variations in DO (ml/l) in the pre- and post-operational
periods of the Refinery are compiled in the following table:
Period Salaya Creek
Pathfinder Inlet
Gulf off Vadinar
Pre-refinery
1994 (Pre) 4.5 2.9 4.5
1994 (Post) 4.6 3.1 4.4
2000 (post) - 5.3 4.8
2004 (post) - 3.7 3.8
2005 (pre) - 4.3 4.5

63
Period Salaya Creek
Pathfinder Inlet
Gulf off Vadinar
Pre-refinery
2006 (pre) 4.5 4.3 4.9 Post-refinery
2006 (post) 5.0 4.6 4.3
2007 (pre) 4.1 4.6 4.5
2008 (pre) 4.5 4.2 4.6
DO in coastal waters is subject to changes due to several factors but in
unpolluted areas it is generally near to saturation. The above values indicate
fairly high DO off Vadinar-Salaya though occasional depressed DO values were
recorded in the pre-operational phase of the Refinery including the baseline of
1994. The average DO in the region however was above 4 ml/l in the post-
operation phase of the Refinery, which, at average salinity of 37 ppt and average
temperature of 29o C was at 93 % of the saturation value indicating excellent
oxidizing conditions in the region. The average BOD in the pre- and the post-
operational phase of the Refinery was low (1 – 5 mg/l) and varied randomly
without any significant trends.
Phosphate-phosphorus:
The average concentrations (µmol/l) of PO43--P in water off Vadinar-
Salaya over the period 1994-2008 varied as follows:
Period Salaya Creek
Pathfinder Inlet
Gulf off Vadinar
Pre-refinery
1994 (Pre) 0.5 1.1 0.4
1994 (Post) 0.6 0.6 1.0
2000 (post) - 1.5 1.1
2004 (post) - 0.9 1.1
2005 (pre) - 0.8 0.7
2006 (pre) 0.4 0.8 0.6 Post-refinery
2006 (post) 0.8 0.9 1.3
2007 (pre) 5.1 4.1 4.3
2008 (pre) 0.8 1.1 1.5
These results indicated that the levels of PO43--P during the pre- and post-
refinery operations had remained more or less comparable except during
premonsoon of 2007 when the levels were relatively high throughout the Gulf

64
segment off Vadinar-Salaya. This could be an isolated instance since results of
2008 (Premonsoon) are comparable to the pre-refinery phase.
Nitrogen compounds:
The concentrations (µmol/l) of NO3--N, NO2
--N and NH4+-N off Vadinar-
Salaya varied as follows during the pre- and post-operational phases of the
Refinery:
Salaya Creek
Pathfinder Inlet
Gulf off Vadinar Period
NO3 NO2 NH4 NO3 NO2 NH4 NO3 NO2 NH4
Pre-refinery
1994 (Pre) 0.7 0.3 0.7 1.0 0.4 0.5 0.5 0.2 0.7
1994 (Post) 6.5 0.8 0.4 12.0 0.5 0.4 9.1 0.5 1.0
2000 (post) - - - 10.4 0.3 0.4 11.1 0.3 0.4
2004 (post) - - - 30.7 0.3 0.4 33.5 0.4 0.8
2005 (pre) - - - 24.0 0.4 0.3 15.0 0.4 0.3
2006 (pre) 4.7 0.3 0.8 2.3 0.3 0.3 1.8 0.2 0.7 Post-refinery
2006 (post) 4.6 0.5 0.4 5.8 0.4 3.7 7.8 0.4 0.4
2007 (pre) 6.2 0.2 1.3 1.2 0.6 0.2 10 0.5 0.6
2008 (pre) 4.0 0.5 0.2 1.3 0.3 0.6 4.5 0.6 0.1
Thus though the concentrations were variable as normally observed for
coastal waters, there were no significant changes in the pre- and post-refinery
operational phase.
PHC:
The PHc and phenol (in parentheses) concentrations (µg/l) in water off
Vadinar-Salaya were as given in the table below:
Period Salaya Creek
Pathfinder Inlet
Gulf off Vadinar
Pre-refinery
1994 (Pre) 3.7 (59) 18 (46) 33 (21)
1994 (Post) 5.7 (32) 4.0 (33) 3.3 (26)
2000 (post) - (-) 0.7 (61) 0.9 (52)
2004 (post) - (-) 22 (36) 15.2 (86)
2005 (pre) - (-) 6.8 (36) 6.1 (35) Post-refinery
2006 (post) - (-) 14.9 (45) 21.0 (47)
2007 (pre) 10.5 (22) 15.0 (44) 18.2 (17)
2008 (pre) 25.0 (21) 27.8 (56) 22.2 (19)

65
Based on these results it is evident that the concentrations of PHc and
phenols in water off Vadinar-Salaya had remained comparable in the pre- and
the post-operational phases of the Refinery.
From the foregoing comparative results of water quality of the period 1994
– 2006 when the Refinery had not undergone into production with the 2007 – 08
datasets of the post-operational period of the Refinery it can be concluded that
the water quality had not deteriorated due to the impacts of the Refinery
operations.
4.5.2 Sediment quality
The results of sediment quality for the Vadinar-Salaya region for the
period 1994 – 2006 are compiled in Table 4.5.1. Comparison of these results
with the data presented in Table 4.3.1 for the post-operational phase of the
Refinery indicated no significant changes in the sediment burden of trace metals,
Corg, phosphorus and PHC. Hence, the sediment quality of the Gulf off Salaya-
Vadinar had not been influenced due to refinery operations.
4.5.3 Biological characteristics
Selected biological components which have been studied over the period
1993 - 2008 are discussed in the following sections to assess ecological changes
if any due to Refinery operations.
Phytoplankton:
The average concentrations of Chlorophyll a (Chl; mg/m3), Phaeophytin
(Pha; mg/m3) and phytoplankton genera (Gr; No) reported off Vadinar-Salaya
during various studies by NIO are compiled in the following table:
Salaya Creek
Pathfinder Inlet
Gulf off Vadinar Period
Chl Pha Gr Chl Pha Gr Chl Pha Gr
Pre-refinery
1994 (Pre) 0.8 0.6 13 0.7 0.7 17 1.0 0.9 21
1994 (Post) 0.9 0.6 - 0.9 1.1 - 0.7 0.8 -
2000 (post) - - - 1.1 0.6 12 1.1 0.5 13
2004 (post) - - - 0.2 0.5 14 0.2 0.5 11
2005 (pre) - - - 0.4 0.9 19 0.3 0.3 17
Post-refinery

66
Salaya Creek
Pathfinder Inlet
Gulf off Vadinar Period
Chl Pha Gr Chl Pha Gr Chl Pha Gr
2006 (post) 1.2 0.4 16 0.9 0.4 17 0.7 0.3 16
2007 (pre) 0.8 2.7 22 1.0 1.9 25 0.2 0.9 18
2008 (pre) 1.1 0.3 15 1.3 0.4 16 1.3 0.8 15
As expected for the coastal region the concentrations of Chlorophyll a as
well as phaeophytin and phytoplankton genera varied during different studies,
however, they were more or less similar during the pre- and post-operational
periods of the Refinery. The populations of phytoplankton varied considerably in
the region without discernible trends. Generally, the populations had relatively
high numbers of Nitzschia, Navicula, Guinardia, Rhizosolenia and Thalassiosira,
Skeletonema, Chaetoceros, Thalassiosira, Pleurosigma Biddulphia, and
Guinardia.
Mangroves and seaweeds:
Information on the past data on quantification of mangrove cover of the
Vadinar-Salaya region was not readily available. The recent estimate of INCOIS
(Section 4.4.4) indicates that the mangroves occupied 5802 ha in the study area
out of which 2445 ha were dense and 3357 ha sparse mangroves. The available
information suggests that the mangrove area in the Salaya-Vadinar zone had
increased in recent years due to extensive plantations made by the Forest
Department some of which were reportedly supported by Essar. As in 1994-95,
Avicennia marina has been the dominant species followed by A. officinalis.
Rhizophora mucronata and Ceriop stagal were occasionally seen.
As in the past, the Vadinar-Salaya region continued to sustain rich and
diverse seaweed flora and their habitat had not been adversely influenced due to
Refinery operations.
Zooplankton:
The average biomass (Bio; ml/100m3), population (Pop; nox103/100m3)
and faunal components (Fau; No) in the Gulf off Vadinar during different studies
varied as given below:

67
Salaya Creek
Pathfinder Inlet
Gulf off Vadinar Period
Bio Pop Fau Bio Pop Fau Bio Pop Fau
Pre-refinery
1994 (Pre) 18.5 181 11 4.4 20.0 14 10.7 11.7 13
1994 (Post) 16.6 53.2 13 1.4 8.7 11 3.9 20.0 13
2000 (post) - - - 2.4 6.9 11 2.3 16.2 9
2004 (post) - - - 2.1 13.8 14 1.6 9.4 13
2005 (pre) - - - 4.2 9.7 15 4.9 11.9 13 Post-refinery
2006 (post) 8.7 98.8 14 0.7 2.9 11 5.8 26.9 13
2007 (pre) 17.3 68.9 15 28.0 87.4 14 5.7 37.8 15
2008 (pre) 9.1 68.2 11 4.5 63.0 15 2.7 17.2 19
These data indicate considerable variations in zooplankton standing stock
and faunal diversity during pre- as well as post-operational periods of the
Refinery without discernible trends. The fauna was mainly constituted by
decapods, copepods, foraminiferans, siphonophores, medusae, ctenophores,
chaetognaths, polychaetes, ostracods, cumaceans, amphipods, mysids, Lucifer
sp, stomatopods, heteropods, lamellibranchs, appendicularians and isopods.
Overall, the results do not indicate any changes in the zooplankton community
structure subsequent to Refinery operations.
Macrobenthos:
Because of their limited mobility macrobenthic fauna are considered to be
the reliable indicators of anthropogenic perturbations in the marine environment.
The average biomass (Bio; g/m2; wet wt), population (Pop; no/m2) and faunal
components (Fau; No) of macrofauna off Vadinar-Salaya during 1994-2008
varied as given in the following table:
Salaya Creek
Pathfinder Inlet
Gulf off Vadinar Period
Bio Pop Fau Bio Pop Fau Bio Pop Fau
Pre-refinery
1994 (Pre) 46.4 5400 8 17.7 2820 6 3.2 1209 7
1994 (Post) 4.8 2338 4 3.1 978 6 5.0 1500 5
2000 (post) - - - 2.7 1419 5 0.2 126 3
2004 (post) - - - 0.9 750 4 0.3 285 4
2005 (pre) - - - 3.2 815 3 1.3 647 4 Post-refinery
2006 (post) 8.8 2198 8 6.0 1174 6 6.0 1822 6
2007 (pre) 5.0 4081 9 12.0 2829 10 3.6 2050 4
2008 (pre) 5.5 1300 6 5.0 1275 5 3.6 702 5

68
The macrobenthos was generally represented by polychaetes,
amphipods, ostracods, tanaidaceans, molluscs, nimertines and hydrozoans. The
results indicate markedly low standing stock of macrobenthos in the subtidal area
off Salaya-Vadinar as compared to the intertidal zone. This is in line with the
general observation for the Gulf. The standing stock of macrobenthos varied in a
random manner, spatially as well as temporally, however, there was no evidence
for changes in the macrobentic standing stock in the post-operational period of
the Refinery.
Corals:
Coral habitats of Narara and Kalubhar reefs were investigated during
1994-95 and their density and species diversity at pre-decided transects was
assessed. The corals were reported to be scattered with low species diversity.
On the directions of the Forest Department, Government of Gujarat to
EOL, NIO had translocated corals falling within the pipeline and jetty corridors at
ecologically similar sites of the Narara reef during April and December 2004.
The translocated corals were regularly monitored on monthly basis from
September 2004 to March 2005. The monitoring results indicated that about 90
to 97 % of them had survived and in good health in line with other natural corals
of the Narara reef. Corals with minute polyps and no polypular cavities viz,
Porites lutea and Porites compressa as well as with shallow polypular cavities
like Siderastrea savignyana revealed better health and had no sedimentation on
them. These corals were not extensively monitored during 2007 and 2008 to
avoid disturbance to them but were visually seen to be in good health.
Fishery:
The fish landings data (t) for Salaya, Vadinar and Sikka landing centres
and Jamnagar District obtained from the Fisheries Department for the period
1994-2008 is given in the following table:
Year Salaya Vadinar Sikka Jamnagar
1994-95 2768 (4.6) - 455 (0.8) 58912
1995-96 - - - 68088
1996-97 - - - 76157

69
Year Salaya Vadinar Sikka Jamnagar
1997-98 1791 (3.1) 513 (0.9) 552 (1) 56043
1998-99 3255 (5.5) 356 (0.6) 1558 (2.6) 58592
1999-00 3541 (4.8) 343 (0.5) 992 (1.4) 71683
2000-01 - - - 72551
2001-02 - - - 83398
2002-03 3720 (3.6) 579 (0.7) 1045 (1) 102843
2003-04 2079 (5.5) 172 (0.5) 770 (2) 37957
2004-05 2112 (4.6) 243 (0.5) 707 (1.5) 45934
2005-06 2840 (4.3) 185 (0.3) 625 (0.9) 66500
2006-07 5892 (8.3) 807 (1.1) 463 (0.6) 70694
2007-08 7328 (11.7) 418 (0.7) 821 (1.3) 62512
The percentage contribution of each centre to the total landing of the
Jamnagar District is given in parenthesis in the above table. The fish landing at
these centres did not indicate any definite trend over the decade but their
contribution to the total catch of the district is low with Vadinar contributing barely
1%.
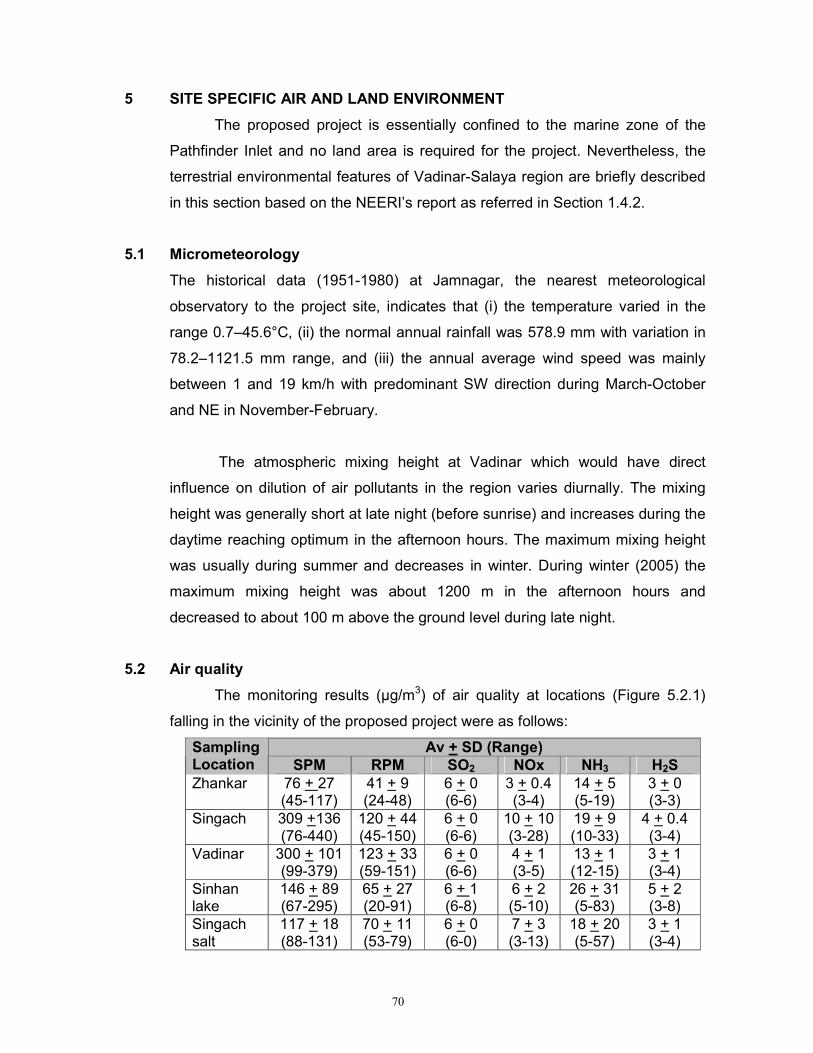
70
5 SITE SPECIFIC AIR AND LAND ENVIRONMENT
The proposed project is essentially confined to the marine zone of the
Pathfinder Inlet and no land area is required for the project. Nevertheless, the
terrestrial environmental features of Vadinar-Salaya region are briefly described
in this section based on the NEERI’s report as referred in Section 1.4.2.
5.1 Micrometeorology
The historical data (1951-1980) at Jamnagar, the nearest meteorological
observatory to the project site, indicates that (i) the temperature varied in the
range 0.7–45.6°C, (ii) the normal annual rainfall was 578.9 mm with variation in
78.2–1121.5 mm range, and (iii) the annual average wind speed was mainly
between 1 and 19 km/h with predominant SW direction during March-October
and NE in November-February.
The atmospheric mixing height at Vadinar which would have direct
influence on dilution of air pollutants in the region varies diurnally. The mixing
height was generally short at late night (before sunrise) and increases during the
daytime reaching optimum in the afternoon hours. The maximum mixing height
was usually during summer and decreases in winter. During winter (2005) the
maximum mixing height was about 1200 m in the afternoon hours and
decreased to about 100 m above the ground level during late night.
5.2 Air quality
The monitoring results (µg/m3) of air quality at locations (Figure 5.2.1)
falling in the vicinity of the proposed project were as follows:
Av + SD (Range) Sampling Location SPM RPM SO2 NOx NH3 H2S
Zhankar 76 + 27 (45-117)
41 + 9 (24-48)
6 + 0 (6-6)
3 + 0.4 (3-4)
14 + 5 (5-19)
3 + 0 (3-3)
Singach 309 +136 (76-440)
120 + 44 (45-150)
6 + 0 (6-6)
10 + 10 (3-28)
19 + 9 (10-33)
4 + 0.4 (3-4)
Vadinar 300 + 101 (99-379)
123 + 33 (59-151)
6 + 0 (6-6)
4 + 1 (3-5)
13 + 1 (12-15)
3 + 1 (3-4)
Sinhan lake
146 + 89 (67-295)
65 + 27 (20-91)
6 + 1 (6-8)
6 + 2 (5-10)
26 + 31 (5-83)
5 + 2 (3-8)
Singach salt
117 + 18 (88-131)
70 + 11 (53-79)
6 + 0 (6-0)
7 + 3 (3-13)
18 + 20 (5-57)
3 + 1 (3-4)

71
Av + SD (Range) Sampling Location SPM RPM SO2 NOx NH3 H2S
Jogwad 201 + 116 (57-394)
96 + 38 (37-157)
6 + 0 (6-0)
6 + 3 (3-10)
24 + 15 (5-42)
3 + 0 (3-3)
ESSAR (B.colony)
373 + 119 (220-498)
164 + 27 (132-199)
6 + 0 (6-0)
7 + 3 (4-10)
14 + 14 (5-33)
5 + 2 (3-8)
The concentrations (µg/m3) of SO2, NOX and NH3 were low and well
within the standards (24 hourly average) stipulated by the CPCB for industrial
areas as evident from the following table:
CPCB stipulation Pollutant Measured (98th
percentile) Industrial Residential
SPM 114-494 500 200
RPM 48-197 150 100
SO2 6-8 120 80
NOX 4-26 120 80
H2S 3-8 - -
NH3 15-53 400 400
Comparatively high concentration of SPM and RPM in the area was due
to dry and arid land cover and was largely of natural origin.
5.3 Water quality
The water quality of local sources (Figure 5.2.1) is compiled in Table
5.3.1. There is no perennial river in the Vadinar-Salaya region though there are
a few seasonal streams which drain the land runoff to the Gulf during monsoon.
Sinhan Nadi is one such stream in the vicinity which has a bund across to store
rain water thereby creating Sinhan Talav and forms the major source of surface
water to the region. The quality of water of Sinhan Talav was good with low SS,
relatively low TDS and other parameters in the range expected for unpolluted
surface fresh water (Table 5.3.1).
The intrusion of seawater has affected the groundwater which has high
TDS, total hardness, chloride, sulphate and sodium in some instances (Table
5.3.1). Otherwise, the quality indicates waters free from anthropogenic
contaminants. Relative high concentration of Fe and Zn in some instances is
probably due the influence of the surrounding basaltic terrain. The water table in
the area varies from 4 to 12 m depending upon the rainfall and its duration and

72
averages around 6 m. However, during the years of scanty rainfall the water
level can be as deep as 14 -16 m in open wells.
5.4 Sediment characteristics
The stratum of the region is predominantly basaltic with the top basalt
layer generally weathered. The surface sediment was calcareous in nature with
a murum layer underneath. The soils were well drained with subangular blocky
structure, sticky and hard in consistency. They could be broadly classified into
alluvial, black, light brown and alkaline soils. Soil texture varied from sandy loam
to clay loam. The bulk density of the soil varied in the range 1.37-1.68 gm/cm3
and its water holding capacity was 22 – 46 %. Organic matter in the soil was in
the range of 0.24 – 0.70 % but the soil was poor in nitrogen and phosphorus.
5.5 Flora and fauna
Flora
Because of hot and semi-arid climate the terrestrial vegetation was
thorny, shrubby and xerophytic type with the dominance of Prosopis juliflora and
Acacia senegal in-between agricultural and waste land zones. Vegetation was
irregular and varied considerably in condition, composition, and density.
Generally trees had low stunted branches and diffuse crown. Most of the
vegetation aggregates near villages were mainly composed of Albizzia
chinensis, Bauhinia racemosa, Ficus recimosa, Syzygium cumini, Terminalia
tomentosa etc. The phyto-ecological structure of vegetation showed three
different strata i.e. top, middle and ground. Top storey was dominated by
Albizzia chinensis, Bauhinia racemosa, Bombax malabaricum, Butea
monosperma, Ficus recemosa, Syzygium cumini, Sapindus emarginatus,
Terminalia tomentosa etc. Middle storey in this region comprised of Adhatoda
vasica, Capparis spinosa, Euphorbia nevulia, Crotolaria retusa, Embelia
officinalis, Flemingia strobilifera, Lantana camara etc. The dominant herbs in the
ground vegetation were Aegeratum conyzoides, Argemone mexicana, Celosia
argentea, Aloe vera, Indigofera tinctoria, Tridax procumbens etc. Out of 165
plant species identified in the area none had been included in the Red Data
Book of the Botanical Survey of India.

73
Productivity of the agricultural crops in this region was low because of
poor soil quality, infrequent and inadequate rainfall, water scarcity, low
consumption of fertilizer, shifting cultivation and lack of improved agricultural
techniques. The common Kharif crops of the region were groundnut, sesamum,
cotton, castor and bajra whereas wheat, gram, cumain, ajwan (semi-rabi) were
the important Rabi crops.
Fauna
The mammals in the area mostly consisted of domestic animals such as
camels, cow, buffaloes, sheep, goats, donkeys, horses, dogs and pigs. Among
domestic animals, cattle were the most abundant, followed by buffaloes, goats,
sheep and other animals. The region was not a wildlife habitat and animals like
Chital, Nilgai, wolf, jackal, panther and wild boar were rarely encountered.
About 20 species of birds were identified in the area during the survey
conducted in December 2005. Pigeons were dominant followed by mynas and
sparrow. The birds like peafowl, mynas, crows, sparrows, bulbuls, babblers and
pigeons were recorded in and around villages. In areas with agriculture fields,
the grain eating herbivorous species such as doves, sparrows and parakeets
were dominant. Insectivorous birds such as Bee eaters, Wagtails, White
breasted kingfisher, Egrets, Swallows, Indian Roller, Larks, Lapwings
(Redwattled lapwing) were found around water bodies and vegetation in low-
lying area. Except haliastur indus and anhinga rufa melanogaster no other
avifauna sighted in the study area were vulnerable and endangered.
There is no major freshwater body in the area. Hence, fresh water fishery
is insignificant. There are three dams in Khambalia Taluka namely Sheda Bhara
Thari (275 ha), Khad Khambalia (48 ha) and Ghee (405 ha). These dams are
usually given for fishing on lease basis.
5.6 Noise
There is no major noise generating activity in the area except for the
vehicular traffic of the State Highway. The average noise levels recorded in the
villages nearby to the site are given in table below:
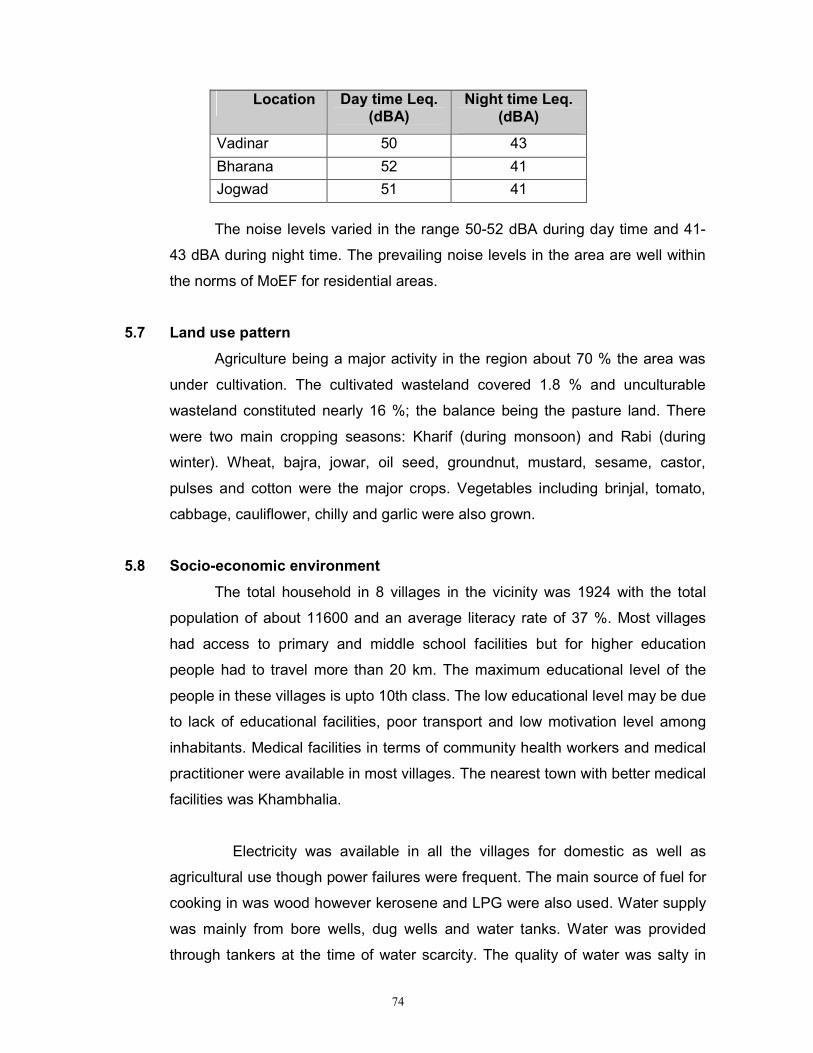
74
Location Day time Leq. (dBA)
Night time Leq. (dBA)
Vadinar 50 43
Bharana 52 41
Jogwad 51 41
The noise levels varied in the range 50-52 dBA during day time and 41-
43 dBA during night time. The prevailing noise levels in the area are well within
the norms of MoEF for residential areas.
5.7 Land use pattern
Agriculture being a major activity in the region about 70 % the area was
under cultivation. The cultivated wasteland covered 1.8 % and unculturable
wasteland constituted nearly 16 %; the balance being the pasture land. There
were two main cropping seasons: Kharif (during monsoon) and Rabi (during
winter). Wheat, bajra, jowar, oil seed, groundnut, mustard, sesame, castor,
pulses and cotton were the major crops. Vegetables including brinjal, tomato,
cabbage, cauliflower, chilly and garlic were also grown.
5.8 Socio-economic environment
The total household in 8 villages in the vicinity was 1924 with the total
population of about 11600 and an average literacy rate of 37 %. Most villages
had access to primary and middle school facilities but for higher education
people had to travel more than 20 km. The maximum educational level of the
people in these villages is upto 10th class. The low educational level may be due
to lack of educational facilities, poor transport and low motivation level among
inhabitants. Medical facilities in terms of community health workers and medical
practitioner were available in most villages. The nearest town with better medical
facilities was Khambhalia.
Electricity was available in all the villages for domestic as well as
agricultural use though power failures were frequent. The main source of fuel for
cooking in was wood however kerosene and LPG were also used. Water supply
was mainly from bore wells, dug wells and water tanks. Water was provided
through tankers at the time of water scarcity. The quality of water was salty in

75
some villages. Most villages have been connected by public transport and post
and communication facilities were good.
The main occupation of the people in these villages was agriculture and
allied activities. Because of uneven rainfall and occasional draughts, agriculture
production was moderate and unreliable. Coastal population was mainly
engaged in fishing activities. The salt pans in the area also provide a good
source of employment for the local people. Some were also employed in other
nearby industries on contract basis. Total main workers in the 8 villages were
more than 2700 of the population while non-working population was 69 % of the
total.

76
6 POTENTIAL IMPACTS DURING CONSTRUCTION PHASE
The construction of Berths C and D is the extension of the existing
facilities of VOTL at the Pathfinder Inlet. The additional marine structures which
will be constructed in water depths of more than 10 m to the North of the existing
berths include two berths, mooring and breasting dolphins, piled approach for
pipelines and walkways connecting the existing and proposed berths. The
topside facilities will comprise of marine loading/unloading arms; piping
headers/manifolds; safety valves; slop draining, collection and transfer facilities;
fire water supply and distribution network and associated fire fighting facilities
including foam/water, tower monitors, ground monitors, hydrants, jumbo curtain
nozzles, hose boxes, portable fire extinguishers etc; navigation system/aids;
pedestal crane; electrical power supply, distribution and other associated
systems; instrumentation and control systems; communication equipments; and
utilities.
The approach to the proposed Berths C and D would be through the
existing Berths A and B which are connected to the approach road via a trestle
bridge. The Berths C and D will utilize the same connectivity and no new
constructions are planned in the nearshore subtidal and intertidal areas. Thus
there will be no construction activity in the intertidal zone. The Pathfinder Inlet
has fairly deep navigational channel and the Berths C and D will have natural
depths for the design ship. Hence, no dredging will be required.
The approach channel and the berths will be delineated by appropriate
navigational aids. Provision of fuel oil bunkering is not envisaged at the berths.
Reception facilities for receiving and treating both solid and liquid wastes from
ships will be available at the Jetty Terminal if a ship for some reason remains at
the berth for longer periods.
The governing site conditions include calm waters during October-April,
significant tides and moderate currents. The Vadinar-Salaya marine zone is
ecologically important due occurrence of mangroves and coral habitats with
several sites protected under MNP/MS. Based on the map made available by
VOTL, the Berths C and D fall outside the boundary of the MNP/MS.

77
6.1 Marine structures and constructions
Probable negative impacts on ecology of the Pathfinder Inlet during the
construction phase can be due to (i) modifications in the hydrodynamic
characteristics of the creek, (ii) degradation in water and sediment qualities, and
(iii) loss of biota.
6.1.1 Hydrodynamic characteristics
Constructions in the marine zone have potential to modify the dynamics
of the near shore environment thereby changing the stabilized bathymetry and
alter the coastal configuration.
The hydrodynamic model studies were carried out at CWPRS for the
development of existing jetty of VOTL in Pathfinder inlet during the year 1997.
These results were re-examined incorporating the proposed extension of the
berthing face by constructing the Berths C and D. The results are discussed in
the report ‘Site inspection and desk studies for feasibility of extension of existing
ESSAR jetty at the Pathfinder Inlet, Vadinar creek, Gujarat. The conclusions
drawn from these studies are as follows:
• The prevailing flow conditions at the pathfinder inlet are generally parallel to
the existing jetty. The flow in front of the jetty is guided by the existing bund.
The velocities during ebb are of the order of 1.0 m/s and during flood they
are of the order of 0.6 m/s.
• The proposed extension of the jetty in line with the existing jetty would be
most appropriate as the flow is generally parallel in the zone of extension.
As the jetty is on piles it would not interfere significantly with the prevailing
flow conditions as well as accretion / erosion trends in the Pathfinder Inlet.
• The berthing of ships would be convenient as the flow is generally parallel
to the berthing face and chances of properly moored ships drifting under
tidal currents are less as the currents are parallel to the ship. Thus the
proposed extension of the jetty is feasible and would have no adverse
effects on the prevailing flow conditions and the shoreline.
78
In view of the findings of the modeling study, the impacts of construction
of the Berths C and D, if any, will be minor and local in this dynamic coastal
environment.
6.1.2 Water quality
The activities which can potentially influence the water quality during
constriction of the Berths C and D would be increase in turbidity due to
dispersion of the bed material in water, accidental spillages of construction
material and release of contaminants by construction machinery including ships
and barges.
The subtidal sediment at the project site is mainly sand and silt with low
clay content (Section 4.3.1). When the bed is disturbed while piling, the sand
would settle soon however, the fine particles of silt and clay may remain in
suspension for a longer period under the influence of tidal currents. The average
SS in the creek is generally below 40 mg/l (Section 4.2.3). Additional SS
generated due to construction activities would render the water in the vicinity of
the piling sites turbid, though the impact on a larger area is unlikely.
In regions where the bed sediment is contaminated by pollutants such as
heavy metals, organic substances, sewage etc there is possibility of release of
pollutants entrapped in the sediment to the water column when the bed is
disturbed. The discussion in Section 4.3 indicates unpolluted creek sediment
with respect to heavy metals, organic carbon, phosphorus and PHc. Hence,
such possibilities are ruled out.
Floating platforms such as barges, cranes, ships etc will be deployed in
the area during construction. An accident involving such platforms may lead to
the loss of onboard construction material and/or fuel. While material may sink to
the bed the fuel spill could deteriorate the water quality of the affected area. The
impact would depend on the type and the quantity of fuel spilled.

79
Thus apart from local transient pulses of SS and deterioration due to
accidental spillages, the water quality of the region will not be influenced
adversely during the construction phase.
6.1.3 Sediment quality
The sediment dispersed in the water column during pilling operations may
settle on nearby seafloor area thereby changing the texture of the sediment
where it deposits. However, considering the prevailing depositional regime of the
creek and the quantities involved which are minor, this impact would be
insignificant and over a short duration.
If proper sanitation is not provided the workers engaged for construction
may use the intertidal area for defecation which can locally degrade the intertidal
sediment by increasing BOD and populations of pathogens. The impact though
temporary and minor is not desirable.
6.1.4 Flora and fauna
An increase in turbidity due to dispersion of fine grained sediment in
water can influence photosynthesis and hence the primary productivity.
However, as discussed earlier, this impact will be local and minor. Zooplankton
standing stock may also be influenced locally though the impact would be
negligible and temporary.
As the sediment is not enriched in organic carbon (Section 4.3), its
suspension in the water column is unlikely to deplete DO in the creek and DO
availability would not constrain the biotic processes. The danger of biota getting
exposed to pollutants released from sediment due to disturbed bed would be
insignificant since the sediment of the creek is free from gross contamination.
Proposed constructions would have some adverse impact on the benthic
habitats which would be destroyed at the foot-prints of the piles. The damage
though minor would be irreversible. The information provided by VOTL indicated
that the Berths C and D would be built on 298 piles with the average diameter of
the pile of 1.2 m. Hence total cumulative area directly occupied by the foot-print

80
of the piles would be 337 m2. Taking the average biomass of 9.5 g/m2 (wet wt)
and population of 2700 no/m2 based on the field data of 2007-08 for the subtidal
zone of the creek (Section 4.4.6), the total loss of biomass and population was
estimated at 3.2 kg (wet wt) and 9.1x10⁵ no respectively. This predicted loss of
macrobenthos was insignificant as compared to the standing stock associated
with the creek. As the fauna was mainly constituted by polychaetes, amphipods
and pelecypods in the creek, their populations would be locally affected. Such
minor losses are unlikely to be reflected in the overall biological productivity of
the creek.
The mangroves of the Narara Bet and Kalubhar Tapu were about a
kilometer away from the project site. These mangroves and mud flats have been
congenial to a variety of birds particularly during the winter season. The noise
during construction may disturb their populations.
Apart from the disturbance caused by the construction process itself, the
coastal ecology of the Gulf would suffer additional stresses if the construction
time was prolonged. This invariably is the case when executing marine
infrastructural projects, if not carefully planned and if the activities are spread
over a large area.
Submerged structures such as piles, cross-beams etc, however, would
create new substratum for selective benthic organisms to settle and grow though
their community could be different than that disturbed by construction. Corals
are also known to settle and grow on such structures. Hence, the resultant loss
of benthic standing stock may not significantly change though the habitat would
be modified.
6.2 Dredging
Bathymetry record of the Pathfinder Inlet made available by the VOTL
(Figure 1.1.2) indicated sufficient depths in the creek and near the proposed
berths for navigating design ships to the respective berth (Section 2.4.3). Hence,
the proposed expansion does not envisage any dredging in the Pathfinder Inlet.

81
6.3 MNP/MS
As discussed in Section 3.3.4, several segments of the southern Gulf
have been declared as MNP/MS including parts of Kalubhar Tapu and Narara
Reef. Based on the map of MNP/MS made available by VOTL, these protected
zones are about away from the site proposed for the Berths C and D.
The probable impact of the construction of Berths C and D on MNP/MS
areas could mainly be due to SS generated during piling which if the circulation
was favourable could be transported to MNP/MS and settle there. Corals which
are sensitive to SS would come under stress if such settlement occurs. The
impact was predicted to be minor since the pile sites are sufficiently away from
MNP/MS and the SS generated during piling is generally localized and small in
volume. Mangrove habitats are unlikely to be influenced since they are fairly
away and mangroves and associated biota can tolerates certain amount of silt
deposition.
A large workforce would be at the site during the construction phase. The
workers would be tempted to cut the mangroves including those falling under
MNP/MS, for firewood if proper fuel was not provided to them. Similarly, if their
colonies were not located sufficiently away from the HTL they could cause
disturbance to the MNP/MS areas.
6.4 Miscellaneous
Several ships, barges other machinery and work force would be brought
to the site. Hence, aesthetics of the area may deteriorate. Moreover, left-over
solid waste and that generated during construction would be a source of
nuisance if not cleared from the site.
The extent of impact on marine ecology would also depend on duration of
the construction phase. If the construction is prolonged due to time-overruns or
improper planning, the negative influence on marine ecology would increase
accordingly.

82
Pathfinder Inlet is not a fishing zone but some fishing vessels navigate to
the Salaya Harbour via the Pathfinder Inlet – Blunt Channel system. There may
be risk of accidents if too many construction vessels are crowded in the
Pathfinder Inlet particularly during night.

83
7 POTENTIAL IMPACTS DURING OPERATIONAL PHASE
The negative impact on the Marine environment due to operations at the
Berths C and D could be due to several factors such as (i) escapement of
petroleum products during loading and unloading operations, (ii) waste
generated at berths such as floor washings, domestic wastewater, garbage etc,
(iii) release of wastes from ships including garbage, solid waste, ballast and
bilge as well as sewage while anchored at berth and during voyage, and (v) rare
but bulk release of products, fuel etc due to accidents involving a laden ship.
7.1 Escapement of cargo
The berths C and D will be used to handle petroleum products and the
transfer of the liquid will be via mechanical loading arms which are considered
safe and spills in the marine environment are unlikely. However, in a rare
instance if spill occurs, it would negatively impact the local biota since refined
products are toxic to marine organisms. Spills of petroleum are discussed
separately.
7.2 Berth related wastes
The wastes generated at berths in normal operations include domestic
effluent, garbage and solid wastes (debris, leftover plastic items, boxes,
containers etc). The release of such wastes unless handled and disposed
properly could locally degrade the marine area.
7.3 Ship generated wastes
The main wastes generated by ships include garbage, solids, bilge water
etc. Local creek environment may be affected if this waste was disposed to the
sea particularly when a vessel, for some reason, remains at the berth for longer
duration. Untreated sewage if released by ships while at anchorage and that
generated at the berths if released, could potentially have negative impact on
local marine ecology.
7.4 Spills of petroleum
The major concern during operations at Berths C and D was the
accidental release of petroleum products in quantities that could be harmful to

84
marine biota. Though rare, bulk releases of petroleum product / fuel could result
due to accidents such as ship collision, ship grounding, onboard fire etc. The
first two are more frequent and often result from out of control ship movement.
Majority of such accidents occurs when the ships approach/leave the port
through the navigational channel. It has been well established that the human
factor remained to be the cause of about 90 % of accidents leading to petroleum
spills.
7.4.1 Spill quantities
Products from the Refinery tank farm would be transported through
pipelines to the berths and loaded via loading arms. For environmental safety
and leak prevention, loading arms are equipped with the following accessories:
• Hydraulic Coupler which allows rapid connection and disconnection of the
arm to the tanker flange.
• Powered Emergency Release Coupling (PERC) installed between two disco
valves to allow quick disconnection from the tanker without draining of the
arm.
• Limit switches that define 3D working envelope giving alarm at three stages.
• Emergency Shut Down (ESD).
Available literature indicated that the failure frequency of loading arms
equipped with above mentioned accessories was as low as 0.03 per 106 h
operation. Even if PERC is activated while loading of the product was in
progress, the spillage would very small in volume. The PARC is so located that
this spillage occurs on the tanker and gets collected in the tray below the PERC.
Hence, spill of a petroleum product at the berths was not expected when
loading/unloading would via loading arms provided with above referred
accessories.
Small and large spills (50-10000 t) could however result if a loaded tanker
went aground or collided with another ship, partially rupturing oil holds. In a
catastrophic event leading to extensive damage to cargo holds, several
thousands tonnes of petroleum may spill.
85
7.4.2 Fate of petroleum spills
Spilled petroleum products undergo a number of physical and chemical
changes (weathering). The major weathering processes are spreading,
evaporation, dispersion, emulsification, dissolution, oxidation, sedimentation and
biodegradation. The last three processes are long-term processes, which
determine the ultimate fate of the oil. The remaining processes are important
during early stages of the spill, especially in coastal and inshore areas.
Generally, lower the specific gravity of oil, less persistent it is. The persistence
of oils can be considered in terms of half-life for each group. Half-life is
described as the time taken for the removal of 50% of oil from the sea surface.
After 6 half-lives, about 1% of the oil remains on water.
7.4.3 Oil spill modelling
Apart from the nature of the oil spilled, spreading, drifting, evaporation etc
of a spill in the Gulf would be mainly controlled by current and wind though
boundary restrictions like the banks, creeks and islands would influence its
ultimate fate. Hypothetical spills of petroleum off Salaya-Vadinar have been
modelled by NIO, ICMAM Project Directorate (Ministry of Earth Sciences) and
recently for VOTL by Environ Software (P) Ltd, Bangalore.
Using MIKE 21, ICMAM modelled a spill of 1000 t of Arabian Light Crude
for three wind scenarios: (i) no wind; (ii) a constant wind speed of 5 m/s blowing
from 240o (premonsoon); and (iii) a constant wind speed of 5 m/s blowing from
330o (postmonsoon). A uniform set of spatially and temporally varying current
pattern was superimposed on winds. Under no wind condition, the oil moved
along the path of the tidal flow with the spill entering the Pathfinder Inlet during
flood tide. Under Scenario (ii) the spill was transported in the north east direction
with landfall near Kandla within 5 days. With the wind blowing from the north in
Scenario (iii) the spill was transported towards the southern coast. The model
results indicated that about 38-39 % of the spilled oil would evaporate and 4-5 %
would disperse in water at the end of 48 h with bulk evaporating within the first 6
h. These quantities would be 39-40 % and 9-10 % at the end of 5 days.
Depending on the local winds the leftover residue would hit the coast within a
few hours or it may remain at sea for a few days.

86
The NIO studies indicated that for a crude oil spill of 100 t off Vadinar the
area of spread would be roughly 25 ha after about 30 h and would not vary
appreciably with the quantity of spilled oil though it would change with the
characteristics of the oil. The spread would be faster during the initial few hours
(10 ha after about 5 h) but decrease as the viscosity increased with the removal
of lighter fractions. If the sea was turbulent, the spill could incorporate as high as
80 % water by volume within 2 to 3 h.
Environ Software (P) Ltd, Bangalore have made detailed analysis of
several oil spill scenarios for hypothetical crude oil and HSD spills at the VOTL
Jetty Terminal including SPMs, berths sub-sea pipelines and navigation channel
for various meteorological and hydrological conditions in the report “Oil spill risk
assessment study for the extension of proposed marine facilities of VOTL
product jetties at vadinar, Jamnagar”. The following spill scenarios were
considered for this study:
• Crude oil spill of 153 t at the SPM.
• HSD spill of 56 t at the product jetty.
• Crude oil spill of 33 t along the pipeline corridor.
• Instantaneous HSD spill of 100 t at the product jetties.
• Instantaneous HSD spill of 1000 t at the product jetties.
• Instantaneous crude oil spill of 500 t at the SBM.
• Instantaneous crude oil spill of 25000 t at the SBM.
• Instantaneous crude oil spill of 25000 t at the Navigation Channel.
Typical trajectories of a hypothetical spill of HSD at the Berths C and D
and that of crude oil at the SPM are illustrated in Figures 7.5.1 to 7.5.5 for a
simulation run of 30 h. The percentage of spill quantities estimated to reach the
coast in different seasons is as follows:
Spill volume January July October
Instantaneous spill
500 t crude oil at SBM 88 79 81
25000 t Crude oil at SBM 88.8 80 81.8
100 t HSD at Product Jetties 73 64 65
1000 t HSD at Product Jetties 73 66.5 68
25000 t crude oil at Nav. Channel 88.3 88 81.2
Continuous spill

87
Spill volume January July October
56 t HSD at Product Jetty 69 55 55
153 t Crude oil at SBM 80 77.7 83
33 t Crude oil at pipeline 81.8 75.7 77
The time taken for the landfall and the quantity of spill lost due to
weathering for different scenarios of tide during premonsoon, monsoon and
postmonsoon have been estimated as given in the table below:
Spill Location
Spill quantity (t)
Weathering loss (t)
Time for landfall (h)
Instantaneous Spill
500 t crude oil 60-105 9-44 SBM
25000 t crude oil 2800-5000 14-44
100 t HSD 27-39 3-4 Product Jetties
1000 t HSD 270-395 3-4
Navigation Channel 25000 t crude oil 2290-5600 30-42
Continuous Spill
SBM 153 t crude oil 15-35 10-44
Pipeline 33 t crude oil 5-8 6-44
Product Jetty 56 t HSD 8-25 4
These results indicated that if a spill of 100 t of HSD occured at the
jetties, the loss due to weathering would vary between 27 and 39 t and the left-
over mass would hit the coast within 3 – 4 h depending on the state of the tide at
which the spill occurred and the season. Likewise, for a spill of 500 t of crude oil
at the SPM, about 60 -105 t would weather before the landfall that would take 9
– 44 h.
The heavy components of crude oil are virtually insoluble in seawater
while lighter compounds, particularly aromatic hydrocarbons like benzene and
toluene are slightly soluble. Hence levels of dissolved PHc rarely exceed 1 mg/l
following a spill. The residue after the spill was weathered could mix with the SS
in water and sink. In the event of sinking of weathered oil, the PHc concentration
in sediment of the affected area could increase several folds and degradation
being a slow process, the oil in sediment would persist for long tome unless it is
dispersed and redistributed over a wider area by turbulence.

88
7.4.4 Impact on flora and fauna
The impact of a spill on the Gulf marine biota would critically depend on
location of the spill, the area affected and the nature and the quantity of the oil
spilled. Small spills would have a temporary and limited adverse impact on the
pelagic and intertidal marine biota except for corals in which case recovery
would be slow. The impact however may be severe in case of large spills.
a) Mangroves and algae
Mangroves and algae show greater sensitivity to fresh rather than
weathered crude oil. Oil may however, block the openings of air breathing roots
of mangroves or interfere with salt balance, harming the trees. Moreover,
mangrove areas are invariably associated with rich fauna which will suffer
damage. The recovery of mangroves would be slow while algae would re-
establish once the oil is weathered.
b) Plankton
An increase in concentrations of dissolved PHc in water subsequent to a
spill could lead to plankton kills. The recovery of plankton would be however
quick through repopulation of the community by fresh recruits from adjacent
areas not affected by oil. Eggs and larvae of fishes, crustaceans and molluscs
in the spill area which are highly sensitive to PHc would be severely affected.
However, it is unlikely that any localised losses of fish eggs and larvae caused
by a spill in the Gulf would have discernible effect on the size or health of future
adult populations.
c) Benthos
These organisms have limited movements and hence are more
vulnerable to oil spills. If the weathered oily mass spread on intertidal areas
mortalities of organisms in the zones of physical contact were expected.
Subtidal benthos of shallow waters may also be affected if the sinking residue
affected their habitats. The benthic organisms of exposed shores would recover
much faster than of sheltered habitats like lagoons, mangrove swamps, marshes
etc. Similarly, benthic organisms of sandy habitats would recover faster as
compared to those of the muddy intertidal segments.

89
d) Corals
Coral reefs in the intertidal area of the Gulf are exposed during low tide.
The oil floating above corals may not cause severe damage but if it settles on
them during exposed condition they would be severely affected. Observations
on oiled corals revealed that several sub-lethal effected such as interference
with reproduction, abnormal behaviour and reduced or suspended growth may
occur. The recovery of the oiled coral reefs would be slow.
e) Fishes
A large oil spill can temporarily reduce the fish catch from the area as fish
might migrate from the affected zone. Limited mortality may also occur
particularly when the oil concentrations in water go abnormally high. Often
fishes get tainted and unpalatable but become normal when the ambient PHc
level approach the baseline which is expected within a few days.
f) Birds
The birds are highly sensitive to oil spills and get particularly affected if
their habitats are oiled. The risk factor would be more for the breeding
populations and spawners. The impact on the adult population would be minor
in case of small spills but in case of a major spill the bird population including
adults could be affected.
g) Turtles and mammals
Marine turtles and mammals are highly sensitive to oil spills and may
temporarily migrate from the spill site. Hence, no serious damage to turtles and
mammals due to an oil spill was expected.
7.5 Risk of ship accidents
Ship collision or grounding, onboard fire, explosion etc could lead to bulk
releases of cargo to the marine environment. Of these, the first two were more
common and often resulted from out of control ship movement. Accident
involving ships were rare, but if occurred it could be ruinous to the local
environment if the cargo spilled was crude oil or petroleum product.

90
7.5.1 Traffic estimates
The traffic of deep-sea ships is important in assessing ship collision and
grounding frequencies. This information is not readily available for the Gulf
making assessment difficult. The major traffic of deep-sea ships in the Gulf has
been to the Okha, Kandla (also includes three SPMs off Vadinar), Mundra,
Navlakhi and Sikka (also includes traffic at 2 SPMs off Sikka and marine
terminal of Reliance) Ports. In the Gulf, crude oil is being unloaded at SPMs off
Vadinar, off Sikks and off Mundra. Presuming each SPM evacuated 12 Mtpa of
crude oil, the total import of crude oil in the Gulf would be about 70 Mtpa.
The traffic of deep-sea ships at ports had also increased substantially
over the years. Thus for instance the number of ships visiting the Kandla Port
had increased from 1672 in 2001-02 to 2124 in 2005-06. The increase at
Mundra Port was from 100 in 1999-00 to 380 in 2006-07. In addition, the
Reliance terminal at Sikka has a substantial traffic, particularly tankers,
transporting refined products but the estimates are not available. Based on the
quantity of products manufactured and parcel sizes dispatched from the marine
terminal the annual traffic of ships could be of the order of 2000/year. With the
expansion of the Essar Refinery the traffic at the VOTL Jetty Terminal would
also increase considerably over the next decade.
The traffic of VLCCs in the Gulf has been confined to the 122 km long
DW navigation channel (NHO Chart No 203) between Dwarka and Sikka. Not all
other deep-sea ships navigate through the DW Route. In fact, the ships not
requiring deep draft are advised to keep outside the DW Route. However, the
statistical information on number of ships using the DW Route was not available.
Because of several uncertainties in ship traffic in the Gulf as a whole, the
traffic at the VOTL SPMs and Jetty Terminal via the navigational channel
between the DW Route and the SPMs/Jetty Terminal were considered for
assessment. This local navigational Channel is 7 km long and 425 m in width.
The prevailing traffic of ships at the Jetty Terminal was about 180 ships/year and
was expected to increase to about 600 ships/year when all the berths would
becom operational. The local channel is also used by oil tankers visiting VOTL

91
and IOC SPMs. This traffic was estimated at about 300 ships/year and expected
to increase to about 550 ships/year in future. Hence, the present and the
projected ship traffic in via the local channel was 480 and 1150 ships/year
7.5.2 Ship collision frequency
The frequency of ship collision is governed by the frequency of ship
encounter and the probability of collision given an encounter. From the records
of accidents maintained at several major ports worldwide it has been considered
that collision frequency was proportional to the square of the traffic density and
was directly proportional to the number of encounters. Casualty statistics
maintained at UK ports indicated that collisions involving ships accounted for 7%
of all accidents and represented 0.024 for every 1000 ship movements. Such
statistics however was not available for the ports in India. Assuming that this
statistics was applicable to the Gulf and taking 960 movements of deep-sea
vessels in 2007, the probability of an accident would be one in every 43 years
for this traffic projection.
7.5.3 Ship grounding frequency
Bulk release of oil could also result if a tanker went aground rupturing
cargo holds. The data-base of ITOPFL revealed that 34.4% and 28.9% of large
spills (>700 t) had occurred due to groundings and collisions respectively.
Channel length and its width were the major factors controlling grounding in
inshore waters. The grounding frequency is expressed as
GF = K x L/W
Where GF = grounding frequency
L = channel length
W = effective channel width
K = constant (normally taken as 1x10⁻⁵ per movement).
With the traffic density of 960 movements per annum in 2008, the
grounding probability in the local channel was 1 in every 6.6 years.
Not all accidents resulted in oil spills. International Tank Owners Pollution
Federation Limited (ITOPFL) has maintained a database of oil spills from tankers
and other ships. Spills are categorised by size (<7 t, 7 - 700 t and >700 t).

92
Information is held for about 10,000 accidents. Their data-base indicated that the
vast majority of spills (83%) fell in the smallest category (<7 t) and <3% of
accidents resulted in large spills. Hence, the probability of a large spill due to
accident involving a ship was very low off Vadinar.
The large scale handling of crude oil in the Gulf dates back to late
nineteen seventies when the first SPM was set-up off Vadinar. Till date no
serious accident involving a tanker leading to an oil spill has been reported.
7.6 Impacts on MNP/MS
During the operational phase of the Berths C and D, the impact on the
MNP/MS areas could be mainly due to spillage of petroleum product if occurred
during loading/unloading. If loading/unloading was through loading arms with
safety devices as discussed in Section 7.4.1, spillage of petroleum was unlikely.
Nevertheless, a spill could occur in a rare event. The composition of the product,
the quantity spilled, phase of the tide and ambient winds would largely govern
the extent of impact on flora and fauna of the MNP/MS. The impacts would be
similar to those discussed under Section 7.4.4.
7.7 Impact on fisheries
The mouth area of the Pathfinder Inlet where the Berths C and D would
be located falls in the restricted zone where fishing and anchoring is not
permissible. A few artisan fishermen from nearby villages such as Bharana,
Nana Amla, Nana Mandha Vadinar and Chudeshwar fish in intertidal and
nearshore areas. However, due to the presence of MNP / MS at Narara Reef the
area is out of bounds for fishing. Hence, fishery operations would not be affected
adversely due to the construction of Berths C and D.
As discussed under Section 4.5.3 there are no traditional trawling
grounds in the vicinity of the Narara reef and most trawlers fish in far away areas
such as Okha, Jakhau, Mandvi etc. The long-term fish landing data of the
centres at Salaya-Vadinar (Table 4.4.18) though varied from year to year, the
general trend indicated an increase in landings over the period 1985 – 2008.

93
8 MANAGEMENT OF ENVIRONMENT
General features of the region, presence of MNP/MS in the vicinity and
the impacts identified in Sections 7 and 8 are considered to suggest conceptual
EMP in the following sections.
8.1 Design considerations
• The Gulf and the surrounding region are seismically active. Hence, the
structures, pipelines and foundations should be designed for specified
seismic loads.
• The region is prone to occasional cyclones. Therefore, the berths and
associated structures must be designed for expected storm surge.
• Major environmental concern at the Berhts C and D is the accidental
spillage of petroleum during loading/unloading operations. The
technology available till date is inefficient to recover oil once spilled and
pollution of the marine area invariably occurs. Hence, strategy should be
to prevent spillages of petroleum through proper designs and dependable
construction materials and components. The design and operating
philosophy of the Terminal must be "No leak" as proposed and handling
of liquids at the jetties should be through state-of-the-art loading arms
equipped with hydraulic coupler, PERC and ESD. If the operating
conditions deviate beyond the preset norms, the pumping should
automatically stop till normal conditions are reset. This would require
robust telemetry control of manifold checks, flow rate, pressure, etc; and
fail-safe communication among the tanker, JOC and COT which must be
included in the design.
• Internationally accepted codes and practices should be followed for
designing structures, pipelines, valves, loading arms etc and their
compliance should be guaranteed through proper inspection, frequent
evaluation and intensive testing particularly of all critical components.
8.2 Construction phase
The proposed project being in the vicinity of the marine protected areas
special precautions are warranted during construction.

94
8.2.1 Piling
• Piling should be controlled to minimize silt dispersion in water that may
have negative impact on corals of the MNP/MS.
• Water quality should be monitored for turbidity and DO at the MNP/MS
boundary nearest to the piling site during flood tide and if sustained
increase is recorded, the piling must be moderated and suspended if
necessary till the tide turns. This will necessitate wireless communication
between the monitoring team and the piling team.
8.2.2 Concreting and erection of structures
• Extra care is warranted to ensure no spillages of construction material
particularly during concreting that can increase turbidity.
• Transport and erection of prefabricated girders, beams, slabs, railings etc
should be watchfully done to avoid accidents.
8.2.3 Miscellaneous
The following actions are suggested to minimize impact on marine
ecology during the construction phase:
• Construction should be completed within the stipulated period and time-
overrun should be avoided by proper management of various contracts.
• The area of construction should be confined to the minimum required and
spillages of activities outside the project site should be avoided.
• Major pre-fabrication jobs should be undertaken in a yard on land located
sufficiently away from the HTL and the transfer of materials to the site
should be through the existing jetty or via the sea route. The intertidal
area should not be used for this purpose. Similarly, the movement of
construction barges, ships, machinery etc should be restricted to the pre-
decided area.
• Number of equipment, barges, ships, etc used for construction should be
optimized to avoid overcrowding thereby increasing the risk of accidents.
• Good sanitation and water supply facilities should be made available to
the work force. Adequate fuel also should be provided to them to prevent
cutting of mangroves for fuel.

95
• Labour colonies should be set-up landward of the HTL and away from
mangroves.
• The operational noise level should be kept to a minimum through proper
lubrication, muffling and modernisation of equipment.
• Regular preventive maintenance of equipment used for construction
should be practiced.
• General clean-up of the site should be taken-up and extraneous materials
such as equipments, pipes, drums, sacks, metal scrap, ropes, excess
sediment, etc should be cleared from the site.
8.3 Operational phase
The operations at the jetties will involve loading/unloading of petroleum
products. The bulk spillage of cargo is the greatest risk due to these operations
and proper management strategies are necessary, as far as possible, to
eliminate the risk factor.
8.3.1 Navigation and traffic management
An area that needs serious regional attention is the management of ship
movements in the Gulf since the risk of ship to ship encounter and grounding will
be enhanced due to the expected increase in the traffic density of product
tankers and other bulk carriers. To prevent accidents involving ships following
should be considered:
• The prevailing traffic control management in the Gulf must be reviewed.
GMB in collaboration with the Department of Lighthouses & Lightships
and KPT is setting-up a state-of-the-art Vessel Traffic System (VTS) in
the Gulf. VOTL should cooperate for successful implementation of this
plan.
• As proposed under Section 2, the navigational channel between the DW
Route and the jetties should be demarcated with proper navigational
aides.
• Depth availability in the local navigational channel must be ascertained
through periodic bathymetry surveys.
• Prevailing practice of navigating ships for berthing and during return
voyage by experienced pilots must be followed at all times.

96
8.3.2 Management of ship-related wastes
• It should be ensured that the deep-sea ships visiting the Berths have
functional onboard sewage treatment facility.
• There should be a mechanism in place to ascertain the compliance to ‘no
release of oily waste, untreated sewage and solid waste’ by ships while
berthed at jetties and also in the navigational channel.
• Arrangement for evacuation of liquid wastes as proposed in the project
(Section 2) must be made if the ship remains at berth for longer duration.
Treatment and disposal of such wastes must be clearly defined.
• There must be facility to evacuate solid waste from ships if required.
Facilities should be created to treat this waste and dispose it as
mentioned in Section 2.
8.3.3 Management of berths-related wastes
• Wastewater such as those generated during cleaning of jetties, floor
washings, domestic use etc should be collected in a settling pond and
released to marine environment only after ascertaining that it is free from
oil and SS.
• The toilets, if envisaged at the berths, should have compact sewage
treatment modules to prevent release of raw sewage to the sea.
• The solid waste generated at the berths must be collected and disposed
suitably and its dumping in the marine area should be prevented.
8.4 Oil spill contingency plan
Spillages of petroleum while loading/unloading cannot be totally ruled out
in spite of a number of safeguards are built in the design and adequate
precautions and safety measures are taken during operation. Hence,
appropriate spill response scheme should be in place to minimise impacts on
marine environment should a spill occur. Majority of spills at terminals result
from routine operations such as valve leakages, improper couplings, pipeline
leaks etc. These operational spills are generally small with over 90 % involving
quantities of a few litres. Rare but large accidental spills can occur when a ship
gets involved in an accident such as collision or grounding. Hence, response at
several levels is necessary for combating oil spills of such variable quantity.
97
NOS-DCP describes the responsibilities of ports handling petroleum and
its products. Indian Coast Guard is the Central Coordinating Agency for marine
response. NOS-DCP considers response at 3 Tiers for combating oil spills. The
Plan makes port authorities responsible to respond to accidents within the port
limits (Tier-1 response) though they can seek additional assistance through the
Regional Communication/Operational Centre of the Coast Guard.
8.4.1 Tier-1 response plan
VOTL seems to have an oil spill contingency plan at the Tier-1 level
(Section 2). This plan should be suitably modified to include operations at the
Berths C and D. As given under Section 2, their contingency plan should be
integrated with the oil spill contingency plan of EOL.
8.4.2 Tier-2 response
Considering the large volumes of crude oil and petroleum products
transported through the Gulf there is a need to have a comprehensive response
plan at the Tier-2 level to handle any emergency arising from large oil spills
wherein cooperation from all industries handling petroleum in the Gulf will be
crucial. VOTL should participate as and when such a plan is conceived and
operationalized.
8.5 Emergency Preparedness and Response Plan (EPRP)
VOTL must prepare an EPRP to react promptly to natural and man-made
disasters. The plan must be designed to prevent or minimize loss of life and
property as well as degradation of ecology ensuring prompt, coordinated and
systematic response to an emergency. This plan should be integrated with the
EPRP of EOL as well as that of the Kandla Port and should include detailed
response procedures in the event of
• Cyclone
• Earthquake
• Tsunami
• Large oil spills
• Fire or explosion on vessels or shore facilities

98
The ERP should be easily understood for effective implementation and
must clearly specify the following:
• Procedures with step by step approach for quick response and
subsequent follow-up to control of the situation.
• Sequence of responses to be pursued to mitigate the emergency or crisis
in the shortest time.
• Responsibilities of personnel identified to react to an emergency.
• Chain of commands and decision making including modes of contacting
the listed officials.
• Post-emergency procedures for assessing damage, monitoring and
recovery of ecology.
8.6 General considerations
The presence of marine protected areas in the vicinity warrants good
marine environmental management practices and the following issues must be
considered seriously:.
• Spillage and leakages of petroleum during loading/unloading operations
should be prevented with good management practices.
• Loading/unloading of petroleum products must be only through state-of-
the-art fail safe loading arms as indicated in Section 2. Conventional
hoses must never be used for this purpose.
• Good preventive and predictive maintenance practices for all equipment
should be adopted.
• Accidental bulk spillages must be avoided by proper navigational
safeguards, training of personnel and vessel traffic management
practices.
• The port area must be declared as no waste discharge zone by ships and
vessels.
• The operators and other personnel at jetties should be trained and
equipped for handling emergencies safely and in an ecologically sound
manner.
• Manual detailing management of incoming and outgoing traffic of vessels
through the channel including strategy for handling emergency situations
must be prepared and implemented through trained personnel.

99
• Special emergency drills should be conducted. Crises exercises should
be designed and used in actual drills to ensure readiness of the staff at
any given emergency situation.
• Noise level in the operational areas and around should be maintained
within permissible limits through regular monitoring.
8.7 Restoration and management of mangroves
The proposed construction of Berths C and D is not expected to cause
any damage to the intertidal flora and fauna. However, to improve the ecological
environment off Vadinar-Salaya, VOTL should support mangrove restoration
programme by way of plantations along creeks and other appropriate areas in
the adjacent mudflats in consultation with the Forest Department (GoG).
The plantations should include both the locally prolific A. marina and the
less dominant R. mucronata with adequate emphasis on the latter as it faces
increased threat. Regeneration of R.mucronata, besides compensating the
development related habitat loss, will augment the mangrove habitat status to a
considerable extent.
8.8 Impact minimization on coral reefs and associated biodiversity
In view of the presence of corals in the vicinity of the proposed
expansion, it is necessary to take measures to ensure their safety and health
during construction and operational phases of Berths C and D. The most critical
issue during the construction phase is the control of turbidity. Measures to
achieve this are discussed in Sections 8.2.1 and 8.2.2. In addition silt curtains
may be deployed between the piling area and the reef so that the silt would be
effectively prevented from being transported in the reef areas during high tide.
Silt curtains have been effectively used in eco-sensitive areas elsewhere in the
world. However, their suitability for deployment in high tidal regime of the
Pathfinder Inlet needs to be checked.
Measures suggested in Sections 8.1, 8.3 and 8.4 for preventing an oil
spill and combating if it occurs in a rare event, as well as recommendation to
declare the area as no waste release zone, if implemented, the risk to reefs

100
would be considerably reduced during the operational phase of the Berths. In
addition, a permanent oil containment boom should be installed between the
Berths and the shore to further protect the corals and associated biodiversity
should a spill occur during operations at the Jetty Terminal.
8.9 Post project monitoring of marine environment
The major impact of the proposed project can be on the marine area and
no significant changes are expected on the terrestrial environment. Hence,
monitoring of the marine environment assumes greater importance.
Ecological degradation due to accidents resulting in petroleum spills is
visible and easy to identify, however impacts due to minor but chronic releases
are seen only after months and even years. Hence, it should be mandatory to
monitor the marine environment periodically, to identify the trends and take
corrective measures if required. This is all the more necessary in the present
case in view of MNP/MS in the vicinity. This would require a dependable
baseline for the Vadinar-Salaya area particularly for the Pathfinder Inlet against
which the results of monitoring after the Berths C and B become operational,
can be compared.
8.9.1 Baseline quality
Baseline should be available for critical locations including mangroves
and corals in addition to water quality, sediment quality and flora and fauna.
These should include open shore areas, intertidal segments and creeks. NIO
has a good database for the region [particularly monitoring done in 2004
(Premonsoon) and 2006 (Premonsoon)] which can be used to generate the
baseline. The baseline should also indicate expected natural variations that are
inherent to dynamic coastal waters. However, as the ecology undergoes
seasonal changes it is important that the post-project monitoring is conducted
around the same period coinciding with that of the baseline studies.
8.9.2 Parameters to be monitored
The post-project monitoring should be conducted at the same locations
monitored for the baseline. Following monitoring protocol should be followed:

101
Water quality:
Water samples obtained from 3 levels in the vertical when the depth
exceeds 10 m, should be studied for temperature, pH, salinity, DO, BOD, (or
total organic carbon), nitrate, nitrite, ammonia, dissolved phosphate, PHc and
phenols. For depths less than 10 m surface and bottom samples may be
collected.
Sediment quality:
Sediment from subtidal and intertidal regions should be analysed for
texture, organic carbon, phosphorous, aluminium, iron, chromium, nickel,
copper, zinc, cadmium, lead, mercury and PHc.
Flora and fauna:
Biological characteristics should be assessed based on primary
productivity, phytopigments, phytoplankton populations and their generic
diversity; biomass, population and diversity of zooplankton; biomass, population
and diversity of benthos; fish quality, density and species diversity; and health of
corals and mangroves of designated sites.
8.9.3 Monitoring schedule
The monitoring schedule can be as follows:
• Just prior to the commencement of operations at the Berths C and D.
• After 6 months of commencement of operations.
• Once a year from the commencement of operations.
8.9.4 Assessment
The results of each monitoring should be carefully evaluated to identify
changes if any, beyond the natural variability identified through baseline studies.
Gross deviation from the baseline may require a thorough review of operations
at the Berths to identify the causes leading to these deviations and accordingly,
corrective measures to reverse the trend will be necessary.

102
8.10 Post-project monitoring of air environment
The operations at the Berths are not expected to have impact on air
environment. Nevertheless, as a good management practice air quality should
be routinely monitored for standard air quality parameters at the Jetty Terminal
(if not already being done) in view of increasing developmental activities around
the southern Gulf and presence of eco-sensitive areas in the vicinity.
8.11 Post-project monitoring of noise
The noise at jetties should be periodically monitored and results used to
keep the levels below required norms for eco-sensitive areas by identifying the
source and taking suitable remedial measures.
8.12 Inspection of marine facilities
A comprehensive protocol for inspection of marine structures, pipelines,
valves, safety devices, fire fighting facility, oil spill combating equipment etc
should be prepared as per the internationally accepted practices. The records
of all inspections including the deficiencies identified and corrective action taken
should be maintained as a part of the overall record system. All these records
should be available for scrutiny, if required.
8.13 Institutional arrangement
The proposed project being in the marine zone and in the vicinity of MNP/MS
management of the marine environment must receive special attention.
Institutional arrangements for management of the environment fall under the
broad categories of post-project monitoring; inspections of machinery, structures
and pollution combating equipment; and petroleum spill control and combating.
For this purpose, VOTL should set-up an Environment Management Cell
(EMC) directly under the control of the Chief Executive (if not already
established). In addition to other staff, EMC should have a group of personnel
well-trained in environmental monitoring and in combating oil spills upto 100 t. A
qualified marine ecologist should also be a part of this group. Since the
response to a spill should be immediate, the EMC should be manned round the
clock.

103
Post-project monitoring of the marine area is a specialised field and
hence should be conducted through a third party with expertise in marine
monitoring. Likewise, detailed inspection of marine structures, pipelines, loading
arms, hoses, valves etc will also require external professionals. Routine air and
noise monitoring can be conducted in-house if such facilities are available with
VOTL.
Apart from monitoring and inspections, EMC should be made responsible
for arranging training programmes, refresher courses, mock rehearsals etc. The
records of all these activities should be maintained as a part of the overall record
system.
8.14 Socio-economic environment
The proposed expansion project will generate direct as well as indirect
employment, though to a limited extent, during construction phase as well as
when the Berths become operational. Locally available workers should be given
priority for employment depending upon their qualifications and suitability. As a
responsible corporate VOTL should consider on-job training to local youth to
enhance their suitability for employment.
Other social measures such as support to primary and secondary
education, medical facilities, supply of drinking water etc to nearby villages
should be considered by VOTL.

Table 3.2.1: Records of severe cyclonic storms which formed over the Arabian Sea and made landfall at the Gujarat coast (1970-2008)
Date Landfall/Devastation
19-24October 1975 Crossed Saurashtra coast about 15 km to the northwest of Porbandar on 22 October. Maintained its severe intensity inland upto Jamnagar-Rajkot area. Maximum wind speeds were 160-180 km/h. 85 people died. Damage to property estimated at Rs 75 crores.
31 May-5 June 1976 Crossed Saurashtra coast on June 3. Maximum wind speed was 167 km/h. 70 people died. 51 villages affected badly. 25,000 houses destroyed/damaged. 4500 cattle perished. Total damage estimated at Rs 3 crores.
28 October-2 November 1981
Crossed Saurastra coast close to Mangrol on November 1 and moved close to Porbandar on November 2. Then moved north-eastwards as a severe cyclone upto jamnagar. 5700 housed and about an equal number of huts destroyed/damaged.
4-9 November 1982 Crossed south Gujarat coasts west of Kodinagar. 511 people died. 12624 Pucca and 54549 Kutchha houses destroyed. Damage to crop estimated at Rs 127.23 crores
17-20 June 1996 Crossed Saurashtra coast near Diu on 18 June. 33 people died and 2472 affected. 14 people died, 1611 houses damaged 2082 cattle affected in Maharashtra.
5-9 June 1998 Crossed Saurashtra coast near Porbandar at 0200 h on June 9. Maintained its intensity till noon when it lay over interior Gulf of Kachchh. 1173 people were missing. Total loss estimated at Rs1865 crores.
16-22 May 1999 Crossed Pakistan coast near border with India on 20 May. Caused severe damage in Kachchh and Jamnagar Districts. 454 people died. Damage to property estimated at Rs 80 crores. 5104 cattle perished. 50 houses destroyed and. 5153 houses damaged.
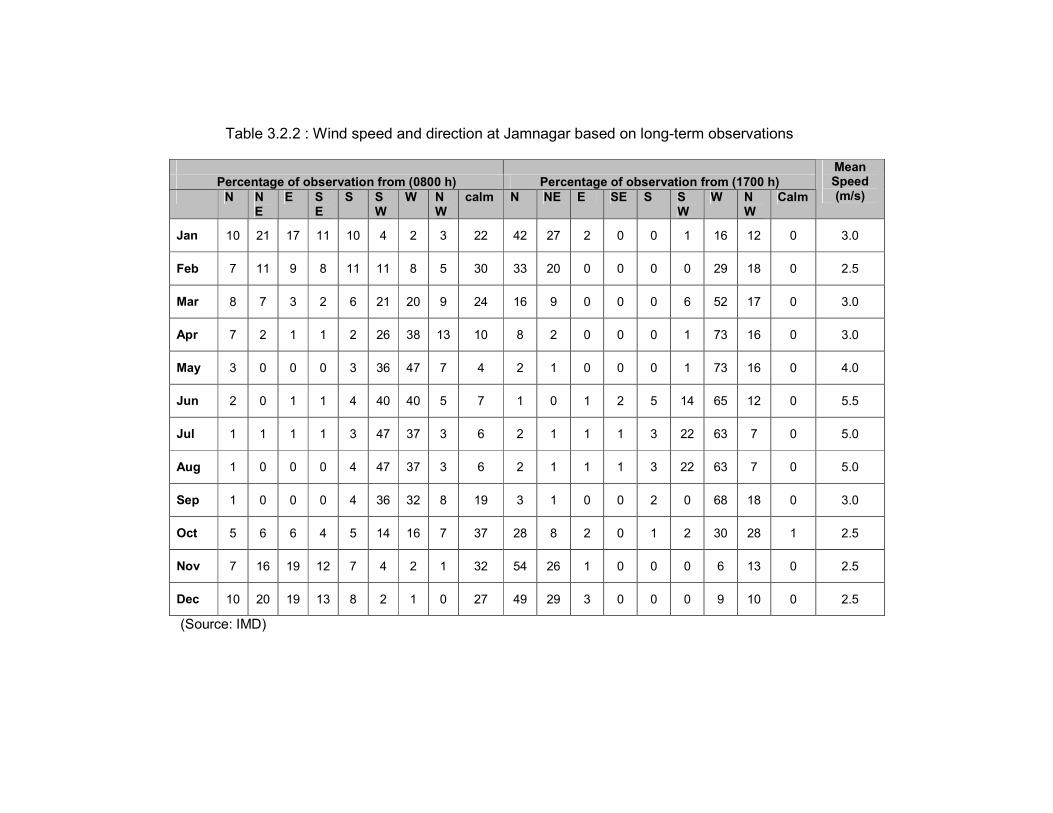
Table 3.2.2 : Wind speed and direction at Jamnagar based on long-term observations
Percentage of observation from (0800 h) Percentage of observation from (1700 h)
N NE
E SE
S SW
W NW
calm N NE E SE S SW
W NW
Calm
Mean Speed (m/s)
Jan 10 21 17 11 10 4 2 3 22 42 27 2 0 0 1 16 12 0 3.0
Feb 7 11 9 8 11 11 8 5 30 33 20 0 0 0 0 29 18 0 2.5
Mar 8 7 3 2 6 21 20 9 24 16 9 0 0 0 6 52 17 0 3.0
Apr 7 2 1 1 2 26 38 13 10 8 2 0 0 0 1 73 16 0 3.0
May 3 0 0 0 3 36 47 7 4 2 1 0 0 0 1 73 16 0 4.0
Jun 2 0 1 1 4 40 40 5 7 1 0 1 2 5 14 65 12 0 5.5
Jul 1 1 1 1 3 47 37 3 6 2 1 1 1 3 22 63 7 0 5.0
Aug 1 0 0 0 4 47 37 3 6 2 1 1 1 3 22 63 7 0 5.0
Sep 1 0 0 0 4 36 32 8 19 3 1 0 0 2 0 68 18 0 3.0
Oct 5 6 6 4 5 14 16 7 37 28 8 2 0 1 2 30 28 1 2.5
Nov 7 16 19 12 7 4 2 1 32 54 26 1 0 0 0 6 13 0 2.5
Dec 10 20 19 13 8 2 1 0 27 49 29 3 0 0 0 9 10 0 2.5
(Source: IMD)

Table 4.2.1: Water quality at station A off Vadinar-Salaya during premonsoon
Air temperature (oC) given in parenthesis * Single value
April 2007 April 2008 Parameter Level
Min Max Av Min Max Av
S 27.0 28.5 27.9 27.3 29.5 28.3
B 27.2 28.0 27.7 27.0 29.3 27.8
Temperature (oC)
(27.0) (32.0) (30.3) (27.0) (32.0) (30.0)
S 7.7 7.8 7.8 8.2 8.3 8.2 pH
B 7.7 7.8 7.8 8.2 8.3 8.2
S - - 30* 34 44 39 SS (mg/l)
B - - 26* 36 50 43
S 36.4 36.8 36.6 35.4 36.1 35.7 Salinity (ppt)
B 36.4 37.5 37.0 35.2 35.9 35.5
S 4.1 5.0 4.4 3.8 4.6 4.2 DO (ml/l)
B 4.2 5.3 4.5 4.0 8.9 4.6
S - - 3.6* 2.2 2.5 2.3 BOD (mg/l)
B - - >5.3 1.8 2.2 2.0
S 2.9 4.2 3.4 0.5 1.2 0.9 PO43--P (µmol/l)
B 4.2 6.4 4.9 0.9 1.5 1.3
S 0.3 2.6 1.7 2.4 6.0 1.3 NO3 --N (µmol/l)
B 0.3 3.0 1.6 1.8 3.8 2.9
S 0.2 0.4 0.3 0.2 0.5 0.4 NO2--N (µmol/l)
B 0.2 0.6 0.3 0.2 0.7 0.4
S 0.3 2.2 1.1 0.1 0.7 0.3 NH4+-N (µmol/l)
B 0.5 1.4 0.9 0.2 8.4 1.1
S - - 23.3* - - 15.4* TN (µmol/l)
B - - 21.0* - - 38.8*
PHc (µg/l) 1m - - 9.0* 13.5 35.0 24.3
Phenols (µg/l) S - - 31.7* 48.5 54.2 51.4

Table 4.2.2: Water quality at station B off Vadinar-Salaya during premonsoon
Air temperature (oC) given in parenthesis * Single value
April 2007 April 2008 Parameter Level
Min Max Av Min Max Av
S - - 28.0* - - 29.0*
B - - 27.1* - - 28.0*
Temperature (oC)
- - (28.5)* (32.5)*
S 7.7 7.7 7.7 8.2 8.2 8.2 pH
B 7.7 7.7 7.7 8.2 8.2 8.2
S - - 20* - - 36* SS (mg/l)
B - - 22* - - 29*
S 36.7 36.9 36.8 36.3 37.6 36.9 Salinity (ppt)
B 36.9 36.9 36.9 36.8 37.0 36.9
S 4.5 5.0 4.8 4.2 4.4 4.3 DO (ml/l)
B 4.1 4.5 4.3 3.8 4.2 4.0
S - - 2.4* - - 1.3* BOD (mg/l)
B - - 1.6* - - 0.3*
S 2.6 2.7 2.6 2.4 2.5 2.5 PO43--P (µmol/l)
B 3.0 3.5 3.2 4.2 4.2 4.2
S 1.1 1.3 1.2 0.7 1.1 0.9 NO3 --N (µmol/l)
B 1.1 1.3 1.2 1.7 1.9 1.8
S 0.1 0.2 1.2 0.1 0.5 0.3 NO2--N (µmol/l)
B 0.1 0.1 0.1 0.2 0.3 0.3
S 0.1 0.4 0.2 0.3 1.0 0.7 NH4+-N (µmol/l)
B 0.1 0.2 0.1 ND 0.9 0.4
S - - 21.0* - - 25.8 TN (µmol/l)
B - - 24.2* - - 24.2*
PHc (µg/l) 1m - - 15.0* - - 27.8*
Phenols (µg/l) S - - 44.2* - - 56.4*

Table 4.2.3: Water quality at station C off Vadinar-Salaya during premonsoon
Air temperature (oC) given in parenthesis * Single value
April 2007 April 2008 Parameter Level
Min Max Av Min Max Av
S 27.4 27.9 27.9 27.2 28.8 28.1
B 27.2 27.2 27.2 27.0 27.8 27.2
Temperature (oC)
(27.5) (27.5) (27.5) (27.0) (31.0) (29.3)
S 7.7 7.7 7.7 8.2 8.3 8.2 pH
B 7.6 7.6 7.6 8.2 8.2 8.2
S - - 24* 19 25 22 SS (mg/l)
B - - 18* 20 29 25
S 36.7 36.7 36.7 35.9 36.5 36.1 Salinity (ppt)
B 36.5 36.5 36.5 35.7 36.1 36.0
S 4.8 5.0 4.9 4.0 4.9 4.6 DO (ml/l)
B 4.5 4.5 4.5 4.2 4.7 4.5
S - - 3.1* 2.8 3.1 3.0 BOD (mg/l)
B - - 1.8* 1.7 2.0 1.9
S 1.6 2.0 1.8 0.5 1.1 0.8 PO43--P (µmol/l)
B 3.5 4.0 3.7 1.1 2.1 1.4
S 1.5 2.1 1.8 1.6 6.4 4.4 NO3 --N (µmol/l)
B 1.4 1.7 1.5 4.3 6.3 5.1
S 0.3 0.3 03 0.2 3.5 0.6 NO2--N (µmol/l)
B 0.2 0.2 0.2 0.4 0.9 0.7
S 1.6 3.0 2.3 ND 3.2 0.4 NH4+-N (µmol/l)
B 0.2 0.9 0.5 ND 0.2 0.1
S - - 31.0* - - 26.0* TN (µmol/l)
B - - 32.1* - - 25.4*
PHc (µg/l) 1m - - 27.9* 23.0 34.0 28.5
Phenols (µg/l) S - - 30.5* 15.1 39.6 27.4

Table 4.2.4: Water quality at station D off Vadinar-Salaya during premonsoon
Air temperature (oC) given in parenthesis * Single value
April 2007 April 2008 Parameter Level
Min Max Av Min Max Av
S 26.2 27.8 27.4 27.5 28.8 28.2
B 26.5 27.5 27.0 27.0 28.0 27.5
Temperature (oC)
(26.2) (28.5) (27.5) (27.0) (29.8) (28.7)
S 7.8 7.9 7.8 8.2 8.3 8.3 pH
B 7.8 7.9 7.9 8.2 8.3 8.3
S 18 18 18 18 20 19 SS (mg/l)
B 18 66 42 27 86 57
S 36.1 36.4 36.3 35.0 35.7 35.3 Salinity (ppt)
B 36.1 36.4 36.4 35.0 35.5 35.3
S 4.3 5.7 5.1 4.0 4.4 4.3 DO (ml/l)
B 4.8 5.7 5.0 3.3 4.4 4.1
S 4.0 4.2 4.1 3.0 4.3 3.6 BOD (mg/l)
B 0.3 4.4 2.3 2.5 2.7 2.6
S 2.1 3.4 2.6 ND 1.1 0.7 PO43--P (µmol/l)
B 2.5 5.0 3.7 0.9 1.6 1.2
S 2.2 7.6 3.9 3.5 5.4 4.5 NO3 --N (µmol/l)
B 2.9 7.3 4.3 3.5 5.8 4.6
S 0.1 0.3 0.1 0.2 0.4 0.3 NO2--N (µmol/l)
B 0.1 0.5 0.3 0.2 0.8 0.5
S 2.9 7.3 4.3 ND 1.3 0.4 NH4+-N (µmol/l)
B ND 14.9 1.9 ND 0.3 0.1
S 16.4 19.8 18.1 - - 33.2* TN (µmol/l)
B 13.7 17.1 15.4 - - 18.4*
PHc (µg/l) 1m 17.1 22.3 19.7 38.1 41.3 39.7
Phenols (µg/l) S - - - 39.8 51.4 45.6

Table 4.2.5: Water quality at station E off Vadinar-Salaya during premonsoon
Air temperature (oC) given in parenthesis * Single value
April 2007 April 2008 Parameter Level
Min Max Av Min Max Av
S 26.5 28.0 27.1 28.5 28.5 28.5
B 26.0 27.0 26.6 28.0 28.0 28.0
Temperature (oC)
(26.0) (28.5) (27.5) (29.0) (29.0) (29.0)
S 7.7 7.9 7.8 8.2 8.2 8.2 pH
B 7.8 7.9 7.8 8.2 8.2 8.2
S 20 24 22 - - 22* SS (mg/l)
B 18 22 20 - - 21*
S 36.3 36.4 36.3 35.2 35.5 35.4 Salinity (ppt)
B 36.1 36.4 36.3 35.4 35.7 35.5
S 4.9 5.9 5.5 4.5 4.5 4.5 DO (ml/l)
B 4.5 5.7 5.0 4.4 4.5 4.5
S 3.4 4.8 4.1 - - - BOD (mg/l)
B 1.9 3.4 2.7 - - -
S 5.0 7.5 6.3 0.1 0.3 0.2 PO43--P (µmol/l)
B 7.7 10.0 9.0 1.1 1.2 1.1
S 0.6 5.4 2.6 3.7 3.8 3.7 NO3 --N (µmol/l)
B 0.5 5.1 3.8 3.2 4.6 3.9
S 0.1 0.5 0.2 0.4 0.5 0.4 NO2--N (µmol/l)
B 0.1 1.2 0.4 0.2 0.6 0.4
S 0.1 1.3 0.6 0.1 0.2 0.2 NH4+-N (µmol/l)
B ND 0.7 0.3 0.1 0.1 0.1
S 31.0 32.4 31.7 - - 46.6* TN (µmol/l)
B 15.0 16.0 15.5 - - 40.6*
PHc (µg/l) 1m 5.6 15.4 10.5 - - 19.4*
Phenols (µg/l) S 45.1 47.0 46.1 - - 37.2*

Table 4.2.6: Water quality at station F off Vadinar-Salaya during premonsoon
Air temperature (oC) given in parenthesis * Single value
April 2007 April 2008 Parameter Level
Min Max Av Min Max Av
S - - 28.0* - - 29.0*
B - - 27.0* - - 28.9*
Temperature (oC)
(29.0) (29.0) (29.0) (29.9) (29.9) (29.9)
S - - 7.9* - - 8.2* pH
B - - 7.9* - - 8.3*
S - - 18* - - 56* SS (mg/l)
B - - 40* - - 28*
S 36.0 36.0 36.0 35.0 35.2 35.1 Salinity (ppt)
B 35.8 36.0 35.9 35.2 35.4 35.3
S 4.5 4.5 4.5 4.5 4.7 4.6 DO (ml/l)
B 4.4 4.6 4.5 4.5 4.5 4.5
S - - 2.6* - - - BOD (mg/l)
B - - 0.5* - - -
S 3.9 4.4 4.2 1.2 1.3 1.3 PO43--P (µmol/l)
B 4.2 4.9 4.5 1.6 1.9 1.7
S 6.8 11.4 9.1 4.1 5.2 4.6 NO3 --N (µmol/l)
B 10.7 11.0 11.9 4.2 4.5 4.3
S 0.5 0.6 0.5 0.6 0.6 0.6 NO2--N (µmol/l)
B 0.5 0.5 0.5 0.6 0.8 0.7
S ND 1.1 1.1 0.1 0.1 0.1 NH4+-N (µmol/l)
B 0.2 0.2 0.2 0.1 0.1 0.1
S - - 34.2* - - 37.2* TN (µmol/l)
B - - 36.5* - - 42.4*
PHc (µg/l) 1m - - 18.2* - - 22.2*
Phenols (µg/l) S - - 16.8* - - 19.0*

Table 4.2.7: Water quality at station G off Vadinar-Salaya during premonsoon
Air temperature (oC) given in parenthesis * Single value
April 2007 April 2008 Parameter Level
Min Max Av Min Max Av
S 28.5 29.5 29.1 29.0 29.2 29.1
B 28.5 29.5 29.0 29.0 29.0 29.0
Temperature (oC)
(27.3) (29.0) (28.0) (31.0) (31.0) (31.0)
S 7.9 8.0 8.0 8.0 8.1 8.1 pH
B 7.9 8.0 8.0 8.2 8.2 8.2
S 22 30 26 - - 31* SS (mg/l)
B 48 68 58 - - 26*
S 36.4 37.2 36.9 35.9 35.9 35.9 Salinity (ppt)
B 36.4 37.2 36.9 36.1 36.8 36.4
S 3.9 4.8 4.1 4.6 4.6 4.6 DO (ml/l)
B 2.8 4.6 4.2 4.3 4.4 4.4
S 1.9 2.7 2.3 - - 2.5* BOD (mg/l)
B 3.1 3.1 3.1 - - 2.0*
S 2.4 7.6 4.7 0.7 0.9 0.8 PO43--P (µmol/l)
B 3.3 7.6 5.5 0.6 0.7 0.7
S 2.5 11.3 5.7 4.5 4.6 4.6 NO3 --N (µmol/l)
B 2.7 13.1 6.7 3.2 3.5 3.4
S 0.1 0.2 0.2 0.5 0.5 0.5 NO2--N (µmol/l)
B 0.1 0.5 0.2 0.5 0.5 0.5
S 0.3 2.4 1.3 0.2 0.2 0.2 NH4+-N (µmol/l)
B 0.2 4.4 1.4 0.2 0.2 0.2
S 49.9 81.2 65.5 - - 41.4* TN (µmol/l)
B 41.5 53.1 47.3 - - 28.8*
PHc (µg/l) 1m 5.0 15.5 10.5 - - 25.0*
Phenols (µg/l) S 8.6 35.8 22.2 - - 21.4*

Table 4.2.8: Water quality at station H off Vadinar-Salaya in April 2007
Air temperature (oC) given in parenthesis * Single value
Parameter Level Min Max Av
S 28.5 28.5 28.5
B 28.5 28.5 28.5
Temperature (oC)
(29.0) (29.0) (29.0)
S 7.9 7.9 7.9 pH
B 7.9 7.9 7.9
S - - 30* SS (mg/l)
B - - 34*
S 37.0 37.2 37.1 Salinity (ppt)
B 36.4 36.8 36.6
S 4.3 4.5 4.4 DO (ml/l)
B 4.3 4.5 4.4
S - - 4.2* BOD (mg/l)
B - - 0.8*
S 4.1 4.9 4.5 PO43--P (µmol/l)
B 5.1 5.5 5.3
S 1.7 9.3 5.5 NO3 --N (µmol/l)
B 4.4 7.1 5.7
S 0.2 0.3 0.2 NO2--N (µmol/l)
B 0.2 0.2 0.2
S 0.3 0.4 0.4 NH4+-N (µmol/l)
B 0.1 0.3 0.2
S - - 40.4* TN (µmol/l)
B - - 37.4*
PHc (µg/l) 1m - - 15.0*
Phenols (µg/l) S - - 24.2*

Table 4.3.1: Sediment quality of Gulf off Vadinar-Salaya (Values in dry weight basis except for PHc which are on wet weight basis) Station Code
Sand (%)
Silt (%)
Clay (%)
Al (%)
Cr
(µµµµg/g)
Mn
(µµµµg/g)
Fe (%)
Co
(µµµµg/g)
Ni
(µµµµg/g)
Cu
(µµµµg/g)
Zn
(µµµµg/g)
Hg
(µµµµg/g)
Cd
(µµµµg/g)
Pb
(µµµµg/g)
Corg (%)
P
(µµµµg/g)
PHc
(µµµµg/g)
April 2007
A 2.8 90.8 6.4 7.2 94 795 5.1 31 76 50 60 0.03 - - 0.9 230 0.3
B 66.6 28.0 5.4 3.8 60 554 2.5 23 108 30 40 0.05 - - 0.5 144 0.3
C 18.5 75.3 6.2 6.7 110 1077 5.1 31 75 45 68 0.04 - - 0.9 451 0.6
D 3.2 90.8 6.0 7.4 109 1025 4.8 31 76 46 65 0.04 - - 0.8 234 0.4
E 44.0 50.6 5.4 6.5 109 816 5.2 31 67 46 56 0.05 - - 0.4 435 0.5
F 12.9 79.3 7.8 7.0 90 597 4.6 33 2 40 89 0.03 - - 0.7 798 0.5
G 28.1 63.1 8.8 6.4 136 760 6.2 45 83 64 86 0.03 - - 0.5 656 0.2
H 90.2 4.2 5.6 4.9 104 1295 0.6 45 73 55 62 0.03 - - 0.3 1037 0.1
April 2008
A - - - 7.4 96 613 4.1 36 41 46 69 0.02 0.12 18.4 1.2 891 3.0
B - - - 4.6 62 492 2.6 29 20 29 110 0.02 0.15 23.2 1.0 858 2.7
C - - - 8.7 95 701 4.2 38 42 44 88 0.01 0.13 18.6 0.9 914 5.6
D - - - 7.3 86 709 3.8 34 33 37 81 0.02 0.18 15.5 1.2 905 4.0
E - - - 6.0 95 720 3.7 34 33 40 87 0.03 0.22 12.7 1.4 980 6.3
F - - - 3.5 70 582 1.8 25 8 33 39 ND 0.24 5.5 0.7 843 0.8
G - - - 7.3 46 667 4.0 34 53 50 80 0.01 0.14 17.0 0.9 1017 0.4
TI - - - 0.3 25 132 0.4 35 6 5 31 ND 0.36 3.8 1.1 878 0.3
TII - - - 0.1 24 154 0.3 22 9 3 15 ND 0.39 2.6 0.9 752 0.4
TIII - - - 0.3 24 107 0.6 2 9 9 11 0.01 0.40 2.6 0.7 814 0.4
T : Intertidal transect

Table 4.4.1 : Microbial counts in water (Plate; no/ml) off Vadinar-Salaya during November 2004
Station Type of Bacteria A B C D E F G H
TVC 1.6x10³ 129x103 16x103 17x103 2.7x10³ 3.8x10³ 1.8x10³ 3.6x10³
TC ND ND 30 143 138 ND 25 28
FC 3 ND 20 105 35 8 18 13
ECLO ND ND 13 30 10 3 ND 5
SHLO 3 ND ND 15 ND ND ND ND
SLO ND ND ND ND ND ND ND ND
PKLO ND ND ND 38 ND ND ND ND
VLO 3 35 123 605 383 58 38 28
VPLO ND 20 ND 150 140 28 10 18
VCLO 3 15 123 455 243 30 28 10
PALO ND ND ND ND ND ND ND ND
SFLO ND ND ND ND ND ND ND ND
ND – Not Detected

Table 4.4.2 : Microbial counts in sediments (Plate no/g; dry wt) off Vadinar-Salaya during November 2004
Station Transect Type of Bacteria A B D E F G H I II III
TVC 62.6 x10³
399.8 x10³
184.8 x10³
109.3 x10³
96 x103
137.7 x10³
65.2 x10³
618 x103
167 x103
16.2 x10³
TC 1472 41 36 1093 320 ND 570 177x102 4400 8280
FC 1380 ND 18 850 240 ND ND 130x102 3080 4140
ECLO 460 41 18 243 160 ND 163 7210 1540 2880
SHLO ND ND ND ND 90 ND ND 128x102 110 1260
SLO ND ND ND ND ND ND ND 412 ND ND
PKLO 1196 ND ND ND ND ND ND 4120 ND 540
VLO 3956 ND ND 486 1920 135 ND 169x102 6160 5580
VPLO 644 ND ND ND 480 ND ND 2266 660 5580
VCLO 3220 ND ND 486 1440 135 ND 146x10102 5560 ND
PALO ND ND ND ND ND ND ND 824 7920 1170
SFLO ND ND ND ND ND ND ND ND ND ND
ND – Not Detected

Table 4.4.3: Range and average (Parenthesis) of phytopigment off Vadinar-Salaya during April 2007 and 2008
April 2007 April 2008
Chlorophyll a (mg/m
3)
Phaeophytin (mg/m
3)
Ratio of Chl a to Phaeo
Chlorophyll a (mg/m
3)
Phaeophytin (mg/m
3)
Ratio of Chl a to Phaeo
Station
S B S B S B S B S B S B
A 0.9-2.1 (1.3)
0.6-1.7 (1.0)
0.1-1.5 (0.8)
0.3-2.1 (1.0)
0.6-11.0 (3.8)
0.3-2.1 (1.1)
1.3-1.9 (1.6)
0.9-1.2 (1.1)
0.2-0.7 (0.4)
0.2-0.7 (0.3)
2.2-7.0 (4.3)
1.7-6.7 (4.0)
B 0.6-1.3 (1.0)
0.9-1.3 (1.1)
0.9-1.6 (1.3)
2.5-2.6 (2.6)
0.7-0.8 (0.8)
0.3-0.5 (0.4)
1.2-1.4 (1.3)
1.2-1.3 (1.3)
0.3-0.4 (0.4)
0.3-0.4 (0.4)
3.1-4.3 (3.7)
3.3-3.7 (3.5)
C 0.9-1.1 (1.0)
0.4-1.1 (0.8)
0.4-3.6 (2.0)
0.1-3.2 (1.7)
0.3-2.7 (1.5)
0.1-10.7 (5.4)
1.2-1.9 (1.6)
1.0-1.6 (1.2)
0.1-0.9 (0.3)
0.1-0.9 (0.3)
1.4-14.0 (8.4)
1.7-14.4 (7.7)
D 0.2-1.9 (1.0)
0.2-1.3 (0.7)
0.2-5.6 (3.4)
1.5-7.5 (4.2)
0.1-1.0 (0.5)
0.1-0.4 (0.2)
1.1-1.6 (1.4)
0.7-1.9 (1.3)
0.1-0.8 (0.3)
0.1-0.6 (0.3)
2.0-23.6 (10.4)
1.7-13.1 (4.8)
E 0.6-2.8 (1.3)
0.4-1.3 (0.9)
0.8-7.5 (5.4)
0.1-7.7 (3.1)
0.1-0.6 (0.2)
0.1-13.0 (2.5)
1.8-1.9 (1.9)
1.4-1.7 (1.6)
0.1-0.2 (0.2)
0.1-0.1 (0.1)
11.2-37.8 (24.5)
14.4-18.6 (16.5)
F 0.2-0.2 (0.2)
0.2-0.4 (0.3)
0.2-0.4 (0.3)
0.2-2.9 (1.6)
0.5-1.0 (0.8)
0.1-1.0 (0.6)
1.1-1.2 (1.2)
1.3-1.4 (1.4)
0.2-0.3 (0.3)
0.4-0.6 (0.5)
3.7-5.2 (4.5)
2.1-3.7 (2.9)
G 0.2-1.5 (0.8)
0.4-1.5 (0.8)
0.4-3.7 (2.0)
1.2-5.7 (3.5)
0.1-1.5 (0.7)
0.1-1.3 (0.3)
1.2-1.3 (1.3)
0.9-1.1 (1.0)
0.3-0.4 (0.4)
0.2-0.3 (0.3)
3.1-3.8 (3.5)
3.5-4.6 (4.1)
H 1.5-2.3 (1.9)
1.3-2.1 (1.7)
0.6-1.4 (1.0)
0.8-1.8 (1.3)
1.6-2.5 (2.1)
1.2-1.6 (1.4)
- - - - - -

Table 4.4.4 : Range and average (parenthesis) of phytoplankton population off
Vadinar-Salaya during April 2007
Cell count (nox103/l)
Total genera (no)
Major genera Station
S B S B S B
A 173.6* 109.6* 25* 26*
Thalassiosira, Nitzschia, Leptocylindrus Rhizosolenia
Nitzschia, Thalassiothrix, Rhizosolenia, Guinardia
B 112.0* 113.6* 23* 27*
Rhizosolenia, Chaetoceros, Guinardia, Thalassionema
Chaetoceros, Rhizosolenia, Nitzschia, Guinardia
C 104.8* 116.0* 21* 22*
Guinardia, Nitzschia, Hemiaulus, Chaetoceros
Leptocylindrus, Guinardia, Chaetoceros, Hemiaulus
D 80.8-120.8 (100.8)
68.8-90.4 (79.6)
21-25 (23)
19-21 (20)
Chaetoceros, Guinardia, Nitzschia, Thalassionema
Guinardia, Nitzschia, Leptocylindrus, Rhizosolenia
E 99.2-161.6 (130.4)
65.6-108.8 (87.2)
19-23 (21)
16-21 (19)
Leptocylindrus, Chaetoceros Hemiaulus, Guinardia
Leptocylindrus, Chaetoceros Hemiaulus, Guinardia
F 22.4* 53.6* 16* 20*
Lithodesmium, Peridinium, Nitzschia, Navicula
Eucampia, Rhizosolenia, Nitzschia, Thalassiosira
G 10.4-126.0
(70) 44.0-134.4
(89.2) 12-28 (20)
19-26 (23)
Thalassiosira, Navicula Nitzschia, Melosira
Nitzschia, Rhizosolenia, Thalassiothrix, Thalassiosira
H 272.0* 214.0* 26* 25*
Nitzschia, Rhizosolenia, Thalassiosira, Navicula
Nitzschia, Rhizosolenia, Thalassiothrix, Leptocylindrus
* Single value

Table 4.4.5: Range and average of phytoplankton population off Vadinar-Salaya
during April 2008
Cell count (nox103/l)
Total genera (no)
Major genera Station
S B S B S B
A 57.6-83.2 (70.4)
36.8-66.4 (51.6)
17-19 (18)
15-18 (17)
Chaetoceros Rhizosolenia Melosira Navicula
Chaetoceros Thalassiosira Navicula Biddulphia
B 43.2* 34.4* 16* 17*
Chaetoceros Navicula Leptocylindrus Peridinium
Rhizosolenia Navicula Peridinium Thalassiosira
C 24.8-40.8 (32.8)
22.4-23.2 (22.8)
14-16 (15)
14-16 (15)
Thalassiosira Cyclotella Nitzschia Navicula
Thalassiosira Navicula Leptocylindrus Melosira
D 28.0-32.8 (30.4)
34.4-40.0 (37.2)
16-18 (17)
18-18 (18)
Thalassiosira Navicula Peridinium Nitzschia
Melosira Navicula Eucampia Peridinium
E 88.8* 63.6* 19* 20*
Guinardia Thalassiosira Chaetoceros
Eucampia
Eucampia Guinardia Thalassiosira Nitzschia
F 42.4* 58.4* 16* 14*
Melosira Thalassiosira Guinardia Thalassiothrix
Guinardia Meuneria Nitzschia Thalassiothrix
G 23.2* 19.2* 15* 14*
Thalassiothrix Navicula Thalassiosira Thalassionema
Navicula Thalassiothrix Thalassiosira Guinardia
* Single value

Table 4.4.6 : Abundance of phytoplankton population off Vadinar/Salaya during April 2007
(+ : Present ; - : Absent)
Algal genera A B C D E F G H
Amphiprora - - - + + - + +
Amphora + - - - - - - +
Bacillaria + + - + + - + +
Bacteriastrum + + + + + - - +
Biddulphia + + - + + + + +
Campyloneis - - - + - + - -
Ceratium + + - - - - + -
Chaetoceros + + + + + + + +
Coretheron + + + + - + + +
Coscinodiscus + + + + + + - +
Cyclotella + + + + + + + +
Cymbella + + - - - - + -
Diploneis - + - - - - + -
Distephanus + + + + + + + -
Ditylium + + + + + + + +
Dictyocha - - - - - - + -
Eucampia + + + + + + + +
Fragillaria - - - - - - + +
Grammatophora - + - - - - + +
Guinardia + + + + + + + +
Gyrosigma + + + + + + + +
Hemiaulus + + + + + + + +
Hyalodiscus - - - + - - + -
Leptocylindrus + - + + + + + +
Licmophora + + - + + - - +
Lithodesmium + - - - + + - -
Melosira + - - + + + + +
Meuniera + + + + + + + +
Navicula + + + + + + + +
Nitzschia + + + + + + + +
Oscillatoria - - - - - - + -
Peridinium + + + + + + + +
Pinnularia - + - - - - + -
Planktoniella + + + + + - - -
Pleurosigma + + + + + + + +
Prorocentrum - + + + + + + -
Rhizosolenia + + + + + + + +
Skeletonema + - + - - - + +
Surirella + + - + + + + +
Thalassionema + + + + + - + +
Thalassiosira + + + + + + + +
Thalassiothrix + + - + - + + +
Triceratium - - - - - - - -

Table 4.4.7 : Abundance of phytoplankton genera off Vadinar-Salaya during April 2008
Algal genera A B C D E F G
Amphora + + - - - - -
Anabaena - - - - - - -
Asterionella + - - - - - -
Bacillaria + - - - - - -
Bacteriastrum - - + + + - +
Biddulphia + - + + + + +
Chaetoceros + + - - + - +
Corethron - - - - - - -
Coscinodiscus - - + - - - -
Cyclotella + + + - + + +
Diploneis + - + + - - -
Ditylium + + - - - - -
Dityocha - - - - - - -
Eucampia + - + + + + -
Gramatophora + + - - - + -
Guinardia + + + + + + +
Gyrosigma + + + + - - +
Hemiaulus + + + + + - -
Leptocylindrus + + + + + - +
Lithodesmium + + + - - - -
Melosira + - - - + + -
Meuniera + + - - - + +
Navicula + + + + + + +
Nitzschia + + + + + + -
Pediastrum + - - - - - -
Peridinium + + + + + - +
Planktoniella - - - + - - -
Pleurosigma + + + + + + +
Prorocentrum - + + + + - -
Rabdonema - - - - - - -
Rhizosolenia + + + + + + -
Skeletonema - - + - - - -
Streptotheca - - + - + - -
Surirella + + + - + + -
Thalassionema + + + + + - +
Thalassiosira + + + + + + +
Thalassiothrix + + + + + + +
(+ : Present ; - : Absent)

Table 4.4.8 : Marine algae at Kalubhar and Narara Island recorded during premonsoon (I) and postmonsoon (II) of 2006-07
Kalubhar Narara Species I II II
MARINE ALGAE Cyanophyceae
Lyngbya majuscula - + +
Lyngbya sp. +++ - -
Anabeana sp. ++ - -
Oscillatoria sp. ++ - -
Microcoleus sp. - + +
Chlorophyceae
Caulerpa racemosa + ++ ++
C.verticillata + - -
C.sertularioides - + +
C.taxiformes - + +
Cladophora prolifera + - -
C.patentir/samea - + ++
Cladophora sp. - + +
Codium decorticatum ++ - -
C.dwarkensis ++ - -
Enteromorpha clathrata +++ +++ +++
E.intestinalis ++ +++ +++
Microdictyon sp. ++ - -
Ulva fasciata + - -
U.lactuca +++ - -
U.reticulata +++ - -
Halideda tuna - + +
Phaeophyceae Colpomenia sinuosa + + +
Cystoceira indica + + +
C.myrica - + -
Dictyota ciliolata ++ - -
D.divaricata + - -
D.atomaria - - +
D.bartayrisiana - + +
D.cervicornis - + +
Ectocarpus rhodocortonoides ++ - -
Hydroclathrus clathratus +++ - - Hinskia mitchelle - + +
Iyengaria stellata ++ - -
Padina tetrastromatica +++ +++ ++
Sargassum ilicifolium + + +
S.swartzii + + +
S.tenerrimum + + +
S.vulgare - + +

Kalubhar Narara Species I II II
Sargassum sp. 1 + + + Sargassum sp. 2 + + +
Sargassum sp. 3 + - -
Turbinaria ornata + - -
Unidentified sp. + - -
Rhodophyceae
Acanthophora delilei ++ - -
A.spicifera - + ++
Am[hiroa fragilissima +++ + ++
A.rigida - + +
Ceramium huysmansii ++ - -
Champia indica ++ + ++
Centroceros clavulatum - ++ ++
Digenia simplex +++ - -
Gracilaria corticata ++ - +
G.crassa ++ - -
G.textorii + - -
G.verrucossa ++ - +
Gracilaria sp. - - +
Hypnea cervicornis ++ + ++
H.musciformis + - -
Laurencia papillosa + + +
L.pedicularioides + - +
Polysiphonia platycarpa ++ - +
Sarconema filiforme + - -
S.scianoides + - -
Scinaia indica - - + Spyridia filamentosa + - -
Wranglia sp. - - +
SEAGRASSES
Halodule univervis - + +
Halophila ovata + + +
H.beccarii - + +
MANGROVES
Avicennia marina +++ +++ ++
A.officinalis ++ ++ -
Ceriops tagal ++ ++ -
Salicornia brachiata ++ ++ -
Suaeda maritima ++ ++ -
Salvadora persiea ++ ++ - Very common = +++; Common = ++; Rare = +; Absent = -

Table 4.4.9: Range and average (parenthesis) of zooplankton off Vadinar-Salaya
during April 2007 and 2008
Station
Biomass (ml/100m³)
Population (nox10³/100m³)
Total Groups (no)
Major group (%)
April 2007
A 3.0-9.4 (5.5)
30.0-87.5 (56.4)
11-18 (15)
Copepods (50.2), decapod larvae (43.8), gastropods (1.7), polychaetes (1.3), fish eggs (1.1), appendicularians (0.4), fish larvae (0.5), lamellibranchs (0.4), foraminiferans (0.1), chaetognaths (0.1), siphonophores (0.1), others (0.1).
B 13.6-42.3 (28.0)
84.3-90.5 (87.4)
12-15 (14)
Decapod larvae (82.3), copepods (12.6), gastropods (3.9), foraminiferans (0.5), polychaetes (0.2), lamellibranchs (0.2), chaetognaths (0.1), fish larvae (0.1), others (0.1).
C 1.6-1.7 (1.7)
15.2-25.5 (20.3)
12-13 (13)
Copepods (85.7), decapod larvae (9.1), gastropods (4.0), siphonophores (0.3), chaetognaths (0.3), appendicularians (0.2), fish eggs (0.1), lamellibranchs (0.1), polychaetes (0.1), others (0.1).
D 0.2-6.5 (3.3)
1.4-20.1 (6.7)
8-16 (12)
Copepods (71.9), gastropods (10.8), decapod larvae (6.6), lamellibranchs (3.7), appendicularians (2.4), chaetognaths (2.0), polychaetes (0.7), Lucifer sp (0.6), siphonophores (0.5), medusae (0.2), amphipods (0.2), fish eggs (0.1), fish larvae (0.1), ctenophores (0.1), others (0.1).
E 1.5-7.4 (3.6)
2.7-32.3 (10.3)
5-14 (10)
copepods (86.3), gastropods (3.5), lamellibranchs (3.1), chaetognaths (2.2), decapod larvae (1.8), appendicularians (1.8), polychaetes (0.6), siphonophores (0.4), Lucifer sp (0.1), ostracods (0.1), others (0.1).
F 5.1-6.3 (5.7)
31.3-44.2 (37.8)
14-16 (15)
Copepods (67.2), decapod larvae (13.2), gastropods (9.5), chaetognaths (4.6), Lucifer sp (2.8), lamellibranchs (1.4), polychaetes (1.1), foraminiferans (0.1), others (0.1).
G 2.1-66.0 (17.3)
7.0-297.9 (68.9)
11-17 (15)
Decapod larvae (41.7), copepods (24.1), gastropods (24.1), lamellibranchs (6.9), chaetognaths (2.0), fish larvae (0.4), siphonophores (0.3), medusae (0.3), others (0.2).

Table 4.4.9 (contd. 2)
Station
Biomass (ml/100m³)
Population (nox10³/100m³)
Total Groups (no)
Major group (%)
H 2.9-15.7 (9.3)
30.9-107.5 (68.2)
15-17 (16)
Decapod larvae (38.6), copepods (30.1), gastropods (28.3), lamellibranchs (1.9), chaetognaths (0.6), fish larvae (0.2), siphonophores (0.1), medusae (0.1), others (0.1).
April 2008
A
2.2-6.1 (4.5)
19.1-130.3 (63.0)
14-15 (15)
Decapod larvae (47.4), copepods (41.4), gastropods (4.2), lamellibranchs (3.6), chaetognaths (1.4), Lucifer sp.(0.8), siphonophores (0.7), ostracods (0.2), medusae (0.1), fish larvae (0.1), others (0.1).
B 10.7-17.0
(8.9) 15.0-36.9 (26.0)
14-16 (15)
Decapod larvae (71.7), gastropods (14.2), copepods (7.6), fish eggs (2.7), foraminiferans (2.7), siphonophores (0.4), medusae (0.2), chaetognaths (0.2), fish larvae (0.1), lamellibranchs (0.1), others (0.1).
C 0.9-5.5 (2.2)
0.1-22.8 (11.5)
4-17 (10)
Copepods (83.4), decapod larvae (4.5), gastropods (4.3), lamellibranchs (2.4), chaetognaths (2.4), amphipods(1.8), Lucifer sp (0.6), foraminiferans (0.3), siphonophores (0.2), fish eggs (0.1), others (0.0).
D 1.9-13.8 (5.4)
15.6-138.7 (48.4)
14-18 (15)
Copepods (71.4), lamellibranchs (10.5), gastropods (10.3), siphonophores (3.2), chaetognaths (1.5), decapod larvae (1.5), polychaetes (0.6), medusae(0.2), appendicularians (0.1), amphipods(0.1), ostracods (0.1), foraminiferans (0.1), others (0.4).
E 0.3-5.2 (2.8)
6.5-134.8 (70.7)
11-11 (11)
Copepods (89.3), lamellibranchs (4.3), decapod larvae (3.9), chaetognaths (1.8), siphonophores (0.6), others (0.1).
F 2.4-2.9 (2.7)
11.5-23.0 (17.2)
18-19 (19)
Copepods (41.1), decapod larvae (17.5), gastropods(13.4), lamellibranchs (11.9), siphonophores (6.2), chaetognaths (4.5), ostracods (2.7), medusae(1.3), Lucifer sp.(0.9), fish larvae (0.2), polychaetes (0.1), foraminiferans (0.1), others (0.1).
G 5.4-12.7 (9.1)
27.0-109.4 (68.2)
10-11 (11)
Copepods (77.8), gastropods (11.1), lamellibranchs (7.0), decapod larvae (2.7), chaetognaths (1.2), Lucifer sp.(0.1), medusae (0.1), others (0.0).

Table 4.4.10: Abundance of zooplankton off Vadinar- Salaya during April 2007
Faunal group A B C D E F G H
Foraminiferans + + - + - + + +
Siphonophores + + + + + + + +
Medusae + + + + + + + +
Ctenophores - - - + + + + +
Chaetognaths + + + + + + + +
Polychaetes + + + + + + + +
Ostracods - - - - + - + -
Copepods + + + + + + + +
Cumaceans - - - - - - + -
Amphipods + + - + + + + +
Mysids - + - - - + + +
Lucifer sp + + + + + + + +
Decapod larvae + + + + + + + +
Stomatopods - - - - - - + +
Heteropods - - - + - - - -
Gastropods + + + + + + + +
Lamellibranchs + + + + + + + +
Appendicularians + + + + + - + +
Fish eggs + + + + + + + +
Fish Larvae + + + + + + + +
Isopods + - - + - + + +
Acetes sp + + + + + - + -
Marine Insects - - - - - - - +
(+ : Present ; - : Absent)

Table 4.4.11: Abundance of zooplankton off Vadinar during April 2008
Faunal group A B C D E F G
Foraminiferans + + + + + + -
Siphonophores + + + + + + -
Medusae + + + + + + +
Ctenophores + - + + + + +
Chaetognaths + + + + + + +
Polychaetes + + + + - + +
Cladocerans + - - - - - -
Ostracods + + + + - + -
Copepods + + + + + + +
Cumaceans + - - - - + -
Amphipods + + + + + + +
Mysids - - + - - - -
Lucifer sp + + + + + + +
Decapod larvae + + + + + + +
Stomatopods + + + + - + +
Heteropods - - + + - + -
Gastropods + + + + + + +
Lamellibranchs + + + + + + +
Appendicularians + + + + - + -
Fish eggs + + + + - - -
Fish Larvae + + + + + + +
Isopods + - + + - + -
Marine Insect - - - + - - -
Others - - - + - - -
(+ : Present ; - : Absent)

Table 4.4.12 : Distribution of decapod larvae, Acetes sp and Lucifer sp off Vadinar-Salaya during April 2007.
Decapod larvae Acetes sp Lucifer sp Station
Counts (no/100m
3)
Incidence (%)
Counts (no/100m
3)
Incidence (%)
Counts (no/100m
3)
Incidence (%)
A 4625-38479 (24684)
100 2-13 (6)
100 0-11 (4)
75
B 67146-76711
(71929) 100
0-3
(2) 50
0-60 (30)
50
C 1851-18536
(1852) 100
0-2
(1) 50
1-4 (3)
100
D 51-1280 (438)
100 0-2 (1)
28.6 0-192 (38)
42.9
E 23-425 (190)
100 0-2 (1)
14.3 0-47 (9)
57.2
F 1544-8427 (4986)
100 - - 112-1998 (1055)
100
G 1827-108124
(28739)
100 0-62 (11)
57.2 20-16497 (4755)
100
H 15666-37803
(26735)
100 - - 26-31 (29)
100
Table 4.4.13: Distribution of fish eggs, and fish larvae off Vadinar/Salaya during April 2007
Fish eggs Fish larvae Station
Counts (no/100 m3)
Incidence (%)
Counts (no/100 m3)
Incidence (%)
A 65-1866 (602)
100 1-577 (259)
100
B 1-78 (40)
100 13-115 (64)
100
C 5-50 (28)
100 8-14 (11)
100
D 0-37 (9)
57.2 0-25 (6)
71.5
E 0-2 (1)
14.3 0-10 (2)
42.9
F 0-3 (2)
50 9-21 (15)
100
G 0-29 (13)
85.8 2-909 (298)
100
H 0-23 (12)
50 22-279 (151)
100

Table 4.4.14: Range and average of intertidal macrobenthic fauna at Vadinar during April 2008
Site Biomass (g/m2; wet wt)
Population (no/m2)
Faunal group (no)
Major group
Transect I
HW 0-12.46 (4.15)
0-3168 (1056)
0-3 (1)
Chironomus larvae
MW 0.32-19.01
(6.6) 1232-2640 (1936)
1-4 (2)
Pelecypods, gastropods.
LW 0-5.74 (3.15)
0-12496 (4460)
0-4 (3)
Invertebrate egg mass.
Transect II
HW 0-2.87 (1.43)
0-9856 (4636)
2-5 (2)
Polychaetes, nematodes.
MW 0.94-21.65
(8.78) 1056-3696 (2348)
2-4 (3)
Polychaetes, pelecypods, nematodes.
LW Nil - - -
Transect III
HW 0.23-8.57 (4.85)
150-2275 (1108)
2-5 (3)
Polychaetes, amphipods, pelecypods.
MW 1.70-4.0 (2.89)
625-1525 (1057)
3-5 (4)
Polychaetes, gastropods, pelecypods, amphipods.

Table 4.4.15: Percentage composition of intertidal macrobenthos at Vadinar during April 2008
Transect
T-I T-II T-III Faunal group HW MW LW HW MW LW HW MW
Phylum Cnidaria Hydrozoans Anthozoans Phylum Aschelminthes Nematodes 27.8 10 Phylum Mollusca Amphineurans 1.3 Gastropods 16.7 30.3 5.3 1.3 0.7 24.4 Pelecypods 5.6 51.5 30 0 15.1 14.9 Phylum Annelida Polychaetes 9.1 7.9 62 55 49.6 45.7 Phylum Arthropoda Pycnogonids 0.8 Insects 1.3 Cumaceans 1.3 Isopods 1.3 Amphipods 9.1 33.8 11.8 Tanaids 1.3 Anomurans 1.6 Brachyurans 2.5 Decapod larvae 0.7 Chironomus larvae 77.7 6.3 Insect larvae 2.5 Invertebrate egg mass 82.9 Phylum Echinodermata Ophiuroids 0.8

Table 4.4.16 : Range and average (parenthesis) of subtidal macrobenthic fauna off Vadinar-Salaya during April 2007 and 2008
Station Biomass (g/m2; wet wt)
Population (no/m2)
Faunal group (no)
Major group
April 2007
A 14.01-15.09 (14.55)
5300-5575 (5439)
7-7 (7)
Polychaetes, pelecypods
B 11.15-12.83 (11.99)
1525-4125 (2829)
8-12 (10)
Polychaetes, amphipods
C 0.26-3.15 (1.71)
425-1100 (764)
3-6 (5)
Polychaetes, amphipods,
D 0.14-0.35 (0.25)
150-700 (427)
4-8 (6)
Amphipods, pelecypods, hydrozoans
E 3.17-10.15 (6.66)
450-950 (702)
5-6 (6)
Amphipods, polychaetes, pelecypods,
F 0.63-9.40 (3.64)
375-3650 (2050)
4-9 (6)
Decapod larvae polychaetes, amphipods
G 2.71-10.69 (4.98)
650-8075 (4081)
6-14 (9)
Polychaetes, amphipods,
H 5.63-39.76 (13.82)
2500-6025 (3717)
6-11 (7)
Amphipods, polychaetes
April 2008
A 3.06-6.45 (5.06)
600-1725 (1275)
4-6 (5)
Polychaetes, pelecypods, amphipods.
B 0.136-14.98
(6.75) 100-3550 (1266)
2-14 (6)
Polychaetes, amphipods,
C 1.30-1.68 (1.5)
250-550 (375)
4-6 (5)
Polychaetes, Amphipods, pelecypods.
D 1.02-11.27
(5.02) 550-3150 (1542)
6-8 (7)
Amphipods, polychaetes, hydrozoans.
E 0.4-1.48 (1.00)
125-1200 (583)
2-9 (5)
Polychaetes, nthozoans, amphipods.
F 0.2-4.02 (1.53)
150-650 (423)
1-7 (4)
Polychaetes, amphipods .
G 4.48-7.54 (5.54)
175-1900 (1300)
3-8 (6)
Polychaetes, amphipods, hydrozoans.

Table 4.4.17: Percentage composition of subtidal macrobenthos off Vadinar during May 2008
Station Faunal Groups
A B C D E F G
Phylum Protozoa
Foraminiferans
Phylum Cnidaria
Hydrozoans 7.9 6 1.9 6.4
Anthozoans 2.6 0.5 30 1.9 -
Phylum Aschelminthes
Nematodes 2.6 2.1 0.5 3 1.9
Phylum Mollusca
Gastropods 3.9 0.6 1.4 0.6
Pelecypods 13.7 7.3 4.5 1.1 4.3 0.6
Phylum Annelida
Polychaetes 66.7 51.3 48.8 21.1 45.8 67 66.7
Phylum Sipuncula
Sipunculan worm 0.5 4
Phylum Echiurida
Echiurids 1.3
Phylum Arthropoda
Pycnogonids 2.6 1.4
Cumaceans 3.3 2 4.5 1.1 1.4 1.9
Isopods 0.6 6.4
Amphipods 8.5 9.2 28.8 57.8 11.5 15.8 12.8
Tanaids 3.9 1.3 4.5 3.2 3.8
Brachyurans 1.3 2.7 1.4 1.9
Anomurans 0.6
Ostracods 2 4.9
Penaeids 1.9 1.3
Mysids 2.1
Decapod Larvae 0.5
Phylum Echinodermata
Ophiuroids 7.9 4.5 1.9

Table 4.4.18 : Marine fish landings (t) for Gujarat State, Jamnagar District and centres around Salaya
Year Gujarat State
Jamnagar District
Percentage of State landing
Salaya Vadinar Sikka Percentage of State landing
1985-86 306577 25238 - 4816 59 491 -
1986-87 315942 27998 - 3259 110 266 -
1987-88 327560 40232 - 2647 69 398 -
1988-89 414075 44161 - 1952 69 246 -
1989-90 432364 45354 - 2105 105 249 -
1990-91 500462 54299 - 3594 - 324 -
1991-92 530017 63452 - 2523 - 384 -
1992-93 609836 66202 - 2486 - 452 -
1993-94 619836 58887 - 3022 - 488 -
1994-95 645261 58912 - 2768 - 455 -
1995-96 598351 68088 - - - - -
1996-97 660068 76157 - - - - -
1997-98 702355 56043 - 1791 513 552 -
1998-99 551660 28592 - 3255 356 1558 0.94
1999-00 670951 71683 10.68 3541 343 992 0.73
2000-01 620474 72551 11.69 - - - -
2001-02 650829 83398 12.81 - - - -
2002-03 743638 102843 13.84 3720 579 1045 0.70
2003-04 609137 37957 6.23 2079 172 770 0.49
2004-05 584951 45934 7.85 2112 243 707 0.53
2005-06 663900 66500 10.0 2840 185 625 0.55
2006-07 - 70694 - 5892 807 463 -
2007-08 - 62512 - 7328 418 821 -
Source: Department of Fisheries, Government of Gujarat.

Table 4.4.19: Specieswise composition of Gujarat state and Jamnagar district during 2004-05.
Name of fish Total
production (t)
Specieswise percentage
(%)
Jamnagar District
Specieswise percentage
(%)
White pomfret 6515.2 1.11 1826.6 3.98
Black pomfret 1766.5 0.3 781.8 1.70
Bombay duck 84955.8 14.52 0 0.00
Thread fin 2285.3 0.39 1159.6 2.52
Jew fish 8236.4 1.41 2089.6 4.55
Hilsa 1906.4 0.33 14.7 0.03
Clupeids 10792.6 1.85 1551.3 3.38
Coilia 11654.1 1.99 147.2 0.32
Shark 10162.6 1.74 1041.9 2.27
Mullet 4434.7 0.76 918.4 2.00
Cat fish 25979.3 4.44 6809.1 14.82
Eel 3417.7 0.59 374.9 0.82
Leather jacket 2335.9 0.4 942.4 2.05
Seer fish 7388.2 1.26 2827.3 6.16
Indian salmon 1001.6 0.17 147.9 0.32
Ribbon fish 48134.8 8.23 2899.3 6.31
Silver bar 39963.2 0.68 724.6 1.58
Perch 11730.6 2.01 2371.6 5.16
Small sciaenids 154561.5 26.42 5471.5 11.91
Shrimp 48280.8 8.25 4766.4 10.38
Prawm (M) 5948.7 1.02 1450.3 3.16
Prawm (J) 839.1 0.14 284.4 0.62
Lobster 272.7 0.05 48.1 0.10
Crab 1657.2 0.28 358.8 0.78
Levta 1763.4 0.3 0 0.00
Cuttle/Squids 17504.5 2.99 3292.2 7.17
Miscellaneous 107462.5 18.37 3634.7 7.91
Total 584951.3 100 45934.8 100
Source: Department of Fisheries, Government of Gujarat.
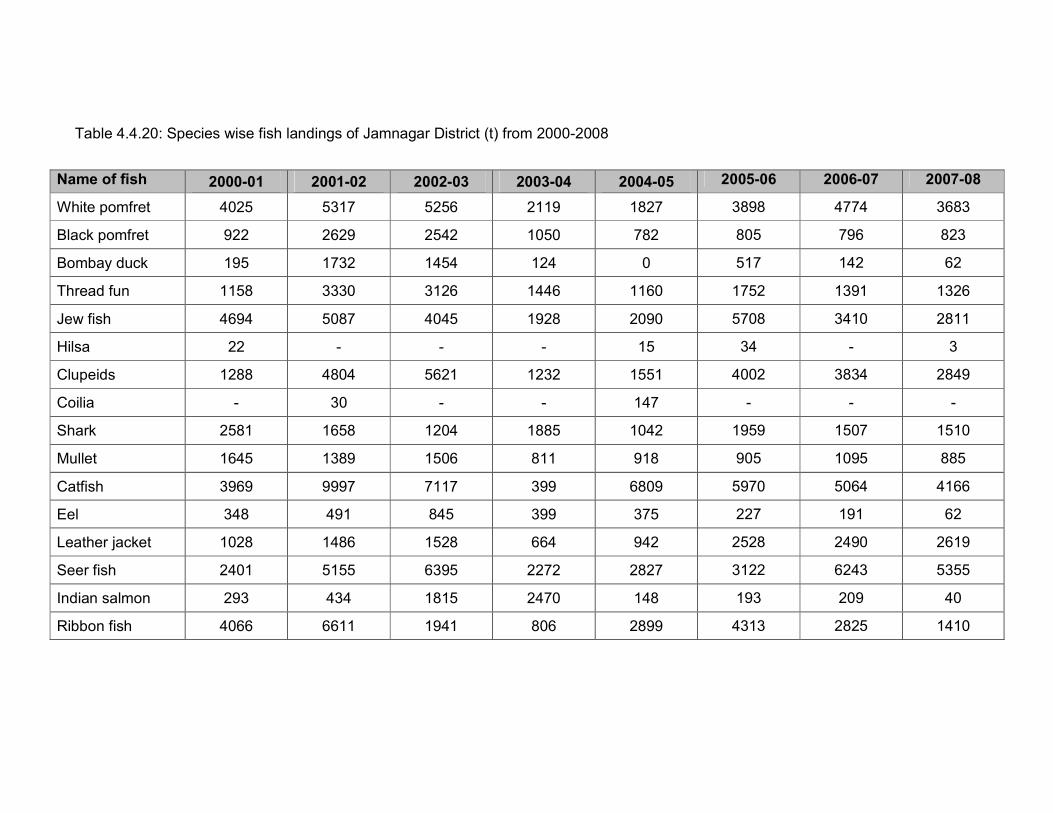
Table 4.4.20: Species wise fish landings of Jamnagar District (t) from 2000-2008
Name of fish 2000-01 2001-02 2002-03 2003-04 2004-05 2005-06 2006-07 2007-08
White pomfret 4025 5317 5256 2119 1827 3898 4774 3683
Black pomfret 922 2629 2542 1050 782 805 796 823
Bombay duck 195 1732 1454 124 0 517 142 62
Thread fun 1158 3330 3126 1446 1160 1752 1391 1326
Jew fish 4694 5087 4045 1928 2090 5708 3410 2811
Hilsa 22 - - - 15 34 - 3
Clupeids 1288 4804 5621 1232 1551 4002 3834 2849
Coilia - 30 - - 147 - - -
Shark 2581 1658 1204 1885 1042 1959 1507 1510
Mullet 1645 1389 1506 811 918 905 1095 885
Catfish 3969 9997 7117 399 6809 5970 5064 4166
Eel 348 491 845 399 375 227 191 62
Leather jacket 1028 1486 1528 664 942 2528 2490 2619
Seer fish 2401 5155 6395 2272 2827 3122 6243 5355
Indian salmon 293 434 1815 2470 148 193 209 40
Ribbon fish 4066 6611 1941 806 2899 4313 2825 1410

Table 4.4.20 (Contd 2)
Source: Department of Fisheries, Government of Gujarat
Name of fish 2000-01 2001-02 2002-03 2003-04 2004-05 2005-06 2006-07 2007-08
Silver bar 821 3100 2909 857 725 897 1100 1050
Perches 703 590 1153 1509 2372 2791 2347 2565
Small sciaenids 18695 10425 11188 3314 5472 9764 11484 9368
Shrimp 4680 1308 2078 2263 4766 3477 7186 8994
Prawns (m) 2118 441 838 1787 1450 1948 2649 3266
Prawns (j) 267 254 297 724 284 574 594 264
Lobster 49 77 69 36 48 211 118 92
Crab 286 259 780 312 359 229 360 282
Levta - - - - 0 2 - -
Cuttle/squids 3081 1130 1968 1147 3292 4050 5596 4420
Tuna - - - - - - 30 7
Carangids/Macarel - - - - - - 623 292
Ranifish - - - - - - 671 3
Sole - - - - - - 10 -
Miscellaneous 10606 15663 38805 5925 3635 5518 395 4308
Total 72551 83398 102846 37957 45935 66492 70695 62512

Table 4.4.21 : Results of experimental fishing conducted around Vadinar-Salaya during April 2007
Area
Tide Total catch (kg/h)
Total Species (no)
Common species
Fishes : Coilia dussumieri, Thryssa hamiltoni, Cynoglossus arel, Sillago sihama, Sparidentex hasta, Lethrinus nebulosus, Rogadius asper, Pallona ditchela, Pomadasys kaakan, Liza parsia, Johnius belangerii, Pseudorhombus javanicus, Drepane longimana, Secutor insidiator, Gobidae, Tetradontidae, Lepturacanthus savala, Arius sp.
Prawns: Metapeneaus affinis, Metapeneaus sp,Solenocera crassicornis Parapenaeopsis stylifera
Salaya Creek
Flood 15.0 F-18 P-4 O-4
Others : Neptunus pelagicus,Sepia,Loligo,Squilla
Fishes : Lepturacanthus savala, Arius sp, Drepane longimana Strongyluta stongyluta, Sillago sihama, Pomadasys kaakan, Johnius belangerii, Cynoglossus arel, Johnius sp, Thryssa sp, Coilia dussumieri, Pampus sp, Harpadon nehereus, Scomberomorus guttatus, Arius jella, Polynemus tetraductylus
Prawns: Metapenaeus sp, Parapenaeopsis stylifera, Metapenaeus monoceros,Penaeus merguiensis.
Salaya Creek
Ebb 8.0 F-12 P-4 O-3
Others : Loligo, Squilla, Sepia.
Fishes : Johnius glacus, Thryssa hamiltoni, Sillago sihama, Liza parsia, Johnius belangerii, Lepturacanthus savata, Rogadius asper, Liza parsia, Sparidentex hasta, Nematolosa nasus, Liognathus bindus, Arius sp, Gobidae.
Prawns: Parapenaeopsis stylifera, Metapenaeus affinis, Parapenaeopsis sp.
Pathfinder Creek
Flood 11.5 F-13 P-3 O-4
Others : Scylla servata, Neptunus pelagicus, Sepia, Squilla.
Fishes : Thryssa hamiltoni, Lepturacanthus savala, Arius sp, Cynoglossus arel, Sillago sihama,Nematolosa nasus, Mugil sp, Johnius sp, Arius jella, Polynemus sp.
Prawns: Exhoppolysmata ensirostris,Polenocera crassicornis.
Pathfinder Creek
Ebb 7.0 F-10 P-2 O-3
Others : Neptunus pelagicus, Sepia, Squilla.

Table 4.4.21 (Contd. 2)
Area
Tide Total catch (kg/h)
Total Species (no)
Common species
Fishes : Coilia dussumieri,Harpadon nenereas, Thryssa dussumierii, Cynoglossus arel, Arius jella, Polynemus tetradactylus, Johnius carutta, Rastrelliger faughni, Sillago sihama, ,Arius sp, Pampus argenteus, Chirocentrus dorab, Otoliths sp, Scoliodon laticaudus, Caranx sp, Thryssa mystax, Trichiurus lepturus.
Prawns: Metapeneaus brevicornis, Metapeneaus sp, Parapenaeopsis sp, Solenocera sp
Gulf Flood 18.0 F-20 P-4 O-4
Others : Charybdis cruciata, Charybdis annulata, Squilla, Sepia.
Fishes : Thryssa dussumieri, Pampus argenteus, Polynemus tetradactylus, Otolithes cuveri, Otolithes sp, Thryssa mystax, Arius sp, Pampus chinensis, Johnius glacus, Sillago sihama, Johnius sp, Gobius sp, Terapon theraps, Lepturacanthus savala, Lutijanus johnii, Coilia dussumieri.
Prawns: Parapenaeopsis stylifera, Metapenaeus sp, Solenocera sp.
Gulf Ebb 17.0 F-16 P-3 O-4
Others : Cherybdis cruciata, Charybdis annulata, Squilla, Sepia.

Table 4.4.22 : Results of experimental trawling conducted by NIO off Vadinar-Salaya - Sikka during 1993-2007
Catch rate (kg/h) Species (no) Area Period
Operations (no) Range Av Range Av
Postmonsoon (1993)
7 09-35.2 11.0 8-19 13
Premonsoon (1994)
5 1.1-5.8 2.7 5-20 9
Postmonsoon (1996)
4 3.2-54.2 20.1 13-24 19
Premonsoon (1997)
2 1.4-12.2 6.8 5-20 13
Sikka
Postmonsoon (2000)
1 47 47 24 24
Premonsoon (1994)
7 2.4-72.9 20.4 4-22 15
Postmonsoon (1994)
4 34.2-115.6
71.6 17-34 25
Postmonsoon (2000)
1 32 32 26 26
Premonsoon (2004)
5 5.5-13.5 87 15-28 22
Premonsoon (2005)
6 4.5-17.5 10.3 15-31 22
Vadinar/salaya
Premonsoon (2007)
6 7.0-18.0 12.8 15-28 22

Table 4.4.23: Distribution of corals in the Gulf of Kachchh*.
Species 1 2 3 4 5 6 7 8 9 10 11 12 13 14 15
Esammocora digitata - - - - - - - + - - - - - - - Acropora humilis (Dead) - - + + - - + + - - - - - - -
A.squamosa (Dead) - - - + - - - - - - - - - - -
Montipora explanata + - + + - + + - + + + + + + +
M.venosa - - - + - - + - - - - - - - -
M.turgescons - - - - - - + - - - - - - - -
M.hispida + + - + + - + + + + + - - - +
M.foliosa - - - + - - + - - - - - - - -
M.monasteriata - - - + - - + - - - - - - - -
Coscinaraea monile + + + + + + + + + - - - - - +
Siderastrea savignyana + - - - - - - - - - - - - - -
Pseudosiderastrea tayami + - - - - - + + + + + + + + +
Goniopora planulata + + - - + + + - + + - + - - +
G.minor - - - + - - + - - - - - - - +
G.nigra + + - + + + + - - + - - - - +
Porites leutea + + + + - - + - - - - + - - +
P.lichen + - - - - - + - + - - + - + +
P.compressa + + - - - - - - - - - - - - +
Favia speciosa - - - - - - - - - - - - - - +
F.favus + + + + + + + + + + + + + + +
Favites complanata + + + + + + + - - + - - - + +
F.melicerum + - + - - - - - + - - - - + +
Goniastrea pectinata + + + + + + + - + + + - + + +
Platygyra sinensis + + + + - - - - - + - - - + +
Hydnophora exesa + + + + - - - - - + - - + - +
Plesiastrea versipora - + - - - - + - - - - - - - -
Leptastrea purpurea - - - - - - - - - - - Sikka Point
Cyphastrea serailia + + + + + + + + + + - - + + +
Symphyllia radian - + - + - + - - + - - - - - -
Acanthastrea simplex + + + + - - - - + + - - - - +
Mycedium elephantotus - - - + - - - - - - - - - - -
Paracyathus stokesi + - - - - - - - - - - - - - -
Polycyathus verrilli + - + - - - + - - - - - - - -
Tubastraea aurea + + + + + - - - + + - - - - -
Dendrophyllia minuscule* + - - - - - - - - - - - - - -
Turbinaria crater + + - + - - + - - - - - - - +
T.peltata - + + + + + + - - + - - + + +
*1 - Okha; 2 - Dholio Gugar; 3 - Dona; 4 - Boria; 5 - Mangunda; 6 - Savaj; 7 - Paga;
8 - Manmarudi Langamarudi; 9 - Ajad; 10 - Bural; 11 - Dhani; 12 - Kalumbhar; 13 -
Narara; 14 - Goose; 15 - Pirotan

Table 4.4.24: Species of corals at Vadinar-Salaya region based on available information for the period 1988 – 2008
No Coral species
Stony corals
1 Favia speciosa
2 F. favus
3 Porites leutea
4 P. compressa
5 P. lichen
6 Goniastrea pectinata
7 Fevites complanata
8 Favites melicerun
9 Pseudosiderastrea tayani
10 Cyphastrea serailia
11 Goniopora nigra
12 G. planulata
13 G. minor
14 Platygyra sinersis
15 Montipora explanata
16 Plesiastrea versipora
17 Symphyllia radians
18 Turbinaria peltala
19 Siderastrea savignyana
20 Tubastrea aurea
21 Turbinaria crater
22 Paracyathus sp
23 Montipora monasteriata
24 Polycyathus verrilli
25 Hydnophora exesa
Soft corals
26 Dendronephthya dendrophyta
27 D. brevirama
28 Astromuricea stellifera

Table 4.4.25 : List of water-birds in the Gulf area.
Status in habitat* English name Scientific name
Salt pans Gulf
Podicipedidae Great Crested Grebe Podiceps cristatus LM -
Blacknecked Grebe Podiceps nigricollis M -
Pelecanidae
White Pelican Pelecanus onocrotalus LM LM
Dalmatian Pelican Pelecanus crispus M M
Phalacrocoracidae
Cormorant Phalacrocorax carbo LM LM
Indian Shag Phalacrocorax fuscicolli LM LM
Little Cormorant Phalacrocorax niger LM R
Darter Anhinga rufa LM R
Ardeidae
Grey Heron Ardea cinerea LM R
Purple Heron Ardea purpurea LM -
Little Green Heron Ardeola striatus LM R
Pond Heron Ardeola grayii LM R
Cattle Egret Bubulcus ibis - LM
Large Egret Ardea alba LM R
Smaller Egret Egretta intermedia LM -
Little Egret Egretta garzetta LM -
Indian Reef Heron Egretta gularis LM R
Night Heron Nycticorax mycticorax LM R
Ciconiidae
Painted Stork Mycteria leucocephala LM R
Blacknecked Stork Ephippiorhynchus asiaficus LM LM
Threskiornithidae
White Ibis Threskiornis aethiopica LM R
Black Ibis Pseudibis papillasa - R
Spoonbill Platalea leucorodia LM R
Phoenicopteridae
Flamingo Phoenicopterus roseus LM LM
Lesser Flamingo Phoeniconatas minor LM R
Anatidae
Ruddy Shel duck Tadorna ferruginea - M
Pintail Anas acuta M M
Common Teal Anas crecca M -
Spotbill Duck Anas poecilorhyncha LM LM
Shoveller Anas clypeata M -
Accipitridae
Brahminy Kite Haliastur indus LM R
Marsh Harrier Circus aeruginosus M M
Osprey Pandian haliaetus M M

Status in habitat* English name Scientific name
Salt pans Gulf
Gruidae
Common Crane Grus grus M M
Demoiselle Crane Anthropoides virgo M M
Rallidae
Coot Fulica atra LM LM
Jacanidae
Pheasant - tailed Jacana Hydrophasianus chirurgus LM -
Haematopodidae
Oystercatcher Haematopus stralegus M M
Charadriidae
Redwattled Lapwing Vanellus indicus R R
Grey Plover Pluvialis sugotarola M M
Eastern Golden Plover Pluvialis dominica - M
Large Sand Plover Charadrius leschenaultii M M Ringed Plover Charadrius hiaticula R -
Kentish plover Charadrius alexandrinus R R
Lesser Sand Plover Charadrius mongolus M M
Whimbrel Numenius phaeopus M M
Curlew Numenius arquata M M
Blacktailed Godwit Limosa limosa M -
Bartailed Godwit Limosa lapponica M M
Spotted Redshank Tringa erythropus M M
Common Redshank Tringa totanus M M
Marsh Sandpiper Tringa stagnatilis M M
Greenshank Tringa nebularia M M
Green Sandpiper Tringa ochropus M M
Wood Sandpiper Tringa glareola M -
Terek Sandpiper Tringa terek M M
Common Sandpiper Tringa hypoleucos M M
Turnstone Arenaria interpres M M
Knot Calidris carutus - M
Eastern Knot Calidris tenuirostris - V
Sanderling Calidris alba - M
Eastern Little Stint Calidris ruficollis - V
Little Stint Calidris minuta M M
Dunlin Calidris alpina M M
Curlew-Sandpiper Calidris testacea M M
Broadbilled Sandiper Limicola falcinellus M M
Ruff and Reeve Philomachus pugnax M M
Rednecked Phalarope Phalaropus lobatus M M
Recurvirostidae
Blackwinged Stilt Himantopus himantopus R -
Avocet Recurvirostra avosetta LM -
Dromadidae
Crab Plover Dromas ardeola M M
Burhinidae

Status in habitat* English name Scientific name
Salt pans Gulf
Great Stone Plover Esacus magnirostris LM R
Laridae
Herring Gull Larus argentatus M M
Lesser Blackbacked
Gull Larus fuscus M M
Blackheaded Larus ichthyaetus M M
Brownheaded Gull Larus brunnicephalus M M
Blackheaded Gull Larus ridibunds M M
Slenderbilled Gull Larus genei M M
Whiskered Tern Chiildonias hybrida M M
Whitewinged Black Chiildonias leucopterus M M
Tern
Gullbilled Tern Gelochelidon nilotica M M
Caspian Tern Hdroprogne caspia LM LM Common Tern Sterna hirunda M M Whitecheeked Tern Sterna repressa M M Brownwinged Tern Sterna anaethetus M M Little Tern Sterna albitrons M M Saunders Little Tern Sterna saundersi LM R Large Crested Tern Sterna bergii M M Indian Lesser Crested Tern Sterna bengalenis M M Sandwich Tern Sterna sandvicensis M M Indian skimmer Rynchops albicollis LM LM
Alcedinidae
Common Kingfisher Alcedo atthis LM LM
Whitebreast Halcyon smyrnensisq LM LM
Blackcapped kingfisher Halcyon pileata M M R - Resident; LM - Local Migrant; M – Migrant; V - Not normally found in the area (one to few records only).

Table 4.5.1 : Sediment quality off Vadinar-Salaya during 1994-2006
Station Code Al (%)
Cr (µg/g)
Mn (µg/g)
Fe (%)
Co (µg/g)
Ni (µg/g)
Cu (µg/g)
Zn (µg/g)
Cd (µg/g)
Hg (µg/g)
Pb (µg/g)
Corg (µg/g)
P (µg/g)
PHc (µg/g)
1994 (Premonsoon)
Salaya Creek 4.2 58 586 3.0 40 31 32 54 - - 1.0 - 389 0.2
Pathfinder Inlet 7.2 66 617 4.3 40 46 41 83 - - 8 - 709 1.1
Gulf off Vadinar 9.6 58 588 3.7 35 47 34 44 - - 7.0 - 500 0.3
1994 (Postmonsoon)
Salaya Creek 6.2 63 864 3.2 39 39 62 134 - - 6.0 - 795 0.9
Pathfinder Inlet 7.5 50 772 3.3 34 49 52 118 - - 10 - 815 0.5
Gulf off Vadinar - - - - - - - - - - - - - -
2000 (Postmonsoon)
Salaya Creek - - - - - - - - - - - - - -
Pathfinder Inlet 9.7 119 677 4.6 47 55 40 91 - 0.06 - 1.1 808 0.9
Gulf off Vadinar 3.9 55 520 2.9 42 30 26 40 - 0.06 - 0.5 729 1.4
2004 (Postmonsoon)
Salaya Creek - - - - - - - - - - - - - -
Pathfinder Inlet 10.3 118 498 5.0 22 64 53 152 0.50 0.19 30.5 0.8 688 -
Gulf off Vadinar 7.5 118 688 4.8 23 61 59 154 0.26 0.05 62.4 0.2 985 -
2005 (Premonsoon)
Salaya Creek - - - - - - - - - - - - - -
Pathfinder Inlet 6.8 99 693 4.8 34 77 44 64 - 0.06 - - 1188 0.3
Gulf off Vadinar 5.1 128 816 4.7 34 68 41 485 - ND - - 1143 0.3
2006 (Premonsoon)
Salaya Creek 7.3 123 731 5.3 118 12 51 100 - 0.04 - - 771 -
Pathfinder Inlet 7.8 119 755 5.8 125 96 66 125 - 0.04 - 1.3 745 0.2
Gulf off Vadinar 5.0 105 741 4.7 113 68 41 113 - 0.03 - 0.6 795 0.2
2006 (Postmonsoon)
Salaya Creek 7.8 99 767 6.7 40 82 56 32 - 0.01 - 0.6 567 -
Pathfinder Inlet 7.6 88 800 6.4 35 74 49 44 -- 0.03 - 1.0 306 -
Gulf off Vadinar 6.5 95 1359 6.9 37 75 48 36 - 0.01 - 0.4 562 -

Table 5.3.1: Water quality of surface water (SW), ground water (GW) and dug wells (DW) at Vadinar-Salaya
Parameter Unit Sinhan (SW)
Singhach (GW)
Vadinar (GW)
Bharana (GW)
Zankhar (DW)
pH 7.5 7.8 8.5 8.4 8.4
Temp. oC 25 22 25 30 30
Turbidity NTU 13 3 4 2 1
SS mg/l 41 2 2 1 1
TDS mg/l 341 1700 2060 860 480
Total alkalinity mg/l 179 268 291 185 242
Total hardness mg/l 171 779 910 476 239
Ca hardness mg/l 83 536 640 263 156
Chloride mg/l 89 530 654 343 109
Sulphate mg/l 23 105 131 45 27
Sodium mg/l 73 276 364 133 96
Potassium mg/l 3 2 3 4 2
Nitrate as N mg/l 21 70 98 14 7
P (Total) mg/l 0.11 0.08 0.08 0.1 0.1
DO mg/l 8 3.8 4.1 6.6 5.2
COD mg/l 13 8 15 9 4
BOD mg/l <5 <3 <3 <3 <3
PHc µg/l ND ND ND ND ND
Ni mg/l ND ND ND ND ND
Cd mg/l ND ND ND ND ND
Cr mg/l 0.02 0.01 ND ND ND
Cu mg/l ND ND ND ND ND
Pb mg/l ND ND ND ND ND
Fe mg/l 0.11 ND 1.05 0.65 ND
Mn mg/l ND ND ND ND ND
Zn mg/l ND ND 0.54 0.43 ND
Co mg/l ND ND ND ND ND
Total Coliform CFU/ 100ml
180 180 ND ND 275
Faecal Coliform CFU/ 100ml
20 27 ND ND 36

Figure 1.1.1: Essar’s establishments at Vadinar along southern Gulf of Kachchh

Figure 1.1.2: Existing marine facilities of VOTL at Vadinar and proposed expansion

Figure 1.2.1: Locations of sampling conducted in 2007 and 2008 off Vadinar- Salaya
22o
30’N
69o
30’E
F
G
H
A
B
D
E
C
III I
II
69o
40’E
22o
24’N


Figure : 4.4.1 Satellite-based mangrove zonation map of Vadinar-Salaya region
Salaya
Creek
Pathfinder
Inlet
Project site

Figure 5.2.1: Sampling locations for air quality and water quality

Figure 7.5.1: Typical trajectory of HSD spill (100 t) in January at Berths C and D
A- C&D Berths
B- Essar SPM 1
C- IOC SPM 1
D- IOC SPM 2
E- Essar SPM 2
(Proposed)

Figure 7.5.2: Typical trajectory of crude oil spill (500 t) in January at SBM
A- C&D Berths
B- Essar SPM 1
C- IOC SPM 1
D- IOC SPM 2
E- Essar SPM 2
(Proposed)

Figure 7.5.3: Typical trajectory of crude oil spill (25000 t) in January in Navigation Channel
A- C&D Berths
B- Essar SPM 1
C- IOC SPM 1
D- IOC SPM 2
E- Essar SPM 2
(Proposed)

Figure 7.5.4: Typical trajectory of HSD spill (100 t) in July at Berths C and D
A- C&D Berths
B- Essar SPM 1
C- IOC SPM 1
D- IOC SPM 2
E- Essar SPM 2
(Proposed)

Figure 7.5.5: Typical trajectory of crude oil spill (500 t) in July at SPM-2
A- C&D Berths
B- Essar SPM 1
C- IOC SPM 1
D- IOC SPM 2
E- Essar SPM 2
(Proposed)