eia for development /exploratory wells, group gathering station...
TRANSCRIPT
EIA for Development /Exploratory Wells, Group Gathering Station and pipeline laying from KSAC to Borholla GGS at Kasomarigaon, Assam
Risk Assessment Report
Prepared for:
ONGC
Prepared by:
SENES Consultants India Pvt. Ltd.
November, 2014
EIA for exploratory/ development activities of hydrocarbon, GGS & pipeline laying at Kasomarigaon
SENES/K-20198/ November, 2014 a ONGC
Table of Contents 1 Risk Assessment ..........................................................................................................4 1.1 Quantitative Risk Assessment (QRA) .........................................................................4 1.1.1 Objective of the QRA Study ........................................................................................4 1.1.2 Risk Assessment Methodology....................................................................................5 1.1.3 Risk Assessment of Identified Project Hazards .........................................................11 1.1.4 Blow Outs/Loss of Well Control ...............................................................................11 1.1.5 Pipeline Failure Incidents & Causes ..........................................................................28 1.2 Disaster Management Plan ........................................................................................43 1.2.1 Objective ....................................................................................................................43 1.2.2 Purpose ......................................................................................................................43 1.2.3 Emergency Classification ..........................................................................................43 1.2.4 Level 1 - Emergency ..................................................................................................44 1.2.5 Level 2 - Emergency ..................................................................................................44 1.2.6 Level 3 - Emergency ..................................................................................................45 1.3 ONGC Disaster Management Plan ............................................................................46
EIA for exploratory/ development activities of hydrocarbon, GGS & pipeline laying at Kasomarigaon
SENES/K-20198/ November, 2014 b ONGC
List of Tables
Table 1-1: Frequency Categories And Criteria ..........................................................................8
Table 1-2: Severity Categories and Criteria ...............................................................................9
Table 1-3: Risk Matrix .............................................................................................................10
Table 5-4: Risk Criteria and Action Requirements..................................................................10
Table 1-5: Blow Out Cause Distribution for Failures during Drilling Operations ..................13
Table 1-6: Pool Fire Modeling Scenarios ................................................................................16
Table 1-7: Pool Fire Diameter & Steady State Burning Area .................................................17
Table 5-8: Distance to Thermal Radiation Threshold Levels ..................................................21
Table 1-9: Natural Gas Release Modeling Scenarios ..............................................................22
Table 1-10: Zone of Flammable Vapour Cloud – Natural Gas Release Scenarios .................26
Table 1-11: Pool Diameter for Oil Spill Risk Scenarios..........................................................27
Table 1-12: Primary Gas Pipeline Failure Frequency ..............................................................31
Table 1-13: Gas Transportation Pipeline Failure Frequency & Class .....................................35
Table 1-14: Ignition Probability – Gas Transportation Pipeline Failure .................................37
Table 1-15: Hypothetical Failure Cases –Pipeline Transportation Risk Modeling .................38
Table 1-16: Threat Zone Distance for Project Pipeline Failure Hypothetical Scenarios .........42
Table 1-17: Emergency Response Levels ...............................................................................45
Table 1-18: ONGC On-Site Disaster Management Team Profile ..........................................47
List of Figures
Figure 1-1: Risk Assessment Methodology ...............................................................................6
Figure 1-2: Blow Out Frequencies in Oil & Gas Industry .......................................................14
Figure 1-3: Ignition Probability Vs Release Rate ....................................................................15
Figure 1-4: KSAD Well Site - Pool Fire Risk Contour Map ...................................................18
Figure 1-5: KSAE Well Site - Pool Fire Risk Contour Map ...................................................19
Figure 1-6: KSAC, KSDB & KSDA Well Cluster - Pool Fire Risk Contour Map .................20
Figure 1-7: KSAD Well Site – Risk Contour Map for Natural Gas Release ...........................23
Figure 1-8: KSAE Well Site – Risk Contour Map for Natural Gas Release ...........................24
Figure 1-9: KSAC, KSDB & KSDA Well Cluster – Risk Contour Map for Natural Gas Release .......................................................................................................................25
Figure 1-10: Gas Pipeline Failure Incidents (1970-2010) .......................................................29
Figure 1-11: Evolution of Primary Failure Frequencies .........................................................32
Figure 1-12: Gas Pipeline Failure – Distribution of Incident & Causes .................................33

EIA for exploratory/ development activities of hydrocarbon, GGS & pipeline laying at Kasomarigaon
SENES/K-20198/ November, 2014 c ONGC
Figure 1-13: Gas Pipeline Primary Failure Frequencies per Cause .........................................34
Figure 1-14: External Failure Frequency – Relation with Damage Type & Diameter Class ..36
Figure 1-15: Threat Zone Plot – 8” Pipeline leak of size 1”dia ...............................................39
Figure 1-16: Threat Zone Plot – 11.7” Pipeline leak of size 2”dia ..........................................40
Figure 1-17: Threat Zone Plot – 8” Pipeline Rupture of size 8”dia.........................................41
Figure 1-18: Emergency Classification “Decision Tree” ........................................................44
EIA for exploratory/ development activities of hydrocarbon, GGS & pipeline laying at Kasomarigaon
SENES/K-20198/ November, 2014 4 ONGC
QRA as a part of integrated risk management process for the proposed project consists of the following iterative steps:
• Identification of hazards • Setting Acceptance Standards for the defined risks • Evaluation of likelihood and consequences and risks of possible events. • Confirmation of arrangements to mitigate the events and respond to the same on occurrence. • Establishment of performance standards • Establishment of continuous monitoring, review and auditing of arrangements
1 Risk Assessment
1.1 QUANTITATIVE RISK ASSESSMENT (QRA)
This section on Quantitative Risk Assessment (QRA) aims to provide a systematic analysis of the major risks that may arise as a result of onshore exploratory development drilling activities by ONGC in Kasomarigaon Block. The QRA process outlines rational evaluations of the identified risks based on their significance and provides the outline for appropriate preventive and risk mitigation measures. Results of the QRA provides valuable inputs into the overall project planning and the decision making process for effectively addressing the identified risks. This will ensure that the project risks stay below As Low As Reasonably Practicable (ALARP) levels at all times during project implementation. In addition, the QRA will also help in assessing risks arising from potential emergency situations like a blow out and develop a structured Emergency Response Plan (ERP) to restrict damage to personnel, infrastructure and the environment.
BOX 1.1: QRA – INTEGRATED RISK MANAGEMENT PROCESS
The risk study for the onshore exploration and development activities has considered all aspects of operation of the drilling rig and other associated activities during the exploratory phase. Oil spills, loss of well control / blow-out and process leaks constitute the major potential hazards that may be associated with the proposed onshore exploratory and development drilling of hydrocarbons in Kasomarigaon Block.
The following section describes objectives, methodology of the risk assessment study and then presents the assessment for each of the potential risk separately. This includes identification of major hazards, hazard screening and ranking, frequency and consequence analysis for major hazards. The hazards have subsequently been quantitatively evaluated through a criteria based risk evaluation matrix. Risk mitigation measures to reduce significant risks to acceptable levels have also been recommended as a part of the risk assessment study.
1.1.1 Objective of the QRA Study
The overall objective of this QRA with respect to the proposed project involves identification and evaluation of major risks, prioritizing risks identified based on their hazard consequences and formulating suitable risk reduction/mitigation measures in line with the ALARP
EIA for exploratory/ development activities of hydrocarbon, GGS & pipeline laying at Kasomarigaon
SENES/K-20198/ November, 2014 5 ONGC
principle. Hence in order to ensure effective management of any emergency situations (with potential individual and societal risks) that may arise during the exploratory and development drilling activities, following specific objectives need to be achieved.
• Identify potential risk scenarios that may arise out of proposed drilling and other associated activities like operation of ancillary facilities and equipment’s, mud chemicals storage and handling etc.
• Analyze the possible likelihood and frequency of such risk scenarios by reviewing historical accident related data for onshore & offshore oil and gas industries.
• Predict the consequences of such potential risk scenarios and if consequences are high, establish the same by through application of quantitative simulations.
• Recommend feasible preventive and risk mitigation measures as well as provide inputs for drawing up of Emergency Management Plan (EMP) for the project.
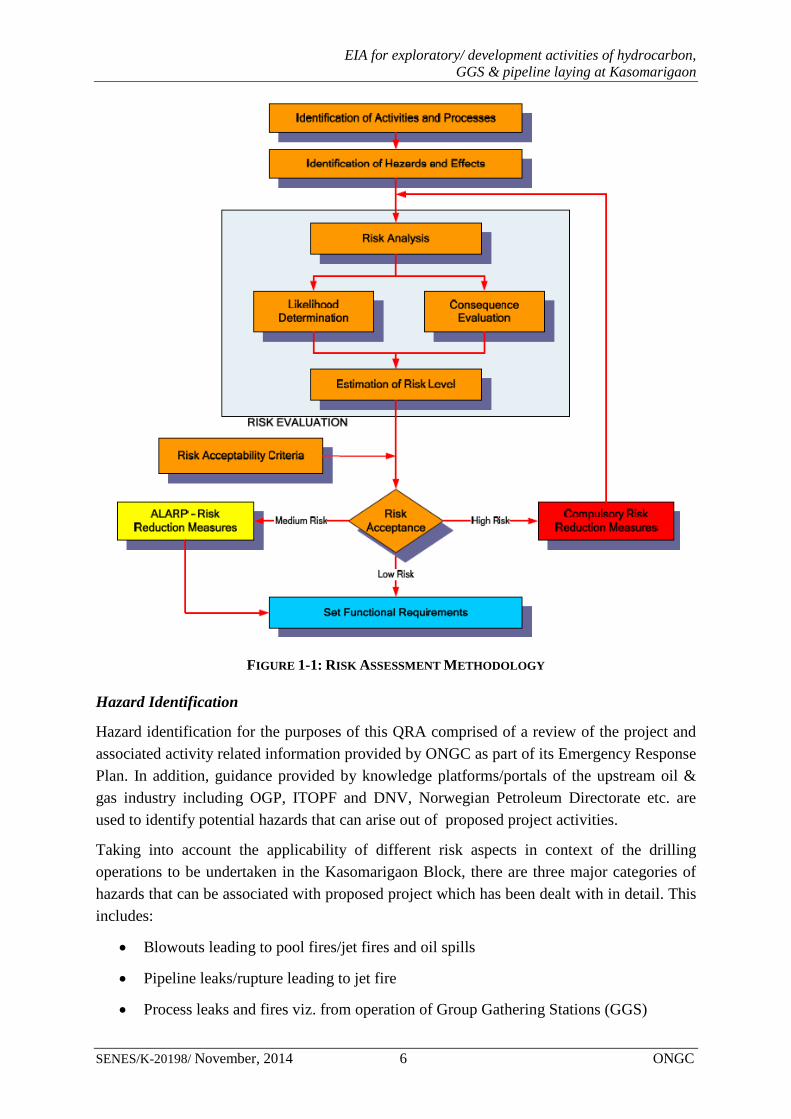
1.1.2 Risk Assessment Methodology
The risk assessment process is primarily based on likelihood of occurrence of the risks identified and their possible hazard consequences particularly being evaluated through hypothetical accident scenarios. With respect to the proposed project, major risks viz. blow outs, process leaks and fires, non-process fires etc. have been assessed and evaluated through a risk matrix generated to combine the risk severity and likelihood factor. Risk associated with the exploratory drilling activities have been determined semi- quantitatively as the product of likelihood/probability and severity/consequence by using order of magnitude data (risk ranking = severity/consequence factor X likelihood/probability factor). Significance of such project related risks was then established through their classification as high, medium, low, very low depending upon risk ranking.
The risk matrix is a widely accepted as standardized method of quantitative risk assessment and is preferred over purely quantitative methods, given that its inherent limitations to define a risk event is certain. Application of this tool has resulted in the prioritization of the potential risks events for the exploratory drilling operations thus providing the basis for drawing up risk mitigation measures and leading to formulation of plans for risk and emergency management. The overall approach is summarized in the Figure 1.1
EIA for exploratory/ development activities of hydrocarbon, GGS & pipeline laying at Kasomarigaon
SENES/K-20198/ November, 2014 6 ONGC
FIGURE 1-1: RISK ASSESSMENT METHODOLOGY
Hazard Identification
Hazard identification for the purposes of this QRA comprised of a review of the project and associated activity related information provided by ONGC as part of its Emergency Response Plan. In addition, guidance provided by knowledge platforms/portals of the upstream oil & gas industry including OGP, ITOPF and DNV, Norwegian Petroleum Directorate etc. are used to identify potential hazards that can arise out of proposed project activities.
Taking into account the applicability of different risk aspects in context of the drilling operations to be undertaken in the Kasomarigaon Block, there are three major categories of hazards that can be associated with proposed project which has been dealt with in detail. This includes:
• Blowouts leading to pool fires/jet fires and oil spills
• Pipeline leaks/rupture leading to jet fire
• Process leaks and fires viz. from operation of Group Gathering Stations (GGS)
EIA for exploratory/ development activities of hydrocarbon, GGS & pipeline laying at Kasomarigaon
SENES/K-20198/ November, 2014 7 ONGC
• Non-process fires / explosions
Well control incident covers a range of events which have the potential of leading to blow-outs but are generally controlled by necessary technological interventions. Hence, such incidents are considered of minor consequences and as a result not well documented. Other possible hazard scenarios like mud chemical spills, falls, etc. has also not been considered for detailed assessment as preliminary evaluation has indicated that the overall risk that may arise out of them would be low. In addition, it is understood that, causative factors and mitigation measures for such events can be adequately taken care of through exiting safety management procedures and practices of ONGC.
It must also be noted here that many hazards identified are sometimes interrelated with one hazard often having the ability to trigger off another hazard through a domino effect. For example, a large oil spill in most instances is caused by another hazardous incident like a blowout or process leak. This aspect has been considered while drawing up hazard mitigation measures and such linkages (between hazards) has also been given due importance for managing hazards and associated risks in a composite manner through ONGC’s Health, Safety & Environmental Management System (HSEMS) and through the Emergency Management Plan, if a contingency situation so arises.
Frequency Analysis
Frequency analysis involves estimating the likelihood of each of the failure cases identified during the hazard identification stage. The analysis of frequencies of occurrences for the key hazards that has been listed out is important to assess the likelihood of such hazards to actually unfold during the lifecycle of the project. The frequency analysis approach for the proposed project is based primarily on historical accident frequency data, event tree analysis and judgmental evaluation. Major oil and gas industry information sources viz. statistical data, historical records and global industry experience were considered during the frequency analysis of the major identified risks1.
For QRA for the proposed project, various accident statistics and published oil industry databases have been consulted for arriving at probable frequencies of identified hazards. However, taking into account the absence of representative historical data/statistics with respect to onshore operations2 relevant offshore accident databases have been considered in the frequency analysis of identified hazards. The same has been recommended in the “Risk Assessment Data Directory” published by the International Association of Oil & Gas Producers (OGP). Key databases/reports referred as part of the QRA study includes
1 It is to be noted that the frequency of occurrences are usually obtained by a combination of component probabilities derived on basis of reliability data and /or statistical analysis of historical data. 2 Although Alberta Energy & Utilities Board (EUB) maintains a database for onshore incidents for the period 1975-1990 the same has not been considered in the context of the present study as the Alberta wells are believed to be sour with precaution being taken accordingly to minimize the likelihood of release.
EIA for exploratory/ development activities of hydrocarbon, GGS & pipeline laying at Kasomarigaon
SENES/K-20198/ November, 2014 8 ONGC
Worldwide Offshore Accident Databank (WOAD), Outer Continental Shelf (OCS) Reports, Norwegian Petroleum Directorate Directives, Offshore Reliability Data (OREDA) Handbook, HSE Offshore Incident Database, SINTEF Offshore Blowout Database, European Gas Incident Group (EGIG) database etc.
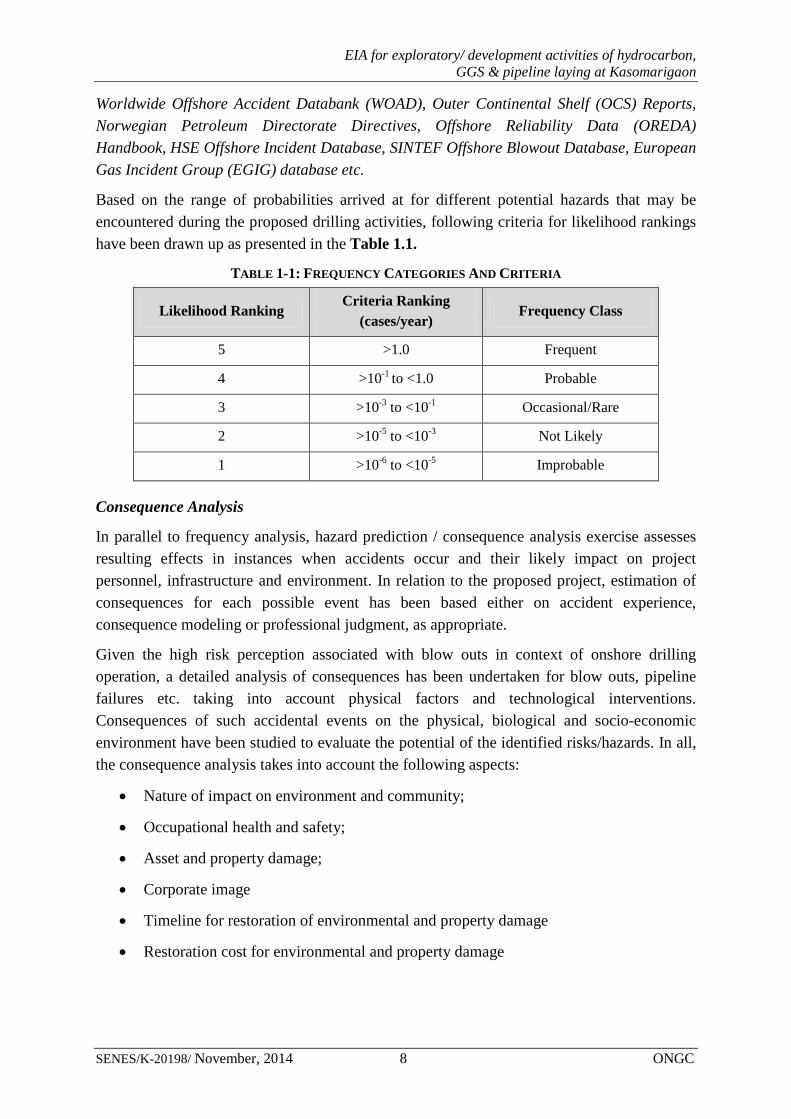
Based on the range of probabilities arrived at for different potential hazards that may be encountered during the proposed drilling activities, following criteria for likelihood rankings have been drawn up as presented in the Table 1.1.
TABLE 1-1: FREQUENCY CATEGORIES AND CRITERIA
Likelihood Ranking Criteria Ranking
(cases/year) Frequency Class
5 >1.0 Frequent
4 >10-1 to <1.0 Probable
3 >10-3 to <10-1 Occasional/Rare
2 >10-5 to <10-3 Not Likely
1 >10-6 to <10-5 Improbable
Consequence Analysis
In parallel to frequency analysis, hazard prediction / consequence analysis exercise assesses resulting effects in instances when accidents occur and their likely impact on project personnel, infrastructure and environment. In relation to the proposed project, estimation of consequences for each possible event has been based either on accident experience, consequence modeling or professional judgment, as appropriate.
Given the high risk perception associated with blow outs in context of onshore drilling operation, a detailed analysis of consequences has been undertaken for blow outs, pipeline failures etc. taking into account physical factors and technological interventions. Consequences of such accidental events on the physical, biological and socio-economic environment have been studied to evaluate the potential of the identified risks/hazards. In all, the consequence analysis takes into account the following aspects:
• Nature of impact on environment and community;
• Occupational health and safety;
• Asset and property damage;
• Corporate image
• Timeline for restoration of environmental and property damage
• Restoration cost for environmental and property damage
EIA for exploratory/ development activities of hydrocarbon, GGS & pipeline laying at Kasomarigaon
SENES/K-20198/ November, 2014 9 ONGC
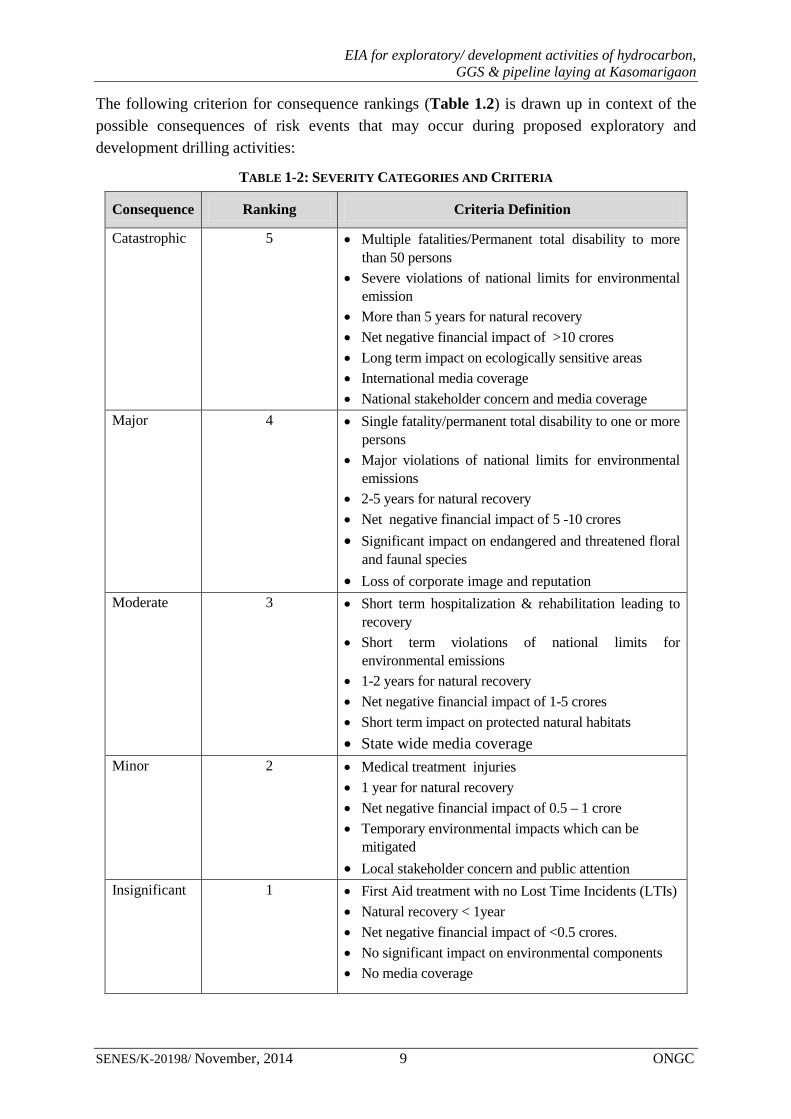
The following criterion for consequence rankings (Table 1.2) is drawn up in context of the possible consequences of risk events that may occur during proposed exploratory and development drilling activities:
TABLE 1-2: SEVERITY CATEGORIES AND CRITERIA
Consequence Ranking Criteria Definition
Catastrophic 5 • Multiple fatalities/Permanent total disability to more than 50 persons
• Severe violations of national limits for environmental emission
• More than 5 years for natural recovery • Net negative financial impact of >10 crores • Long term impact on ecologically sensitive areas • International media coverage • National stakeholder concern and media coverage
Major 4 • Single fatality/permanent total disability to one or more persons
• Major violations of national limits for environmental emissions
• 2-5 years for natural recovery • Net negative financial impact of 5 -10 crores • Significant impact on endangered and threatened floral
and faunal species • Loss of corporate image and reputation
Moderate 3 • Short term hospitalization & rehabilitation leading to recovery
• Short term violations of national limits for environmental emissions
• 1-2 years for natural recovery • Net negative financial impact of 1-5 crores • Short term impact on protected natural habitats • State wide media coverage
Minor 2 • Medical treatment injuries • 1 year for natural recovery • Net negative financial impact of 0.5 – 1 crore • Temporary environmental impacts which can be
mitigated • Local stakeholder concern and public attention
Insignificant 1 • First Aid treatment with no Lost Time Incidents (LTIs) • Natural recovery < 1year • Net negative financial impact of <0.5 crores. • No significant impact on environmental components • No media coverage
EIA for exploratory/ development activities of hydrocarbon, GGS & pipeline laying at Kasomarigaon
SENES/K-20198/ November, 2014 10 ONGC
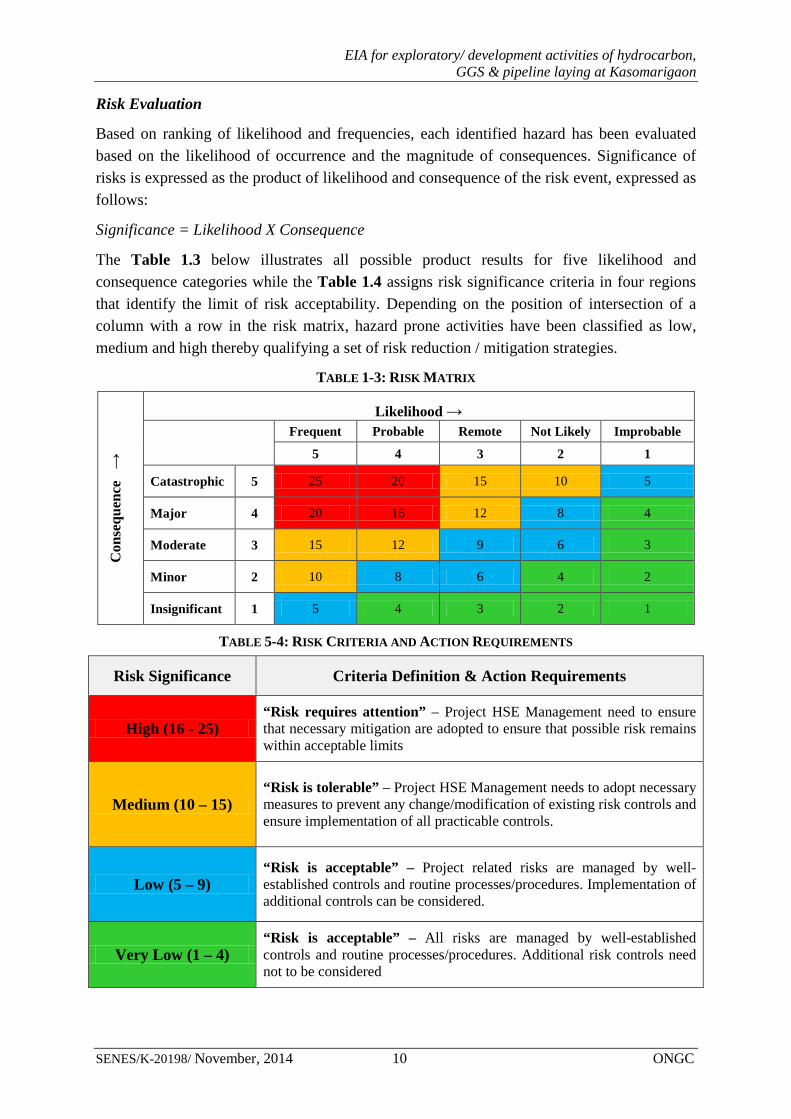
Risk Evaluation
Based on ranking of likelihood and frequencies, each identified hazard has been evaluated based on the likelihood of occurrence and the magnitude of consequences. Significance of risks is expressed as the product of likelihood and consequence of the risk event, expressed as follows:
Significance = Likelihood X Consequence
The Table 1.3 below illustrates all possible product results for five likelihood and consequence categories while the Table 1.4 assigns risk significance criteria in four regions that identify the limit of risk acceptability. Depending on the position of intersection of a column with a row in the risk matrix, hazard prone activities have been classified as low, medium and high thereby qualifying a set of risk reduction / mitigation strategies.
TABLE 1-3: RISK MATRIX
Con
sequ
ence
→
Likelihood →
Frequent Probable Remote Not Likely Improbable
5 4 3 2 1
Catastrophic 5 25 20 15 10 5
Major 4 20 16 12 8 4
Moderate 3 15 12 9 6 3
Minor 2 10 8 6 4 2
Insignificant 1 5 4 3 2 1
TABLE 5-4: RISK CRITERIA AND ACTION REQUIREMENTS
Risk Significance Criteria Definition & Action Requirements
High (16 - 25) “Risk requires attention” – Project HSE Management need to ensure that necessary mitigation are adopted to ensure that possible risk remains within acceptable limits
Medium (10 – 15) “Risk is tolerable” – Project HSE Management needs to adopt necessary measures to prevent any change/modification of existing risk controls and ensure implementation of all practicable controls.
Low (5 – 9) “Risk is acceptable” – Project related risks are managed by well-established controls and routine processes/procedures. Implementation of additional controls can be considered.
Very Low (1 – 4) “Risk is acceptable” – All risks are managed by well-established controls and routine processes/procedures. Additional risk controls need not to be considered
EIA for exploratory/ development activities of hydrocarbon, GGS & pipeline laying at Kasomarigaon
SENES/K-20198/ November, 2014 11 ONGC
1.1.3 Risk Assessment of Identified Project Hazards As already discussed in the previous section, three major categories risk have identified in relation to proposed exploratory and development drilling activities. A comprehensive risk assessment study has been undertaken to assess and evaluate significance of identified risks in terms of severity of consequences and likelihood of occurrence. Risk assessment study details have been summarized in the subsequent sections below:
1.1.4 Blow Outs/Loss of Well Control
Blow out is an uncontrolled release of well fluid (primarily hydrocarbons viz. oil and/or gas and may also include drilling mud, completion fluid, water etc) from an exploratory or producing well. Blow outs are the result of failure to control a kick and regain pressure control and are typically caused by equipment failure or human error. The possible blow out cause events occurring in isolation or in combination have been listed below:
• Formation fluid entry into well bore
• Loss of containment due to malfunction (viz. wire lining)
• Well head damage (e.g. by fires, storms, dropped object etc)
• Rig forced off station (e.g. by anchor failure) damaging Blow Out Preventor (BOP) or wellhead
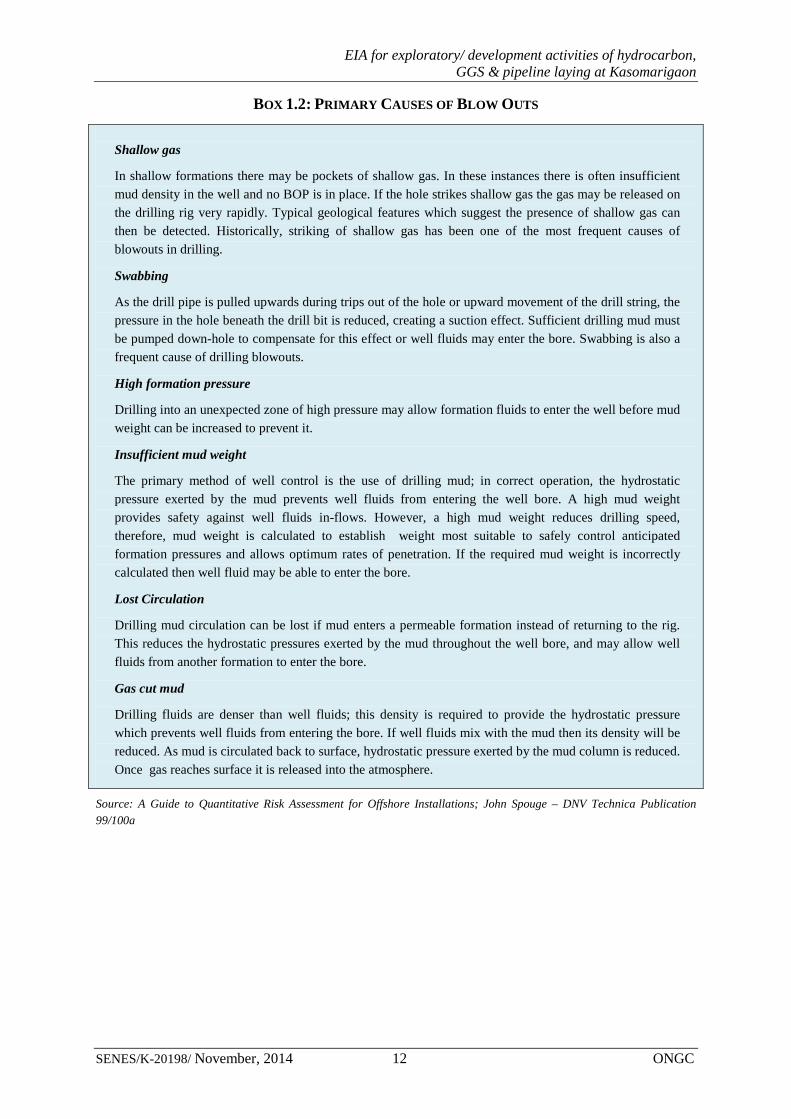
The most common cause of blow out can be associated with the sudden/unexpected entry/release of formation fluid into well bore that may arise as a result of the following events as discussed in the Box 1.2 below.
EIA for exploratory/ development activities of hydrocarbon, GGS & pipeline laying at Kasomarigaon
SENES/K-20198/ November, 2014 12 ONGC
BOX 1.2: PRIMARY CAUSES OF BLOW OUTS
Shallow gas
In shallow formations there may be pockets of shallow gas. In these instances there is often insufficient mud density in the well and no BOP is in place. If the hole strikes shallow gas the gas may be released on the drilling rig very rapidly. Typical geological features which suggest the presence of shallow gas can then be detected. Historically, striking of shallow gas has been one of the most frequent causes of blowouts in drilling.
Swabbing
As the drill pipe is pulled upwards during trips out of the hole or upward movement of the drill string, the pressure in the hole beneath the drill bit is reduced, creating a suction effect. Sufficient drilling mud must be pumped down-hole to compensate for this effect or well fluids may enter the bore. Swabbing is also a frequent cause of drilling blowouts.
High formation pressure
Drilling into an unexpected zone of high pressure may allow formation fluids to enter the well before mud weight can be increased to prevent it.
Insufficient mud weight
The primary method of well control is the use of drilling mud; in correct operation, the hydrostatic pressure exerted by the mud prevents well fluids from entering the well bore. A high mud weight provides safety against well fluids in-flows. However, a high mud weight reduces drilling speed, therefore, mud weight is calculated to establish weight most suitable to safely control anticipated formation pressures and allows optimum rates of penetration. If the required mud weight is incorrectly calculated then well fluid may be able to enter the bore.
Lost Circulation
Drilling mud circulation can be lost if mud enters a permeable formation instead of returning to the rig. This reduces the hydrostatic pressures exerted by the mud throughout the well bore, and may allow well fluids from another formation to enter the bore.
Gas cut mud
Drilling fluids are denser than well fluids; this density is required to provide the hydrostatic pressure which prevents well fluids from entering the bore. If well fluids mix with the mud then its density will be reduced. As mud is circulated back to surface, hydrostatic pressure exerted by the mud column is reduced. Once gas reaches surface it is released into the atmosphere.
Source: A Guide to Quantitative Risk Assessment for Offshore Installations; John Spouge – DNV Technica Publication 99/100a
EIA for exploratory/ development activities of hydrocarbon, GGS & pipeline laying at Kasomarigaon
SENES/K-20198/ November, 2014 13 ONGC
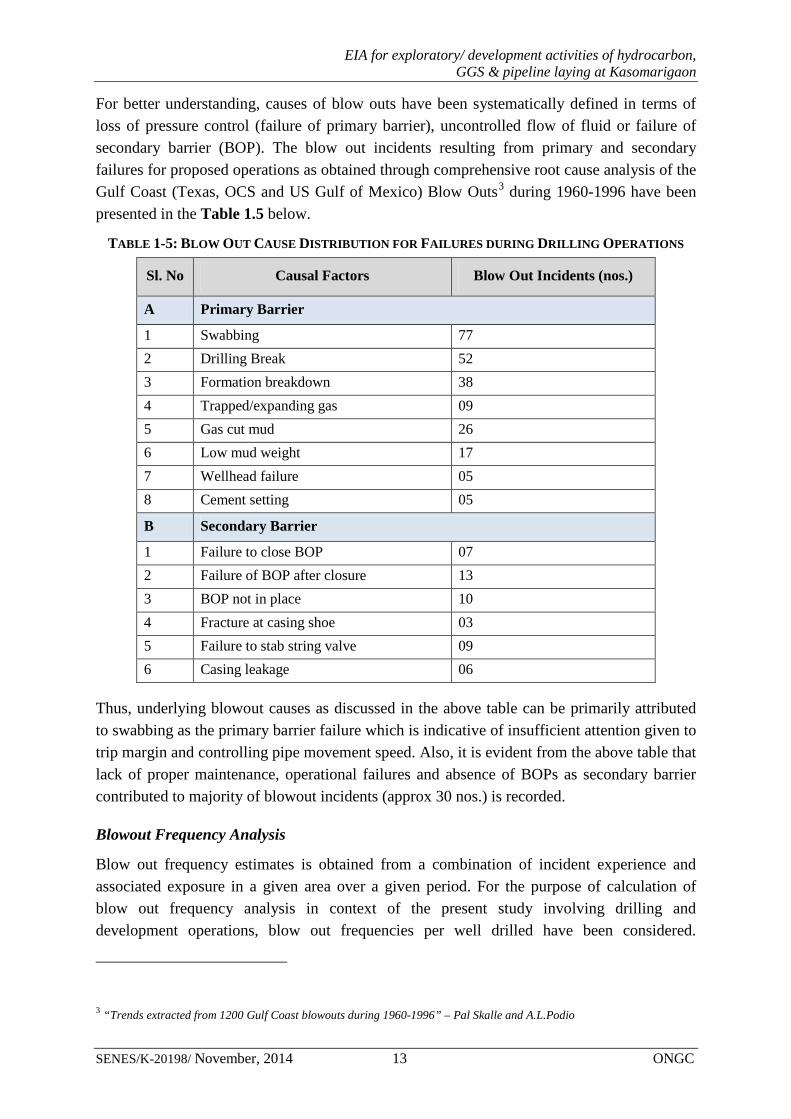
For better understanding, causes of blow outs have been systematically defined in terms of loss of pressure control (failure of primary barrier), uncontrolled flow of fluid or failure of secondary barrier (BOP). The blow out incidents resulting from primary and secondary failures for proposed operations as obtained through comprehensive root cause analysis of the Gulf Coast (Texas, OCS and US Gulf of Mexico) Blow Outs3 during 1960-1996 have been presented in the Table 1.5 below.
TABLE 1-5: BLOW OUT CAUSE DISTRIBUTION FOR FAILURES DURING DRILLING OPERATIONS
Sl. No Causal Factors Blow Out Incidents (nos.)
A Primary Barrier
1 Swabbing 77 2 Drilling Break 52 3 Formation breakdown 38 4 Trapped/expanding gas 09 5 Gas cut mud 26 6 Low mud weight 17 7 Wellhead failure 05 8 Cement setting 05
B Secondary Barrier
1 Failure to close BOP 07 2 Failure of BOP after closure 13 3 BOP not in place 10 4 Fracture at casing shoe 03 5 Failure to stab string valve 09 6 Casing leakage 06
Thus, underlying blowout causes as discussed in the above table can be primarily attributed to swabbing as the primary barrier failure which is indicative of insufficient attention given to trip margin and controlling pipe movement speed. Also, it is evident from the above table that lack of proper maintenance, operational failures and absence of BOPs as secondary barrier contributed to majority of blowout incidents (approx 30 nos.) is recorded.
Blowout Frequency Analysis
Blow out frequency estimates is obtained from a combination of incident experience and associated exposure in a given area over a given period. For the purpose of calculation of blow out frequency analysis in context of the present study involving drilling and development operations, blow out frequencies per well drilled have been considered.
3 “Trends extracted from 1200 Gulf Coast blowouts during 1960-1996” – Pal Skalle and A.L.Podio
EIA for exploratory/ development activities of hydrocarbon, GGS & pipeline laying at Kasomarigaon
SENES/K-20198/ November, 2014 14 ONGC
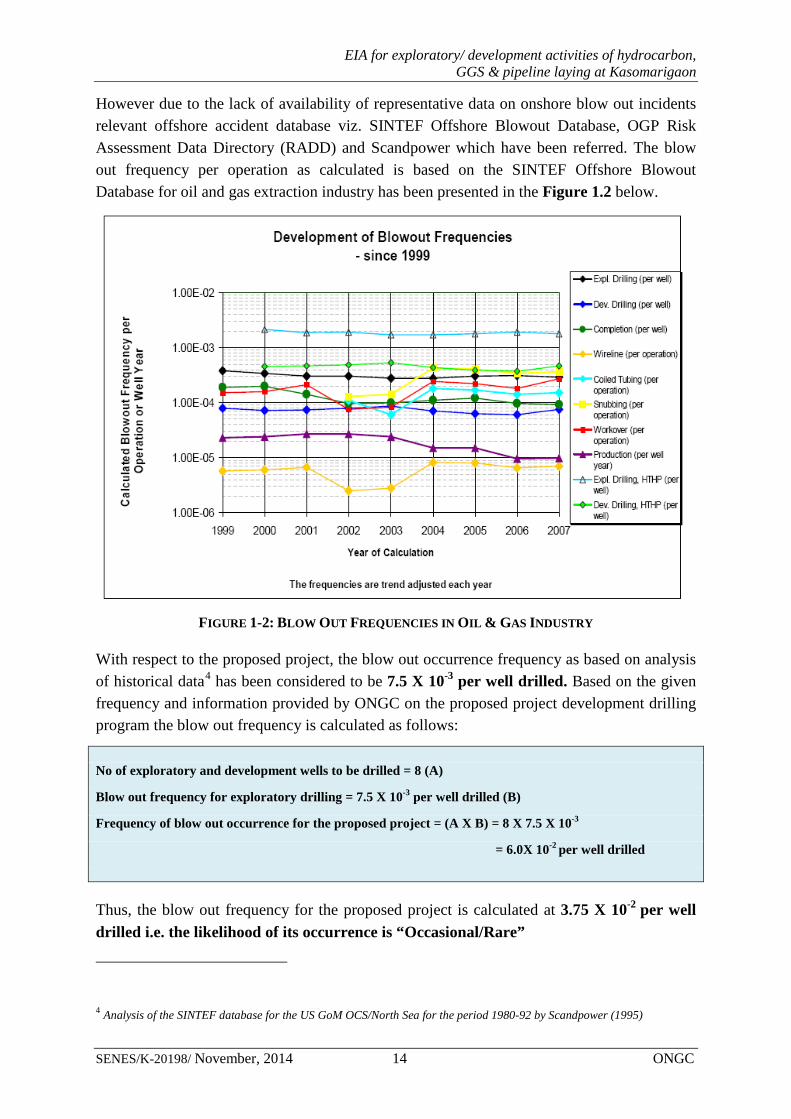
However due to the lack of availability of representative data on onshore blow out incidents relevant offshore accident database viz. SINTEF Offshore Blowout Database, OGP Risk Assessment Data Directory (RADD) and Scandpower which have been referred. The blow out frequency per operation as calculated is based on the SINTEF Offshore Blowout Database for oil and gas extraction industry has been presented in the Figure 1.2 below.
FIGURE 1-2: BLOW OUT FREQUENCIES IN OIL & GAS INDUSTRY
With respect to the proposed project, the blow out occurrence frequency as based on analysis of historical data4 has been considered to be 7.5 X 10⁻³ per well drilled. Based on the given frequency and information provided by ONGC on the proposed project development drilling program the blow out frequency is calculated as follows:
No of exploratory and development wells to be drilled = 8 (A)
Blow out frequency for exploratory drilling = 7.5 X 10⁻³ per well drilled (B)
Frequency of blow out occurrence for the proposed project = (A X B) = 8 X 7.5 X 10-3
= 6.0X 10⁻² per well drilled
Thus, the blow out frequency for the proposed project is calculated at 3.75 X 10⁻² per well drilled i.e. the likelihood of its occurrence is “Occasional/Rare”
4 Analysis of the SINTEF database for the US GoM OCS/North Sea for the period 1980-92 by Scandpower (1995)
EIA for exploratory/ development activities of hydrocarbon, GGS & pipeline laying at Kasomarigaon
SENES/K-20198/ November, 2014 15 ONGC
Blowout Ignition Probability
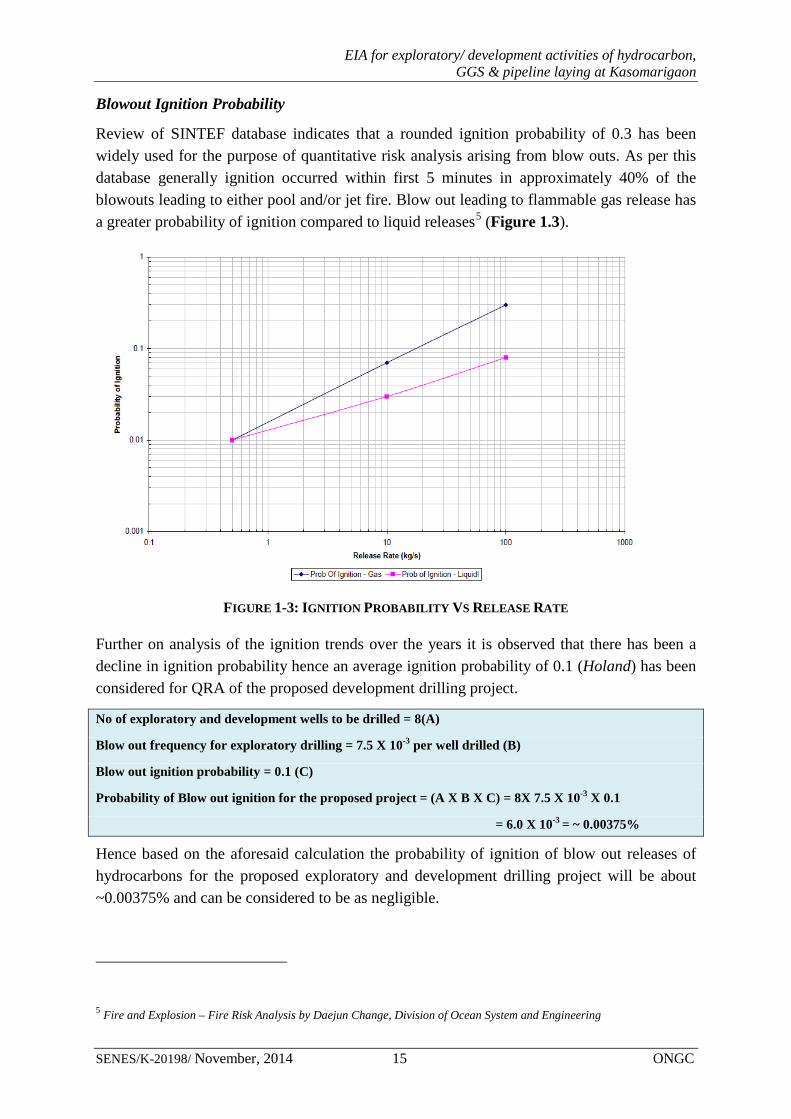
Review of SINTEF database indicates that a rounded ignition probability of 0.3 has been widely used for the purpose of quantitative risk analysis arising from blow outs. As per this database generally ignition occurred within first 5 minutes in approximately 40% of the blowouts leading to either pool and/or jet fire. Blow out leading to flammable gas release has a greater probability of ignition compared to liquid releases5 (Figure 1.3).
FIGURE 1-3: IGNITION PROBABILITY VS RELEASE RATE
Further on analysis of the ignition trends over the years it is observed that there has been a decline in ignition probability hence an average ignition probability of 0.1 (Holand) has been considered for QRA of the proposed development drilling project.
No of exploratory and development wells to be drilled = 8(A)
Blow out frequency for exploratory drilling = 7.5 X 10⁻³ per well drilled (B)
Blow out ignition probability = 0.1 (C)
Probability of Blow out ignition for the proposed project = (A X B X C) = 8X 7.5 X 10-3 X 0.1
= 6.0 X 10-3 = ~ 0.00375%
Hence based on the aforesaid calculation the probability of ignition of blow out releases of hydrocarbons for the proposed exploratory and development drilling project will be about ~0.00375% and can be considered to be as negligible.
5 Fire and Explosion – Fire Risk Analysis by Daejun Change, Division of Ocean System and Engineering

EIA for exploratory/ development activities of hydrocarbon, GGS & pipeline laying at Kasomarigaon
SENES/K-20198/ November, 2014 16 ONGC
Blowout Consequence Analysis
Blow out from a hydrocarbon exploratory and/or producing well may lead to the following possible risk consequences:
• Pool fires and smoke plumes resulting from ignited oil blow outs
• Jet fires resulting from ignited gas blow outs
• Oil slicks resulting from un-ignited oil pools.
Most crude oils are more than 95 percent carbon and hydrogen, with small amounts of sulfur, nitrogen, oxygen, and traces of other elements. Crude oils contain lightweight straight-chained alkanes (e.g., hexane, heptane); cycloalkanes (e.g., cyclyohexane); aromatics (e.g., benzene, toluene); cycloalkanes; and heavy aromatic hydrocarbons (e.g., polycyclic aromatic hydrocarbons [PAHs], asphaltines). Based on the above discussion and also given the limitation of ALOHA software with respect to risk modeling of crude oil releases, n-heptane has been considered as the representative substitute of crude oil for ALOHA based risk modeling for hydrocarbon releases for the proposed development drilling project. For natural gas releases leading to jet fire, modeling has been based considering methane which has been identified as the principal constituent (~ 95%) of natural gas.
Pool fire
A pool fire is a turbulent diffusion fire burning above a pool of vaporizing hydrocarbon fuel where the fuel vapor has negligible initial momentum. The probability of occurrence of pool fires for oil and gas exploration and development is high due to continuous handling of heavy hydrocarbons. The evaporation of hydrocarbons from a pool forms a cloud of vapor above the pool surface which, on ignition, leads to generation of pool fire.
For the purpose of consequence modeling for pool fires resulting from blow outs, following hypothetical scenarios in terms of hydrocarbon (particularly crude oil) release rates (Table 1.6) have been considered based on DNV Technica’s FLARE program.
TABLE 1-6: POOL FIRE MODELING SCENARIOS
Scenario Release Rate (kg/s) Release Type
Scenario - I 1 Small
Scenario - II 10 Medium
Scenario – III (Worst Case) 50 Large The release rates as specified for the aforesaid scenarios have been utilized in computing the pool fire diameter utilizing the following equation and input parameters:
D = √4Q/πb
Where D = pool diameter (m)
Q = release rate (kg/s)
b = burning rate (kg/m2s)
EIA for exploratory/ development activities of hydrocarbon, GGS & pipeline laying at Kasomarigaon
SENES/K-20198/ November, 2014 17 ONGC
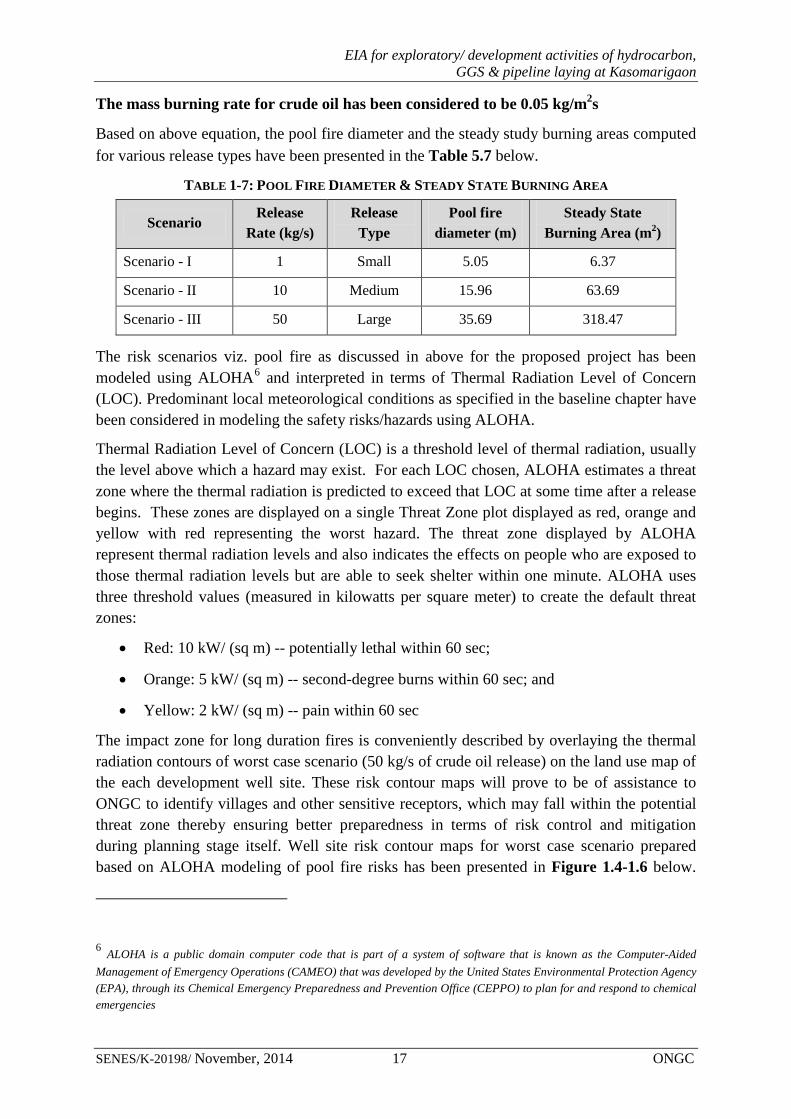
The mass burning rate for crude oil has been considered to be 0.05 kg/m2s
Based on above equation, the pool fire diameter and the steady study burning areas computed for various release types have been presented in the Table 5.7 below.
TABLE 1-7: POOL FIRE DIAMETER & STEADY STATE BURNING AREA
Scenario Release
Rate (kg/s) Release
Type Pool fire
diameter (m) Steady State
Burning Area (m2)
Scenario - I 1 Small 5.05 6.37
Scenario - II 10 Medium 15.96 63.69
Scenario - III 50 Large 35.69 318.47
The risk scenarios viz. pool fire as discussed in above for the proposed project has been modeled using ALOHA6 and interpreted in terms of Thermal Radiation Level of Concern (LOC). Predominant local meteorological conditions as specified in the baseline chapter have been considered in modeling the safety risks/hazards using ALOHA.
Thermal Radiation Level of Concern (LOC) is a threshold level of thermal radiation, usually the level above which a hazard may exist. For each LOC chosen, ALOHA estimates a threat zone where the thermal radiation is predicted to exceed that LOC at some time after a release begins. These zones are displayed on a single Threat Zone plot displayed as red, orange and yellow with red representing the worst hazard. The threat zone displayed by ALOHA represent thermal radiation levels and also indicates the effects on people who are exposed to those thermal radiation levels but are able to seek shelter within one minute. ALOHA uses three threshold values (measured in kilowatts per square meter) to create the default threat zones:
• Red: 10 kW/ (sq m) -- potentially lethal within 60 sec;
• Orange: 5 kW/ (sq m) -- second-degree burns within 60 sec; and
• Yellow: 2 kW/ (sq m) -- pain within 60 sec
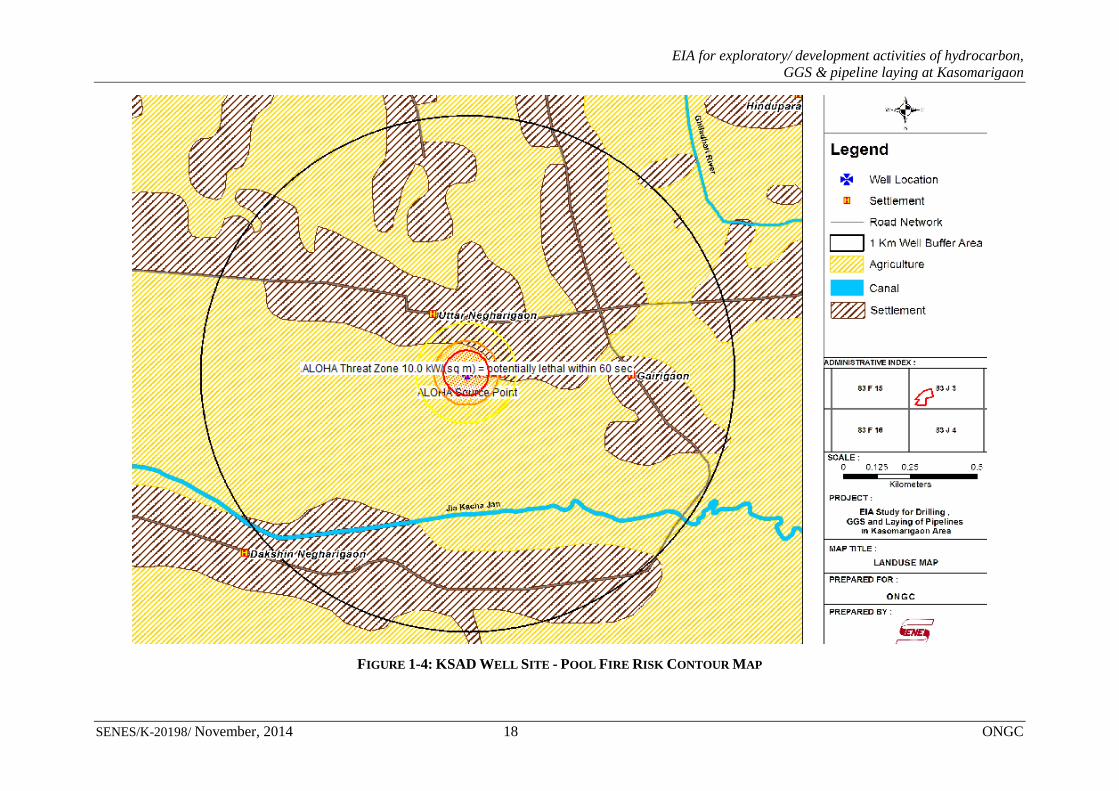
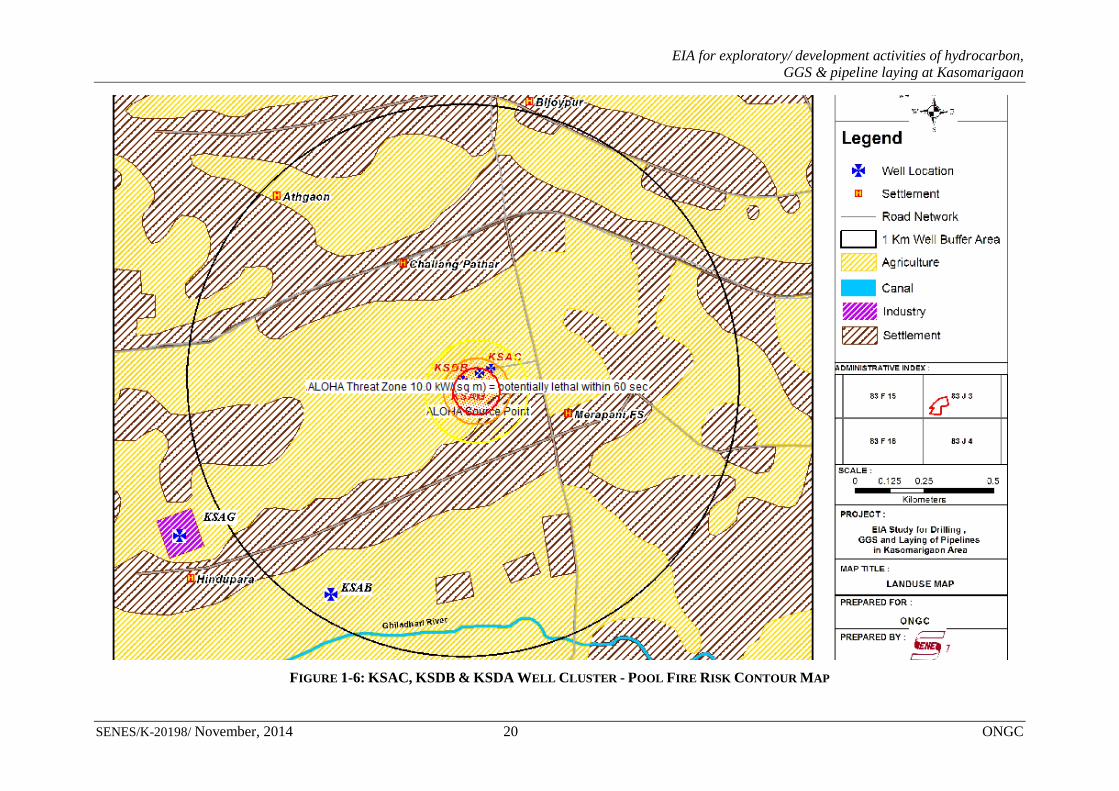
The impact zone for long duration fires is conveniently described by overlaying the thermal radiation contours of worst case scenario (50 kg/s of crude oil release) on the land use map of the each development well site. These risk contour maps will prove to be of assistance to ONGC to identify villages and other sensitive receptors, which may fall within the potential threat zone thereby ensuring better preparedness in terms of risk control and mitigation during planning stage itself. Well site risk contour maps for worst case scenario prepared based on ALOHA modeling of pool fire risks has been presented in Figure 1.4-1.6 below.
6 ALOHA is a public domain computer code that is part of a system of software that is known as the Computer-Aided Management of Emergency Operations (CAMEO) that was developed by the United States Environmental Protection Agency (EPA), through its Chemical Emergency Preparedness and Prevention Office (CEPPO) to plan for and respond to chemical emergencies
EIA for exploratory/ development activities of hydrocarbon, GGS & pipeline laying at Kasomarigaon
SENES/K-20198/ November, 2014 18 ONGC
FIGURE 1-4: KSAD WELL SITE - POOL FIRE RISK CONTOUR MAP

EIA for exploratory/ development activities of hydrocarbon, GGS & pipeline laying at Kasomarigaon
SENES/K-20198/ November, 2014 19 ONGC
FIGURE 1-5: KSAE WELL SITE - POOL FIRE RISK CONTOUR MAP
EIA for exploratory/ development activities of hydrocarbon, GGS & pipeline laying at Kasomarigaon
SENES/K-20198/ November, 2014 20 ONGC
FIGURE 1-6: KSAC, KSDB & KSDA WELL CLUSTER - POOL FIRE RISK CONTOUR MAP
EIA for exploratory/ development activities of hydrocarbon, GGS & pipeline laying at Kasomarigaon
SENES/K-20198/ November, 2014 21 ONGC
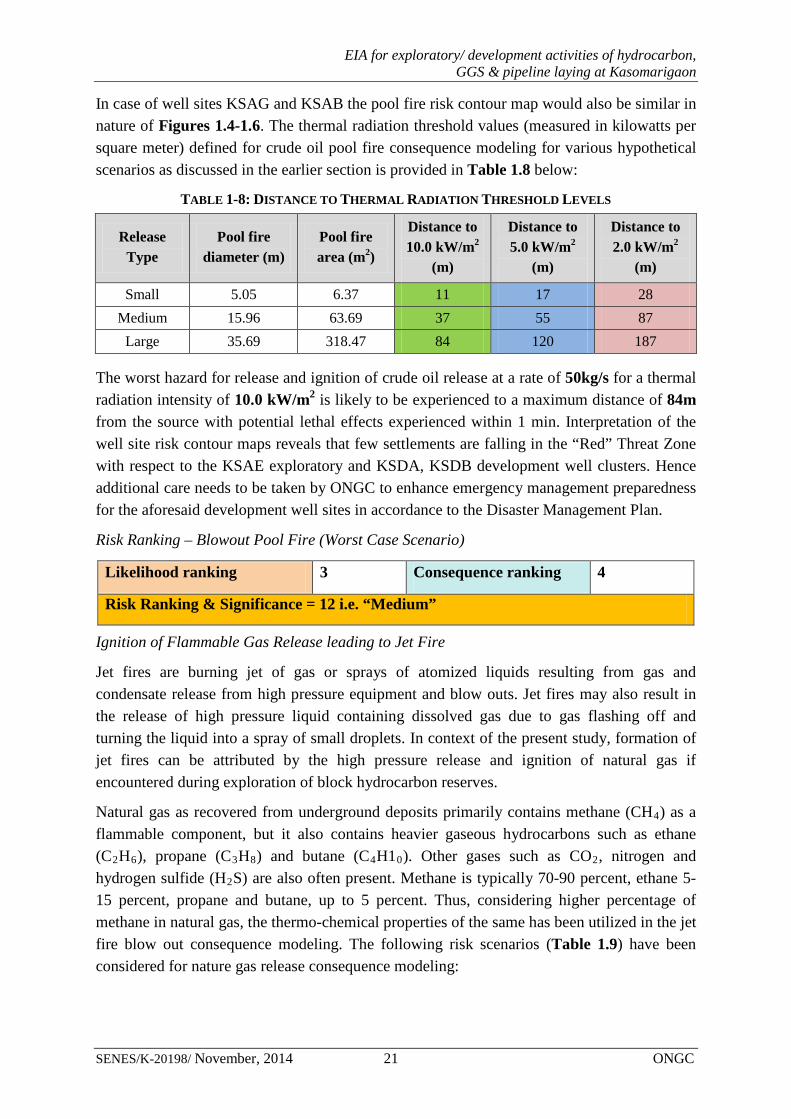
In case of well sites KSAG and KSAB the pool fire risk contour map would also be similar in nature of Figures 1.4-1.6. The thermal radiation threshold values (measured in kilowatts per square meter) defined for crude oil pool fire consequence modeling for various hypothetical scenarios as discussed in the earlier section is provided in Table 1.8 below:
TABLE 1-8: DISTANCE TO THERMAL RADIATION THRESHOLD LEVELS
Release Type
Pool fire diameter (m)
Pool fire area (m2)
Distance to 10.0 kW/m2
(m)
Distance to 5.0 kW/m2
(m)
Distance to 2.0 kW/m2
(m)
Small 5.05 6.37 11 17 28 Medium 15.96 63.69 37 55 87
Large 35.69 318.47 84 120 187
The worst hazard for release and ignition of crude oil release at a rate of 50kg/s for a thermal radiation intensity of 10.0 kW/m2 is likely to be experienced to a maximum distance of 84m from the source with potential lethal effects experienced within 1 min. Interpretation of the well site risk contour maps reveals that few settlements are falling in the “Red” Threat Zone with respect to the KSAE exploratory and KSDA, KSDB development well clusters. Hence additional care needs to be taken by ONGC to enhance emergency management preparedness for the aforesaid development well sites in accordance to the Disaster Management Plan.
Risk Ranking – Blowout Pool Fire (Worst Case Scenario)
Likelihood ranking 3 Consequence ranking 4
Risk Ranking & Significance = 12 i.e. “Medium”
Ignition of Flammable Gas Release leading to Jet Fire
Jet fires are burning jet of gas or sprays of atomized liquids resulting from gas and condensate release from high pressure equipment and blow outs. Jet fires may also result in the release of high pressure liquid containing dissolved gas due to gas flashing off and turning the liquid into a spray of small droplets. In context of the present study, formation of jet fires can be attributed by the high pressure release and ignition of natural gas if encountered during exploration of block hydrocarbon reserves.
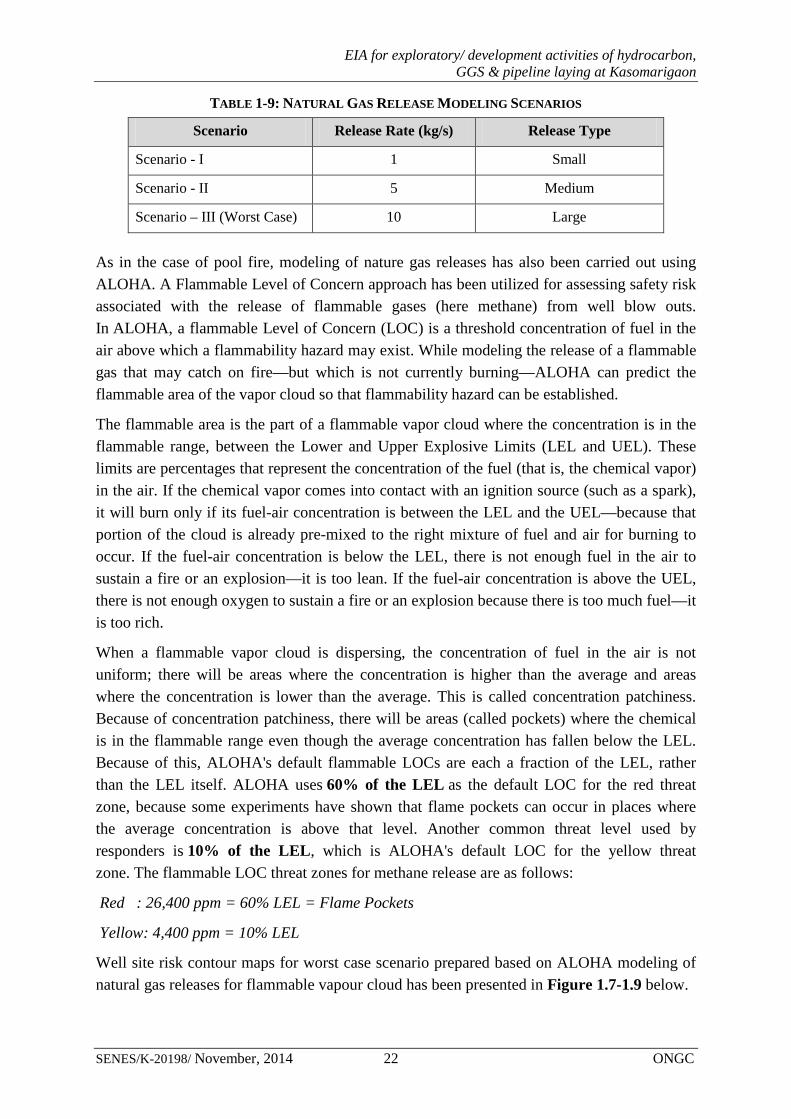
Natural gas as recovered from underground deposits primarily contains methane (CH4) as a flammable component, but it also contains heavier gaseous hydrocarbons such as ethane (C2H6), propane (C3H8) and butane (C4H10). Other gases such as CO2, nitrogen and hydrogen sulfide (H2S) are also often present. Methane is typically 70-90 percent, ethane 5-15 percent, propane and butane, up to 5 percent. Thus, considering higher percentage of methane in natural gas, the thermo-chemical properties of the same has been utilized in the jet fire blow out consequence modeling. The following risk scenarios (Table 1.9) have been considered for nature gas release consequence modeling:
EIA for exploratory/ development activities of hydrocarbon, GGS & pipeline laying at Kasomarigaon
SENES/K-20198/ November, 2014 22 ONGC
TABLE 1-9: NATURAL GAS RELEASE MODELING SCENARIOS
Scenario Release Rate (kg/s) Release Type
Scenario - I 1 Small
Scenario - II 5 Medium
Scenario – III (Worst Case) 10 Large
As in the case of pool fire, modeling of nature gas releases has also been carried out using ALOHA. A Flammable Level of Concern approach has been utilized for assessing safety risk associated with the release of flammable gases (here methane) from well blow outs. In ALOHA, a flammable Level of Concern (LOC) is a threshold concentration of fuel in the air above which a flammability hazard may exist. While modeling the release of a flammable gas that may catch on fire—but which is not currently burning—ALOHA can predict the flammable area of the vapor cloud so that flammability hazard can be established.
The flammable area is the part of a flammable vapor cloud where the concentration is in the flammable range, between the Lower and Upper Explosive Limits (LEL and UEL). These limits are percentages that represent the concentration of the fuel (that is, the chemical vapor) in the air. If the chemical vapor comes into contact with an ignition source (such as a spark), it will burn only if its fuel-air concentration is between the LEL and the UEL—because that portion of the cloud is already pre-mixed to the right mixture of fuel and air for burning to occur. If the fuel-air concentration is below the LEL, there is not enough fuel in the air to sustain a fire or an explosion—it is too lean. If the fuel-air concentration is above the UEL, there is not enough oxygen to sustain a fire or an explosion because there is too much fuel—it is too rich.
When a flammable vapor cloud is dispersing, the concentration of fuel in the air is not uniform; there will be areas where the concentration is higher than the average and areas where the concentration is lower than the average. This is called concentration patchiness. Because of concentration patchiness, there will be areas (called pockets) where the chemical is in the flammable range even though the average concentration has fallen below the LEL. Because of this, ALOHA's default flammable LOCs are each a fraction of the LEL, rather than the LEL itself. ALOHA uses 60% of the LEL as the default LOC for the red threat zone, because some experiments have shown that flame pockets can occur in places where the average concentration is above that level. Another common threat level used by responders is 10% of the LEL, which is ALOHA's default LOC for the yellow threat zone. The flammable LOC threat zones for methane release are as follows:
Red : 26,400 ppm = 60% LEL = Flame Pockets
Yellow: 4,400 ppm = 10% LEL
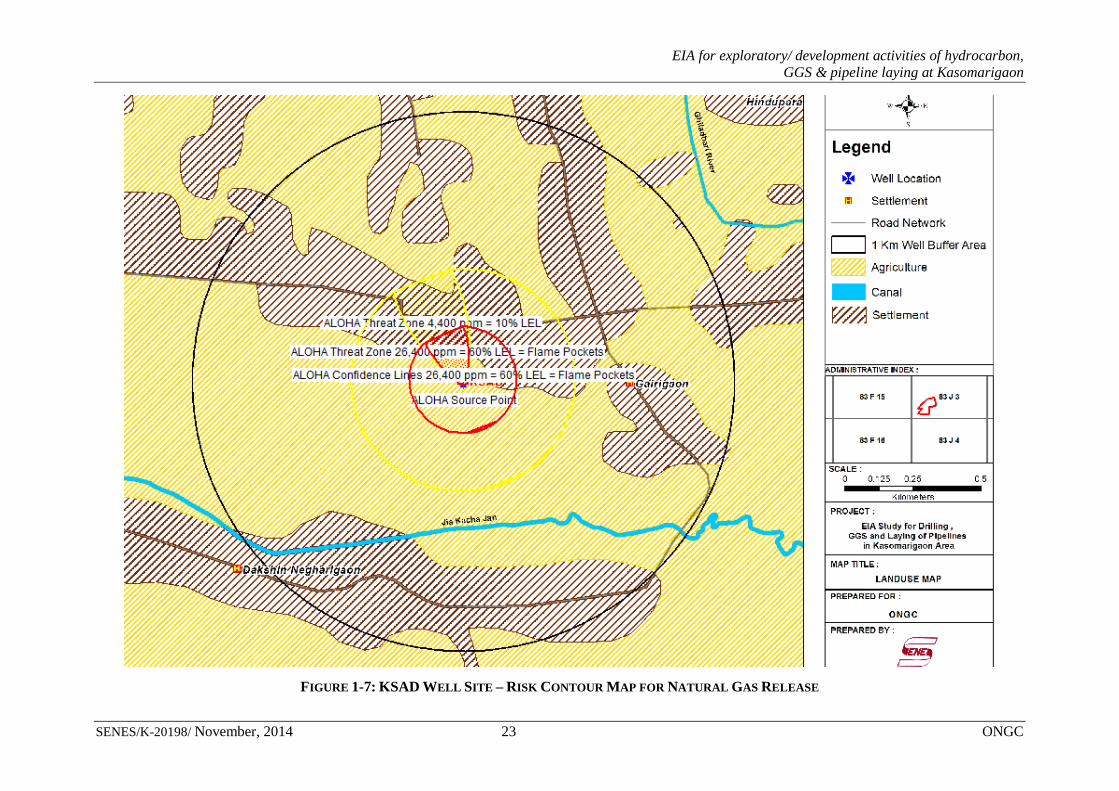
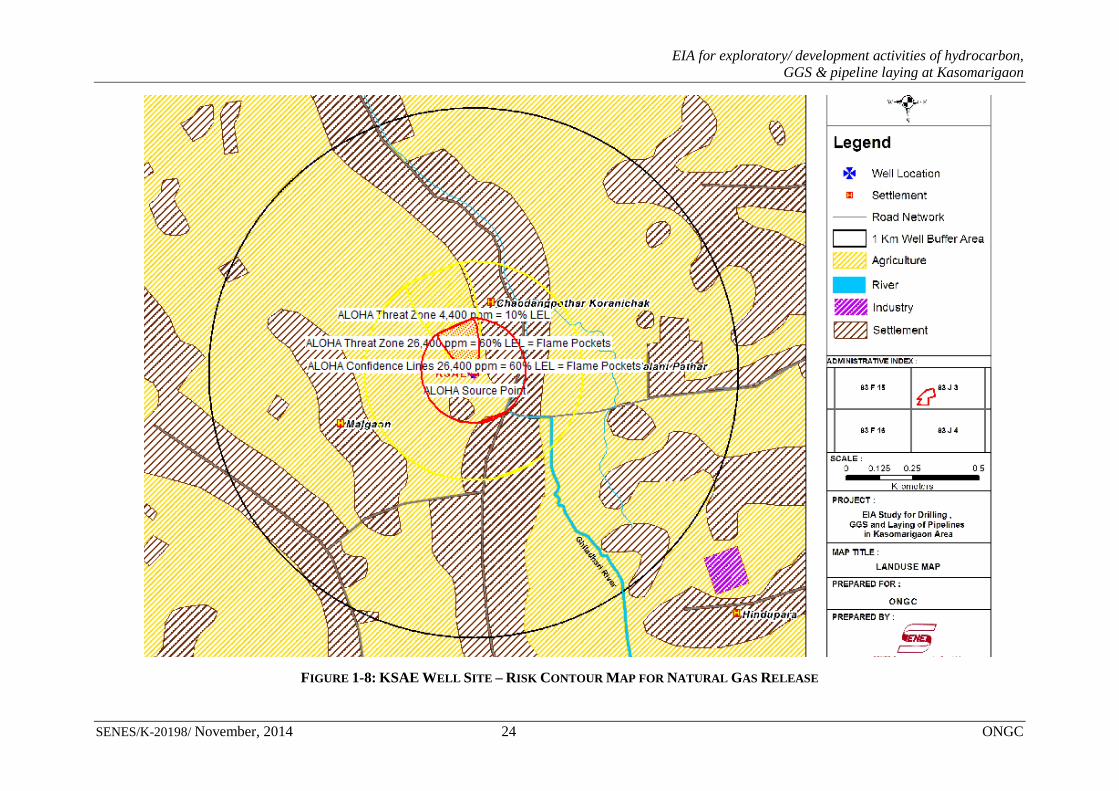
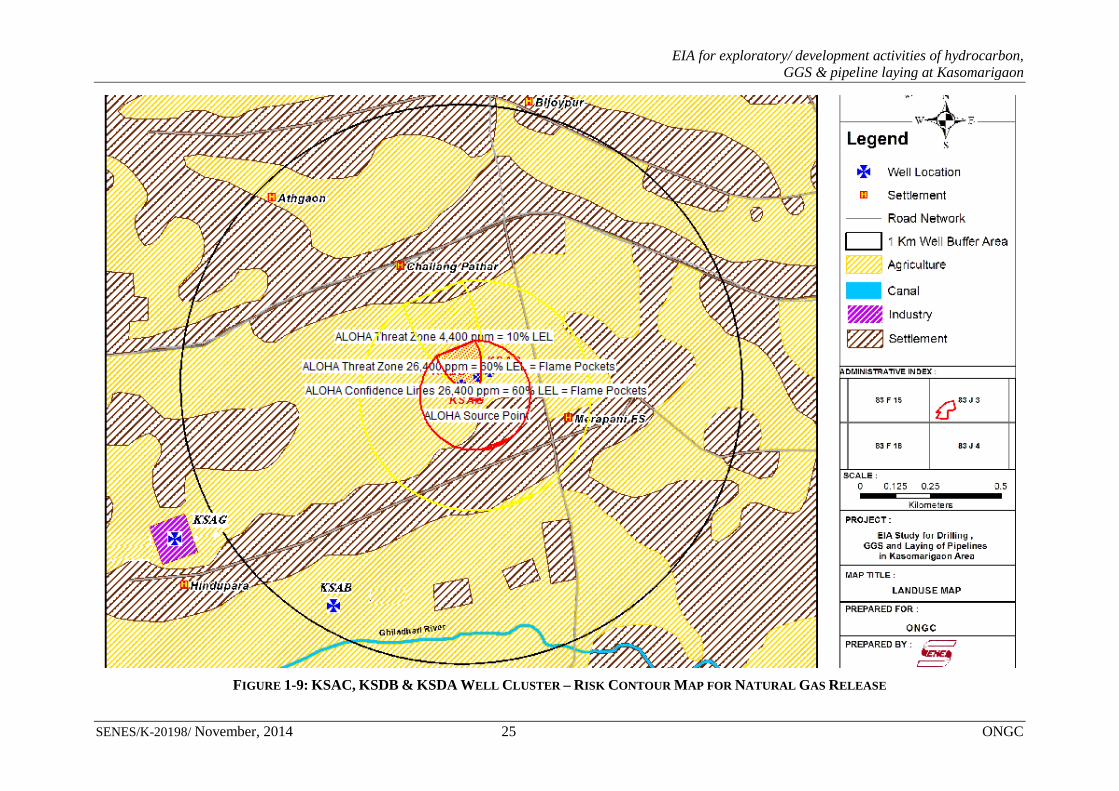
Well site risk contour maps for worst case scenario prepared based on ALOHA modeling of natural gas releases for flammable vapour cloud has been presented in Figure 1.7-1.9 below.
EIA for exploratory/ development activities of hydrocarbon, GGS & pipeline laying at Kasomarigaon
SENES/K-20198/ November, 2014 23 ONGC
FIGURE 1-7: KSAD WELL SITE – RISK CONTOUR MAP FOR NATURAL GAS RELEASE
EIA for exploratory/ development activities of hydrocarbon, GGS & pipeline laying at Kasomarigaon
SENES/K-20198/ November, 2014 24 ONGC
FIGURE 1-8: KSAE WELL SITE – RISK CONTOUR MAP FOR NATURAL GAS RELEASE
EIA for exploratory/ development activities of hydrocarbon, GGS & pipeline laying at Kasomarigaon
SENES/K-20198/ November, 2014 25 ONGC
FIGURE 1-9: KSAC, KSDB & KSDA WELL CLUSTER – RISK CONTOUR MAP FOR NATURAL GAS RELEASE
EIA for exploratory/ development activities of hydrocarbon, GGS & pipeline laying at Kasomarigaon
SENES/K-20198/ November, 2014 26 ONGC
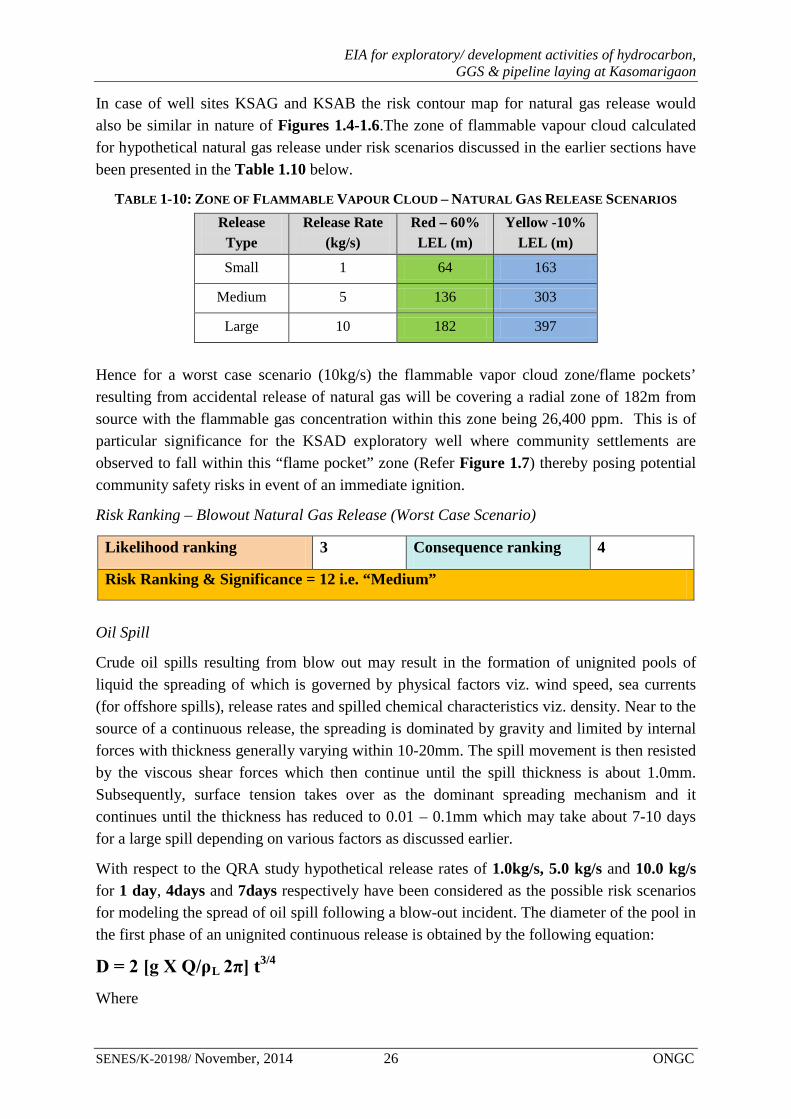
In case of well sites KSAG and KSAB the risk contour map for natural gas release would also be similar in nature of Figures 1.4-1.6.The zone of flammable vapour cloud calculated for hypothetical natural gas release under risk scenarios discussed in the earlier sections have been presented in the Table 1.10 below.
TABLE 1-10: ZONE OF FLAMMABLE VAPOUR CLOUD – NATURAL GAS RELEASE SCENARIOS Release
Type Release Rate
(kg/s) Red – 60% LEL (m)
Yellow -10% LEL (m)
Small 1 64 163
Medium 5 136 303
Large 10 182 397
Hence for a worst case scenario (10kg/s) the flammable vapor cloud zone/flame pockets’ resulting from accidental release of natural gas will be covering a radial zone of 182m from source with the flammable gas concentration within this zone being 26,400 ppm. This is of particular significance for the KSAD exploratory well where community settlements are observed to fall within this “flame pocket” zone (Refer Figure 1.7) thereby posing potential community safety risks in event of an immediate ignition.
Risk Ranking – Blowout Natural Gas Release (Worst Case Scenario)
Likelihood ranking 3 Consequence ranking 4
Risk Ranking & Significance = 12 i.e. “Medium”
Oil Spill
Crude oil spills resulting from blow out may result in the formation of unignited pools of liquid the spreading of which is governed by physical factors viz. wind speed, sea currents (for offshore spills), release rates and spilled chemical characteristics viz. density. Near to the source of a continuous release, the spreading is dominated by gravity and limited by internal forces with thickness generally varying within 10-20mm. The spill movement is then resisted by the viscous shear forces which then continue until the spill thickness is about 1.0mm. Subsequently, surface tension takes over as the dominant spreading mechanism and it continues until the thickness has reduced to 0.01 – 0.1mm which may take about 7-10 days for a large spill depending on various factors as discussed earlier.
With respect to the QRA study hypothetical release rates of 1.0kg/s, 5.0 kg/s and 10.0 kg/s for 1 day, 4days and 7days respectively have been considered as the possible risk scenarios for modeling the spread of oil spill following a blow-out incident. The diameter of the pool in the first phase of an unignited continuous release is obtained by the following equation:
D = 2 [g X Q/ρL 2π] t3/4
Where

EIA for exploratory/ development activities of hydrocarbon, GGS & pipeline laying at Kasomarigaon
SENES/K-20198/ November, 2014 27 ONGC
D = pool diameter (m)
g = acceleration due to gravity (m/s2)
Q = release rate (kg/s)
ρL = liquid density (kg/m3) (crude oil density is 790 kg/ m3)
t = time since start of release (s)
The pool diameter so calculated for the aforesaid risk scenarios have been presented in the Table 1.11 below.
TABLE 1-11: POOL DIAMETER FOR OIL SPILL RISK SCENARIOS
Release Type Release Rate (kg/s) Release Time (s) Oil Spill Pool Diameter (m)
Small 1 86400 19.9
Medium 5 259200 226.9
Large 10 432000 665.7
Hence, for a worst case spill scenario involving a crude oil release rate of 10kg/s for a period of 7 days the pool diameter for an un-ignited continuous release is predicted to be about 665.7 m. The ignition of the oil pool may lead to the formation of pool fires - consequences of which have been discussed earlier under the risk related to pool fires. Although the un-ignited pool is not considered to be of major significance, it may gain significance based on the environmental impacts that may result from it depending on sensitive receptors identified abutting the proposed project development well sites.
Risk Ranking – Blowout Oil Spills (Worst Case Scenario)
Likelihood ranking 3 Consequence ranking 4
Risk Ranking & Significance = 12 i.e. “Medium”
Preventive and Mitigation Measures
Blowouts being events which may be catastrophic to any well operation, it is essential to take up as much a preventive measures as feasible. This includes:
• Necessary active barriers (eg. Well-designed Blowout Preventor) be installed to control or contain a potential blowout.
• Weekly blow out drills be carried out to test reliability of BOP and preparedness of drilling team.
• Close monitoring of drilling activity be done to check for signs of increasing pressure, like from shallow gas formations.
• Installation of hydrocarbon detectors.
EIA for exploratory/ development activities of hydrocarbon, GGS & pipeline laying at Kasomarigaon
SENES/K-20198/ November, 2014 28 ONGC
• Periodic monitoring and preventive maintenance be undertaken for primary and secondary barriers installed for blow out prevention, including third party inspection & testing
• An appropriate Emergency Response Plan be finalized and implemented by ONGC.
• Marking of hazardous zone (500 meters) around the well site and monitoring of human movements in the zone.
• Training and capacity building exercises/programs be carried out for onsite drilling crew on potential risks associated with exploratory drilling and their possible mitigation measures.
• Installation of mass communication and public address equipment.
• Good layout of well site and escape routes.
Additionally, ONGC will be adopting and implementing the following Safe Operating Procedures (SOPs) developed as part of its Onsite Emergency Response Plan to prevent and address any blow out risks that may result during drilling and work over activities:
• Blow Out Control Equipment
• Choke lines and Choke Manifold Installation with Surface BOP
• Kill Lines and Kill Manifold Installation with Surface BOP
• Control System for Surface BOP stacks
• Testing of Blow Out Prevention Equipment
• BOP Drills
1.1.5 Pipeline Failure Incidents & Causes
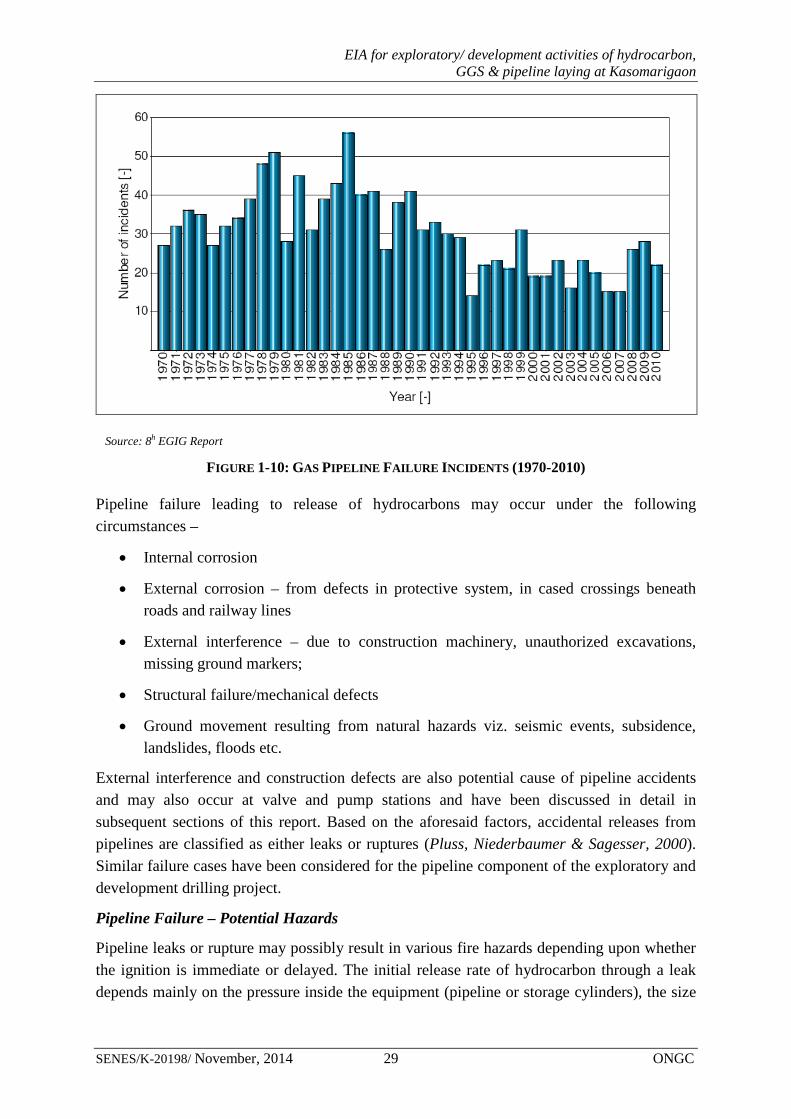
Failure frequency analysis of natural gas and/or crude oil transportation pipeline interconnecting development wells and GGS have been carried out based on the review of European Gas Pipeline Incident Data Group (EGIG) database. The EGIG is a cooperation of 15 major gas transmission systems in Europe with the objective of providing a broad basis for the calculation of safety performance of the pipeline systems thus providing a more realistic picture of the frequencies and probabilities of incidents. The 7th EGIG report recorded a total of 1173 nos. incidents for the period 1970-2007, with 76 nos. incidents being reported for the last three years which bring the total no of incidents to 1249 for the period (2007-2010). The number of pipeline failure incidents per year for the period 1970-2010 has been presented in the Figure 1.10 below.
EIA for exploratory/ development activities of hydrocarbon, GGS & pipeline laying at Kasomarigaon
SENES/K-20198/ November, 2014 29 ONGC
Source: 8h EGIG Report
FIGURE 1-10: GAS PIPELINE FAILURE INCIDENTS (1970-2010)
Pipeline failure leading to release of hydrocarbons may occur under the following circumstances –
• Internal corrosion
• External corrosion – from defects in protective system, in cased crossings beneath roads and railway lines
• External interference – due to construction machinery, unauthorized excavations, missing ground markers;
• Structural failure/mechanical defects
• Ground movement resulting from natural hazards viz. seismic events, subsidence, landslides, floods etc.
External interference and construction defects are also potential cause of pipeline accidents and may also occur at valve and pump stations and have been discussed in detail in subsequent sections of this report. Based on the aforesaid factors, accidental releases from pipelines are classified as either leaks or ruptures (Pluss, Niederbaumer & Sagesser, 2000). Similar failure cases have been considered for the pipeline component of the exploratory and development drilling project.
Pipeline Failure – Potential Hazards
Pipeline leaks or rupture may possibly result in various fire hazards depending upon whether the ignition is immediate or delayed. The initial release rate of hydrocarbon through a leak depends mainly on the pressure inside the equipment (pipeline or storage cylinders), the size
EIA for exploratory/ development activities of hydrocarbon, GGS & pipeline laying at Kasomarigaon
SENES/K-20198/ November, 2014 30 ONGC
of hole and phase of release i.e. gas, liquid or two-phase. Considering possible consequences associated with hydrocarbon leaks, release rate is considered to be important as it affects the size of the resulting gas cloud and hence the probability of ignition. It also determines the size of fire or smoke plume which may result. The IGEM/TD/27 (Institution of Gas Engineers & Managers) standard recognizes the following possible fire hazards as being applicable following a gas pipeline release that ignites:
Ignition of a Leak (Immediate or Delayed) to give a Jet Fire
In case of leaks from buried pipelines, the transient flow will be channelized through the voids from the overlaying soil. If the leak is sufficiently large then soil will be ejected above the pipeline. The jet will entrain air as it moves upward and will get disperse depending on the prevailing wind direction and other meteorological conditions. The concentration of gas till its Lower Flammability Limit (LFL) is hazardous, as it can catch fire on availability of ignition source. The total duration of release and its impact/consequence will depend on how quickly the release is identified and the sectionalizing valve isolates the pipeline section. If the material encounters an ignition source while it is in the flammable concentration range, a jet fire may occur. The momentum of released material from a buried pipeline generally results in vertically oriented fires. Such fires have smaller hazard ranges than horizontally orientated fires.
Immediate Ignition of a Rupture to give a Fireball & Crater Fire
Following a rupture, or large puncture, there will be rapid depressurization in the vicinity of the failure. For the buried pipelines as in this case, the overlying soil will be ejected with the formation of a crater of a size and shape, which influences the behavior of the released gas. At the start of the release, a highly turbulent mushroom shaped cap is formed which increases in height above the release point due to the source momentum and buoyancy, and is fed by the gas jet and entrained air from the plume which follows. In addition to entrained air the release can also result in entrainment of ejected soil into the cap and plume. Eventually, the cap will disperse due to progressive entrainment and a quasi-steady plume will remain. (Acton, Gosse & McCollum, 2002).
If the large scale quasi-instantaneous flammable gas release is under pressure is ignited almost immediately a fireball will result. In order for a fireball to occur, the cloud must be ignited before it has time to disperse hence there must be an ignition source close to the release point at the time of release. The energy released by the rupture of the pipeline typically results in the formation of a crater around the rupture point. Gas enters the crater from each end of the ruptured pipeline. Once the fireball has dissipated, this gas continues to
7 IGEM/TD/2 provides a framework for carrying out an assessment of the acute safety risks associated with major accident hazard pipelines (MAHPs) containing high pressure Natural Gas. It provides guidance on the selection of pipeline failure frequencies and on the modelling of failure consequences for the prediction of individual and societal risks.
EIA for exploratory/ development activities of hydrocarbon, GGS & pipeline laying at Kasomarigaon
SENES/K-20198/ November, 2014 31 ONGC
burn as a crater (or trench) fire. Crater fire generally occurs when the ignition of the gas released by rupture is delayed.
Flash Fires
The buoyancy of natural gas and momentum of the high pressure release tend to propel the gas away from ground level within a relatively short distance from the source. This means that it is highly unlikely that flammable concentrations of gas will be produced at ground level beyond a short distance from the source. For this reason, flash fires are not included within the QRA.
Pipeline Failure – Frequency Analysis
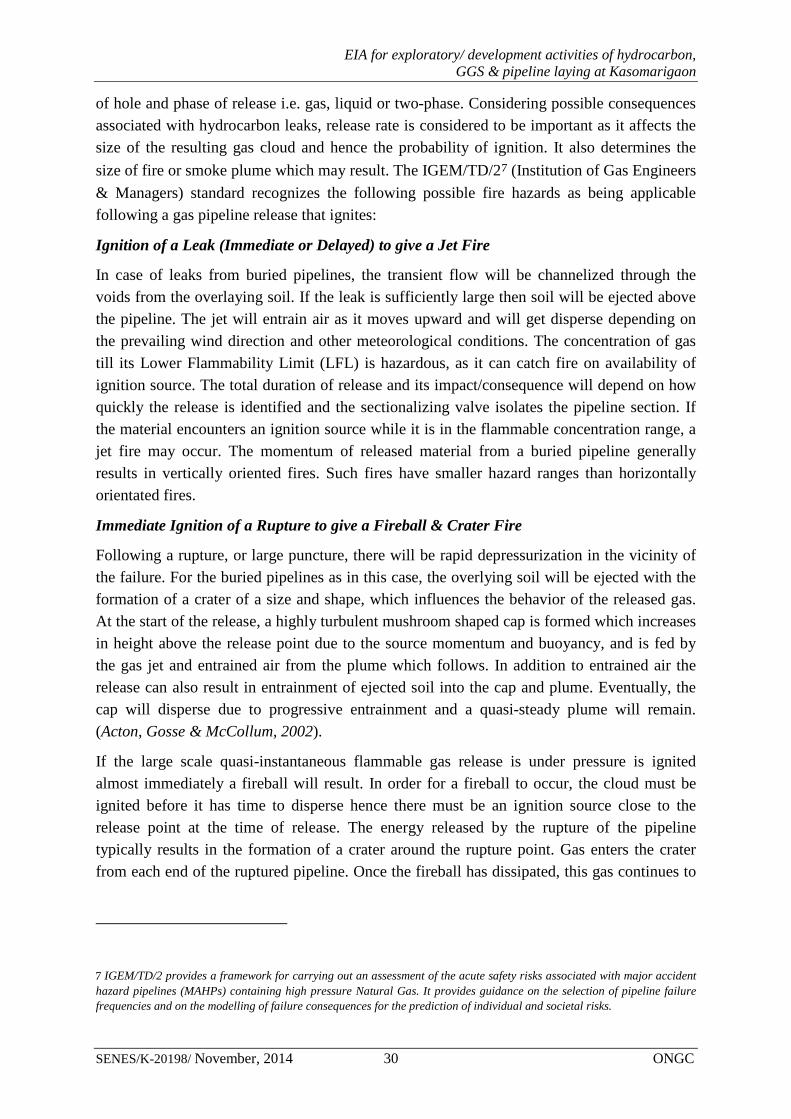
In view of the transportation of natural gas generated from development wells to GGS via pipeline network an effort has also been made to understand the primary failure frequencies of gas pipeline which is the result of the number of incidents within a period divided by the corresponding total system exposure. Based on the EGIG database the evolution of the primary failure frequencies over the entire period and for the last five years has been provided in Table 1.12 below.
Flash Fires
The buoyancy of natural gas and momentum of the high pressure release tend to propel the gas away from ground level within a relatively short distance from the source. This means that it is highly unlikely that flammable concentrations of gas will be produced at ground level beyond a short distance from the source. For this reason, flash fires are not included within the QRA.
Pipeline Failure – Frequency Analysis
In view of the transportation of natural gas generated from development wells to GGS via pipeline network an effort has also been made to understand the primary failure frequencies of gas pipeline which is the result of the number of incidents within a period divided by the corresponding total system exposure. Based on the EGIG database the evolution of the primary failure frequencies over the entire period and for the last five years has been provided in Table 1.12 below.
TABLE 1-12: PRIMARY GAS PIPELINE FAILURE FREQUENCY
Period Interval No. of
Incidents Total System
Exposure (km.yr) Primary failure frequency
(1000 km.yr)
1970-2010 41 years 1249 3.55.106 0.351
1970-2007 38 years 1173 3.15.106 0.372
1971-2010 40 years 1222 3.52.106 0.347
1981-2010 30 years 860 3.01.106 0.286
1991-2010 20 years 460 2.25.106 0.204
EIA for exploratory/ development activities of hydrocarbon, GGS & pipeline laying at Kasomarigaon
SENES/K-20198/ November, 2014 32 ONGC
Period Interval No. of
Incidents Total System
Exposure (km.yr) Primary failure frequency
(1000 km.yr)
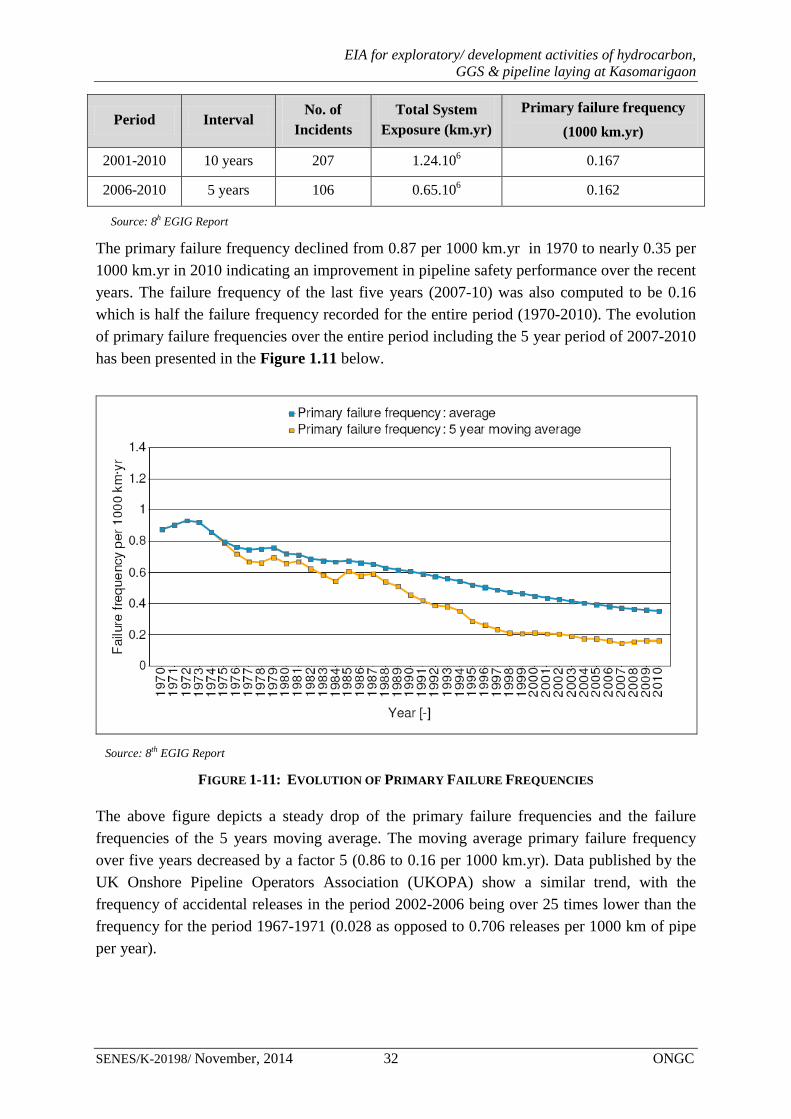
2001-2010 10 years 207 1.24.106 0.167
2006-2010 5 years 106 0.65.106 0.162
Source: 8h EGIG Report
The primary failure frequency declined from 0.87 per 1000 km.yr in 1970 to nearly 0.35 per 1000 km.yr in 2010 indicating an improvement in pipeline safety performance over the recent years. The failure frequency of the last five years (2007-10) was also computed to be 0.16 which is half the failure frequency recorded for the entire period (1970-2010). The evolution of primary failure frequencies over the entire period including the 5 year period of 2007-2010 has been presented in the Figure 1.11 below.
Source: 8th EGIG Report
FIGURE 1-11: EVOLUTION OF PRIMARY FAILURE FREQUENCIES
The above figure depicts a steady drop of the primary failure frequencies and the failure frequencies of the 5 years moving average. The moving average primary failure frequency over five years decreased by a factor 5 (0.86 to 0.16 per 1000 km.yr). Data published by the UK Onshore Pipeline Operators Association (UKOPA) show a similar trend, with the frequency of accidental releases in the period 2002-2006 being over 25 times lower than the frequency for the period 1967-1971 (0.028 as opposed to 0.706 releases per 1000 km of pipe per year).
EIA for exploratory/ development activities of hydrocarbon, GGS & pipeline laying at Kasomarigaon
SENES/K-20198/ November, 2014 33 ONGC
Pipeline Failure Frequency Analysis – Incident Causes
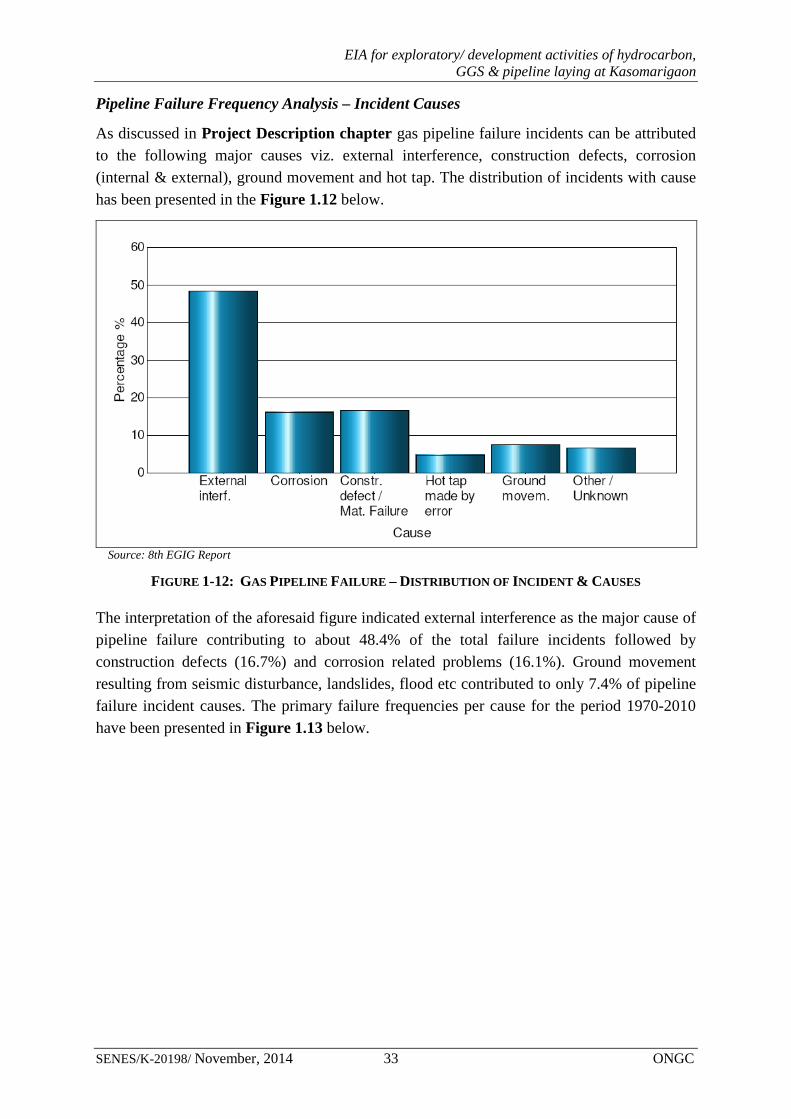
As discussed in Project Description chapter gas pipeline failure incidents can be attributed to the following major causes viz. external interference, construction defects, corrosion (internal & external), ground movement and hot tap. The distribution of incidents with cause has been presented in the Figure 1.12 below.
Source: 8th EGIG Report
FIGURE 1-12: GAS PIPELINE FAILURE – DISTRIBUTION OF INCIDENT & CAUSES
The interpretation of the aforesaid figure indicated external interference as the major cause of pipeline failure contributing to about 48.4% of the total failure incidents followed by construction defects (16.7%) and corrosion related problems (16.1%). Ground movement resulting from seismic disturbance, landslides, flood etc contributed to only 7.4% of pipeline failure incident causes. The primary failure frequencies per cause for the period 1970-2010 have been presented in Figure 1.13 below.
EIA for exploratory/ development activities of hydrocarbon, GGS & pipeline laying at Kasomarigaon
SENES/K-20198/ November, 2014 34 ONGC
Source: 8th EGIG Report
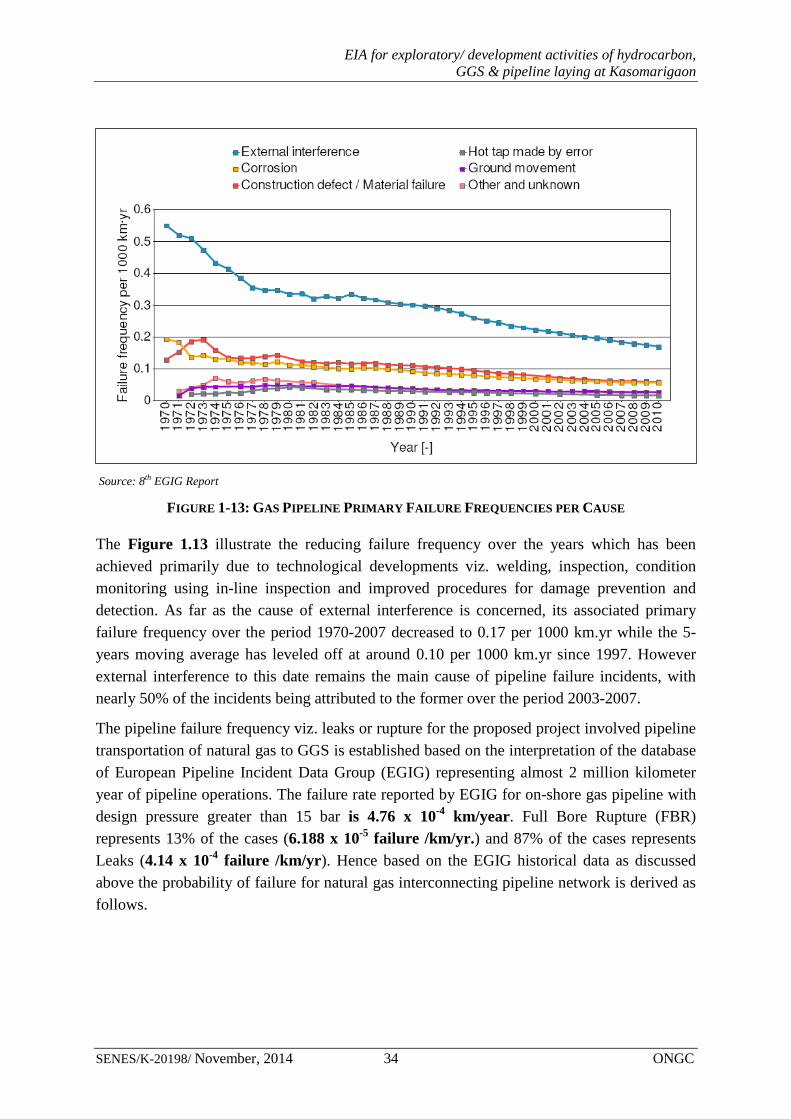
FIGURE 1-13: GAS PIPELINE PRIMARY FAILURE FREQUENCIES PER CAUSE
The Figure 1.13 illustrate the reducing failure frequency over the years which has been achieved primarily due to technological developments viz. welding, inspection, condition monitoring using in-line inspection and improved procedures for damage prevention and detection. As far as the cause of external interference is concerned, its associated primary failure frequency over the period 1970-2007 decreased to 0.17 per 1000 km.yr while the 5-years moving average has leveled off at around 0.10 per 1000 km.yr since 1997. However external interference to this date remains the main cause of pipeline failure incidents, with nearly 50% of the incidents being attributed to the former over the period 2003-2007.
The pipeline failure frequency viz. leaks or rupture for the proposed project involved pipeline transportation of natural gas to GGS is established based on the interpretation of the database of European Pipeline Incident Data Group (EGIG) representing almost 2 million kilometer year of pipeline operations. The failure rate reported by EGIG for on-shore gas pipeline with design pressure greater than 15 bar is 4.76 x 10⁻⁴ km/year. Full Bore Rupture (FBR) represents 13% of the cases (6.188 x 10⁻⁵ failure /km/yr.) and 87% of the cases represents Leaks (4.14 x 10⁻⁴ failure /km/yr). Hence based on the EGIG historical data as discussed above the probability of failure for natural gas interconnecting pipeline network is derived as follows.
EIA for exploratory/ development activities of hydrocarbon, GGS & pipeline laying at Kasomarigaon
SENES/K-20198/ November, 2014 35 ONGC
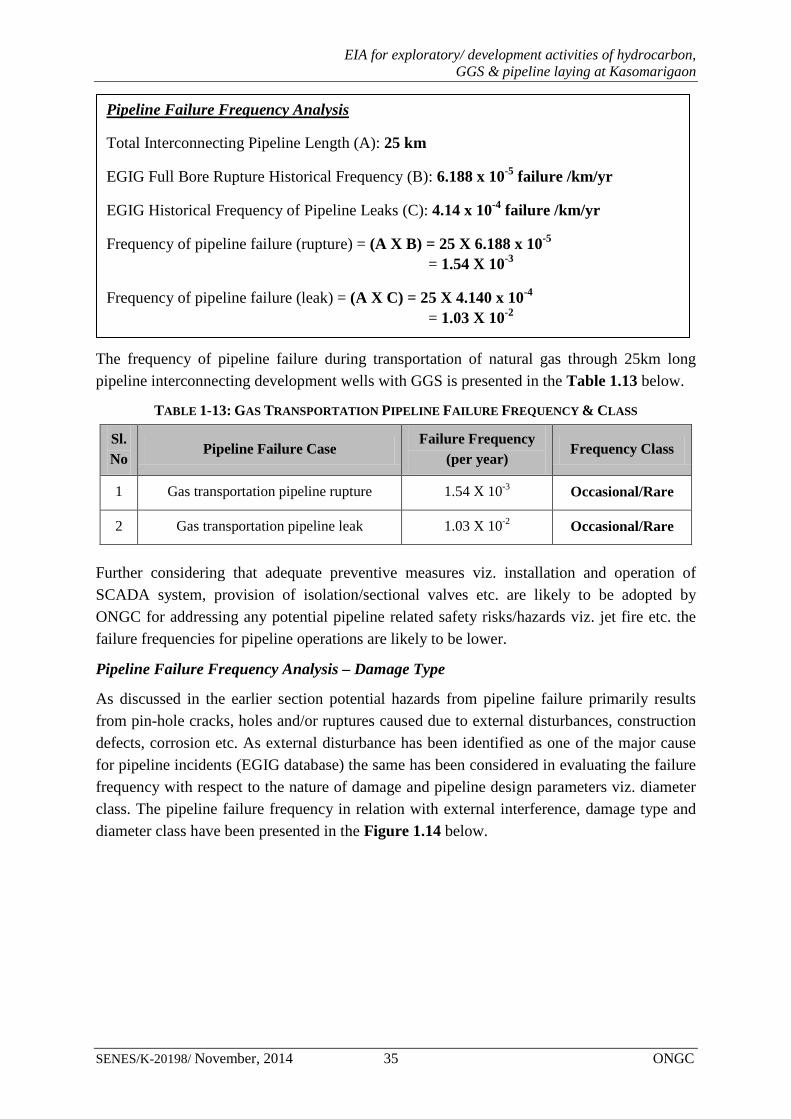
The frequency of pipeline failure during transportation of natural gas through 25km long pipeline interconnecting development wells with GGS is presented in the Table 1.13 below.
TABLE 1-13: GAS TRANSPORTATION PIPELINE FAILURE FREQUENCY & CLASS
Sl.No
Pipeline Failure Case Failure Frequency
(per year) Frequency Class
1 Gas transportation pipeline rupture 1.54 X 10⁻³ Occasional/Rare
2 Gas transportation pipeline leak 1.03 X 10⁻² Occasional/Rare
Further considering that adequate preventive measures viz. installation and operation of SCADA system, provision of isolation/sectional valves etc. are likely to be adopted by ONGC for addressing any potential pipeline related safety risks/hazards viz. jet fire etc. the failure frequencies for pipeline operations are likely to be lower.
Pipeline Failure Frequency Analysis – Damage Type
As discussed in the earlier section potential hazards from pipeline failure primarily results from pin-hole cracks, holes and/or ruptures caused due to external disturbances, construction defects, corrosion etc. As external disturbance has been identified as one of the major cause for pipeline incidents (EGIG database) the same has been considered in evaluating the failure frequency with respect to the nature of damage and pipeline design parameters viz. diameter class. The pipeline failure frequency in relation with external interference, damage type and diameter class have been presented in the Figure 1.14 below.
Pipeline Failure Frequency Analysis
Total Interconnecting Pipeline Length (A): 25 km
EGIG Full Bore Rupture Historical Frequency (B): 6.188 x 10⁻⁵ failure /km/yr
EGIG Historical Frequency of Pipeline Leaks (C): 4.14 x 10⁻⁴ failure /km/yr
Frequency of pipeline failure (rupture) = (A X B) = 25 X 6.188 x 10-5
= 1.54 X 10⁻³
Frequency of pipeline failure (leak) = (A X C) = 25 X 4.140 x 10-4
= 1.03 X 10⁻²
EIA for exploratory/ development activities of hydrocarbon, GGS & pipeline laying at Kasomarigaon
SENES/K-20198/ November, 2014 36 ONGC
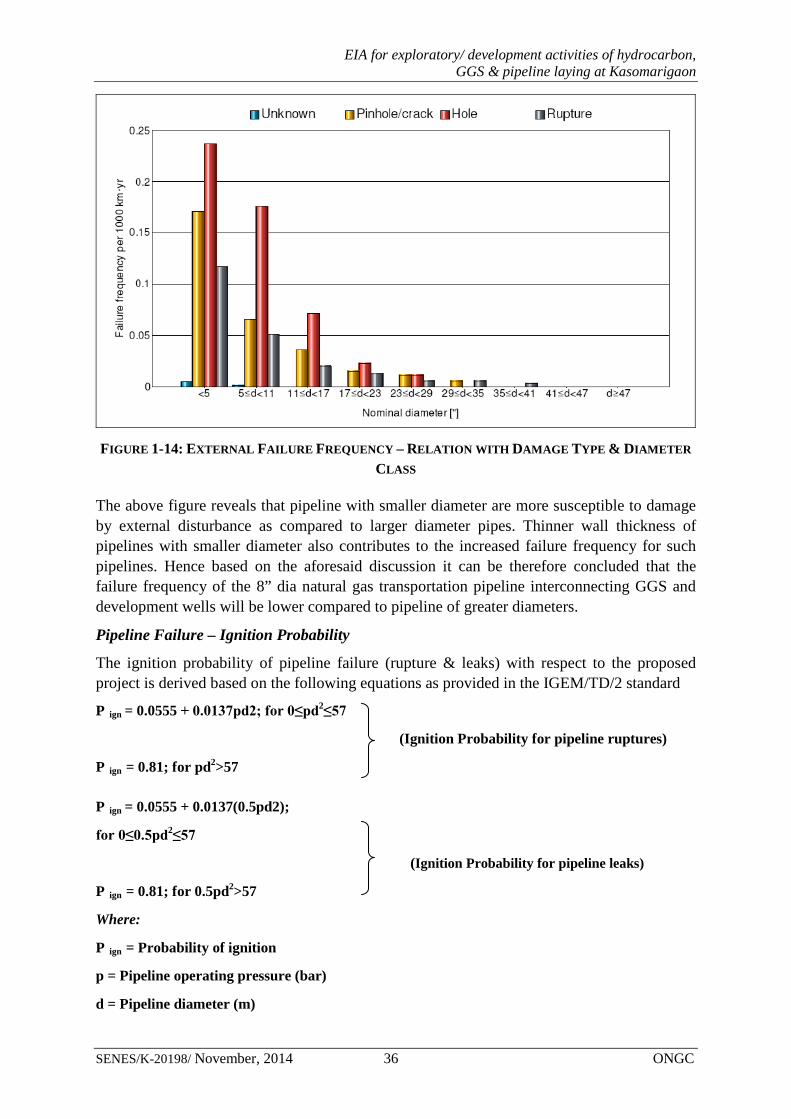
FIGURE 1-14: EXTERNAL FAILURE FREQUENCY – RELATION WITH DAMAGE TYPE & DIAMETER
CLASS
The above figure reveals that pipeline with smaller diameter are more susceptible to damage by external disturbance as compared to larger diameter pipes. Thinner wall thickness of pipelines with smaller diameter also contributes to the increased failure frequency for such pipelines. Hence based on the aforesaid discussion it can be therefore concluded that the failure frequency of the 8” dia natural gas transportation pipeline interconnecting GGS and development wells will be lower compared to pipeline of greater diameters.
Pipeline Failure – Ignition Probability
The ignition probability of pipeline failure (rupture & leaks) with respect to the proposed project is derived based on the following equations as provided in the IGEM/TD/2 standard
P ign = 0.0555 + 0.0137pd2; for 0≤pd2≤57
(Ignition Probability for pipeline ruptures)
P ign = 0.81; for pd2>57
P ign = 0.0555 + 0.0137(0.5pd2);
for 0≤0.5pd2≤57
(Ignition Probability for pipeline leaks)
P ign = 0.81; for 0.5pd2>57
Where:
P ign = Probability of ignition
p = Pipeline operating pressure (bar)
d = Pipeline diameter (m)
EIA for exploratory/ development activities of hydrocarbon, GGS & pipeline laying at Kasomarigaon
SENES/K-20198/ November, 2014 37 ONGC
The above equations have been used in computing the ignition probability arising from failure of various diameter pipelines to be utilized in the natural gas transportation from development wells to GGS. The ignition probability of natural gas from transportation pipeline failure (leak and rupture) at specific operating pressure (15 bar) have been presented in the Table 1.14 below.
TABLE 1-14: IGNITION PROBABILITY – GAS TRANSPORTATION PIPELINE FAILURE
Pipeline dia (inch)
Pipeline dia (m)
Pressure (bar)
Pipeline rupture (pd2)
Pipeline leak (0.5 pd2)
Ignition Probability
Rupture Leak
8.00 0.20 15.69 0.6276 0.3138 6.40 X 10⁻² 5.98 X 10⁻²
The finding is further supported by the EGIG database which reported an ignition probability of 10% and 33% for leaks/rupture size of ≤16 inches and >16 inches respectively.
Pipeline Failure – Consequence Analysis
Pipeline generally contains large inventories of oil or gas under high pressure; although accidental releases from them are remote they have the potential of catastrophic or major consequences if related risks are not adequately analyzed or controlled. The consequences of possible pipeline failure is generally predicted based on the hypothetical failure scenario considered and defining parameters such as meteorological conditions (stability class), leak hole & rupture size and orientation, pipeline pressure & temperature, physicochemical properties of chemicals released etc. In accordance to the 8th EGIG report of the total no of 1249 incident recorded during the study period (197—2010) only 7 fatalities were reported of which two were general public/community.
As discussed in Project Description chapter, jet fire and fireball/crater fire have been identified as the possible consequences resulting from the gas pipeline failure and is dependent on the ignition time. Jet fires are generally burning jet of gas or spray of atomized liquid released from high pressure equipment. This may be very damaging to equipment within the fire, and lethal to personnel and local communities at some distance. Taking into account the low density (approx 0.68) of methane a major constituent of natural gas any formation of flammable vapour cloud leading to explosion is unlikely.
Taking into account the above pipeline failure consequences and frequency analysis as discussed above following hypothetical risk scenarios (Table 1.15) have been considered for failure consequence modeling with respect to pipeline operations of the project:
EIA for exploratory/ development activities of hydrocarbon, GGS & pipeline laying at Kasomarigaon
SENES/K-20198/ November, 2014 38 ONGC
TABLE 1-15: HYPOTHETICAL FAILURE CASES –PIPELINE TRANSPORTATION RISK MODELING
Case No
Pipeline Failure Case Hole Size
(inch)
Design pressure
(bar)
Pipeline temperature
(°C) Scenario Description
I 8” pipeline leak
1.00
15 50
Formation of jet fire
II 2.00 Formation of jet fire
III 8” pipeline rupture 8.00 Formation of jet fire
The above risk scenarios for pipeline failure are modeled using ALOHA8 and interpreted in terms of Thermal Radiation Level of Concern (LOC). Predominant local meteorological conditions as specified in the baseline chapter have also been considered in modeling the pipeline risks using ALOHA.
Thermal Radiation Level of Concern (LOC) is a threshold level of thermal radiation, usually the level above which a hazard may exist. For each LOC chosen, ALOHA estimates a threat zone where the thermal radiation is predicted to exceed that LOC at some time after a release begins. These zones are displayed on a single Threat Zone plot displayed as red, orange and yellow with red representing the worst hazard. The threat zone displayed by ALOHA represent thermal radiation levels and also indicates the effects on people who are exposed to those thermal radiation levels but are able to seek shelter within one minute. ALOHA uses three threshold values (measured in kilowatts per square meter) to create the default threat zones:
Red: 10 kW/ (sq m) -- potentially lethal within 60 sec;
Orange: 5 kW/ (sq m) -- second-degree burns within 60 sec; and
Yellow: 2 kW/ (sq m) -- pain within 60 sec
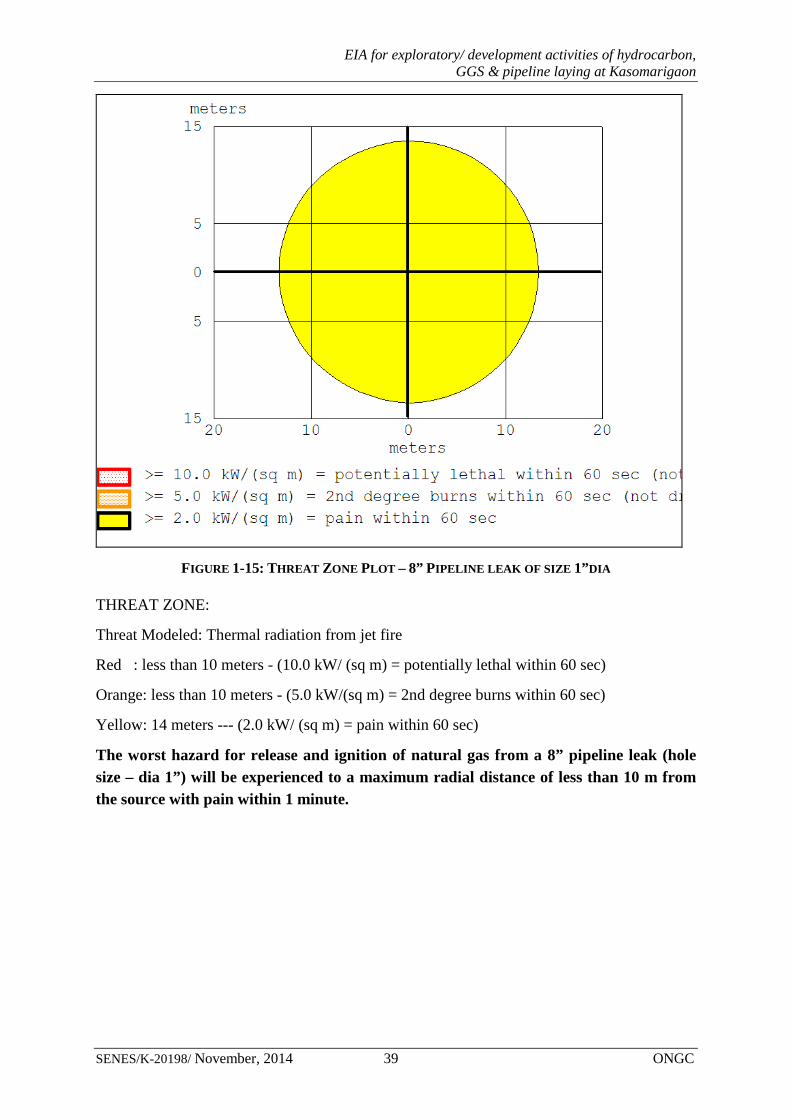
Case 1: Release of natural gas from 8” dia pipeline failure –leak hole size (dia 1”)
The threat zone plot for release and ignition of flammable natural gas from a 8” pipeline leak of hole size – 1” dia is represented in Figure 1.15 below.
8 ALOHA is a public domain computer code that is part of a system of software that is known as the Computer-Aided Management of Emergency Operations (CAMEO) that was developed by the United States Environmental Protection Agency (EPA), through its Chemical Emergency Preparedness and Prevention Office (CEPPO) to plan for and respond to chemical emergencies
EIA for exploratory/ development activities of hydrocarbon, GGS & pipeline laying at Kasomarigaon
SENES/K-20198/ November, 2014 39 ONGC
FIGURE 1-15: THREAT ZONE PLOT – 8” PIPELINE LEAK OF SIZE 1”DIA
THREAT ZONE:
Threat Modeled: Thermal radiation from jet fire
Red : less than 10 meters - (10.0 kW/ (sq m) = potentially lethal within 60 sec)
Orange: less than 10 meters - (5.0 kW/(sq m) = 2nd degree burns within 60 sec)
Yellow: 14 meters --- (2.0 kW/ (sq m) = pain within 60 sec)
The worst hazard for release and ignition of natural gas from a 8” pipeline leak (hole size – dia 1”) will be experienced to a maximum radial distance of less than 10 m from the source with pain within 1 minute.
EIA for exploratory/ development activities of hydrocarbon, GGS & pipeline laying at Kasomarigaon
SENES/K-20198/ November, 2014 40 ONGC
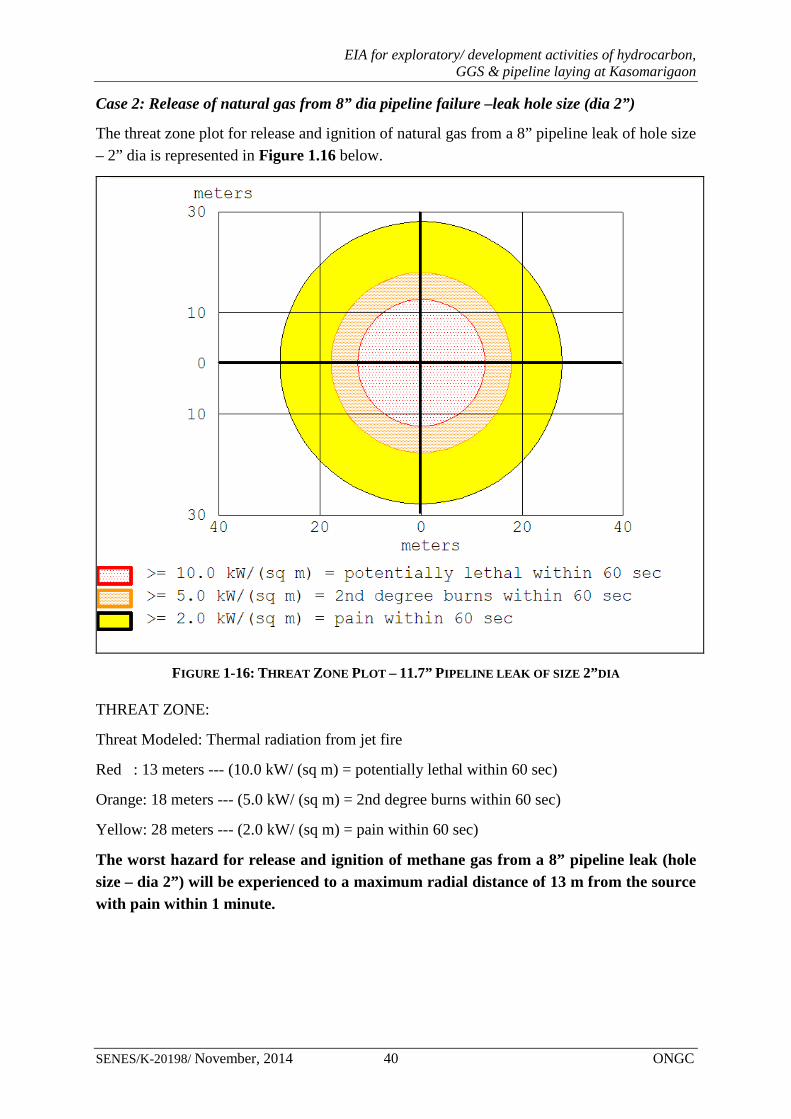
Case 2: Release of natural gas from 8” dia pipeline failure –leak hole size (dia 2”)
The threat zone plot for release and ignition of natural gas from a 8” pipeline leak of hole size – 2” dia is represented in Figure 1.16 below.
FIGURE 1-16: THREAT ZONE PLOT – 11.7” PIPELINE LEAK OF SIZE 2”DIA
THREAT ZONE:
Threat Modeled: Thermal radiation from jet fire
Red : 13 meters --- (10.0 kW/ (sq m) = potentially lethal within 60 sec)
Orange: 18 meters --- (5.0 kW/ (sq m) = 2nd degree burns within 60 sec)
Yellow: 28 meters --- (2.0 kW/ (sq m) = pain within 60 sec)
The worst hazard for release and ignition of methane gas from a 8” pipeline leak (hole size – dia 2”) will be experienced to a maximum radial distance of 13 m from the source with pain within 1 minute.
EIA for exploratory/ development activities of hydrocarbon, GGS & pipeline laying at Kasomarigaon
SENES/K-20198/ November, 2014 41 ONGC
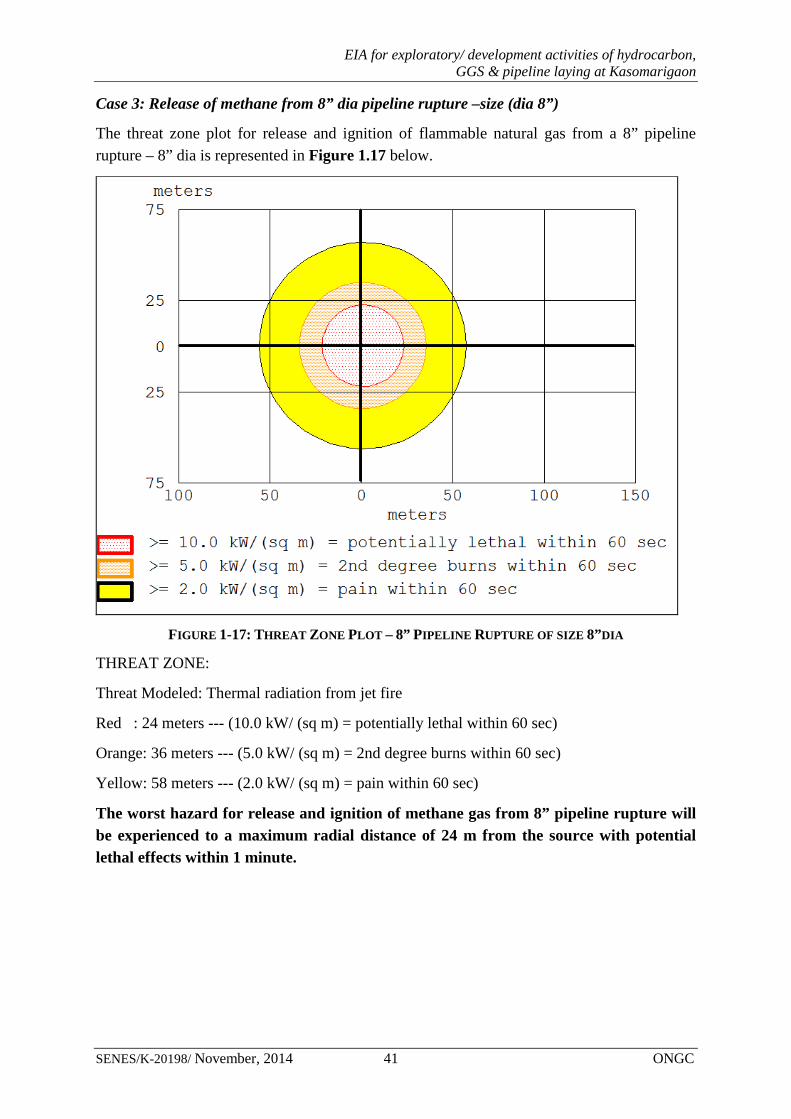
Case 3: Release of methane from 8” dia pipeline rupture –size (dia 8”)
The threat zone plot for release and ignition of flammable natural gas from a 8” pipeline rupture – 8” dia is represented in Figure 1.17 below.
FIGURE 1-17: THREAT ZONE PLOT – 8” PIPELINE RUPTURE OF SIZE 8”DIA
THREAT ZONE:
Threat Modeled: Thermal radiation from jet fire
Red : 24 meters --- (10.0 kW/ (sq m) = potentially lethal within 60 sec)
Orange: 36 meters --- (5.0 kW/ (sq m) = 2nd degree burns within 60 sec)
Yellow: 58 meters --- (2.0 kW/ (sq m) = pain within 60 sec)
The worst hazard for release and ignition of methane gas from 8” pipeline rupture will be experienced to a maximum radial distance of 24 m from the source with potential lethal effects within 1 minute.
EIA for exploratory/ development activities of hydrocarbon, GGS & pipeline laying at Kasomarigaon
SENES/K-20198/ November, 2014 42 ONGC
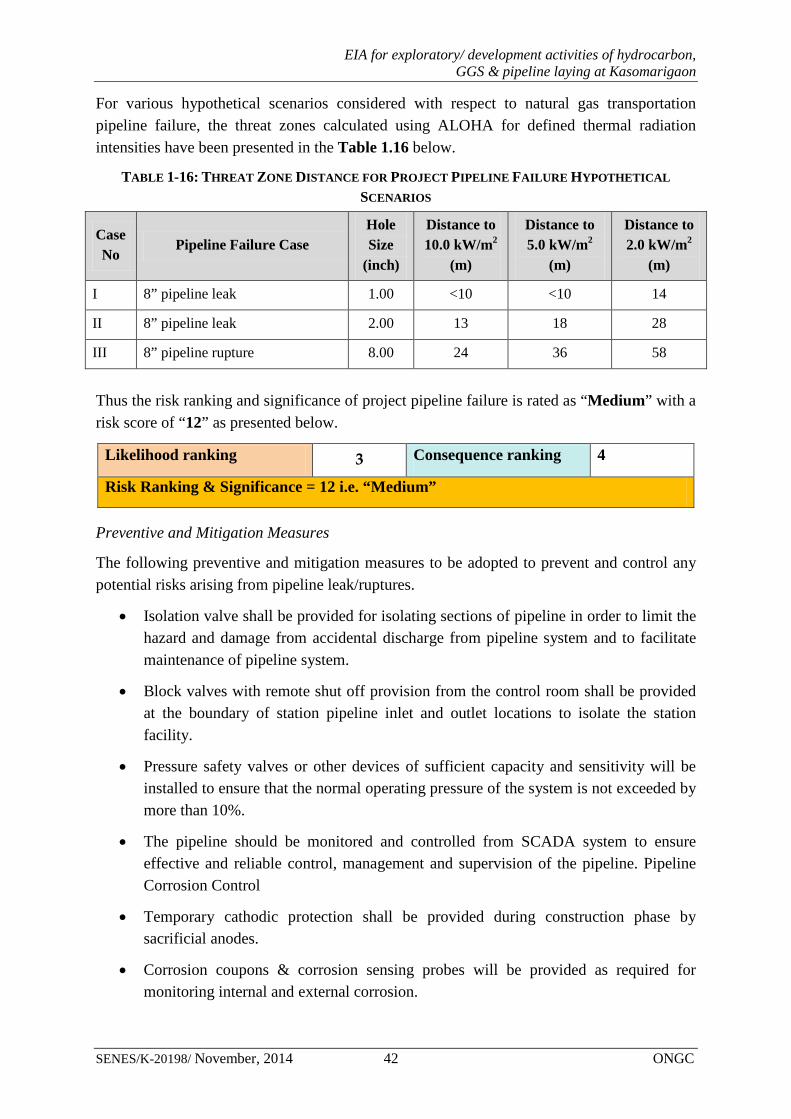
For various hypothetical scenarios considered with respect to natural gas transportation pipeline failure, the threat zones calculated using ALOHA for defined thermal radiation intensities have been presented in the Table 1.16 below.
TABLE 1-16: THREAT ZONE DISTANCE FOR PROJECT PIPELINE FAILURE HYPOTHETICAL
SCENARIOS
Case No
Pipeline Failure Case Hole Size
(inch)
Distance to 10.0 kW/m2
(m)
Distance to 5.0 kW/m2
(m)
Distance to 2.0 kW/m2
(m)
I 8” pipeline leak 1.00 <10 <10 14
II 8” pipeline leak 2.00 13 18 28
III 8” pipeline rupture 8.00 24 36 58
Thus the risk ranking and significance of project pipeline failure is rated as “Medium” with a risk score of “12” as presented below.
Likelihood ranking 3 Consequence ranking 4
Risk Ranking & Significance = 12 i.e. “Medium”
Preventive and Mitigation Measures
The following preventive and mitigation measures to be adopted to prevent and control any potential risks arising from pipeline leak/ruptures.
• Isolation valve shall be provided for isolating sections of pipeline in order to limit the hazard and damage from accidental discharge from pipeline system and to facilitate maintenance of pipeline system.
• Block valves with remote shut off provision from the control room shall be provided at the boundary of station pipeline inlet and outlet locations to isolate the station facility.
• Pressure safety valves or other devices of sufficient capacity and sensitivity will be installed to ensure that the normal operating pressure of the system is not exceeded by more than 10%.
• The pipeline should be monitored and controlled from SCADA system to ensure effective and reliable control, management and supervision of the pipeline. Pipeline Corrosion Control
• Temporary cathodic protection shall be provided during construction phase by sacrificial anodes.
• Corrosion coupons & corrosion sensing probes will be provided as required for monitoring internal and external corrosion.
EIA for exploratory/ development activities of hydrocarbon, GGS & pipeline laying at Kasomarigaon
SENES/K-20198/ November, 2014 43 ONGC
1.2 DISASTER MANAGEMENT PLAN
1.2.1 Objective
The primary objective of the DMP is to provide a safe, timely, effective and coordinated response by the onsite Emergency Response Team (ERT), along with the other local and government agencies/departments to prevent or minimize any major emergencies that may arise from possible failures/risks viz. blow outs, oil spill, fire & explosion etc. associated with exploratory and development drilling.
The main objectives of this plan are:
• To minimize the risk for human life, environment and common property resources, by means of an effective and efficient intervention;
• Protection of the environment;
• Protection of public safety;
• To initiate the early and efficient response throughout the utilization of all available resources.
1.2.2 Purpose
The purpose of the DMP is to effectively manage and control the emergencies occurring during project operations. This DMP ensures,
• emergency response group is effective & adequate;
• clear roles and responsibilities of key personnel & support groups;
• availability and adequacy of emergency infrastructure & resources; and
• efficient emergency communication
1.2.3 Emergency Classification
Due consideration is given to the severity of potential emergency situation that may arise as a result of storage tank and pipeline accident events as discussed in the Quantitative Risk Analysis (QRA) study. Not all emergency situations call for mobilization of same resources or emergency actions and therefore, the emergencies are classified into three levels depending on their severity and potential impact, so that appropriate emergency response procedures can be effectively implemented by the ONGC Emergency/Crisis Management Team. The emergency levels/tiers defined with respect to this project based on their severity have been discussed in the subsequent sections with 'decision tree' for emergency classification being depicted in Figure 1.18.
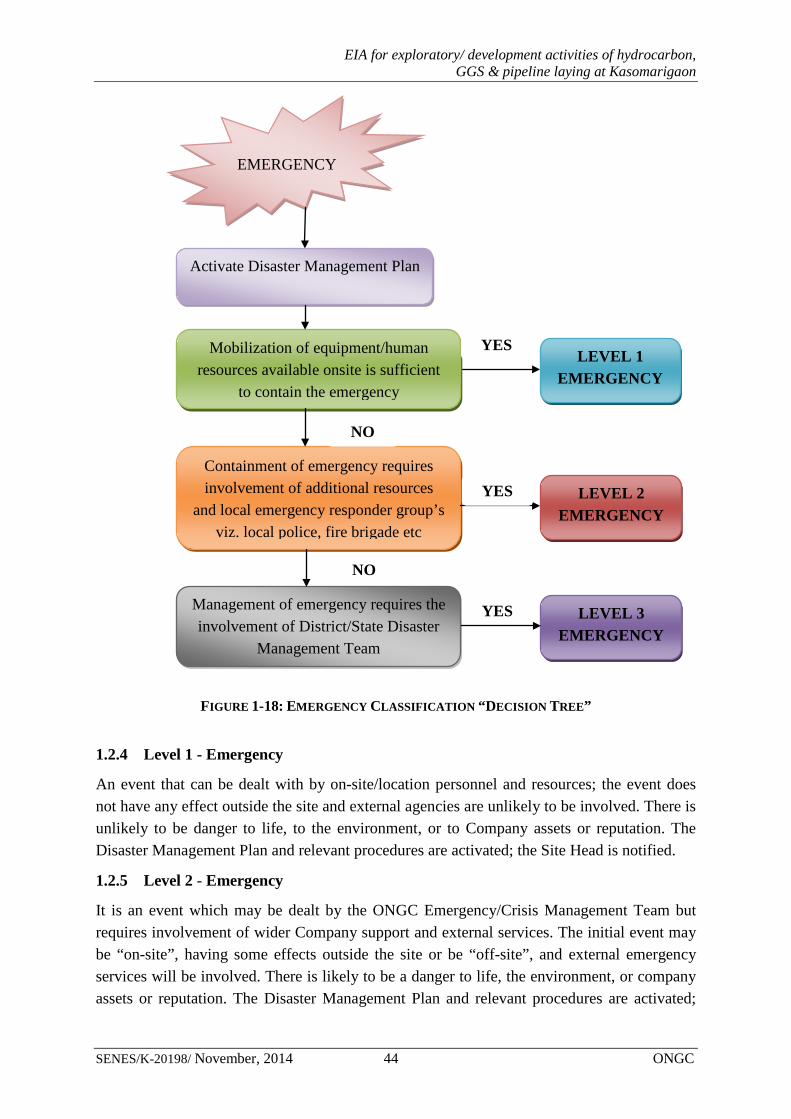
EIA for exploratory/ development activities of hydrocarbon, GGS & pipeline laying at Kasomarigaon
SENES/K-20198/ November, 2014 44 ONGC
FIGURE 1-18: EMERGENCY CLASSIFICATION “DECISION TREE”
1.2.4 Level 1 - Emergency
An event that can be dealt with by on-site/location personnel and resources; the event does not have any effect outside the site and external agencies are unlikely to be involved. There is unlikely to be danger to life, to the environment, or to Company assets or reputation. The Disaster Management Plan and relevant procedures are activated; the Site Head is notified.
1.2.5 Level 2 - Emergency
It is an event which may be dealt by the ONGC Emergency/Crisis Management Team but requires involvement of wider Company support and external services. The initial event may be “on-site”, having some effects outside the site or be “off-site”, and external emergency services will be involved. There is likely to be a danger to life, the environment, or company assets or reputation. The Disaster Management Plan and relevant procedures are activated;
EMERGENCY
Activate Disaster Management Plan
Mobilization of equipment/human resources available onsite is sufficient
to contain the emergency
Containment of emergency requires involvement of additional resources
and local emergency responder group’s viz. local police, fire brigade etc
NO
YES LEVEL 1
EMERGENCY
YES LEVEL 2 EMERGENCY
Management of emergency requires the involvement of District/State Disaster
Management Team
NO
YES LEVEL 3 EMERGENCY
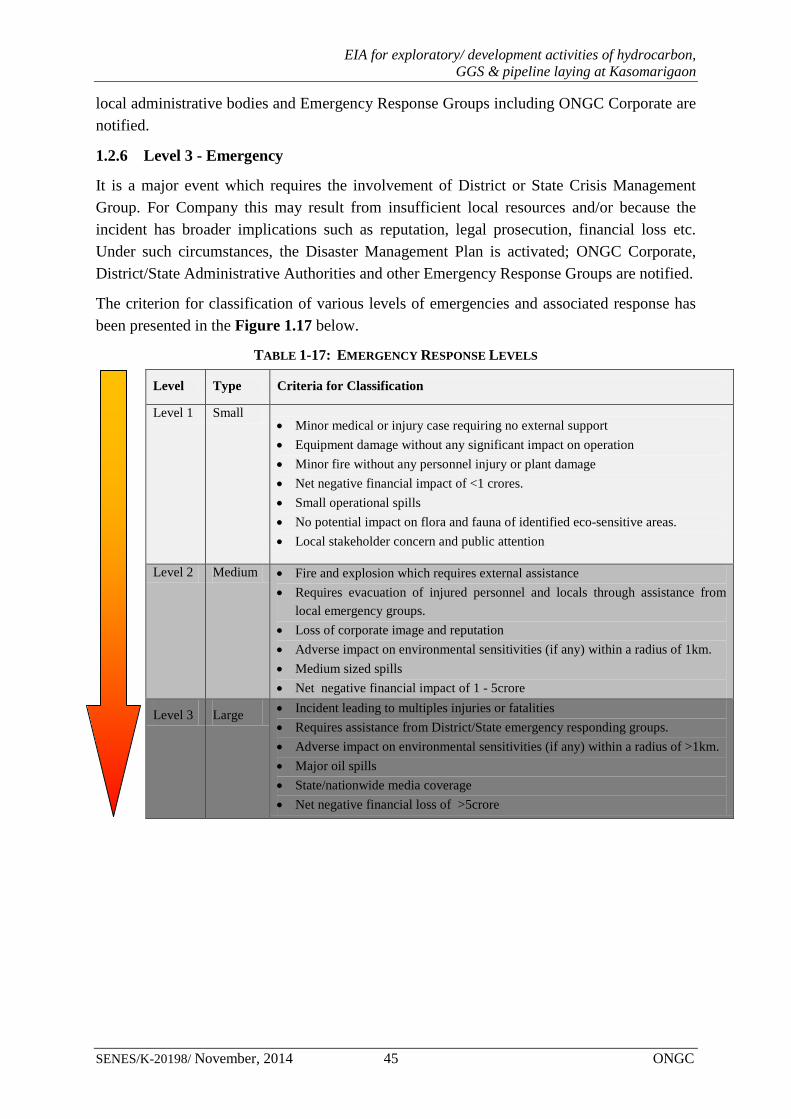
EIA for exploratory/ development activities of hydrocarbon, GGS & pipeline laying at Kasomarigaon
SENES/K-20198/ November, 2014 45 ONGC
local administrative bodies and Emergency Response Groups including ONGC Corporate are notified.
1.2.6 Level 3 - Emergency
It is a major event which requires the involvement of District or State Crisis Management Group. For Company this may result from insufficient local resources and/or because the incident has broader implications such as reputation, legal prosecution, financial loss etc. Under such circumstances, the Disaster Management Plan is activated; ONGC Corporate, District/State Administrative Authorities and other Emergency Response Groups are notified.
The criterion for classification of various levels of emergencies and associated response has been presented in the Figure 1.17 below.
TABLE 1-17: EMERGENCY RESPONSE LEVELS Level Type Criteria for Classification
Level 1 Small • Minor medical or injury case requiring no external support • Equipment damage without any significant impact on operation • Minor fire without any personnel injury or plant damage • Net negative financial impact of <1 crores. • Small operational spills • No potential impact on flora and fauna of identified eco-sensitive areas. • Local stakeholder concern and public attention
Level 2 Medium • Fire and explosion which requires external assistance • Requires evacuation of injured personnel and locals through assistance from
local emergency groups. • Loss of corporate image and reputation • Adverse impact on environmental sensitivities (if any) within a radius of 1km. • Medium sized spills • Net negative financial impact of 1 - 5crore
Level 3 Large • Incident leading to multiples injuries or fatalities • Requires assistance from District/State emergency responding groups. • Adverse impact on environmental sensitivities (if any) within a radius of >1km. • Major oil spills • State/nationwide media coverage • Net negative financial loss of >5crore
EIA for exploratory/ development activities of hydrocarbon, GGS & pipeline laying at Kasomarigaon
SENES/K-20198/ November, 2014 46 ONGC
1.3 ONGC DISASTER MANAGEMENT PLAN
ONGC has in place a Disaster Management Plan which has been developed to set up the appropriate mechanism and course of action to mitigate the impact of an Emergency event viz. blow out, fire, explosion etc. The plan provides a procedure allowing all those involved in and outside ONGC to mobilize their resources in an orderly manner and react effectively in time. The plan therefore, aims at immediate response to an Emergency event to prevent escalation to a Disaster and also the response in the event of such escalation. The plan will be updated as and when necessary, but at least once in every year by Basin HSE in consultation with Surface Team, Sub surface Team, Drilling Services and Well Services Group. Also ONGC has been accredited with ISO 9001:2008; 14001:2004 and OHSAS 18001.
The roles and responsibilities of both ONGC emergency response team to combat with any emergency situation as discussed in the earlier section are presented in the Table 1.18 below while the details of the resources available onsite with the Crisis Management Team to control key emergency events particularly blow outs has been presented in Annexure 1.1.
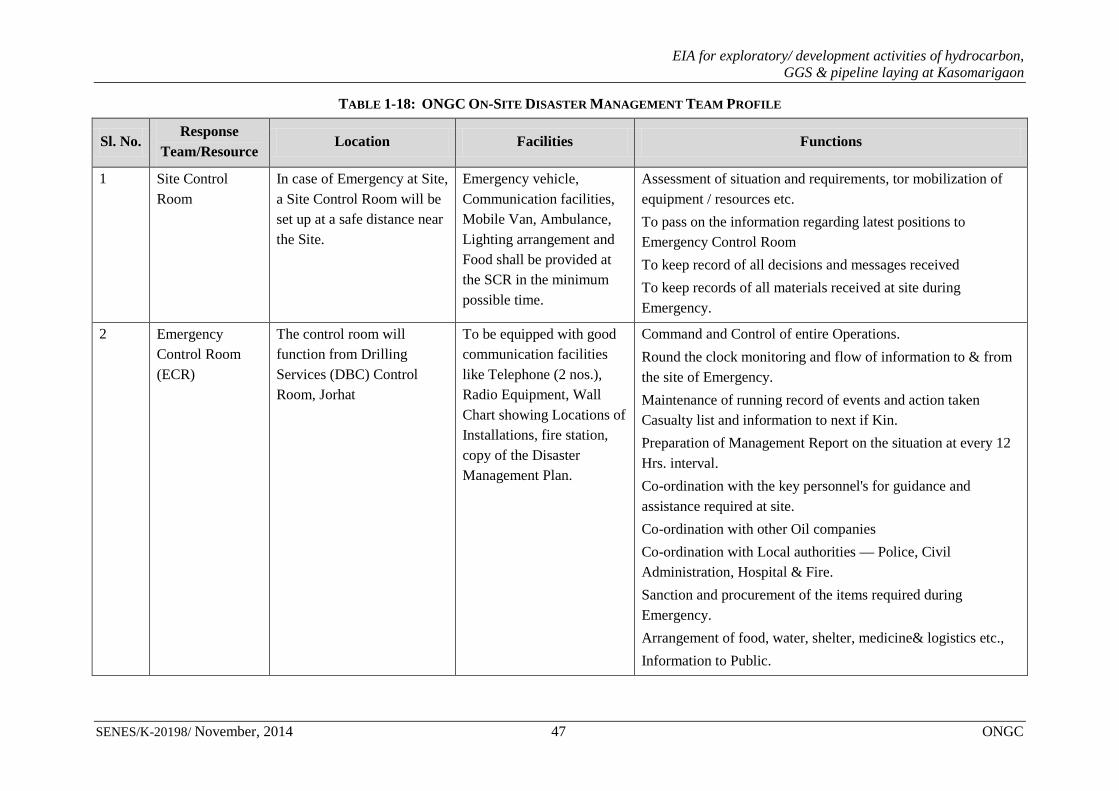
EIA for exploratory/ development activities of hydrocarbon, GGS & pipeline laying at Kasomarigaon
SENES/K-20198/ November, 2014 47 ONGC
TABLE 1-18: ONGC ON-SITE DISASTER MANAGEMENT TEAM PROFILE
Sl. No. Response
Team/Resource Location Facilities Functions
1 Site Control Room
In case of Emergency at Site, a Site Control Room will be set up at a safe distance near the Site.
Emergency vehicle, Communication facilities, Mobile Van, Ambulance, Lighting arrangement and Food shall be provided at the SCR in the minimum possible time.
Assessment of situation and requirements, tor mobilization of equipment / resources etc. To pass on the information regarding latest positions to Emergency Control Room To keep record of all decisions and messages received To keep records of all materials received at site during Emergency.
2 Emergency Control Room (ECR)
The control room will function from Drilling Services (DBC) Control Room, Jorhat
To be equipped with good communication facilities like Telephone (2 nos.), Radio Equipment, Wall Chart showing Locations of Installations, fire station, copy of the Disaster Management Plan.
Command and Control of entire Operations. Round the clock monitoring and flow of information to & from the site of Emergency. Maintenance of running record of events and action taken Casualty list and information to next if Kin. Preparation of Management Report on the situation at every 12 Hrs. interval. Co-ordination with the key personnel's for guidance and assistance required at site. Co-ordination with other Oil companies Co-ordination with Local authorities — Police, Civil Administration, Hospital & Fire. Sanction and procurement of the items required during Emergency. Arrangement of food, water, shelter, medicine& logistics etc., Information to Public.
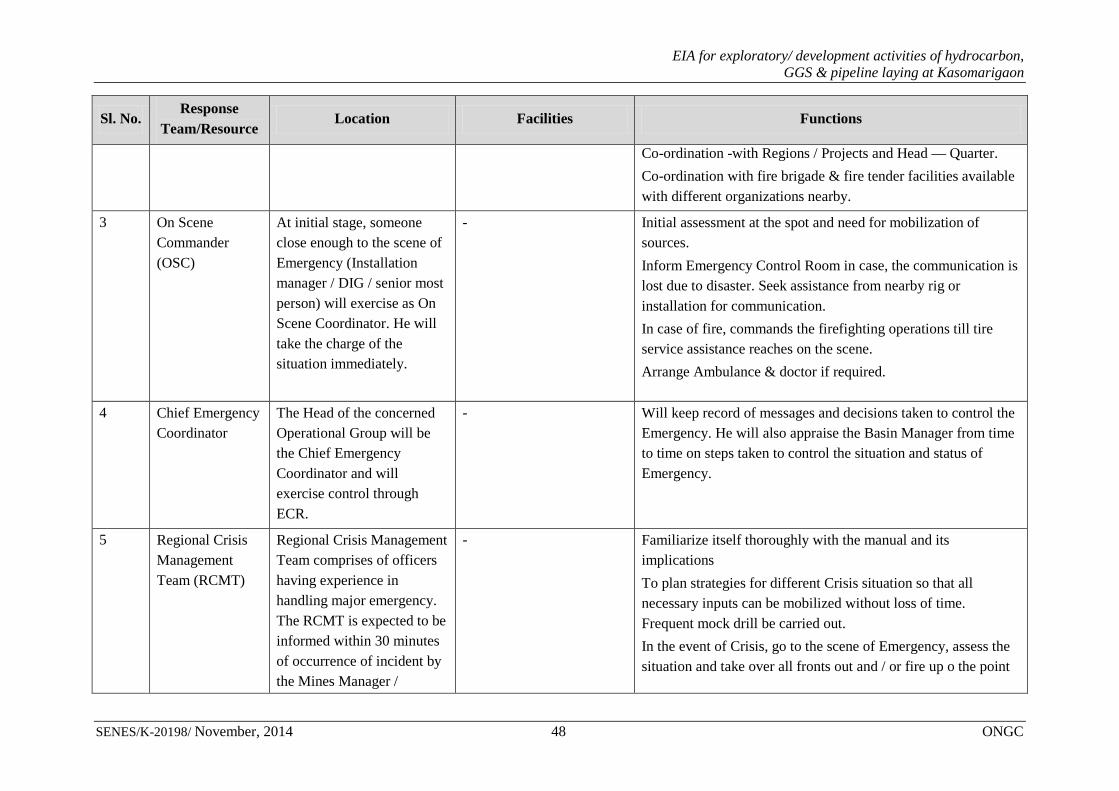
EIA for exploratory/ development activities of hydrocarbon, GGS & pipeline laying at Kasomarigaon
SENES/K-20198/ November, 2014 48 ONGC
Sl. No. Response
Team/Resource Location Facilities Functions
Co-ordination -with Regions / Projects and Head — Quarter. Co-ordination with fire brigade & fire tender facilities available with different organizations nearby.
3 On Scene Commander (OSC)
At initial stage, someone close enough to the scene of Emergency (Installation manager / DIG / senior most person) will exercise as On Scene Coordinator. He will take the charge of the situation immediately.
- Initial assessment at the spot and need for mobilization of sources. Inform Emergency Control Room in case, the communication is lost due to disaster. Seek assistance from nearby rig or installation for communication. In case of fire, commands the firefighting operations till tire service assistance reaches on the scene. Arrange Ambulance & doctor if required.
4 Chief Emergency Coordinator
The Head of the concerned Operational Group will be the Chief Emergency Coordinator and will exercise control through ECR.
- Will keep record of messages and decisions taken to control the Emergency. He will also appraise the Basin Manager from time to time on steps taken to control the situation and status of Emergency.
5 Regional Crisis Management Team (RCMT)
Regional Crisis Management Team comprises of officers having experience in handling major emergency. The RCMT is expected to be informed within 30 minutes of occurrence of incident by the Mines Manager /
- Familiarize itself thoroughly with the manual and its implications To plan strategies for different Crisis situation so that all necessary inputs can be mobilized without loss of time. Frequent mock drill be carried out. In the event of Crisis, go to the scene of Emergency, assess the situation and take over all fronts out and / or fire up o the point
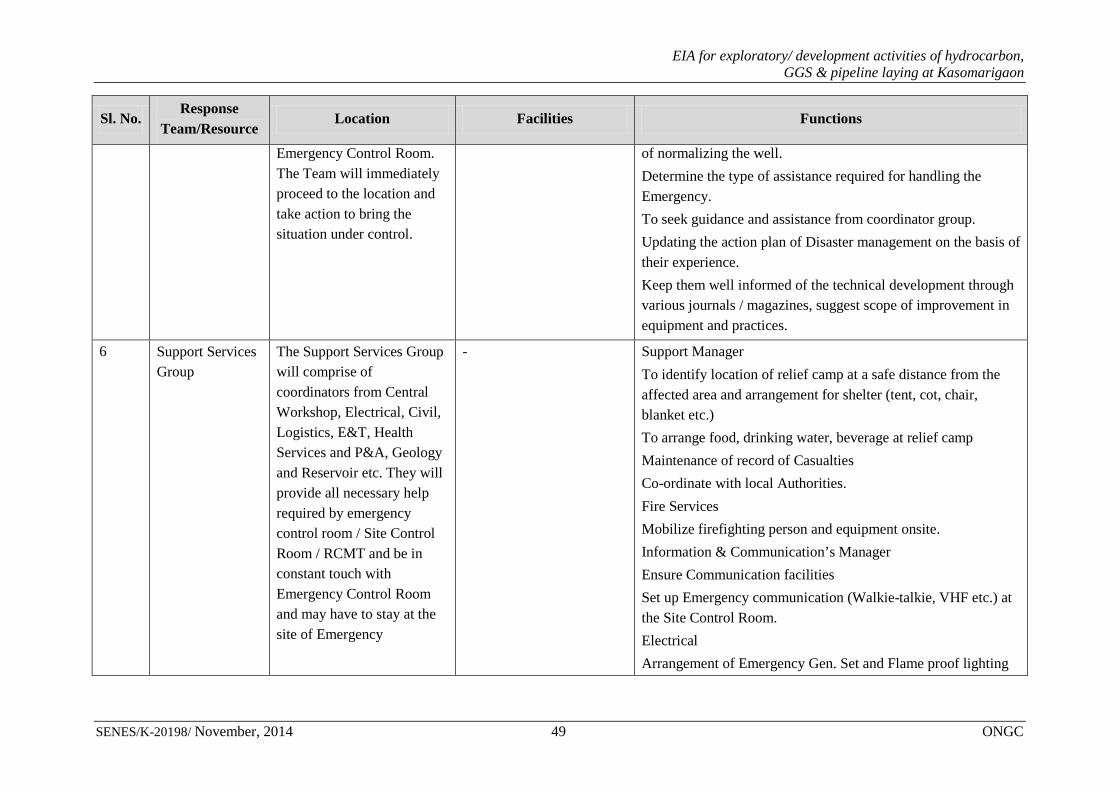
EIA for exploratory/ development activities of hydrocarbon, GGS & pipeline laying at Kasomarigaon
SENES/K-20198/ November, 2014 49 ONGC
Sl. No. Response
Team/Resource Location Facilities Functions
Emergency Control Room. The Team will immediately proceed to the location and take action to bring the situation under control.
of normalizing the well. Determine the type of assistance required for handling the Emergency. To seek guidance and assistance from coordinator group. Updating the action plan of Disaster management on the basis of their experience. Keep them well informed of the technical development through various journals / magazines, suggest scope of improvement in equipment and practices.
6 Support Services Group
The Support Services Group will comprise of coordinators from Central Workshop, Electrical, Civil, Logistics, E&T, Health Services and P&A, Geology and Reservoir etc. They will provide all necessary help required by emergency control room / Site Control Room / RCMT and be in constant touch with Emergency Control Room and may have to stay at the site of Emergency
- Support Manager To identify location of relief camp at a safe distance from the affected area and arrangement for shelter (tent, cot, chair, blanket etc.) To arrange food, drinking water, beverage at relief camp Maintenance of record of Casualties Co-ordinate with local Authorities. Fire Services Mobilize firefighting person and equipment onsite. Information & Communication’s Manager Ensure Communication facilities Set up Emergency communication (Walkie-talkie, VHF etc.) at the Site Control Room. Electrical Arrangement of Emergency Gen. Set and Flame proof lighting

EIA for exploratory/ development activities of hydrocarbon, GGS & pipeline laying at Kasomarigaon
SENES/K-20198/ November, 2014 50 ONGC
Sl. No. Response
Team/Resource Location Facilities Functions
at the site. Logistics Arrangement of transport facilities, cranes, moles etc for man and material. Material Management To assist in issuing of materials Arrangement of equipment, materials, expertise etc., as per requirement of Emergency Control Room / RCMT. Civil Civil jobs such as construction of temporary road, control of Oil spread by sand bags or digging of pits, water pumping and storage arrangement etc. Security Deployment of Security personals at vulnerable locations. Cordoning off the affected site. Police Help Sub surface Team (Geology & Reservoir) To assist in Geological / Reservoir information about the well Medical Services Mobilize first — aid team with adequate medical facility and ambulance at Emergency site. Corporate Communication (PRO) Press briefing with approval of Basin Manager
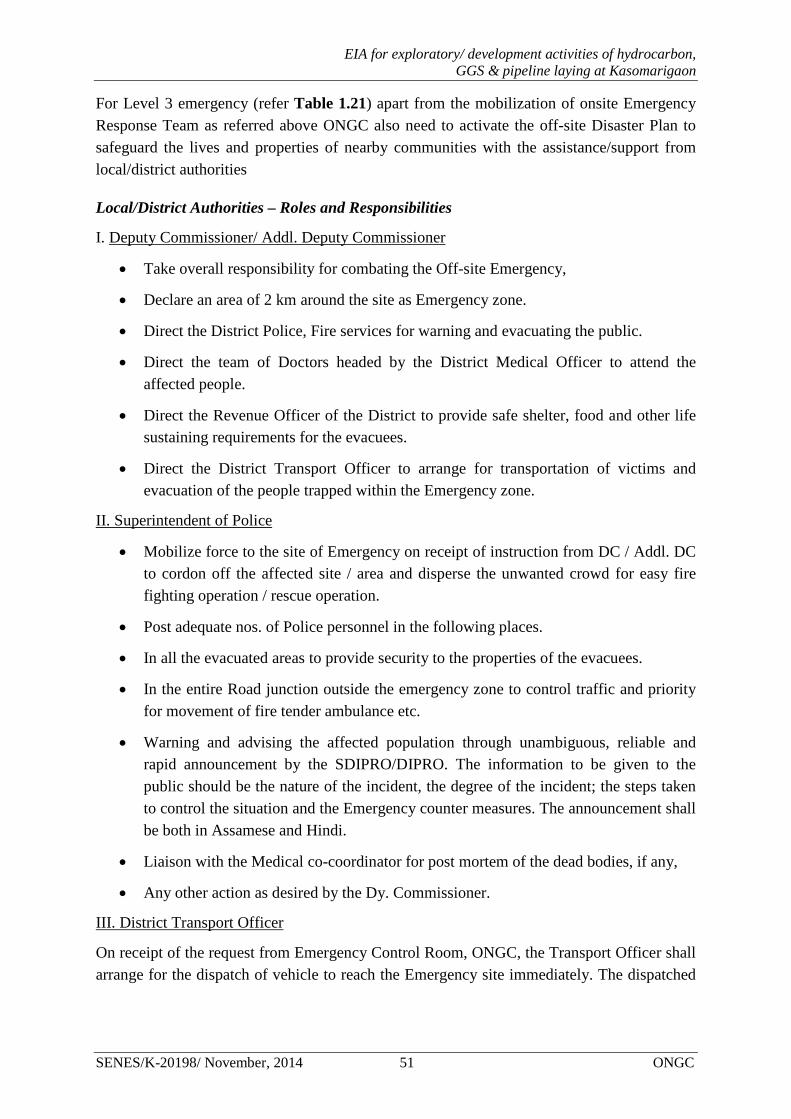
EIA for exploratory/ development activities of hydrocarbon, GGS & pipeline laying at Kasomarigaon
SENES/K-20198/ November, 2014 51 ONGC
For Level 3 emergency (refer Table 1.21) apart from the mobilization of onsite Emergency Response Team as referred above ONGC also need to activate the off-site Disaster Plan to safeguard the lives and properties of nearby communities with the assistance/support from local/district authorities
Local/District Authorities – Roles and Responsibilities
I. Deputy Commissioner/ Addl. Deputy Commissioner
• Take overall responsibility for combating the Off-site Emergency,
• Declare an area of 2 km around the site as Emergency zone.
• Direct the District Police, Fire services for warning and evacuating the public.
• Direct the team of Doctors headed by the District Medical Officer to attend the affected people.
• Direct the Revenue Officer of the District to provide safe shelter, food and other life sustaining requirements for the evacuees.
• Direct the District Transport Officer to arrange for transportation of victims and evacuation of the people trapped within the Emergency zone.
II. Superintendent of Police
• Mobilize force to the site of Emergency on receipt of instruction from DC / Addl. DC to cordon off the affected site / area and disperse the unwanted crowd for easy fire fighting operation / rescue operation.
• Post adequate nos. of Police personnel in the following places.
• In all the evacuated areas to provide security to the properties of the evacuees.
• In the entire Road junction outside the emergency zone to control traffic and priority for movement of fire tender ambulance etc.
• Warning and advising the affected population through unambiguous, reliable and rapid announcement by the SDIPRO/DIPRO. The information to be given to the public should be the nature of the incident, the degree of the incident; the steps taken to control the situation and the Emergency counter measures. The announcement shall be both in Assamese and Hindi.
• Liaison with the Medical co-coordinator for post mortem of the dead bodies, if any,
• Any other action as desired by the Dy. Commissioner.
III. District Transport Officer
On receipt of the request from Emergency Control Room, ONGC, the Transport Officer shall arrange for the dispatch of vehicle to reach the Emergency site immediately. The dispatched
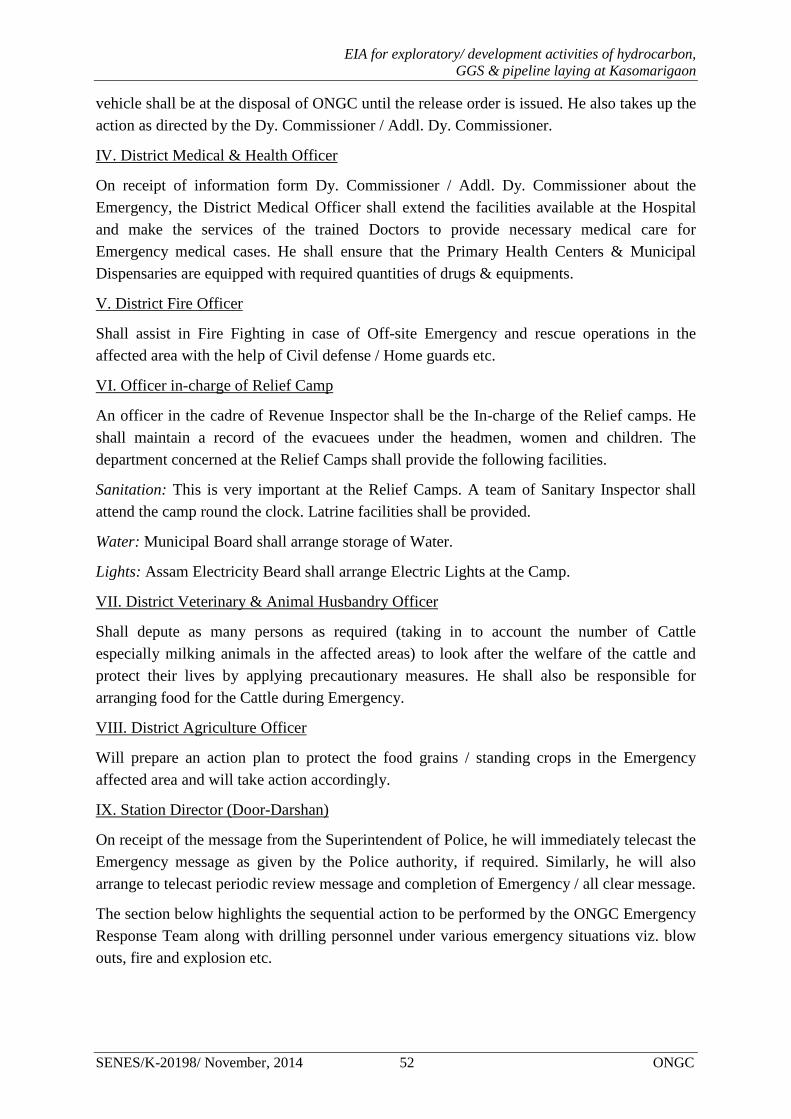
EIA for exploratory/ development activities of hydrocarbon, GGS & pipeline laying at Kasomarigaon
SENES/K-20198/ November, 2014 52 ONGC
vehicle shall be at the disposal of ONGC until the release order is issued. He also takes up the action as directed by the Dy. Commissioner / Addl. Dy. Commissioner.
IV. District Medical & Health Officer
On receipt of information form Dy. Commissioner / Addl. Dy. Commissioner about the Emergency, the District Medical Officer shall extend the facilities available at the Hospital and make the services of the trained Doctors to provide necessary medical care for Emergency medical cases. He shall ensure that the Primary Health Centers & Municipal Dispensaries are equipped with required quantities of drugs & equipments.
V. District Fire Officer
Shall assist in Fire Fighting in case of Off-site Emergency and rescue operations in the affected area with the help of Civil defense / Home guards etc.
VI. Officer in-charge of Relief Camp
An officer in the cadre of Revenue Inspector shall be the In-charge of the Relief camps. He shall maintain a record of the evacuees under the headmen, women and children. The department concerned at the Relief Camps shall provide the following facilities.
Sanitation: This is very important at the Relief Camps. A team of Sanitary Inspector shall attend the camp round the clock. Latrine facilities shall be provided.
Water: Municipal Board shall arrange storage of Water.
Lights: Assam Electricity Beard shall arrange Electric Lights at the Camp.
VII. District Veterinary & Animal Husbandry Officer
Shall depute as many persons as required (taking in to account the number of Cattle especially milking animals in the affected areas) to look after the welfare of the cattle and protect their lives by applying precautionary measures. He shall also be responsible for arranging food for the Cattle during Emergency.
VIII. District Agriculture Officer
Will prepare an action plan to protect the food grains / standing crops in the Emergency affected area and will take action accordingly.
IX. Station Director (Door-Darshan)
On receipt of the message from the Superintendent of Police, he will immediately telecast the Emergency message as given by the Police authority, if required. Similarly, he will also arrange to telecast periodic review message and completion of Emergency / all clear message.
The section below highlights the sequential action to be performed by the ONGC Emergency Response Team along with drilling personnel under various emergency situations viz. blow outs, fire and explosion etc.
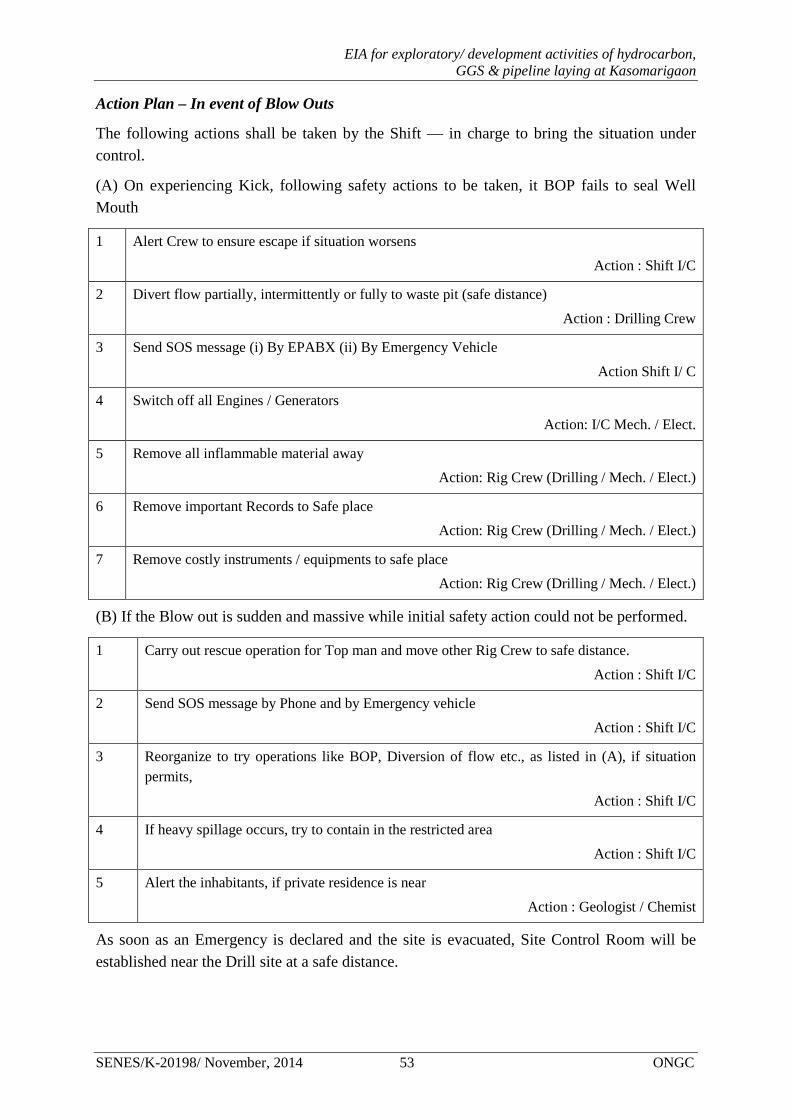
EIA for exploratory/ development activities of hydrocarbon, GGS & pipeline laying at Kasomarigaon
SENES/K-20198/ November, 2014 53 ONGC
Action Plan – In event of Blow Outs
The following actions shall be taken by the Shift — in charge to bring the situation under control.
(A) On experiencing Kick, following safety actions to be taken, it BOP fails to seal Well Mouth
1 Alert Crew to ensure escape if situation worsens
Action : Shift I/C
2 Divert flow partially, intermittently or fully to waste pit (safe distance)
Action : Drilling Crew
3 Send SOS message (i) By EPABX (ii) By Emergency Vehicle
Action Shift I/ C
4 Switch off all Engines / Generators Action: I/C Mech. / Elect.
5 Remove all inflammable material away Action: Rig Crew (Drilling / Mech. / Elect.)
6 Remove important Records to Safe place Action: Rig Crew (Drilling / Mech. / Elect.)
7 Remove costly instruments / equipments to safe place Action: Rig Crew (Drilling / Mech. / Elect.)
(B) If the Blow out is sudden and massive while initial safety action could not be performed.
1 Carry out rescue operation for Top man and move other Rig Crew to safe distance.
Action : Shift I/C
2 Send SOS message by Phone and by Emergency vehicle
Action : Shift I/C
3 Reorganize to try operations like BOP, Diversion of flow etc., as listed in (A), if situation permits,
Action : Shift I/C
4 If heavy spillage occurs, try to contain in the restricted area
Action : Shift I/C
5 Alert the inhabitants, if private residence is near
Action : Geologist / Chemist
As soon as an Emergency is declared and the site is evacuated, Site Control Room will be established near the Drill site at a safe distance.
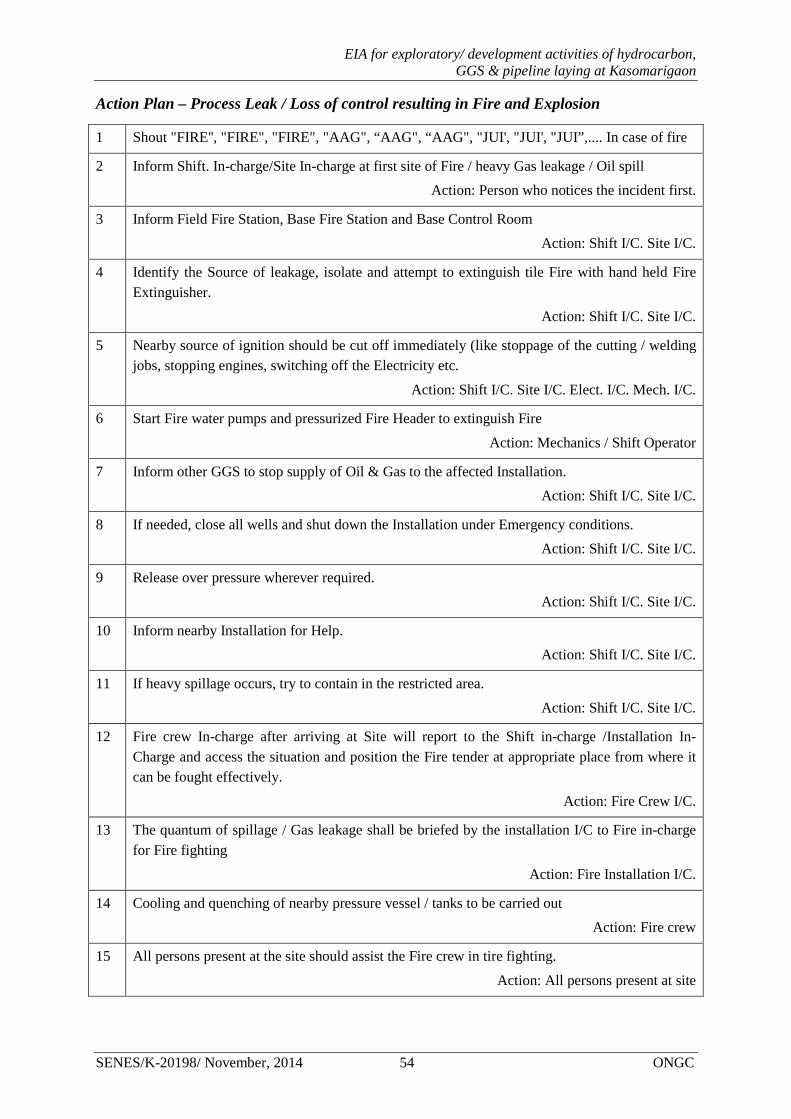
EIA for exploratory/ development activities of hydrocarbon, GGS & pipeline laying at Kasomarigaon
SENES/K-20198/ November, 2014 54 ONGC
Action Plan – Process Leak / Loss of control resulting in Fire and Explosion
1 Shout "FIRE'', "FIRE", "FIRE", "AAG", “AAG", “AAG", "JUI', "JUI', "JUI”,.... In case of fire
2 Inform Shift. In-charge/Site In-charge at first site of Fire / heavy Gas leakage / Oil spill Action: Person who notices the incident first.
3 Inform Field Fire Station, Base Fire Station and Base Control Room Action: Shift I/C. Site I/C.
4 Identify the Source of leakage, isolate and attempt to extinguish tile Fire with hand held Fire Extinguisher.
Action: Shift I/C. Site I/C.
5 Nearby source of ignition should be cut off immediately (like stoppage of the cutting / welding jobs, stopping engines, switching off the Electricity etc.
Action: Shift I/C. Site I/C. Elect. I/C. Mech. I/C.
6 Start Fire water pumps and pressurized Fire Header to extinguish Fire
Action: Mechanics / Shift Operator
7 Inform other GGS to stop supply of Oil & Gas to the affected Installation. Action: Shift I/C. Site I/C.
8 If needed, close all wells and shut down the Installation under Emergency conditions. Action: Shift I/C. Site I/C.
9 Release over pressure wherever required. Action: Shift I/C. Site I/C.
10 Inform nearby Installation for Help. Action: Shift I/C. Site I/C.
11 If heavy spillage occurs, try to contain in the restricted area.
Action: Shift I/C. Site I/C.
12 Fire crew In-charge after arriving at Site will report to the Shift in-charge /Installation In-Charge and access the situation and position the Fire tender at appropriate place from where it can be fought effectively.
Action: Fire Crew I/C.
13 The quantum of spillage / Gas leakage shall be briefed by the installation I/C to Fire in-charge for Fire fighting
Action: Fire Installation I/C.
14 Cooling and quenching of nearby pressure vessel / tanks to be carried out Action: Fire crew
15 All persons present at the site should assist the Fire crew in tire fighting.
Action: All persons present at site

EIA for exploratory/ development activities of hydrocarbon, GGS & pipeline laying at Kasomarigaon
SENES/K-20198/ November, 2014 55 ONGC
16 Continuous monitoring of Gas concentration should be done.
Action: Safety Officer/Asst. Shift I/C
17 Entry at Main Gate should be regulated and Contract personals should be removed from the affected site by CISF.
Action: Area Commander CISF
18 Pass the information and progress to Emergency Control Room at regular intervals. Action: Installation I/C., Field I/C.
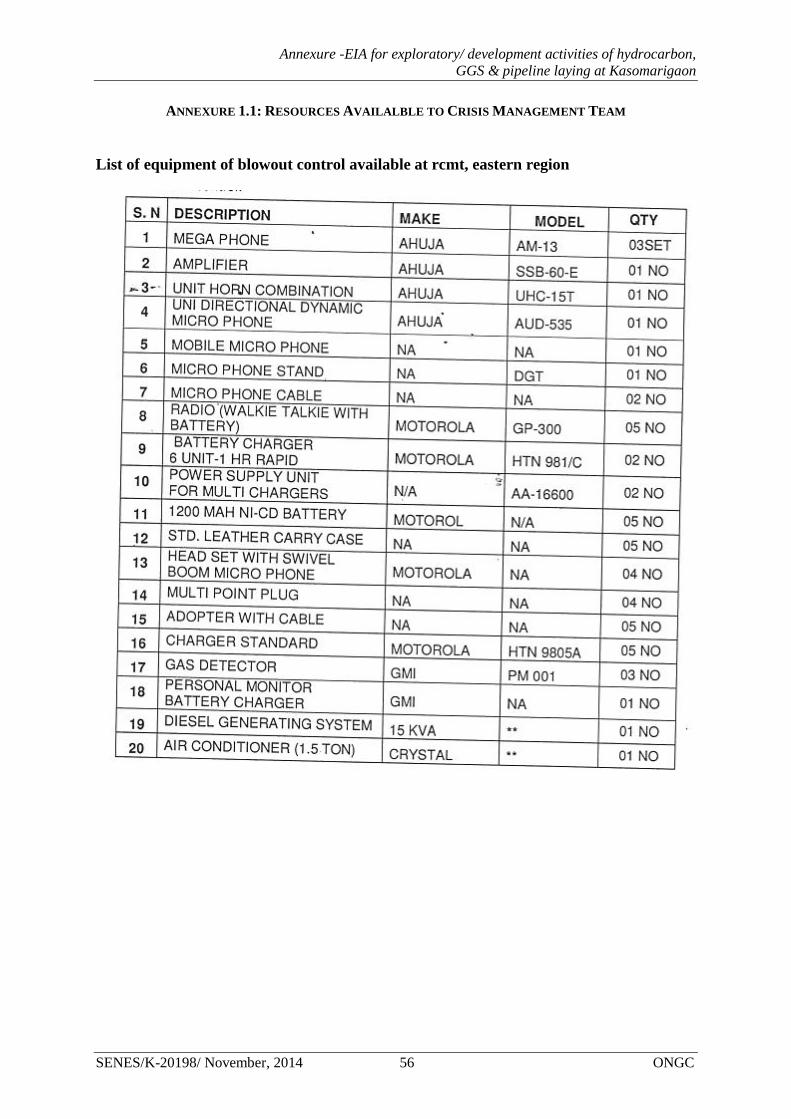
Annexure -EIA for exploratory/ development activities of hydrocarbon, GGS & pipeline laying at Kasomarigaon
SENES/K-20198/ November, 2014 56 ONGC
ANNEXURE 1.1: RESOURCES AVAILALBLE TO CRISIS MANAGEMENT TEAM
List of equipment of blowout control available at rcmt, eastern region
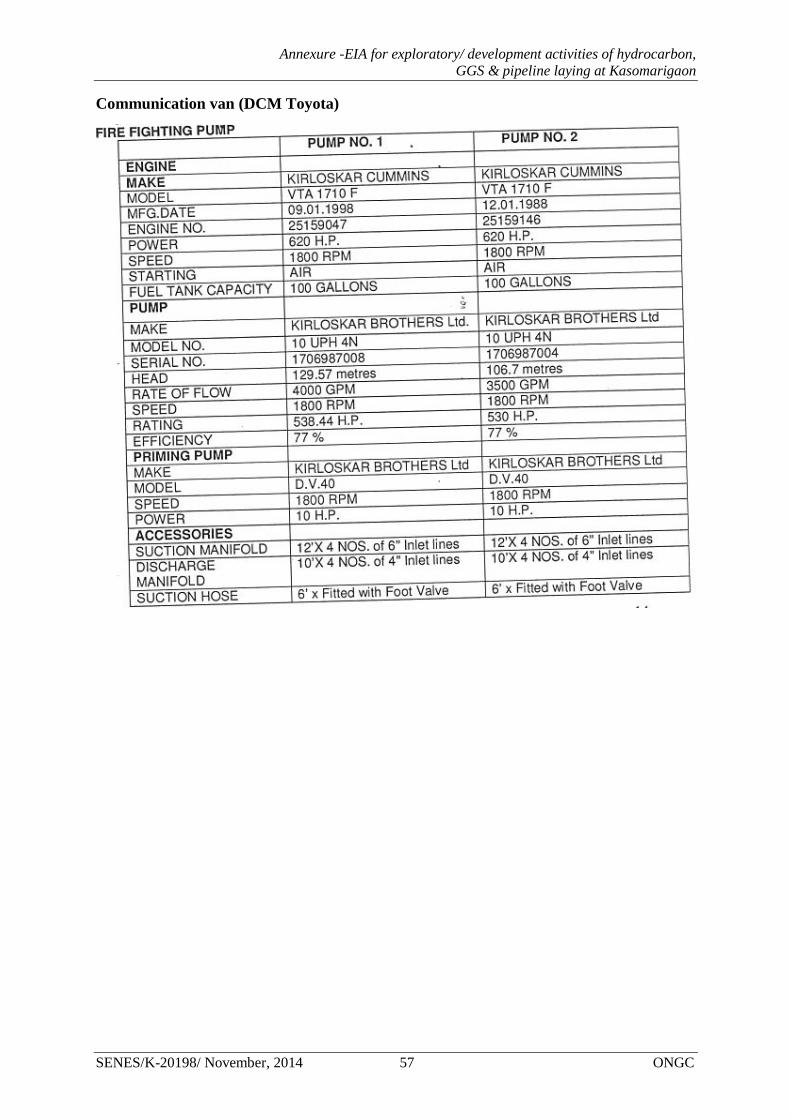
Annexure -EIA for exploratory/ development activities of hydrocarbon, GGS & pipeline laying at Kasomarigaon
SENES/K-20198/ November, 2014 57 ONGC
Communication van (DCM Toyota)
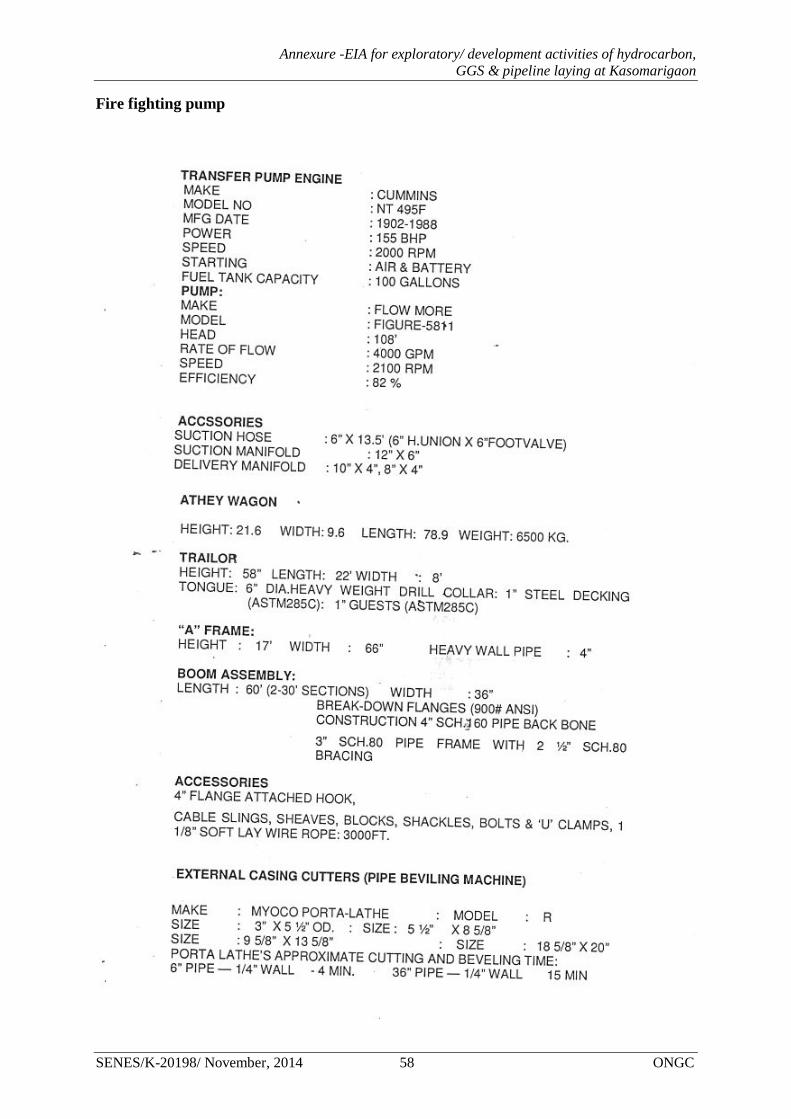
Annexure -EIA for exploratory/ development activities of hydrocarbon, GGS & pipeline laying at Kasomarigaon
SENES/K-20198/ November, 2014 58 ONGC
Fire fighting pump
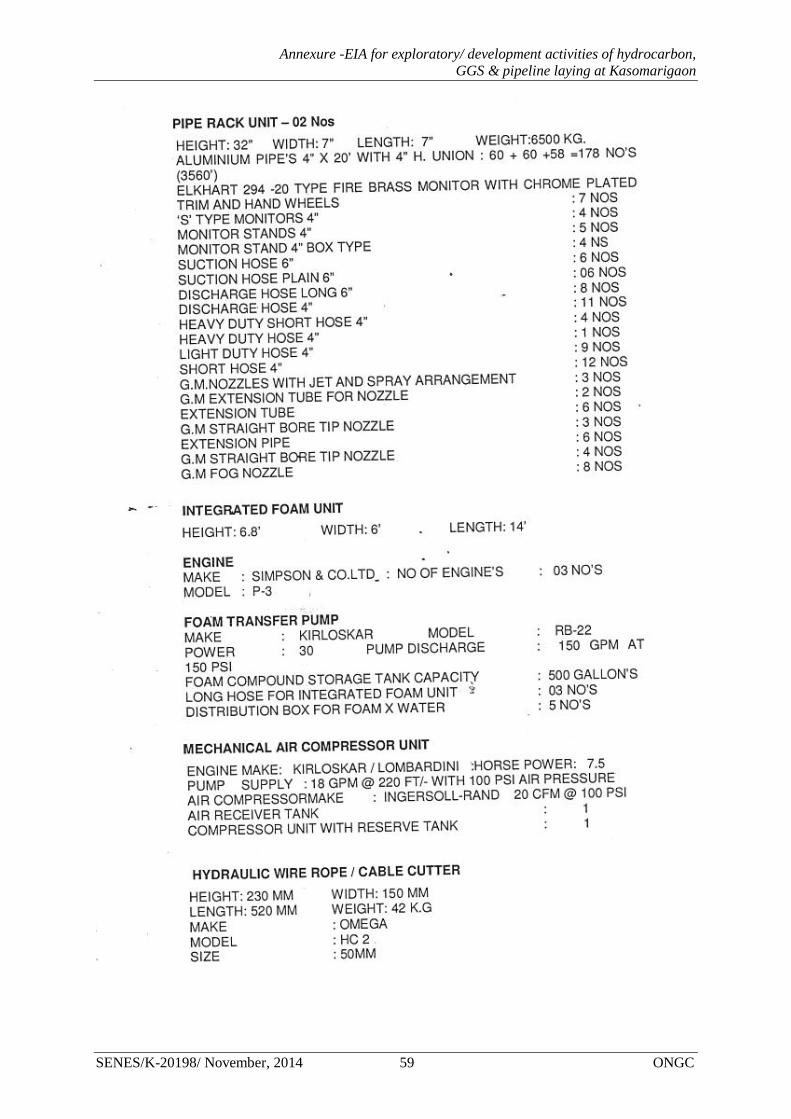
Annexure -EIA for exploratory/ development activities of hydrocarbon, GGS & pipeline laying at Kasomarigaon
SENES/K-20198/ November, 2014 59 ONGC
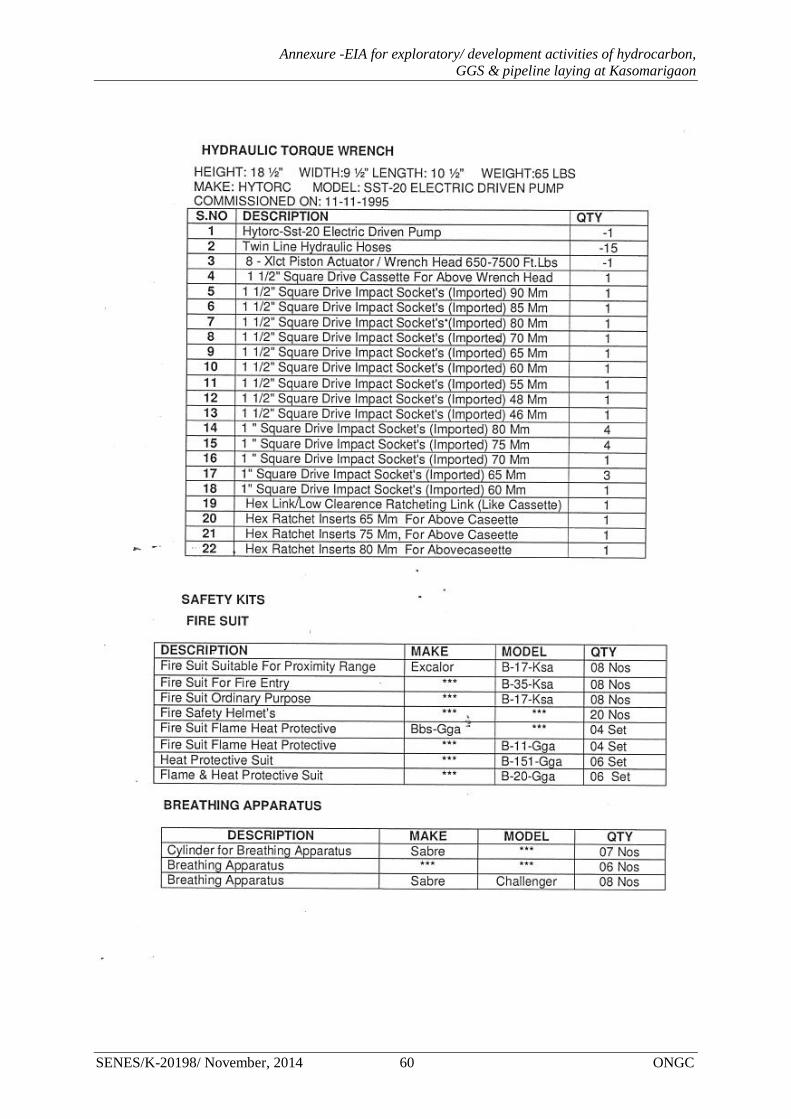
Annexure -EIA for exploratory/ development activities of hydrocarbon, GGS & pipeline laying at Kasomarigaon
SENES/K-20198/ November, 2014 60 ONGC
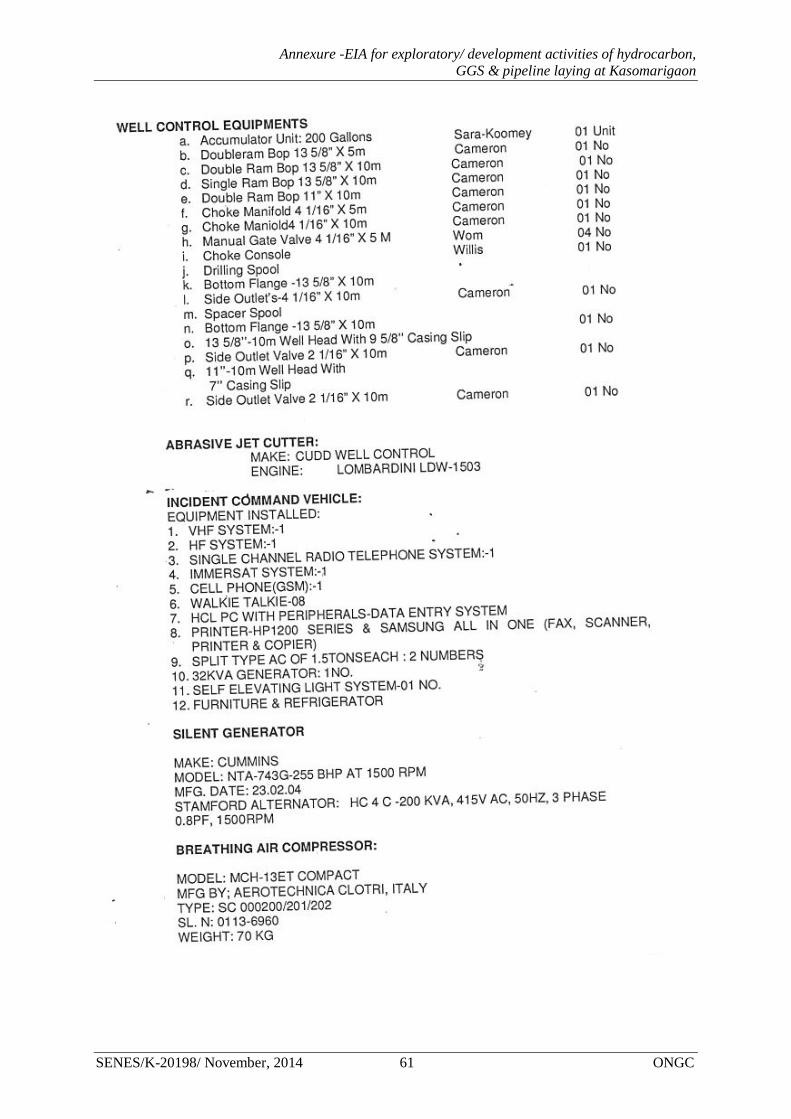
Annexure -EIA for exploratory/ development activities of hydrocarbon, GGS & pipeline laying at Kasomarigaon
SENES/K-20198/ November, 2014 61 ONGC