ei-potential-locations-for-macro-algae-farming-off-the-coast-of-east-anglia.pdf
TRANSCRIPT
Marine Estate Research Report
Feasibility study – Potential locations for macro-algae farming
off East Anglian coast

© Crown Copyright 2014
ISBN: 978-1-906410-61-2
Published by The Crown This report is available on The Crown Estate website at www.thecrownestate.co.uk
Dissemination Statement This publication (excluding the logos) may be re-used free of charge in any format or medium. It may only be re-used accurately and not in a misleading context. The material must be acknowledged as Crown Estate copyright and use of it must give the title of the source publication. Where third party copyright material has been identified, further use of that material requires permission from the copyright holders concerned.
Disclaimer The opinions expressed in this report are entirely those of the authors and do not necessarily reflect the view of The Crown Estate, and The Crown Estate is not liable for the accuracy of the information provided or responsible for any use of the content.
Suggested Citation Capuzzo, E., Stephens, D., Aldridge, J., Forster, R.M. 2014. ‘Feasibility study – Potential locations for macro-algae farming off the East Anglian coast’ The Crown Estate, 37 pages. ISBN: 978-1-906410-61-
2

Feasibility study – Potential locations for
macro-algae farming off the East Anglian
coast
Authors: Elisa Capuzzo, David Stephens, John Aldridge, Rodney
Forster
Commissioned by The Crown Estate
Head office
Centre for Environment, Fisheries & Aquaculture Science
Pakefield Road, Lowestoft, Suffolk NR33 0HT, UK
Tel +44 (0) 1502 56 2244 Fax +44 (0) 1502 51 3865
www.cefas.co.uk
Cefas is an executive agency of Defra

Executive Summary
The natural populations of seaweeds (macro-algae) around the coasts of the UK have
historically been intensively harvested for use as food, soil improvers and for mineral
extraction. This activity has declined throughout the twentieth century to a very low level of
use, but there has been a recent resurgence of interest in the use of macro-algae. The larger
algae, particularly the kelps, can be used for cosmetics, food, hydro-colloids and other high-
value chemicals, fertilisers, and also as biomass for energy generation via anaerobic
digestion. In the future, with increasing demand, it is likely that algae will be harvested less
from natural populations in favour of farming of particular high value species.
The majority of the recent scientific research in the field of macro-algae farming has been
focussed on the west coast of Scotland (e.g. Aldridge et al. 2012), but achieving a wider
uptake of macro-algae in large-scale supply chains will need a range of sites around the UK
to be explored.
An earlier study by Cefas (Aldridge et al. 2012) showed that nutrient concentrations in
winter and early spring can be an important factor in determining the yield of an algal crop
during the following spring-summer growth period. Therefore it could be expected that sites
with nutrient enrichment would deliver higher biomasses of kelp at harvest, compared to
sites with similar conditions of light and temperature but lower nutrient concentration. For
this reason, and for social-economic reasons such as proximity to advanced biotechnology
facilities on land and access to a skilled labour force, the eastern coast of England could be a
promising location for macro-algal development.
The aim of this study was to provide an assessment of the suitability of East Anglian
waters for the large-scale farming of macro-algae, using a GIS-based approach to
identifying optimal sites for potential farms based on environmental data layers.
The key environmental variables, affecting growth and composition of macro-algae,
adopted in the GIS study included: minimum and maximum sea surface temperatures, light
climate (as depth at which the available light is 10% of the surface light), maximum tidal
velocity, wave height, and nutrient concentrations. The range of each environmental
variable was considered and ranked in optimal, sub-optimal, or unsuitable intervals, for
macro-algae growth. A composite layer of the rankings of the different variables was made
in order to find the sites with the highest suitability. The sites suitable for macro-algae

farming were then compared to publicly-available GIS layers of existing and planned uses
and constraints of this sea region, in order to locate areas which could potentially support a
large seaweed farm capable of producing upwards of 20 000 tonnes dry weight per year
(e.g. with dimensions 4 km by 4 km, as modelled in Aldridge et al., 2012). The layers used for
activities included current or future wind farms, planned Marine Conservation Areas, and
areas of high shipping traffic. Three potentially sites were identified, presenting suitable
environmental conditions for macro-algae growth with minimal conflict with existing uses.
The GIS-based approach of intersecting relevant layers (environmental data, constraints,
and conflicting uses) provided a useful and flexible tool for selecting suitable sites for macro-
algae farming. The composite layer of the ranking of the different environmental variables
showed that there are no sites in which all environmental variables were in the ‘optimal’
range for macro-algae growth. The highest rated areas, in terms of suitability for macro-
algae farming, were located off the north Norfolk coastline and off the Humber estuary. In
particular, three sites were selected for detailed consideration:
o Site 1 is located on the north-east of Wells-next-the-Sea; it is the deepest site and
potentially the least turbid.
o Site 2 is the least exposed to waves, and has an optimal level of nutrients during
winter; it is also the closest to port (Wells-next-the-Sea) and has the lowest
indicated vessel traffic and the least conflicts. However it is also the most turbid
site.
o Site 3 is the most northerly site off the Humber estuary; it has optimal
temperature range. This site is the most exposed with the highest maximum tidal
velocity and wave height, as well as being the furthest from port (Grimsby).
Comparison with historical species records showed that the kelp Saccharina latissima, which
is a possible target species to farm, has in the past been recorded along the Norfolk coast,
close to the most suitable sites. This lends support to the site selection procedure.
The report did not consider co-management options such as integrating macro-algae farms
with windfarms or other aquaculture options. This could be explored further to optimise
uses of sites with suitable conditions and maximise economic returns on existing
equipment. Further access constraints, such as distance to plant/processing areas on land,
as well as engineering constraints (in relation to the physical structure of the farm) could
also be taken into account to improve the site suitability selection.

Table of contents
1 Introduction ................................................................................................................................... 1
1.1 GIS-based analysis for site suitability for aquaculture ............................................................ 4
2 Methods .......................................................................................................................................... 6
2.1 Work approach ....................................................................................................................... 6
2.2 Input data ................................................................................................................................ 8
2.2.1 Sea surface temperature ................................................................................................ 8
2.2.2 Tidal velocity and wave height ........................................................................................ 8
2.2.3 Depth of light penetration .............................................................................................. 9
2.2.4 Dissolved inorganic nitrate concentration ...................................................................... 9
2.2.5 Bathymetry...................................................................................................................... 9
2.2.6 Legal and environmental constraints, competing uses ................................................ 10
2.2.7 AIS marine traffic observation ...................................................................................... 10
2.2.8 Distance to port ............................................................................................................ 10
2.2.9 Historical macro-algae observations ............................................................................. 10
2.3 Data analysis ......................................................................................................................... 11
2.3.1 Definition of optimal/suboptimal/unsuitable environmental conditions .................... 11
2.3.2 Combining layers into environmental suitability index ................................................ 11
2.3.3 Identifying potential sites ............................................................................................. 12
2.3.4 Detailed comparison of sites......................................................................................... 12
3 Results ......................................................................................................................................... 13
3.1 Environmental data ............................................................................................................... 13
3.2 Classified environmental data .............................................................................................. 16
3.3 Combined layers into suitability index .................................................................................. 18
3.4 Potential sites identified ....................................................................................................... 19
3.5 Qualitative assessment of site selection process ................................................................. 24
4 Discussion ................................................................................................................................... 26

4.1 Ranges of environmental variables ....................................................................................... 26
4.2 Site selection ......................................................................................................................... 29
4.3 Comparison with historical in situ observations ................................................................... 32
5 Conclusions and recommendations ......................................................................................... 33
6 References ................................................................................................................................... 34
1
1 Introduction
The natural populations of seaweeds (macro-algae) around the coasts of the UK have
historically been intensively harvested for use as food, soil improvers and for mineral
extraction. This activity has declined throughout the twentieth century to a very low level of
use, but there has been a recent resurgence of interest in the use of macro-algae. The larger
algae, particularly the kelps, can be used for cosmetics, food, hydro-colloids and other high-
value chemicals, fertilisers, and also as biomass for energy generation via anaerobic
digestion. In the future, with increasing demand, it is likely that algae will be harvested less
from natural populations in favour of farming of particular high value species. The majority
of the recent scientific research in the field of macro-algae farming has been focussed on
the west coast of Scotland (e.g. Aldridge et al. 2012), but achieving a wider uptake of macro-
algae in large-scale supply chains will need a range of sites around the UK to be explored.
The Crown Estate has begun to investigate the potential for large-scale production of
macro-algae and the wider ecosystem effects of large-scale extraction of these seaweeds
(kelp).
In previous work commissioned by The Crown Estate, Cefas adopted two model-based
approaches for assessing the potential environmental impact of macro-algae farms situated
in four hypothetical locations on the west coast of Scotland (Aldridge et al. 2012). In
simulations, it was found that the winter and early spring nutrient concentration in the
water was important in controlling the yield of kelp biomass during the following months. A
site in the outer Clyde estuary, with a winter nutrient concentration of 10 mmol m-3
(compared to an ambient level of 7 mmol m-3 for other sites on the west coast of Scotland),
was predicted to have a correspondingly higher potential yield of Saccharina latissima
(Aldridge et al. 2012).
Work by Drew and co-authors (e.g. Conolly and Drew 1985) at St. Andrews in the 1970s
showed that natural kelp populations in the proximity of a waste water discharge grew
faster than those located in lower nutrient water. Therefore it could be expected that sites
with nutrient enrichment would deliver higher biomasses of kelp at harvest, compared to
sites with similar conditions of light and temperature but lower nutrient concentration.

2
The winter nutrient concentrations in the southern North Sea, and the East Anglian coast in
particular, are among the highest in the UK (Hydes et al. 1999; Lenhart et al. 2010; Proctor
et al. 2003). For this reason, and for economic reasons, such as proximity to advanced
biotechnology facilities on land, the eastern coast of England could be a promising location
for macro-algal development.
The area off East Anglia is a zone of elevated turbidity, as result of the coalescing of the
Humber, Thames and Wash estuaries (Bristow et al. 2013; Dyer and Moffat 1998). This
turbid area is also known as the East Anglian plume (EAP) and it extends across the Southern
Bight of the North Sea, the Dutch sector and eventually reaches the German Bight (Dyer and
Moffat 1998). The water column in the EAP is vertically mixed and characterised by high
suspended sediment concentration, as result of coastal erosion and freshwater runoff (van
Raaphorst et al. 1998).
The Humber, Thames and Wash estuaries introduce dissolved nutrients into the coastal
waters off East Anglia; the Humber total dissolved inorganic nitrogen input is estimated at
57.4 x10³ t year-1 and 95% of this is exported to the North Sea (Jickells et al. 2000). During
winter, when phytoplankton is light-limited, the EAP transports inorganic nutrients (nitrate)
towards continental Europe (10,340 x103 kgN in March; Weston et al. 2004). Contrarily,
during spring and summer, the EAP transports nitrogen mainly in the form of ammonium
and Particulate Organic Nitrogen (PON), due to phytoplankton uptake. Consequently, the
plume is an important region of the southern North Sea for nutrients processes and organic
matter (Weston et al. 2004).
Due to the high level of nutrients in the area off East Anglia, it could be expected that yields
of a farm in this location should accordingly be higher, if the other environmental conditions
(i.e. temperature, light climate, tides and waves) are also favourable for macro-algae
growth. At the same time the coastal seas of southern England are already heavily exploited
by many other users and space is at a premium (Limpenny et al. 2011).
This study is therefore aimed at identifying potential locations for macro-algae farming off
the Norfolk and Suffolk coasts (see extent of the study area in Figure 1), presenting suitable
environmental conditions for macro-algae growth with minimal conflict with existing uses.
This work does not cover regulatory constraints which may occur as a result of national or
international legislation, but would add to the information necessary for marine spatial

3
planning in the East of England (MMO 2014). The existing marine plan states “The main
issue with respect to aquaculture in the East marine plan areas is to help enable the broadly
recognised opportunity for growth in the sector and to ensure this growth is sustainable. An
assessment of the optimum sites for future expansion of the industry was identified as a
requirement (commenced by the Marine Management Organisation with published report
Marine Management Organisation 1040) along with further research into the possibility for
co-location of aquaculture with other activities, and carrying capacity of areas for
aquaculture.”
Although legislatory frameworks are in place to control the harvesting of wild macro-algae
populations in Europe, there are very few precedents for offshore seaweed farming. A
preliminary assessment of the relatively few legal documents relevant to macro-algae
mariculture is presented by Benson et al. (2014), and case studies of regulations impacting
seaweed development in Northern Ireland (Strangford Lough) and The Netherlands are
given by Parker et al. (2014; personal communication to R. Forster).
Figure 1. The extent of area investigated in this study, for identification of sites suitable for
macro-algae farming, is highlighted in red.
4
1.1 GIS-based analysis for site suitability for aquaculture
There are many examples in the literature of GIS-based analysis for site suitability for
aquaculture of fish and shellfish (see list of examples in Kapetsky and Aguilar-Manjarrez
2007; Nath et al. 2000). The application of this technique for selection of sites for macro-
algae farming is novel, therefore there are fewer examples available in literature (e.g.
Kapetsky and Aguilar-Manjarrez 2007; Radiarta et al. 2011; Rosijadi et al. 2011).
In general, a GIS-based analysis for site suitability for aquaculture aims to define sites where
the production of fish/shellfish/seaweed is maximised and the conflicts (with other
potential uses of the sites) is minimised (Rosijadi et al. 2011; Kapetsky and Aguilar-
Manjarrez 2007). The analysis uses two sets of variables:
1. selection factors;
2. selection constraints.
The first set includes all those variables that affect the potential productivity of the site (e.g.
environmental variables), while the second set include all those variables which make an
otherwise desirable site unsuitable for development (Rosijadi et al. 2011). Examples of
selection constraints could be regulations or competing uses for space (e.g. windfarms,
fishing grounds). Rosijadi et al. (2011) divide the selection constraints into access constraints
(e.g. distance to port), legal constraints (e.g. military and conservation zones),
environmental constraints (e.g. critical habitat, restoration zones), and competing uses
constraints (e.g. shipping, oil platforms, cable, dredge disposal sites, aggregates extraction).
Once selection factors and constraints are identified, they are combined together (e.g.
intersected) for identifying the most suitable areas for macro-algae farming.
Focusing on the selection factors (i.e. environmental variables), Kapetsky and Aguilar-
Manjarrez (2007) consider coastlines, winds, currents, and bathymetry for identifying
suitable sites for Gracilaria farming in northeast Brazil. For identification of sites suitable for
cultivation of Laminaria japonica in Japan, Radiarta et al. (2011) took into account sea
surface temperature, suspended solids (proxy for turbidity), bathymetry and slope of the
bottom. The authors defined suitable ranges of the different environmental parameters
based on literature and expert opinion; they also ranked the importance of the variables
from 1 (least important) to 9 (most important; Radiarta et al. 2011). Rosijadi et al. (2011)
considered in their analysis for site selection for macro-algae farming off Southern California
5
and New England: sea surface temperature, chlorophyll concentration, salinity, turbidity,
irradiance, and sea surface winds.
A final example is given in a recent report by the MMO (2013), where a broad-scale GIS
approach with four input layers (substrate type, combined seabed energy, depth and
distance from shore) was used for investigating the suitability of the east coast of England
for macro-algae farming. Water quality parameters such as turbidity, nutrients and
temperature were not included in the analysis, either because not thought to have sufficient
data coverage in the region, or because not considered important (MMO 2013).

6
2 Methods
2.1 Work approach
Based on the outcome of previous projects commissioned by The Crown Estate (Capuzzo et
al. 2012; Stephens et al. 2014) and on similar studies (Kapetsky and Aguilar-Manjarrez 2007;
Radiarta et al. 2011; Rosijadi et al. 2011; MMO 2013), the key environmental variables, or
selection factors, considered in this project are:
1. minimum sea surface temperature;
2. maximum sea surface temperature;
3. light availability (expressed as depth at which the available light is 10% of the surface
light);
4. maximum tidal velocity;
5. maximum wave height;
6. nitrate concentration;
7. depth.
Ranges of these environmental variables for optimal, suboptimal and unsuitable macro-
algae growth were identified (based on literature and expert opinion) and intersected. The
optimal/sub-optimal/unsuitable ranges were identified based on the growth requirements
of Saccharina latissima, as this species is native to the East Anglian coast and has suitable
attributes for farming (rapid growth, high energy content, edible). The resulting intersected
areas were ranked, based on the suitability score from more to less suitable for macro-algae
farming. To these suitable areas, selection constraints were then applied (e.g. windfarms,
protected areas, shipping routes).
Finally, three sites, presenting the highest suitability score and the minimum conflict with
existing uses, were identified and described in details.
The process undertaken to identify potential sites viable for macro-algae cultivation is
summarised in Figure 2. Section 2.1 focuses on the environmental data (or selection factors)
and marine usage data (or selection constraints) which were used as base for the suitability
analysis (green rectangles in Figure 2).

7
The 4 main steps of the analysis (blue rectangles in Figure 2), described in Section 2.2, were
carried out using R version 3.1 (R Development core team, 2014) and ArcGIS version 10
(ESRI, 2014).
Figure 2. Flow chart summarising the approach used for identifying sites suitability for
macro-algae farming off East Anglia.

8
2.2 Input data
2.2.1 Sea surface temperature
Daily sea surface temperature data for a 12 year period (2001-2013) was obtained from the
Ocean Sea Temperature and Ice Analysis Product (OSTIA; Donlon et al. 2012) of the UK Met
Office with delivery via the MyOcean data portal (http://www.myocean.eu/). The extreme
values of the 95% data interval (2.5 and 97.5 percentile values) were calculated on an
annual basis and used to set a temperature range (in this way it can be expected that at
least 95% of daily temperature values fell within this range). This approach was used
considering that the effects of macro-algae exposure to extreme temperatures is more
severe when exposure is prolonged; for example it has been observed that Saccharina
latissima disintegrated after exposure for 7 days at 23 °C (Bolton and Lüning 1982). In other
words, for the study area while extreme values may occur outside the specified range, these
events will be likely to persist for a short period of time.
The water column in the EAP is vertically mixed (van Raaphorst et al. 1998), therefore is
assumed that temperature values are uniform throughout the water column.
2.2.2 Tidal velocity and wave height
Wave and currents were modelled on the Southern North Sea and English Channel with a
grid resolution of approximately 2 km (1/40 degree east-west, 1/60 of a degree north-
south). Results used here were for the year 2000. Depth mean tidal and wind driven
currents were calculated using the POLCOMS model (Holt and James 2001) forced with 15
tidal constituents (Q1, O1, P1, S1, K1, 2N2, μ2, N2, ν2, M2, L2, T2, S2, K2, M4) and hourly
wind and pressure at 12 km resolution from the UK Met Office mesoscale atmospheric
model. The maximum annual current was selected as the output layer, because extremes
are more important than means in this context. Using the same meteorological forcing, the
WAM spectral wave model (Osuna and Wolf 2004) was used to provide the peak seasonal
significant wave height (Spring = March/April/May; Summer = June/July/August; Autumn =
September/October/November; Winter = December/January/February). Only autumn
values of wave height were used for site suitability analysis, considering that largest waves
usually occur in this period.

9
All other environmental variables were resampled to the same (2 km) grid as the tidal
current and wave height data so the analysis could be performed on a consistent grid.
2.2.3 Depth of light penetration
Daily maps of the light attenuation coefficient from MODIS (Kd(PAR); Gohin et al. 2002),
generated by Ifremer (Brest, France; http://www.ifremer.fr/nausicaa/marcoast/index.htm),
were averaged by month across 10 years (from 2002 to 2012). The derived Kd(PAR) for
spring (March/April/May) was used to calculate the depth of the available light is equivalent
to 10% of surface light, using Equation 1.
Ez10% = 0.1 * E0 = E0 * e-Kd(PAR) * z10% (1)
Where Ez10% is the irradiance (PAR) at depth z10%; E0 is the irradiance (PAR) just below the
surface; and z10% is the depth at which the irradiance is 10% of the surface irradiance.
2.2.4 Dissolved inorganic nitrate concentration
A compilation was made of all available measurements of water column nitrate within the
months when concentrations are highest (January to March), based on a climatology of in
situ (ship-based) measurements. The sampling stations were not equally distributed across
the study area, with more points located inshore than offshore. Kriging was used to produce
a continuous raster layer (at 0.05 degree resolution) suitable for nutrient quality
assessment.
As for temperature, it is assumed that nitrate concentration is uniform throughout the
water column.
2.2.5 Bathymetry
The bathymetry used was a 1 arc-second grid produced by Astrium Oceanwise for DEFRA
(Astrium OceanWise 2011). Although the grid was at 1 arc-second resolution (approximately
30 m), the underlying data was of a variable quality. More details on the bathymetry layer
are given in Stephens et al. (2014).
10
2.2.6 Legal and environmental constraints, competing uses
DEFRAs Marine Reference dataset (collated by the Joint Nature Conservation Committee
2011) was used to delineate restriction and exclusion zones (military practice areas,
dumping ground/disposal sites, cables/pipelines, fishing activities), offshore production
areas and windfarms. Special Areas of Conservation (SACs), Marine Protected Areas (MPAs)
and Marine Conservation Zones (MCZs, designated and proposed) were also considered.
2.2.7 AIS marine traffic observation
Marine vessel AIS (Automatic Identification System) ping data was obtained from exactEarth
Ltd. (http://www.exactearth.com/) for the year of 2013. The ping density was calculated for
each grid cell, which was then classified into quartiles (low, low-moderate, moderate-high,
high) to provide a relative scale of vessel traffic.
2.2.8 Distance to port
Port locations were obtained from the World Port Index, WPI (msi.nga.mil/NGAPortal).
Distance from the centre of each grid cell was calculated to the nearest port. Wells-next-
the-Sea did not appear in the WPI layer however observations from Marine Traffic AIS data
suggested that the port of Wells is regularly used servicing the Sheringham Shoal windfarm
off north Norfolk coast. Therefore, considering this port potentially viable for serving macro-
algae farm, it was added to the analysis.
2.2.9 Historical macro-algae observations
In situ observations of macro-algae presence were obtained from The Crown Estate (June
2014). Observations were collated by the Natural History Museum, in an ESRI geodatabase
(WGS1984) and clipped from Flamborough Head to the Thames.

11
2.3 Data analysis
2.3.1 Definition of optimal/suboptimal/unsuitable environmental conditions
The first stage of analysis (Figure 2, stage 1) was to classify the environmental data
according to conditions suitable for macro-algae cultivation. A literature search was used in
order to identify suitable thresholds (Table 1 and Discussion); this information was
supplemented with expert knowledge.
A 3 tier classification was used for each environmental variable:
unsuitable = conditions considered unsuitable for macro-algae growth;
sub-optimal = macro-algae growth is potentially viable although conditions are not
optimal;
optimal = most suitable conditions for macro-algae growth.
Table 1. Details of the thresholds chosen for each environmental variable and references.
Variable Optimal Suboptimal Unsuitable Reference
Minimum Temperature (°C) 4 2-4 <2 Bolton and Lüning (1982)
Maximum Temperature (°C) < 16 16-18 >18 Bolton and Lüning (1982)
KPAR 10% light depth (m) >4 2-4 <2 This study
Tidal velocity (m s-1) 0.25-1 <0.25 & 1-2 >2 Buck and Buchholz (2005)
Significant Wave height (m) 1-4 <1 & 4-6 >6 Buck and Buchholz (2005)
Winter Nitrate (mmol m-3) >20 10-20 <10 Aldridge et al. (2012)
Bathymetry (m) 10-30 30-50 <10 & >50 Radiarta et al. (2011)
2.3.2 Combining layers into environmental suitability index
In order to create an overall map of environmental conditions suitable for macro-algae
growth and cultivation, the classified layers produced from the step 1 of the analysis
12
(Section 2.2.1) were intersected. The suitability index is simply a count of the number of
‘optimal’ variables divided by the number of variables taken into account.
The index ranges between 0 (no variables are in the optimal range) and 1 (all variables in
optimal range). A total of 7 variables were used (Table 1); if, for example, 5 variables were in
an optimal range the suitability index score would be 5/7 = 0.71.
Only grid cells where all variables were at least ‘sub-optimal’ were considered in the next
stage of analysis, i.e. if any variables were considered ‘unsuitable’ the grid cell was given a
null classification (disregarded from the analysis).
2.3.3 Identifying potential sites
Once the suitability index was generated the next stage was to examine legal and
environmental constraints and competing uses for potential sites; thus to select sites which
were suitable for macro-algae growth as well as presenting minimal conflicts with other
uses. The possibility of placing macro-algae farms within conservation areas in not
considered an option in this study.
In addition to legal and environmental constraints and competing uses, distance from port
and AIS traffic were also taken into account. Based on the intersection of the environmental
layers with the different constraint layers, 3 potential sites (4 km x 4 km in size) were
chosen.
2.3.4 Detailed comparison of sites
The strengths and weakness of each of the 3 potential sites, in terms of environmental
conditions and conflicting interests, were summarised and compared.
13
3 Results
3.1 Environmental data
Minimum sea surface temperature, SST, (of the 2.5 percentile) ranged from 4.5 oC, around
the Wash, to approximately 7 oC approaching the straits of Dover (Figure 3a), while
maximum SST (of the 97.5 percentile; Figure 3b) varied from approximately 15.5 oC, in the
north of the study area, to 19 oC off mainland Europe.
The depth of the 10% surface irradiance in spring (Figure 3c) ranged between 1 m near the
Thames estuary to more than 6 m at offshore areas. The East Anglian plume (EAP) is clearly
visible as a turbid area stretching out into the southern North Sea (Figure 3c).
Maximum tidal velocity was highest off the straits of Dover (> 2 m s-1) and along the Norfolk
coast between Cromer and Great Yarmouth (between 1 and 2 m s-1), while minimum values
were predicted to occur in the Thames estuary (Figure 3d).
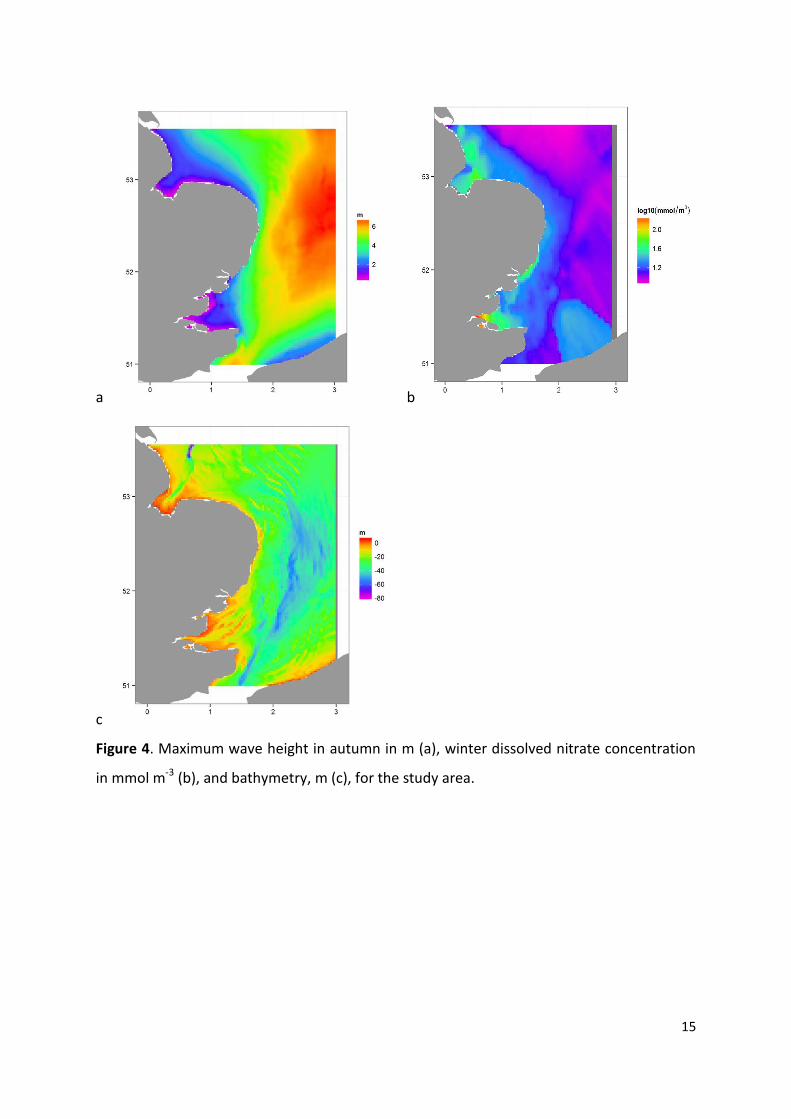
In terms of wave height in autumn, a clear transition is noticeable between the inshore
areas (Humber, Wash and Thames estuaries), characterised by less than 3 m wave height,
and the offshore areas with wave height in excess of 6 m (Figure 4a).
The nutrient layer showed features similar to the result of biogeochemical modelling of the
North Sea given in a previous report (e.g. Figure 6 in Aldridge et al. 2012), with highest
values of dissolved inorganic nitrate in The Wash, in the Essex estuaries and in the Thames
and Humber.
For bathymetry, the majority of the study area falls between 20 and 40 m depth (Figure 4c);
the Thames and Wash estuaries are shallower with average water depth of less than 10 m.

14
a b
c d
Figure 3. Minimum (a) and maximum (b) temperature in °C, depth of the 10% surface
irradiance in m (c), and maximum tidal velocity in m s-1 (d), for the study area.
15
a b
c
Figure 4. Maximum wave height in autumn in m (a), winter dissolved nitrate concentration
in mmol m-3 (b), and bathymetry, m (c), for the study area.
16
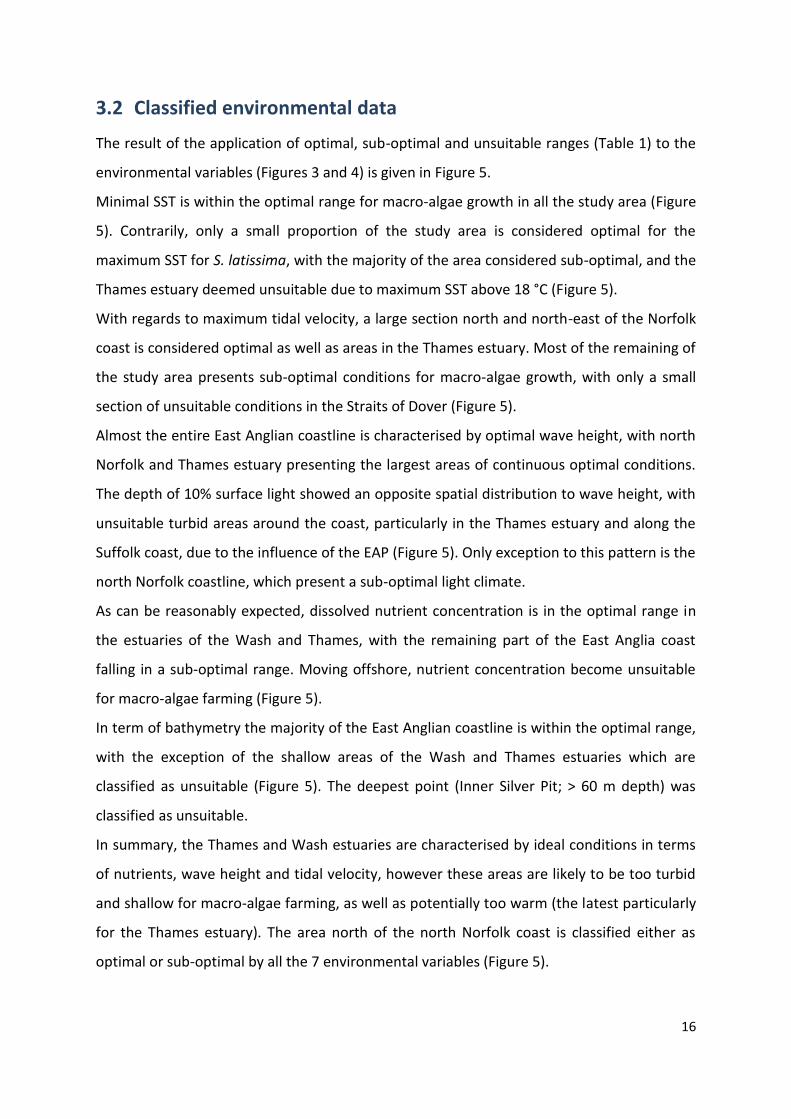
3.2 Classified environmental data
The result of the application of optimal, sub-optimal and unsuitable ranges (Table 1) to the
environmental variables (Figures 3 and 4) is given in Figure 5.
Minimal SST is within the optimal range for macro-algae growth in all the study area (Figure
5). Contrarily, only a small proportion of the study area is considered optimal for the
maximum SST for S. latissima, with the majority of the area considered sub-optimal, and the
Thames estuary deemed unsuitable due to maximum SST above 18 °C (Figure 5).
With regards to maximum tidal velocity, a large section north and north-east of the Norfolk
coast is considered optimal as well as areas in the Thames estuary. Most of the remaining of
the study area presents sub-optimal conditions for macro-algae growth, with only a small
section of unsuitable conditions in the Straits of Dover (Figure 5).
Almost the entire East Anglian coastline is characterised by optimal wave height, with north
Norfolk and Thames estuary presenting the largest areas of continuous optimal conditions.
The depth of 10% surface light showed an opposite spatial distribution to wave height, with
unsuitable turbid areas around the coast, particularly in the Thames estuary and along the
Suffolk coast, due to the influence of the EAP (Figure 5). Only exception to this pattern is the
north Norfolk coastline, which present a sub-optimal light climate.
As can be reasonably expected, dissolved nutrient concentration is in the optimal range in
the estuaries of the Wash and Thames, with the remaining part of the East Anglia coast
falling in a sub-optimal range. Moving offshore, nutrient concentration become unsuitable
for macro-algae farming (Figure 5).
In term of bathymetry the majority of the East Anglian coastline is within the optimal range,
with the exception of the shallow areas of the Wash and Thames estuaries which are
classified as unsuitable (Figure 5). The deepest point (Inner Silver Pit; > 60 m depth) was
classified as unsuitable.
In summary, the Thames and Wash estuaries are characterised by ideal conditions in terms
of nutrients, wave height and tidal velocity, however these areas are likely to be too turbid
and shallow for macro-algae farming, as well as potentially too warm (the latest particularly
for the Thames estuary). The area north of the north Norfolk coast is classified either as
optimal or sub-optimal by all the 7 environmental variables (Figure 5).

17
Figure 5. Optimal, sub-optimal and unsuitable conditions for macro-algae growth for each
environmental variable (minimum and maximum temperature, tidal velocity, wave height,
10% light depth, nutrient and bathymetry). The ranges of the environmental variables are
given in Table 1.

18
3.3 Combined layers into suitability index
The classified data layers were combined into the suitability index (Figure 6) as described in
section 2.2.2. No grid cells had a suitability score of 1, indicating that in no areas were all
variables in the optimal range. The highest rated areas (darker brown, Figure 6) are all
located off the north Norfolk coastline and off the Humber estuary.
Figure 6. Suitable areas (optimal and sub-optimal areas combined) for macro-algae farming
off the East Anglian coast, obtained intersecting the environmental variables shown in
Figures 3 and 4. The colour scale highlights the proportion of the environmental variables
considered optimal in the analysis (where 0 is none, and 1 is all variables).
19
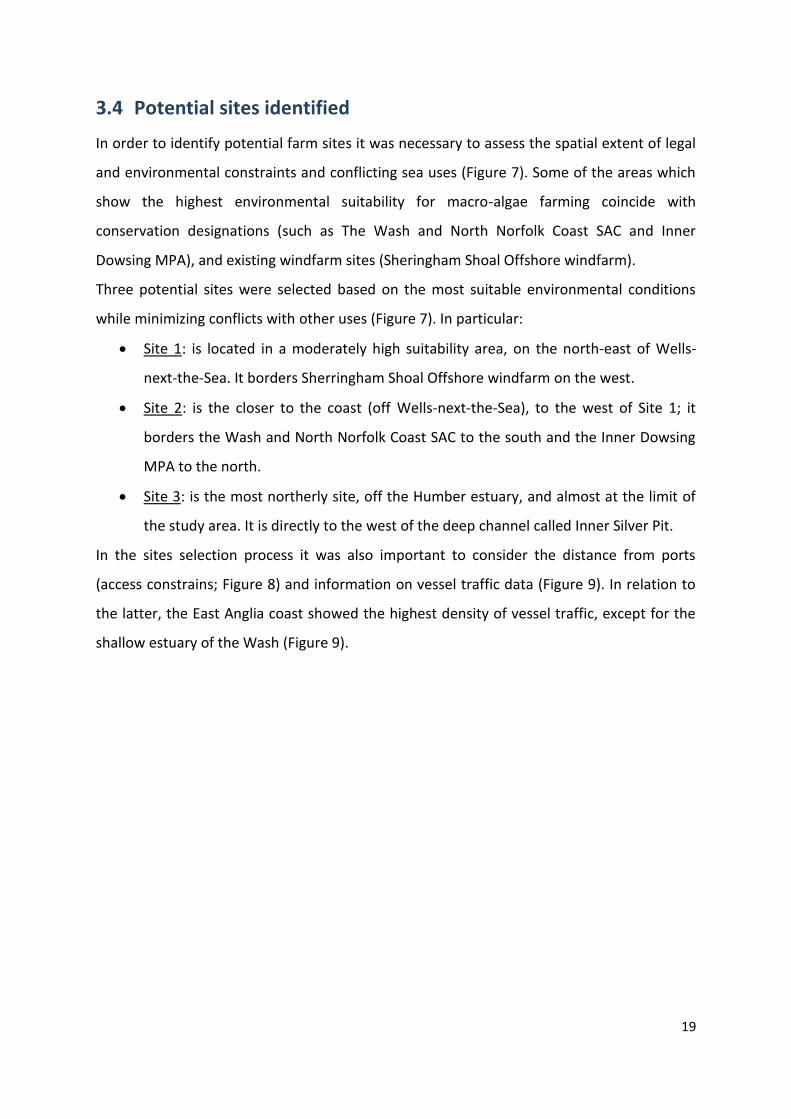
3.4 Potential sites identified
In order to identify potential farm sites it was necessary to assess the spatial extent of legal
and environmental constraints and conflicting sea uses (Figure 7). Some of the areas which
show the highest environmental suitability for macro-algae farming coincide with
conservation designations (such as The Wash and North Norfolk Coast SAC and Inner
Dowsing MPA), and existing windfarm sites (Sheringham Shoal Offshore windfarm).
Three potential sites were selected based on the most suitable environmental conditions
while minimizing conflicts with other uses (Figure 7). In particular:
Site 1: is located in a moderately high suitability area, on the north-east of Wells-
next-the-Sea. It borders Sherringham Shoal Offshore windfarm on the west.
Site 2: is the closer to the coast (off Wells-next-the-Sea), to the west of Site 1; it
borders the Wash and North Norfolk Coast SAC to the south and the Inner Dowsing
MPA to the north.
Site 3: is the most northerly site, off the Humber estuary, and almost at the limit of
the study area. It is directly to the west of the deep channel called Inner Silver Pit.
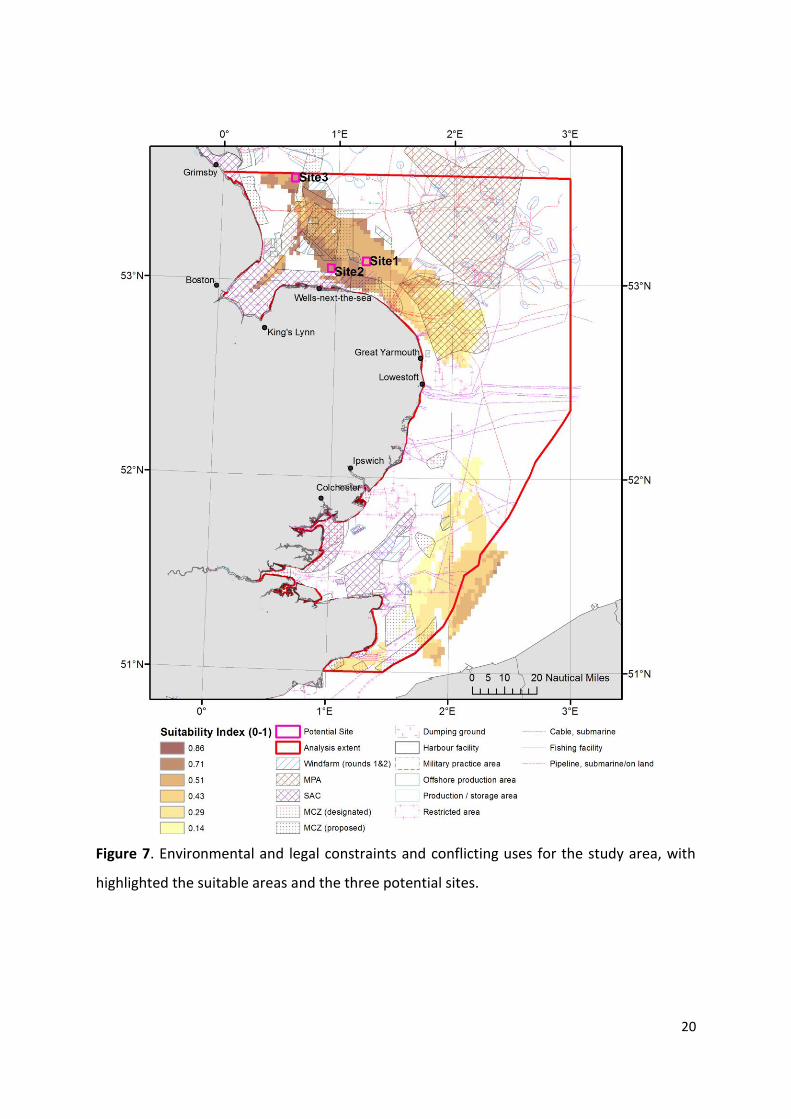
In the sites selection process it was also important to consider the distance from ports
(access constrains; Figure 8) and information on vessel traffic data (Figure 9). In relation to
the latter, the East Anglia coast showed the highest density of vessel traffic, except for the
shallow estuary of the Wash (Figure 9).
20
Figure 7. Environmental and legal constraints and conflicting uses for the study area, with
highlighted the suitable areas and the three potential sites.
21
Figure 8. Distance to ports, expressed as nautical miles (nmi). The three potential sites for
macro-algae farms are highlighted in pink.
22
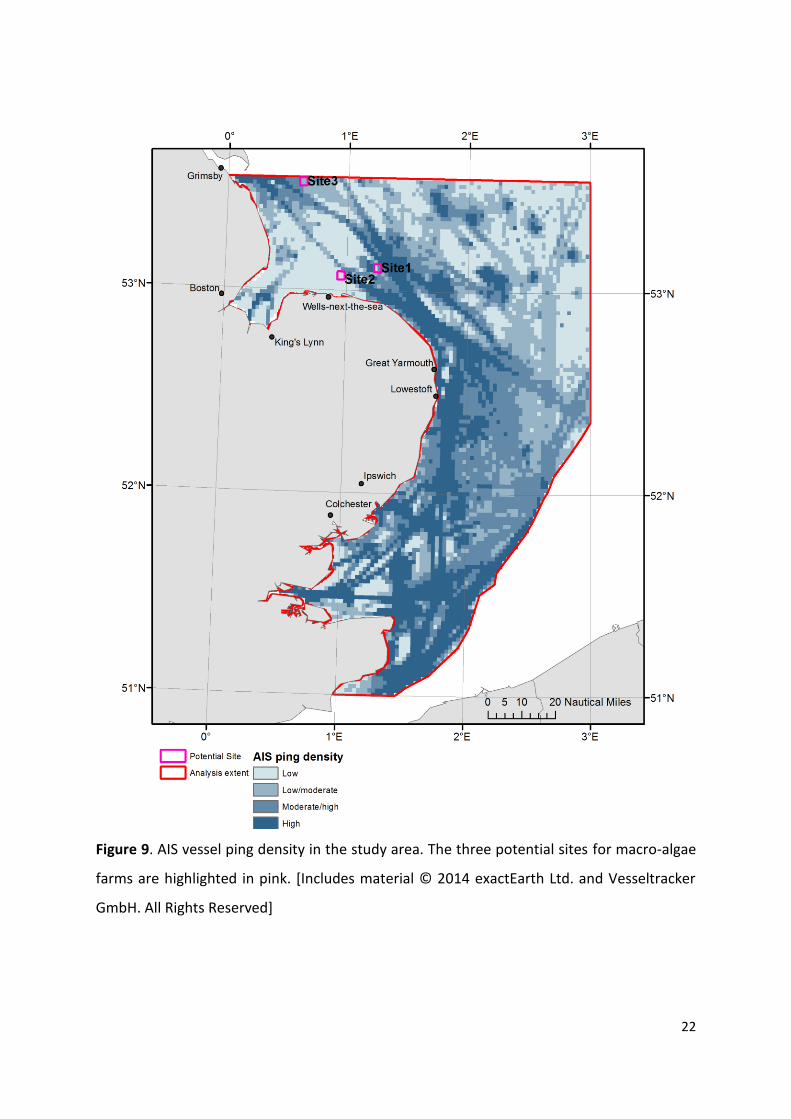
Figure 9. AIS vessel ping density in the study area. The three potential sites for macro-algae
farms are highlighted in pink. [Includes material © 2014 exactEarth Ltd. and Vesseltracker
GmbH. All Rights Reserved]
23
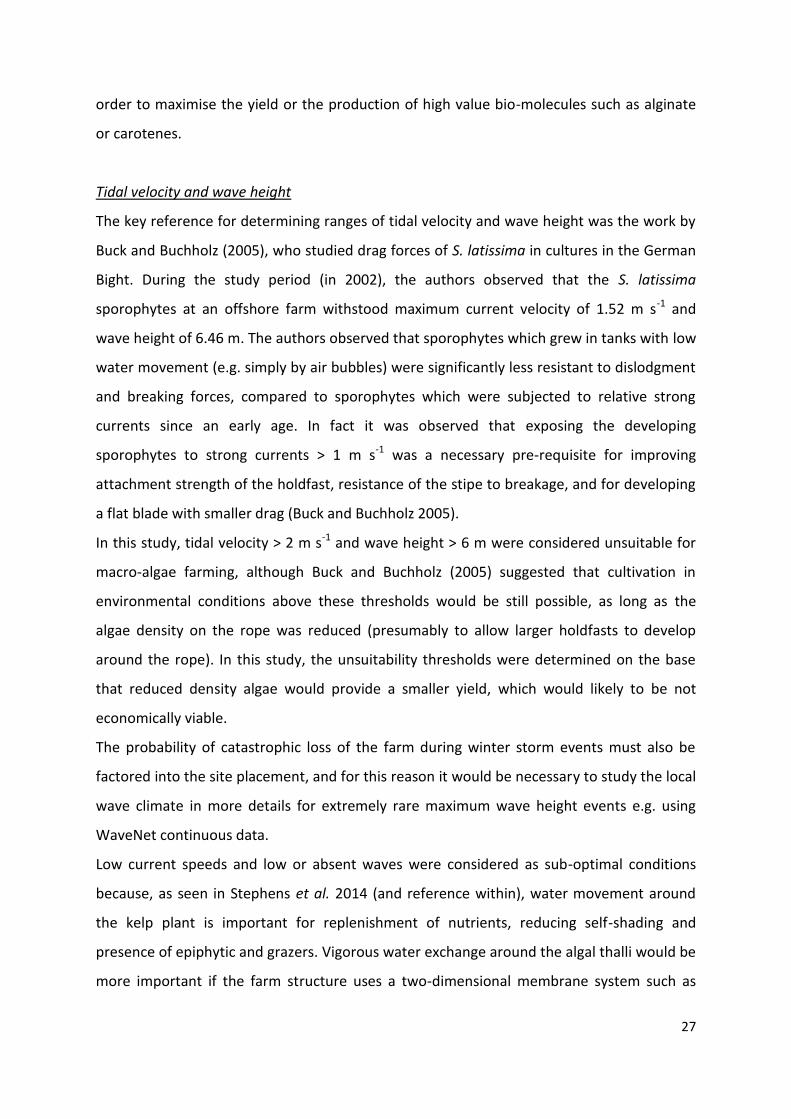
The main environmental data and constraints for each of the 3 potential sites are
summarised in Table 2. Site 2 is the shallowest site with a mean water depth of 15 m, while
sites 1 and 3 are slightly deeper with approximate depth of 20 m (Table 2). The three sites
have a similar minimum SST (approximately 5 oC), with Site 2 presenting slightly cooler SST
(perhaps related to its proximity to the coast). Site 3 has a maximum SST of 1 oC cooler than
Sites 1 and 2 (Table 2).
All sites are estimated to have a peak tidal velocities of the < 1m s-1 and ranging between 0.7
(Site 2) and 0.97 m s-1 (Site 3). Site 3 is the most exposed to wind generated waves with
significant wave height of approximate 3 m. Site 2 appears to be the most suitable with
wave height < 2 m.
Site 2 is the closest to port (8.3 nmi), being less than half the distance than Site 1 (17.6 nmi)
and 3 (24.9 nmi). Furthermore Site 2 is the only site to have an ‘optimal’ nutrient range,
while the other Sites 1 and 3 have sub-optimal levels.
AIS ping density indicates that Site 2 is in an area of low vessel traffic, Site 1 is in an area of
moderate-high traffic, and Site 3 is in a moderate-low area.
In summary, Site 1 is the deepest site and potentially the least turbid. Site 2 is the least
exposed to waves, and has an optimal level of nutrients during winter; it is also the closest
to port (Wells-next-the-Sea) and had the lowest indicated vessel traffic. However it is also
the most turbid site. Finally, Site 3 has optimal temperature range but it is the most
exposed, with the highest maximum tidal velocity and wave height, as well as being the
furthest from port (Grimsby).
24
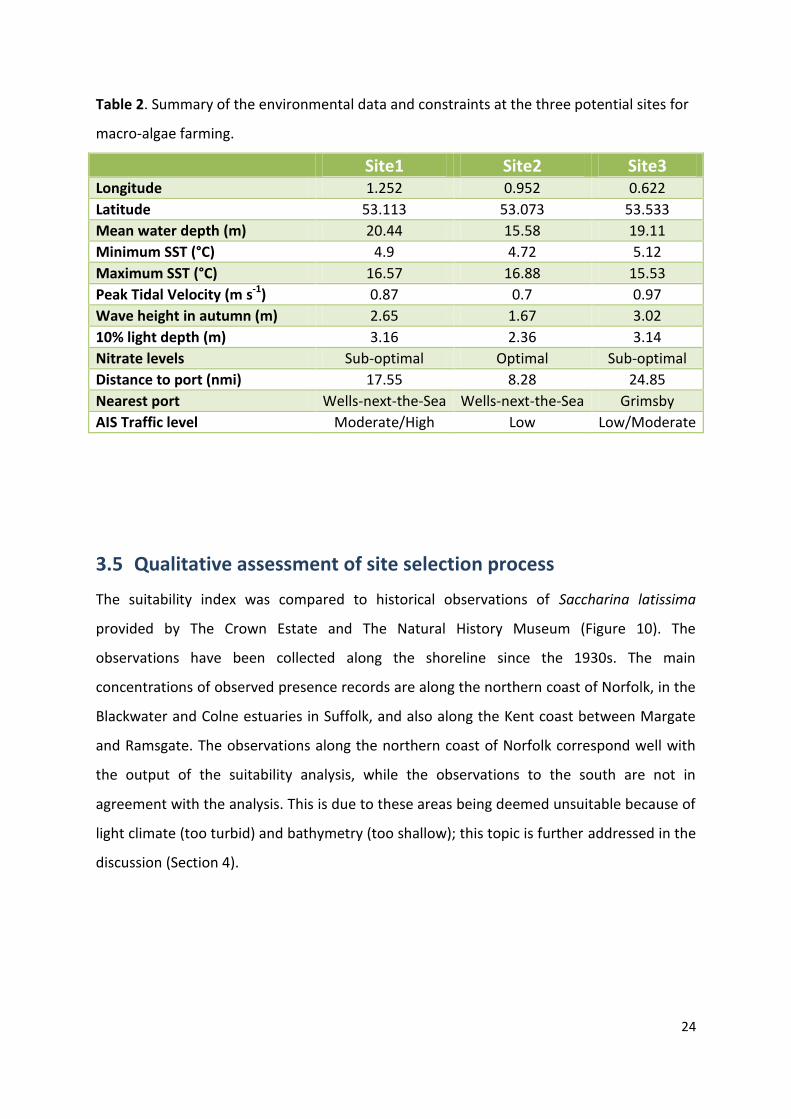
Table 2. Summary of the environmental data and constraints at the three potential sites for
macro-algae farming.
Site1 Site2 Site3 Longitude 1.252 0.952 0.622
Latitude 53.113 53.073 53.533
Mean water depth (m) 20.44 15.58 19.11
Minimum SST (°C) 4.9 4.72 5.12
Maximum SST (°C) 16.57 16.88 15.53
Peak Tidal Velocity (m s-1) 0.87 0.7 0.97
Wave height in autumn (m) 2.65 1.67 3.02
10% light depth (m) 3.16 2.36 3.14
Nitrate levels Sub-optimal Optimal Sub-optimal
Distance to port (nmi) 17.55 8.28 24.85
Nearest port Wells-next-the-Sea Wells-next-the-Sea Grimsby
AIS Traffic level Moderate/High Low Low/Moderate
3.5 Qualitative assessment of site selection process
The suitability index was compared to historical observations of Saccharina latissima
provided by The Crown Estate and The Natural History Museum (Figure 10). The
observations have been collected along the shoreline since the 1930s. The main
concentrations of observed presence records are along the northern coast of Norfolk, in the
Blackwater and Colne estuaries in Suffolk, and also along the Kent coast between Margate
and Ramsgate. The observations along the northern coast of Norfolk correspond well with
the output of the suitability analysis, while the observations to the south are not in
agreement with the analysis. This is due to these areas being deemed unsuitable because of
light climate (too turbid) and bathymetry (too shallow); this topic is further addressed in the
discussion (Section 4).

25
Figure 10. In situ observations of kelp (Saccharina latissima) presence along the East Anglia
coast. The three potential sites for macro-algae farming, as well as suitable areas, are also
highlighted in the map.

26
4 Discussion
4.1 Ranges of environmental variables
The optimal, sub-optimal and unsuitable ranges for the different environmental data (Table
1) were selected based on literature research and expert opinion. Considerations used for
determining optimal/sub-optimal/unsuitable ranges are provided in details below.
Temperature
Ranges were defined based on a Bolton and Lüning (1982) study on Saccharina latissima.
The authors observed that the optimal temperature range for growth of S. latissima is
between 10 and 15 °C, while at temperatures of 5 and 20 °C the growth rate is 60-70% and
50-70% of optimal growth rates, respectively. At 0 °C S. latissima is still able to grow but at
20-40% of the optimal growth rate; contrarily after 7 days at 23 °C plants disintegrate
(Bolton and Lüning 1982). As specified in the method (Section 2.1.1), the approach of using
the 95% of the observations for determining ranges was used considering that the effects of
macro-algae exposure to extreme temperatures is more severe when exposure is
prolonged.
Light climate
The absolute lower limit for kelp distribution (Laminaria hyperborea) is set by Lüning and
Dring (1979) at 0.7% of surface light. Saturation irradiance for Laminaria and Saccharina is
usually reached at irradiance < 150 μmol photons m-2 s-1 (100-145 μmol photons m-2 s-1,
Drew 1983; 50-70 μmol photons m-2 s-1, Lüning 1979; 20-100 μmol photons m-2 s-1, Bartsch
et al. 2008); however Han and Kain (1996) observed that the minimum irradiance required
for growth of young sporophytes of L. hyperborea is of just 1 μmol photons m-2 s-1.
The 10% surface light depth was chosen as descriptor of the light climate to make sure that
a portion of the water column fell in an optimal range of irradiance for photosynthetic
activity (not light limited). Kelp can still grow below the 10% irradiance depth but at a slower
rate, which potentially would not be economically viable. A deeper photic zone would give a
kelp farmer more possibilities to manage the exact depth at which the algae are located in
27
order to maximise the yield or the production of high value bio-molecules such as alginate
or carotenes.
Tidal velocity and wave height
The key reference for determining ranges of tidal velocity and wave height was the work by
Buck and Buchholz (2005), who studied drag forces of S. latissima in cultures in the German
Bight. During the study period (in 2002), the authors observed that the S. latissima
sporophytes at an offshore farm withstood maximum current velocity of 1.52 m s-1 and
wave height of 6.46 m. The authors observed that sporophytes which grew in tanks with low
water movement (e.g. simply by air bubbles) were significantly less resistant to dislodgment
and breaking forces, compared to sporophytes which were subjected to relative strong
currents since an early age. In fact it was observed that exposing the developing
sporophytes to strong currents > 1 m s-1 was a necessary pre-requisite for improving
attachment strength of the holdfast, resistance of the stipe to breakage, and for developing
a flat blade with smaller drag (Buck and Buchholz 2005).
In this study, tidal velocity > 2 m s-1 and wave height > 6 m were considered unsuitable for
macro-algae farming, although Buck and Buchholz (2005) suggested that cultivation in
environmental conditions above these thresholds would be still possible, as long as the
algae density on the rope was reduced (presumably to allow larger holdfasts to develop
around the rope). In this study, the unsuitability thresholds were determined on the base
that reduced density algae would provide a smaller yield, which would likely to be not
economically viable.
The probability of catastrophic loss of the farm during winter storm events must also be
factored into the site placement, and for this reason it would be necessary to study the local
wave climate in more details for extremely rare maximum wave height events e.g. using
WaveNet continuous data.
Low current speeds and low or absent waves were considered as sub-optimal conditions
because, as seen in Stephens et al. 2014 (and reference within), water movement around
the kelp plant is important for replenishment of nutrients, reducing self-shading and
presence of epiphytic and grazers. Vigorous water exchange around the algal thalli would be
more important if the farm structure uses a two-dimensional membrane system such as
28
that being trialled by the at_sea project (http://www.atsea-project.eu/). In this case,
nutrient replenishment from the water below the farm would be limited, and the farm sited
so that horizontal exchange would be maximised.
Bathymetry
Based on the study by Radiarta et al. 2011 for cultivation of Japanese kelp, a water depth
between 10 and 30 m was considered optimal for macro-algae farming using hanging-
culture on ropes. If other cultivation techniques are going to be used (e.g. two-dimensional
membrane systems) the optimal water depth could be reconsidered taking into account the
specific engineering requirements of the farm. A bathymetry of more than 50 m was
considered unsuitable due to likely higher operational costs and difficulties in the mooring
system.
Nutrients
As shown by Conolly and Drew (1985) elevated level of nutrient concentration increase the
growth rate of natural kelp populations. However, nutrients uptake by kelp can be affected
by different physical, chemical and biological factors, such as light availability, temperature,
and water movement around plants (Harrison and Hurd 2001). When nutrients are
abundant and their availability exceeds the metabolic requirements, kelp plants exhibit
what has been termed as ‘luxurious uptake’. Under such circumstances, plants continue
taking in nutrients which are stored in the plant tissues (Birkett et al. 1998), in both organic
and inorganic forms.
The maximum uptake rate (Vmax) for nitrate for S. latissima has shown to increase with
nitrate concentration up to 30 μM (Ahn et al. 1998), or with concentrations between 10 and
20 μM, according to Chapman et al. (1978).
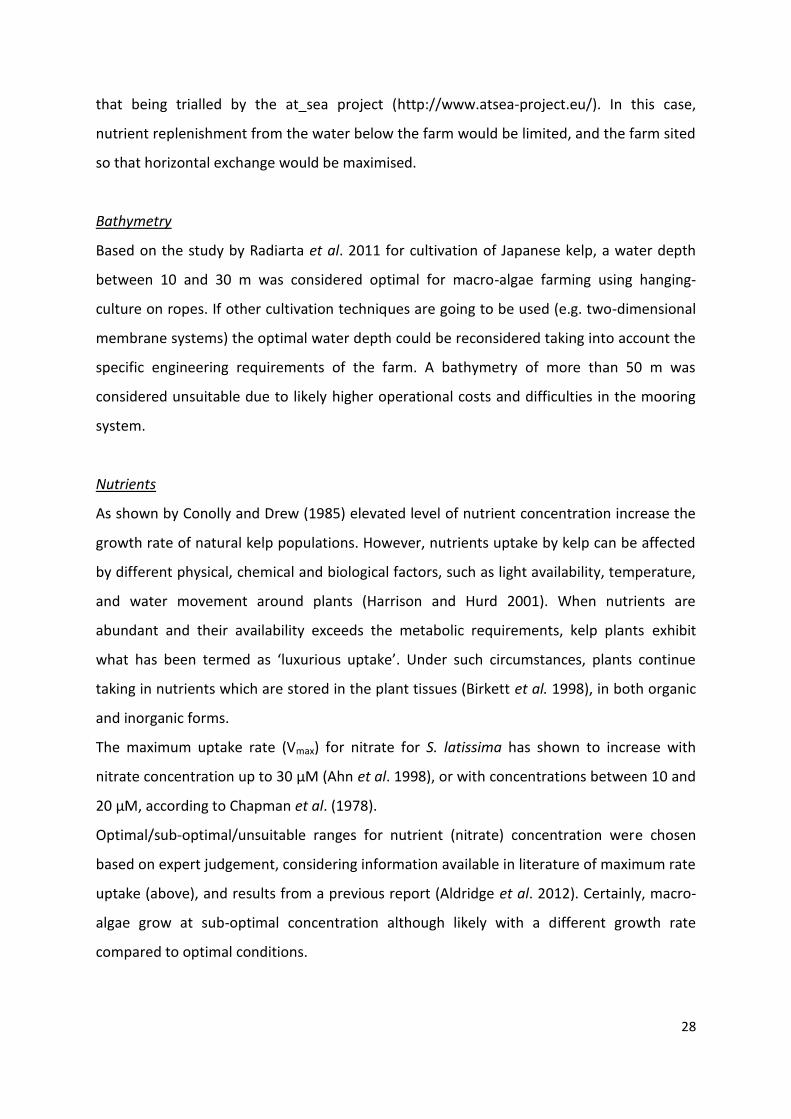
Optimal/sub-optimal/unsuitable ranges for nutrient (nitrate) concentration were chosen
based on expert judgement, considering information available in literature of maximum rate
uptake (above), and results from a previous report (Aldridge et al. 2012). Certainly, macro-
algae grow at sub-optimal concentration although likely with a different growth rate
compared to optimal conditions.

29
Constraints and conflicting uses
Potential sites were chosen on the basis that that they would not intersect or overlap with
any other sea use. However, it is conceivable that shared uses may be possible in some
circumstances. For example, following the example of Buck et al. (2004), if an appropriate
co-management strategy is in place, a macro-algae farm could be integrated alongside an
existing windfarm. Also, the prospect of placing a macro-algae farm within an
MPA/SAC/MCZ could be explored with the relevant conservation bodies (Natural England
and JNCC).
AIS vessel traffic
The scale of vessel traffic, including commercial fishing activities by vessels large enough to
be fitted with AIS, used in this study was determined by a basic analysis to be interpreted as
a qualitative guide when exploring potential sites. A more comprehensive analysis would be
needed to consider other aspects such as vessel speed and size. It was assumed that high
vessel traffic has negative implications on selecting potential macro-algae farm sites
however the full implications of placing a farm in high traffic are not known. Furthermore,
the legal and safety implications regarding navigation of vessel traffic around potential
farms were not considered in this analysis.
4.2 Site selection
The GIS-based approach of intersecting relevant layers (environmental data, constraints,
and conflicting uses) was shown to be a useful and flexible tool in selecting suitable sites for
macro-algae farming.
The three sites identified as potential locations for macro-algae farm are representative of
the most suitable areas for cultivation; however they do not represent the only possible
solution, especially if farms with dimensions smaller of 4 km by 4 km are considered. The
size of the farm of 4 km by 4 km was chosen to be consistent with previous projects
commissioned by The Crown Estate (Aldridge et al. 2012; Stephens et al. 2014). Therefore
the 3 sites were chosen on the basis that they could fit these dimensions; a farm with
smaller dimension would increase the number of placement opportunities in suitable areas.

30
Suitable areas within SACs/MPAs or MCZs were excluded from the analysis. Considering that
areas of a high suitability scores occurred in planned or designated conservation areas, the
prospect of placing macro-algae farms within conservation areas should be discussed with
the relevant conservation authorities.
The three sites were selected minimising overlaps with existing uses; however, the presence
of an existing maritime activity does not wholly exclude an area for use as a macro-algae
farm site. In fact co-location of industries is an important part of marine spatial planning
(Gilliland and Laffoley 2008) and can have positive implications (e.g. economical,
maintenance).
To improve the site suitability selection analysis, further access constraints, such as distance
to plant/processing areas on land, as well as engineering constraints (in relation to the
physical structure of the farm) could also be taken into account.
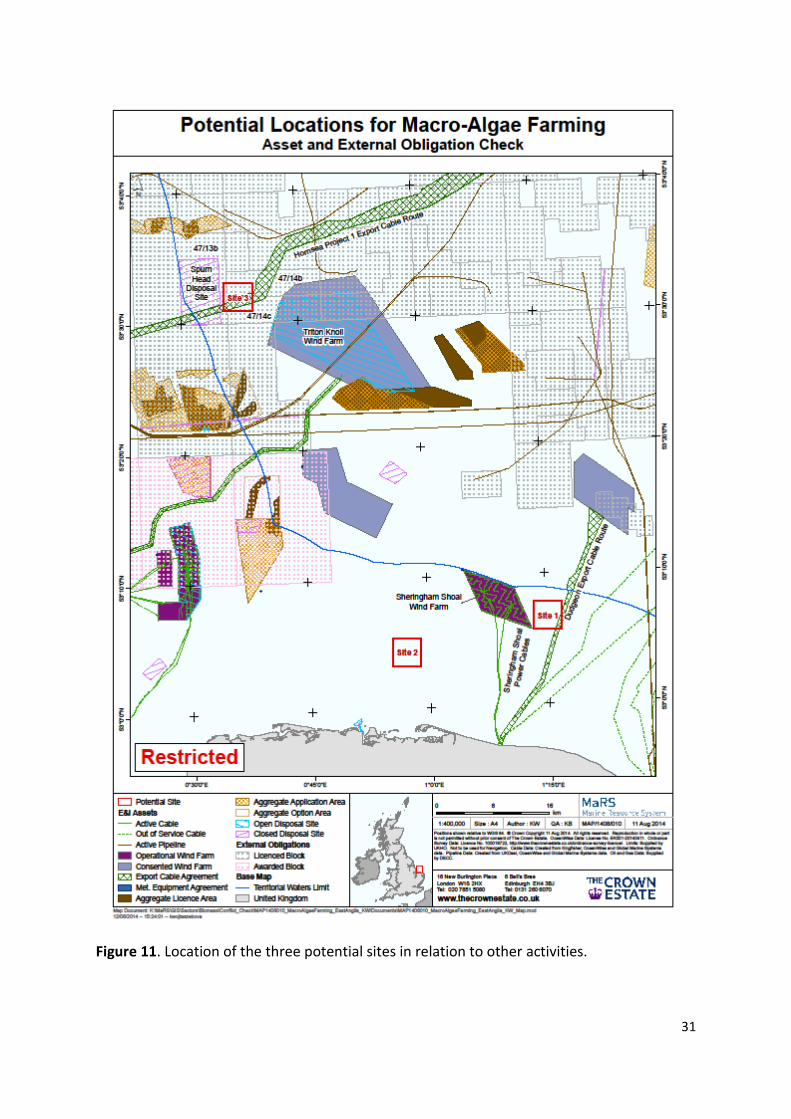
Consideration by The Crown Estate of potential conflicts with other sea users is shown in
Figure 11. This indicates that of the three sites, Site 2 would be the easiest to develop in
having fewer conflicts.
31
Figure 11. Location of the three potential sites in relation to other activities.
32
4.3 Comparison with historical in situ observations
Historical observations from the north Norfolk coast corroborate the outcome of the
suitability analysis. However, the historical observations for Suffolk and Kent coast occurred
in areas which were deemed as not suitable for macro-algae cultivation by the GIS analysis,
because of water depth (too shallow for farming) and light climate (too turbid). The
potential reasons for this discrepancy are likely to be a result of one or more of the
following:
a) temporal discrepancy between environmental variables, used in the analysis, and in situ
observations; the latter were collected between 1930s and 1960s, while the analysis in this
study used modelled and remote sensing data from the last 10 years. The work of Capuzzo
et al. (2014, submitted) showed that underwater light penetration in the southern North
Sea has decreased over the past century. Reductions in the coverage of macro-algae due to
increased turbidity and eutrophication have also been observed in the Baltic Sea (Fleming-
Lehtinen and Laamanen 2012);
b) the depth of the 10% surface light was chosen assuming that a portion of the water
column has sufficient light to support optimal kelp growth. As discussed in section 4.1, this
does not preclude the growth of macro-algae outside these areas, although growth rate are
likely to be slower and/or not economically viable;
c) some of the areas classified as unsuitable had less than 10 m water depth therefore
classified as too shallow; this is concerning the cultivation of the kelp rather than the
presence of the natural population. It is obviously possible for kelp populations to grow in
depth less than 10 m; for S. latissima the natural habitat is the depth range from the low
water mark of spring tides to depths of 20 m. Competition with other kelps usually prevents
S. latissima from exploiting the full extent of its lower depth range.
33
5 Conclusions and recommendations
The key conclusion of this study is that the areas off the north Norfolk coast and off the
Humber estuary were identified to be the most suitable for macro-algae cultivation, in
terms of optimal/sub-optimal environmental conditions for macro-algae growth and
minimum conflict with other uses. Historical observations of Saccharina latissima presence
in the coastal area of north Norfolk support this result. Potential sites for location of farms
with dimensions of 4 km by 4 km were identified:
o Site 1 is located on the north-east of Wells-next-the-Sea; it is the deepest site and
potentially the least turbid.
o Site 2 is the least exposed to waves, and has an optimal level of nutrients during
winter; it is also the closest to port (Wells-next-the-Sea) and had the lowest
indicated vessel traffic and least conflicts. However it is also the most turbid site.
o Site 3 is the most northerly site off the Humber estuary; it has optimal
temperature range. This site is the most exposed with the highest maximum tidal
velocity and wave height, as well as being the furthest from port (Grimsby);
Recommendations arising from this study are:
1) to apply the Combined Kelp Phytoplankton model (CKP), developed during a
previous project (Aldridge et al. 2012), to simulate macro-algae growth, nutrient
uptake and potential effect of macro-algae farms at selected sites off the East Anglia
coast;
2) to run a trial (pilot farm) to ascertain the suitability of the environmental conditions,
as well as potential growth rates, and biochemical composition of the farmed macro-
algae at selected sites;
3) to discuss with relevant conservation authorities the prospect of placing macro-algae
farms within conservation areas (considering that areas of a high suitability occurred
in planned or designated conservation areas);
4) to explore option of co-management/co-location of industries, as integrating macro-
algae farms with windfarms or other aquaculture options could optimise uses of
sites with suitable conditions.

34
6 References
Ahn, O., Petrell, R. J., Harrison, P. J. (1998). Ammonium and nitrate uptake by Laminaria
saccharina and Nereocystis luetkeana from a salmon seacage farm. Journal of
Phycology, 10, 333-340.
Aldridge, J., van der Molen, J., Forster, R. (2012). Wider ecological implications of
macroalgae cultivation. The Crown Estate, 95 pages. ISBN: 978-1-906410-38-4.
Astrium OceanWise (2011). Creation of a high resolution digital elevation model (DEM) of
the British Isles continental shelf, 21 pages.
Bartsch, I., Wiencke, C., Bischof, K., Buchholz, C. M., Buck, B. H., Eggert, A., Feuerpfeil, P.,
Hanelt, D., Jacobsen, S., Karez, R., Karsten, U., Molis, M., Roleda, M. Y., Schubert, H.,
Schumann, R., Valentin, K., Weinberger, F., Wiese, J. (2008). The genus Laminaria
sensu lato: recent insights and developments. European Journal of Phycology, 43(1),
1-86.
Benson, D., Kerry, K., Malin, G. (2014). Algal biofuels: impact significance and implications
for EU multi-level governance. Journal of Cleaner Production, 72, 4-13.
Birkett, D. A., Maggs, C. A., Dring, M. J., Boaden, P. J. S., Seed, R. (1998). Infralittoral reef
biotopes with kelp species (volume VII). An overview of dynamic and sensitivity
characteristics for conservation management of marine SACs. Scotttish Association of
Marine Science (UK Marine SACs Project), 174 pages.
Bolton, J. J., Lüning, K. (1982). Optimal growth and maximal survival temperatures of
Atlantic Laminaria species (Phaeophyta) in culture. Marine Biology, 66, 89-94.
Bristow, L. A., Jickells, T. D., Weston, K., Marca-Bell, A., Parker, R., Andrews, J. E. (2013).
Tracing estuarine organic matter sources into the southern North Sea using C and N
isotopic signatures. Biogeochemistry, 113, 9-22.
Buck, B. H., Buchholz, C. M. (2005). Response of oddshore cultivated Laminaria saccharina
to hydrodynamic forcing in the North Sea. Aquaculture, 250, 674-691.
Buck, B. H., Krause, G., Rosenthal, H. (2004). Extensive open aquaculture development in
wind farms in Germany: the prospect of offshore co-management and legal
constraints. Ocean and Coastal Management, 47(3-4), 95-122.

35
Capuzzo, E., Stephens, D. T., Silva, T., Barry, J., Forster, R. M. (2014). Increased in turbidity of
the North Sea during the twentieth-century. Submitted.
Chapman, A. R. O., Markham, J. W., Lüning, K. (1978). Effects of nitrate concentration on the
growth and physiology of Laminaria saccharina (Phaeophyta) in culture. Journal of
Phycology, 14, 195-198.
Conolly, N. J., Drew, A. D. (1985). Physiology of Laminaria. III. Effect of a coastal
eutrophication gradient on seasonal patterns of growth and tissue composition in L.
digitata Lamour and L. saccharina (L.) Lamour. Marine Ecology, 6(3), 181-195.
Donlon, C. J., Martin, M., Stark, J., Roberts-Jones, J., Fiedler, E., Wimmer, W. (2012). The
Operational Sea Surface Temperature and Sea Ice Analysis (OSTIA) system. Remote
Sensing of Environment, 116, 140–158.
Drew, E. A. (1983). Physiology of Laminaria. Seasonal variation of photosynthesis and
respiration in Laminaria digitata LAMOUR, L. hyperborea (GUNN.) FOSL. and L.
saccharina, (L.) LAMOUR. and a model for calculation of annual carbon budgets.
Marine Ecology, 4(3), 227-250.
Dyer, K. R., Moffat, T. J. (1998). Fluxes of suspended matter in the East Anglian plume
Souther North Sea. Continental Shelf Research, 18, 1311-1331.
ESRI (2014). ArcGIS Desktop: Release 10. Redlands, CA: Environmental Systems Research
Institute.
Fleming-Lehtinen, V., Laamanen, M. (2012). Long-term changes in Secchi depth and the role
of phytoplankton in explaining light attenuation in the Baltic Sea. Estuarine, Coastal
and Shelf Science, 102-103, 1–10.
Gilliland, P. M., Laffoley, D. (2008). Key elements and steps in the process of developing
ecosystem-based marine spatial planning. Marine Policy, 32(5), 787–796.
Gohin, F., Druon, J. N., Lampert, L. (2002). A five channel chlorophyll concentration
algorithm applied to SeaWiFS data processed by SeaDAS in coastal waters.
International Journal of Remote Sensing, 23(8), 1639–1661.
Han, T., Kain, J. M. (1996). Effect of photon irradiance and photoperiod on young
sporophytes of four species of the Laminariales. European Journal of Phycology, 31,
233-240.

36
Harrison, P. J., Hurd, C. L. (2001). Nutrient physiology of seaweeds: Application of concepts
to aquaculture. Cahiers de Biologie Marine, 42, 71-82.
Holt, J. T., James, D. J. (2001). An s coordinate density evolving model of the northwest
European continental shelf: 1. Model description and density structure. Journal of
Geophysical Research, 106(C7), 14015–14034.
Hydes, D., Kelly-Gerreyn, B., Le Gall, A., Proctor, R. (1999). The balance of supply of nutrients
and demands of biological production and denitrification in a temperate latitude shelf
sea — a treatment of the southern North Sea as an extended estuary. Marine
Chemistry, 68(1-2), 117–131.
Jickells, T., Andrews, J., Samways, G., Sanders, R., Malcolm, S., Sivyer, D., Parker, R., Nedwell,
D., Trimmer, M., Ridgway, J. (2000). Nutrient fluxes through the Humber Estuary—
past, present and future. Ambio, 29, 130–135.
Kapetsky, J., Aguilar-Manjarrez, J. (2007). Geographic Information Systems, remote sensing
and mapping for the development and management of marine aquaculture. Food and
Agriculture Organization of the United Nations, Rome.
http://www.fao.org/docrep/009/a0906e/a0906a00.htm
Lenhart, H.-J., Mills, D. K., Baretta-Bekker, H., van Leeuwen, S. M., van der Molen, J., Baretta,
J. W., Wakelin, S. L. (2010). Predicting the consequences of nutrient reduction on the
eutrophication status of the North Sea. Journal of Marine Systems, 81(1-2), 148–170.
Limpenny, S. E. et al. (2011). The East Coast Regional Environmental characterisation. Cefas
Open Report 08/04. 287 pp. ISBN: 978 0 907545 62 0
Lüning, K. (1979). Growth strategies of three Laminaria species (Phaeophyceae) inhabiting
different depth zones in the sublittoral region of Helgoland (North Sea). Marine
Ecology - Progress Series, 1, 195-207.
Lüning, K., Dring, M. J. (1979). Continuous underwater light measurement near Helgoland
(North Sea) and its significance for characteristic light limits in the sublittoral region.
Helgoländer wissenschaftliche Meeresuntersuchungen, 32(4), 403-424.
MMO (2013). Spatial trends in aquaculture potential in the South and East Inshore and
Offshore Marine Plan Areas. A report produced for the Marine Management
Organisation, pp 202. MMO Project No: 1040. ISBN: 978-1-909452-18-3.
37
Nath, S. S., Bolte, J. P., Ross, L. G., Aguilar-Manjarrez, J. (2000). Applications of geographical
information systems (GIS) for spatial decision support in aquaculture. Aquacultural
Engineering, 23, 233-278.
Osuna, P., Wolf J. (2004). Results from a one-year run of a wave model for the UK
continental shelf. Proudman Oceanographic Laboratory, Internal Document No. 170.
Proctor, R., Holt, J., Allen, J., Blackford, J. (2003). Nutrient fluxes and budgets for the North
West European Shelf from a three-dimensional model. The Science of The Total
Environment, 314-316, 769–785.
R Development Core Team (2014). R: A Language and Environment for Statistical
Computing. (R. D. C. Team, Ed.). R Foundation for Statistical Computing.
Radiarta, N., Saitoh, S.-I., Yasui, H. (2011). Aquaculture site selection for Japanese kelp
(Laminaria japonica) in southern Hokkaido, Japan, using satellite remote sensing and
GIS-based models. ICES Journal of Marine Science, 68(4), 773-780.
Roesijadi, G. et al. (2011). Macroalgae analysis. A national GIS-based analysis of macroalgae
production potential. Summary report and project plan. Prepared for the U.S.
Department of Energy under contract DE-AC05-76RL01830, pp. 56.
van Raaphorst, W., Philippart, C. J. M., Smit, J. P. C., Dijkstra, F. J., Malschaert, J. F. P. (1998).
Distribution of suspended particulate matter in the North Sea as inferred from
NOAA/AVHRR reflectance images and in situ observations. Journal of Sea Research,
39, 197-215.
Weston, K., Jickells, T. D., Fernand, L., Parker, E. R. (2004). Nitrogen cycling in the southern
North Sea: consequences for total nitrogen transport. Estuarine, Coastal and Shelf
Science, 59, 559-573.

The Crown Estate 16 New Burlington Place London W1S 2HX Tel: 020 7851 5080
www.thecrownestate.co.uk
ISBN: 978-1-906410-61-2