ehlorlnated drinking-watermonographs.iarc.fr/eng/monographs/vol52/mono52-6.pdfehlorlnated...
TRANSCRIPT

eHLORlNATED DRINKING-WATER
1. Description of the Process
1.1 History of chlorination of drinking-water
Chlorine in one form or another is by far the most commonly used chemical forthe disinfection of water supplies. It is also active for other purposes assocIatedwith water treatment and supply, such as prevention of algal, bacterial and generalslime growths in treatment plants and pipeworks, control of tastes and odours, andremoval of ¡ron, manganese and colour (White, 1986).
The history and use of chlorine in the treatment of water has been reviewed indetail (White, 1986), and the following summary is based largely on that work.
Chlorine was discovered in 1774 by Karl W Scheele and identified as anelement in 1810 by Humphrey Davy. Javel water (a solution of potassiumhypochlorite) was introduced in 1785 by Berthollet, and the commercially
important development of a cheap, stable bleaching powder, calcium hypochlorite,was achieved by Tennant in 1798.
One of the first reported uses of chlorination for the disinfection of watersupplies was in 1897, when bleach solution was used to disinfect a water main ¡nMaidstone, Kent, UK, following an outbreak of typhoid. Regular use in water
treatment began around the beginning of the twentieth century. Probably, the firstcontinuous application was in 1902 at Middelkerke, Belgium, where ferric chloride,used for 'coagulation' (see p. 47) was mixed with calcium hypochlorite, producinghypochlorous acid; in 1903, at Ostende, Belgium, chlorine was generated frompotassium chlorate and oxalic acid. ln the UK, the first known regular use (ofsodium hypochlorite) was in 1905 in Lincoln after a typhoid epidemic. ln 1908 inChicago, IL, USA, George A. Johnson instituted chlorination by adding 'chloride oflime' to contaminated river water. Chlorination of a river water supply to JerseyCity, USA, at the turn of the century was significant in that, in the litigation thatdevelöped, objections regarding the ineffectiveness, potential hazards and generalundesirability of the addition of chlorine to water supplies were overcome. Thesedevelopments were quickly followed by similar examples in most industrialized
-45-

46 lARe MONOGRAHS VOLUME 52
countries. As a result, most large-scale public water supplies are now disinfectedchemically by chlorine (White, 1986), although there are many smalllocal supplies(small wells, private springs) that are not disinfected by any means.
Prior to the successful widespread introduction of chlorination, water
treatment techniques existed that included filtration, followed by chemicalprecipitation and sedimentation techniques. These methods alone, however, couldnot guarantee a bacteriologically safe water supply.
The main diseases can be controlled (to varying extents) by goodphysicaI/chemical water treatment and chemical dis infection include typhoid fever,cholera, amrebic dysentry, bacterial gastroenteritis, shigellosis, salmonellosis,eampylobacterenteritis, Yersina enteritis, Pseudomonas infections, schistosomiasis,giardiasis and various viral diseases, such as hepatitis A (National ResearchCouncil, 1980; Hoff & Akin, 1986; White, 1986).
The early use of chlorine to disinfect drinking-water involved hypochloritesolutions. ln 1910-20, it became possible to store and transport liquid chlorine, andthe development of suitable chlorinator installations led to increased use of chlorineitself for this purpose, providing easier control and monitoring and betterdisinfection than the various hypochlorite solutions. Notable in these andsubsequent developments in the field ofwater treatment chlorinators were Wallaceand Tiernan, who patented a variety of control and safety devices (White, 1986).The introduction of chlorine-resistant plastics in the 1950s and increasedunderstanding of the chemistry of chlorination hastened the process. Furthermajor developments were the use of ammonia-chlorine reactions and thebreakpoint phenomenon (see p. 51) to minimize the taste and odour of chlorine,precise control of chlorine residues by dechlorination with sulfur dioxide and, morerecently, concern over organic chemical by-products and the possible need for theircontrol. These developments are discussed in the following sections.
1.2 Overview of the addition of chlorine during drinking-water treatment
Before discussing the addition of chlorine during water treatment, it is usefulto review the important stages ofwater treatment and the chemistry of chlorination.
(a) Drinking-water treatment
The fundamental purpose of water treatment is to protect the consumer fromimpurities that may be offensive or injurious to human health. A secondarypurpose is to deal with impurities which, although not directly harmful to health,may cause problems such as corrosion and discoloration. These purposes areachieved by setting up barriers such as coagulation and filtration, which removeimpurities by precipitation and particle capture. The final barrier is disinfection.

CHLORINATED DRINKING-WATER47
The main purpose of treatment prior to dis infection is to prepare the water foreffective and reliable disinfection, for example by removing suspended solids whichcan impair disinfection efficiency.
Surface water sources, i.e., those exposed to air on the surface of the Earth,comprise waters ofwidely varying quality, from high qualitywaters containing littleknown contamination (such as treated or untreated wastewater) to lowland riversthat contain appreciable contamination from a variety of sources. Deepgroundwaters, i.e., the water that is naturally contained in and saturates the subsoil,are normally of high quality. However, sorne groundwaters, particularly those thatare shallow and those in highly permeable strata, are vulnerable to specific localizedcontamination by a variety of substances-especially volatile chlorinatedhydrocarbons such as trichloroethylene (see IAC, 1987). Springs constitute a
water source in which the groundwater meets an impermeable rock stratum and is'forced out of the ground; theyare usually of high purity.
Surface waters are more prone to contamination than groundwaters and somore often need pretreatment. Some pretreatment may be afforded by storing thewater in a reservoir, which can result in sedimentation of suspended solids and asignificant reduction in the numbers of any pathogenic organisms present. Variousadditional pretreatment methods are used, generally to rem
ove suspended solidsand naturally occurring coloured impurities. The principles involved in theseprocesses are discussed below. Apart from disinfection, high quality groundwatersneed no or minimal physical or che
mi cal treatment.
(i) Coagulation, sedimentation and filtration
Coagulation: Sorne impurities in natural waters cannot be removed by settIingalone, either because they are dissolved or because they occur in a very finely
divided Ccolloidal) state. The addition of a chemical coagulant is needed to createlarge particles that can settle, called 'flocs'. The coagulants most commonly usedare aluminium and ferric salts. When these chemicals are added, a precipitate ofthe metal hydroxide forms which removes suspended solids, algae and colour by anumber of mechanisms, including adsorption and trapping. Mechanical orhydraulic mixng causes the hydroxide precipitate, together with impurities, toaggIomerate into flocs a few miIImetres in diameter. Other chemicals, calledpolyelectrolytes, can be used in addition to, or in place of, aluminium or ¡roncoagulants to produce stronger or larger flocs. Once formed, the flocs are removedfrom the water by filtration, generally preceded by sedimentation.
Sedimentation and jlotation: Sedimentation is used to remove the bulk of theflocs, so as to reduce the load on downstream fiters. Sedimentation may take placein rectangular or circular, horizontal basins in which discrete settling of flocs occursor, commonly in sorne European designs, in 'floc blanket' clarifiers, in which the

48 lARe MONOGRAHS VOLUME 52
water flows upwards through a fluidized bed of flocs and treated water is taken fromthe top of the clarifier. Flocs have a density only marginally greater than water, sotreatment rates must be low. Typical tank loadings are ~ 1-5 m/h.
An alternative process to sedimentation is dissolved air flotation. ln thisprocess, water saturated with air under pressure is released into the water
containing f1ocs, and tiny air bubbles become attached to the f10cs and f10at them tothe surface of the water. This is a faster process than sedimentation; typical
loadings being 5- 12 m/h. Dissolved air flotation may be particularly suitable for the
treatment of coloured, low-turbidity waters and algal-Iaden waters.
Filtration: Deep-bed filtration through sand is employed to remove theremaining particulate matter. Water is passed through a bed of sand, typicallycomposed of grains 0.5- 1.0 mm in diameter, one-metre deep. Particles are trappedwithin the bed by a variety of mechanisms including straining, sedimentation,interception and electrostatic adhesion. Filtration rates are typically 4- 10 m/h. Asparticles are trapped within the bed, the resistance to f10w increases, necessitating a
greater head ofwater (pressure) to maintain a constant rate offlow. Once a limitinghead loss is reached, or solids start to be released from the filter, the filter is cleanedby backflushing with clean water.
ln the treatment of turbid waters, filtration is almost always preceded bysedimentation, and filters are of the open 'gravity filter' type. With sorne lowturbidity waters, including coloured moorland waters, the sedimentation stage maybe omitted and direct filtration employed. With direct fIltration, pressure fitrationcan be used to conserve a hydrostatic head.
(ii) Slow sand filtration
Slow sand filtration, which is a well-established process, is an alternative to thecoagulation process for waters with little colour and a moderately low concentrationof suspended solids. A slow sand filter consists of a 0.5- l.5-m-deep bed of fine(0.15-0.35 mm) sand, supported on a layer of gravel by a system of underdrains. Atthe low flow rates used (0.1-0.3 m/h), solids settle onto the surface of the sand. Thelayer formed, known as the 'Schmutzdecke', contains mu d, organic waste, bacterialmatter and algae and is biologically active. The mechanisms involved in slow sandfiltration are: removal of colloidal material by straining, adsorption and bacterialaction; destruction of pathogenic organisms by bacterial action; and purification ofthe water above the filter by bacterial action, f1occulation and pathogen death.
As filtration progresses, the head loss through the bed increases to the point atwhich the required f10w rate cannot be maintained. The filter is then taken out ofaction and the top layer is skimmed off manually or mechanically. The sand iswashed for re-use. Eventually the depth of sand in the filter becomes insufficient foreffective filtration, and more sand is added.

CHLORINATED DRINKlNG-WATER 49
(iii) Other processes
A number of other processes may be employed prior to disinfection of water;these processes are applicable to groundwaters as weIl as surface waters.
Aeration may be employed for a variety of reasons, including removal ofvolatile taste- and odour-producing compounds, precipitation of iron andmanganese and removal of carbon dioxide.
Oxiation may be used for purposes other than disinfection; these includeprecipitation of iron and manganese, taste and odour control, colour removal andoxidation of trace organic compounds. The principal oxidizing agents employed inwater treatment are chlorine, chloramine, ozone and chlorine dioxide (White, 1986).
pH Adjustment, usually to more alkaline levels, is used to achieve optimalvalues for other processes, including coagulation and disinfection, as weIl as toreduce the corrosiveness of the water supply. pH can be increased byaddingchemicals such as lime, caustic soda or soda ash or by placing the water in contactwith a bed of sparingly soluble material, such as marble.
The pH of drinking-water is typically in the range 6.5-8.5, but levels up to 9.5can occur.
Softening: Hardness in water results from the presence of calcium andmagnesium compounds. When hardness is excessive, it can be reduced byprecipitation softening or ion exchange. ln precipitation softening, lime (andsometimes soda ash) is added to precipitate calcium as calcium carbonate, which isremoved in a sedimentation tank. Ion-exchange softening is used only forgroundwaters; the water is passed through a bed of cationic resin which exchangessodium for calcium and magnesium. When the resin is fully loaded with calciumand magnesium, it is regenerated using a strong brine solution.
Activated carbon may be employed to remove natural and synthetic organicchemicals. It is produced by the controlled combustion of wood, coal and othermaterial to produce a porous material with a large surface area and a high affinityfor organic compounds. A slurry of powder can be added to the water and thenremoved by subsequent treatment processes, such as coagulation. Alternatively,granular-activated carbon can be employed in purpose-built adsorbers, or as areplacement for sorne of the sand in a rapid gravity filter.
(b) General chemistry of the addition of chlonne
The basic chemistry of water chlorination has been studied by a large numberof workers and has been reviewed (National Academy of Sciences, 1979; NationalResearch Council, 1980; White, 1986). The main features are as follows.
Chlorine dissolves rapidly in water to establish an equilbrium with
hypochlorous acid (HOCI) and hydrochlorIc acid (HCI):

50 lARe MONOGRAHS VOLUME 52
Cli + HiO í: HOCI + H+ + Ci- (pKa = 9.5).ln dilute solutions and at pH levels above 4.0, the equilibrium is displaced to the
right and very little molecular chlorine exists in solution. Between pH 6.0 and 8.5,hypochlorous acid dissociates almost completely to form the hypochlorite 'ion(OCi-):
HOCI í: OCi- + H+.
At pH levels above 9.0, hypochlorite ions are the dominant species.Alternative sources of hypochlorite ions are calcium hypochlorite and sodium
hypochlorite. Essentially the same active species and equilibria are establishedwhether the source of chlorine is liquid or gaseous or a hypochlorite compound.
The total concentration of molecular chlorine, hypochlorous acid and
hypochlorite ion is defined as 'free available chlorine'. Total available chlorine maybe defined as the mass equivalent of chlorine contained in aIl chemical species thatcontain chlorine in an oxidized state. Combined available chlorine can be definedas the difference between total available chlorine and free available chlorine andrepresents the amount of chlorine that is in chemical association with variouscompounds (usually amino- or ammoniacal nitrogen) but that is also capable ofdisinfecting. Free chlorine species are generally more effective disinfectants thancombined chlorine species.
Raw (untreated) water may contain a large number of compounds that canreact with chlorine species, including inorganic reducing agents (HiS, sOi-, NOi-,Fei+ and Mni+, which are oxidized to, for example, S04i-, N03-, Fe3+ andMnOi); ammonia and amino-nitrogen groups; and organic substances.
The principal effects of these side-reactions are the formation of by-productsand a loss of dis infection efficiency as active chlorine species are reduced to lessactive combined species, particularly the non-bactericidal chloride. The mostsignificant side-reactions, in terms of chlorine demand, are those involvingammonia or amino-nitrogen groups.
The reaction between hypochlorous acid and ammonia in dilute aqueoussolution yields, successively, monochloramine (NH2CI), dichloramine (NHCI2)and trichloramine (more commonly known as ni trogen trichloride, NCI3):
NH3 + HOCI í: NHiCI + HiONHiCl + HOCI í: NHCli + HiONHiCI + HOCI í: NCl3 + HiO.
Hypochlorous acid and ammonia may also react to yield nitrogen:
2NH3 + 3HOCI í: Ni + 3HCI + 3HiO.These reactions are dependent on pH, temperature and the initial ratio of chlorineto ammoniacal nitrogen.

CHLORINATED DRINKING-WATER51
An important reaction that often occurs in the chlorination of water is theformation of hypobromous acid from bromide:
HOCI + Be -+ HOBr + Ci-.Even at low bromide concentrations, this reaction leads to readily detectable levelsof brominated organic by-products, such as brominated trihalomethanes, due tothe reactivity of hypobromous acid. Bromide concentrations in untreated watervary widely: for example, in ni ne rivers in various regions of the USA, bromide levelsranged from 10 to 245 J.g/1 (Amy et al., 1985). The occasional detection of iodinatedhalomethanes is probably due to a similar mechanism involving iodides.
Organic chloramines are formed when chlorine reacts with amines, aminoacids, proteinaceous material and other forms of organic nitrogen involving amiiiogroups or linkages. Organic chloramines are usually formed at slower rates th
aninorganic chloramines and are not considered to be effective disinfectants. Whilesome organic chloramines are stable, others are not and degrade to many otherby-products.
Addition of chlorine to waters containing dissolved organic compounds canresult In three possible reactions, which are classified as:
(i) addition,
(ii) ionic substitution and
(iii) oxidation.
While aIl of these reactions result in an increase in the oxidation state of thesubstrate, (iii) results only in unchlorinated products (Pierce, 1978). The amount oforganic matter in untreated water varies considerably. Typically, high quaIitygroundwater contains up to 1 mg/l (as organic carbon), river water contains 1-10mg/l (as organic carbon), while upland water may contain up to 20 mg/l (as organiccarbon) which is almost entirely of natural origin (in humic substances). The totalorganic matter present would be roughly double these concentrations.
The use of ammonia with chlorine in water treatment, often called the'chloramination' or 'chloramine' process, is designed to convert fully or partially thefree chlorine to chloramine. The chloramine produced has a disinfectant action.Although it is less effective than chlorine, it has a lesser tendency to react withorganic matter to form by-products: it generates less chlorophenolic taste fromphenol and, of more recent interest, fewer by-products such as trihalomethanes.Chloramines are also more persistent in the drinking-water distribution system.The development of the chloramination process has been reviewed (White, 1986).
Chloramination was popular until the discovery and understanding of the'breakpoint phenomenon'. ln breakpoint chlorination, the aim is to maintain anoptimal free residue of chlorine; to achieve this, any ammonia in the water Isdestroyed by addition of sufficient chlorine. As described above, chlorine reacts

52 lARe MONOGRAHS VOLUME 52
rapidly with ammonia in water to form monochloramine, dichloramine and
trichloramine, depending on the ratio of chlorine to ammonia and other factors,such as pH. ln practice, as the molar ratio of chlorine to ammonia increases
towards 1:1, the combined chlorine residue in the water increases steadily. Beyondthis ratio, i.e., with more added chlorine, the combined residue decreases quickly toa point beyond which further addition of chlorine produces a steady increase in freechlorine residue. This point (theoretically at around 1.5 mol chlorine to 1.p molammonia) is the so-called breakpoint. For many waters, addition of sufficientchlorine to exceed the breakpoint, thus achieving a combined residue (free chlorineplus chloramines) containing about 85% free chlorine, produces the mostsatisfactory palatability. It was found recently that these levels of free chlorine oftenenhance levels of organic chemical by-products such as trihalomethanes;
consequently, breakpoint chlorination has been replaced at some treatment worksby other processes (White, 1986).
The concentration of chlorine entering the distribution system is often reducedslightly, to conform to operational requirements, by the addition of a small quantityof a reducing agent; typicaIly, sulfur dioxide is used.
(c) Addition of chlorine du ring water treatment
Current drinking-water treatments reflect other objectives of chlorination, inaddition to kiling pathogenic organisms. These objectives include the destructionof substances and organisms that confer tas te and odour on the supply and fouIequipment, such as filters and pipelines, and the oxidation of undesirable chemicalsubstances such as Fe2 + and Mn2 + in raw water.
Additions of chlorine during the treatment and distribution of drinking-watercan be summarized as follows:-prechlorination of raw water (Le., prior to any treatment),-addition at various points in the treatment process,
-addition after treatment but before distribution (Le., final works dis infection),-addition during distribution, and
-miscellaneous use during maintenance activities.Prechlorination has been used extensively for the treatment of lower quality
surface water. The amount of chlorine added is usually in the range of 1-10mg/l-typically around 5 mg/l, although much higher levels have been used. Suchadditions of relatively large amounts of chlorine directly to raw water can producehigh levels of by-products such as trihalomethanes; consequently, efforts have beenmade to reduce the level of prechlorination or to abandon it completely.
Chlorine (typically less than 5 mg/l) may also be added aftercoagulation/before sedimentation or after sedimentation/before filtration,

CHLORINATED DRINKING-WATER 53
generally to maintain improved flow by preventing build-up of slimes and bacterialgrowth. At sorne works, chlorine is added (at 2-5 mg/l) to oxidize ferrous sulfate toferric sulfate, which is then used as a coagulant.
The quantity of chlorine added for disinfection after treatment depends on theactual treatment process, but generally sufficient chlorine is added to provide thedesired chlorine resi d ue (free chlorine and chloramine), usually in the range of 0.5-1mg/I. Higher levels have been used (e.g., up to 5 mg/l; White, 1986) when difficultiesin maintaining a residue in distribution are experienced, for example, with long
pipelines.Within large distribution systems, further chlorine may be added to maintain a
desired residue at consumer taps. The quantity of chlorine ad de d, usually at a
covered water storage reseivoir, varies but is typically in the range of 0.5-2 mg/I.High doses of chlorine (about 50 mg/l) are used for disinfecting new or
repaired equipment such as distribution pipes; however, such highly chlorinatedwater is usually flushed to waste.
ln Europe, the USA and in other industrialized countries, where most watersupplies are disinfected, usually with chlorine, high-quality groundwater sourcesusually receive minimal treatment and relatively low doses of chlorine (up to around1 mg/l) for disinfection. Surface waters generally receive more chlorine, dependingon the quality of the source water, as discussed above.
1.3 Impnrities in chlorine gas and liquid
Various processes have been used for the commercial production of chlorinegas and liquid; the relative popularity of each has often been governed byeconomicaspects-particularly the cost and availability of starting chemicals from otherindustrial processes. Most of the current production of chlorine is accompli shedelectrolytically from brine using diaphragm, mercury or membrane cells. To a lesserextent, hydrochloric acid is used instead of brine. Sorne chlorine is also producedby ,the catalytic oxidation of hydrochloric acid and the action of nitric acid onsodium chloride, known as the salt process.
The main impurities in chlorine that are of possible relevance to the quality ofdrinking-water are carbon tetrachloride (see IARC, 1987) and bromine. Generally,the level of carbon tetrachloride is such that the residual concentrations in
drinking-water, if any, are very low. A detectable level (1 mg/l) that was reportedappeared to be due to unsuItable chlorine manufacture (carbon tetrachloride wasused in this particular process). Consequent to this incident, the American WaterWorks Association set a maximum level for carbon tetrachloride in chlorine at 150mg/l (White, 1986).
Bromine in chlorine gas or liquid could result in brominated by-products. Thelevels of bromine in commercial chlorine available in the UK for drinking-water

54 lARe MONOGRAHS VOLUME 52
treatment are, however, low (maxima, 850 and 2500 ppm (w/w) in two sources) (ICIChemicals and Polymers Ltd, 1988), and typical levels in the USA are 50-125 ppm(maximum, 200 ppm) (The Chlorine Institute, USA, 1990).
1.4 Alternative disinfectants for drinking-water
Although chlorine is by far the most commonly used dis infectant (and oxidant)in drinking-water treatment, other chemicals, particularly ozone and chlorinedioxide, have been used for many years. Concern over possible risks to health dueto the by-products of chlorination has led to a wider interest in alternatives.
Ozone is a powerful oxidant and an excellent disinfectant. It is used fortreating drinking-water at many waterworks throughout the world, particularly incertain countries, for example France. It must be generated on site, andconsequently it is less suited than chlorine to application at small treatment works.It does not leave a residue in the distribution system, since it decays quickly inwater; therefore, if a residue is required, ozone must be used in conjunction with adisinfectant that gives such a residue (White, 1986).
Ozone produces a range of by-products, particularly aldehydes and organicacids (White, 1986), and it can generate low levels of bromoform (see monograph,p. 213) (Jacangelo et aL., 1989) by oxidation of bromide to hypobromous acid (Amyet al., 1985). Evidence concerning the bacterial mutagenicity of ozonation
by-products is conflicting; in general, ozone generates less mutagenicity thanchlorine, but different mutagens are likely to be produced (National Academy ofSciences, 1979; National Research Council, 1980; Fielding & Horth, 1988).
Chlorine dioxide is used at a number of waterworks, particularly for watersources in which chlorophenolic tas tes result from the use of chlorine (due tochlorination of phenol). It does not form trihalomethanes and it persists indrinking-water, which means that it provides a residue in the distributed supply. lnuse, however, it produces chlorite and chlorate, which must be carefully controlled,
. as they are relatively toxic species. The by-products of chlorine dioxide are not weIlcharacterized. ln general, chlorine dioxide produces low levels of bacterialmutagenicity, but, as in the case of ozone, the mutagens involved are probablydifferent from those produced by chlorine (National Academy of Sciences, 1979;National Research Council, 1980; Fielding & Horth, 1988).
Monochloramine is a less powerful disinfectant than chlorine, ozone orchlorine dioxide, but it is more persistent in drinking-water and has been used tomaintain a low residual level in a distribution system over many years. Recently,interest in Its use on a more substantial scale has been raised because it does notlead to high levels of trihalomethanes (Jacangelo et aL., 1989). Little information isavailable on the by-products of chloramine; it generates bacterial mutagenicity, butless consistently and at a lower level than does chlorine.

CHLORINATED DRINKING-WATER 55
2. Occurrence and Analysis of Compounds Formedby the Chlorination of Drinking-water
2.1 Occurrence
The composition of chlorinated drinking-water to which the consumer isexposed varies according to location. The variables of established importance inthe production of potentially toxic compounds are total organic carbonconcentrations, pH, ammonium and bromide ion concentrations and thequalitative composition of the organic matter. Minor constituents are otherinorganic ions such as nitrate, additives to drinking-water and other treatmentprocesses.
The pKa ofHOCI (one of the forms that chlorine assumes in aqueous solution)is 9.5 (see equation on p. 50). At pH ~ pKa, chlorination reactions are moreprominent (White, 1986). Many by-products produced at low pH (2-7) are unstableat neutral to alkaline pH. This is particularly true of mutagenic chemicals formedon chlorination (Meier et al., 1983, 1985). The concentrations of other by-products(e.g., dichloroacetic acid) appear to be more or less independent of the pH (Krasneret al., 1989), while others decrease markedly at high pH (e.g., trichloroacetic acidand chloral). Conversely, the amount of trihalomethanes increases markedly as thepH becomes more alkaline. The pH of drinking-water is sometimes altered duringthe course of treatment (e.g., lime softening).
The relationship between chlorine dose and the amount of orgaiiic carbon thatis present greatly affects the by-products formed. This becomes a critical issue inassessing whether the chlorine residue commonly maintained in chlorinated watersor the by-products of chlorination that are formed are responsible for anyeffectsobserved epidemiologically. The chlorine:carbon molar ratios normally foundduring the chlorination reaction in drinking-water treatment are very different froIDthose found in ingested water in the gastrointestinal tract. ln drinking-water, theratio is typically in the range of 1.0- 1.5, and that in the gastrointestinal tract is muchlower. As a consequence, data gathered in the USA, where fairly high residual levelsof chlorine remain in treated water as it is consumed at the tap (0.5-2 mgl), may notbe applicable to practice in other parts of the world where residues are deliberatelymaintained at low levels ( ~ 0.1 mg/l). Finally, it is important to recognize that theactual practice in many locations is to maintain residues as 'combined residuals'(e.g., by adding ammonia to form chloramine) after using chlorine or otherchemicals for primary disinfection.
As a consequence, chlorinated water in different locations cannot beconsidered to be the same entity. This fact has added a complex dimension to

56 lARe MONOGRAHS VOLUME 52
evaluation of the carcinogenic hazard for humans of chlorinated water that is notordinarily encountered in these Monographs. Nevertheless, it was the view of theWorking Group that this issue was of great importance to public health.Consequently, it endeavoured to make as objective an evaluation as is possible,given the vagaries of the data. The Working Group considered it important that theappropriate public health and regulatory authorities recognize the need to clarifythe broad issue of drinking-water disinfection with appropriate research efforts inthe near future. This issue must be resolved in a way that first protects against thewaterborne infectious diseases observed in past centuries and then provides forminimizing or even eliminating any carcinogenic hazards that are secondary to thisprimary goal.
The addition of chlorine to waters containing dissolved organic compoundsresults in complex reactions that le ad to chlorination by-products. The nature andextent of reaction of organic substrates in natural waters with chlorine is controlledby several factors, particularly pH and the chlorine:substrate ratio. An additionalfactor of importance is the presence of bromide in the untreated water (see p. 54),which can lead to brominated compounds.
Improvements in analytical techniques over recent years have revealed acor.aplex range of organic substances in water supplies (Commission of theEuropean Communities, 1989), and it has become apparent that many of these aregenerated during water chlorination. The probable organic precursors of thesesubstances occur commonly and are of natural origin; they incIude humicsubstances and organic nitrogen compounds, such as amino acids (White, 1986).
The following sections summarize the available information on groups ofhalogenated by-products, selected mainly on the basis of the frequency of theiroccurrence in chlorinated water.
(a) Trihalomethanes
The production of chloroform (see IARC, 1987) during chlorination of naturalwaters was first observed by Bellar et al. (1974) and Rook (1974); this findinginitiated many investigations into the identity, source and significance ofchlorination by-products. Subsequently, a variety of additional trihalomethaneswas detected (for example, Fawell et aL., 1986; Fielding & Horth, 1986), whichinclude bromodichloromethane (see monograph, p. 179), chlorodibromomethane(see monograph, p. 243), tribromomethane (bromoform) (see monograph, p. 213),iododichloromethane, iododibromomethane, bromochloroiodomethane andchlorodiiodomethane. Total trihalomethane levels in treated drinking-water werereported in one survey in the UK (Water Research Centre, 1980): Chlorinated waterderived from a lowland river contained a mean level of 89.2 J.g/I (SD, 0.9-3.9), andthat from an upland reseivoir, 18.7 J.g/I (SD, 0.2-1.3). The study also showed that

CHLORINATED DRINKING-WATER 57
chlorinated groundwater was contaminated by trihalomethanes to a significantlylesser extent th an chlorinated surface waters. Chloroform was the predominanttrihalomethane.
The occurrence of chloroform in drinking-water was reviewed in an earlIermonograph (see IARC, 1979a), which indicated that unchlorinated waters containlow concentrations (typically -c 1 l1g/I), but chlorinated waters in several countriesinvariably contain chloroform at levels up to 311 l1g/1 (Symons et al., 1975). Similarfindings were reported in later surveys (for example, Brass et al., 1977; Water
Research Centre, 1980).
Chloroform was measured in a range of surface, reservoir, lake andgroundwaters in the USA (Krasner et al., 1989). The median values (according toseason) ranged from 9.6 to 15 l1g/1 for chloroform, 4.1-10 l1g/1 for bromo-dichloromethane, 2.6-4.5 l1g/1 for chlorodibromomethane and 0.33-0.88 l1g/1 forbromoform. Concentrations of chloroform in 100 US surface waters were 0.1-1 j.g/1
(39%), 1-10 l1g/1 (49%), 10-100 I-g/I (12%) and 100-1000 I-g/I (-c 1%) (Perwak et al.,1980). Quaghebeur and De Wulf (1980) found mean total concentrations oftrihalomethanes in Belgium of 7.7 l1g/1 in groundwater and 78 l1g/1 in surface water;chloroform was the predominant trihalomethane in treated surface waters. ln theUSA, three of 13 groundwater supplies had levels of -c 0.2, 2.6 and 83 l1g/1chloroform, while in the other 10 surface water supplies the levels ranged from 1.3 to130 l1g/1 (Reding et al., 1989).
Nicholson et al. (1984) reported chloroform concentrations in drinking-waterfrom 17 countries at levels ranging from not detected to 823 J.g/I; levels ofbromodichloromethane ranged from not detected to 228 l1g/l; those of chlaro-dibromomethane ranged from not detected to 288 l1g/l; and those of bromoformfrom not detected to 289 l1g/L.
Bromodichloromethane levels have been reported in many studies. ln treateddrinking-water, concentrations typically range from 1 to 50 l1g/l, with higher orlower values at sorne locations compared with those in untreated water samples,which are typically less than 1 I-g/I (see monograph, p. 179). Surface andgroundwater samples showed a similar range; however, in certain groundwaters, theconcentrations were higher than those in surface waters. An analysis of 19 550
water samples in the USA revealed a mean bromodichloromethane concentrationof Il l1g/1 (range, 0-10 133 I-g/I) (US Environmental Protection Agency, 1985). (TheWorking Group noted that the very high concentrations seen may be misleading,since no information was available on possible contamination by wastewater or onmeasures of quality control.) Concentrations of bromodichloromethane in 118

58 lARe MONOGRAHS VOLUME 52
surface waters in the USA ranged from 0.1 to 1 llg/l in 66% of the samples, 1-10 J.g/Iin 31% and 10-100 llg/l in 3% (Perwak et aL., 1980).
Chlorodibromomethane levels have also been reported in many studies. lntreated drinking-water, concentrations typically ranged from 1 to 20 llg/l, withhigher or lower values at sorne locations compared with those in untreated waters,which are typically less than 1 llg/L. Treated groundwater samples showed, ingeneral, higher chlorodibromomethane concentrations than treated surface water(see monograph, p. 243). An analysis of 18 616 water samples in the USA revealed ame an chlorodibromomethane concentration of 10 llg/l (range, 0-10 133 llg/l) (USEnvironmental Protection Agency, 1985). (The Working Group noted that the veryhigh concentrations may be misleading, since no information was available onpossible contamination by wastewater or on measures of analytical quality control.)Concentrations of chlorodibromomethane in 115 surface waters in the USA rangedfrom 0.1 to 1 llg/l in 80% of samples and from 1 to 10 llg/l in 20% (Perwak et al.,1980).
Bromoform has been determined in many chlorinated drinking-water samples(see monograph, p. 213). It was not usually found (.( 1 llg/l) in untreated watersources in the USA (Symons et al., 1975). Concentrations in surface water in theUSA typically ranged from 1 to 10 llg/l, with a median of about 4 llg/l (Brass et al.,1977; Perwak et aL., 1980). Maximal levels in chlorinated groundwaters tend to be
higher (up to 240 llg/l) (Glaze & Rawley, 1979; Page, 1981). Levels of bromoform inchlorinated groundwater vary widely, probably because of variations in the naturalbromide content; at high bromide levels, the median value for bromoform was 72llg/l (Krasner et al., 1989).
Heating or boiling drinking-water containing trihalomethanes causes theconcentrations to decrease significantly (Table 1) (Lahl et aL., 1982).
Table 1. Errect or heating and boiling water on trihalomethane contenta
Compound Level (~gli)
Original 80°C: 100° C: Boiling: Boiling:tap water 1 min o min 1 min 5 min
Chloroform 45.6 23.2 12.3 9.4 4.1
Bromodichloromethane 44.6 24.1 13.5 10.8 4.6
Chlorodibromomethane 42.3 24.1 14.4 12.3 5.5
Bromoform 35.9 21.3 13.9 13.5 6.8
tlrom Lahl et al. (1982)

CHLORINATED DRINKING-WATER59
Since the late 1970s, many countries have endeavoured to control the levels oftrihalomethanes in water supplies to meet national standards, which range from 25to 250 J.g/I (World Health Organization, 1988). The WorId Health Organization(1984) set a guideline value for chloroform in drinking-water of 30 J.g/I.
(h) Halogenated acetic acidsHalogenated acetic acids, although not investigated as thoroughly as
trihalomethanes, are probably major chlorination by-products in drinking-water.Table 2 summarizes the levels reported.
Table 2. Halogenated acetic acids in chlorinated drinking-water
Water ty (location)ReferenceCorn pound Concentration
range (J1g/I)
Two chlorinated surfacewaters (USA)
Range of surface, reservoir,lake, and groundwaters(USA)
Tap water (reservoir)(USA)Tap water (Gerrnany)
Surface waters (USA)
Treated water (Australia)
Monochloroacetic acidDichloroacetic acid
Trichloroacetic acid
Monobrornoacetic acidDibromoacetic acid
Monochloroacetic acidDichloroacetic acid
Trichloroacetic acid
Monobrornoacetic acidDibromoacetic acidDichloroacetic acid
Trichloroacetic acid
Trichloroacetic acid
Trichloroacetic acid
Trichloroacetic acid
Dichloroacetic acid
1 and 49.4 and 237.4 and 220: 0.5 and 3.80.7 and 11
0: 1-1.2a
5.0-7.3a4.0-6.0a0: 0.5-1.6bO.9-19b
63.1-13333.6-161
Not detected-3
4.23-53.8
20 rnax
(similar max)
J acangelo et al.(1989)
Krasner et al.(1989)
Uden & Miler
(1983)Lahl et al.(1984)Noiwoo et al.(1986)Nicholson et al.(1984)
~edian value
Úfigh brornide level
(c) Halogenated acetonitnles
A variety of halogenated acetonitriles (see monograph, p. 269) have beendetected in chlorinated drinking-water samples, formed by the action of chlorine onnatural organic matter in water (Oliver, 1983; Jacangelo et al., 1989; Krasner et al.,1989; Peters et al., 1989). The levels found vary; the highest total concentrationfound was 42 J.g/I in a suivey in Florida (Trehy & Bieber, 1981). Halogenatedacetonitriles were not detected in raw water (Oliver, 1983).

60 lARe MONOGRAHS VOLUME 52
The most abundant of the acetonitriles is dichloroacetonitrile. ln surveys inthe USA, this compound was found in most chlorinated water supplies atconcentrations of up to 24 l.g/l, with a median of 1.2 l.g/I. Bromochloroacetonitrilewas found at concentrations up to 10 l.g/l, with a median of 0.5 l.g/I.Dibromoacetonitrile was found in some water supplies at maximum concentrationsof Il l.g/l, with a median of 0.5 l.g/1 (Krasner et al., 1989; Reding et aL., 1989).
(d) ehlorinated ketones
A range of chlorinated ketones are produced during chlorination (Table 3).Other chlorinated ketones that have been detected in drinking-water but have notbeen quantified, include 1,1,3,3-tetrachloropropanone, 3,3-dichloro-2-butanone,
1,1-dichloro-2-butanone, 1,1, 1-trichloro-2-butanone and 2,2-dichloro-3-pentanone
(Coleman et al., 1984).
Table 3. Chlorinated ketones in chlorinated drinking-water
Water typ (location) Compound Concentrationrange (Jig/l)
Reference
Range of surface, reservoir,lake and groundwaters (USA)
1,1-Dichloropropanone O.46-0.SSa2.2 (max)0.35-0.80a2.4 (max)
0.16-0.241.1-1.8
20 (max)
Krasner et al.(1989)
1,1,1- Trichloropropanone
Two chlorinated surfacewaters (USA)Drinking-water (Australia)
1,1 - Dich loropropanone1,1,1 - Trichloropropanone
1,1,1 - Trichloropropanone
J acangelo et al.(1989)Nicholson et al.(1984)
lledian
(e) Halogenated phenols
Chloro-, chlorobromo- and bromophenols can be formed from phenol duringchlorination. They add objectionable tastes or odours to drinking-water whenpresent at levels over a few micrograms per litre. Although high concentrations mayoccur during phenol pollution of untreated water, typical levels in drinking-waterare kept low to avoid consumer complaints. A recent investigation ofdrinking-water gave the following levels (l.g/l): 2-chlorophenol, -0 0.00-0.065;4-chlorophenol, -0 0.004-0.127; 2,4-dichlorophenol (see IARC, 1986), -0 0.002-0.072;2,6-dichlorophenol, -0 0.002-0.033; 2,4,6-trichlorophenol (see IARC, 1987),-0 0.008-0.719; pentachlorophenol (see IARC, 1987), -0 0.004-0.034; bromodi-chlorophenol, -0 0.002-0.78; chlorodibromophenol, -0 0.00-0.022; 2,4-dibromo-phenol, -0 0.002-0.084; and 2,4,6-tribromophenol, -0 0.00-0.022 (Sithole &
Willams, 1986).

CHLORINATED DRINKING-WATER61
(f Other halogenated hydrocarbons
Other halogenated hydrocarbons have been detected in chlorinateddrinking-water; although accu rate quantitative data are not available, levels aretypically ~ 1 l1g/1 (McKinney et al., 1976; Suffet et al., 1980; Anon., 1983; Coleman etal., 1984; Kopfler et al., 1985; Fielding & Horth, 1986; Fawell et aL., 1987; Horth et al.,1989). These compounds include bromoethane (see monograph, p. 299), bromo-butane, bromochloromethane, bromochloropropanes, bromopentachloroethane,bromopropane, bromopentane, bromotrichloroethylene, chlorobutane, chloro-ethane (see monograph, p. 315), dibromomethane, dichloromethane (see lARe,1987), 1,1-dichloroethane, 1,2-dichloroethane (see IAC, 1979b), dichloropropene(see IAC, 1987), hexachloroethane (see IARC, 1979c), hexachlorocyclopentadiene,iodoethane, tetrachloromethane (carbon tetrachloride) (see IARC, 1987) andpentachloropropene. It is not cIear, however, to what extent, if any, thesecompounds result from chlorination of water.
(g) ehlonnated furanones and related compounds
Studies on the possible identity of chemical mutagens formed duringchlorination (see p. 71) have led to the detection in drinking-water (Kronberg &Vartiainen, 1988; Horth et al., 1989; Fawell & Horth, 1990) of 3-chloro-
4-( dichloromethyl)-5-hydroxy-2(5H)-furanone, referred to as MX, and E-2-chloro-3-( dichloromethyl)-4-oxobutenoic acid, referred to as E- MX (see also the section ongenetic and related effects, p. 66). Levels of MX and E- MX that have been detectedare given in Table 4.
Table 4. Concentrations of MX and E-MX in chlorinated drinking-water
Water typ (loction)Corn pound Concentration range
(l.g/l)Reference
Surface treated and chlorinatedwaters (Finland)
MXE-MX
-( 0.00.0670.002-0.059
Kronberg &Vertiainen (1988)
Treated and chlorinated lowlandrivers (UK)
Treated and chlorinated uplandwaters (UK)
MX Not detected-o.OO Fawell & Harth(1990)
Fawell & Harth(1990)
MX Not detected-0.041

62 lARe MONOGRAHS VOLUME 52
MX and E- MX are though to be related in the following manner:
CI
1
CI-C-H CI\ /C= C1 1
HO-C-H C = 0\ /o
..
Ci
1
CI-C-H Ci\ /C= C/ \
0= C COOH1
H
light
.. .
MX 'Open form'
..
CI
1
CI-C-H COOH\ /C= c/ \
0= C CI1
H
E-MX
(h) Miscellaneous compounds round in chlorinated water
Other compounds that have been reported to be present in chlorinateddrinking-water are listed in Table 5.
Table s. Concentrations of miscellaneous chlorination products in chlorinateddrinking-water
ReferenceWater ty (location) Corn pound Concentrationrange (¡.gll)
Eight treated waters (UK) 5-Chlorouracil 0.1-14.15-Chlorouridine 0.7-26.74-Chlororesorcinol 1.6-4.75-Chlorosalicylic acid 2.3-12.5
Six treated waters (USA) Chlora) (hydrate) 7.2-18.2
Two utilities (USA) Chloral (hydrate) 6.3-19
Range of surface, reservoirs, Chloral (hydrate) 1.7-3lake and groundwaters(USA)Range of surface, reservoir, Chloropicrin 0.07-1Jake andgroundwaters(France, UK, USA)
0.10-0.16
Crathome et al.(1979)
Uden & Miler(1983)Jacangelo et al.(1989)Krasner et al.(1989)
Duguet et al.(1985); FawelI et al.(1986, 1987);J acangelo et al.,1989)Krasner et al.(1989)

Table 5 (contd)
CHLORINATED DRINKING-WATER 63
Compound Concentration Reference
range (J.lg/I)
Water typ (location)
Range of surface andgroundwaters (UK)
Not stated (USA)
Range of surface andgroundwaters (UK)
Range of surface, reservoir,lake and groundwaters(USA)
Bromodichloronitro- Not quantifiedmethaneBromochloronitromethane Not quantified
Trichloropropenenitrile Not quantified
Fawell et al. (1986)
Coleman et al.(1984)
Fawell et al. (1986,1987)
Benzyl cyan ideChlorohydroxybenzyl
cyan ide
FonnaldehydeAcetaldehyde
Not quantifiedNot quantified
2.1-17a2.1-7.1a
Krasner et al.(1989)
anue to presence in untreated water and increase during chlorination
Formaldehyde and acetaldehyde were found in untreated water and werefound at higher levels in water treated with various disinfectants, including chlorine.Ozone produced the highest levels (Krasner et al., 1989).
(i) Adsorbable organic halide
The total halogenated matter generated by chlorination has been estimated bymeasuring adsorbable organic halide (halogenated organic compounds that can beadsorbed onto activated carbon; see p. 49). A recent survey of drinking-water
(Krasner et aL., 1989) found median levels in the range of 150-250 Jlg/I. Therelationships among the individual chlorination by-products covered by thismeasurement and between individual products and halogenated organiccompounds vary substantially.
(¡) Sources of chlorination by-products
At present, it is not possible to analyse aIl of the by-products of chlorination orother disinfectants/oxidants. ln order to understand the production of by-productsand to identify unknown by-products, many workers have studied substancesoccurring in raw water that could react with chlorine. Such studies have revealedby-products that have been found in water supplies and others that could be presentbut have not, as yet, been detected.
Rook (1977) suggested that humic substances are involved as precursors.These naturally occurring substances are an i1-defined mixure of chemically and

64 lARe MONOGRAHS VOLUME 52
microbiologically degraded plant residues, bound together by chemical andphysical processes, and are characterized as refractory, yeIlow-to-black materials.They are complex, high-molecular-weight, ubiquitous constituents of naturalwaters, where they consist mainly of humic and fulvic acids, the latter normallypredominating. They vary in character to some extent from site to site andaccording to season; the organIc matter in upland, coloured, natural water is mostlyhumic substances. They are extracted from water in several ways but usually byadsorption onto resins. Humic acids are defined operationally as becoming
insoluble at pH , 2. Fulvic acids, however, are soluble in water at aIl pHs.
Several research groups have studied the chlorination of humic substancesextracted from soil and water and confirmed that chloroform and dichloro- andtrIchloroacetic acids are produced as major reaction products. A variety of otherproducts and intermediates have also been characterized. Christman et al. (1983)studied the chlorination of humic and fulvic substances extracted from water andfound a wide variety of chlorinated saturated and unsaturated aliphatic acids. ln arecent review, Christman et aL. (1989) gave the significant products detected as:chloroform (CHC13), bromodichloromethane (CHBrCI2), chloral (CCI3-CHO),chloroacetic acid (H2CCI-COOH), dichloroacetic acid (H2CCI-COOH) andtrichloroacetic acid (CCI3-COOH), which are found in chlorinated drinking-water.Others produced in the laboratory are 2,2-dichloropropanoic acid (CH3-CCI2-COOH), 3,3-dichloropropenoic acid (CCI2 = CH-COOH), 2,3,3-trichloropropen-oic acid (CCI2 = CCI-COOH), dichloropropanedioic acid (HOOC-CCI2-
COOH), butanedioic acid (HOOC-(CH2)2-COOH), chlorobutanedioic acid(HOOC-CH2-CHCI-COOH), 2,2-dichlorobutanedioic acid (HOOC-CCI2-CH2-COOH), cis-chlorobutenedioic acid (HOOC-CH = CCI-COOH), cis-dichloro-butenedioic acid (HOOC-CCI = CCI-COOH) and trans-dichlorobutenedioIc acid(HOOC-CCI = CCI-COOH).
Nonchlorinated products-for example, benzene carboxylic acids, carboxy-phenylglyoxylic acids and mono- and dibasic alkanoic acids-were also reported.Depending on reaction conditions, chloroform, dichloro- and trichloroacetIc acidsaccounted for over 50% of the adsorbable organic halides (see p. 63) producedduring chlorination of humic substances. de Leer (1987) identified over 100products of the chlorination of humic acids. These were mainly those found byprevious workers, but, in addition, he described various other chlorinated
carboxylic acids, cyano-alkanoic acids and trichloromethyl precursors of chloro-form. Examples of the many precursors detected are: 3,3,3-trichloro-2-hydroxy-propanoic acid (CI3C-CH(OH)-COOH), 4,4,4-trichloro-3-hydroxybutanoic acid(CI3C-CH(OH)-CH2-COOH) and 2-chloro-3-(trichloroacetyl)butenedioic acid(COOH-(CCI3-CO)C = CCI-COOH). These by-products have not been detected

CHLORINATED DRINKING-WATER 65
in drinking-water but are probably reaction intermediates. The chloroformprecursors may form chloroform in the following manner:
HiOChC-CO-CCl = CCI-CCli-COOH ~ CHCl3 + HOOC-CCI = CCI-CCli-COOH.
The cyanoalkanoic acids (which are presumably derived fromnitrogen-containing elements of humic substances) were examined further by deLeer (1987). Cyanopropanoic acid and cyanoacetic acid (the latter was not detectedas a chlorination by-product but its presence was postulated) reacted readily withchlorine. The following chlorination products were identified after reaction ofcyanoacetic acid at pH 10: dichloroacetic acid (CHCli-COOH) and trichloroaceticacid (CCIJ-COOH), which are found in chlorinated drinking-water; and2,2-dichloroacetami de (CHCli-CO NH i), 2,2-dichloro-N-hydroxyethaneimidoylchloride (CHCli-CCI = NOH), 2,2-dichloro-2-carboxyacetamide (HOOC-CCI2-CONH2), 2,2-dichloropropanedioic acid (HOOC-CCI2-COOH), 2,2,2-trichloro-N-hydroxyethaneimidoyl chloride (CCIj-CCI = NOH) and 2,2-dichloro-2-carboxy-N-hydroxyethaneimidoyl chloride (HOOC-CCli-CCI = NOH). At lower pH,conversion to dichloroacetonitrile, dichloroacetic acid and dichlorosuccinic acidwas favoured.
Several workers have concluded that most chlorination products are formedby a reaction involving 1,3-dihydroxybenzene (resorcinol) structures within thehumic structure (Rook, 1980; Boyce & Hornig, 1983; de Leer, 1987; Christman et al.,1989).
Unsaturated organic compounds, alkenes and unsaturated fatty acids such asoleic and linoleic acids, can react with chlorine in the laboratory under conditionssimilar to those of water treatment to form chlorohydrins (Gibson et al., 1986);however, their presence in chlorinated drinking-water has not been investigated.
Amino acids are common constituents of raw water. Although they normallyoccur at low concentrations (typically up to 100 l1g/I), bound amino acids, such asproteins and peptides, may predominate (Le Cloirec & Martin, 1985; Thurman,1985).
The general reaction of ami no acids with chlorine in aqueous solution has beenknown for many years, and reviews have been published (for example, Glaze et aL.,1982). It is now known that most, if not aIl, ami no acids of the typeR-CHi-CH(COOH)NHi react readily with chlorine and initially form mono-chloramines (R-CHi-CH(COOH)NHCl) and, depending on the conditions,dichloramines (R-CHi-CH(COOH)NCli). Further reaction leads to nitriles(R-CHiCN) and/or aldehydes (R-CHiCHO). Le Cloirec and Martin (1985)postulated the mechanism involved. Amino acids have been shown to generate awide range of other by-products during chlorination (Horth, 1989).

66 lARe MONOGRAHS VOLUME 52
(k) Mutagenic by-products
Mutagenicity assays have been used in many countries to study the mutagenicpotential of drinking-water samples (see p. 70). A number of
the substances foundin chlorinated drinking-water have been shown to be bacterial mutagens (Table 6).Only the chlorinated furanones and related compounds (see p. 61) are sufficientlypote nt and occur in sufficiently high concentrations to account for a significantproportion of the mutagenicity measured in sorne extracts of chlorinateddrinking-water (Kronberg & Vartiainen, 1988; Horth, 1989). Many mutagens aregenerated during laboratory chlorination of humic substances and ami
no acids and
during chlorination of wood pulp in experiments designed to indicate thosesubstances that may be formed in the chlorination of natural waters; however, notaIl of these have been detected in drinking-water.
Table 6. Studies in which bacterial (Salmonella typhimurium TA100 without anexogenous metabolic system) mutagens were identified in chlorinated drinking-water, chlorinated solutions of hurnic substances and arnino acids and in chlori-nated wood pulp effluent
Mutagen Referencea
Drinking- Humic Amino Woowater substances acids pulp
Halo-alkanesBromoform 1 ND ND NDBromochloromethane 1 ND ND NDBromodichloromethane 1 1,7 ND 2Dibromomethane 1 ND ND 2
Chlorodibromomethane 1 ND ND 2
Dichloromethanè 15 ND ND 3
Bromoethane 1 ND ND ND1-Bromopropane 1 ND ND ND1-Bromobutane 1 ND ND ND1,2- Dichloroethane 1 ND ND 3
1,1,1- Trichloroethane ND ND ND 3
1,1,2,2- Tetrachloroethane ND ND ND 3
lodoethane 1 ND ND ND
Chloro-alkenesTrichloroethylene ND ND ND 2
Tetrachloroethylene ND ND ND 2
Dichloropropene 1 ND ND NDTetrachloropropene ND ND ND 2
Pentachloropropene ND 4 ND 2

CHLORINATED DRINKING-WATER 67
Table 6 (contd)
Mutagen ReferenceQ
Drinking- Humic Amino Woowater substance acids pulp
Chloro-ketonesl,l-Dichloropropanone 5 4,5 ND ND1,3- Dichloropropanone ND 4,5 ND 21,1,1- Trichloropropanone 5 4,5 ND ND1,1,3- Trichloropropanone ND 4,5 ND ND3,5,5- Trichloropent-4ne-2-one ND ND ND 21,1,3,3- Tetrachloropropanone 5 4,5 ND 2,3Pentachloropropanone ND 4,5 ND 3Hexachloropropanone ND 6 ND 2,3
Chloro-aldehydeslfuranonesChloral (trichloroethanal) 1 16 7 NDChloroacetaldehyde ND ND ND 22-Chloropropenal ND 4 ND 2Dichloropropanal ND 4 ND ND2,3- Dichloropropenal ND 4 ND ND3,3-Dichloropropenal ND 4,5 ND NDTrichloropropanal ND 4 ND ND2,3,3- Trichloropropenal ND 4,5 ND ND2-Phenyl-2,2-dichloroethanal ND ND 7 NDE-2-Chloro-3-( dichloromethyl)-4xo- 8 9 7 10
butenoic acid (E-MX)3-Chlor0-( dichloromethyl)-5-hydroxy- 8,11 9,10 7 2,12
2(5H)furanone (M)3,4- Dichloro-5-( dichloromethyl)-5-hydroxy- ND ND ND 13
2-furanone3-Chlor0-(bromochloromethyl)-5-hydroxy- ND ND 14 ND
2(5H)furanone (BMX-l)3-Chlor0-( dibromomethyl)-S-hydroxy- ND ND 14 ND
2(5H)furanone (BMX-2)3-Brom0-( dibromomethyl)-5-hydroxy- ND ND 14 ND
2(5H)furanone (BMX-3)Halo-nitrles
Bromochloroacetonitrile 1 ND ND NDDichloroactonitrile 1 5,7 7 ND

68 lARe MONOGRAHS VOLUME 52
Table 6 (contd)
Mutagen Referencea
Drinking- Humicwater substances
Aminoacids
Woopulp
MiscellaneousChloropicrinb 1 ND ND NDTrichloro-1,2,3-trihydroxybenzene ND ND ND 2Benzyl chloridec ND ND 7 3
Benzoyl chloridec ND ND 7 NDBromo-pa-cene ND ND ND 2Dichloro-paa-cene ND ND ND 2
~eference: 1, Fielding & Horth (1986); 2, Rapsn et al. (1985); 3, McKague et al. (1981);4, Kopfler et al. (1985); 5, Meier et al. (1985); 6, de Ler (1987); 7, Horth (1989); 8, Kronberg &Variainen (1988); 9, Kronberg et al. (199); 10, Holmbom et al. (199); 11, Hemming et al. (1986);12, Holmbom et al. (1984); 13, Strömberg et al. (1987); 14, Fawell & Horth (199); 15, Anon.(1983); 16, Coleman et al. (1984)l1ith S9 activation
C'entative identificationND, not detected
2.2 Analytical rnethods
Methods for the analysis of chlorinated compounds produced during thechlorination of drinking-water can be divided into three basic types: techniques foridentifying unknown or suspected substances-not necessarily specific forhalogenated compounds; specific techniques for the analysis of known or suspectedhalogenated compounds; and techniques designed for a gross estiffate ofhalogenated organic matter in chlorinated water.
(a) Analysis of unknown chlonnation by-products
ln the 1970s, concern over the presence of organic micropollutants in
drinking-water together with the emergence of powerful, sensitive analyticaltechniques for separating and identifying these substances, such as capilarycolumn gas chromatography-mass spectrometry (GC-MS) led to the identificationof a large number of organic compounds in drinking-water at low concentrations(Commission of the European Communities, 1989). Techniques involving GC-MShave been used extensively to analyse drinking-water for unknown and knownchlorination by-products in addition to contaminants iD general. With theexception of grossly contaminated drinking-water, concentrations of organicchemicals are such that direct application of identification techniques is usually

CHLORINATED DRINKING-WATER 69
impossible and, consequently, sorne form of isolation/concentration process isrequired. The mixure of organic chemicals isolated is so complex that considerableseparation (invariably by sorne form of chromatography) is also needed prior toapplication of instrumental techniques capable of providing structuralinformation. Thus, the overall analytical technique deployed usually consists of:
(i) isolation/concentration (not necessarily as one step),
(ii) separation (of the components in the complex mixures isolated) and
(ii) detection and structural analysis.
Various methods for isolating and concentrating organic chemicals, such aschlorination by-products, from drinking-water exist, and a number of validatedmethods have emerged that are based upon solvent extraction, adsorption (usuallyby XA resin), followed by solvent elution of the adsorbent, headspace analysis andrelated methods. Application of these techniques is virtually routine, and examplesabound in the literature (Keith, 1976; Coleman et al., 1980; Keith, 1981; Fawell et al.,1986).
(b) Analysis of known or suspected chlonnation by-products
Analytical methods have been developed for a range of identified chlorinationby-products. The following is a summary of those used for the substances discussedabove.
(i) Trialomethanes
Trihalomethanes were shown to be present in drinking-water as a result ofchlorination (Bellar et al., 1974; Rook, 1974) using purge and trap and solventextraction methods of concentration, followed by GC with electron capturedetection (ECD; Croll et al., 1986). Subsequently, a number of analytical methodsfor the determination of trihalomethanes in drinking-water have been published(for review, see Croll et al., 1986); they include direct aqueous injection (Nicholson etal., 1977; Peters, 1980; Grob & Habich, 1983), liquid-liquid extraction (Dressman etal., 1979; US Environmental Protection Agency, 1979a; Standing Committee ofAnalysts, 1980), purge and trap (Bellar et al., 1974; Dressman et al., 1979; USEnvironmental Protection Agency, 1979b) and headspace analysis (Rook, 1974;Otson et al., 1979; Croll et al., 1986) with separation and detection by GC-ECD.More information is given in the respective monographs about the analysis ofbromodichloromethane, chlorodibromomethane and bromoform.
(ii) Halogenated acetic acids
Halogenated acetic acids are common by-products of water chlorination.Most of the analytical methods involve extraction into a solvent at low pH (0.5-2)with addition of sodium chloride to salt out the substances, derivatization and then

70 lARe MONOGRAHS VOLUME 52
detection by GC-ECD(Krasner et al., 1989; Uden & Miler, 1983; Lahl et al., 1984),GC with microwave plasma detection (Miler et al., 1982) or isotope dilution MS(Norwood et al., 1986).
(iii) Halogenated acetonitriles
DichloroacetonitrIle and other halogenated analogues have been determinedin drinking-water by solvent extraction with salting out using sodium chloride orsodium sulfate followed by GC-ECD (Oliver, 1983; Italia & Uden, 1988; Krasner etal., 1989). More information on analytical methods for halogenated acetonitriles isgiven in the monograph.
(iv) ehloropheno/s
Chlorophenols are well-known chlorination by-products, since they can conferobjectionable tastes and odours in the supply. A variety of techniques have beendeveloped for their analysis, which usually involve derivatization to methyl, acetyl orpentafluorobenzoyl derivatives, followed by GC-ECD (Renberg, 1981;Abrahamsson & Xie, 1983; Standing Committee of Analysts, 1985, 1988) or, in somecases, GC-MS with specific-ion monitoring (Sithole & Wiliams, 1986).
(v) ehlorouracil, chlorouriine, chlororesorcinol and chlorosa/icylic
acidThese unchlorinated substances occur in natural waters and can become
chlorinated during water treatment. They have been determined after freeze-dryingor vacuum evaporation, extraction with methanol and examination byhigh-performance liquid chromatography with confirmation by GC-MS(Crathorne et al., 1979).
(vi) Organic chloramines
Chlorine can react extensively with organic amines, ami no acIds and relatedsubstances in water to produce chloramines. Specifie analysis of organicchloramines in drinking-water is diffcult, and, consequently, there is little detaIledinformation on their presence and concentrations. ln recent years, some specificmethods have appeared which are based on derivatization followed byhigh-performance liquid chromatography with fluorescence detection (Scully et al.,1984) or ultraviolet/electrochemical detection (Lukasewycz et al., 1989).
(c) Mutagens and mutagenicity in chlorinated drinkng-waterThe presence of mutagenic chemicals in concentrated extracts of
drinking-water is inferred from the positive results obtained in bacterial
mutagenicity assays such as the Salmone/la/microsome mutagenicIty assay (Ames& Yanofsky, 1971; Ames et al., 1975).

CHLORINAlED DRINKING-WAlER 71
Organic compounds present at low concentrations in drinking-water must beextracted and concentrated prior to assays for mutagenicity. No single technique iscapable of extracting aIl organic material from water, and therefore several methodshave been used in combination with bacterial mutagenicity assays, includingreverse osmosis or freeze drying, followed by extraction of the solids with organicsolvent, or adsorption on resins followed by elution with solvents (for review, see
Wilcox et al., 1986). The most widely used technique involves adsorption on XAmacroreticular resin. Although a small proportion of the organic matter in
drinking-water is recovered, the level of mutagenic activity of the extracts is high(Fielding & Horth, 1986; Ringhand et al., 1987). Different compounds may berecovered by altering the pH of the water prior to XA adsorption. Sorne groupshave reported considerably higher levels of mutagenic activity in low pH/XADextracts th an in extracts obtained at sample pH (near neutral) (Kronberg et al.,1985a; Ringhand et al., 1987; Horth et al., 1989). With aIl the methods, it is essentialto check that mutagens are not generated as artefacts by the process itself, asimpurities in solvents and other materials used or even their reaction products withfree chlorine or chloramine in the water samples being processed.
Studies of the compounds responsible for the mutagenicity detected have ledto the identification of strong bacterial mutagens, especially MX. The levels of thischlorination by-product have been determined in drinking-water by a methodbased on adsorption on resin at low pH followed by desorption with solve nt,methylation and GC-MS with selected-ion monitoring (Hemming et al., 1986; Horthet al., 1989).
(d) Measurement of total halogenated organic matter in drinking-water
Methods have been used to estimate total (as near as possible) organicallybound halogen in chlorinated drinking-water (for review, see Oake & Anderson,1984). The basis of the most commonly used technique, which involves measuringadsorbable organic halogen, includes extraction of organic chlorine (or bromine)compounds from water by adsorption onto activated carbon, removal of inorganichalide by washing the carbon with a nitrate solution, conversion of organicallybound halogen to inorganic halide (usually by combustion, although otherapproaches exist) andt finaIly, measurement of the halide (usually bymicrocoulometry). The terms 'total organic halide' and 'adsorbable organic halide'tend to be used in practice (Krasner et al., 1989); however, the latter is preferable,since very polar and very volatile halogenated compounds would not be recoveredquantitatively by the usual methods.

72 lARe MONOGRAHS VOLUME 52
3. Biological Data Relevant to the Evaluation of
earcinogenic Risk to Humans
3.1 Carcinogenicity studies in anirnals
Most of the studies reported here were designed to investigate the effects oforganic extracts of drinking-water. These studies did not address the potentialeffects of by-products of disinfection, since that variable was not controlled for, i.e.,generally, no control group of animaIs treated with extracts of raw water wasincluded. Furthermore, the methods used to extract organic material from waterwere somewhat selective and would not result in equal concentration of aIlcomponents (see p. 69); in particular, volatile substances may be lost. The extractsstudied, therefore, may not be completely representative of the substances found inchlorinated water. FinaIly, the potential for introducing impurities into organicextracts by the interaction of free chlorine and chloramine in drinking-water with asolvent or resin may also be a confounding factor. Notwithstanding the difficultiesin designing studies that control for this variable, it must be considered in theirinterpretation. Although of limited relevance to evaluating the carcinogenicity ofchlorinated drinking-water, the studies of organic extracts are included for
completeness.
(a) Oral administration
Mouse: Groups of 25 male and 25 female CFLP Han mice (age unspecified)were administered a chloroform (triple distilate) extract of disinfected river waterfrom France (treatment procedure: f1occulation, filtration, prechlorination,ozonization and postchlorination), dissolved in agar at a weight ratio of 1:20,prepared every two weeks and added to the diet for 104 weeks. The river water wascollected over a two-year period. The treatment doses of organic material (1.2 and2.4 mg/kg bw per day, respectively) corresponded to 100 and 20 times thecalculated human dose, based on an assumed human consumption of 3 l/60 kg bwper day. The average yield of organic extract was 0.24 mg/I (mean of 10 samples). Agroup of 50 males and 50 females served as controls (control diet not specified). Nocontrol receiving unchlorinated water was included. Increased mortality wasobserved in animaIs of each sex in the treated group (details not given). Thefrequency of malignant tumours in males (predominantly thyroid gland tumoursand lymphosarcomas) was: control, 4.9%; low-dose, 11.1%; and high-dose groups,11.1%. The frequency of ffalignant tumours among females (predominantlymammary gland and ovarian adenocarcinomas and lymphosarcomas) was: control,14.3%; low-dose, 43.8%; and high-dose, 45.0% (Truhaut et al., 1979). (The WorkingGroup noted the lack of an adequate control group to test for the extraction

CHLORINATED DRINKING-WATER73
procedure, and that the incidence of individual tumour types and the incidence ofbenign tumours were not given.)
Groups of 50 male and 50 female B6C3F 1 mice, six to eight weeks of age,received solutions of either chlorinated humic acids (carbon:chlorine ratio, 1:1 or1:0.3), produced by the addition of sodium hypochlorite to a commercialpreparation of humic acid, or unchlorinated humic acids in the drinking-water,prepared freshly once a week, for two years. The average daily intake of totalorganic carbon was 2.8-2.9 mg/mouse for males and 2.1-2.2 mg/mouse for females.Similar numbers of male and female mice received sodium chloride (daily intake,26.4 mg/male mouse and 22 mg/female mouse) in the drinking-water. As a positivecontrol, equal numbers of mice of each sex were given dibromoethane at doses of 1.4mg/male and 1.2 mg/female. A group of 100 male and 100 female mice received notreatment. Surviving animaIs were killed at 24 months, with the exception of thedibromoethane-treated groups, which were kiled at 18 months. At two years, morethan 78% of treated and control animaIs were stil alive, except among males givendibromoethane. There was no difference in the percentage or the number oftumour-bearing animaIs in the treated groups. Several types oftumours occurred athigher incidence in the groups treated with 1:1 chlorinated humic acids, 1:0.3chlorinated humic acids or unchlorinated humic acids, when compared to theuntreated group, but the incidences were not increased when compared to thesodium chloride-treated control group (Van Duuren et aL., 1986).
Rat: Groups of 25 male and 25 female Sprague-Dawley rats (age unspecified)were administered the same extract of disinfected river water described fot CFLPHan mice, above, at the same treatment doses. A group of 25 males and 25 femalesseived as controls (control diet not specified). No control receiving unchlorinatedwater was included. A dose-dependent increase in mortality was observed inanimaIs of each sex (details not given). The frequency of malignant tumours inmales (thyroid gland tumours and lymphosarcomas) was significantly increased: 0in controls, 33.3% with the low dose and 50% with the high dose. The frequencyofmalignant tumours in females (mammary gland and ovarian adenocarcinomas andlymphosarcomas) was 4.5% in controls, 40% in low-dose animaIs and 57.1% inhigh-dose groups (Truhaut et al., 1979). (The Working Group noted the lack of acontrol group to test for the extraction procedure, that exact incidences of
individual tumours types were not given, that tumours of different origins werecombined for analysis, and that the incidences of benign tumours were not given.)
Oroups of 50 male and 50 female Wistar rats (RIV:Tox(M)), weighing 165 g and130 g, respectively, were administered organIc extracts of surface tap water from theNetherlands (disinfection procedure unspecified) in nonmutagenic drinking-waterfor 106 weeks. Water consumption was measured weekly. Extraction and
concentration were carried out on XAD-4/8 resin, and elution with

74 lARe MONOGRAHS VOLUME 52
dimethylsulfoxide, such that a O.ll-ml sample of concentrate contained 115 J.g
organic material, which corresponded to 1 1 tap water. Daily dose levels were
caIculated as multiples of the expected human exposure based upon a dailyconsumption of2 1 water per 70 kg bw: 0, 4.5 times (11 mg/kg bw organic matter), 14times (34 mg/kg bw), 40 times (97 mg/kg bw) for males and 0, 7 times (17 mg/kg bw),22 times (53 mg/kg bw) and 68 times (165 mg/kg bw) for females. A slight increase inmortality was observed in the exposed groups. The numbers of animaIs withtumours (benign and malignant combined) were: males -control, 29/50; low-dose,23/47; mid-dose, 27/50; and high-dose, 34/50; and females-control, 36/49;
low-dose, 30/47; mid-dose, 33/47; and high-dose, 35/50. The frequency and types oftumours were similar in the treated and control groups (KooI et al., 1985a). (TheWorking Group noted that no control group to test for the extraction procedure wasused and that several contaminants are unstable in dimethylsulfoxide (see p. 82;Meier et al., 1987; Kronberg & Vartiainen, 1988; Fielding & Horth, 1988).)
(h) Skin application
Mouse: Two groups of 40 male C57BI mice, eight to ten weeks old, received skinapplications of one drop of a tap water (collected over a period of one year) extract(preparation: US river water was treated by breakpoint chlorination, coagulation,filtration, concentration of organic compounds by passing through activatedcarbon, extraction of adsorbed organic matter with diethyl ether, removal of theether by evaporation), either undiluted or diluted with methyl ethyl ketone (1:1)
(Braus et al., 1951). The original tap water contained 0.1-1 mg/l organic materiaI.The extracts were painted on a 1 -cm2 area of shaved shoulder twice a week for fivemonths. The two groups of mice were then combined, and the animaIs received onedrop of undiluted sample twice a week for a further a 12-13 months, when survivorswere kiled. A vehicle control group of 25 male mice received one drop of methyl
ethyl ketone on shaved skin twice a week for four months. One skin papilomadeveloped among the treated mice, whereas no skin tumour was observed amongvehicIe controls. Amyloidosis of the spleen, liver and kidneys was observed inseveral animaIs (Hueper & Ruchhoft, 1954). (The Working Group noted the lack ofinformation on the quantity of tap water used for extraction, the quantity of organicmaterial in the extracts and the lack of an adequate control group l-
As part of a larger experiment, groups of 36 male and 36 female C57BI mice,two months of age, received skin applications on the shaved neck region of eitherone drop of undiluted chloroform extract condensate prepared by passing
chlorinated US tap water through activated carbon and elution with chloroform(yield, 1 g/620 gallons (2347 litres) water) once every two weeks (total of 28applications), or one drop of undiluted ethanol-extract condensate prepared bypassing chlorinated tap water through activated carbon (yield, 1 g/890 gallons (3369litres L water) once every two weeks (total of 20 applications). Forty male and female

CHLORINATED DRINKING-WATER 75
mice were untreated. The 12 surviving animaIs in the chloroform-extract group andthe three in the ethanol-extract group were kiled at 18 months. No tumourdeveloped among the treated mice either locally or in distant organs (Hueper &Payne, 1963). (The Working Group noted the infrequent application of the materialand the lack of an adequate control group.)
(c) Subcutaneous administration
Mouse: Groups of 36 male and 36 female C57BI mice, two months of age, wereinjected subcutaneously in the neck region at two-week intervals with 4 mgcondensate prepared by passing chlorinated tap-water from the USA throughactivated carbon and extraction with chloroform (yield, 1 g/620 gallons (2347 litres)water) in 0.05 ml tricaprylin (total of 28 injections (total dose, 112 mg/mouse)).Additional groups of 36 male and 36 female C57BI mice were similarly treated with4 mg of tap water condensate prepared by passing chlorinated drinking-waterthrough activated carbon and extraction with ethanol (yield, 1 g/890 gallons (3369litres) water) in 0.5 ml ethanol (total of 20 injections (total dose, 80 mg/mouse)).Three animaIs in the chloroform-extract group suivived to 18 months, and tenanimaIs in the ethanol-extract group survived to 15 months. One skin papiIoma atthe site of injection and one leukaemia/lymphoma developed in the chloroformextract-treated animais (sex unspecified). One leukaemia/lymphoma was obseivedamong the ethanol extract-treated mice (Hueper & Payne, 1963). (The WorkingGroup noted the infrequent application of the test material and the lack of adequatecontrol groups.)
Six groups of 50-72 non-inbred albino mice received a subcutaneous injectionof an extract of drinking-water collected every two weeks from three
water-treatment plants in the USA, based on surface water sources (500 gallons(18 927 litres); treatment procedure: coagulation, sedimentation, filtration andchlorination with free chlorine). The water was passed through an activated carbonfilter, and the adsorbate was eluted either with chloroform or with ethanol; eluateswere pooled to obtain a one-year representative sam pIe for each type of eluate.Median organic yields from the three sources were 45-78 i.g/l for chlorofom and98-122 i.g/I for ethanol extracts. The mice received three injections of one of the.extracts in 0.025 ml diluted propylene glycol (1:1 with isotonic saline) on thefollowing dosing schedule: shortly after birth (4-18 h), 0.5 mg; at 10 days of age, 1.0mg; and at 20 days of age, 3.5 mg/mouse (total dose, 5 mg). Control mice receivedeither diluted propylene glycol or saline by a similar injection schedule. Highmortality was observed in the neonatal period in each of the six treated and twocontrol groups; however, more animaIs died in the chloroform extract-treatedgroups th an in the ethanol extract-treated and vehicle control groups. The totalnumber of surviving animaIs at week 4 ranged between 43 and 53. Survivors wereobseived for 78 weeks and were kiIed at 1.5 years of age. No tumour had developed

76 lARe MONOGRAHS VOLUME 52
at the injection sites. The types and numbers of other tumours were similar in theexperimental and control groups (Dunham et al., 1967). (The Working Group notedthe infrequent injection schedule, the high early mortality, the short duration oftheexperiment and the lack of an adequate control group.)
(d) Administration with known carcinogens
Groups of 50 Sencar mice (sex unspecified), aged six to nine weeks, were givensix subcutaneous injections over two weeks (to give a total dose of 1.5 ml) ofwaterfrom a US river, disinfected, after settling, coagulation and filtration, by eitherchlorine (2.0-2.5 mg/l), chloramine (2.0-3.0 mg/l), chlorine dioxide (2.0-3.0 mg/l) orozone (1.0-3.0 mg/l), then concentrated 100- 180 fold using reverse osmosis. Treatedbut not disinfected water, similarly concentrated (organic material not quantified)served as control water. Equal numbers of mice received isotonic saline by the sametreatment schedule. As a positive control, 7.5 iig 7,12-dimethylbenz(a )anthracene
(DMBA) in 10% Emulphor were administered subcutaneously to 50 mice. Twoweeks after the last initiating dose, 25 mice in each group received topicalapplications of 2.5 iig 12-0-tetradecanoylphorbol 13-acetate (TPA) in 0.2 mlacetone three times a week for 18 weeks, and the remaining 25 received 0.2 ml
acetone without TPA; aIl mice were then observed for an additional28 weeks. Thenumbers of animaIs injected with concentrate followed by topical application ofTPA that had macroscopic skin tumours at one year were: non-disinfected watercondensate, 0/25; chlorine disinfected water condensate, 4/25; chloramine disin-fected water condensate, 5/25; chlorine dioxide disinfected water concentrate, 0/25;ozone disinfected water concentrate, 7/25; saline control, 1/25; DMBA positivecontrol, 16/25. Histologically verified skin tumours (papilomas and carcinomas)were observed at the end of the study in 1/25, 4/25, 3/25, 0/25, 4/25, 1/25 and 9/25 inthese groups, respectively (Bull et aL., 1982). (The Working Group noted that noinformation was provided on skin tumour frequency in the acetone-treated controlgroups.)
ln two experiments, groups of 60 Sencar mice (sex unspecified), aged six to nineweeks, were given six subcutaneous injections over two weeks (to give a total dose of1.5 ml) of the same sam pIes described above but which were concentrated 40 foldusing reverse osmosis followed by freeze-drying. Equal numbers of animaIsreceived isotonic saline by the same treatment schedule. As a positive control,groups of mice (numbers unspecified) received 7.5 or 25 iig/mouse DMBA or9 mg/mouse urethane. Two weeks after the last initiating dose, 40 mice in eachgroup received topical applications of 1 iig/mouse TPA in 0.2 ml acetone three timesa week for 20 weeks; the remaining 20 animaIs in each group received applicationsof 0.2 ml acetone without TPA and were observed for an additional 28 weeks. Theincidence of skin papilomas observed macroscopically at one year was similar in

CHLORINATED DRINKING-WATER 77
the treated and saline control group in both experiments (Bull et al., 1982). (TheWorking Group noted that data were not provided on tumour incidence in thepositive control groups or in the acetone-treated groups.)
Groups of 60 male Sencar mice, 8- 10 weeks of age, received six subcutaneousinjections over two weeks of two types of drinking-water concentrates obtainedfrom five water-treatment plants with different water sources (method ofdisinfection unspecified). One sample (ROE) was obtained by reverse osmosisfollowed by extraction with pentane and dichloromethane. The other sample(XAD) was obtained by passing the aqueous residue of the reverse osmosisextraction through XAD-2 resin and eluting with ethanoI. The extracts wereadministered in 0.1 ml Emulphor to give a total dose of 150 mg/kg bw. A vehiclecontrol group received 0.1 ml Emulphor alone. As a positive control, a total dose of25 J.g/mouse DMBA in 0.1 ml Emulphor was injected in six subcutaneousinjections over a two-week period. Two weeks after the last initiating dose, 40 micefrom each group received topical applications of 0.1 J.g/mouse TPA in 0.1 mlacetone three times a week for 20 weeks; the remaining 20 animaIs in each groupreceived 0.1 ml acetone only. Suiviving animaIs were sacrified one year aftercompletion of promotion. Skin tumours that persisted for three weeks or more wereincluded in a cumulative count. There was a statistically significant increase in thenumber of skin papillomas per mouse in one group treated with the ROE sam pIefrom one source plus TPA, and in one group treated with the XAD sample fromanother source plus TPA, as compared with the vehicle control and the TPA control(Robinson et al., 1981).
3.2 Other relevant dataAs chlorine dissolves in water to produce hypochlorous acid and hypochlorite,
the Working Group summarized experiments that utilized high concentrations ofchlorine, hypochlorous acid and hypochlorite in the monograph on hypochlorite.Only studies that were directed specifically to by-products isolated fromchlorinated drinking-water (in comparison to non-chlorinated watcr froID the samesource) or sought to model processes that are known to occur in chlorinateddrinking-water are discussed here.
(a) Experimental systems
(i) Toxic effects
Organic material recovered from chlorinated water by reverse osmosis
(reduced in volume by 100 and 400 times) and given to 10 male and 10 female CD-lmice in each experimental group as drinking-water was compared in a 30-day studywith non-disinfected water and water treated with other disinfectants. A significantincrease in liver weights was reported in female but not male mice given the highdose of chlorinated water concentrate in comparison with the concentrate from

78 lARe MONOGRAHS VOLUME 52
non-chlorinated control water. Male mice had reduced lung weights at both dosesand decreased testicular weights at the high dose. No histological examination wasperformed (Miler et al., 1986).
Organic chemicals from the same waters, recovered on XA resin, wereadministered as 0.3 ml of a 100- or 400-times concentrate by gavage three timesper week for four weeks to 10 CD- 1 mice of each sex per group. Treatment had noeffect on organ weights in animaIs of either sex; however, water that had beenchlorinated, filtered through granular activated carbon and then rechlorinatedincreased liver weight in male mice at both doses and decreased lung weight at thehigh dose. Both doses reduced ovary weight in female mice. No histological findingwas reported (Miler et al., 1986).
A combined acid and neutral fraction of organic chemicals recovered on XAresin, dissolved in dimethyl sulfoxide (corresponding to 100 1 of chlorinateddrinking-water), was administered intraperitoneally on two consecutive days to10-day-old Wistar rats and once to 20-day-old rats. This treatment resulted in 50%mortality at 48 h in 10-day-old rats and in 30% mortality in 2O-day-old rats; it alsoinduced various alterations in drug metabolizing enzyme activities in liver fractionsobtained from surviving animaIs. The most consistent effect was an increase in thelevel of hepatic 7-ethoxyresorufin-O-deethylase compared to solvent-treated
controls (Liimatainen et al., 1988). (The Working Group noted that nonon-chlorinated water control was available.)
ln a 90-day study in groups of 15 rats, humic acids dissolved at concentrationsof 0.1, 0.5 and 1 g/l in distiled water and chlorinated with a 1:1 ratio of chlorineequivalents to organic carbon were given as drinking-water (pH 3). Renal weightswere increased relative to body weight at 0.5 and 1 g/l, and there was a small increasein blood urea nitrogen. Haematuria was seen with the 1.0 g/l dose, which appearedto be related to the deposition of crystals (composition unspecified) in the renalpelvis (Condie et al., 1985).
Chlorine reacts very rapidly with purified DNA and RNA (Hayatsu et al.,1971). It chlorinates uracil to produce 5-chlorouracil at low chlorine:carbon ratiosand dichlorouracil and ring cIeavage at higher ratios (Gould et al., 1984). Relativelystable organic chloramines are formed with cytosine. Purines (modelled bycaffeine) are chlorinated to a very small extent, with ring cIeavage to a complex arrayof products (Gould & Hay, 1982). A peroxide of adenosine 5' -monophosphate(AMP) has been shown to form at physiological pH, and this reaction is dependenton the NaOCI:AMP ratio, reaching a plateau when this reatio is less th an 1
(Bernofsky et al., 1987).
(ii) Effects on reproduction and prenatal toxicity
McKinney et al. (1976) reported an increased incidence of de ad implantationsand of litters with malformed fetuses among Swiss CD-1 mice given chlorinated tap

CHLORINATED DRINKING-WATER 79
water from Durham, NC, USA. The effect was reported to be seasonal (data notshown). The control group in this study was given the same water purified byfiltration (to reduce organic material and remove microparticulates),
demineralization and distilation.These observations stimulated a series of teratogenicity studies in which
Durham city tap water was compared with water purified by the same method asdescribed above. Using much larger group sizes than McKinney et aL. (1976),Staples et al. (1979) found no significant overall difference in the reproductive statusof pregnant mice given tap water or purified water. Month-by-month comparisonsover a nine-month period (including the critical winter months suspected of beingimportant by McKinney et al.) indicated occasionally improved reproductiveperformance only in the tap water group. Chernoff et al. (1979) also found nosignificant effect on any fetal parameter in CD- 1 mice, except for an increasedincidence of supernumerary ribs, which the authors considered to be spurious, lnthe groups given Durham tap water. They considered the possibilty thatdrinking-water quality had changed during the inteivening years since the study byMcKinney et al.
Kavlock et al. (1979) evaluated the effects of concentra tes of organic materialsfrom the drinking-water of five US cities representative of major sources of rawwater. Because the reverse osmosis method used for concentrating the se materialsdoes not retain organohalides with a molecular weight ofless than 20, an artificiaHyconstituted organohalide mixture was also prepared and evaluated. Groups ofSwiss mice were given 300, 100 or 300 times the anticipated human dose ofthese
materials by gavage on gestation days 7- 14. No adverse effect on embryonal or fetaldevelopment was observed.
(The Working Group noted that these studies were designed to study theeffects of the drinking-water of individual cities but not to investigate the
developmental toxicity of chlorinated drinking-water, nor did they include a
non-chlorinated water controL)
(iv) Genetic and related effectsThe results obtained in a variety of short-term tests for ~amples of chlorinated
water have been reviewed (KraybiI, 1980; Loper, 1980; Alink, 1982; Kooi et al.,1982a; Nestmann, 1983; Bull, 1985; Degraeve, 1986; Fielding & Horth, 1986; Meier,1988). Many of the studies were concerned with the mutagenicIty of drinking-waterand not with the influence of chlorination. As the source of mutagenicity io
drinking-water may also be polluted rawwater, the role ofwater chlorination cannotbe evaluated unless a comparison is made with an unchlorinated sample. Paperslacking this aspect and those in which no reference is made to the disinfection agentused are not summarized here. ln many papers, data were avaIlable to allow

80 lARe MONOGRAHS VOLUME 52
comparison of unchlorinated and chlorinated waters, and when the authors did notdo this, the Working Group drew their own conclusions.
The Working Group also limited themselves to studies of water samplesdisinfected with chlorine or hypochlorite; studies on water samples disinfected withchlorIne dioxide, monochloramine or ozone alone were not considered.
By far the majority of studies were with Salmonella tyhimunum strains TA98and TA100.
(1) ehlonnated water (Table 7)
Chlorination did not increase the mutagenicity of drinking-water preparedfrom surface or spring water, as studied in fluctuation tests with S. tyhimunumstrains TA98 and TA100. Mutations were not induced in S. typhimurium TA100when samples of chlorinated water were used to prepare bottom agar for the testplates. (The Working Group noted that volatile substances would be lost ifthewaterwere autoclaved.) Chlorination of a tap water sample derived from surface waterdid not increase the number of mIcronuclei in Tradescantia pollen mother cells.Chromosomal aberrations were induced in A/lium cepa, however, by a river watersam pIe chlorinated in the laboratory. Cell transformation was not induced bychlorinated tap water in cultured Syrian hamster embryo cells or by finisheddrinking-water from a surface water source in mouse embryo cells.
(2) eoncentrates of chlorinated water (Tables 8-10)
The most widely used method for isolating organic material from watersamples is adsorption to macroreticular resin (various types of Amberlite XA)followed by elution with an organic solvent. Liquid-liquid extraction with an
organic solvent is also commonly used. The different concentration methods usedfor mutagenicity studies have been discussed (Forster & Wilson, 1981; Harringtonet aL., 1983; Maruoka & Yamanaka, 1983; Monarca et al., 1985a,b; Wigilius et alo,1985; Vartiainen et al., 1987a). The methods are more or less selective and do notconcentrate aIl organic materials, e.g., XAD adsorption and liquid-liquid extractiontechniques may result in the loss of highly polar compounds. Concentration of anextract invariably means that volatile substances are removed with the solvent. Theextent of loss depends upon the solvent used: use of low-boiling-point solvents, e.g.,ether and acetone, leads to sm aller losses (compounds with boiling-points of about120°C should be retained unless evaporation is to dryness), while use of high-boilng-point solvents, e.g., ethyl acetate and dimethyl sulfoxide, leads to greaterlosses.
Chlorination of surface water usually resulted in increased mutagenicity ofconcentrated samples towards S. typhimurium, particularly strains TA100 andTA98 (Tables 8 and 10). ln the few studies in which these strains were not used,negative responses were obtained, perhaps because the most sensitive organism

Table 7. Summary of the influence of chlorine disinfection on the genetic and related effects orunconcentrateddrinking-water samples in comparison with unchlorinated water
Source of water; disinfection Test system Result Dose or dose Referencemethoda range
Without Withexogenous exogenousmetabolic metabolicsystem system
PROKAYOTES ()::Italy; lake; NaOCI, floclation, Mutation, S. typhimurium - 0 5-100% Monarca L"
RSF, NaOCI TA100 fluctuation test et al. (1985b) 0~Italy; river; NaOCI, floclation, Mutation, S. typhimurium 0 5-100% Monarca --ZSSF, NaOCI TA100 fluctuation. test et al. (1985b) '):~Italy; spring water; NaOCI Mutation, S. typhimurium 0 5-100% Monarca-UTA100 fluctuation test et al. (1985b) U
USA; chlorinated drinking-water Mutation, S. typhimurium - - 1-20 ml/plate Schwaz et al. ~-from two supply systems TA 100 (1979) Z~-PlAS Z
Macomb (IL, USA); chlorinated Micronuclei, Tradescantia 0 Cuttings placed Ma et al.0- 1
tap water from city reservoir clone 03, pollen mother cells in sam pIe (1985) ~
~Sava river (Zagreb, Yugoslavia); Chromosmal aberations, (+ ) 0 Roots suspended AI-Sabti &NaOC11-1O mg CIII in laboratory Allum cepa in sam pIe Kurelec (1985) ~
MAMALIA CELL lN VITROPretoria (South Afrca); reclaimed Transformation, golden - 0 Media made up Kfr &tap water; activated sludge, clarifi- hamster embryo cells, colony from sample Prozeskycation, Ch, clarification, alum, sand morphology (1982)filtration, Cli, active carbon, Cli
Mississippi river (USA); iis Transformation, mouse - 0 72% of sample Pelon et al.finished water samples embryo R846DP-6 celIs, in medium (1980)
growth pattern00-
~SF, rapid sand filtration; SSF, slow sand filtration

82 lARe MONOGRAHS VOLUME 52
was not used. Inclusion of a metabolic activation system usually resulted in areduced response or totally abolished il. Mutagenic effects were consistently foundin samples of surface water that had a high content of natural organIc compounds atthe time of the chlorination. Water samples in which the organic content had beenreduced before chlorination by water treatment procedures tended to show reducedor no mutagenicity.
Chlorinated ground- and spring water sam pIes (Table 9) were less frequentlymutagenic than chlorinated surface water samples (Table 10).
Much of the bacterial mutagenicity of concentrated chlorinated surface watersamples is probably due to chlorination of natural constituents, such as humic andfulvic acids. Chlorination of aqueous solutions of fulvic and humic acids resulted inthe formation of mutagenic compounds (Meier et al., 1983; Kowbel et al., 1984;Kopfler et al., 1985; Kronberg et al., 1985a,b; Meier et al., 1985; Kowbel et al., 1986;Maruoka, 1986; Meier et al., 1986; Van Duuren et al., 1986; Agarwal & Neton, 1989;Horth, 1989; Pommery et al., 1989). The mutagenicity of chlorinated water samplesis not due to the volatile trihalomethanes known to be formed at chlorination; muchof the mutagenicity is due to nonvolatile acidic and polar substances. Such
compounds require acidic conditions for efficient extraction by non-polar solvents.ln several studies, the greatest mutagenic activity was seen when concentration wasperformed at low pH (e.g., pH 2) (Kool et al., 1981; Van Der Gaag et al., 1982;Kronberg et al., 1985a,b; Vartiainen & Liimatainen, 1986; Ringhand et al., 1987;Fawell & Horth, 1990). A single organic compound, MX, has been shown to beresponsible for a significant portion of the bacterIal mutagenicity of sorne
concentrated chlorinated surface water samples. This compound is uns table athigh pH and in dimethyl sulfoxide (Meier et al., 1987; Kronberg & Vartiainen, 1988;Fielding & Horth, 1988).
Sorne concentra tes of chlorinated tap water prepared from surface waters,groundwater or their mixture induced more sister chromatid exchange in Chinesehamster ovary cells than concentrates of the respective raw waters. ln the only studyof its kind, concentra tes of chlorinated river water that had undergone extensivewater treatment procedures did not increase the incidence of hprt locus mutationsin Chinese hamster V79 cens. Chlorination was associated with an increase in thefrequency of micronuclei in Chinese hamster ovary cens exposed to sorne samplesof concentrated chlorinated tap water prepared from surface water and mIxedground- and surface water but not in those exposed to concentrated chlorinatedgroundwater. Concentrates prepared from chlorinated water from a river and areservoir induced chromosomal aberrations in Chinese hamster ovary cens.
No studies in mammals in vivo were available.

Table 8. Summary of the influence of chlorine dis infection on the genetic and related efTects of suñace water concentra tes
iD comparisoD with concentra tes of unchlorinated water
Source of water; Concen tra tion Test sytem Result Dos or dos Referencedisinfection methoda and extraction rangeC
method(concentration Without Withfactorl exogenous exogenous
metabolic metabolic (jsytem sytem :i~PROKAYOT 0
:;-Belgium; rechlorination Freeze-diyng, Mutation, S. typhimurium, Wilcox & Denny Z(0.5 mgll) of contact water methanol fluctuation test (1985)
~dechlorinated totally with TA100 + 0 0.02-0.1l/mlsulfur dioxide TA98 - 0 0.02-0. 1 l/ml UUK; chlorinated water Freeze-diyng Mutation, S. typhimurium, 0.00 Fielding & Horth Uwater from lowland fluctuation test (1988) :;-riversd TAlOO + (+ )* Z
TA98 + 4/5 + * 2/5 ~UK; chlorinated water Freeze-diyng Mutation, S. typhimurium, 0.00 Fielding & Horth Z
0water from upland reservoirsd. fluctuation test (1988) 1
TA100 + ( - )~TA98 + 2/3 (+ )~Savojarovi (Finland); humic XA 4/8, ethyl Mutation, S. typhimurium Backlund et ai.
lake water; CL2 21 mgll acetate TA100 + 0 10- 200 ml/pl (1985) :;TA98 + 0 10-200 ml/plTA97 + 0 10-200 ml/pl
Mississippi River (USA); lime XA-4, acetone, Mutation, S. typhimurium Cheh et ai. (1980)and alum, CO2, activated car- dichloromethane TA100 + 0 0.1-0.61/plbon powder, CL2 4-8 ppm,
alumd
Oise River (France); 03, XA-4 and Mutation, S. typhimuriume Bourbigot et al.storage, coagulation, XA-8, DMSO TAlOO - - 0.00 (1983)flocculation, decantation, (700-1000) TA98 - - 0.00fitration, 03, GAC, 03, Ch 000.9 mgJ1 w

Table 8 (contd) ~Source of water; Concentration Test system Result Dose or dose Referencedisinfection methoda and extraction rangeC
method(concentration Without Withfactor)b exogenous exogenous
metabolic metabolicsystem system
Mississipi River (USA); lime XA-4, acetone, Mutation, S. typhimurium Cheh et al. (1980)and alum, COi, activated car~ dichloromethane TAI00 + 0 0.1-0.6 IIpl -bon powder, Cli 4-8 ppm, ~NaiS03, alumd ()Seine River (France); XA-2 and Mutation, S. typhimuriume Cognet et al. ~pulsation, RSF, GAC, CL2 XA-8, CHiCli TA98 - - 1 ml/pl (1986, 1987) 0residual 0.2 mgll or CH30H Z0Seine River (France); XA-2 and Mutation, S. typhimuriume Cognet et al. apulsation, RSF, 03, GAC, Cli XA-8, CHiCli TA98 - - 1 mllp (1986, 1987)
~residual 0.2 mgll or CH30H
Houlle River (France); XA-2 and Mutation, S. typhimurium Cognet et al. ::Cli 5 ppm, coagulation, XA-8, CHiCli TA98 + 0 1-5 IIpl (1986)
C/
flotation, GAC or CH30H âAro River (Florence, XA-2, CHiCli Mutation, S. typhimurium Dolara et al.
EItaly); NaOCI 2.5-7.5 g CI/m3, and CHCl3 TAI00 + + . 0.375-10 IIpl (1981)activated carbon, coagulation, TA1538 + + 10 l/pl ~flocculation tr
VIOttawa (Canada); chlorinated XA-2, Mutation, S. typhimurium Ntap water from Ottawa River hexane:acetone TAI00
+1 Toxicity+ 0.3-2 mg/pl Nestmann et al.
(200 OOOX stock) TA98 + observed + 0.3-2 mg/pl (1979)Ontario (Canada); chlorinated XA-2, Mutation, S. typhimurium Douglas et al.tap water from a river hexane:acetone TA100 + - 92-756 ¡.g/pl (1986)
DD: (2.3 1 eq/ml)
Ontario (Canada); chlorinated XA-2, Mutation, S. typhimurium DD: (1.8 IIml) Douglas et al.tap water from a river hexane:acetone TA98 + 0 (1986)

Table 8 (contd)
Source of water; Concentration Test system Result Dose or dos Referencedisinfection methoda and extraction rangeCmethod(concentration Without Withfactor)b exogenous exogenous
metabolic metabolicsystem sytem
nOntario (Canada); chlorinated XA-2, Mutation, S. typhimurium DD: (1.5 l/ml) Douglas et al. :i
l"tap water from mixd ground- hexane:acetone TA98 + 0 (1986) 0and surface water :;-Ontario (Canada); chlorinated XA-2, Mutation, S. typhimurium DD: Douglas et al. Ztap water from two lakes hexane:acetone TA100 + 0 (2.2-4.1 l/ml) (1986)
~Calumet River (Indiana, XA-2, diethyl Mutation, S. typhimurium Flanagan & Allen UUSA); Cli 10 mgll2 h, 0.2-1 ether, CH30H TA1538 + . 0.06-0.5 IIpl (1981)mgll residual Cli U:;Calumet River (Indiana, XA-2, diethyl Mutation, S. typhimurium Flanagan & Allen -ZUSA); Ch 10 mgll2 h, alum ether, CH30H TA1538 + + 0.06-0.5 l/pl (1981) ~and polyer addition, flocu- -Zlation, sedimentationQCalumet River (Indiana, XA-2, diethyl Mutation, S. typhimurium Flanagan & Allen
1
~USA); alum and polyer addi- ether, CH30H TA1538 + . 0.06-0.5 l/pl (1981)tion, floculation, sedimenta-
~tion, Cli 10 mgll 2 h:;Fox River (Ilinois, USA); XA-2, diethyl Mutation, S. typhimurium Flanagan & Allen
Clil0 mgll 2 h, residual ether, CH30H TA1538 - 0 0.00 (1981)Ci 0.2-1 mgll
Fox River (Ilinois, USA); XA- 2, diethyl Mutation, S. typhimurium Flanagan & AllenClil0 mgll 2 h, alum and ether, CH30H TA1538 - 0 0.00 (1981)polymer addition, flocculation,sedimentation
Fox River (Ilinois, USA); XA-2, diethyl Mutation, S. typhimurium Flanagan & Allenalum and polyer addition, ether, CH30H TA1538 - 0 0.00 (1981)flocculation, sedimentation (?),00Ch 10 mgll 2 hV\

Table 8 (contd) ~
Source of water; Concentration Test system Result Dos or dos Referencedisinfection methodQ and extraction rangeC
method(concentration Without Withfactor)b exogenous exogenous
metabolic metabolicsystem sytem
Pary (South Africa); water Liquid-liquid ex- Mutation, S. typhimurium Grabow et al. -from Vaal River; alum flocu- traction, CliCHi TAI 00 + - 112-190 ).g/pl (1981) ~lation, sedimentation, sand (10 00), neutral TA98 + (+ )* 112-190 ).g/plfiltration, chlorination, TA1535 nresidual Ch 004-0.5 mgll
- - 112- 190 ).g/pl ~(doss equal to 01 l/pl used In Zcomparson) 0
0Pary (South Africa); water Liquid-liquid ex- Mutation, S. typhimurium Grabow et al.
~from Vaal River; alum flocu- traction, CliCHi TAI 00 - - 36-125 ).g/pl (1981)lation, seimentation, sand (10 00), acidic TA98
(+ ) 36-125 ).g/plfiltration, chlorination, TA1535
- ::residual C1i 004-0.5 mg/l
- - 36-125 ¡.g/pl l'(doss equal to ~1 l/pl used in 0comparson) t
Pary (South Africa); water Liquid-liquid ex- Mutation, S. typhimurium Grabow et al. ~tr
from Vaal River; alum floccu- traction, CliCHi TAI 00 - - -: 1-25 ¡.g/pl (1981) VIlation, sedimentation, sand fi- (10 00), basic TA98 -: 1-25 ).g/pl Ntration, chlorination, TA1535
- -
residual Cii 004-0.5 mgll- - -: 1-25 ).g/pl
(doses equal toIl/pl used In
comparison)
Des Moines (Iowa, USA); XA-4, diethyl Mutation, S. typhimurium Grimm-Kibalo
chlorinated and fluoridated ether TA100 + +* 0.00 et al. (1981)water from a river and an infi- ( ~ 200 00) TA98 + (+ ) 0.00tration gallery
Des Moines (Iowa, USA); XA-4, ethanol Mutation, S. typhimurium Grimm-Kibalo
chlorinated and fluoridated after diethyl ether TA100 + +* 0.00 et al. (1981)water from a river and an infil- ( ~ 200 OOOX) TA98 (+ ) (+ ) 0.00tration gallery

Table 8 (contd)
Source of wa ter; Concentration Test system Result Dose or dose Referencedisinfection methoda and extraction rangeC
method(concen tra tion Without Withfactor)b exogenous exogenous
metabolic metabolicsystem system
(JComo (Italy) outlet; mixed XA-2 and Mutation, S. typhimurium Galassi et al. i:~from ground water and Lake XA- 7, acetone TA100 + + 0.5-5.01/pl (1989) 0Como; conventional treatment TA98 + + 0.5-5.0 l/pl "and NaOCI -
ZNetherlands; Rhine River; XAD-4/8, Mutation, S. typhimurium de Greef et al.
~fitration, ferrc chloride, DMSO (150Ox) TA100 (+ ) 0 0.25-0.5 ml/pl (1980)filtration, pH adjustment, Cli TA98 (+ ) 0 0.25-0.5 ml/pl U(NaOCI) 5-15.7 mgll, pH 6.2 0Netherlands; dune infitrated XA-4/8, Mutation, S. typhimurium Kooi et al. (1981) "-river wa ter after transport DMSO (800Ox) TA98 + - 1.5 l/pi Zchlorination ~-Netherlands; river water; XA-4/8, Mutation, S. typhimurium Kool et al. (1981) Z0transport chlorination; end of DMSO (800Ox) TA98 + + 1. 5 l/pi 1
transport system
~Netherlands; river water; XA-4/8, Mutation, S. typhimurium Kooi et al. (1981) ~transport chlorination, RSF, DMSO (800Ox) TA98 + + 1. 5 I/plfitration "Netherlands; dune infiltrated XA-4/8, Mutation, S. typhimurium Kooi et al. (1981)river water; transport chlorina- DMSO (800Ox) TA98 - - 1.5 l/pition, RSF
Netherlands; Rhine River; XA-4/8, Mutation, S. typhimurium Kool et al. (1981)5-15 mg Clill DMSO (180Ox) TA100 - 0 0.25-0.5 ml/pl
TA98 + 0 0.25-0.5 ml/plNetherlands; Meuse River; XA-4/8, Mutation, S. typhimurium Kool et al.breakpoint chlorination DMSO (700Ox) TAI 00 + - 1. 5 lIpl (1982b)
TA98 + + 1. 5 I/pl00..
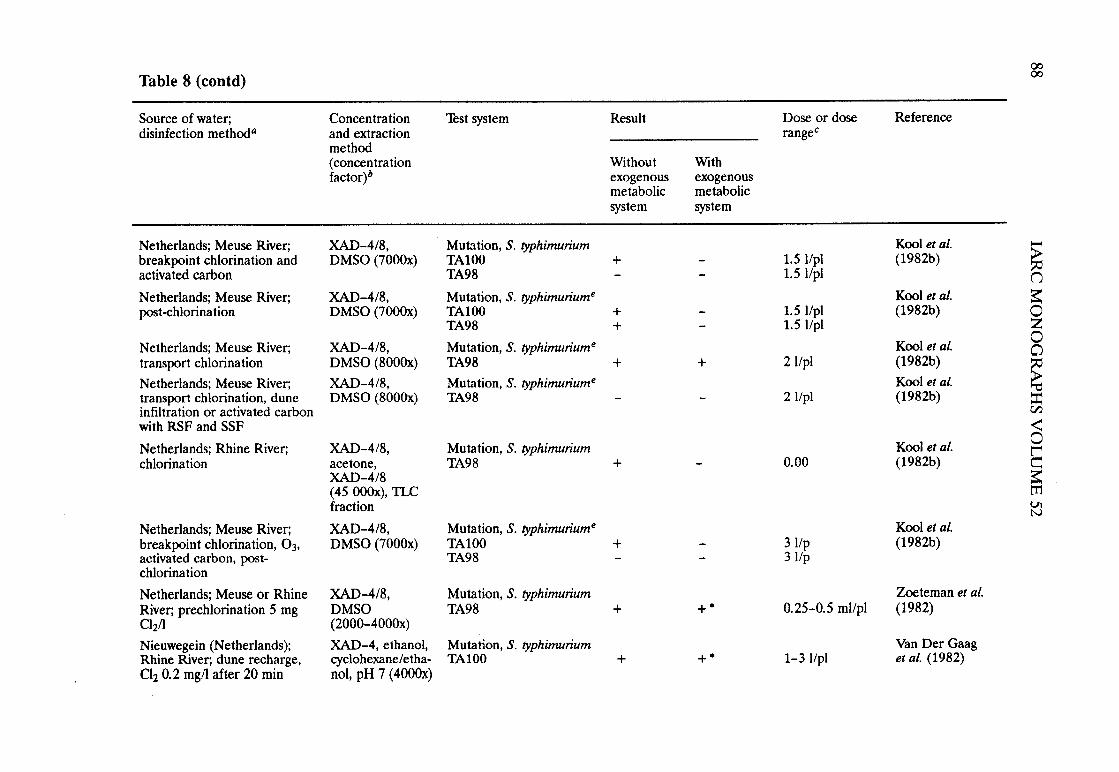
00Table 8 (contd) 00
Source of water; Concen tra tion Test system Result Dose or dos Referencedisinfection methoda and extraction rangeC
method(concentration Without Withfactor)b exogenous exogenous
metabolic metabolicsystem sytem
Netherlands; Meuse River; XA-4/8, Mutation, S. typhimurium Kool et al. ""breakpoint chlorination and DMSO (7000) TA100 + - 1.5 l/pl (1982b) ~activated carbon TA98 - - 1.5 I/pl nNetherlands; Meuse River; XA-4/8, Mutation, S. typhimuriume Kool et al. ~pot-chlorination DMSO (700Ox) TA100 + - 1.5 l/pl (1982b) 0
TA98 + - 1.5 l/pl ZNetherlands; Meuse River; XA-4/8, Mutation, S. typhimuriume Kool et al.
00
transport chlorination DMSO (800Ox) TA98 + + 2l/pl (1982b)
~Netherlands; Meuse River; XA-4/8, Mutation, S. typhimuriume Kool et al.transport chlorination, dune DMSO (8000) TA98 - - 2 l/pl (1982b) ~infiltration or activated carbon C/
with RSF and SSF âNetherlands; Rhine River; XA-4/8, Mutation, S. typhimurium Kool et al.
Echlorination acetone, TA98 + - 0.00 (1982b)XA-4/8 ~(45 OOOX), TL tIfraction ViN
Netherlands; Meuse River; XA-4/8, Mutation, S. typhimuriume Kool et al.breakpoint chlorination, 03, DMSO (700) TA100 + - 31/p (1982b)activated carbon, pot- TA98 - - 3l/pchlorination
Netherlands; Meuse or Rhine XA-4/8, Mutation, S. typhimurium Zoteman et al.River; prechlorina tion 5 mg DMSO TA98 + +* 0.25-0.5 ml/pl (1982)Clill (2000-400Ox)Nieuwegein (Netherlands); XA-4, ethanol, Mutation, S. typhimurium Van Der GaagRhine River; dune recharge, cyclohexane/etha- TA100 + +* 1-3 l/pi et al. (1982)Ch 0.2 mgll after 20 min 001, pH 7 (4000)

Table 8 (contd)
Source of water; Concentration Test sytem Result Dos or dos Referencedisinfection methoda and extraction rangeCmethod( concen tra tion Without Withfactor)b exogenous exogenous
metabolic metabolicsystem sytem n
:iNieuwegein (Netherlands); XA-4, ethanol, Mutation, S. typhimurium Van Der Gaag l"Rhine River; dune recharge, cyclohexane/etha- TA100 + +. 1-3 l/pl et al. (1982) 0
:;Ch 0.2 mgll after 20 min nol, pH 2 (400) -Nieuwegein (Netherlands); XA-4, ethanol, Mutation, S. typhimurium Van Der Gaag Z
~Rhine River; active carbon fi- cyclohexane/etha- TA100 - - 1-4 l/pl et al. (1982)tr~tion, Cli 0.2 mgll after 20 nol, pH 7 (400)
Umm
Nieuwegein (Netherlands); UXA-4, ethanol, Mutation, S. typhimurium Van Der Gaag :;Rhine River; active carbon fil- cyclohexane/etha- TA100 + 1.4 l/pl et al. (1982) --Ztration, Cli 0.2 mgll after 20 nol, pH 2 (400) ~min -ZNetherlands; Meuse River; CIi XA-4/8, Mutation, S. typhimurium Kooi et al. a1. 5 mgll D MSO or ace- TA100 (-) 0.1-0.2 ml (1985b)1+
~tone (700) TA98 + + 0.1-0.2 mlTA100NR- - - 0.1-0.2 ml
~TA98NR- + - 0.1-0.2 ml ~Netheriands; Meuse River; Cli XA-4/8, Mutation, S. typhimurium Kooi et al.5-15 mgll DMSO (400) TA100 - - 211pl (1985c)
TA98 + +. 2l/plNetherlands; Meuse River; XA-4/8, Mutation, S. typhimurium Kooi & Hrubectransport chlorination DMSO TA98 + - 1. 5 l/pi (1986); Kool et al.Ch 1-2 mgll
(1985b)Netherlands; Meuse River; XA-4/8, Mutation, S. typhimuriume Kool & Hrubecprechlorination Ch 1.8 mgll DMSO (700Ox) TA100 + +. 3.5 IIpl (1986); Kool &
TA98 + +. 3.5 l/pl van Kreijl (1984);Kooi et al.
(1985b)00\0

Table 8 (contd) ~
Source of water; Concentration Test sytem Resul t Dose or dos Referencedisinfection methoda and extraction rangeC
method( concen tra tion Without Withfactor)b exogenous exogenous
metabolic metabolicsystem system
Netherlands; Meuse or Rhine XA-4/8, Mutation, S. typhimuriume Kool & Hrubec -River; potchlorination 0.15 DMSO (700) TAl00 + + 3.5 IIpl (1986); Kool & ~mg Cli after 20 min TA98 + +* 3.51/pl van Kreijl (1984);
Kool et al. n(1985b) ~
Netherlands; Meuse River; Cli XA-4/8, Mutation, S. typhimurium Kool & Hrubec 0Z
1-5 mgll DMSO (3500) TAI00 + 0 1. 7 IIpl (1986) 0TA98 + + * 1. 7 IIpl 0
Netherlands; Rhine River; Cli XAD-4/8, Mutation, S. typhimurium Kool & Hrubec~1-5 mgll DMSO (3500) TAI 00 - 0 0.9 IIpl (1986)
TA98 (+ ) (+ ) 0.91/pl :iNetherlands; sunace water
crXA-4/8, Mutation, S. typhimurium Kool & Hrubec ~from one city; Cli 1 mgll DMSO (700), TAI 00 - - 3.5 l/pl (1986) 0neutral fraction TA98 + + 3. 5 IIpl
ENetherlands; sunace water XA-4/8, Mutation, S. typhimurium Kool & Hrubec æ:from one city; Cli 1 mgll DMSO (700), TAl00 - - 3.5 IIpl (1986) tracidic fraction TA98 - + 3.5 l/pl VI
Netherlands; sunace water XA-4/8,N
Mutation, S. typhimurium Kool et al.from one city; Ch 1 mgll DMSO (700), TAI 00 + - 3.51/pl (1985c)
neutral fraction TA98 + + 3.5 ¡¡pl
Netherlands; sunace water XA-4/8, Mutation, S. typhimurium Kool et al.from one city; Cli 1 mgll DMSO (700Ox), TAI00 - - 3.5 IIpl (1985c)
acidic fraction TA98 + - 3. 5 l/pl
Cincinnati (Ohio, USA); Ohio XA-2, hexane- Mutation, S. typhimurium Loper et al.River; presettling with alumini- acetone (10 00). TAI00 + +* 0.25-1.51/pl (1985)um sulfate, Ch, lime, F, ferrc TA98 + +* 0.25-1.5I1plsulfate, coagulation, floccula-tion, sedimentation, RSF

Table 8 (contd)
Source of water; Concentration Test system Result Dose or dose Referencedisinfection methoda and extraction rangeCmethod(concentration Without Withfactorl exogenous exogenous
metabolic metabolicsystem system
Cincinnati (Ohio, USA); tap XA-2, hexane- Mutation, S. typhimurium Laper et aL. nwater; presettling with alumini- acetone (10 00) TAlOO + (+ )* 0.25- 1. 5 Upl (1985) :ium sulfate, Cli, lime, F, ferrc TA98 + (+ )* 0.25- 1. 5 Upl r-0sulfate, coagulation, flocula-~tion, sedimentation, RSF -ZCincinnati (Ohio, USA); Ohio XA- 2, hexane- Mutation, S. typhimurium Laper et al.
~River; presettling with alumini- acetone (10 00) TAlOO - 0 0.25-1.5 Upl (1985)um sulfate, Cli, lime, F, ferrc TA98 - 0 0.25- 1. 5 Upl
Usulfate, coagulation, floccula-
Ution, sedimentation, RSF,~GAC -
Cincinnati (Ohio, USA); Ohio XA- 2, hexane- Mutation, S. typhimurium Laper et al. Z~River; presettling with alumini- acetone (100) TA100 - - 0.25-3 Upl (1985) -Zum sulfate, Cli, lime, F, ferrc TA98 - - 0.25-2 Upl 0sulfate, coagulation, floccula-1
tion, sedimentation, RSF, ~GAC, Ch 2.6 mgll
~Jeffersn Parish (Louisiana, XA-2 and Mutation, S. typhimurium Miler et al.USA); pilot plant; Cli XAD-8, acetone TAlOO + 0 0.00 (1986)
~(400), pH 2 TA98 + 0 0.00
Jeffersn Pansh (Louisiana, XA-2 and Mutation, S. typhimurium Miler et al.USA); pilot plant; Cli, fresh XA-8, acetone TAlOO - 0 0.00 (1986)GAC (400) TA98 - 0 0.00Jefferson Parish (Louisiana, XA-2 and Mutation, S. typhimurium Miller et al.USA); pilot plant, Ch, GAC XA-8, acetone TA100 - 0 0.00 (1986)after 14 months ( 400) TA98 + 0 0.00Jeffersn Parish (Louisiana, XA-2 and Mutation, S. typhimurium Miler et al.USA); pilot plant; CIi, fresh XA-8, acetone TA100 - 0 0.00 (1986)GAC, Cli ( 400Ox) TA98 - 0 0.00 \0..

Table 8 (contd) \0N
Source of water; Concentration lèst system Result Dose or dos Referencedisinfection methoda and extraction rangeC
method(concentration Without Withfactor)b exogenous exogenous
metabolic metabolicsytem system
Jeffersn Parish (Louisiana, XA-2 and Mutation, S. typhimurium Miler et al.USA); pilot plant; C12, GAC XA-8, acetone TA100 + 0 0.00 (1986) -after 6 months, Cl2 ( 400) TA98 + 0 0.00 ~Jeffersn Parish (Lopuisiana, Revers osmosis Mutation, S. typhimurium Miler et al. nUSA); pilot plant; CI2 (400) TA100 - - 0.025-1 ml/pl (1986) ~
TA98 - - 0.025-1 ml/pl 0Jeffersn Parish (Louisiana, XA-2 and Mutation, S. typhimurium Ringhand et al.
Z0
USA); pilot plant, Mississippi XA-4, acetone TA100 + 0 0.1-1.61/pl (1987) QRiver; clarification, settling, F, pH2
~sand filtration, Ch 0.2-7.5ppm ::Jeffersn Parish (Louisiana, XA-2 and Mutation, S. typhimurium Ringhand et al. C/
USA); pilot plant; Mississipi XA-4, acetone TA100 (+ ) 0 0.1-1.6l/pl (1987) âRiver; clarification, settling, F, pH 8sand fitration, Ch, 0.2-7.5 Eppm ~Cincinnati (Ohio, USA); XA-2 and Mutation, S. typhimurium Ringhand et al. trpilot plant, Ohio River; clarifi- XA-4, acetone TA100 + 0 0.1-1.61/pl (1987) VI
Ncation, coagulation, floccula- pH2tion, seimentation, RSF, Cli0.2-7.5 ppm
Cincinnati (Ohio, USA); XA-2 and Mutation, S. typhimurium Ringhand et al.pilot plant, Ohio River; clarifi- XA-4, acetone TA 100 (+ ) 0 0.1-1.61/pl (1987)cation, sedimentation, coagula- pH8tion, flocculation, sedimenta-tion, RSF, Ch 0.2-7.5 ppm
USA; chlorinated drinking- Polyurethane Mutation, S. typhimurium Schwartz et al.water foam column, TA98 - - 0.1- Il/pl (1979)
acetone, benzene(30 OOOX)

Table 8 (contd)
Source of water; Concentration Test system Result Dose or dose Referencedisinfection methoda and extraction rangeC
method(concen tra tion Without Withfactor)b exogenous exogenous
metabolic metabolicsystem system
ItaIy; Iake; CIi, flocculation, Liquid-liquid ex- Mutation, S. typhimurium Monarca et al. n:iRSF, CIi traction, CHiCIi, TAIOO - - 0.00 (1985a) t'neutrai TA98 - - 0.00 0
ItaIy; Iake; CIi, flocculation, Liquid-liquid ex- Mutation, S. typhimurium Monarca et al. ~-RSF, Cli traction, CHiCli, TAIOO + - 0.00 (1985a) Z
acidic TA98 - - 0.00~ItaIy; Iake; Cli, flocculation, Liquid-liquid ex- Mutation, S. typhimurium Monarca et al.
RSF, CIi traction, CHiCli, TAIOO + - 0.00 (1985a)U
basic TA98 - - 0.00 u~
ItaIy; river, CIi, flocculation, Liquid-liquid ex- Mutation, S. typhimurium Monarca et al. -Z
SSF, CIi traction, CHiCIi, TAIOO - - 0.00 (1985a) ~neutrai TA98 + - 0.00 -
ZItaly; river; CIi, flocculation, Liquid-liquid ex- Mutation, S. typhimurium Monarca et al. 0SSF, Cli traction, CHiCli, TA100 + 0.00 (1985a)
1- ~acidic TA98 + - 0.00
~Italy; river; CIi, flocculation, Liquid-liquid ex- Mutation, S. typhimurium Monarca et al.SSF, CIi traction, CHiCli, TA 100 - - 0.00 (1985a) ~
basic TA98 - - 0.00
ItaIy; lake; Ch, flocculation, XA-2, acetone Mutation, S. typhimurium Monarca et al.RSF, Cli TAIOO - - 0.00 (1985a)
TA98 - - 0.00
ItaIy; river; CIi, flocculation, XA-2, acetone Mutation, S. typhimurium Monarca et al.SSF, CIi TA100 - - 0.00 (1985a)
TA98 - - 0.00
Italy; lake; NaOCI, floccula- XA-2, acetone Mutation, S. typhimurium, Monarca et al.tion, RSF, NaOCl fluctuation test (1985b)
TA100 - 0 0.1-1 I/test 1.v.

\0~Table 8 (contd)
Source of water; Concentration Test system Result Dose or dos Referencedisinfection methoda and extraction rangeC
method(concentration Without Withfactor)b exogenous exogenous
metabolic metabolicsystem system
..Italy; river; NaOCl, floccula- XA-2, acetone Mutation, S. typhimuriume Monarca et al. ~tion, SSF, NaOCl fluctuation test (1985b) ()
TAI 00 - 0 O.l-ll/test ~Italy; lake; NaOCI, floccula- Uquid-liquid Mutation, S. typhimurium Monarca et al. 0tion, RSF, NaOCl extraction, fluctuation test (1985b) Z
CHiCli, neutral TAI 00 - 0 0.1-1 l/test 0Cì
Italy; lake; NaOCl, floccula- Uquid-liquid Mutation, S. typhimurium Monarca et al.
~tion, RSF, NaOCI extraction, fluctuation test (1985b)CHiCli, acidic TAlOO + 0 0.1-1 l/test 0:
Italy; lake; NaOCI, floccula- Liquid-liquid Mutation, S. typhimurium Monarca et al.CI
~tion, RSF, NaOCl extraction, fluctuation test (1985b) 0
CHiCli, basic TAlOO - 0 O.l-ll/testB
Italy; river; NaOCI, floccula- Uquid-liquid Mutation, S. typhimurium Monarca et al. ~tion, SSF, NaOCI extraction, fluctuation test (1985b) t'
CHiCli, neutral TAI 00 - 0 0.1-1 l/test U'
Italy; river; NaOCl, floccula- Liquid-liquid Mutation, S. typhimurium Monarca et al.N
tion, SSF, NaOCl extraction, fluctuation test (1985b)CHiCli, acidic TAI 00 + 0 O.l-ll/test
Italy; river; NaOCI, floccula- Uquid-liquid Mutation, S. typhimurium Monarca et al.
tion, SSF, NaOCl extraction, fluctuation test (1985b)CHiCli, basic TAI 00
- 0 0.1-1 l/test
Italy; surface water; NaOCI, Sep-Pak, metha- Mutation, S. typhimurium Monarca et al.flocculation, sand filtration, nol fluctuation test (1985b)NaOCI TAI 00 + 0 from 0.1 l/test

Table 8 (contd)
Source of water; Concen tra tion Thst system Result Dos or dos Referencedisinfection methoda and extractionrangeCmethod
( coneen tra tion Without Withfactor)b exogenous exogenous
metabolic metabolicsytem sytem
Kuopio, Finland; Kallavesi Uquid-liquid Mutation, S. typhimurium Vartiainen & ('Lake; Ca(OHn, Al2(SO)4)3, extraction, diethyl TA100 + +* 3-33 ml/pl Uimatainen ~CI2 1 mgll, CO2, flotation, ether TA98 + +* 4-35 ml/pl (1986) rsand filtration, Ca(OH)i CI2 01 mgll, F ~-Kuopio, Finland; Kaiiavesi Uquid-liquid Mutation, S. typhimurium Vartiainen & ZLake; Ca(OHn, Al2(SO)4)J, extraction, TA100 + 0 100300 mllpl Uimatainen~Ch 1 mgll, CO2, flotation, CH2CI2 TA98 + 0 100300 ml/pl (1986)sand fitration, Ca(OH)i CI2U1 mgll, FU
Kuopio, Finland; Kallavesi XA 8, ethyl Mutation, S. typhimurium Vartiainen & ~-Lake; Ca(OHn, Al2(SO)4)J, aeetate TA100 + 0 4-40 ml/pl Liimatainen Z~CI2 1 mgii' CO2, flotation, TA98 + 0 4-40 ml/pl (1986) -sand fitration, Ca(OH)i CI2Z1 mgll, F 01Varkaus, Finland; lake; chlori- Uquid-liquid Mutation, S. typhimurium Vartiainen & ~nated drinking-water extraction, TA100 + 0 0.00 Liimatainen~CH2CI2 TA98 + 0 0.00 (1986)
Kuopio, Finland; Kallavesi XA 8, ethyl Mutation, S. typhimurium Vartiainen et al.~
Lake; Ca(OH)i, C12 0.7 g/m3, acetate, acidicl TA 100 + 0 0.00 (1987b)A12(SO)4)3, CO2, mixng, flota- neutral TA98 + 0 0.00tion or sedimentation, sand fi- TA97 + 0 0.00tration, CI2 1.2 g/m3, F,
Ca(OH)i
Kuopio, Finland; Kallavesi XA 8, ethyl Mutation, S. typhimurium Vartiainen et al.Lake; Ca(OH)2, CI2 0.7 g/m3, acetate, basic TA100 - 0 0.00 (1987b)Al2(SO)4)J, CO2, mixng, flota- TA98 - 0 0.00tion or sedimentation, sand fil- TA97 - 0 0.00tration, C12 1.2 g/m3, F,
\0Ca(OH)iVI

Table 8 (contd) ~
Source of water; Concentration 'lst sytem Result Dose or dose Reference
disinfection methoda and extraction rangeemethod(concentration Without Withfactor)b exogenous exogenous
metabolic metabolicsystem system
Kuopio, Finland; artificially re- XA 8, ethyl Mutation, S. typhimurium Vartiainen et al.
charged water from Kallavesi acetate, acidic/ TAI 00 + 0 0.00 (1987b),.
Lake; aeration, Ca(OHn, CiO- neutral TA98 + 0 0.00 ~1 mgll, mixng, A1i(S04)i, TA97 + 0 0.00 ()floculation, sedimentation, 3:sand fitration, potchlorina- ation 0.5 mgll ZKuopio, Finland; artificially re- XA 8, ethyl Mutation, S. typhimurium Vartiainen et al. a0charged water from Kallavesi acetate, basic TAI 00
- 0 0.00 (1987b)
~Lake; aeration, Ca(OHn, CLO- TA98 + 0 0.00
1 mgll, mixng, A1i(S04h, TA97 + 0 0.00floculation, sedimentation,
::sand fitration, potchlorina-
C/
tion 0.5 mgll..a
Kuopio, Finland; artificially re- XA 8, ethyl Mutation, S. typhimurium Vartiainen et al. tcharged water from Kallavesi acetate, acidic/ TAI 00 + 0 0.00 (1987b)Lake; aeration, Ca(OHn, CiO- neutral TA98 + 0 0.00 3:
1 mgll, mixng, A1i(S04)3, TA97 + 0 0.00 tr
floculation, sedimentation,
VINsand filtration
Kuopio, Finland; artificially re- XA 8, ethyl Mutation, S. typhimurium Vartiainen et al.
charged water froID Kallavesi acetate, basic TAIOO - 0 0.00 (1987b)Lake; aeration, Ca(OH)i, CiO- TA98 + 0 0.001 mgll, mixng, A1i(S04h, TA97 + 0 0.00
floculation, sedimentation,
sand filtration
Kuopio, Finland; artificially re- XA 8, ethyl Mutation, S. typhimurium Vartiainen et al.
charged water from Kallavesi acetate, acidic/ TAIOO + 0 0.00 (1987b)Lake; aeration, Ca(OH)i, CLO- neutral TA98 + 0 0.00
1 mgll, KMn04, mixng, TA97 - 0 0.00
A1i(S04)3, flocculation, sedi-mentation, sand fitration

Table 8 (contd)
Source of water; Concentration Test system Result Dos or dos Referencedisinfection methoda and extraction rangeCmethod(concentration Without Withfactor)b exogenous exogenous
metabolic metabolicsystem system
(JKuopio, Finland; artificially re- XA 8, ethyl Mutation, S. tyhimurium Vartiainen et al. ~charged water from Kallavesi acetate, basic TAI 00 - 0 0.00 (1987b) ~0Lake; aeration, Ca(OH)i CIO- TA98 - 0 0.00 :;1 mgll, KMn04, mixng, TA97 - 0 0.00 ..Ali(S04)3, floculation, sedi- Zmentation, sand filtration
~Kuopio, Finland; artificially re- XA-8, ethyl Mutation, S. typhimurium Vartiainen et al. 0charged water from Kallavesi acetate, acidic/ TAI00 + 0 0.00 (1987b) ULake; aeration, CiO- 2 mgll neutral TA98 + 0 0.00 :;TA97 + 0 0.00 ..Kuopio, Finland; artificially re- XA 8, ethyl Mutation, S. typhimurium Vartiainen et al. Z
~charged water from Kallavesi acetate, basic TAI 00 - 0 0.00 (1987b) ..ZLake; aeration, CiO- 2 mgll TA98 + 0 0.00 QTA97 - 0 0.00 1
Finland; nine artificially re- XA 8 at pH 2, Mutation, S. typhimuriume Vartiainen et al. ~charged waters; alum coagula- ethyl acetate TAI00 + 0 0.00 (1988) ~tion, clarification, sand filtra- TA98 (+ ) 0 0.00 :;tion, pH adjustment, Cli 1 TA97 - 0 0.00:i 0.9 mgll
Finland; 14 surface waters; fi- XA 8 al pH 2, Mutation, S. typhimuriume Vartiainen et al.tration, Cli 0.6 :i 0.6 mgll ethyl acetate TAI00 + 0 0.00 (1988)TA98 + 0 0.00
TA97 + 0 0.00Finland; 22 surface waters; XA 8 at pH 2, Mutation, S. typhimuriume Vartiainen et al.alum coagulation with or with- ethyl acetate TA100 + 0 0.00 (1988)out Fei(S04)i, clarification, TA98 + 0 0.00sand fitration, pH adjustment, TA97 + 0 0.00Cli 1. 3 :1 0.9 mgll \0..

Table 8 (contd)1.00
Source of water; Concen tra tion Test system Result Dose or dose Referencedisinfection methoda and extraction rangeC
method(concentration Without Withfactor)b exogenous exogenous
metabolic metabolicsystem system
Finland; 22 surface waters; Cli XA 8 at pH 2, Mutation, S. typhimuriume Vartiainen et al. -1.7:l 1.2 mg/l, alum coagu- ethyl acetate TA100 + 0 0.00 (1988) ~lation with or without TA98 + 0 0.00
Fei(S04)3, clarification, sand TA97 - 0 0.00 ()filtration, pH adjustment, Cli ~1:l 0.5 mg/l
azFinland; three surface waters; XA 8 at pH 2, Mutation, S. typhimuriume Vartiainen et al. aKMn04, alum coagulation, ethyl acetate TA100 + 0 0.00 (1988) 0clarification, sand filtration, TA98 (+ ) 0 0.00
~pH adjustment, Cli 1.4 TA97 + 0 0.00
:l O. 3 mg/l :ir:'Tipei (Tiwan); chlorinated XA-2, acetone, Mutation, S. typhimurium Wei et al. (1984) ~river water; total Cli before pH 7, 6.9 or 6 TA100 + - 0.00 aXA 1.2-13.4 ppm TA98 - - 0.00 5'Tipei (Tiwan); chlorinated XAD-2, acetone, Mutation, S. typhimurium Wei et al. (1984) ~eiver water; total Ch before pH 5.2 TA100 + +* 0.25-1l/pl rrXA 36 ppm TA98 - - 0.00 VtN'Tipei (Tiwan); chlorinated XA-2, acetone, Mutation, S. typhimunum Wei et al. (1984)river water; total Cli 0.1-13.3 pH 6.5-8.5 TA100 - - 0.00ppm, boilng before or after TA98 - - 0.00Ch
Como (Haly) outlet; mixed XA-2 and Gene conversion, Sacchar- + 0 0.2-5.0Ilml Galassi et al.from groundwater and Lake XA- 7, acetone omyces cerevisiae 6117 (1989)Como; conventional treatment, cyh2 locusNaOCI

Table 8 (contd)
Source of water; Concentration Test sytem ResuIt Dos or dose Referencedisinfection methodQ and extraction rangeCmethod(concen tra tion Without Withfactor)b exogenous exogenous
metabolic metabolicsytem sytem
nMAMAAN CEll lN VITRO ::~
Oise River (France), 03, stor- XA-4 and Mutation, Chinese ham- 0 0.00 Bourbigot et al. 0-:;age, coagulation, floculation, XA-8, DMSO ster V79 celIs! hprt resis-
(1983) -Zdecantation, fitration, 03, tance inc1uding 'initiator
~GAC, 03. Cl2 0.9 mgll and promoter activity'Ontario (Canada); river; chIo- XA-2, hex- Sister chromatid ex- + (-) DO: 1.2 llml Douglas et al. Urinated tap water ane:acetone change, Chinese hamster
(1986) UCHO cells::-Ontario (Canada); rier; chIo- XA-2, hex- Sister chromatid ex- - 0 DD: 0.8 l/ml Douglas et al. Zrinated tap water ane:acetone change, Chinese hamster
(1986) ~-CHO cellsZ
Ontario (Canada); lake; ch lori- XA-2, hex- Sister chromatid ex- - 0 DD: 2.0 l/ml Douglas et al. a1nated tap water ane:acetone change, Chinese hamster
(1986)~CHO cells
Ontario (Canada); lake; chlori- XA-2, hex- Sister chromatid ex- (+ ) 0 DO: 0.9l/ml Douglas et al. ~nated tap water ane:acetone change, Chinese hamster(1986) :;
CHO ce lis
Ontario (Canada); mixd sur- XA-2, hex- Sister chromatid ex- + 0 DD: 1 l/ml Douglas et al.face and groundwater; chlori- ane:acetone change, Chinese hamster(1986)nated tap water CHO cells
VI( lowland river; chlorinated XA-2, acetone Chromosmal aberrations, + 0 0.5-2 l/ml Wilcox & Wil-(10 00) Chinese hamster CHO liamson (1986)
cellsVI( upland reservoir; chlori- XA-2, acetone Chromosmal aberrations, + 0 1-4 l/ml Wilcox &nated
(10 OOOX) Chinese hamster CHO Wiliamsoncells
(1986) ~

Table 8 (contd)
Test system Dos or dosrangeC
ReferenceSource of water;disinfection methoda
Concentrationand extractionmethod( concen tra tionfactor)b
Ontario (Canada); river; chIo-rinated tap water
Ontario (Canada); river; chIo-rinated tap waterOntario (Canada); lake; chlori-nated tap water
Ontario (Canada); lake; chlori-nated tap water
Ontario (Canada); mixdground- and surface waters;chlorinated tap water
XA-2 hexane:acetone
XA-2 hexane:acetone
XA-2 hexane:acetone
XA-2 hexane:acetone
XA-2 hex-ane:acetone
Micronuclei, Chinesehamster CHO cells
Micronuclei, Chinesehamster CHO cells
Micronuclei, Chinesehamster CHO cells
Micronuclei, Chinesehamster CHO cells
Micronuclei, Chinesehamster CHO cells
Douglas et al.(1986)Douglas et al.(1986)Douglas et al.(1986)Douglas et al.(1986)Douglas et al.(1986)
4- 27 ¡ig/ml
0.00
0.00
DD: 2.8 l/ml
DD: 0.9 l/ml
aoAC, granular activated carbon; RSF, rapid sand filtration; SSF, slow sand filtrationb¡MSO, dimethyl sulfoxide; TL, thin-Iayer chromatography"pl, plate; DD, doubling dos. Doss given in litres per unit are litre equivalents of the original water sample per that unit. Other units refer to theamount of concentrate added per plate, mililitre, etc.tleatment performed in laboratoiy instead of water treatment plant€Mean of net revertantsllitre compared to mean of net revertantsllitre in raw watersÆ:omparison to previous stage in the treatment process*Lower effect than without metabolic activation* *Data not given but lower effect than without metabolic activation
~8
~()~ozoo
~::C/~oE~tTVIN

Table 9. Summary of the influence of chlorination upon the genetic and related elTects of groundwater and spring water con.centrates in comparison with concentra tes of unchlorinated water
Source of water; Concentration Test system ResuIt Dose or dos Referencedisinfection methoda and extraction rangeCmethod(concentration Without Withfactor)b exogenous exogenous ("
metabolic metabolic ::t"system system 0:x-Netherlands; groundwater XA-4/8, Mutation, S. typhimurium Kool & Hrubec Zfrom five cities; CI2 1 mgll DMSO (700), TAI 00 ( + ) (1I5)d
-3. 5 Upl (1986)
~neutral TA98 + (3/5) + (2/5) 3.5 Upl
UNetherlands; groundwater XA-4/8, Mutation, S. typhimurium Kool & HrubecUfrom five cities; CI2 1 mgll DMSO (700), TAloo + (2/5) - 3.5I/pI (1986) :xacidic TA98 + (2/5) ( + ) (115) 3.5 Upl -ZNetherlands; groundwater XA-4/8, Mutation, S. typhimurium Kool et al. ~-from five cities; CI2 1 mgll DMSO (700), TA100 + (2/5) - 3. 5 I/pI (1985c) Zneutral TA98 + (2/5) ( + ) (115) 3. 5 Upl 01
Netherlands; groundwater XA-4/8, Mutation, S. typhimurium Kooi et al. ~from five cities; CI2 1 mgll DMSO (7000), TAI 00 ( + ) (115) - 3.5 Upl (1985c)~acidic TA98 + (3/5) ( + ) (3/5) 3. 5 l/pl:xItaly; spring water; Cli liquid-liquid ex- Mutation, S. typhimurium Monarca et al.
traction, CHiCli, TA 100 - - 0.00 (1985a)neutraI, acidic, TA98 - - 0.00basic
Italy; spring water; CI2 XA-2, acetone Mutation, S. typhimurium Monarca et al.TA 100 - - 0.00 (1985a)TA98 - - 0.00
Italy; spring water; NaOCI XA-2, acetone Mutation, S. typhimurium, Monarca et al.fluctuation test
(1985b)TA100 0 0.1-1 l/test ..- 0i-

Table 9 (contd)..0N
Source of water; Concen tra tion Test system Result Dose or dose Reference
disinfection methoda and extraction rangeC
method(concentration Without Withfactor)b exogenous exogenous
metabolic metabolicsystem system
Italy; spring water; NaOCl Uquid-liquid ex- Mutation, S. typhimurium, Monarca et aL.
traction, CHiCli, fluctuation test (1985b)-~
neutral, acidic, TAI00 - 0 0.1-1 lItest
basicn
Italy; spring water; NaOCl Sep-Pak, metha- Mutation, S. typhimurium, Monarca et aL.3:0
nol fluctuation test (1985b) ZTAI00 - 0.00 0 0
Ontario (Canada); ground- XA-2, hex- Mutation, S. typhimurium Douglas et al.a~water; chlorinated tap water ane:acetone TAI 00 (1986)
+ 0 DD: (15.5 l/ml) ::Siiinjãrv, Finland; ground- Uquid-liquid ex- Mutation, S. typhimurium Vartiainen & en
water; chlorinated drinking- traction, CHiCli TAI 00 - 0 0.00 Uimatainen ~
water TA98 - 0 0.00 (1986) 0E
Siilinjãrv, Finland; ground- Uquid-liquid ex- Mutation, S. typhimuriume Vartiainen &3:
water; chlorinated Cli 2 or 20 traction, CHiCli TAI00 +1 0 0.00 Uimatainen timg/lg TA98 - 0 0.00 (1986) VINUK; groundwater; chlorinated Freeze-dryng Mutation, S. typhimurium Fielding & Horth
fluctuation test (1988)TAI00TA98 + +

Table 9 (contd)
Source of water;disinfection methoda
Concen tra tionand extractionmethod( concen tra tionfactor)b
Ontario (Canada); ground-water; chlorinated tap water
XA-2, hex-ane:acetone
Ontario (Canada); ground-water; chlorinated tap water
XA-2, hex-ane:acetone
Test system Result Dos or dos ReferencerangeC
Without Withexogenous exogenousmetabolic metabolicsytem system
Sister chroma tic exchange, Douglas et al.Chinese hamster CHO (1986)cells (+ ) 0 DD: 1.9 l/ml
Micronuc1ei, Chinese Douglas et al.hamster CHO cells - 0 0.00 (1986)
IlAC, granular activated carbon; RSF, rapid sand filtration; SSF, slow sand filtration.bnMSO, dimethyl sulfoxide
1'1, plate; DD, doubling dos. Doss given in 1 per unit are litre equivalents of the original water sample per that unit. Other units refer ta the amountof concentra te added per plate, mililitre, etc.d'n parentheses, number of citiesEComparison ta previous stage in the treatment process-bnly 20 mg Qi/l poitive
8'eatment pedormed in laboratory and not in water treatment plant
()::~o:;""Z
~UU:;""Z~""Zo1
~~:;
..ow

¡.
Table 10. Summary orthe influence or chlorinatIon in combination with either chlorine dioxide or ozone treatment upon the~
genetic activity or sunace water concentra tes in comparison with concentra tes or unchlorinated water
Source of water; Concentration 'lst sytem Result Dos or dos Referencedisinfection method and extraction rangea
method(concentration Without Withfactor) exogenous exogenous
metabolic metabolicsystem system -
Savojärv, Finlandj humic lake XA 4/8, ethyl Mutation, S. typhimurium Backlund et al. ~water; 03 5.7-33.2 mgll, Ch acetate TA100 + 0 10-50 ml/pl (1985)
n21 mgll TA98 + 0 10-50 ml/pl ~
TA97 + 0 10-50 ml/pl azSavojärv, Finlandj humic lake XA 4/8, ethyl Mutation, S. typhimurium Backlund et al. awater; Cli 10.5 mgll, CIOi acetate TAI 00 + 0 10-50 ml/pl (1985) 010.5 mgll TA98 + 0 10-50 ml/pl
~TA97 - 0 10-50 ml/pl
Savojärv, Finlandj humic lake XA 4/8, ethyl Mutation, S. typhimurium Backlund et aL.:irz
water; alum floculation, Cli acetate TAI 00 + 0 10-200 ml/pl (1985) ~6.5 mgll or 032.9 mgll, Cli TA98 + 0 10-200 ml/pl a6.5 mgll TA97 + 0 10-200 ml/pl
ESavojärv, Finlandj humic lake XA 4/8, ethyl Mutation, S. typhimurium Backlund et al. ~water; alum floculation, Ch acetate TAI 00 (+ ) 0 10-200 ml/pl (1985) tT
3.25 mgll, CIOi 3.25 mgll TA98 - 0 10-200 ml/pl V\
TA97 0 10-200 ml/plN-
Aro River (Florence, Italy); XA-2, CHiCli, Mutation, S. typhimurium Dolara et al.
NaOCI 2.5-7.5 g, Cl/m3, acti- CHCh TA100 (+ ) + 0.375-10 l/pl (1981)vated carbon, coagulation, TA1538 + + 10 l/pl
floculation, decantation, 03
Finland, seven surface waters; XA 8, pH 2, Mutation, S. typhimurium Vartiainen et al.
CIOi 1 :: 0.5 mg Chll, alum ethyl acetate TA100 + 0 0.00 (1988)
coagulation, clarification, sand TA98 - 0 0.00
fitration, pH adjustment, Ch TA97 + 0 0.00
O.7:l 0.2 mgll

Table 10 (contd) ('=ci:
Source of water; Concentration Test sytem Result Dos or dos Reference 0:;disinfection methoda and extraction rangea -Zmethod
~( concen tra tion Without Withfactor)b exogenous exogenous
metabolic metabolic Usytem system U
:;-Finland, seven surface waters; XA 8, pH 2, Mutation, S. typhimurium Vartiainen et al. Z
;;03, alum coagulation, c1arifi- ethyl acetate TA100 + 0 0.00 (1988) -Zcation, sand fitration, pH ad. TA98 (+ ) 0 0.00 0justment, Ch 0.7:: 0.3 mgll TA97 + 0 0.00 1
~l;I, pla te ~
~
""oVI
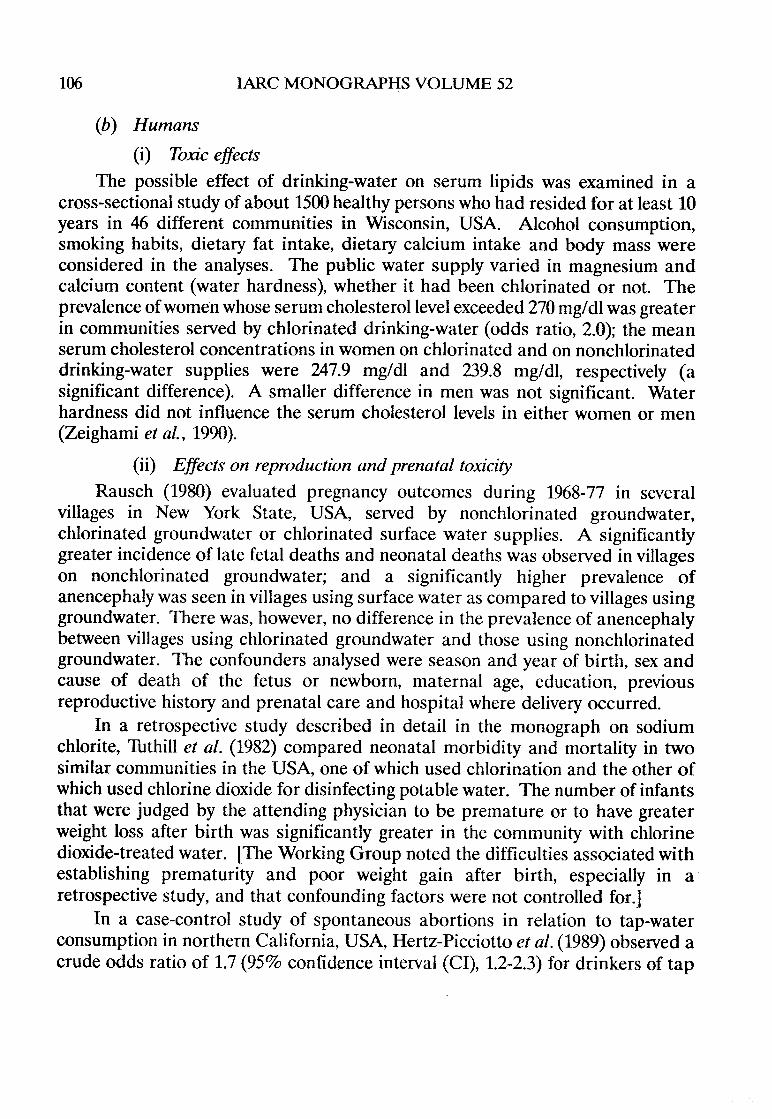
106 lARe MONOGRAHS VOLUME 52
(h) Humans
(i) Toxic effects
The possible effect of drinking-water on serum lipids was examined in across-sectional study of about 1500 healthy persons who had resided for at least 10years in 46 different communities in Wisconsin, USA. Alcohol consumption,smoking habits, dietary fat intake, dietary calcium intake and body mass wereconsidered in the analyses. The public water supply varied in magnesium andcalcium content (water hardness), whether it had been chlorinated or not. Theprevalence ofwomen whose serum cholesterol level exceeded 270 mg/dl was greaterin communities served by chlorinated drinking-water (odds ratio, 2.0); the meanserum cholesterol concentrations in women on chlorinated and on nonchlorinateddrinking-water supplies were 247.9 mg/dl and 239.8 mg/dl, respectively (asignificant difference). A smaller difference in men was not significant. Waterhardness did not influence the serum cholesterol levels in either women or men(Zeighami et al., 1990).
(ii) Effects on reproduction and prenatal toxicity
Rausch (1980) evaluated pregnancy outcomes during 1968-77 in severalvilages in New York State, USA, seived by nonchlorinated groundwater,
chlorinated groundwater or chlorinated surface water supplies. A significantlygreater incidence of late fetal deaths and neonatal deaths was obseived in vilageson nonchlorinated groundwater; and a significantly higher prevalence ofanencephaly was seen in villages using surface water as compared to vilages usinggroundwater. There was, however, no difference in the prevalence of anencephalybetween vilages using chlorinated groundwater and those using nonchlorinatedgroundwater. The confounders analysed were season and year of birth, sex andcause of death of the fetus or newborn, maternaI age, education, previous
reproductive history and prenatal care and hospital where delivery occurred.ln a retrospective study described in detail in the monograph on sodium
chlorite, Tuthil et al. (1982) compared neonatal morbidity and mortality in twosimIlar communities in the USA, one of which used chlorination and the other ofwhich used chlorine dioxide for disinfecting potable water. The number of infantsthat were judged by the attending physician to be premature or to have greaterweight loss after birth was significantly greater in the community with chlorinedioxide-treated water. (The Working Group noted thedifficulties associated withestablishing prematurity and poor weight gain after birth, especially in aretrospective study, and that confounding factors were not controlled for.)
ln a case-control study of spontaneous abortions in relation to tap-waterconsumption in northern California, USA, Hertz-Picciotto et al. (1989) observed acru de odds ratio of 1.7 (95% confidence interval (Ci), 1.2-2.3) for drinkers of tap

CHLORINATED DRINKING-WATER 107
water as compared with drinkers of bottled water. After controIIng for a largenumber of confounders, including demographic, reproductive and Iife-stylevariables, the results were stil significant.
(iv) Genetic and related effectsNo data were available to the Working Group.
3.3 Epidemiological studies or carcinogenicity in humans
The epidemiological investigation of the relation between exposure tochlorinated drinking-water and cancer occurrence is problematic because anyincrease in relative risk over that in people drinking unchlorinated water is likely tobe small and therefore difficult to detect in epidemiological studies. It isparticularly important to obtain valid assessment of disease status, of confoundingfactors (see also Preamble, p. 26) and, most relevantly, of the level of exposure tochlorinated water.
Relevant exposure to chlorinated water is particularly difficult to measure. Anumber of surrogates, such as use of surface water, depth of wells and residence in acommunitywith a chlorinated wa:ter supply, have been used. To the extent that theydo not reflect exposure to chlorinated water during the possibly relevant timeperiods for the etiology of the cancers in question, they wil result ¡fimisclassification of subjects by exposure and wil introduce bias. ln sorne studies,concentrations of particular chlorination by-products have been modelledretrospectively; the assumptions underlying such models are, however, unproven.
Correlation studies are generally of uncertain validity, because exposurevariables assessed for whole communities do not necessarily reflect the exposure ofindividuals. Such studies have been used extensively in relation to chlorinateddrinking-water, however, as exposure may vary less within geographical units (suchas towns) than between them.
Case-control studies are generally considered to provide greater opportunityfor valid inference than correlation studies, because in these studies exposure andoutcome are correlated at the individual level. Sorne of the case-control studiesavailable for review were, however, based on exposure measured at the communitylevel, because of the difficulties in assessing exposure of individuals.
Moreover, in many of these correlation and case-control studies, informationon the nature of the water source and its chlorination status was obtainedsubsequently to or contemporaneously with the period over which cancer
occurrence was measured. Because there are usually long latent periods betweenexposure and disease, cancer rates should be correlated with the characteristics ofwater supplies that were current before the cancers occurred. Most of these studies

108 lARe MONOGRAHS VOLUME 52
also did not address the problem of migration in and out of communities over time:the degree of exposure misclassification consequent on population mobility canvary between geographical areas and thus lead to unpredictable bias.
ln a small number of case-control studies of cancer incidence, detailedinformation was collected about the residential histories of subjects and theirexposure to chlorinated water over long periods, estimated by reference tohistorical data on water supplies. The accuracy of such exposure measurementsdepends on the accuracy of recall by study subjects and the availability of relevantwater supply records. Moreover, water consumed outside the home and the dailyquantity ofwater consumed have rarely been taken into account. Thus, even in thebest studies, errors in exposure measurement may stil be a problem.
An additional problem encountered in assessing the effects of chlorinatedwater is that the profile of chemical exposures resulting from chlorination dependson local conditions and may vary from place to place and from time to time. It ispossible therefore that one criterion for assessing causality-consistency of
findings among epidemiological studies-may not be entirely appropriate.Comparisons of populations living in communities served by chlorinated
water supplies and populations living in towns served by unchlorinated sourcescould be confounded by many factors, including the constituents of water suppliesother th an chlorination by-products; socioeconomic, industrial and cultural (e.g.,smoking, diet, use of medications) characteristics of the populations; and themedical facili ties available for diagnosing cancer. ln most of the studies, very few, ifany, of these factors were mentioned. Virtually aIl of the studies reviewed aretherefore susceptible to bias from confounding, to some degree.
(a) Correlation studies
(i) Surface versus groundwater
ln the studies described below, the surrogate measure of exposure to
chlorinated water was exposure to surface water, although the status of neither thesurface nor the groundwater was known.
Page et al. (1976) studied 64 parishes in Louisiana, USA, in which 32% of thepopulation were supplied by the Mississippi River, 56% by groundwater and 12%by other surface supplies. Age-adjusted 20-year mortality rates (Mas on & McKay,1974) for cancers of the gastrointestinal tract, urinary tract (these two groupingswere necessary owing to small numbers of deaths from cancers at related individualsites in sorne counties), breast and prostate and for cancers at aIl sites were analysedby multiple regression, including as independent variables the percentage of theparish population drinking Mississippi River water, rurality, income, andoccupation in the petroleum and coal, chemical and mining industries, in four
. subgroups: white men, white women, non-white men and non-white women. The
CHLORINATED DRINKING-WATER 109
proportion of the parish population using Mississippi River water was positively (p~ 0.05) associated with cancer of the gastrointestinal tract in aIl four groups, forurinary tract cancer in white men and non-white women and for cancers at aIl sitesin white men, non-white men and non-white women. (The Working Group notedthat the parishes using Mississippi River water were aIllocated in the southern partof Louisiana, and the possible effects of water supply type and social and culturaldifferences cannot be separated.)
A further analysis of these and other data (DeRouen & Diem, 1977) also tookaccount of region, i.e., northern or southern Louisiana, to allow for cultural andoccupational differences. ln a multiple regression analysis, percentage use of
Mississippi River water was significantly associated with mortality from cancers ataIl sites for white men, non-white men and non-white women, with gastrointestinaltract cancer mortality for non-white men and non-white women, with urinary tractcancer for non-white women, and with cancer of the lung for non-white men.Southern Louisiana parishes in which part of the population was supplied withMississippi River water showed significantly higher mortality from aIl cancers fornon-white women, cancer of the stomach for non-white women, cancer of the colonfor both white and non-white women, cancer of the rectum for white men, cancer ofthe urinary bladder for white men and cancer of the lung for non-white men. lnthese parishes, there was significantly lower mortality from cancer of the lung ¡nwhite women and from cancer of the liver in white men.
Kuzma et aL. (1977) classified 88 Ohio (USA) counties by ground- or surfacewater source on the basis of a survey of water supplies conducted in 196. Asubstantial proportion of the population was served by sources not included in thesurvey: in only 39 counties was more than 50% of the population on a water sourcethat was covered. Average annual age-adjusted cancer mortality rates amongwhites from 1950 to 1969 (Mas on & McKay, 1974) were obtained for cancers of thestomach, large intestine, rectum, biliary passages and Iiver, pancreas and urinaiybladder; for aIl cancers at aIl sites; for lung cancer in men; and for breast cancer inwomen. Analysis of covariance included the water classification variable as a factorand percentage urbanization, median income, population size and percentage ofthe male population in manufacturing activity and agriculture-forestry-fisheiyactivity as covariables. Adjusted mean mortality in counties classified as suppliedby surface water significantly (p ~ 0.05) exceeded that in those supplied bygroundwater for cancers at aIl sites combined in men, for stomach cancer in bathmen and women and for bladder cancer in men. When the 39 counties in whichmore than 50% of the population was on a water source covered by the survey '~vereanalysed, similar results were obtained. (The Working Group noted that in theabsence of information on county population size and water source, it was

110 lARe MONOGRAHS VOLUME 52
impossible to confirm the adequacy of covariance analysis to control for populationsize.)
Bean et aL. (1982) compared cancer incidence rates in Iowa (USA)municipalities served by water from surface sources with those from groundwatersources. They omitted municipalities with populations of fewer than 100 and thosein which less th an 90% of the water used was from the classified source. Onlymunicipalities receiving water from a single source type in 1965-79 were included.
Cancer incidence data were obtained for 1969-71 and 1973-78, from the Third
National Cancer Survey and from the Surveilance, Epidemiology and End ResultsProgram, respectively. Age-standardized, sex-specific incidence rates werecalculated for cancers of the urinary bladder, breast, colon, lung, rectum, prostateand stomach. Details of socioeconomic status and occupation were obtained fromthe 1970 census and from the Directory of Iowa Manufacturers. Using a previouslyconducted population-based case-control study of urinary bladder cancer whichincluded subjects in Iowa (Hoover & Strasser, 1980), the authors derivedinformation on several variables, including education, income, manufacturing,labour force, change in population between 1960 and 1970 and smoking habits, forresidents of towns on groundwater and on surface water. The case-control studyhad shown that 63% of the controls over 55 years of age had been on the same watersupply for at least 20 years before onset of their cancer, and 77% had been on thesame supply for at least 10 years before onset. Analyses were based on log-linearmodels. After adjustment for population size, the incidences of lung cancer andrectal cancer were significantly greater (details not given) for men and womenserved by surface water th an for those drinking groundwater. Trends of risk overthree categories of weIl depth were not significant.
Kool et al. (1981) studied 19 cities in the Netherlands, representing
approximately one-third of the population of that country. Directly standardized,sex-specific mortality rates for cancers of the bladder, lung, oesophagus, stomach,colon, rectum and liver were calculated for 1964-76. Organic constituents of tapwater were determined in 1976. Correlation coefficients between source type(surface/groundwater) were calculated, and a transformation of the rates showedthat mortality from Iiver and urinary bladder cancer in men and lung cancer in bothmen and women was significantly greater (p c( 0.05) in cities supplied with surfacewater. (The Working Group noted that no potential confounding factor was takeninto account, and the statistical methods were not adequately described.J
(ii) ehlonnation and chlonnation by-products
Cantor et aL. (1978) calculated directly age-standardized, sex-specific, cancermortality rates by site for whites for 1968-71 in 923 US counties with more than 50%urbanization in 1970. Chloroform and total trihalomethane (THM) levels were

CHLORINATED DRINKING-WATER 111
obtained from two drinking-water surveys carried out in 1975 by the USEnvironmental Protection Agency, and levels of bromine-containing tri halo-methanes (BTHM) were calculated by subtraction. The proportion of each countyserved in 196 by the sampled municipal water supplies was estimated. The
correlation between chloroform and BTHM levels was 0.54. Weighted linearregression using aIl 923 counties was used to predict sex- and site-specific cancerrates in 1970 by including the following variables in the model: urbanization (%;1970), education (1970), population size (1970), ratio of 1970:1950 population,
workforce in manufacturing (%; 1970), population in each of 10 ethnic groups (%)and region. The differences between the observed and predicted values (residuals)were correlated with log-THM in the 76 counties where 50% or more of thepopulation was served by a water supply included in either of the two surveys and inthe 25 counties where 85% or more of the population was so served. AlI cancer sitesfor which the sex-specific mortality rate was more than l.5/lOS per year werestudied. ln the analysis of the 76 counties, the only significant correlation found wasbetween the residual mortality rates for lung cancer in females and level of totalTHM (correlation coefficient, r = 0.22; p = 0.05). ln the analysis of the subset of 25counties, there were significant correlations between kidney cancer in men andchloroform level (r = 0.42, p = 0.04) and between urinary bladder cancer in womenand BTHM level (r = 0.45, p = 0.02); whereas the correlations for kidney cancer inwomen and lung cancer in men were very low or negative, the correlation coefficientfor male urinary bladder cancer and BTHM level was 0.38 (p = 0.06). Partialcorrelations controIling for high-risk occupation were calculated for cancers of theurinary bladder and lung. After allowance for lung cancer mortality (presumablyaproxy for cigarette smoking), the partial correlations of urinary bladder cancer withlog-BTHM level in counties in which 85-100% of the population was served bysampled supplies were 0.33 and 0.42 for men and women, respectively. Adjustmentfor occupational exposures left the correlations unchanged.
Hogan et al. (1979) used cancer mortality rates in US counties for 1950-69(Mason & McKay, 1974) for white men and women in a multiple regression analysis.The cancers considered were of the tongue, oesophagus, stomach, large intestine,rectum, biliary passages and liver, pancreas, breast, ovary, kidney, urinary bladderand other urinary, thyroid and bone and cancers at aIl sites. Data on exposure tochloroform were taken from the two surveys carried out by the US EnvironmentalProtection Agency in 1975 and referred to by Cantor et al. (1978). Weighted andunweighted analyses were carried out, which included the following independentvariables: population density, percentage of urbanization, percentage of non-white,percentage of foreign born, median income, education, percentage inmanufacturing industry, population size (aIl in 1960), region and chloroform infinished water. There were substantial differences in the results of three analyses
112 lARe MONOGRAHS VOLUME 52
based on different methods of weighting the units of observation. Consistentpositive associations were found with chloroform exposure level in men and womenin aIl analyses (with at least one significant result, p c( 0.05) for cancers of theurinary bladder, breast, rectum and large intestine using data for the countiescovered in the first survey and for cancers of the liver and tongue using data fromthe second survey. A significant negative association was obtained for pancreaticcancer using data from the second survey. FinaIly, in an analysis restricted tocounties in which 50% or more of the population was on a sampled supply,significant associations were found for cancer of the large intestine in bath men andwomen and for urinary bladder cancer in women. (The Working Group noted thatthe geographical areas and exposure measures were similar to those used by Cantoret al. (1978), and these results, therefore, do not provide independent evidence.)
Carlo and MeUlin (1980) obtained age-adjusted cancer incidence rates fromthe New York State Tumor Registry for 218 census tracts in Erie County, NY, USA,between 1973 and 1976. Nine cens us tracts with rates greater than three standarddeviations from the mean or large institutions were excIuded; cases with incompleteresidence data were excIuded. The cancer sites studied were oesophagus, stomach,colon, rectum, urinary bladder and pancreas; socioeconomic factors, mobilty,percentage of non-white, urbanicity and occupation (only for bladder cancer) werecontrolled for. Total THM, derived from State records, and type of water sourcewere inc1uded in the analysis. Use of surface water was significantly (p c( 0.05)associated with the incidence of oesophageal and pancreatic cancer; total THMwas not significantly related to any cancer site studied. (The Working Group notedthat the quality of data on THM levels could not be assessed; it is probable that anumber of neighbouring census tracts shared the same water supply; and thestatistical procedure used was uncIear.)
Tuthil and Moore (1980) studied communities in Massachusetts (USA) servedby surface water in 1949, exc1uding those with a population of fewer than 10 ()
persons in 1970 or with a growth rate exceeding 25% between 1950 and 1970. Theycalculated sex-specific standardized mortality ratios (SMRs) for 1969-76 for ninedigestive and urinary tract cancers and ten other cancer sites thought unlikely to berelated to water quality. Correlations were made between SMRs and threemeasures of water quality: average past (1949-51) chlorine dose, recent chlorinedose and recent total THM leveI. Data analysis inc1uded correlation and stepwisemultiple regression. Potential confounding variables included were ethnic group,income, education, percentage of foreign-born, occupation in the textile, printingand chemical industries and population growth betweeen 1950 and 1970. There was
no significant correlation between sex-specific SMRs and average chlorine dose in1949-51. For recent chlorine dose and recent total THM level, there was a significant(p c( 0.05) posi tive association wi th stomach cancer for women and for rectal cancer
CHLORINATED DRINKING-WATER 113
for men. For recent total THM level, there was a significant negative associationwith stomach cancer for men. After multiple regression analysis allowing forsociodemographic factors, the significant associations disappeared. (The WorkingGroup noted that the number of communities studied was not explicitly stated andthe methods of analysis were not fully presented.)
ln the study by KooI et al. (1981) (described on p. 110), no significantrelationship was found between levels of THM and cancer mortality in 19 cities inthe Netherlands.
Isacson et al. (1983) extended the analysis of their earlier study (Bean et al.,1982; see p. 110) to include the chlorination status of the water supply (chlorinatedprior to 1966 or never chlorinated). Directly standardized incidence rates for rectalcancer in men were significantly lower in municipalities with chlorinated water inboth categories of weIl depth (~150 feet and ~150 feet (~ or :;45.7 ml), but thisdifference was no longer significant after adjustment for potential confounding byother methods of water treatment (aeration, filtration, coagulation andsedimentation). When water sources were classified by chloroform content (0..96,100-230 and 260-90 l1g/I), nonsignificant increases were observed across theselevels for cancers of the colon, rectum and urinary bladder În men and cancers ofcolon and rectum in women. (The Working Group noted that no test for trend withincreasing chloroform level was presented.)
Zierler et al. (1986) compared mortality rates from cancers of the stomach,colon, rectum, urinary bladder, breast, lung, pancreas, kidney and lymphaticsystem in 23 Massachusetts (USA) communities provided with chlorinated waterwith mortality from these cancers in Massachusetts as a whole. There were highermortality rates in communities served bya chlorinated water source for cancer ofthe stomach among both males and females and for cancer of the lung among males.
(The Working Group noted that the exposed group provided a substantialproportion of the reference population.)
(iii) Time-trend study
Cech et al. (1987) used the introduction of a new water supply in Houston, TX,USA, as a natural experiment. Lake Houston was constructed in 1954, and much ofthe population of Houston, previously supplied with water from lightly chlorinatedunderground sources, thereafter received heavily chlorinated surface water.Fifty-six cens us tracts were studied: group A (138 697 residents) had used
groundwater over the whole period of the study; group B (46 394) changed fromground- to surface water in 1954; and groups C (84 159) and D (163466) changedfrom ground- to surface water after 1954. THM levels were measured in 1978-79,and average concentrations in source areas A, B, C and D were 4, 111, 129 and
50 l1g/l, respectively. The outcome measure was age-adjusted five-year average

114 lARe MONOGRAHS VOLUME 52
mortality from urinary tract cancer in 1940-74; control causes of death were
respiratory cancer, bronchitis-emphysema and homicide. Trends in death ratesover time showed little variation that could be related to the change in water supply.The slopes of the regression lines for urinary cancer rates for 1940-59 and for
196-74 in area B showed a significant (p .( 0.05) decrease for white men and asignificant increase for white women; no such difference was found in other areas.Adjustment of mortality rates for education, population density, percentagepopulation employed in high-risk industries, percentage population foreign-born,presence of met al or petroleum industries, and presence of hospitals with
oncological units had no effect on the results. A cohort analysis was also carriedout: there was sorne evidence of a birth cohort effect for urinary cancer in whitewomen in area B. The authors concluded that there was little evidence of an effectof chlorination.
(h) Case-control studies
(i) eommunity exosure data
Alavanja et al. (1978) carried out a death certificate case-control study in sevencounties of New York State (USA), chosen because the water supplies were diverse(including chlorinated surface and chlorinated and nonchlorinated groundwater);individual supplies had been stable for at least 15 years before the date of the study,and immigration had been low during the same period. ln aIl, 3446 deaths occurringin 1968-70 from cancers of the gastrointestinal tract (oesophagus, stomach, smallintestine, large intestine, rectum, liver, intrahepatiC bile ducts, gall-bladder and bileducts, pancreas and peritoneum and retroperitoneal tissue) and urinary tract(bladder, kidney, renal pelvis, ureter and other unspecified urinary organs) and1416 lung cancer deaths were individually matched to noncancer deaths (not further
defined) by year of death, race, sex, birthplace and county of residence. The 'usualplace of residence' on the death certificate was taken as the place of residence.Water distribution maps (from an unspecified period) were used to locate thewatersupply for each case and control individuaIly. The odds ratios associated withchlorination for gastrointestinal and urinary tract cancers combined were 1.44 forwomen and 2.09 for men (both p .( 0.(05). For lung cancer in aIl urban and ruralareas combined, the odds ratios were 1.55 (not significant) for women and 1.83(p .( 0.(05) for men. For individual cancer sites among men, aIl odds ratios weresignificantly greater th an 1; only the odds ratio for stomach cancer was significantlyraised for women. Random samples of cases and controls were taken in order tocompare possible occupational exposures; male cases were more likely to have hadoccupational exposure to carcinogens th an male controls (odds ratio, 1.25; notstatistically significant). (Te Working Group noted that no allowance for potentialconfounders (such as occupational exposure and smoking) was made in the

CHLORINATED DRINKING-WATER 115
analysis, the statistical analysis of the data is inadequately described, and it is likelythat the matching was not dealt with appropriately.)
Brenniman et al. (1980) carried out a death certificate case-control studyincorporating 3208 deaths from gastrointestinal and urinary tract cancer occurringin Illnois, USA, between 1973 and 1976 and 43 66 non-cancer deaths as controls,excluding deaths from complications of pregnancy, congenital anomalies, perinataldisorders, mental disorders, senilty and infectious diseases. The study wasrestricted to whites and to communities served by groundwater-272 chlorinatedand 270 nonchlorinated. Data on water supply were obtained from an inventory of
municipal water facilities published in 1963 and verified, where possible, by aquestionnaire sent to the water supply source. Allowance was made in the analysisfor age, sex, urbanicity and residence in a standard metropolitan statistIcal area.Cancers of the oesophagus, stomach, large intestine, rectum, liver, gall-bladder andbile ducts, pancreas, bladder and other urinary organs were studied for men andwomen separately. No significantly elevated odds ratio was found for anyindividual site.
Results from a study based on southern Louisiana (USA) parishes were
presented in three articles (Gottlieb et al., 1981, 1982; Gottlieb & Carr, 1982).Gottlieb et al. (1982) carried out a case-control study of 10 205 cancer deaths in 13parishes in southern Louisiana. l)eaths from the following cancers formed the case
series: urinary bladder, colon, kidney, liver, non-Hodgkin's lymphoma, rectum,stomach, breast, brain, oesophagus, pancreas, Hodgkin's disease, leukaemia, lung,malignant melanoma, multiple myeloma and prostate. For each case, a controlmatched on sex, age, race and year of death was selected from among deaths fromcauses other than cancer, excluding causes related to each cancer. Analyses ofsurface versus groundwater were carried out (i) according to water source at deathand (ii) restricted to subjects on the same source type at birth and at death (lifetimeexposure). The former analysis revealed only three significant odds ratios: 1.79 forrectal cancer, 1.21 for breast cancer and 0.70 for multiple myeloma. The analysis oflifetime water use gave significant odds ratios of 2.50 for rectal cancer and 1.30 forbreast cancer. (Confidence intervals were not given.) A dose-related response wasseen for each of these cancers in the categories lifetime surface water, some surfacewater (only birth or death in a parish served by surface water) and lifetime
groundwater use. Odds ratios were elevated for rectal cancer among men accordingto water use at death (2.21; 95% CI, 1.57-3.12) and for men and women according tolifetime water use (3.18; 1.96-5.19 in men and 1.73; 0.97-3.10 in women). There werealso elevated risks for lung cancer among men on surface water at death (1.30;1.05- 1.62) and for breast cancer among women both on surface water at death (1.21;1.00- 1.46) and with lifetime surface water use (1.30; 1.00-1.69). An additionalanalysis based on 11349 case-control pairs from 20 parishes (Gottlieb & Carr, 1982)

116 lARe MONOGRAHS VOLUME 52
did not provide different results. (The Working Group noted some inconsistenciesin the number of parishes studied; the analysis is inappropriate sInce matching wasbroken, and the results are not presented in an understandable format.) A furtheranalysis of these data (Gottlieb et al., 1981) was restricted to a sample of 692 deathsfrom rectal cancer and 1167 from colon cancer; 1859 controls were selected fromstrata based on age at death (:f five years), race, sex, year of death and parish. Fourcategories of estimated lifetime surface water use were derived as in the earlIerwork: mostly surface (birth and death in a surface water parish), sorne surface(either birth or death in a surface water parish), possible surface (death in agroundwater parish, birth outside the study are a), least surface (birth and death in agroundwater parish). Of the total population, 99.2% could be cIassified into one ofthe four surface water exposure levels. For rectal cancer, relative risks of 1.61 (95%CI, 0.91-2.85) and 2.11 (1.17-3.84)were found for a residence served by surfacewaterfor 10-19 and :: 30 years, respectively, as compared with residence served bygroundwater. A significantly increasing trend with a relative risk of 2.07 (95% CI,1.49-2.88) was also found for lifetime consumption of 'mostly surface water' relativeto the 'least surface water' category. No elevation in odds ratios for any of thevariables of interest was found for colon cancer. (The Working Group noted sorneinternaI inconsistencies in these papers in the nurrbers of cases and controls, andthe method of selection of controls and whether they were individually matched isunclear. )
A study of cancer mortality in Wisconsin, USA, in relation to waterchlorination was reported by Young et al. (1981), Kanarek and Young (1982) andYoung and Kanarek (1983). Young et al. (1981) carried out a matched case-controlstudy based on the death certificates of white females who had died of cancer inWisconsin during 1972-77, restricted to the 28 counties in which the population wasrelatively stable and in which there were both chlorinated and unchlorinated watersupplies. A total of 8029 deaths due to cancers of the gastrointestinal and urinarytracts, lung, breast and brain were matched to white female noncancer deaths oncounty of residence, year of death and birth date. The water supply serving theusual place of residence as recorded on each subjects death certificate wasobtained from a 1970 survey of the 202 water sources serving the study areas,gathered from a postal questionnaire to the water utilities. These data includedtype of water source (surface or ground), presence or absence of environmentalfactors that might influence organic content (e.g., rural run-off) and mean dailychlorination doses over the previous 20 years in four levels: none, low (-: 1.00 ppm),medium (1.00-1.70 ppm) and high (1.71-7.00 ppm). ln an unmatched analysis,adjusted for marital status, urban residence and high-risk occupations specific forcertain cancer sites, significantly high odds ratios were found for colon cancer: 1.53(95% CI, 1.11-2.11), 1.53 (1.08-2.00) and 1.51 (1.06-2.14) for the low, medium and

CHLORINATED DRINKING-WATER117
high categories, respectively. No significant increase in risk was found for othercancers. ln areas with a rural run-off into the water supply, the odds ratios for coloncancer were higher, and these increased slightly after adjustment for depth ofgroundwater source and purification. ln an additional analysis using matched data,similar results were obtained (Young & Kanarek, 1983). ln a further analysis ofthese data (Kanarek & Young, 1982), in which organic contamination, source depthand purification were taken into account, the odds ratio for colon cancer amongpersons using chlorinated in relation to that for people using unchlorinated watersources (1.43; p c( 0.02) increased to 1.81 (p = 0.03) for chlorinated sources
contaminated by organic compounds and to 2.81 (p = 0.01) for chlorinated surfacewater.
ln a case-control study of multiple cancer sites based on death certificates,Zierler et al. (1986) (see p. 113) compared communities in Massachusetts (USA) inwhich surface water was disinfected by chloramine treatment (see p. 51) (20communities) or chlorine treatment (23 communities). More th an 5000 deathsfrom cancers of the urinary bladder, colon, kidney, pancreas, rectum, stomach, lungand breast occurring between 1969 and 1983 in persons aged 45 years or more wereidentified. Over 200 00 deaths from lymphatic cancer, cardiovascular disease,cerebrovascular disease, pulmonary disease and pneumonia/influenza were used ascontrols. Exposure was defined as residence in a community supplied with
chlorinated water at the time of death; nonexposure, in a community supplied withchloraminated water. No elevated risk for cancer at any site was observed.
(ii) 1 ndividual exposure data
Lawrence et al. (1984) carried out a case-control study based on deathcertificates of white women who had been members of the New York State (USA)Teachers' Retirement System and had died from cancers of the colon and rectum.After geographical restrictions and other exclusions, 395 deaths occurring between1962 and 1978 were included. Controls (395) were selected randomly from deathsdue to any cause except malignant tumours and matched to the cases by age andyear of death (within two years). Information was obtained on residence andemployment 20 years prior to death, and water records were abstracted for bothhome and work addresses over the 2O-year period. A model-based estimate ofexposure to THM was derived from a study of New York State surface watersystems. Potential confounding factors included in the matched and unmatchedlogistic regression analyses were population density, marital status, age and year ofdeath. Only analyses for grouped colon and rectal cancers were reported. Resultsfrom the matched and unmatched analyses were identical. There was no significantfinding in relation either to source type (odds ratio, 1.07; 90% CI, 0.79- 1.43), to 20

118 lARe MONOGRAHS VOLUME 52
years' cumulative chloroform dose or to five other measures of exposure to chlorineor THM.
Cantor et al. (1985, 1987) conducted a population-based case-control interviewstudy of urinary bladder cancer in 10 areas of the USA comprising 2982 cases aged21-84 who had been newly diagnosed in 1978 (73% of the eligible pool). A total of5782 controls were selected by random-digit diallng for those age 21-64 and byHealth Care Financing Agency listings for those 65 and older. Interviews in thehomes of the subjects gathered information on residential history, fluidconsumption and potential confounders (smoking, occupation, lower urinary tractinfection, artificial sweetener use, use of hair dyes). Data on water source andtreatment since 190 was obtained from an independent survey of water utilties.Year-by-year profiles of water source (surface and ground) and water treatment(chlorinated and not) were derived for the lifetime of each respondent by mergingindividual residential and water utilty information; 76% of aIl person-years couldbe related to a known water source. Reported consumption of drinking-water wasadded to the intake of other home beverages containing tap water to estimate totaldaily ingestion of tap water. Since one goal of the study was to estimate the riskassociated with consumption of chlorinated surface water in comparison withnonchlorinated groundwater, the primary analyses were restricted to a subset ofrespondents who had lived at least 50% of their lifetime prior to interview a.tresidences served by one or both ofthese two types ofwater source (59% of all casesand controls). Analysis was by logistic regression. ln initial analyses (Cantor et al.,1985) that did not consider tap-water consumption levels, an association was foundbetween duration of residence with à chlorinated surface source and risk of urinarybladder cancer. Only among nonsmokers was there a significant odds ratio forthose exposed for more than 60 years (odds ratio, 2.3; 95% CI, 1.3-4.2); there was anonsignificant inverse trend for current smokers. For aIl groups combined(controllng for smoking), odds ratios for the duration measure were close to one. lnsubsequent analyses (Cantor et al., 1987), current total fluid and tap-waterconsumption were considered in conjunction with duration of exposure tochlorinated surface water. Total fluid consumption was related to urinary bladdercancer risk, and tap water was the main risk factor (test for trend: males, X2 = 22.6,p c( 0.001; females, X2 = 3.15, p = 0.08). These findings were not modified by
extent of disease. When respondents were grouped by duration of chlorinatedsurface water use, significant trends with tap-water intake were restricted topersons who had consumed chlorinated water for 40-59 years and :: 60 years. Theodds ratios for the highest (:: 1.961/day) versus the lowest (~ 0.80 l/day) quintiles of
intake in these two duration strata were 1.7 and 2.0, respectively, with significanttrends (p = 0.00 and p = 0.014, respectively). The trends in odds ratios withtap-water intake were nonsignificant for up to 39 years' duration. There was a

CHLORINATED DRINKING-WATER 119
significant trend with duration of residence with a chlorinated surface water supply,but only among women whose tap-water consumption was above the median(p = 0.02). The overall increase in the odds ratio with duration seen amongnonsmokers in the previous analysis (Cantor et al., 1985) was more exaggeratedamong respondents whose tap-water consumption was above the median (p = 0.01for trend) than in those whose consumption was below the median (p = 0.40 fortrend).
Lynch et al. (1989) conducted an analysis of the Iowa respondents in the studyof Cantor et al. (1987), comprising 354 cases of urinary bladder cancer and 752èontrols. Chlorination was quantified in four ways, with increasing levels ofspecificity: (i) assuming that the respondent's lifetime was spent consuming the typeofwater provided by the community ofhis or her most recent place of residence; (H)assuming that the person's most recently used water supply (whether or not his orher community's supply) was used for life; (iii) applying the most recent watersupply to the number of years of actual residence at this place; and (iv) using theentire lifetime residentiaI/water supply history. For methods (ii), (ii) and (iv), therewere significant trends with exposure to chlorination, the highest odds ratio beingfound for method (iv) (test for trend: X2 = 10.90, p = 0.001). The odds ratios for1-25, 26-50 and :; 50 years of exposure to chlorination relative to no exposure usingmethod (iv) were 1.42, 1.70 (p .: 0.01) and 2.14 (p .: 0.01). After adjustment for ageand smoking, the odds ratio for history of any exposure to chlorinated water was1.47. The highest unadjusted odds ratio (no adjusted odds ratio reported) wasfound for exposure only to prechlorinated or prefiltered surface or shallowgroundwater (odds ratio, 2.95; 95% CI, 1.52-5.75). ln this study subset of Iowarespondents, cigarette smokers (more than 25 pack-years) who had had exposure tochlorinated drinking-water had a higher odds ratio (4.48; 95% CI, 2.47-8.13) th ansmokers never so exposed (2.89; 1.41-5.89), relative to nonsmokers never exposed tochlorinated drinking-water. This result contrasts with the findings from the overallstudy in which smokers who had used chlorinated surface water were not at excessrisk (Cantor et al., 1985).
Cragle et al. (1985) identified 20 cases of colon cancer newly diagnosedbetween 1978 and 1980 at seven hospitals in North Carolina (USA) who had had atleast 10 years' residence in the state. At least two hospital controls were matched toeach case by age, race, sex, vital status, date of diagnosis and hospital. Informationon residential history and a variety of potential confounding factors was collectedfrom the respondents by either a personal interview or by mail questionnaire. Eachsubject's residence history for 1953-78 was related to data from the water companyto derive estimates of the duration of residence on chlorinated and nonchlorinatedsupplies. A logistic regression analysis was carried out which included achlorination variable and several potential confounders. The authors concluded

120 lARe MONOGRAHS VOLUME 52
that there was an association between chlorination and colon cancer in people overthe age of 60. (The Working Group noted that a number of detaIls of the studydesign are not adequately described: it is not stated how many deceased cases andcon troIs were selected and what procedure was used for obtaining data on thesesubjects; it is not clear how the chlorination variable was treated in the analysis;and, in spite of the matched nature of the design, an unmatched analysis wasapparently carried out.)
A study in Wisconsin (USA), reported by Young et al. (1987) was designed toestimate the risk for colon cancer associated with chronIc ingestion of THMsoccurring as by-products of water chlorination. White men and women aged 50-90were included. Cases were identified from a state-wide hospital tumour registryover a two-year period; 347 cas-es (45% of those sampled) were included in theanalysis. Two sets of con troIs were used: 639 cancer controls identified from thesame source as the cases, and 611 population controls identified from driver'slicense records, representing 48% of controls sampled. Self-completed ques-tionnaires, supplemented with medical records, were used to obtain lifetimehistories of residence, water use and medical and occupational histories. Watercompany records and contemporary measurements of THM were used to estimatethe THM content of alI types of water source in the past and then to constructestimates of lifetime ingestion of THM for each subject. Odds ratios for coloncancer relative to population controls, adjusted for age, sex and population sizewere 1.10 (95% CI, 0.68-1.78) for estimated cumulative exposure to 100-300 mgTHM and 0.73 (0.44-1.21) for 300 mg or more, relative to the baseline group (lessthan 100 mg lifetime ingestion of THM). Analyses comparing surface withgroundwater sources and chlorinated with nonchlorinated sources also showed noassociation with colon cancer risk. (The Working Group considered that theresponse rate in this study was tao low to permit reliable inferences to be made.)
Zierler et al. (1988) carried out a case-control study of urinary bladder cancerbased on death certificates of residents of 43 Massachusetts (USA) communitiesserved by surface water disinfected by chlorine or chloramine. A total of 1057deaths from urinary bladder cancer in people aged 45 or more occurring between1978 and 1984 were identified. Controls were obtained from an age-stratifiedsample of deaths from the following causes: lung cancer, lymphoma, cardiovasculardisease, cerebrovascular disease and chronic obstructive pulmonary disease (total,2144). A large number of the cases and controls included in this study were alsoincluded in a previous case-control study carried out by the same authors (Zierler etal., 1986; see p. 117). Informants were found for 614 (58%) of the cases and 1074(50%) of con
troIs and were interviewed about the decedents' residential andsmoking history. Each subjects residential history was lInked to historical data onwater source obtained from the US Environmental Protection Àgency and State

CHLORINATED DRINKING-WATER 121
water authorities. Four categories of Iifetime exposure to chlorinated water weredefined, and each individual was placed into one of these. Information onsocioeconomic status and high-risk occupations was obtained indirectly at the levelof the community. Odds ratios for usual and lifetime exposure to chlorinated waterwith respect to Iifetime exposure to chloramine were 1.4 (95% CI, 1.1- 1.8) and 1.6(1.2-2.1). When analysis was restricted to 30 communities each supplied bya singleauthority, the odds ratio for lifetime exposure with respect to Iifetime nonexposurewas 1.6 (1. 1.-2.4). (The Working Group noted that the response rate was very low. Itwas unclear whether information on water supplies was obtained when individualsresided outside the 43 communities. The choice of controls may not have beenappropriate. Confounding by city size was not addressed. Differences between theresults of this study and those of Zierler et al. (1986) may be due to the fact that theexposure information in this study was more precise or to selection biases due tolow response rates.)
(c) eohort study
Wilkins and Comstock (1981) conducted a cohort study in Washington County,Maryland (USA) on a population of 14 553 white men and 16 227 white women over25 years of age, who were resident in 1963. FoIlow-up over a 12-year period tomid- 1975 was through death certificate records, the cancer registry and medicalrecords at Washington County HospitaL. (No information was given on
completeness of folIow-up.) Data on personal and socioeconomic variables in 1963(age, marital status, education, smoking history, length of residence, frequency ofchurch attendance, adequacy of housing and persons per room, source ofdrinking-water) were available. Sex- and site-specific incidence rates werecalculated for cancers of the biliary passages and Iiver, kidney and urinary bladder.Mortality rates were calculated for the same sites and alsò for cancers of theoesophagus, stomach, colon, rectum, pancreas, lung, breast, cervIx, ovary, prostateand brai n, and leukaemia, and non-cancer causes of death (cirrhosis of the Iiver,bronchitis and emphysema, pneumonia, aortic aneurysm, road accident, fall,suicide, arteriosclerotic heart disease, hypertension, stroke and aIl causes.) Watersources were classified into three groups according to the subjects' residence in1963: high exposure (23 727 urban residents served by chlorinated surface water
systems; average chloroform concentration, 107 J.g/I), low exposure (2231 users ofunchlorinated, deep wells), and an intermediate group of 4842 residents of foursmall towns served by combined chlorinated surface and groundwater. ln the
incidence study, the only consistent results for men and women were ad justedrelative risks (high versus low exposure) of 1.80 and 1.60 forurinary bladder cancerbased on five and two cases in the low-exposure category (both p ~ 0.05). Only forurinary bladder cancer in men was there a relationship with duration of exposure

122 lARe MONOGRAHS VOLUME 52
(relative risk, 6.46; 95% CI, 1.00- ~ 100 for 12 or more years at one address). ln themortality study, a significant result was obtained only for breast cancer (2.27;1.16-4.89); however, when the relative risks were ranked, three of the four highest
were for sites for which there was an a-priori suspicion of an association withorganic contamination of drinking-water (liver: 2.98, 0.92-14.84; kidney: 2.76,0.67-23.06; and urinary bladder: 2.20, 0.71-9.39). Relative risks were 0.89 (0.57-1.43)
for cancer of the colon and 1.42 (0.70-3.16) for cancer of the rectum. (The WorkingGroup noted that the large number of liver cancer deaths may indicate the inclusionof secondary liver cancers.)
Studies relevant to the evalution
Table 11 gives a summary of the results from those studies on which the finalevaluation was based. Some studies were excluded because of the methodologicallimitations described on pp. 107-108 and in the square brackets following thedescriptions of sorne studies; sorne were excluded because they largely overlappedwith other studies included in the Table. For correlation studies, only an indicationof the direction of the results is given; odds ratios or relative risks (with 95% CIwhen available) are given for case-control studies and for the cohort study.
4. Summary of Data Reported and Evaluation
4.1 Exposure data
Water supplies were first chlorinated at the turn of the century, and over thefollowing two decades chlorination was introduced for disinfection ofdrinking-water in most industrialized countries. ln the chlorination process,
chlorine reacts mainly with natural water constituents to produce a complexmixure of by-products, including a wide variety of halogenated compounds, theactuallevels of which depend on the amount of chlorine added and the type of watersource. ln general, groundwaters produce lower levels, whIle surface waters oftentend to produce higher levels of chlorination by-products; however, there is sorneevidence that groundwaters can give higher levels of brominated substances,probably due to higher levels of bromide in the untreated water. Estimates of the
, total halogenated organic matter generated during chlorination suggest typicallevels in the range -c 10-250 iig/l as chlorine. The main chlorination by-productsare trihalomethanes and chlorinated acetic acids, which usually occur in the range1- 100 Jlg/I (although higher levels have been reported). Many products occur io therange 1-10 iig!, whIle a large number can be detected at levels of -: 1 Jlg/L. The

Table 11. Summary of results of selected epidemiological studiesa
Aulhor, year Expure varble Bladder Colon Rem Slomach Lung-M F M F M F M F M F
Corrlan S/iesDeRouen & Diem Sunace vs groundwaler
('(1977) Whles (+t (+)b (+)' (+)' i:Nonwhites(+ )b
+b +, +, (40River vs non-river
,:-Whles + (-) (+) + + (+) (- (-) (+) - ZNonwhites (+) (+) (+) + (+) (+) (+) + + (-)
~Kuzin el al Sunac vs groundwater + (+) (+) +/- (+) +/- + + (+)(1977)
0Be el al (1982) Sunac vs groundwater +/- (-) +/- +/- + + +/- +/- + + 0Cantor el al Chlrited sunac vs (+) + +/- +/- +/- +/- +/- (- (+) (+) :;(1978) unchlrited groundwater -ZThlhi & Moore Tromehaes in 1978 +/- (+) +/- +/- + (+) - + +/- +/- ~(1980) Chlri dos in 1950 +/- +/- +/- +/- (-) +/- (-) (-) +/- (-) -Z
lsan et al Chlried vs unchlorited (+) (-) (+) (-) - (+) (- (-) (+) (+) 0(1983)
1Tim stie~Ceh el al (1987) Chlried vs unchloriled (_)b (+t (- (+)&i
Ca1l stie coba f! de/iBrenn et al Chlried V$ unchlorited 0.99 0.95 1.04 1.7 1.4 1.5 0.91 1.07 :;(1980)
Gottli et al Lietïm use of sunac vs 1.2 1.02 0.90 1.05 3.18.d 1. 73.d 1.25 1.01 1.05 1.9(1982) groundater. (0.88-1.97) (0.57-1.82) (0.60-1.7) (0.73-1.51)(1.96-5.19) (0.97-3.10) (0.85-1.84) (0.61-1.66) (0.77-1.43) (0.63-3.11)
Young & Kaek Chlried vs unchlrited 1.08 1.41. 1.9 0.72 0.86(1983)
Zierler et al Chloried vs chloramted 1.04 1.05 0.85 0.92 0.98 0.94 0.95 1.01 0.91 0.95(1986) (0.94-1.6) (0.92-1.21) (0.80-0.90) (0.87-0.97) (0.88-1.09) (0.84-1.05) (0.87-1.03) (0.92-1.0) (0.86-.96) (0.91-0.98)
i-~

Table 11 (contd)
Aithor, yea Expure val¡le Blader Colon Rem Stomah Lung
M F F M F M F M FM
Casont sties, inivua ex dejúLawrence el al Surfac V$ grounclater'
(1984)
Cantor el al(1987)
1.07 (0.79-1.431
1.2
(0.7-2.1)60 yea or more on chloritedwater, water consumption ;. me-dia
3.2-S
(1.-8. 7)
Zierler el al(1988)
Cohrt si
Wil & Com-stock(1981)
Chlorited vs chloramted,lietime exure
1.6-(1.2-2.1)
Chlorited vs unchlorited 1.80
(0.80-4.75)1.60
(0.54-6.32)
"( +) , positive assoiation; +, poitive asiation, p -c 0.05; (- negative asiation; -, negative astion, p -c 0.05; + /-, no asiationbt nn tract'Dastrointestinl tractdgignificant trend (bth sees combined) acros two levls of e:sure (source at death, lietim sorce)
'Women onlytcolorecal cancer; 90%confidenc interv'Women onlBSigniicant trend acros five levls of duration of residence with a chlorited surfac drig-water source (0, 1-19, 20-39, 40-59 and ~ 60 years)-p -c 0.05
..~
-~~ozoo
~::U'
â8~trVIN

CHLORINATED DRINKING-WATER125
by-products responsible for most of the bacterial mutagenicity found in chlorinateddrinking-water, 3-chloro-4-( dichloromethyl)-5-hydroxy-2( 5H)-furanone (MX) andassociated substances, are present at very low concentrations (oe 0.1 Jlg/I).
4.2 Experimental carcinogenicity data
Two series of studies were considered to provide evidence that cou Id supportan evaluation of the potential carcinogenicity of chlorinated drinking-water.
Sam pIes of material concentrated from treated and undisinfected or treatedand chlorinated water samples were tested in mice in three initiation-promotionexperiments (by subcutaneous injection followed by topical application of12-0-tetradecanoylphorbol 13-acetate). None of the concentrates derived froID thechlorinated water induced a significantly increased incidence of skin tumours whencompared with concentrates derived from undisinfected water samples or withsaline.
ln one experiment in mice, oral administration of chlorinated humic acids inthe drinking-water did not increase the incidence of tumours over that in animaIsreceiving unchlorinated humic acids or in saline-treated controls.
4.3 Human carcinogenicity data
Seven case-control studies conducted in the USA were considered to provideevidence that could support an evaluation. Four of these had community exposuredata, and three had individually derived exposure data. The four studies withcommunity exposure data each included several cancer sites. One study showed asignificant increase in risk for colon cancer only; another showed a significantincrease only for rectal cancer; the other two studies showed no excess risk forcancer.
Of the three case-control studies with individual exposure data, one was apopulation-based study of urinary bladder cancer carried out by interview in 10areas of the USA. Many potential confounding factors, including smoking, weretaken into account in the analyses. An early analysis of the study showed asignificant association between long-term use at home of a chlorinated surfacewater source (as compared to an unchlorinated groundwater source) and urinarybladder cancer in nonsmokers only. ln a subsequent analysis, tap-water intake wasconsidered in addition to home water source, andconsumption level of tap waterwas significantly associated with urinary bladder cancer; this effect wassubstantially confined to those who had lived for 40 years or more in a hou
se with achlorinated surface water source. There were significant and increasing trends inurinary bladder cancer risk with duration of residence in a house with a chlorinatedsurface water source for both women and nonsmokers whose tap-water

126 lARe MONOGRAHS VOLUME 52
consumption was above the median. ln a further report based only on Iowaparticipants in this study, risk for urinary bladder cancer was associated withduration of use of a chlorinated water source, and the association became strongerwith increasing accuracy of the exposure measure.
ln the second of these case-control studies, carried out in Massachusetts(USA), the authors reported an excess risk for mortality from urinary bladdercancer among people who had lived in areas with chlorinated water supplies ascompared with chloraminated supplies. Sorne confounding factors, includingsmoking, were taken into account; however, the proportion of eligible subjects forwhom exposure could be ascertained was low.
ln a third case-control study, based on deaths among members of the NewYork State Teachers' Retirement System, no association was found between deathsfrom cancers of the colon and rectum combined and estimated use of surface wateror intake of chloroform from domestic and workplace water supplies over the 20years prior to death. Few confounding variables were taken into acount.
A cohort of the general population in a county in Maryland (USA) was enrolledand surveyed in 1963 and followed up to 12 years. Urinary bladder cancer incidencewas found to be higher in both men and women residents supplied mainly by achlorinated surface water source compared with county residents who obtainedtheir drinking-water from.unchlorinated deep wells; but the effects of chlorinateddrinking-water cou Id not be distinguished from factors related to urbanicity, andthe numbers were too small to rule out a chance effect.
Six correlation studies and one time-trend study were considered by theWorking Group to provide sorne useful data. These studies showed moderatelyconsistent patterns of a positive correlation between use of surface water or ofchlorinated water and cancers of the stomach, colon, rectum, urinary bladder andlung, with the most consistent patterns for cancers of the urinary bladder andrectum.
The studies that were considered informative, and therefore included in thissummary, were nevertheless difficult to interpret in an evaluation of thecarcinogenicity of chlorinated drinking-water. The water variables studied-whether surface or groundwater and others-were generally imperfect surrogatesfor the subject of this monograph. There is cause for sorne scepticism about theestimates of exposure to chlorinated drinking-water in aIl of these studies.Furthermore, very few attempted to document exposure over long periods of thesubjects' lives. Chlorination by-products differ according to local conditions andpractices of chlorination, and the health effects found in one place may not be foundelsewhere. Many variables, such as smoking habits, dietary practices andenvironmental conditions, influence the risks for cancer, and they may differbetween populations served by chlorinated and unchlorinated water supplies. Such

CHLORINATED DRINKING-WATER 127
factors should ideally be taken into account in an epidemiological study; however, inmost of the studies evaluated, there was little if any information available aboutthem. When the data are examined on the basis of individual cancer sites, theevidence of elevated risk is strongest for cancer of the urinary bladder. Thestrongest study of cancer at this site supports the hypothesis of an elevated risk dueto drinking chlorinated surface water compared with unchlorinated groundwater.However, the sum of the evidence from other studies, although showing sornedegree of consistency, is severely compromised by the weaknesses outIined above.
4.4 Other relevant data
Elevated serum cholesterol levels were reported in women but not in men livingin communities served by chlorinated versus nonchlorinated water supplies in onestudy. No difference in the prevalence of ancephaly was observed between villagesserved by chlorinated and nonchlorinated groundwater in another study.
ln regard to studies of genetic and related effects, only those reports wereincluded in which the role of chlorination could be evaluated. Samples ofunconcentrated chlorinated drinking-water were not genotoxic in bacteria or in amicronucleus assay in plants and did not induce morphological transformation incultured mammalian cells. Samples of organic material concentrated fromchlorinated surface waters were usually genotoxic in bacteria and induced sister
chromatid exchange, micronuclei and chromosomal aberrations in single studieswith cultured mammalian cells. ln a single study, no activity was observed in amammalian cell assay for mutation.
Samples of organic material concentrated froID chlorinated groundwaterswere less frequently mutagenic in bacteria than those from chlorinated surfacewaters; in a single study, they induced sister chromatid exchange but notmicronuclei in cultured mammalIan cells.
Samples of organic material concentrated from surface water treated witheither chlorine dioxide or ozone followed by chlorination induced mutation inbacteria in sorne studies.
4.5 Evaluationl
There is inadequate evidence for the carcinogenicity of chlorinated drinking-water in humans.
lFor definition of the italicized terms, see Preamble, pp. 30-33.

128 lARe MONOGRAHS VOLUME 52
There is inadequate evidence for the carcinogenicity of chlorinateddrinking-water in experimental animaIs.
Overall evaluation
Chlorinated drinking-water is not classifiable as to its carcinogenicity to humans(Group 3).
5. References
Abrahamsson, K. & Xie, LM. (1983) Direct determination of trace amounts ofchlorophenols in fresh water, waste water and sea water.l Chromatogr., 279, 199-208
Agarwal, s.e. & Neton, J. (1989) Mutagenicity and alkylating activity of the aqueouschloriation products of humic acid and their molecular weight fractions. Sei totalEnviron., 79, 69-83
Alavanja, M., Goldstein, 1. & Susser, M. (1978) A case control study of gastrointestinal anduriary tract cancer mortality and drinking water chlorination. ln: JoUey, R.J.,Gorchev, H. & Hamilton, D.H., Jr, eds, Water Chlorination: Environmental Impact and
Health Effects, VoL. 2, Ann Arr, MI, Ann Arbor Science, pp. 395-409Alink, G;M. (1982) Genotoxins in waters. ln: Sorsa, M. & Vainio, H., eds, Mutagens in Our
Environment, New York, Alan R. Liss, pp. 261-276Al-Sabti, K. & Kurelec, B. (1985) Chromosomal aberrations in onion (Allium cepa) induced
by water chloriation by-products. Bull. environ. Contam. Toxicol., 34, 80-88
Ames, B.N. & Yanofsky, C. (1971) The detection of chemical mutagens with enteric bacteria.ln: Hollaender, A., ed., Chemical Mutagens. Prnciples and Methods for Their Detection,
VoL. 1, New York, Plenum Press, pp. 267-282Ames, B.N., McCann, J. & Yamasaki, E. (1975) Methods for detecting carcinogens and
mutagens with the Salmonella/mammalian-microsome mutagenicity test. Mutat. Res.,31,347-364
Amy, G.L., Chadik, P.A., Chowdhury, Z.K., King, P.H. & Cooper, W.J. (1985) Factorsaffecting incorpration of bromide into brominated trihalomethanes durigchlorination. ln: JoUey, R.L., Bull, R.J., Davis, W.P., Katz, S., Roberts, M.H., Jr &Jacobs, \ZA., eds, Water Chlorination: Chemistry, Environmental Impact and HealthEffects, VoL. 5, Chelsea, MI, Lewis Publishers, pp. 907-922
Anon. (1983) Water substances spur pleas for reg~lation.i Commerce, 30 September, 22b1
Backlund, P., Kronberg, L., Pensar, G. & Tikkanen, L. (1985) Mutagenic activity in humicwater and alum floculated humic water treated with alternative disinfectants. Seitotal Environ., 47, 257-26
Bean, J.A., lsacson, P., Hausler, W.J., Jr & Kohler, J. (1982) Drinking water and cancerincidence in Iowa. 1. Trends and incidence by source of drinking water and size of
municipality. Am. 1 Epidemiol., 116, 912-923

CHLORINATED DRINKING-WATER 129
Bellar, LA., Lichtenberg, J.J. & Kroner, R.C. (1974) The ocurrence of organohalides inchloriated drikig waters. 1 Am. Water Works Assoc., 66, 703-706
Bernofsky, C., Strauss, S.L. & Hinojosa, O. (1987) Binding ofhyphlorite-modifiedadenosine 5' -monophosphate (AMP) to protein and nucleic acid and its possible role incyotoxicity. Biochem. Arch., 3, 95-101
Bourbigot, M.M., Paquin, J.L., Pottenger, L.H., Blech, M.E & Hartemann,:P (1983) Studyof mutagenic activity of water in a progressive ozonation unit (Fr.). Aqua, 3,99-102
Boyce, S.D. & Hornig, J.E (1983) Reaction pathways of trialomethane formation from the
halogenation of dihydroxyaromatic model compounds for humic acid. Environ. Sei.TechnoL., 17, 202-211
Brass, H.J., Feige, M.A., Halloran, L, Mello, J.W., Munch, D. & Thomas, R.E (1977) Thenational organic monitorig survey: samplings and analyses for purgeable organic
compounds. ln: Pojasek, R.B., ed., Drinking Water Quality Enhancement through SourceProtection, Ann Arr, MI, Ann Arbor Science, pp. 393-416
Braus, H., Middleton, EM. & Walton, G. (1951) Organic chemical compounds in rawandfiltered sudace waters. Anal. Chem., 23, 1160-1164
Brenniman, G.R., Vasilomanolakis-Lagos, J., Amsel, J., Namekata, L & Wolf, A.H. (1980)Case-control study of cancer deaths in Ilinois communities served by chloriated ornonchlorinated water. ln: Jolley, R.L., Brungs, W.A., Cumming, R.B. & Jacobs, \ZA.,eds, Water Chlorination: Environmental Impact and Health Effects, VoL. 3, Ann Arr,MI, Ann Arbor Science, pp. 1043-1057
Bull, R.J. (1985) Carcinogenic and mutagenic properties of chemicals in driking water. Seitotal Environ., 47, 385-413
Bull, R.J., Robinson, M., Meier, J.R. & Stober, J. (1982) Use of biological assay systems toassess the relative carcinogenic hazards of disinfection by-products. Environ. Health
Perspect., 46, 215-227Cantor, K.:P, Hoover, R., Mason, LJ. & McCabe, L.J. (1978) Assoiations of cancer
mortality with halomethanes in drinking water. 1 natl Cancer Inst., 61, 979-985Cantor, K.:P, Hoover, R., Hartge, :P, Mason, LJ., Silverman, D.L & Levi, L.I. (1985)
Drinking water source and risk ofbladder cancer: a case-control study. ln: JoUey, R.L.,Bull, R.J., Davis, W.:P, Katz, S., Roberts, M.H., Jr & Jacobs, \ZA., eds, WaterChlorination: Chemistry Environmental Impact and Health Effects, VoL. 5, Chelsea, MI,Lewis Publishers, pp. 145-152
Cantor, K.:P, Hoover, R., Hartge, :P, Mason, TJ., Silverman, D.L, Altman, R., Austin, D.F.,Child, M.A., Key, C.R., Marrett, L.D., Myers, M.H., Narayana, A.S., Levi, L.I.,Sullivan, J.W., Swanson, G.M., Thomas, D.B. & West, D.W. (1987) Bladder cancer,drinking water source, and tap water consumption: a case-control study.l natl CancerInst., 79, 1269-1279
Carlo, G.L. & Mettlin, c.J. (1980) Cancer incidence and trihalomethane concentrations in apublic drinking water system. Am. 1 public Health, 70,523-525
Cech, 1., Holguin, A.H., Littell, A.S., Henry, J.:P & O'Connell, J. (1987) Health significanceof chlorination byproducts in drinking water: the Houston experience. Int. 1Epidemiol., 16, 198-207

130 lARe MONOGRAHS VOLUME 52
Cheh, A.M., Skochdopole, J., Koski, P. & Cole, L. (1980) Nonvolatile mutagens in drikigwater: production by chlorination and destruction by sulfite. Science, 207, 90-92
Cherooff, N., Rogers, E., Carver, B., Kavlock, R. & Gray, E. (1979) The fetotoxic potential
of municipal drikig water in the mouse. Terat%gy, 19, 165-170
The Chlorie Institute, USA (199) Bromine Lee/s in Ch/orine Used for Disinfection Purposes,Washington De
Christman, R.E, Norwoo, D.L., Millington, D.S., Johnson, J.D. & Stevens, A.A. (1983)Identity and yields of major halogenated products of aquatic fulvic acid chloriation.
Environ. Sci. Techno/., 17, 625-628
Chritman, R.E, Norwoo, D.L., Seo, Y. & Frimel, EH. (1989) Oxdative degradation ofhumic substances from freshwater environments. ln: Hayes, H.B., MacCarthy, :P,Malcolm, R.L. & Swit, R.S., eds, Humic Substances IL' ln Search of Structure,Chichester, John Wiley, pp. 33-67
Cognet, L., Courtois, Y. & Mallevialle, J. (1986) Mutagenic activity of disinectionby-products. Environ. Hea/th Perspect., 69, 165-175
Cognet, L., Duguet, J.P., Courtois, Y., Bordet, J.P. & Mallevialle, J. (1987) Mutagenicactivity of various driking water treatment lines. Adv. Chem. Ser., 214, 627-64
Coleman, W.E., Melton, R.G., Kopfler, EC., Barone, K.A., Aurand, 'LA. & Jellson, M.G.(1980) Identifcation of organic compounds in a mutagenic extract of a sudace drikigwater by a computeried gas chromatography/mass spectrometry system
(GC/MS/COM). Environ. Sei Techno/., 14, 576-588Coleman, W.E., Munch, J.W., Kaylor, W.H., Streicher, R.P., Ringhand, H.P. & Meier, J.R.
(1984) Gas chromatography/mass spectroscpy analysis of mutagenic extracts ofaqueous chloriated humic acid. A comparison of the byproducts to drinking watercontaminants. Environ. Sei Techno/., 18, 674-681
Commission of the European Communities (1989) COST Project 641: OrganicMicropollutants in the Aquatic Envionment. News/etter, 4, 4
Condie, L.W., Laurie, R.D. & Bercz, J.P. (1985) Subchronic toxicology of humic acidfollowig chloriation in the rat. 1 Toxico/. environ. Hea/th, 15, 305-314
Cragle, D.L., Shy, C.M., Struba, R.J. & Siff, E.J. (1985) A case-control studyof colon cancerand water chlorination in North Carolina. ln: Jolley R.J., Bull, R.J., Davis, WP., Katz,S., Roberts, M.H., Jr & Jacobs, Y.A., eds, Water Ch/orination: Chemistry, Environmenta/Impact and Hea/th Effects, VoL. 5, Chelsea, MI, Lewis Publishers, pp. 153-159
Crathoroe, B., Watts, C.D. & Fielding, M. (1979) Analysis of non-volatile organiccompounds in waterby high-pedormance liquid chromatography.l Chromatogr., 185,671-690
Croll, B.'L, Summer, M.E. & Leathard, D.A. (1986) Determination of trialomethanes inwater using gas syge injection of headspace vapours and electron-capture gaschromatography. Ana/yst, 111, 73-76
Degraeve, N. (1986) Genotoxic effects related to chlorination of drinking-water (Fr.). Aqua,6, 333-335

CHLORINATED DRINKING-WATER 131
DeRouen, LA. & Diem, J.E. (1977) Relationships between cancer mortality in Louisianadrikig-water source and other possible causative agents. ln: HiaU, H.H., Watson,
J.D. & Winsten, J.A., eds, Origins of Human Cancer, Book A Incidence of Cancer inHuman, Cold Sprig Harbr, NY, CSH Press, pp. 331-345
Dolara, P., Ricci, \Z, Burrni, D. & Grifini, O. (1981) Effect of ozonation and chloriation onthe mutage nie potential of drikig water. Bull. environ. Contam. Toxicol., 27, 1-6
Douglas, G.R., Nestmann, E.R. & Lebel, G. (1986) Contribution of chlorination to themutagenic activity of driking water extracts in Salmonella and Chinese hamster ovarycells. Environ. Health Perspect., 69, 81-87
Dressman, R.C., Stevens, A.A., Fair, J. & Smith, B. (1979) Comparison of methods fordetermination of trialomethanes in drikig water. 1 Am. Water Works Assoc., 71,
392-396
Duguet, J.P., Thutsumi, Y., Bruchet, A. & Malleville, J. (1985) Chloropicri in potable
water: conditions of formation and production during treatment processes. ln: JoUey,R.L., Bull, R.J., Davis, W.P., Katz, S., Roberts, M.H., Jr & Jacobs, \ZA., eds, WaterChlorination: Chemistry, Environmental Impact and Health Effects, VoL. 5, Chelsea, MI,Lewis Publishers, pp. 1201-1213
Dunham, L.J., O'Gara, R.W: & Thylor, EB. (1967) Studies on pollutants from processedwater: collection from three stations and biologie testing for toxicity andcarcinogenesis. Am. 1 public Health, 57, 2178-2185
Fawell, J.K. & Horth, H. (199) Assessment and identification of genotoxie compounds inwater. ln: Waters, M.D., Daniel, EB., Lewtas, J., Moore, M. & Nesnow, S., eds, GeneticToxicology of Complex Mixtures (Environmental Science Research Series VoL. 39), NewYork, Plenum Press, pp. 197-214
Fawell, J.K., Fielding, M., Horth, H., James, H., Lacey, R.E, Ridgway, J.W., Wilcox, P. &Wilson, i. (1986) Health Aspects ofOrganics in Drinking Water (Publication No. TR 231),Medmenham, Water Research Centre
Fawell, J.K., Fielding, M. & Ridgway, J.W: (1987) Health risks of chlorination. Is there aproblem? 1 Inst. Water environ. Manage., 1, 61-66
Fielding, M. & Horth, H. (1986) Formation of mutagens and chemicals durig watertreatment chloriation. Water Supply, 4, 103-126
Fielding, M. & Horth, H. (1988) The formation and removal of chemical mutagens duringdrinking water treatment. ln: Angeletti, G. & Bjørseth, A., eds, OrgancMicropollutants in the Aquatic Environment, Dordrecht, Kluwer Acdemie Publishers,pp.284-298
Flanagan, E.P. & Allen, H.E. (1981) Effect of water treatment on mutagenic potential. Bull.environ. Con/am. Toxicol., 27, 765-772
Forster, R. & Wilson, I. (1981) The application of mutagenicity testing to drinking water.lIns. Water Eng. Sei, 35, 259-274
Galassi, S., Guzzella, L. & Sora, S. (1989) Mutagenic potential of drinking waters fromsudace supplies in northern Italy. Environ. Toxicol. Chem., 8, 109-116

132 lARe MONOGRAHS VOLUME 52
Gibson, 'fM., Haley, J., Righton, M. & Watts, C.D. (1986) Chloriation offatty acids durig
water treatment disinection: reactivity and product identification. Environ. Technol.
LeU., 7, 365-372Glaze, W.H. & Rawley, R.A. (1979) A preliminary survey of trihalomethane levels in
selected East Texas water supplies. 1 Am. Water Works Assoc., 71, 50-515
Glaze, W.H., Burleson, J.L., Henderson, J.E., IV Jones, P.c., Kinstley, W., Peyton, G.R.,Rawley, R., Saleh, EY. & Smith, G. (1982)AnalysisofChlorinated Organic CompoundsFormed During Chlorination of Wastewater Products (EPA-60/4-82-072), Athens, GAus Envionmental Protection Agency
Gottlieb, M.S. & Carr, J.K. (1982) Case-control cancer mortality study and chloriation of
drinking water in Louisiana. Environ. Health Perspect., 46, 169-177
Gottlieb, M.S., Carr, J.K. & Morrs, D.'f (1981) Cancer and driking water in Louisiana:colon and rectum. Int.l Epidemiol., 10, 117-125
Gottlieb, M.S., Carr, J .K. & Clarkson, J .R. (1982) Drinking water and cancer in Louisiana. Aretrospective mortality study. Am. 1 Epidemiol., 116,652-667
Gould, J.P. & Hay, 'fR. (1982) The nature of the reactions between chlorine and purie andpyrimidine bases: products and kinetics. Water Sei Technol., 14,629-64
Gould, J.P., Richards, J:r. & Miles, M.G. (1984) The kinetics and primary products of uracilchlorination. Water Res., 18, 205-212
Grabow, W.O.K., Van Rossum, P.G., Grabow, N.A. & Denkhaus, R. (1981) Relationship ofthe raw water quality to mutagens detectable by the Ames Salmonella/microsome assayin a drinking-water supply. Water Res., 15, 1037-1043
de Greef, E., Morrs, J.C., van Kreijl, C.E & Morra, C.EH. (1980) Health effects in thechemical oxidation of polluted waters. ln: Jolley, R.L., Brungs, W.A., Cumming, R.B.& Jacobs, Y.A., eds, Water Chlorination: Environmental Impact and Health Effects, VoL. 3,Ann Arr, MI, Ann Arr Science, pp. 913-924
Grimm-Kibalo,S.M., Glatz, B.A. & Fritz, J.S. (1981) Seasonal variation of mutagenicactivity in drinking water. Bull. environ. Contam. Toxicol., 26, 188-195
Grob, K. & Habich, A. (1983) Trace analysis of halocrbns in water; direct aqueous injection
_ with electron capture detection.l high Resolut. Chromatogr., 6, 11-15
Harrngton, 'fR., Nestmann, E.R. & Kowbel, D.J. (1983) Suitabilty of the modifiedfluctuation assay for evaluating the mutagenicity of unconcentrated drinking water.Mutai. Res., 120, 97-103
Hayatsu, H., Pan, S.-K. & Ukita, 'f (1971) Reaction of soium hyphlorite with nucleicacidsand their constituents. Chem. pharm. Bull., 19, 2189-2192
Hemming, J., Holmbom, B., Reunanen, M. & K.onberg, L. (1986) Determination of thestrong mutagen 3-chloro-4-( dichloromethyl)-5-hydroxy-2(5H)-furanone in chloriated
drikig and humic waters. Chemosphere, 15, 549-556
Hertz-Picciotto, L, Swan, S.H., Neutra, R.R. & Samuels, S.J. (1989) Spontaneous abortionsin relation to consumption of tap-water: an application of methods from survvalanalysis to a pregnancy follow-up study. Am. 1 Epidemiol., 130, 79-93
Hoff, J.C. & Ak, E.W. (1986) Microbial resistance to disinfectants: mechanisms andsignificance. Environ. Health Perspect., 69, 7-13

CHLORINATED DRINKING-WATER 133
Hogan, M.D., Chi, P.-Y., Hoel, D.G. & Mitchell, 1:J. (1979) Assoiation between chloroformlevels in finished drinkig water supplies and various site-specifie cancer mortality
rates. 1 environ. Pathol. Toxicol., 2, 873-887
Holmbom, B., Voss, R.H., Mortimer, R.D. & Wong, A. (1984) Fractionation, isolation, andcharacterisation of Ames mutagenic compounds in kraft chlorination effluents.Environ. Sei Technol., 18, 333-337
Holmbom, B., Kronberg, L., Backlund, p., Längv, \Z-A., Hemming, J., Reunanen, M.,Smeds, A. & Tikkanen, L. (199) Formation and properties of 3-chloro-4-( diehloro-methyl)-5-hydroxy-2(5H)-furanone, a potent mutagen, in chloriated waters. ln:
Jolley, R.L., Condie, L.W:, Johnson, J.D., Katz, S., Minear, R.A., Mattce, J.S. &Jacobs, \ZA., eds, Water Chlorination: Chemistry, Environmental Impact and HealthEffects, VoL. 6, Chelsea, MI, Lewis Publishers, pp. 125-135
Hoover, R.N. & Strasser, P.H. (1980) Arificial sweeteners and human bladder cancer.Preliminary results. Laet, i, 837-84
Horth, H. (1989) Identification of mutagens in drikig water. Aqua, 38, 80-100Horth, H., Fielding, M., Gibson, 1:, James, H.A. & Ross, H. (1989) Identification of Mutagens
in Drinking Water (Publication No. PRD 2038-M), Medmenham, Water ResearchCentre
Hueper, W.C. & Payne, W:W. (1963) Carcinogenic effects of adsorbates of raw and finishedwater supplies. Am. 1 clin. Pathol., 39, 475-481
Hueper, W.C. & Ruchhoft, c.e. (1954) Carcinogenic studies on adsorbates of industriallypolluted raw and finished water supplies. Arch. ind. Hyg., 9, 488-495
lARe (1979a) IARC Monographs on the Evaluation of the Carcinogenic Risk ofChemicals toHumans, VoL. 20, Some Halogenated Hydrocarbons, Lyon, pp. 401-427
lARe (1979b) lAC Monographs on the Evaluation of the Carcinogenic Risk of Chemicals toHumans, VoL. 20, Sorn Halogenated Hydrocarbons, Lyon, pp. 429-A48
lARe (1979c) IARC Monographs on the Evaluation of the Carcinogenic Risk of Chemicals toHuman, VoL. 20, Some Halogenated Hydrocarbons, Lyon, pp. 467-476
lARe (1986) IARC Monographs on the Evaluation of the Carcinogenic Risk of Chemicals toHumans, VoL. 41, Some Halogenated Hydrocarbons and Pesticide Expsures, Lyon, p. 320
lARe (1987) lAC Monographs on the Evaluation of Carcinogenic Risks to Human, Suppl. 7,Overall Evaluations of Carcinogenicity: An Updating of lARe Monographs Volumes 1 to42, Lyon
iei Chemicals and Polymers Ltd (1988) Chlor-Chemicals, Runcomlsacson, P., Bean, J.A & Lynch, C. (1983) Relationship of cancer incidence rates in Iowa
municipalities to chloriation status of drinking water. ln: JoUey R.J., Brungs, W.A.,
Cotruvo, J.A., Cumming, R.B., Mattice, J.S. & Jacobs, \ZA., eds, Water Chlorination:Environmental Impact and Health Effects, VoL. 4, Book 2, Environment, Health, and Risk,Ann Arr, MI, Ann Arr Science, pp. 1353-1364
Italia, M.P. & Uden, P.C. (1988) Comparison of volatile halogenated compounds formed inthe chloramination and chlorination of humic acid by gas chromatography-
electron-capture detection. 1 Chromatogr, 449, 326-330

134 lARe MONOGRAHS VOLUME 52
Jacangelo, J.G., Patania, N.L., Reagan, K.M., Aieta, E.M., Krasner, S.W. &- McGuire, M.J.(1989) Ozonation: assessing its role in the formation and control of disinfectionby-products.l Am. Water Works Assoc., 81, 74-84
Kanarek, M.S. & Young, 1:B. (1982) Driking water treatment and risk of cancer death inWiscnsin. Environ. Bealth Perspect., 46, 179-186
Kavlock, R., Chemoff, N., Carver, B. & Kopfler, F. (1979)Teratologystudies in mice expsedto municipal driking-water concentrates durig organogenesis. Food Cosmet. Toxicol.,
17,343-347Keith, L.H., ed. (1976) Identification and Analysis of Organic Pollutants in Water, Ann Aror,
MI, Ann Arr ScienceKeith, L.H. (1981) Advances in the Identification and Analysis of Organic Pollutants in Water,
Vols 1 and 2, Ann Arr, MI, Ann Arr ScienceKfir, R. & Prozesky, O. W. (1982) Detection of potential cacinogens and toxicants in tap and
reclaimed water by the golden hamster cell transformation assay. Water Res., 16,1561-1568
KooI, H.J. & Hrubec, J. (1986) The influence of an ozone, chlorine and chlorine dioxidetreatment on mutagenic activity in (drinking) water. Ozone Sei Eng., 8, 217-234
KooI, H.J. & van Kreijl, C.F. (1984) Formation and removal of mutagenic activity durigdrikig water preparation. Water Res., 18, 1011-1016
KooI, H.J., van Kreijl, C.F., van Kranen, H.J. & de Greef, E. (1981) Toxicity assessment oforganic compounds in drinking water in the Netherlands. Sei total Environ., 18,135-153
KooI, H.J., van Kreijl, c.F. & Zoeteman, B.C.J. (1982a) Toxicology assessment of organiccompounds in driking water. Crit. Re environ. Control, 12, 307-357
KooI, H.J., van Kreijl, C.F., de Greef, E. & van Kranen, H.J. (1982b) Presence, introductionand removal of mutagenic activity during the preparation of drinking water in theNetherlands. Environ. Bealth Perspect., 46, 207-214
KooI, H.J., Kuper, E, van Haeringen, H. & Koeman, J.H. (1985a) A carcinogenicity studywith mutagenic organic concentra tes of drinking-water in the N etherlands. Food chem.Toxicol., 23, 79-85
KooI, H.J., Hrubec, J., van Kreijl, C.F. & Piet, G.J. (1985b) Evaluation of different treatmentprocesses with respect to mutagenic activity in drinking water. Sei. total Environ., 47,229-256
KooI, H.J., van Kreijl, C.F. & Hrubec, J. (1985c) Mutagenic and carcinogenic properties ofdrikig water. ln: Jolley, R.L., Bull, R.J., Davis, W.P., Katz, S., Roberts, M.H., Jr &
Jacos, Y.A., eds, Water Chlorination: Chemistry, Environmental Impact and Health
Effects, VoL. 5, Chelsea, MI, Lewis Publishers, pp. 187-205
Kopfler, EC., Ringhand, H.P., Coleman, WE. & Meier, J.R. (1985) Reactions of chlorine indriking water, with humic acids and in vivo. ln: Jolley, R.L., Bull, R.J., Davis, W.:P,Katz, S., Roberts, M.H., Jr & Jacos, Y.A., eds, Water Chlorination: Chemistry,
Environmntal Impact and Bea/th Effects, VoL. 5, Chelsea, MI, Lewis Publishers, pp.161-173

CHLORINATED DRINKING-WATER 135
Kowbel, D.J., Malaiyandi, M., Paramasigamani, v: & Nestmann, E.R. (1984) Chloriation of
ozonated soil fulvic acid: mutagenicity studies in Salmonella. Sei. total Environ., 37,171-176
Kowbel, D.J., Ramaswamy, S., Malaiyandi, M. & Nestmann, E.R. (1986) Mutagenicitystudies in Salmonella: residues of ozonated and/or chloriated water fulvic acids.Environ. Mutagenesis, 8, 253-262
Krasner, S.W., McGuire, M.J., Jacangelo, J.G., Patania, N.L., Reagan, K.M. & Aieta, E.M.(1989) The ocurrence of disinection by-products in US drikig water. J Am. WaterWorks Assoc., 81,41-53
Kraybil, H.E (1980) Evaluation of public health aspects of carcinogenic/mutagenic
biorefractories in drikig water. Prev Med., 9, 212-218
Kronberg, L. & Vartiainen, 1: (1988) Ames mutagenicity and concentration of the strongmutagen 3-chloro-4-(dichloromethyl)-5-hydroxy-2(5H)-furanone and of its geometricisomer E-2-chloro-3-(dichloromethyl)-4-oxo-butenoic acid in chlorine-treated tap
waters. Mutat. Res., 206, 177-182
Kronberg, L., Holmbom, B. & Tikkanen, L. (1985a) Mutagenic activity in drinkig water andhumic water after chlorine treatment. Vátten, 41, 106-109
Kronberg, L., Holmbom, B. & Tikkanen, L. (1985b) Fractionation of mutagenic compoundsformed during chloriation of humic water. Sei total Environ., 47, 343-347
Kronberg, L., Holmbom, B. & Tikkanen, L. (199) Identification of the strong mutagen,3-chloro-4-(dichloromethyl)-S-hydroxy-2(SH)-furanone and of its geometric ismer
E-2-chloro-3-(dichloromethyl)-4-oxobutenoic acid, in mutagenic fractions of
chlorine-treated humic water and driking waters. ln: JoUey, R.L., Condie, L.W.,Johnson, J.O., Katz, S., Minear, R.A., Mattice, J.S. & Jacobs, V:A., eds, Water
Chlorination: Chemistry, Environmental Impact and Bealth Effects, VoL. 6, Chelsea, MI,Lewis Publishers, pp. 137-146
Kuzma, R.J., Kuzma, C.M. & Buncher, C.R. (1977) Ohio drinking water source and cancerrates. Am. J public Bealth, 67, 725-729
Lahl, U., Cetinkaya, M., Duszeln, J.V:, Gabel, B., Stachel, B. & Thiemann, W. (1982) Healthrisks for infants caused by trihalomethane generation during chemical disinfection offeeding utensils. Ecol. Food Nutr., 12, 7-17
Lahl, U., Stachel, B., Schroer, W. & Zeschman, B. (1984) Determination of halogenatedorganic acids in water samples. Z. Wasser Abwasser Forsch., 17,45-49
Lawrence, c.E., Thyl or, P.R., Trock, B.J. & Reily, A.A. (1984) Trialomethanes in drinkigwater and human colorectal cancer. J natl Cancer 1nst., 72, 563-568
Le Cloirec, C. & Martin, G. (1985) Evolution of amino acids in water treatment plants and
the effect of chlorination on amino acids. ln: JoUey, R.L., BuU, R.J., Davis, WP., Katz,S., Roberts, M.H., Jr & Jacobs, V:A., eds, Water Chlorination: Chemistry, EnvironmentalImpact and Bealth Effects, Voi.-S, Chelsea, MI, Lewis Publishers, pp. 821-834
de Leer, E. W.B. (1987) Aqueous Chlorination Products: The Origin of Organochlorine
Compounds in Drinking and Surface Waters, Delft, University Press

136 lARe MONOGRAHS VOLUME 52
Lümatainen, A., Müller, D., Vartiainen, 1:, Jahn, E, Kleeberg, U., Klinger, W. & Hanninen,O. (1988) Chloriated drikig water is mutagenic and causes 3-methylcholanthrene
tye induction of hepatic monooxygenase. Toxicology, 51,281-289
Loper, J.C. (1980) Mutagenic effects of organic compounds in drikig water. Mutat. Res.,76, 241-268
Loper, J.C., Thbor, M.W., Rosenblum, L. & DeMarco, J. (1985) Continuous removal ofbothmutagens and mutagen-forming potential by an experiental full-scle granular
activated carbn treatment system. Environ. Sei Tèchnol., 19, 333-339
Lukasewycz, M.l:, Bieriger, C.M., Liukkonen, R.J., Fitzsimmons, M.E., Corcoran, H.E,
Lin, S. & Carlson, R.M. (1989) Analysis of inorganic and organic chloramines:
derivatiztion with 2-mercaptobenzothiazole. Environ. Sei. Technl., 23, 196-199
Lynch, C.E, Woolson, R.E, O'Gorman, 1: & Cantor, K.P. (1989) Chloriated drikigwater
and bladder cancer: effect of misclassification on risk estima tes. Arch. environ. Health,44, 252-259
Ma, l:-H., Andersn, \ZA., Harrs, M.M., Neas, R.E. & Lee, 1:-S. (1985) Mutagenicity of
drikig water detected by the Tradescantia micronucleus test. Cano 1 Genet. Cytol., 27,143-150
Maruoka, S. (1986) Analysis of mutagenic by-products produced by chloriation of humic
substances by thin layer chromatography and high-pedormance liquidchromatography. Sei total Environ., 54, 195-205
Maruoka, S. & Yamanaka, S. (1983) Mutagenic potential of laboratoiy chlorinated riverwater. Sei total Environ., 29, 143-154
Mason, 1:-J. & McKay, EW. (1974) US Cancer Mortality by County: 1950-1969, WashingtonDe, US Government Prnting Office
McKague, A.B., Lee, E.G.-H. & Douglas, G.R. (1981) Chloroacetones: mutagenicconstituents of bleached kraft chlorination effluent. Mutat. Res., 91, 301-306
McKiney, J.D., Maurer, R.R., Hass, J.R. & Thomas, R.O. (1976) Possible factors in thedrikig water of laboratoiy animaIs causing reproductive failure. ln: Keith, L.H., ed.,
Advances in Identification and Analysis of Organic Pollutants in Water, Ann Arr, MI,Ann Arbor Science, pp. 417-432
Meier, J.R. (1988) Genotoxic activity of organic chemicals in driking water. Mutat. Res., 196,211-245
Meier, J.R., Lingg, R.D. & Bull, R.J. (1983) Formation of mutagens following chloriation ofhumic acid: a model for mutagen formation durig drikig water treatment. Mutat.
Res., 118, 25-41
Meier, J.R., Ringhand, H.P., Coleman, W.E., Munch, J.W., Streicher, R.P., Kaylor, W.H. &Schenk, K.M. (1985) Identification of mutagenic compounds formed durigchloriation of humic acid. Mutat. Res., 157, 111-122
Meier, J.R., Ringhand, H.P., Coleman, W.E., Schenck, K.M., Munch, J.W., Streicher, R."P,Kaylor, W.H. & Kopfler, EC. (1986) Mutagenic by-products from chloriation of humic
acid. Environ. Health Perspect., 69, 101-107

CHLORINATED DRINKING-WATER137
Meier, J.R., Knohl, R.B., Coleman, WE., Ringhand, H.P., Munch, J.w., Kaylor, W.H.,Streicher, R.P. & Kopfler, EC. (1987) Studies on the potent bacterial mutagen,3-chloro-4-(dichloromethyl)-5-hydroxy-2(5H)-furanone: aqueous stabilty, XArecoveiy and analytical determination in drinking water and in chloriated humic acidsolutions. Mutal. Res., 189, 363-373
Miler, J.W., Uden, P.C. & Barnes, R.M. (1982) Determination of trichloroacetic acid at thepart-per-bilion level in water by precolumn trap enrichment gas chromatography withmicrowave plasma emission detection. Anal. Chem., 54, 485-488
Miler, R.G., Kopfler, EC., Condie, L.W., Pereira, M.A., Meier, J.R., Ringhand, H.P.,
Robinson, M. & Casto, B.C. (1986) Results of toxicological testing of Jefferson Parishpilot plant samples. Environ. Health Perspect., 69, 129-139
Monarca, S., Pasquini, R. & Scasselati Sforzolini, G. (1985a) Mutagenicity assessment ofdifferent driking water supplies before and after treatments. Bull. environ. Con/am.
Toxicol., 34, 815-823Monarca, S., Pasquini, R. & Arcaeni, P. (1985b) Detection of mutagens in unconcentrated
and concentrated drinking water supplies before and after treatment using a
microscle fluctuation test. Chemosphere, 14, 1069-1080National Academy of Sciences (1979) The Chemistry of Disinfectants in Water: Reactions and
Products (NS PB-292 776), Washington De, US Environmental Protection Agency
National Research Council (1980) Drinking Water and Health, Vol. 2, Washington De,National Acdemy Press
Nestmann, E. (1983) Mutagenic activity of drinking water. ln: Stich, H.E, ed., Carcinogensand Mutagens in the Environment, VoL. 3, Naturally Occurrng Compounds: Epidemiologyand Distribution, Boc Raton, FL, CRe Press, pp. 137-147
Nestmann, E.R., LeBel, G.L., Wiliams, D:r. & Kowbel, D.J. (1979) Mutagenicity of organicextracts from Canadian driking water in the Salmonella/mammalian-microsome
assay. Environ. Mutagenesis, 1, 337-345Nicholson, A.A., Meresz, O. & Lemyk, B. (1977) Determination of free and total potential
haloforms in drinking water. Anal. Chem., 49, 814-819Nicholson, B.C., Hayes, K.P. & Bursil, D.B. (1984) By-products of chlorination. Water,
September, 11-15
Norwoo, D.L., Christman, R.E, Johnson, J.D. & Hass, J.R. (1986) Using isotope dilutionmass spectrometiy to determine aqueous trichloroacetic acid. J Am. Water WorksAssoc., 78, 175-180
Oake, R.J. & Anderson, I.M. (1984) The Determination of Carbon Adsorbable Organo-halidein
Waters (PubL. No. TR 217), Medmenham, Water Research CentreOliver, B.G. (1983) Dihaloacetonitriles in drinking water: algae and fulvic acid as precursors.
Environ. Sei Technol., 17, 80-83
Otson, R., Willams, D:r. & Bothwell, P.D. (1979) A comparison of dynamic and static headhead space and solvent extraction techniques for the determination of trihalomethanesin water. Environ. Sei Technol., 13, 936-939
Page, G.W. (1981) Comparison of groundwater and surface water for patterns and levels ofcontamination by toxic substances. Environ. Sei Technol., 15, 1475-1481

138 lARe MONOGRAHS VOLUME 52
Page, 1:, Harrs, R.H. & Epstein, S.S. (1976) Driking water and cancer mortality inLouisiana. Science, 193, 55-57
Pelon, W., Beasley, 1:W. & Lesley, D.E. (1980) Transformation of the mou se clonaI cell lineR84-DP8 by Mississippi river, raw, and finished water samples from southeastemLouisiana. Environ. Sei Technol., 14, 723-726
Perwak, J., Goyer, M., Harrs, J., Schimke, G., Scow, K., Wallace, D. & Slimak, M. (1980)AnExpsure and Risk Assessment for Trihalomethanes: Chloroform, Bromoform, Bromodi-chloromethane, Dibromochloromethane (EPA-44/4-81-018; NTS PB 85-211977),Washington De, Office of Water Regulations and Standards, US EnvionmentalProtection Agency
Peters, C.J. (1980) Trihalomethane Formation Arsing from the Chlorination of Potable Waters,PhD Thesis, London, Imperial College of Science and Technology
Peters, R.J.B., Versteegh, J.EM. & de Leer, E.W.B. (1989) Dihaloacetonitries in drinkigwater in the Netherlands (Dutch). H20, 22,80-80
Pierce, R.C. (1978) The Aqueous Chlorination ofOrganic Compounds: Chemical ReactivityandEffects on Environmental Quality (NRCC Pub!. No. 16450), Ottawa, National ResearchCouncil of Canada
Pommeiy, J., Imbenotte, M., Urien, A.E, Marzin, D. & Erb, E (1989) SOS chromotest studyconceming sorne appreciation criteria of humic substances' genotoxic potency. Mutat.Res., 223, 183-189
Quaghebeur, D. & De Wulf, E. (1980) Volatile halogenated hydrocarbns in Belgiandriking waters. Sei total Environ., 14, 43-52
Rapson, W.H., lsacovics, B. & Johnson, C.I. (1985) Mutagenicity produced byaqueouschlorination of tyosine. ln: Jolley, R.L., Bull, R.J., Davis, W.P., Katz, S., Roberts,
M.H., Jr & Jacobs, ~A., eds, Water Chloriation: Chemistry, Environmental Impact and
Health Effects, VoL. 5, Chelsea, MI, Lewis Publishers, pp. 237-249
Rausch, L.L. (1980) Chlorination of Drinkng Water and Pregnancy Outcomes in New YorkVillages, 1968-1977, PhD Thesis, Columbia University, New York City, NY
Reding, R., Fair, P.S., Shipp, C.J. & Brass, H.J. (1989) Measurement of dihaloacetonitriesand chloropierin in US drinking water. ln: Disinfection By-products: Current Perspectives,Denver, CO, American Water Works Assoiation, pp. 11-22
Renberg, L. (1981) Gas chromatographie determination of phenolie compounds in water astheir pentafluorobenzoyl derivatives. Chemosphere, 10, 767-773
Ringhand, H.P., Meier, J.R., Kopfler, EC., Schenck, K.M., Kaylor, W.H. & Mitchell, D.E.(1987) Importance of sample pH on recoveiy of mutagenicity from driking water byXA resins. Environ. Sei Technol., 21, 382-387
Robinson, M., Glass,J.W., Cmehil, D., Bull, R.J. & Orthoefor,J.G. (1981) The initiation andpromoting activity of chemicals isolated from driking waters in the SENCAR mouse:a five-city survey. ln: Waters, M.D., Sandhu, S.S., Huisingh, J.L., Claxon, L. &N esnow, S., eds, Short -term Bioassays in the Analysis of Complex Environmental Mixures.II (Environmental Science Research Series, VoL. 22), New York, Plenum Press, pp.177-188

CHLORINATED DRINKING- W ATER 139
Rook, J.J. (1974) Formation of haloforms durig chloriation of natural waters. Water Treat.Exam., 23, 234-243
Rook, J.J. (1977) Chlorination reactions of fulvic acids in natural waters. Environ. SeiTechnol., Il, 478-482
Rook, J.J. (1980) Possible pathways for the formation of chloriated degradation productsdurig chloriation of humic acids and resorcinol. ln: Jolley, R.L., Brungs, W.A.,Cumming, R.B. & Jacobs, \ZA., eds, Water Chlorination: Chemistry, EnvironmentalImpact and Health Effects, VoL. 3, Ann Arr, MI, Ann Air Science, pp. 85-98
Schwartz, D.J., Saxe na, J. & Kopfler, EC. (1979) Water distribution system, a new source ofmutagens in drikig waters. Environ. Sei Technol., 13, 1138-1141
Scully, EE., Jr, Yang, J.P., Mazina, K. & Daniel, EB. (1984) Derivatiztion of organic andinorganic N-chloramines for high performance liquid chromatographie analysis ofchlorinated water. Environ. Sei Technol., 18, 787-792
Sithole, B.B. & Wiliams, D:r. (1986) Halogenated phenols in water at fort Canadianpotable water treatment facilities. 1 Assoc. off anal. Chem., 69, 807-810
Standing Committee of Analysts (1980) Chloro and Bromo Trihalogenated Methanes in Water(Methods for the Examination of Waters and Assoiated Materials), London, HerMajesty's Stationery Offiee
Standing Committee of Analysts (1985) Chlorophenoxy Acidic Herbicides, TrichloroaceticAcid, Chlorophenols, Triazines and Glyphosate in Water 1985 (Methods for the Exami-nation of Waters and Assoiated Materils), London, Her Majesty's Stationery Office
Standing Committee of Analysts (1988) The Determination of Microgram and SubmicrogramAmounts of Individual Phenols in River and Potable Waters (Methods for the Examinationof Waters and Assoiated Materials), London, Her Majesty's Stationery Office
Staples, R.E., Worthy, w.c. & Marks, 'fA. (1979) Influence of drikig water-tap versuspuriied-on embryo and retal development in miee. Teratology, 19, 237-244
Strömberg, L.M., de Sousa, E, Ljungquist, p., McKague, B. & Krgstad, K.P. (1987) Anabundant chloriated furanone in the spent chloriation liquor from pulp bleaching.Environ. Sei Technol., 21, 754-756
Suffet, I.H., Brenner, L. & Cairo, P.R. (1980) GC/MS identification of trace organics inPhiladelphia drikig waters during a 2-year period. Water Re., 14, 853-867
Symons, J.M., Bellar, 'fA., Carswell, J.K., DeMarco, J., Kropp, K.L., Robeck, G.G., Seeger,D.R., Slocum, C.J., Smith, B.L. & Stevens, A.A. (1975) National organics
reconnaissance survey for halogenated organies.l Am. Water Works Assoc., 67, 634-647
Thurman, E.M. (1985) Organic Geochemistry of Natural Waters, Dordrecht, MartinusNijhoff/Dr W. Junk Publishers
Trehy, M.L. & Bieber, 'f1. (1981) Detection, identification and quantitative analysis ofdihaloacetonitries in chloriated natural waters. ln: Keith, L.H., ed., Advanes in theIdentification an Anysis of Organic Pollutants in Water, VoL. 2, Ann Arr, MI, AnnArr Science, pp. 941-975

140 lARe MONOGRAHS VOLUME 52
Truhaut, R., Gak, J.C. & Grailot, C. (1979) Studies on the risks that may result from
chemical pollution of drinking-water-I. Study of the long-terr toxicity in rats andmice of organic micropollutants extracted from driking water with chloroform (FL).Water Res., 13, 689-697
Ththil, R.W. & Moore, G.S. (1980) Driking water chlorination: a practice unrelated tocancer mortality.l Am. Water Works Assoc., 72, 570-573
Ththil, R.W., Giusti, R.A., Moore, G.S. & Calabre se, E.J. (1982) Health effects amongnewborns after prenatal expsure to CI02-disinected drinking water. Environ. HealthPerspect., 46, 39-45
Uden, P.C. & Miler, J. W. (1983) Chlorinated acids and chloral in drinking wateLl Am. WaterWorks Assoc., 75, 524-427
US Envionmental Protection Agency (1979a) EPA 501-2, Cincinnati, OH, EnvironmentalMonitorig and Support Laboratory
US Envionmental Protection Agency (1979b)EPA 501-1, Cincinnati, OH, EnvironmentalMonitoring and Support Laboratory
US Envionmental Protection Agency (1985) Health and Environmental Effects Profile forBromochloromethanes (EPA-60/X-85-397; NTS PB 88-174610), Cincinnati, OH,Envionmental Criteria Assessment Office
Van Der Gaag, M.A., Noordsij, A. & Oran je, J.P. (1982) Presence of mutagens in Dutchsudace water and effects of water treatment processes for drinking water preparation.ln: Sorsa, M. & Vainio, H., eds, Mutagens in Our Environment, New York, Alan R. Liss,pp. 277-286
Van Duuren, B.L., Melchionne, S., Seidman, 1. & Pereira, M.A. (1986) Chronic bioassays ofchloriated humic acids in B6C3F1 mice. Environ. Health Perspect., 69, 109-117
Vartiainen, 1: & Liiatainen, A. (1986) High levels of mutagenic activity in chlorinated
drikig water in Finland. Mutat. Res., 169,29-34
Vartiainen, 1:, Liimatainen, A., Jääskeläinen, S. & Kauranen, P. (1987a) Comparison ofsolvent extractions and resin adsorption for isolation of mutagenic compounds fromchloriated drinking water with high humus content. Water Res., 21, 773-779
Vartiainen, 1:, Liimatainen, A., Keränen, P., Ala-Peijari, 1: & Kalliokoski, P. (1987b) Effectof permanganate oxidation and chlorination on the mutagenic activity and other qualityparameters of artificially recharged ground water processed from humus-rich sudacewater. Chemosphere, 16, 1489-1499
Vartiainen, 1:, Lümatainen, A., Kauranen, P. & HüsvIra, L. (1988) Relations betweendrikig water mutagenicity and water quality parameters. Chemosphere, 17, 189-202
Water Research Centre (1980) Trihalomethanes in Water: Seminar Held at the LorchFoundation, Lae End, Buckingamhire, UK, 16-17 January 1980, Medmenham, UK
Wei, R.-D., Chang, S.-C. & Jeng, M.-H. (1984) Mutagenicity of organic extracts froIDdrikig water in the Thipei area. Natl Sei. Couneil Monthly ROC, Il, 1565-1572
White, G.C., ed. (1986) The Handbook of Chlorination, 2nd ed., New York, Van NostrandReinhold

CHLORINATED DRINKING-WATER 141
Wigilius, B., Borén, H., Carlberg, G.E., Grivall, A. & Möller, M. (1985) A comparison ofmethods for concentrating mutagens in drikig water-recovery aspects and their
implications for the chemical character of major unidentified mutagens. Sei totalEnviron., 47, 265-272
Wilcox, P. & Denny, S. (1985) Effect of dechlorinating agents on the mutagenic activity ofchloriated water samples. ln: Jolley, R.L., Bull, R.J., Davis, w.P., Katz, S., Roberts,M.H., Jr & Jacobs, \ZA. eds, Water Chlorination: Chemistry, Environmntal Impact andHealth Effects, VoL. 5, Chelsea, MI, Lewis Publishers, pp. 1341-1353
Wilcox, P. & Wiliamson, S. (1986) Mutagenie activity of concentrated drikig water
samples. Environ. Health Perspect., 69, 141-149
Wilcox, P., van Hoof, F. & Van Der Gaag, M. (1986) Isolation and characterition ofmutagens from drikig water (Abstract). ln: Léonard, A. & Kisch-Volders, M., eds,Proceedings of the XVth Amual Meeting of the European Environmental Mutagen Society,23-30 August 1986, Brsels, Brussels, Free University, pp. 92-103
Wilkins, J.R., III & Corn stock, G.W. (1981) Source of drikig water at home andsite-specifie cancer incidence in Washington County, Maryland. Am. 1 Epidemiol., 114,178-190
World Health Organization (1984) Guidelines for Drinking Water Quality, Vols 1 and 2,Geneva
World Health Organiztion (1988) Introduction to National Seminars on Drinking-waterQuality, Geneva, p. V-7
Young, TB. & Kanarek, M.S. (1983) Matched pair case control study of drikig water
chlorination and cancer mortality. ln: Jolley R.J., Brungs, W.A., Cotruvo, J.A,Cumming, R.B., Mattice, J.S. & Jacobs, \ZA., eds, Water Chlorination: EnvironmenlalImpact and Health Effects, VoL. 4, Book 2, Environmental Health and Risk, Ann Air,MI, Ann Arr Science, pp. 1365-1380
Young, TB., Kanarek, M.S. & Thiatis, A.A. (1981) Epidemiologic study of drinkig waterchlorination and Wiscnsin female cancer mortality. 1 natl Cancer lnsl., 67, 1191-1198
Young, TB., Wolf, D.A. & Kanarek, M.S. (1987) Case-control study of colon cancer anddrinking water trihalomethanes in Wisconsin. lnt. 1 Epidemiol., 16, 190-197
Zeighami, E.A., Watson, A.P. & Craun, G.F. (199) Chlorination, water hardness and serumcholesterol in rort-six Wiscnsin communities. lnt. 1 Epidemiol., 19, 49-58
Zierler, S., Danley, R.A. & Feingold, L. (1986) Type of disinfectant in driking water andpatterns of mortality in Massachusetts. Environ. Health Perspect., 69, 275-279
Zierler, S., Feingold, L., Danley, R.A. & Craun, G. (1988) Bladder cancer in Massachusettsrelated to chlorinated and chloraminated drinking water: a case-control study. Arch.environ. Health, 43, 195-200
Zoeteman, B.C.J., Hrubec, J., de Greer, E. & KooI, H.J. (1982) Mutagenic activityassociated with by-products of drinking water disinfection by chlorie, chlorie dioxide,
ozone and UV-irradiation. Environ. Health Perspect., 46, 197-205