ehes working paper | no. 210 | march 2021 inequality
TRANSCRIPT

European Historical Economics Society
EHES Working Paper | No. 210 | March 2021
Inequality Beyond GDP: A Long View
Leandro Prados de la Escosura
Universidad Carlos III de Madrid

EHES Working Paper | No. 210 | March 2021
Inequality Beyond GDP: A Long View*
Leandro Prados de la Escosura1 Universidad Carlos III de Madrid
Abstract
The study of international well-being and its distribution remains focused on income. This paper addresses multidimensional well-being from a capabilities perspective during the last one-and-a-half centuries. Relative inequality (population-weighted) fell in health and education since the late 1920s, due to the globalisation of mass schooling and the health transition, but only dropped from 1970 onwards in terms of political and civil liberties, and declined since 1900 for augmented human development. These results are at odds with per capita income inequality that rose over time and only shrank from 1990 onwards. Relative and absolute well-being distribution behaved differently, with the distance between countries shrinking in relative terms but widening in absolute terms. Countries in the middle and lower deciles of the world distribution achieved the largest relative gain over the last century. Education and political and civil liberties were the main contributors to the evolution of augmented human development inequality, although longevity made a substantial contribution until the 1920s.
JEL Codes: I00, N30, O15, O50
Keywords: Inequality, Well-being, Life Expectancy, Schooling, Civil and Political Liberties, GDP, Augmented Human Development
Notice The material presented in the EHES Working Paper Series is property of the author(s) and should be quoted as such.
The views expressed in this Paper are those of the author(s) and do not necessarily represent the views of the EHES or its members
1Corresponding Author: Leandro Prados de la Escosura: ([email protected])
* I gratefully acknowledge comments and suggestions on earlier versions of the paper by Carles Boix, Tim Hatton, Branko Milanovic, Blanca Sánchez-Alonso, and participants at the 4th World Bank-Banco de España Policy Conference (Madrid), the Economic History Society Conference (Cambridge), the GGDC 25th Anniversary Conference (Groningen), the World Congress of Cliometrics (Strasbourg), the LSE-Stanford-Universidad de los Andes Conference (London), and seminars at Bar-Ilan (Tel Aviv), NYUAD (Abu Dhabi), ANU (Canberra), and Higher School of Economics and Lomonosov (Moscow) universities. I thank Juana Lamote de Grignon for her statistical help. A research grant from Fundación Rafael del Pino is acknowledged.
I. Introduction
In the last one and a half centuries, substantial gains in well-being have been
achieved across the board. This can be observed for its main dimensions: health,
education, political voice, civil liberties, personal security, and material well-being
(Deaton, 2013; Maddison, 2008; Morrisson and Murtin, 2009; Pinker, 2018). However,
in the study of international well-being and its distribution the focus remains on
income. In this paper I address multidimensional well-being and raise some questions.
How have the gains from well-being dimensions been distributed? Do relative and
absolute inequality move together? What drives relative inequality? Which parts of the
distribution achieved larger gains over time in relative and absolute terms?
This paper approaches multidimensional well-being from a capabilities
perspective.1 The capabilities approach makes well-being dependent on a combination
of functionings or achievements freely chosen by individuals (Sen, 1984). Thus, the
distribution of well-being across countries will be assessed on a broad basis that
includes health, access to knowledge, and civil and political liberties, proxied by
Kakwani indices of life expectancy at birth and schooling, and an index of liberal
democracy, respectively, as well as the distribution of material well-being, proxied by
per capita income. Well-being dimensions may reveal diverging trends, warranting the
resort to a composite measure. Therefore, differences across countries in terms of
augmented human development, which encompasses enjoying a healthy life, acquiring
knowledge, and achieving a decent standard of living in a context of freedom of choice
(Prados de la Escosura, 2021), will be also addressed.
This paper contributes to the literature on international well-being distribution
in several ways.2 First, it offers long run trends in relative and absolute inequality for
schooling, life expectancy, political and civil liberties, and augmented human
development, that are contrasted with those for per capita income.3 Secondly, it
1 Alternatives include the welfare economics approach which values various dimensions of quality of life in monetary terms (Nordhaus and Tobin, 1972; Becker et al., 2005; Jones and Klenow, 2016; Gallardo Albarrán, 2017), and Subjective Well-Being (SWB), which places life satisfaction at its centre (Easterlin, 1974, Kahneman and Deaton, 2010; Veenhoven and Vengust, 2013; Clark, 2018). 2 Since in the present state of the art it is not possible to derive measures of within-country inequality for the well-being dimensions considered over such a large country sample and long time span, I will focus on inter-national inequality, on the basis of national averages for each dimension. 3 Relative inequality depends on the ratio of countries to the mean and absolute inequality measures the absolute distance between countries. Consider, for example, GDP per head in two countries, country

2
addresses the drivers of relative inequality across well-being dimensions on the basis
of decomposable entropy indices. Finally, it shows the distribution of relative and
absolute gains in well-being dimensions by deciles using growth incidence curves. The
period considered spans from 1870 to 2015, encompassing two phases of globalisation
(pre-1913 and post-1950) and one of globalisation backlash (1914-1950), on the basis
of a sample ranging between 115 and 162 countries that represents most of world’s
population.
The paper’s main results challenge the conventional view of well-being
distribution across countries and over time that derives from GDP per head. While the
international dispersion of per capita income increased until the late twentieth century
and only fell since 1990, relative inequality in health and education fell steadily since
the late 1920s and, in terms of political and civil liberties, unweighted inequality
experienced a long-run decline since 1890, but population-weighted inequality grew
over time only dropping from 1970 onwards. Relative inequality in augmented human
development declined since 1900, with schooling and political and civil liberties as the
main contributors, although longevity played a distinctive part up to the 1920s. The
gap between the OECD and the Rest of the world accounted only partially for relative
inequality in well-being since the dispersion within developing regions became its main
driver from the mid-twentieth century onwards. Relative and absolute well-being
distribution behaved differently. For most of the time span considered the relative
distance across countries shrank, but the absolute distance widened. A look at the
long-run distribution of well-being reveals relative gains for those countries in the
middle and lower deciles over the last century. The globalisation of primary and
secondary schooling and the health transition mainly accounted for the reduction of
population-weighted inequality in terms of well-being, although the rise of
authoritarian political regimes partly offset it, since civil and political liberties only
helped reducing well-being inequality from the late twentieth century.
A, $1,000 and country B, $ 10,000. If GDP per head is doubled in both countries, the absolute difference between country B and country A will widen, from 9,000 (= 10,000- 1,000) to 18,000 (=20,000-2,000), but in relative terms the difference will not change, country B will continue being ten times richer than country A. Cf. Ravallion (2004: 23-24).
3
The paper is organized as follows. Section II provides an overview of the
empirical literature on multidimensional international inequality. Section III presents
new indices of life expectancy, schooling, and political and civil liberties, as well as of
augmented human development. Section IV offers long-run trends in inequality.
Section V portrays relative and absolute gains across the distribution for each well-
being indicator on the basis of growth incidence curves. Section VI looks at the
behaviour of well-being dimensions to account for the disparities in their distribution
over time.
II. Debating Well-being Inequality
Earlier quantitative assessments of international inequality were carried out on
the basis of per capita GDP, focusing almost exclusively on the late twentieth century.
A long-term deterioration in world distribution of income, led by a widening gap
between developed and developing countries, was the prevailing consensus up to the
1980s (Theil 1979, 1989). Albert Berry, François Bourguignon, and Christian Morrisson
(1983) challenged this view by pointing out that large countries were the main
determinants of the exhibited trends.4 Later, Branko Milanovic (2005, 2016) showed
that while unweighted international inequality (labelled ‘Inequality 1’) experienced a
sustained increase until 2000 and, then, declined, population-weighted inequality
(labelled ‘Inequality 2’) fell since the mid-twentieth century.
In the last decades, as data on household surveys became widely available,
research shifted the focus to ‘global’ economic inequality, that is, world income
distribution among individuals (‘Inequality 3’ in Milanovic’s typology). The results from
the new approach initially supported the view of a substantial increase in global
inequality as widening inter-country income differentials more than offset the decline
in within-country inequality (Korzeniewicz and Moran, 1997). The consensus was
broken when Paul Schultz (1998) showed that inequality had fallen since the mid-
1970s, since the contraction in inequality across countries cancelled any increases in
within-country inequality. Schultz’s findings led to a new, less pessimistic consensus
that challenged the view of a widening gap between the world rich and poor in the late
4 The determinant role played by China and India in the international income distribution is a recurrent feature in later studies, cf. Firebaugh (1999), Bourguignon and Morrisson (2002), Milanovic (2005), and Sala-i-Martin (2006).

4
twentieth century. Glenn Firebaugh (1999) also noticed a remarkable stability in world
income distribution between 1960 and 1989 since the divergence in income growth
favourable to rich countries was offset by the faster population growth in poor
countries. For the post-1980 era, Christoph Lakner and Milanovic (2016) indicate that
the level of global inequality remained stable and high, and only declined mildly since
the early 2000s including the period of the Great Recession, with China’s contribution
playing a decisive role (Milanovic, 2020).5
The discussion has been carried out, so far, in terms of relative inequality,
which depends on the ratio of countries to the mean, and little emphasis has been
placed on absolute inequality, that is, absolute differences between countries and
regions. In fact, the difference between relative and absolute inequality help explain
the contradiction often highlighted between the evolution of aggregate measures of
inequality, most often, the Gini coefficient, and the gap between the top and the
bottom.6 For example, Miguel Niño-Zarazúa et al. (2017) found a decline in global
inequality between 1975 and 2010 in relative terms, but an increase when measured
in absolute terms.
Long run inequality has received little quantitative attention until the last
decades due to data constraints. Bourguignon and Morrisson (2002), on the basis of 33
“trans-national” units, concluded that world inequality was much higher in 1992 than
in 1820. This resulted from a rise in inequality between the early nineteenth century
and mid-twentieth century that tended to stabilize during the second half of the
century. The main element behind long run world income inequality was the disparity
across countries. Nonetheless, within-country income distribution dominated world
inequality during the nineteenth century, while in the twentieth century cross-country
income distribution prevailed. Refined estimates by Jan-Luiten van Zanden et al. (2014)
tend to confirm Bourguignon and Morrisson’s findings. Driven by between-country
inequality, the dispersion of global income distribution increased over the long run,
5 Dowrick and Akmal (2005) found, however, that inequality increased slightly between 1980 and 1993. In a careful survey, Anand and Segal (2008) express an agnostic view about the direction of change in global inequality over 1970-2000. Liberati (2015) confirmed Milanovic’s finding and pointed out a moderate decline in global inequality since the beginning of the twentieth-first century. 6 For example, if all countries double their income, relative inequality will remain the same, but absolute inequality will widen. Cf. Anand and Segal (2015) and Atkinson and Brandolini (2010).

5
mostly up to 1950, stabilising thereafter, and experiencing a moderate rise from 1980
onwards. When, alternatively, absolute inequality is considered, Thomas Goda and
Alejandro Torres García, (2017) find a sustained rise since 1850 (with only a decline in
the 2000s), in which within-country inequality represented the driving force before
1929 and after 1985, while between-country inequality prevailed over 1929-1950.
However, per capita income is just one dimension of well-being. Inequality in
access to education and health have also attracted social scientists’ interest (. In the
case of civil and political rights, however, although the Its spread and setbacks across
countries have attracted much attention, no quantitative assessments of its
international distribution seem to exist (Cf. Noble, 2106).
Morrisson and Fabrice Murtin (2013) provided a long run view of global
education inequality on the basis of average years of schooling, finding a long-term
reduction, mostly attributable to the diffusion of literacy.7 Brian Goesling and David
Baker (2008) observed a declining dispersion of schooling years since 1980 and
attributed it to the globalization of primary education.
The long run evolution of life expectancy inequality has been addressed by
Bourguignon and Morrisson (2002), who on the basis of cross-country data for life
expectancy at birth at benchmark years, found a sustained increase in inequality
between 1820 and 1910, that stabilized up to 1929, and, then, declined sharply down
to 1970, remaining unaltered until 1990. An update of the estimates shows a further
decline in the 1990s (Morrisson and Murtin, 2005). Thus, the levels of inequality in the
late twentieth and early nineteenth centuries were similar. Rob Clark (2010) finds also
that the international dispersion of life expectancy declined between 1955 and 1990
but it rose, then, until 2005. He claims an inverted U relationship existed between life
expectancy dispersion and the level of per capita GDP, and depicted it as a “welfare
Kuznets curve”. Goesling and Glenn Firebaugh (2004) found a decline in the 1980s that
was reverted during the 1990s, and they largely attributed to the different pace at
which life expectancy evolved across countries, particularly in Sub-Saharan Africa.8
7 Morrison and Murtin (2013) use Bourguignon and Morrisson’s trans-national units or “large” countries (32 rather than 33, in their case). 8 Goesling and Firebaugh (2004) also hypothesised an inverted U shape evolution of health inequality over the last two centuries, starting from low levels that would have increased since the late nineteenth century and peaked in the Interwar years, to decline during the second half of the twentieth century.

6
Rati Ram (2006) concurred, pointing out the contrast between the pre- and post-1990
periods and attributing the divergence in the 1990s to the role of HIV/AIDS. Goesling
and Baker (2008) stressed the uneven diffusion of health knowledge, practice, and
technology across countries that, as Ryan Edwards (2011) observes, translated into
steady, or even growing, international inequality in adult longevity between 1970 and
2000.
Whether to look at different dimensions of well-being individually or to resort
to multidimensional indices poses a dilemma. On the one hand, the interpretation of
individual indices is straightforward. On the other, if individual indices show conflicting
tendencies, drawing general conclusions on its evolution becomes impossible
(Decancq et al., 2009). This has led to constructing composite indicators.
The pioneer in addressing international well-being inequality within a
capabilities framework, was Ram (1992), who noticed a discrepancy between the high
level of income inequality and the low level of human development inequality. Earlier
on, using the Physical Quality of Life Index, Ram (1980) had observed a sustained
decline in well-being inequality over 1950-1970, at odds with the simultaneous rising
trend observed for income. Later, Farhad Noorbakhsh (2006) pointed out a slow
inequality reduction in human development during the last quarter of the twentieth
century, and Ricardo Martínez (2012) found a decline in the international dispersion of
human development between 1980 and 2010. In the only long run perspective on
human development, Morrisson and Murtin (2005) observed that the evolution of
inequality had an inverted U-shape with a turning point in 1930.9
Also inspired by Amartya Sen’s capabilities approach, and on the basis of
‘achievement indices’ (see next section) for different social indicators (infant mortality
rate, life expectancy at birth, and daily calorie and protein supply), Bart Hobijn and
Philip Hans Franses (2001) disputed the view that standards of living converged in the
9 Morrisson and Murtin (2005) used a slightly modified version of the UNDP HDI. More recently, Auke Rijpma (2017) has constructed a comprehensive well-being index for the last two centuries on the basis of a wide range of indicators (income, health, education, political institutions, freedom, inequality, and personal security) and using a latent variable model. This composite index shows more intense improvement and stronger convergence over time than GDP per head. Also, Koen Decancq et al. (2009) using a flexible index of multidimensional well-being showed a decline in unweighted inequality over 1975-2000.

7
late twentieth century and suggested an increase in unweighted inequality resulting
from a widening gap between Core and Periphery since the 1960s.10
The main conclusion that derives from the surveyed literature is that (non-
income) well-being inequality experienced a long-term rise that peaked by the early-
twentieth century and, then, gave way to a sustained decline. This is at odds with the
evolution of international income distribution, in which dispersion rose over time to
decline only in the early 2000s. Can this depiction of the trends in well-being inequality
be confirmed using a more rigorous conceptual approach and on the basis of a more
comprehensive database?
It is also worth mentioning the driving role played by between-country
inequality in global interpersonal income and education inequality. Between-country
inequality not only represented the main component of global inequality but their
trends were largely coincidental (Bourguignon and Morrisson, 2002; van Zanden et al.,
2014; Lakner and Milanovic, 2016; Morrisson and Murtin, 2013). This finding lends
support to the approach that, in the absence of within country information, is
presented here, namely, studying population-weighted inequality across countries
(Milanovic’s Inequality 2).
III. Assessing Well-being
How to measure progress in non-economic dimensions of well-being beyond
GDP constitutes a far from negligible matter. Original values of social variables (life
expectancy, height, or literacy) are usually employed (Acemoglu and Johnson, 2007;
Becker et al., 2005; Bourguignon and Morrisson, 2002; Morrisson and Murtin, 2013;
Hatton and Bray, 2010; Lindert, 2004). However, unlike GDP, non-income well-being
indicators, such as life expectancy, height, infant mortality, literacy rates, or years of
schooling, have asymptotic limits that reflect biological or physical maxima. This means
that the use of original values for comparisons over space and time introduces biases,
because the range of variation is very narrow, forcing smaller gains (both absolute and
relative) as their levels get higher (Sen, 1981; Dasgupta, 1990; Cornia and Menchini,
2006). This objection is particularly relevant when an attempt is made at measuring
10 This conclusion was disputed by Eric Neumayer (2003), who rejected Hobijn and Franses ‘achievement indices’ to assess inequality and using the original values of a set of social variables (life expectancy, infant survival, education enrolment, literacy, and telephone and television availability), restated the view of a reduction in inequality between 1960 and 2000.

8
the distribution of such variable across countries and over time, since the use of
original values tends to bias the results towards convergence.
A transformation would be, then, required to measure changes within upper
and lower bounds. A possibility is a linear transformation, which reduces the size of the
denominator and, thus, widens the index’s range. Indices for each dimension (Ix) are
computed as,
Ix = (x - Mo) / (M - Mo), [1]
where x is the observed value of a given dimension of welfare, and Mo and M
the minimum and maximum values (goalposts), respectively. The index varies within 0
and 1.11
However, using linearly transformed values does not solve the problem as
absolute changes of identical size result in smaller measured improvement for the
country with the higher initial level (Sen, 1981; Kakwani, 1993).12 Consider, for
example, two improvements in life expectancy at birth, one from 30 to 40 years and
another from 70 to 80 years. These increases are identical in absolute terms, but the
second is smaller in proportion to the initial starting level.13
The shortcomings of a linear transformation of original values become more
evident when quality is taken into account. Healthy life expectancy increases with life
expectancy at birth as morbidity experiences a relative compression (Murray et al.,
2017) and, hence, as life expectancy raises, disability for each age-cohort falls and the
quality of life rises across the board (Salomon et al., 2012; Mathers et al., 2001).14
11 This transformation is used in the United Nations Development Programme’s (UNDP) (2014) Index of Human Development. 12 As Decancq et al. (2009) put it, the problem of spurious convergence remains, nonetheless, with a concave transformation as “it dampens the effect of increasing values at the higher end of the distribution” (p. 17). 13 For example, using expression [1] and with 85 and 20 years as goalposts, the index would double in the former case and increase only by 20% in the latter. 14 Studying the United States over 1990-2005 Cutler et al. (2014) argued that the reduction in disabled life expectancy and the increase in disability-free life expectancy suggest the compression of morbidity. Also Chernew et al. (2016) found an increase in healthy life expectancy along a fall in disable life expectancy in the U.S. during 1992-2008. However, this finding is not confirmed on the basis of self-reported chronic disease and Beltrán-Sánchez et al. (2016) conclude that there is no clear evidence of compression of morbidity. The sceptical view also find support in the case of Europe, for which Heger and Kolodziej (2016) do not find that medical progress reduces the disabling impact of diseases, associating population ageing with an extension of morbidity.
9
Similarly, the quality of education, measured in terms of cognitive skills, grows as the
quantity of education increases (Altinok et al., 2018).15
Unfortunately no historical data on health-adjusted life expectancy and quality-
adjusted education measures for the broad country sample considered here are
available before 1990.16 However, Nanak Kakwani’s (1993) proposal of transforming
social dimensions with a non-linear function, in which achievements of the same
absolute size have a larger impact as the starting point is higher, may provide a short-
cut method to derive proxies for healthy life expectancy and cognitive skills on the
basis of crude figures for life expectation at birth and years of schooling.17
Kakwani (1993) constructed a normalised index from an achievement function
in which an increase in the standard of living of a country at a higher level implies a
greater achievement than would have been the case had it occurred at a lower level,
f (x, Mo, M) = (log (M - Mo) – log (M – x)) / log (M - Mo) [2]
where x is an indicator of a country’s standard of living, M and Mo are the
maximum and minimum values, respectively, and log stands for the natural logarithm.
Kakwani (1993) achievement function proposed by is a convex function of x,
and it is equal to 0, if x = Mo, and equal to 1, if x = M, with a range between 0 and 1.18
Freedom and agency are crucial elements of well-being in a capabilities
approach (Ivanov and Peleah, 2010). The best and most comprehensive indicator
available is, perhaps, offered by Varieties of Democracy, the Liberal Democracy Index,
which combines political liberties (electoral democracy, including free competition,
extensive participation, and rulers’ responsiveness to citizens) and civil liberties
15 The measure of quality-adjusted years of education used here is derived as the product of normalised indices (namely, expressed relative to its maximum value) of cognitive skills (as a measure of quality), provided by Altinok et al. (2018) and years of schooling (as a measure of quantity) for each country’s average over 1965-2015.. 16 In fact, whether an association between mortality and morbidity existed between 1870 and 1990 remains an unknown (Riley, 1990; Howse, 2006; Bleakley, 2007, 2010). 17 Life expectancy at birth defined, by the UN, as “The average number of years that a new-born could expect to live, if he or she were subject to the age-specific mortality rates of a given period” http://www.un.org/esa/sustdev/natlinfo/indicators/methodology_sheets/health/life_expectancy.pdf . Years of schooling represent the average years of total schooling (primary, secondary, and tertiary) for population aged 25 and over. 18 In the case of life expectancy, maximum and minimum values accepted are 85 and 20 years, respectively, and 0 and 15 years are the goalposts in the case of years of schooling (UNDP, 2014). A ‘floor’ of 25 years has been assumed for of life expectancy at birth and 0.01 years in the case of years of schooling. For a discussion of sources and computation procedures, Prados de la Escosura (2021).

10
(protection of individual and minority rights and limits on government including the
rule of law, an independent judiciary, and effective checks and balances).19
As well-being dimensions may exhibit diverging trends in their level and
distribution, well-being inequality is also addressed using a composite index, the
Augmented Human Development Index (AHDI), which represents an alternative to the
UNDP's conventional HDI (Prados de la Escosura, 2021). As the conventional HDI, the
AHDI includes as proxies for a healthy life (life expectancy at birth), access to
knowledge (years of schooling), and material well-being plus other aspects of well-
being (discounted per capita income, in logs). The difference with the HDI is that non-
income variables are transformed non-linearly using expression [2], rather than
linearly, so increases of the same absolute size represent greater achievements the
higher the level at which they take place. Moreover, the aggregate index is augmented
by incorporating civil and political liberties, proxied here by the index of liberal
democracy which, as it measures quality in addition to quantity (unlike the other
bounded variables considered here), is derived linearly (expression [1]).
The AHDI has been obtained as a multiplicative combination of the transformed
values of each dimension.20 If we denote the non-linearly transformed values of life
expectancy and schooling as E and S, respectively, political and civil liberties, as L, and
the adjusted per capita income21 as Y, the historical index of human development is
derived as,
AHDI = (E x S x L x Y)1/4 [3]
19 Varieties of Democracy [V-Dem] database encompasses 201 countries over 1789-2017 (Coppedge et al., 2018). 20 Since all dimensions are considered indispensable, they are assigned equal weights (UNDP, 2010). Upper and lower bounds and maximum and minimum levels for life expectancy and years of schooling are those of footnote 19. In the case of per capita income, the upper and lower bounds, expressed in Geary-Khamis [G-K] 1990 dollars, $47,000 and $100, respectively. A ‘floor’ of $300 has been accepted. See the discussion in Prados de la Escosura (2021). 21 The income dimension has been derived using also expression [1] but with per capita GDP previously transformed into natural logs. The reason why per capita income enters the index at a declining rate is that it is aimed to represent command over resources to live a full, meaningful life so, in terms of capabilities, income returns diminish as its level raises. For a theoretical justification of the introduction of diminishing returns to income., cf. Zambrano (2014, 2017).
11
IV. Trends in Well-being Inequality
Is well-being inequality higher in the world today than it was in the late
nineteenth century? Can we distinguish different phases in its evolution? How does
the inequality of different well-being dimensions compare? What are their drivers?
The overview of the literature has shown that most studies address inequality
in social dimensions of well-being using their original values (and, occasionally, their
linear transformation) but this approach tends to bias the results favouring
convergence. Such spurious tendency is mitigated here, if not totally suppressed, by
resorting to Kakwani non-linear transformation of health and education dimensions
(Hobijn and Franses, 2001). Therefore, the results presented in this section should
provide a more accurate picture of trends in well-being inequality.
Alternative inequality measures, that differ in their sensitivity to different parts
of the distribution, can be adopted. Thus, among Atkinson class A(ε) indices (in which ε
represents an inequality aversion parameter) –with the larger ε, the more sensitive the
index to differences at the bottom of the distribution-, I have chosen an index with
ε=2. The Gini coefficient, more sensitive to the middle (mode) of the distribution, has
been also selected. Finally, among the entropy indices G(α), for which the more
positive (negative) α, the more sensitive the index to differences at the top (bottom) of
the distribution entropy, I have chosen G(0), which corresponds to Henri Theil’s (1967)
population weighted index, also known as Theil L or Mean Logarithmic Deviation
(MLD), that is more sensitive to the bottom of the distribution, and G(1), or Theil’s
income weighted index (Theil T, for short). more sensitive to the top of the
distribution. Entropy indices have the additional advantage of being perfectly
decomposable into between- and within-group inequality.
Two types of inequality estimates are presented here, inequality between
country averages in which all countries are given the same weight, regardless their
size, that is, Milanovic’s (2005) Inequality 1; and inequality between country averages
but weighted by countries’ size, so a large country counts more than a small one,
namely, Milanovic’s Inequality 2. The unweighted measure of inequality (Inequality 1)
allows for the fact that policies are implemented at country level and impact on its
citizens’ well-being. Besides, weighted measures (Inequality 2) are very sensitive to the

12
performance of highly populated countries. However, Inequality 2, although implicitly
assumes perfectly equal within-country distribution, does get us closer to a measure of
world distribution by assigning higher value to more populated countries (Milanovic,
2005: 7-8). Unfortunately, no data on within-country distribution of social dimensions
of well-being are available for such a large sample and time span.22
Does population-weighted international inequality (Inequality 2) provide a good
proxy for global inequality, that is, inequality among world inhabitants (Inequality 3)?
This would be the case if between-country inequality, rather than within-country
inequality, drives global inequality.23 Evidence on global inequality estimates both for
per capita income and education supports this hypothesis (see Section II). It will be,
then, assumed here that inter-country dispersion provides a lower bound measure of
global inequality.24
Different country samples have been used in the alternative inequality
estimates, for which the longer the time span, the narrower the spatial coverage. Thus,
over the entire time span, 1870-2015, 115 countries are considered, its number rising
up to 121, 146, 161, and 162 countries for the samples starting in 1913, 1950, 1980,
and 1990, respectively.25 The country samples represent above 90 per cent of the
world population. The results of these samples are highly coincidental so there has
been no need to splice them.
Let us now look at the international distribution of well-being dimensions over
time and compare it with that of per capita income.
Trends in Inequality 1 and 2
How is access to knowledge, proxied by the Kakwani index of schooling,
distributed internationally? High initial levels of inequality are observed for both
22 Clio Infra https://www.clio-infra.eu/ efforts to provide inequality measures for education and income fall short of the amount of data required in my estimates. 23 This assertion only applies in the context of perfectly decomposable entropy indices, such as MLD or Theil T, but for the Gini, the overlap component, which tends to evolve in opposite direction to between-country inequality, also matters (Milanovic, 2005: 25). 24 It could also be argued that the dispersion in social dimensions tends to be significant lower than in the case of income, namely, the longevity or education gap between the rich and the poor is less than proportional to their income gap. 25 Data sources and procedures are provided in Prados de la Escosura (2021). Country estimates for well-being dimensions examined here are accessible at http://espacioinvestiga.org/home-hihd/?lang=en.

13
unweighted and population-weighted measures in the late nineteenth and early
twentieth century, prior to the diffusion of mass primary education (Benavot and
Riddle, 1988; Lindert, 2004). Inequality fell steadily since 1900 across all measures but
for the Atkinson index that although initiated its decline in the 1930s, only experienced
a sharp contraction after 1970 (Inequality 1) and 1950 (Inequality 2). Inequality
decline was more intense in the case of unweighted entropy measures, the MLD, in
particular (Figures 1a and 1b). The level of inequality was, nonetheless, still high in the
third quarter of the twentieth century with a Gini of 0.45 as late as 1975 (Table 1).
Do the trends in schooling inequality obtained with the Kakwani transformation
match those derived on the basis of the original values by Morrisson and Murtin
(2013)? Inequality fell over time in Morrisson and Murtin’s estimates as it happens
when I replicate the measurement of inequality using original values of years of
schooling (Figure 2), and, as expected, the level of inequality is systematically lower
because bounded variables, when transformed linearly, exhibit a spurious tendency
towards convergence.
Living a long and healthy life is an essential dimension of well-being and how it
is distributed matters. Inequality trends in the Kakwani index of life expectancy,
derived using alternative unweighted measures, provide a common picture, although
more intense when computed by with entropy measures (Table 2). Main phases can be
observed in the evolution of life expectancy inequality: a rise from 1870 to 1925,
followed by a sustained fall until the early 1980s, that bounced partially back between
1990 and 2010, recovering, then, a declining trend. When we compare Inequality 1 and
2 (Figures 3a and 3b), we find that, for population-weighted inequality, the rise up to
the mid-1920s and the long-run contraction to 1980 were sharper, unlike the post-
2010 rebound. It is also noticeable a sharp and punctual reversal in 1960 that captures
the impact of China’s mortality increase during the Great Leap Forward famine (Meng
et al., 2015). This hints at the importance of large countries as illustrated by the
upsurge of Inequality 2 in 1960, not observable in Inequality 1.
How do inequality trends in life expectancy compare to those obtained by
previous studies? Bourguignon and Morrisson (2002) computed inequality 2 on the
basis of the original values of life expectancy at birth. However, as the comparison with

14
the Kakwani index shows, the level of inequality is underestimated and does not
capture the post-1990 reversal (Figure 4).
Unweighted and population-weighted inequality in political and civil liberties
exhibit different trends. In the case of Inequality 1, after increasing in the late
nineteenth century, a long-run decline took place since 1900, punctuated by reversals
in the Interwar years and, more intensively, in the 1970s and early 1980s (Figure 5a
and Table 3). These trends, common across all inequality measures, are more acute for
the MLD. If we turn now to Inequality 2, between 1870 and 1970, a rising trend is
observed for the MLD and Atkinson measures, more sensitive to the bottom of the
distribution, while remained practically unaltered for the Gini and Theil, more sensitive
to the top and the middle of the distribution, only broken by the decline between 1900
and the break of World War I (Figure 5b). A fall in inequality took place across the
board between 1970 and 2010, followed by a mild reversal in the 2010s.
Since the different well-being dimensions discussed exhibit contradictory
trends, a look at the international distribution of a composite measure such as the
Augmented Human Development Index (AHDI) seems warranted (Prados de la
Escosura, 2021). Unweighted inequality in terms of augmented human development
increased up to 1890 and followed, then, a steady long-run decline but for a reversal in
the aftermath of World War I and stagnation in the early 1970s (Table 4 and Figure 6a).
If we now turn to population-weighted inequality, we find a declining trend that was
reversed in the aftermath of the World Wars (Figure 6b).
Given the multiplicative composition of the augmented human development
index (expression 3), when measured with an entropy index, a breakdown of human
development inequality can be performed into within-inequality of its dimensions,
namely, the equally weighted sum of each components’ inequality -life expectancy (E),
years of schooling (S), adjusted income (Y), political and civil liberties (L)-, plus a
residual (R), that accounts for the disparities between AHD dimensions (Martínez,
2016: 417-418).
MLDahd = 1/4 MLDE + 1/4 MLDS + 1/4 MLDY + 1/4 MLDL+ R [4]
It can be observed that the level of augmented human development inequality
depended chiefly on the distribution of education up to World War II, and on that of

15
civil and political liberties thereafter, while longevity contributed to raising inequality
up to the mid-1920s (Figure 7 and Table 5).26
But how do international inequality trends in well-being compare to those in
GDP per head for the same country sample? If we first delve into unweighted
measures, a long-run increase in per capita income inequality took place. Up to 2000
for those indices sensitive to changes at the bottom of the distribution (MLD and
Atkinson), but peaking in 1950 for the Gini and the Theil T, which, then, shrank to two-
thirds of the peak level by the mid-1980s (Figure 8a and Table 6). The sharp increase in
inequality between the end of the Great Depression and 1950 reflects the uneven
impact of World War II across countries. A generalised contraction occurred after
2000. In the case of population-weighted inequality, a sustained rise up to early 1970s
took place, but for the Theil T that peaked in 1990, only punctuated by a severe
contraction during the Great Depression (Figure 8b). Inequality declined across the
board since the late twentieth century. Thus, distinctive pattern of international
distribution emerge for multidimensional well-being and GDP per head.
The Role of Large Countries
How much do large countries condition the level and trends of population-
weighted inequality? For each well-being dimension I have simulated inequality in the
absence of China and India, then, Russia, and, finally, Sub-Saharan Africa, that is, I have
estimated inequality assuming that these regions would have behaved as the average.
If, in the absence of a given region, inequality is higher (lower) than when all regions
are considered, we can claim that such region contributed to reducing (increasing) the
level of inequality.
It appears that, in terms of schooling, China and India contributed to lower
world inequality levels around 1900 and from 1970 onwards (Figure 9 and Table 7).
Russia helped reducing inequality until the 1960s. And Sub Saharan Africa contributed
to a higher level of inequality over time, specially during the first half of the twentieth
century as post-independence education policies mitigated the schooling gap with the
rest of the world.
26 Martínez (2016) found that education was its main driver in the UNDP HDI that, as discussed, exclude the freedom dimension.

16
Up to the 1920s, India and China made a significant contribution to the rise of
life expectancy inequality, while Russia mitigated it (Figure 10 and Table 8). The high
mortality in China during Mao’s Great Leap Forward accounts for the dramatic
inequality increase in 1960. Since 1970, however, China and India have contributed to
reducing inequality. Conversely, Sub-Saharan Africa increased it from the mid-1960s
onwards.
India and China contributed to raising inequality in civil and political liberties
distribution during the late nineteenth century and since 1950, but for the early 1980s,
while helped reducing it in the Interwar years (Figure 11 and Table 9). Russia
contributed to increasing inequality during the Soviet era (1917-1989). And Sub
Saharan Africa had no influence on either the level or trend of inequality.
Lastly, in terms of augmented human development, China and India
contributed to raising the level of inequality in the early twentieth century and to
reducing it since the 1970s. Conversely Russia mitigated inequality up to the early
1970s, especially until the 1920s (Figure 12 and Table 10). And Sub Saharan Africa
contributed to increasing inequality in the long run.
If we now turn to the international distribution of per capita income, China and
India contributed significantly to a higher level of inequality until 1990 and to its
reduction thereafter. Conversely, Russia helped reducing inequality until the 1990s and
Sub-Saharan Africa played a part in raising inequality since the mid-1980s (Figure 13
and Table 11). Again, substantial discrepancies are found in the contribution of large
countries or regions to inequality between multidimensional well-being and GDP per
head.
Drivers of Inequality 2
What drove inequality? Was it the gap between advanced or OECD countries27
and the Rest of the world, or the dispersion within each of these two groups? MLD
allows us to carry out this breakdown of aggregate inequality 2.
27 Advanced countries comprise here those belonging to the OECD prior to its enlargement in 1994 (OECD, for short, or the West, as this group of countries is indistinctively labelled throughout the paper). In this paper, countries under the label OECD, or the West, coincide largely with the membership of the Organisation for Economic Co-operation and Development (OECD) up to 1994: Western Europe, its 'Western Offshoots', and Japan. Western Europe includes Austria, Belgium, Denmark, Finland, France, Germany, Greece, Ireland, Italy, the Netherlands, Norway, Portugal, Spain, Sweden, Switzerland and the United Kingdom. Three OECD members are excluded: Iceland and Luxemburg are left out for lack of

17
In the case of schooling, the level of inequality depended to a larger extent on
the gap between the OECD and the Rest up to 1930, and the dispersion within each
group dominated hereafter. However, inequality trends were driven by the dispersion
within the OECD and the Rest and, more specifically, by latter’s (Figure 14 and Table
12).
Similarly, in terms of life expectancy the gap between the OECD and the Rest
made the largest contribution to total inequality up to World War II; and within group
inequality became its main contributor from 1950 onwards (Figure 15). However, the
dispersion within OECD and the Rest drove inequality rising trends up to the 1920s and
after 1990 (mostly the dispersion within the Rest) while the reduction in the gap
between the West and the Rest steered the inequality decline between the late 1920s
and 1970 (Table 13).
When we turn to political and civil liberties, the gap between the OECD and the
Rest accounts for most inequality until World War I, and the dispersion within groups,
in particular, within the Rest, explain inequality levels from 1930 onwards (Figure 16
and Table 14). Nonetheless, within groups dispersion mainly drives inequality trends.
In terms of augmented human development, the OECD-Rest gap made the
largest contribution to the level and trend of international inequality up to the 1980s,
when within group inequality took over (Figure 17 and Table 15).
Lastly, the gap between the OECD and the Rest was the main contributor to the
aggregate level of inequality in terms of GDP per head until 1950 and, then, within-
group dispersion took over. The dispersion within the two groups, OECD and the Rest,
mainly the latter’s, accounts for inequality trends over 1930-2000 (Figures 18 and
Table 16).
Thus, the role played by the OECD-Rest gap driving the level of inequality up to
roughly the early twentieth century appears as a common feature of both
multidimensional well-being and per capita GDP, but no coincidence exists about the
driver of inequality trends.
human development estimates; Turkey is counted with Asia in order to reduce group heterogeneity in terms of development. 'Western Offshoots' consists of Australia, Canada, New Zealand and the United States.

18
Relative and Absolute Inequality
So far, the discussion has dealt with inequality in relative terms. This means
that international inequality depends on countries’ ratios to the international mean,
that is, on proportionate differences. The implication is that inequality does not alter
if, for example, the number of years of schooling changes by the same proportion
around the globe. However, if such a global change does occur it could widen its
absolute differences. For this reason, absolute inequality which depends on the
distance or gap between countries’ levels, is sometimes the preferred measure.28
Figure 19 allows us to compare schooling relative and absolute inequality (the
dotted line). While relative inequality declined steadily but for post-World War I
reversal, in absolute terms inequality rose up to 1970 and only fell since the 1980s.
In the case of life expectancy, absolute inequality rose substantially in three
different periods: up to mid-1920s, during the 1950s to peak in 1960, and between
1990 and 2010, and relative inequality increased up to the mid-1920s and declined
from then to the early 1980s, only bouncing back in 1960, and remaining roughly the
level of absolute inequality in the 2010s was stable thereafter but for a minor recovery
during 1990-2010 (Figure 20). As a result, comparable to that of the 1920s.
In terms of political and civil liberties, the rising trend in relative and absolute
inequality is highly coincidental until 1970, but stronger in absolute terms (Figure 21).
However, while inequality contracted in relative terms during the last half a century, in
absolute terms, after a small reduction in the early 1970s, it flattened and only fell
between the mid-1990s and 2010.
Absolute inequality raised until 1960 and, then, declined, for augmented
human development, unlike the long run contraction since the late 1920s, in relative
terms (Figure 22).
Relative and absolute inequality in per capita GDP increased in the long run but
while the rise of relative inequality peaked by the mid-1970s and fell since 1990,
absolute inequality kept rising until 2000 and, then, stabilised at a high level (Figure
23).
28 The absolute inequality measure is derived as the mean value times the relative inequality measure. Cf. Anand and Segal, (2000: 96-97).

19
Once more, discrepancies emerge between multidimensional well-being and
GDP per head. Both in relative and absolute terms per capita inequality was higher in
2015 than in 1870, but in terms of multidimensional well-being, only absolute
inequality was higher.
V. The Distribution of Well-being Gains
So much for the aggregate evolution of inequality, but how much did well-being
vary across the distribution over time? The annual cumulative growth rate by country
deciles, from bottom to top, namely, the Growth Incidence Curve (GIC), provides a
nuanced picture of the distribution of gains for each well-being dimension over 1870-
2015.
In the case of schooling it can be observed (Figure 24) that, in the long run, the
lower deciles (percentiles 10th-25th) experienced the main relative gains (the
continuous line), while those above percentile 85th received the smallest gains. The
more than proportional improvement over time in low schooling countries is
consistent with the reduction in relative inequality discussed above. However, a glance
at the absolute gain achieved by each decile (the dotted line) offers the mirror image.
Deciles in the middle of the distribution obtained larger absolute gains than those at
the bottom, but still smaller than the top deciles. In other words, the gap or distance
between high and low schooling countries widened over time. In particular, absolute
gains were significantly larger for countries in the top 5 per cent. Between 1870 and
2015, low-level countries in terms of schooling (those in the 10th-25th percentiles) grew
above 3 per cent per year, while those in the top 5 per cent did it at 1 per cent;
however, the absolute level gain of the bottom countries was 0.2, while the top 10 per
cent secured 0.6.
A look at the growth incidence curves for the main phases in the evolution of
well-being reveals which parts of the distribution experienced larger relative gains in
schooling (measured as annual cumulative growth rates over each of the five periods
distinguished). Thus, the lower part of the distribution, more specifically, countries
below percentile 25th, achieved the largest relative gains during 1870-1913, a feature
consistent with a contraction from a high initial level of inequality (Figure 25). The
early twentieth century (1913-50) reinforced this tendency. The Golden Age (1950-70)
represented major gains for the lower part of the distribution, especially the lower

20
middle deciles and percentile 5th. In the post-oil shock decades (1970-1990), the main
gains went to the lower and middle deciles. Lastly, during 1990-2015, the main gains
were attributed to lower part of the distribution (percentiles 10th-25th). In a nutshell,
relative gains were larger at the bottom and, then, at the middle class, a result that
matches the long-run contraction in schooling inequality across countries.
The progress of life expectancy across the distribution shows (Figure 26) that,
over 1870-2015, the middle class (percentiles 45th-60th) experienced the main relative
gains (continuous line), followed by the lower-middle deciles, and the smallest gains
accrued to those above percentile 80th. However, in absolute terms, the largest gain
went to countries in the top 20 cent, especially those in the top 1%. The upper middle
deciles were next, and those below the 40th percentile received the smallest gains. As
in the case of schooling, the distance broadened between high and low level countries.
Thus, in the long run, middle countries (those in percentiles 45th-60th) grew above 2
per cent per year and those in the top two deciles below 1.5 per cent; but the absolute
level gain for the bottom countries was below 0.3 and above 0.8 for the top 1 per cent.
A closer look at the GICs of the main phases indicates that the upper half of the
distribution achieved the main relative gains during 1870-1913, a feature consistent
with the persistence of high inequality (Figure 27). The early twentieth century
upturned the tendency with the main gains accruing to the lower part of the
distribution and, next, to upper middle deciles. The Golden Age (1950-70) represented
a major upward push to the middle class (percentiles 35th-55th) gains. After the Golden
Age, relative gains were milder and more smoothly distributed. In the period 1970-
1990 the largest gains went to the lower part of the distribution and, since 1990, gains
were rather evenly distributed with the top 5 per cent improving comparatively. To
sum up, relative large gains took place at the bottom and the middle of the distribution
between the 1920s and 1970.
In the case of political and civil liberties, relative gains over the long run were
concentrated in the broad middle part of the distribution (percentiles 25th-75th) at the
expense of those countries at the bottom and the top of the distribution (Figure 28). In
absolute terms, however, the largest gains went to upper part of the distribution,
especially accruing to the top two deciles. Thus, absolute differences widened across
the distribution.

21
If we turn now to the GICs for the main phases, we observe that countries in
the lower middle deciles achieved the largest relative gains during the first
globalisation 1870-1913 (Figure 29). This trend was inverted in the early twentieth
century and the upper half of the distribution, in particular, the upper middle deciles,
obtained the largest improvement. The gains of the upper middle class were
reinforced during the Golden Age (1950-70). However, in the following two decades,
the middle and lower sections of the distribution achieved larger gains and the post-
1990 era witnessed a major leap forward for the lower middle deciles. Hence, a
process of catching up appear to have occurred in the lower half of the distribution
since 1970.
How countries behaved across the distribution over the long run in terms of
augmented human development? The main relative gains accrued to the lower half of
the distribution, especially to the middle deciles (45th-60th) (the continuous line)
(Figure 30). However, the absolute gains (the dotted line) were directly related to the
initial country levels, with those in the top 10 per cent getting the largest ones. Thus,
while the more than proportional improvement in the middle deciles, that grew at
double the pace than those in the top decile, is consistent with the reduction in
relative AHD inequality, the distance between high and low AHD countries widened
over this period, and the top 10 per cent absolute level gain was near 0.6 against less
than 0.2 for the bottom decile.
A glance at the GICs for different periods reveals that middle-upper part of the
distribution (percentiles 60th-80th) achieved the main relative gains during 1870-1913,
a feature that matches the rising aggregate inequality (Figure 31). The early twentieth
century witnessed the success of the “middle class” (percentiles 40th-55th). Although
the largest relative gains went to the lower part of the distribution (percentiles 10th-
25th), the middle “class” was also reinforced during the Golden Age (1950-1970). In the
post-Golden Age decades more than proportional improvements for the lower deciles
were paralleled by gains in the upper-middle deciles. Differences across the
distribution smoothed since 1990, although the middle deciles were the main
achievers. Thus, the inverse association between relative gains and initial AHD levels
observed for all phases, but the first one (1870-1913), is consistent with the sustained
decline in aggregate relative inequality since the 1920s.

22
How do gains were distributed across the distribution for GDP per head? As for
life expectancy and liberal democracy, the bottom two deciles also achieved the
lowest relative gains. The middle (percentiles 45th-65th) and the top of the distribution
(percentiles 90th-95th) experienced the main relative gains (the continuous line) (Figure
32). The distribution was similar in absolute terms (dotted line) but for the fact that
largest gains went to the top 10 per cent decile.
If the GICs for the main phases are considered, one finds that the upper part of
the distribution achieved the main relative gains during 1870-1913 (Figure 33). The
early twentieth century reinforced this tendency but gains were larger for the top 10
per cent. After a relatively smoothed distribution of relative gains, substantial
differences across deciles emerged from 1950 onwards. During the Golden Age the
bottom and the upper middle deciles were the main achievers. In the years 1970-1990,
the largest relative gains were achieved by the lower part of the distribution and, next,
by the top 15 per cent. Lastly, over 1990-2015, major gains accrued to the middle and,
then, the lower middle deciles.
A substantial difference between multidimensional well-being and per capita
GDP growth incidence curves is that, in the former, relative gains over the 150 years
considered went to the middle and lower deciles of the distribution, and to the middle
and top deciles in the latter. Discrepancies also emerge for the main phases
considered, specifically, the skewed distribution of per capita income gains towards
the upper part of the distribution during 1914-1970, although matches that of civil and
political liberties, is at odds with schooling and life expectancy, as well as with
augmented human development, in which the middle and lower deciles experienced
the largest gains.
VI. Accounting for Inequality Trends in Well-being
But why did the international distribution in terms of well-being and per capita
income differ? It is often assumed that improvements in life expectancy, schooling,
and civil and political rights are associated, either as a cause or as a consequence of, to
raising average incomes. If this is so, how can their inequality trends be so different? A
glance at the evolution of well-being dimensions may help us understand why.

23
Schooling
Mass primary education initiated in Europe during the 1870s. Schooling moved
from private and decentralised (local or religious) to compulsory and centralised as a
result of public intervention, although the speed and breadth of the process varied
substantially across countries during the late nineteenth and early twentieth century
(Ansell and Lindvall, 2013).
But why did such a change happen? John Meyer et al. (1992: 129, 132) claimed
that mass education was at the core of the nation-state model and represented a
project of the elites involving socialisation of individuals, extension of citizenship, and a
secular vision of progress. Schooling was, thus, an instrument to spread the values of
the elite to the rest of the population (Alesina, Giuliano, and Reich, 2020).
Centralisation and secularisation, carried out in both democracies and
dictatorships, played a major role in the expansion of mass primary education (Ansell
and Lindvall, 2013: 506). The tension between central and local governments, secular
and religious authorities conditioned the pace at which mass primary education
spread.
The diffusion of mass education to the rest of the world would have resulted
from “the spread of the Western system, with its joined principles of national
citizenship and state authority” (Meyer et al. (1992: 146). After World War II the newly
independent countries in Asia and Africa would adopt the education policies earlier
implemented in the metropolis. The Cold War and international cooperation
contributed to accelerating the spread of mass primary and secondary schooling. This
acceleration is clearly noticeable in the Kakwani index of schooling (Figure 34).
A number of non-excluding elements account for the spread of schooling:
industrialisation (that required skills), war (helped by indoctrination and mass
provision of public goods to motivate conscripted armies), and redistribution (Gellner,
1983; Aghion et al., 2019; Alesina, Reich, and Riboni, 2020; Darden and Mylonas, 2015;
Manzano, 2017).
Homogenising population to forge a national identity through a common
national language and mass public instruction, often imposed on the population and
helped by compulsory military conscription, appears as a distinctive driving force
behind mass schooling (Alesina, Giuliano, and Reich, 2020). In immigration and newly

24
independent countries schooling was crucial in nation-building. Oriana Bandiera et al.
(2018: 66) show that U.S. schooling laws were designed “to instil civic values to the
culturally diverse migrants” during the Age of Mass Migration (1850-1914). Similarly in
Argentina public primary schooling in Spanish was a tool for nation-building during the
massive Italian immigration (Botana and Gallo, 1997).
Democratization has been considered responsible for the spread of education.
Peter Lindert (2004), for example, established a connection between the expansion of
primary mass schooling and democratization on the basis of some Western countries’
experience. Agustina Paglayan (2021) qualifies this argument by pointing out that
democratization only promotes the expansion of primary schooling when a majority of
the population lacked access to primary schooling before democracy emerged, an
infrequent historical situation. Most state education systems were established ahead
of it to homogenise population. In fact, elites perceived democratization as a threat to
their power (Alesina, Giulano, and Reich, 2020). The discrepancies observed in the
international distribution of schooling and liberal democracy over the long run,
declining steadily in the case of schooling and rising in the case of liberal democracy
until the late twentieth century, contradict the hypothesis of a connection between
the spread of democratization and schooling.
Other external developments affected the spread of mass education. Mariko
Klasing and Petros Milionis (2020) claim that the epidemiological transition, by
improving relative female life expectancy, due to the better response of the female
immune system to vaccination against infectious diseases, contributed to rising female
education and reducing the education gender gap. Thus, it can be hypothesised that,
as longer and healthier lives prompt individuals to invest on their education (Hansen,
2013), women’s higher education attainment may have contributed not only to raising
the average level of schooling but also to lowering the dispersion of schooling levels
across countries. The fact that inequality 2 for both schooling and life expectancy,
moved together between the 1920s and the 1970s, the phase of international diffusion
of the epidemiological transition, supports the conjecture. Furthermore, the second
health transition, with increases in life expectancy as a result of major improvements
in the treatment of cardiovascular and respiratory diseases, had also the consequence
of increasing enrolment in higher education (Hansen and Strulik, 2017).

25
Life Expectancy
What drives life expectancy’s international distribution? The epidemiological
transition helps explain the observed tendencies in the international distribution of life
expectancy distribution. The epidemiological or health transition represents a long
phase in which persistent gains in lower mortality and higher survival are achieved as
infectious disease gives way to chronic disease as the main cause of death (Omran,
1971, 1998; Riley, 2001). The epidemiological transition is associated to the diffusion
of the germ theory of disease since the 1880s (Preston, 1975) that led to the
introduction of new vaccines from the 1890s. Moreover, medical technological
progress introduced new drugs to cure infectious diseases -sulpha drugs since the late
1930s (Easterlin 1999) and antibiotics since the 1950s-, contributing to spread the
health transition (Easterlin, 1999; Jayachandran et al., 2010; Lindgren, 2016). However,
a less noticed result of the epidemiological transition consisted of improvements in
public health –often at low cost, because low incomes prevented the purchase of the
new drugs- and the diffusion of preventive methods of disease transmission and
knowledge dissemination through school education contributed to reducing infant
mortality and maternal death, two major determinants of the increase in life
expectancy at birth in developing regions (Riley, 2001).
Thus, unlike the widespread view that associates the health transition to the
diffusion of new drugs and, therefore, dates its beginning after the 1940s (Acemoglu
and Johnson, 2007; Klasing and Milionis, 2020), the diffusion of the epidemiological
transition in world regions without the purchasing power to access the new drugs
started much earlier with the prevention of infectious disease. Widespread gains in
longevity during the globalisation backlash (1914-1950), a time of economic distress,
are, hence, linked to the germ theory of disease.
The substantial achievements in longevity during the epidemiological transition,
observable in the Kakwani index of life expectancy (Figure 35), were not shared equally
across countries. Lack of economic means and basic scientific knowledge prevented a
fast and wide diffusion of new medical technology and health practice across
countries. Thus, in the late nineteenth and early twentieth century, the increase in life
expectancy inequality can be associated to the fact that the first health transition was
unevenly distributed and initially restricted to advanced western countries.

26
The gradual international diffusion of the health transition favoured the
reduction in life expectancy inequality between the late 1920s and 1980. The
inequality contraction was particularly intense during the 1930s and 1940s, when life
expectancy improved in countries of low per capita income levels as a consequence of
the epidemiological transition, just at a time of stagnant or declining average incomes
and growing income disparities across countries resulting from the Great Depression
and World War II (Mandle, 1970; Reher, 2003; Riley, 2005).
The reversal in life expectancy inequality, with an increase after 1990 may be
associated, not just to the impact of HIV-AIDS in Sub Saharan Africa, or to the demise
of socialism in Eastern Europe, but also to a second health transition that, so far, has
been restricted to the West. In this new transition, mortality and morbidity fall among
the elderly as a result of new medical knowledge that has permitted a better
treatment of respiratory and cardiovascular disease and vision problems (particularly,
cataract surgery) (Cutler et al., 2006; Chernew et al., 2016; Eggleston and Fuchs, 2012).
The rise in longevity has also been helped by better nutrition in early years of life. The
result is people living not just longer life but longer healthy life years (Mathers et al.,
2001; Murray and Lopez, 1997; Salomon et al., 2012).29
To sum up, episodes of rising international inequality in life expectancy in the
late nineteenth and early twentieth century and, then, in the late twentieth and early
twentieth-first century, coincide with the early stages of two health transitions and
result from the uneven diffusion of new medical knowledge and technology and health
practices.
Political and civil liberties
Finally, what drives the spread of civil and political rights? Over the last sixty
years, Seymour Lipset’s theory of political modernisation, namely, that economic
development brings democracy with it, has been at the centre of debate about
29 Politics may have also contributed to shape inequality trends. It has been argued that autocracies successfully fought mortality through government intervention during the first health transition, but democracies facilitated the new health transition with fewer constraints on medical innovation, so gains in life expectancy have been larger in democratic than in authoritarian countries since the late twentieth century (Devereux, 2010; Mackenbach, 2013).

27
democratic transitions and democracy stability.30 For example, Daron Acemoglu et al.
(2008, 2009) accept the income-democratization correlation but reject a causal effect
of income on democracy. And Carles Boix (2011) proposes a conditional version of
Lipset’s theory in which the association between democratization and GDP per head
exhibits diminishing returns to income. Moreover, the relationship shifts outwards
over time.
Different explanations have been proposed for the introduction and spread of
democracy in a country. Ruth Collier (1999) stresses the role played by the elite in the
first democratization wave up to the early twentieth century. Acemoglu and James
Robinson (2006: 27) consider, instead, that the threat of a revolution in a context of
high inequality stimulates democratization, which implies “a commitment to future
pro-majority policies by the elites”. Boix (2003), claims, however, that only in a context
of declining inequality and economic diversification the elite would accept
democratization, as the redistribution threat diminishes. The spread of democracy is
also associated to international conflict and war exposure (Knutsen et al., 2019). For
example, a trade-off has been suggested between the extension of suffrage and mass
conscription (Ticchi and Vindigni, 2008).
Sharun Mukand and Dani Rodrik (2020) trace a sequence in which the three
dimensions of liberal democracy: property, political, and civil rights interplay, from
autocracy, under which only property rights were respected, to liberal democracy, in
which the three types of rights are recognised usually in a context of mild inequality
and social homogeneity, with intermediate stages of liberal autocracy, in which
property and civil rights but not electoral rights were acknowledged, and illiberal
democracy, in which civil rights are absent.31 How this sequence evolves has differed
over space and time and accounts for the level of liberal democracy and its distribution
over the last one-and-a-half-centuries.
30 (Lipset, 1959: 80) sustained that “the factors subsumed under economic development [industrialization, urbanization, wealth, and education] carry with it the political correlate of democracy”. 31 Mukand and Rodrik’s “illiberal” democracy brings back to the conflict Classical liberals observed between democracy, which focuses on who exercises the power, and liberty, which sets the limits of power (Rodríguez Braun, 2010).

28
The time dimension of democratization defines another stream of the literature
that approaches the spread of liberal democracy as a global process that transcends
national boundaries and is subjected to geopolitical events. The world trends observed
in liberal democracy, with three expansion phases: up to the early 1920s, during the
aftermath of World War II and until the early 1960s, and from the late 1980s onwards,
and their reversals (Figure 36), resemble closely the evolution of the share of
democratic countries in the world (Boix, 2011: 810) and broadly conform to Samuel
Huntington’s (1990) waves of democratization. The swift diffusion of democracy in the
early 1920s, late 1940s and early 1950s, and the 1990s, and their setbacks, closely
match major international events.32 Such coincidence lends support to the decisive
role of the great powers in shaping the international order and interfering with
countries’ internal politics (Boix, 2011; Narizny, 2012). Although the diffusion of ideas
(liberalism, equality, human rights) also played an significant part in the spread of
democratization from the early nineteenth century (Collier, 1999; Mukand and Rodrik,
2020).
Well-being Levels and Distribution
But how does the distribution of well-being dimensions compare to their
levels? I have plotted scattered diagrams, using a bivariate kernel linear fit, of
inequality (MLD) against levels for each dimension. In schooling the fit is a convex line
with negative slope which implies that the improvement in education was gradually
shared by the world population (Figure 37).
In the case of life expectancy, the fit represents an inverted U shape at low
levels, which peaked at MLD 0.30 and corresponded to a Kakwani index of 0.05, that is,
32.3 years of life expectancy at birth, and gives way to a long downside until a low
inequality level (MLD 0.066) at a Kakwani index of 0.275, equivalent to 64.4 years of
life expectancy at birth (Figure 38). Hereafter, inequality fluctuated trendless, but for a
minor rebound, as life expectancy continued to rise. The uneven diffusion of the
epidemiological or first transition would account for the initial rise of inequality, and its
gradual diffusion across the globe would explain its decline. Furthermore, one could
32 Namely, the breakdown of Austria-Hungary and Russia’s empires, the rise of fascism and Nazism in the Interwar and its defeat in World War II, the subsequent demise of colonial empires and the Cold War, and the collapse of the Soviet Union.
29
suggest that the rebound in the right tail of the curve (at a value of 0.328 for the
Kakwani index) corresponds to the uneven diffusion of the second health transition
(Cutler et al. 2006) as well as to the effects of HIV-AIDS in Sub Saharan Africa and the
demise of socialism in Eastern Europe. However, it seems a short-lived episode offset
by the recovery of life expectancy in Sub Saharan Africa and former socialist Europe.
As regards political and civil liberties, the association follows an inverted U
shape, with an upside starting from a low level (0.150) but relatively high inequality
(MLD 0.5) to peak and stabilise in a high inequality plateau (MLD 0.72), associated to a
0.225-0.255 range of the index of liberal democracy, followed by a sharp downside to
(MLD 0.37) and an index level of 0.4 (Figure 39). Inequality increased as civil and
political rights spread in parallel to the emergence of authoritarian and totalitarian
ideologies. The downside matches the collapse of the Soviet Union and the retreat of
socialism and the decline of right-wing authoritarian regimes in the world.
If we look now at well-being in aggregate terms, an inverted hockey stick shape,
defined by a long declining straight line, after a short upward trend, represents the
association between the inequality and the level of augmented human development,
moving from high inequality at low AHD level and to low inequality high AHD level
Figure 40).
How do these results compare to those for GDP per head? The association
between inequality and the log of per capita income (to account for its unbound
nature) shows a long upside until an inequality peak of MLD 0.61, that corresponds to
Geary-Khamis 1990$ 4,570 per capita GDP, and a short but sharp downside with
inequality still high (MLD 0.38) at the maximum average income level of the
considered time span (1990$ 8,287) (Figure 41). These findings suggests that while for
augmented human development, or its health and education dimensions,
improvements in average levels were increasingly shared by world population, in the
case of GDP per head, material progress did not easily disseminate through the world
distribution. The analogy with the case of civil and political liberties that also exhibits a
Kuznets curve presents, nonetheless, a significant difference: the downside begins at
middle levels and reaches the lowest inequality, but in terms of per capita GDP the

30
downside only takes place at relatively high levels and the inequality reversal is far
from complete.
VII. Concluding Remarks
The study of the international distribution of well-being remains focused on
income. In this paper long-run inequality is approached from a multidimensional
perspective. Well-being distribution presents different patterns across its dimensions.
Population-weighted inequality fell steadily since the 1920s in terms of schooling and
concentrated its decline between the late 1920s and the early 1980s in terms of life
expectancy, but increased overtime in the case of political and civil rights to decline
only after 1970. Augmented human development, a comprehensive measure of well-
being, experienced a long term decline since the early twentieth century. Its inequality
level depended chiefly on education up to World War II and on civil and political
liberties, thereafter.
Inequality across well-being dimensions was driven by the gap between the
OECD and the Rest until early twentieth century when the dispersion within each
group, the Rest in particular, increasingly drove it. Countries in the middle and lower
deciles achieved the largest relative gain over the last century.
The spread of mass education, largely a result of governmental intervention,
accounted for the long-term decline in schooling inequality. And the diffusion of the
health transition drove life expectancy inequality. The emergence of authoritarian and
totalitarian ideologies explained the dispersion of political and civil liberties between
the end of World War I and the collapse of the Soviet Union. The distribution of well-
being over time is, thus, at odds with that of per capita GDP.
31
References
Acemoglu, D. and S. Johnson (2007), “Disease and Development: The Effects of Life Expectancy on Economic Growth,” Journal of Political Economy 115: 925-985.
Acemoglu, D., S. Johnson, J.A. Robinson, and P. Yared (2008), “Income and Democracy”, American Economic Review 98: 808–842.
Acemoglu, D., S. Johnson, J. A. Robinson, and P. Yared (2009), “Reevaluating the Modernization Hypothesis”, Journal of Monetary Economics 56: 1043–1058.
Acemoglu, D. and J.A. Robinson (2006), Economic Origins of Dictatorship and Democracy, New York: Cambridge University Press.
Aghion, P., X. Jaravel, T. Persson, and D. Rouzet (2019), “Education and Military Rivalry”, Journal of the European Economic Association 17(2): 376-412.
Alesina, A., P. Giuliano, and B. Reich (2020), Nation-Building and Education: Theory and Evidence, NBER Working Paper No. 18839 (revised).
Alesina, A., B. Reich, and A. Riboni (2020), Nation-Building, Nationalism, and Wars, CEPR Discussion Paper 15561.
Altinok, N., N. Angrist, and H.A. Patrinos (2018), Global Data Set on Education Quality (1965-2015), World Bank Policy Research Working Paper 8314.
Anand, S. and A. Sen (2000), “The Income Component of the Human Development Index,” Journal of Human Development 1: 83-106.
Anand, S. and P. Segal, P. (2008), “What Do We Know About Global Income Inequality?”, Journal of Economic Literature 46 (1): 57–94.
Anand, S. and P. Segal, P. (2015), “The Global Distribution of Income”, in A. Atkinson and F. Bourguignon (eds.), Handbook of Income Distribution, Volume 2A, Amsterdam: Elsevier, pp. 937-979.
Ansell, B. and J. Lindvall (2013), “The Political Origins of Primary Education Systems: Ideology, Institutions, and Interdenominational Conflict in an Era of Nation-Building”, American Political Science Review 107 (3): 505-522.
Atkinson, A.B. and A. Brandolini (2010), “On Analysing the World Distribution of Income”, World Bank Economic Review 24 (1): 1–37.
Bandiera, O. M. Mohnen, I. Rasul and M. Viarengo (2018), “Nation-Building through Compulsory Schooling During the Age of Mass Migration”, Economic Journal 129: 62-109.
Becker, G. S., T.J. Philipson, and R.R. Soares (2005), “The Quantity and Quality of Life and the evolution of world inequality”, American Economic Review 95 (1): 277–291
Beltrán-Sánchez H., M.P. Jiménez, and S.V. Subramanian (2016), “Assessing Morbidity Compression in Two Cohorts from the Health and Retirement Study”, Journal of Epidemiology and Community Health 70 (10): 1011–1016
Benavot, A. and P. Riddle (1988), “The Expansion of Primary Education, 1870-1940: Trends and Issues,” Sociology of Education 61: 191-210.
Berry, A., F. Bourguignon and C. Morrisson (1983), “Changes in the World Distribution between 1950 and 1977”, Economic Journal 93 (37): 331-350
Bleakley, H. (2007), “Disease and Development: Evidence from Hookworm Eradication in the American South,” Quarterly Journal of Economics 122: 73-117.
Bleakley, H. (2010), “Malaria Eradication in the Americas: A Retrospective Analysis of Childhood Exposure”, American Economic Journal: Applied Economics 2: 1-45.
Boix, C. (2003), Democracy and Redistribution, New York: Cambridge University Press.

32
Boix, C. (2011), “Democracy, Development, and the International System”, American Political Science Review 105(4): 809-828.
Botana, N. and E. Gallo (1997), De la Republica Posible a la Republica Verdadera: 1880-1910, Buenos Aires: Ariel.
Bourguignon, F. and C. Morrisson (2002), “Inequality among World Citizens”, American Economic Review 92, 4: 727-744.
Chernew, M., D.M. Cutler, K. Gosh, and M.B. Landrum (2016), Understanding the Improvement in Disability Free Life Expectancy in the U.S. Elderly Population, NBER Working Paper Series 22306.
Clark, A.E. (2018), “Four Decades of the Economics of Happiness: Where Next?”, Review of Income and Wealth 64(2): 245-269.
Clark, R. (2011), “World Health Inequality: Convergence, Divergence, and Development”, Social Science & Medicine 72 (4): 617-624.
Clio Infra https://www.clio-infra.eu/ Coppedge, M., J. Gerring, C.H. Knutsen, S.I. Lindberg, S.-E. Skaaning, J. Teorell, D. Altman, M.
Bernhard, M.S. Fish, A. Cornell, S. Dahlum, H. Gjerløw, A. Glynn, A. Hicken, J. Krusell, A. Lührmann, K.L. Marquardt, K. McMann, V. Mechkova, J. Medzihorsky, M. Olin, P. Paxton, D. Pemstein, J. Pernes, J. von Römer, B. Seim, R. Sigman, J. Staton, N. Stepanova, A. Sundström, E. Tzelgov, Y. Wang, T. Wig, S. Wilson, and D. Ziblatt (2018) V-Dem [Country-Year/Country-Date] Dataset v8, Varieties of Democracy (V-Dem) Project, https://doi.org/10.23696/vdemcy18 (Accessed on 4 May 2019).
Collier, R.B. (1999), Paths Towards Democracy, Cambridge: Cambridge University Press. Cornia, G.A. and L. Menchini (2006), Health improvements and Health Inequality during the
Last 40 Years, UNU-WIDER Research Paper 2006/10. Cutler, D.M., A. Deaton and A. Lleras-Muney (2006), “The Determinants of Mortality”, Journal
of Economic Perspectives 20: 97-120. Cutler, D.M., K. Ghosh, and M.B. Landrum (2014), Evidence for Significant Compression of
Morbidity In the Elderly U.S. Population, in D.A. Wise (ed.), Discoveries in the Economics of Aging, University of Chicago Press, pp. 21-51.
Darden, K. and H. Mylonas (2015), “Threats to Territorial integrity, National Mass Schooling, and Linguistic Commonality”, Comparative Political Studies 49(11): 1446-1479.
Dasgupta, P. (1990), “Well-Being and the Extent of its Realization in Poor Countries”, Economic Journal 100 (400): 1-32.
Deaton, A. (2013), The Great Escape. Health, Wealth, and the Origins of Inequality, Princeton: Princeton University Press.
Decancq, K., A. Decoster, and E. Schokkaert (2009), “The Evolution of World Inequality in Well-being”, World Development 37 (1): 11-25.
Devereux, J. (2010), The Health of the Revolution: Explaining the Cuban Healthcare Paradox, Queens College, CUNY.
Dowrick, S. and M. Akmal (2005), “Contradictory Trends in Global Income Inequality: A Tale of Two Biases”, Review of Income and Wealth 51 (2): 201-230.
Easterlin, R. A. (1974), “Does economic growth improve human lot?”, in P. A. David and M. W. Reder (eds.), Nations and Households in Economic Growth: Essays in Honor of Moses Abramovitz, New York: Academic Press, pp. 89-125.
Easterlin, R. (1999), “How Beneficient is the Market? A Look at the Modern History of Mortality”, European Review of Economic History 3 (3): 257-294.
33
Edwards, R.D. (2011), “Changes in World Inequality in Length of Life: 1970-2000”, Population and Development Review 37 (3): 499-528.
Eggleston, K.N. and V. Fuchs (2012), “The New Demographic Transition: Most Gains in Life Expectancy Now Realized Late in Life”, Journal of Economic Perspectives 26: 137-156.
Firebaugh, G. (1999), “Empirics of World Income Inequality”, American Journal of Sociology 104 (6): 1597-1630.
Gallardo Albarrán, D. (2017), Missed opportunities? The Development of Human Welfare in Western Europe, 1913-1950, Groningen Growth and Development Centre Research Memorandum 166.
Gellner, E. (1983), Nations and Nationalism, Ithaca, New York: Cornell University Press. Goesling, B. and D.P. Baker (2008), “Three faces of international inequality”, Research in Social
Stratification and Mobility 26: 183–198 Goesling, B. and G. Firebaugh (2004), “The Trend in International Health Inequality”,
Population and Development Review 30 (1): 131-146. Goda, T. and A. Torres García (2017), “The Rising Tide of Absolute Global Income Inequality
During 1850–2010: Is It Driven by Inequality Within or Between Countries?”, Social Indicators Research 130: 105-1072.
Hansen, C.W. and H. Strulik (2017), “Life Expectancy and Education: Evidence from the Cardiovascular Revolution”, Journal of Economic Growth 22: 421-450.
Hansen, C.W. (2013), “Life Expectancy and Human Capital: Evidence from the International Epidemiological Transition”, Journal of Health Economics 32: 1142– 1152
Hatton, T.J. and B.E. Brey (2010), “Long Run Trends in the Heights of European Men, 19th–20th Centuries”, Economics and Human Biology 8: 405-413.
Heger, D. and I.W.K. Kolodziej (2016), Changes in Morbidity over Time: Evidence from Europe, Ruhr Economic Papers, No. 640.
Hobijn, B. and P.H. Franses (2001), “Are Living Standards Converging?”, Structural Change and Economic Dynamics 12: 171-200.
Howse, K., (2006) “Increasing Life Expectancy and the Compression of Morbidity: a Critical Review of the Debate,” Oxford Institute of Ageing Working Paper 226.
Huntington, S. P. (1991), The Third Wave: Democratization in the Late Twentieth Century, Norman: University of Oklahoma Press
Ivanov, A. and M. Peleah (2010), “From Centrally Planned Development to Human Development,” UNDP Human Development Reports Research Paper 38
Jayachandran, S., A. Lleras-Muney, and K.V. Smith (2010), “Modern Medicine and the Twentieth Century Decline in Mortality: Evidence on the Impact of Sulfa Drugs,” American Economic Journal: Applied Economics 2: 118-146.
Jones, C.I. and P.J. Klenow (2016), “Beyond GDP? Welfare across Countries and Time”, American Economic Review 106 (9): 2426-2457
Kahneman, D., and A. Deaton (2010), High Income Improves Evaluation of Life but not Emotional Well-being, Proceedings of the National Academy of Sciences of the United States of America 107 (38): 16489–16493.
Kakwani, N. (1993), “Performance in Living Standards. An International Comparison”, Journal of Development Economics 41: 307-336.
Klasing, M.J. and P. Milionis (2020), “The international epidemiological transition and the education gender gap”, Journal of Economic Growth 25: 37–86.
Korzeniewicz, R.P. and T.P. Moran (1997), “World Economic Trends in the Distribution of Income, 1965-1992”, American Journal of Sociology 102 (4): 1000-1039

34
Knutsen, C.H., J. Teorell, T. Wig, A. Cornell, J. Gerring, H. Gjerløw, S.-E. Skaaning, D. Ziblatt, K.L. Marquardt, D. Pemstein, and B. Seim (2019), “Introducing the Historical Varieties of Democracy Dataset: Political Institutions in the Long 19th Century”, Journal of Peace Research 56 (3): 440-451.
Lakner and Milanovic (2016), “Global Income Distribution: From the Fall of the Berlin Wall to the Great Recession”, World Bank Economic Review 30 (2): 203-232.
Liberati, P. (2015), “The World Distribution of Income And its Inequality, 1970–2009”, Review of Income and Wealth 61 (2): 248-273.
Lindert, P.H. (2004), Growing Public. Social Spending and Economic Growth since the Eighteenth Century, Cambridge: Cambridge University Press.
Lindgren, B. (2016), The Rise in Life Expectancy, Health Trends among the Elderly, and the Demand for Care. A Selected Literature Review, NBER Working Paper 22521
Lipset, S.M. (1959), “Some Social Requisites of Democracy: Economic Development and Political Legitimacy”, American Political Science Review 53(1): 69-105
Loudon, I. (2000), “Maternal Mortality in the Past and its Relevance to Developing Countries Today”, American Journal of Clinical Nutrition 72, (1) (supplement): 241S-246S.
Mackenbach, J.P. (2013), “Political Conditions and Life Expectancy in Europe, 1900-2008”, Social Science & Medicine 82: 134-146.
Mandle, J.R. (1970), “The Decline of Mortality in British Guiana, 1911-1960,” Demography 7: 301-315.
Manzano, D. (2017), Bringing Down the Educational Wall: Political Regimes, Ideology, and The Expansion of Education, Cambridge: Cambridge University Press
Martínez, R. (2012), “Inequality and the New Human Development Index”, Applied Economics Letters 19 (6): 533-535.
Martínez, R. (2016), “Inequality Decomposition and Human Development”, Journal of Human Development and Capabilities 17 (3): 415-425.
Mathers, C. D., R. Sadana, J.A. Salomon, C.J.L. Murray, and A.D. Lopez (2001), “Healthy Life Expectancy in 191 Countries”, Lancet 357: 1685–1691.
Meng, X., N. Qian, and P. Yared (2015), “The Institutional Causes of China’s Great Famine, 1959-1961”, Review of Economic Studies 82: 1568–1611
Meyer, J.W., F.O. Ramirez, and Y.N. Soysal (1992), “World Expansion of Mass Education, 1870–1980”, Sociology of Education 65: 128–149
Milanovic, B. (2005), Worlds Apart. Measuring International and Global Inequality. Princeton: Princeton University Press.
Milanovic, B. (2016), Global Inequality: A New Approach for the Age of Globalization, Cambridge, MA: Belknap Press of Harvard University Press.
Milanovic, B. (2020), After the Financial Crisis: The Evolution of the Global Income Distribution between 2008 and 2013, MPRA Paper no. 101560.
Morrisson, C. and F. Murtin (2005), “The World Distribution of Human Capital, Life Expectancy and Income: A Multi-dimensional Approach” (mimeo).
Morrisson, C. and F. Murtin (2009), “The Century of Education”, Journal of Human Capital 3 (1): 1-42
Morrisson, C. and F. Murtin (2013), “The Kuznets Curve of Human Capital Inequality: 1870–2010”, Journal of Income Inequality 11, 3: 283-301.
Mukand, S.W. and D. Rodrik (2020), “The Political Economy of Liberal Democracy”, Economic Journal 130: 765-792.

35
Murray, C.J.L. and A.D. Lopez (1997), “Regional Patterns of Disability-free Life Expectancy and Disability-adjusted Life Expectancy: Global Burden of Disease Study”, Lancet 349: 1347-1352.
Murray, C.J.L. et al. (2017), “Global, Regional, and National Disability-adjusted Life-years (DALYs) for 333 Diseases and Injuries and Healthy Life Expectancy (HALE) for 195 Countries and Territories, 1990–2016: a Systematic Analysis for the Global Burden of Disease Study 2016”, Lancet 390: 1260-1344.
Narizny, K. (2012), “Anglo-american Primacy and the Global Spread of Democracy: An International Genealogy”, World Politics 64(2): 341-372.
Neumayer, E. (2003), “Beyond Income: Convergence in Living Standards, Big Time”, Structural Change and Economic Dynamics 14: 275-296
Niño-Zarazúa, M., L. Roope, and F. Tarp (2017), “Global Inequality: Relatively Lower, Absolutely Higher”, Review of Income and Wealth 63 (4): 661-684.
Noble, M.D. (2016), Illuminating Democracy: Trends, Predictors, and Outcomes of Liberal Democracy 1972-2013, University of North Carolina Unpublished Ph.D. Dissertation.
Nordhaus, W., and J. Tobin (1972), “Is Growth Obsolete?”, in National Bureau of Economic Research, Economic Growth: Fiftieth Anniversary Colloquium V, New York: Columbia University Press, pp. 1–80
Noorbakhsh, F. (2006), International Convergence or Higher Inequality in Human Development? Evidence for 1975 to 2002, UNU-WIDER Research Paper No. 2006/15
Omran, A.R. (1971), “The Epidemiological Transition: A Theory of Epidemiology of Population Change,” Milbank Memorial Fund Quarterly 49 (4): 509-538.
Omran, A. R. (1998), “The Epidemiologic Transition Theory Revisited Thirty Years Later”, World Health Statistics Quarterly 53 (2,3,4): 99-119. https://apps.who.int/iris/handle/10665/330604
Paglayan, A.S. (2021), “The Non-Democratic Roots of Mass Education: Evidence from 200 Years”, American Political Science Review 115(1): 179-198
doi:10.1017/S0003055420000647 Pinker, S. (2018), Enlightenment Now. The Case for Reason, Science, Humanism and Progress,
London and New York: Allen Lane. Prados de la Escosura, L. (2015), “World Human Development: 1870-2007”, Review of Income
and Wealth 61, 2: 220-247. Prados de la Escosura, L. (2021), “Augmented Human Development in the Age of
Globalisation”, Economic History Review (forthcoming). Dataset accessible at https://espacioinvestiga.org/home-hihd/?lang=en
Preston, S. (1975), “The Changing Relationship between Mortality and the Level of Economic Development”, Population Studies 29 (2): 231-248.
Ram, R. (1980), “Physical Quality of Life Index and Inter-country Inequality”, Economic Letters 5: 195-199.
Ram, R. (1992), “International Inequalities in Human Development and Real Income”, Economic Letters 38: 351-354.
Ram, R. (2006), “State of the Life Span Revolution between 1980 and 2000”, Journal of Development Economics 80: 518-526.
Ravallion, M. (2004), “Concepts of Inequality in the Globalization Debate”, in S.M. Collins and C. Graham (eds.), Brookings Trade Forum. Globalization, Poverty, and Inequality, Washington, DC: Brookings Institution Press pp. 1-38.

36
Reher, D.S. (2003), “Perfiles demográficos de España 1940-1960”, in C. Barciela (ed.), Autarquía y Mercado negro. El fracaso económico del primer franquismo, 1939-1959, Barcelona: Crítica, pp. 1-26
Riley, J.C. (1990), “The Risk of Being Sick: Morbidity Trends in Four Countries”, Population and Development Review 16: 403-432.
Riley, J.C. (2001), Rising Life Expectancy. A Global History, New York: Cambridge University Press.
Riley, J.C. (2005), Poverty and Life Expectancy. The Jamaica Paradox, Cambridge University Press, New York
Rijpma, A. (2017), What Can’t Money Buy? Wellbeing and GDP since 1820, CGEH Working Paper Series 78
Rodríguez Braun, C. (2010), “On Liberty’s Liberty”, Independent Review 14 (4): 599-612. Sala-i-Martin, X. (2006), “The World Distribution of Income: Falling Poverty ... and
Convergence, Period”, Quarterly Journal of Economics 121 (2): 351-397. Salomon, J.A., H. Wang, M.K. Freeman, T. Vos, A.D. Flaxman, A.D. Lopez, and C.J.L. Murray
(2012), “Healthy Life Expectancy for 187 Countries, 1990–2010: A Systematic Analysis for the Global Burden Disease Study 2010,” Lancet 380: 2144-2162.
Schultz, T.P. (1998), “Inequality in the distribution of personal income in the world: How it is changing and why”, Journal of Population Economics 11: 307-344.
Sen, A. (1981), “Public Action and the Quality of Life in Developing Countries,” Oxford Bulletin of Economics and Statistics 43: 287-319.
Sen, A. (1984), “The Living Standard”, Oxford Economic Papers 36: 74-90. Theil, H. (1967), Economics and Information Theory, Amsterdam: North Holland. Theil, H. (1979), “Components of the Change in Regional inequality”, Economic Letter 4: 191-
193. Theil, h. (1989), “The Development of International Inequality 1960-1985”, Journal of
Econometrics 42: 145-155. United Nations Development Programme [UNDP] (2014), Human Development Report 2014.
Sustaining Human Progress: Reducing Vulnerabilities and Building Resilience, New York: United Nations Development Programme.
Veenhoven, R. and F Vengust (2013), “The Easterlin Illusion: Economic Growth Does Go with Greater Happiness”, International Journal of Happiness and Development 1 (4), 311–343
Zambrano, E. (2014), “An Axiomatization of the Human Development Index”, Social Choice Welfare 42: 853-872.
Zambrano, E. (2017), “The ‘Troubling Tradeoffs’ Paradox and a Resolution”, Review of Income and Wealth 63 (3): 520-541.
Zanden, J.L. van, J. Baten, P. Foldvári, and B. van Leeuwen (2014), “The Changing Shape of Global Inequality 1820-2000; Exploring a New Dataset”, Review of Income and Wealth 60 (2): 279-297.
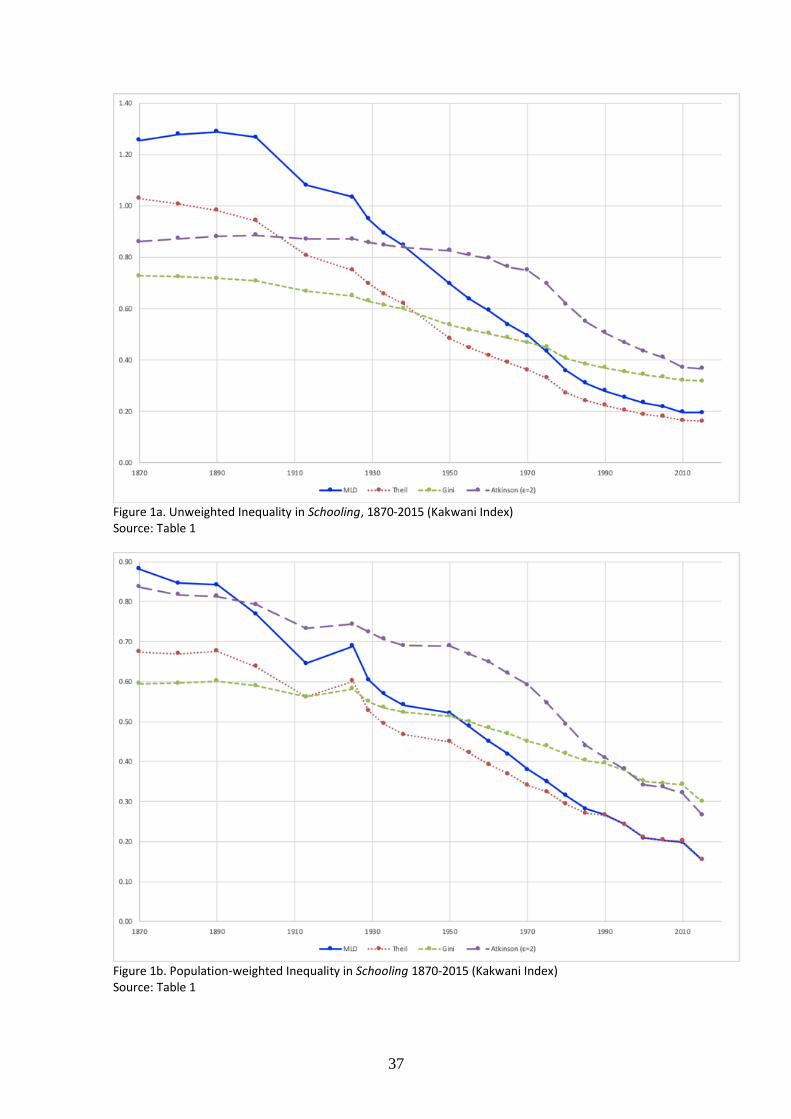
37
Figure 1a. Unweighted Inequality in Schooling, 1870-2015 (Kakwani Index) Source: Table 1
Figure 1b. Population-weighted Inequality in Schooling 1870-2015 (Kakwani Index) Source: Table 1

38
Figure 2. Population-weighted Inequality in Schooling (MLD): Kakwani Index and Original Values Source: Table 1 and see the text.
Figure 3a. Unweighted Inequality in Life Expectancy, 1870-2015 (Kakwani Index) Source: Table 2

39
Figure 3b. Population-weighted Inequality in Life Expectancy, 1870-2015 (Kakwani Index) Source: Table 2
Figure 4. Population-weighted Inequality in Life Expectancy (MLD): Kakwani Index and Original Values Source: Table 2 and see the text
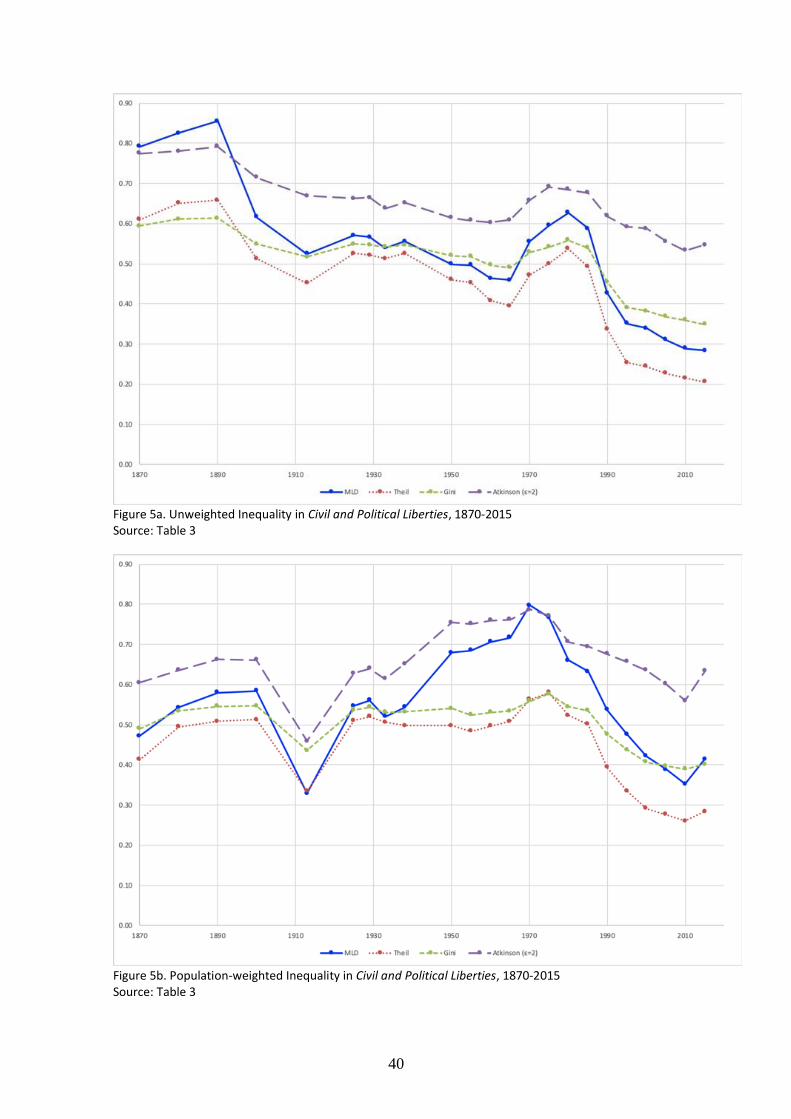
40
Figure 5a. Unweighted Inequality in Civil and Political Liberties, 1870-2015 Source: Table 3
Figure 5b. Population-weighted Inequality in Civil and Political Liberties, 1870-2015 Source: Table 3

41
Figure 6a. Unweighted Inequality in Augmented Human Development 1870-2015 Source: Table 4
Figure 6b. Population-weighted Inequality in Augmented Human Development, 1870-2015 Source: Table 4

42
Figure 7. Dimensions’ Contributions to Augmented Human Development Inequality (pop-weighted MLD) Source: Table 5
Figure 8a. Unweighted Inequality in Real Per Capita GDP, 1870-2015 Source: Table 6

43
Figure 8b. Population-weighted Inequality in Real Per Capita GDP, 1870-2015 Source: Table 6
Figure 9. Population-weighted Inequality in Schooling: The Contribution of China and India, Russia, and Sub Saharan Africa, 1870-2015 (Kakwani Index) (MLD) Source: Table 7

44
Figure 10. Population-weighted in Life Expectancy: The Contribution of China and India, Russia, and Sub Saharan Africa, 1870-2015 (Kakwani Index) (MLD) Source: Table 8
Figure 11. Population-weighted in Civil and Political Liberties: The Contribution of China and India, Russia, and Sub Saharan Africa, 1870-2015 ( (MLD) Source: Table 9

45
Figure 12. Population-weighted Inequality in Augmented Human Development: The Contribution of China and India, Russia, and Sub Saharan Africa, 1870-2015 (MLD) Source: Table 10
Figure 13. Population-weighted Inequality in Real GDP per Head: The Contribution of China and India, Russia, and Sub Saharan Africa, 1870-2015 (MLD) Source: Table 11

46
Figure 14. Population-weighted Inequality Breakdown: Schooling, 1870-2015 (Kakwani Index) (MLD) Source: Table 12
Figure 15. Population-weighted Inequality Breakdown: Life Expectancy, 1870-2015 (Kakwani index) (MLD) Source: Table 13

47
Figure 16. Population-weighted Inequality Breakdown: Civil and Political Liberties, 1870-2015 (MLD) Source: Table 14
Figure 17. Population-weighted Inequality Breakdown in Augmented Human Development, 1870-2015 (MLD) Source: Table 15

48
Figure 18. Population-weighted Inequality Breakdown in Real Per Capita GDP, 1870-2015 (MLD). Source: Table 16
Figure 19. Relative and Absolute Inequality in Schooling, 1870-2015 (pop-weighted MLD) (2015=1)
Source: See the text.

49
Figure 20. Relative and Absolute Inequality in Life Expectancy, 1870-2015 (pop-weighted MLD) (2015=1) Source: See the text.
Figure 21. Relative and Absolute Inequality in Civil and Political Liberties, 1870-2015 (pop-weighted MLD) (2015=1)
Source: See the text.

50
Figure 22. Relative and Absolute Inequality in Augmented Human Development, 1870-2015 (pop-weighted MLD) (2015=1)
Source: See the text.
Figure 23. Relative and Absolute Inequality in Real GDP per Head, 1870-2015 (pop-weighted MLD) (2015=1)
Source: See the text.

51
Figure 24. Absolute and Relative Schooling Growth Incidence Curves, 1870-2015 Source: See the text.
Figure 25. Relative Schooling Growth Incidence Curves: Main Phases (balanced panel 1870-2015) Source: See the text.

52
Figure 26. Absolute and Relative Life Expectancy Growth Incidence Curves, 1870-2015 Source: See the text.
Figure 27. Relative Life Expectancy Growth Incidence Curves: Main Phases (balanced panel 1870-2015) Source: See the text.

53
Figure 28. Absolute and Relative Civil and Political Liberties Growth Incidence Curves, 1870-2015 Source: See the text.
Figure 29. Relative Civil and Political Liberties Growth Incidence Curves: Main Phases (balanced panel 1870-2015) Source: See the text.
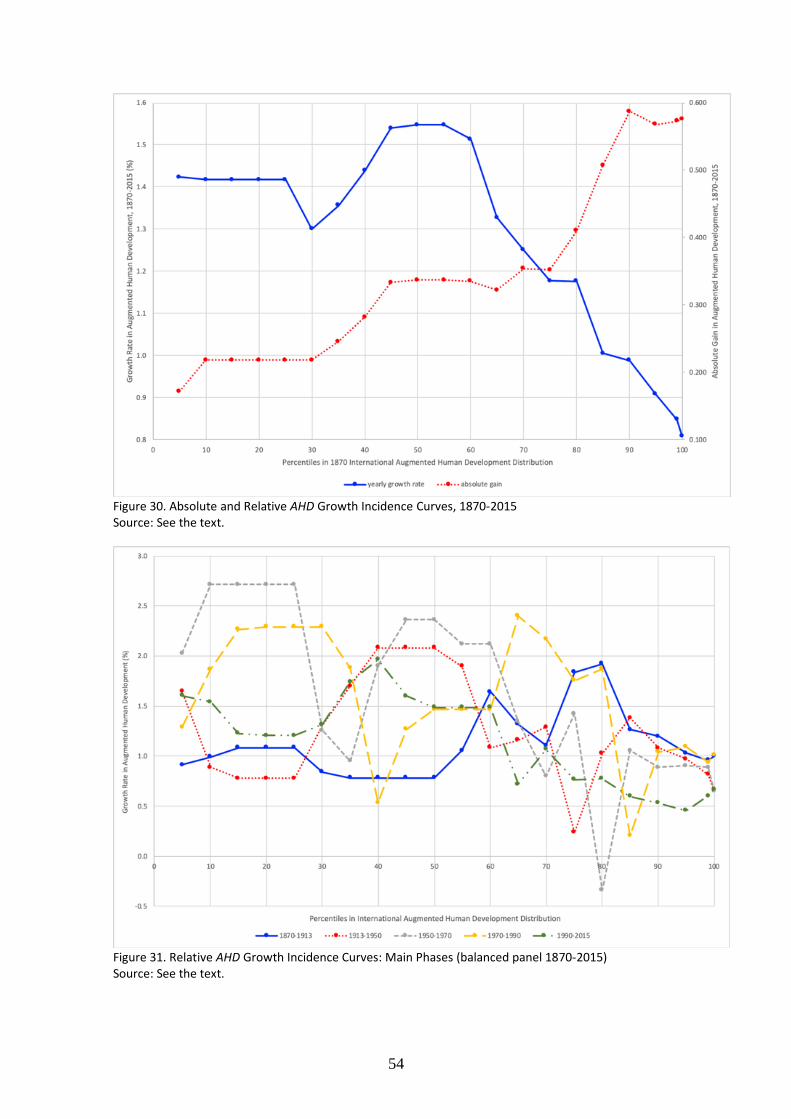
54
Figure 30. Absolute and Relative AHD Growth Incidence Curves, 1870-2015 Source: See the text.
Figure 31. Relative AHD Growth Incidence Curves: Main Phases (balanced panel 1870-2015) Source: See the text.

55
Figure 32. Absolute and Relative Per Capita GDP Growth Incidence Curves, 1870-2015 Source: See the text.
Figure 33. Relative Per Capita GDP Growth Incidence Curves: Main Phases (balanced panel 1870-2015) Source: See the text.

56
Figure 34. Kakwani Index of Schooling, 1870-2015 Source: Prados de la Escosura (2021).
Figure 35. Kakwani Index of Life Expectancy, 1870-2015 Source: Prados de la Escosura (2021).

57
Figure 36. Index of Civil and Political Liberties, 1870-2015 Sources: Coppedge et al. (2018) and Prados de la Escosura (2021).
Figure 37. Schooling: Distribution versus Level. Bivariate kernel linear fit (Epanechnikov, 100)

58
Figure 38. Life Expectancy: Distribution versus Level. Bivariate kernel linear fit (Epanechnikov, 100)
Figure 39. Civil and Political Liberties: Distribution versus Level. Bivariate kernel linear fit (Epanechnikov, 100)

59
Figure 40. Augmented Human Development: Distribution versus Level. Bivariate kernel linear fit (Epanechnikov, 100)
Figure 41. GDP per head: Distribution versus Level (logs). Bivariate kernel linear fit (Epanechnikov, 100)

60
Table 1
International Inequality in Schooling, 1870-2015 (Kakwani Indices)
Unweighted Population weighted
MLD Theil Gini Atkinson (ε=2) MLD Theil Gini Atkinson (ε=2)
1870 1.25 1.03 0.73 0.86 0.88 0.67 0.59 0.84
1880 1.28 1.01 0.72 0.87 0.85 0.67 0.60 0.82
1890 1.29 0.98 0.72 0.88 0.84 0.68 0.60 0.81
1900 1.27 0.94 0.71 0.89 0.77 0.64 0.59 0.79
1913 1.08 0.81 0.67 0.87 0.65 0.56 0.56 0.73
1925 1.03 0.75 0.65 0.87 0.69 0.60 0.58 0.74
1929 0.95 0.70 0.63 0.86 0.60 0.53 0.55 0.72
1933 0.89 0.66 0.61 0.85 0.57 0.49 0.54 0.71
1938 0.85 0.62 0.60 0.84 0.54 0.47 0.52 0.69
1950 0.69 0.48 0.54 0.83 0.52 0.45 0.51 0.69
1955 0.64 0.45 0.52 0.81 0.49 0.42 0.50 0.67
1960 0.59 0.42 0.50 0.80 0.45 0.39 0.48 0.65
1965 0.54 0.39 0.49 0.76 0.42 0.37 0.47 0.62
1970 0.49 0.36 0.47 0.75 0.38 0.34 0.45 0.59
1975 0.43 0.33 0.45 0.70 0.35 0.32 0.44 0.55
1980 0.36 0.27 0.41 0.62 0.31 0.29 0.42 0.49
1985 0.31 0.24 0.39 0.55 0.28 0.27 0.40 0.44
1990 0.28 0.22 0.37 0.51 0.27 0.27 0.40 0.41
1995 0.25 0.21 0.36 0.47 0.24 0.24 0.38 0.38
2000 0.23 0.19 0.34 0.43 0.21 0.21 0.35 0.34
2005 0.22 0.18 0.33 0.41 0.20 0.20 0.35 0.34
2010 0.20 0.17 0.32 0.37 0.20 0.20 0.34 0.32
2015 0.19 0.16 0.32 0.37 0.15 0.16 0.30 0.27

61
Table 2
International Inequality in Life Expectancy, 1870-2015 (Kakwani Indices)
Unweighted Population weighted
MLD Theil Gini Atkinson (ε=2) MLD Theil Gini Atkinson (ε=2)
1870 0.25 0.29 0.38 0.33 0.21 0.24 0.35 0.30
1880 0.27 0.31 0.39 0.35 0.23 0.24 0.37 0.32
1890 0.30 0.33 0.42 0.39 0.29 0.30 0.40 0.38
1900 0.33 0.35 0.44 0.42 0.34 0.34 0.44 0.44
1913 0.35 0.36 0.46 0.45 0.40 0.38 0.47 0.50
1925 0.39 0.39 0.48 0.50 0.42 0.38 0.48 0.53
1929 0.33 0.33 0.44 0.45 0.25 0.24 0.38 0.37
1933 0.32 0.32 0.44 0.44 0.23 0.23 0.37 0.34
1938 0.26 0.26 0.40 0.38 0.20 0.20 0.35 0.30
1950 0.18 0.17 0.33 0.30 0.15 0.15 0.31 0.25
1955 0.17 0.16 0.32 0.29 0.15 0.15 0.30 0.25
1960 0.17 0.15 0.31 0.29 0.21 0.19 0.34 0.33
1965 0.15 0.13 0.29 0.26 0.11 0.10 0.25 0.19
1970 0.13 0.12 0.28 0.24 0.09 0.08 0.22 0.16
1975 0.12 0.11 0.27 0.23 0.08 0.07 0.21 0.15
1980 0.10 0.09 0.23 0.19 0.07 0.06 0.19 0.13
1985 0.09 0.08 0.22 0.18 0.06 0.06 0.19 0.12
1990 0.09 0.08 0.22 0.19 0.06 0.06 0.19 0.13
1995 0.10 0.09 0.23 0.21 0.06 0.06 0.19 0.13
2000 0.11 0.09 0.24 0.21 0.07 0.07 0.20 0.14
2005 0.11 0.10 0.25 0.22 0.07 0.07 0.20 0.15
2010 0.11 0.10 0.25 0.22 0.08 0.07 0.21 0.15
2015 0.09 0.09 0.24 0.17 0.06 0.06 0.19 0.12

62
Table 3
International Inequality in Civil and Political Liberties, 1870-2015
Unweighted Population weighted
MLD Theil Gini Atkinson (ε=2) MLD Theil Gini Atkinson (ε=2)
1870 0.79 0.61 0.59 0.77 0.47 0.41 0.49 0.60
1880 0.82 0.65 0.61 0.78 0.54 0.49 0.53 0.63
1890 0.85 0.66 0.61 0.79 0.58 0.51 0.55 0.66
1900 0.62 0.51 0.55 0.71 0.58 0.51 0.55 0.66
1913 0.52 0.45 0.52 0.67 0.33 0.33 0.44 0.46
1925 0.57 0.52 0.55 0.66 0.55 0.51 0.54 0.63
1929 0.57 0.52 0.55 0.66 0.56 0.52 0.54 0.64
1933 0.54 0.51 0.54 0.64 0.52 0.51 0.53 0.61
1938 0.56 0.53 0.55 0.65 0.54 0.50 0.53 0.65
1950 0.50 0.46 0.52 0.61 0.68 0.50 0.54 0.75
1955 0.50 0.45 0.52 0.61 0.68 0.48 0.52 0.75
1960 0.46 0.41 0.50 0.60 0.71 0.50 0.53 0.76
1965 0.46 0.40 0.49 0.61 0.72 0.51 0.53 0.76
1970 0.56 0.47 0.53 0.66 0.80 0.56 0.56 0.79
1975 0.60 0.50 0.54 0.69 0.77 0.58 0.58 0.77
1980 0.63 0.54 0.56 0.68 0.66 0.52 0.54 0.71
1985 0.59 0.49 0.54 0.68 0.63 0.50 0.54 0.69
1990 0.43 0.34 0.45 0.62 0.54 0.39 0.48 0.68
1995 0.35 0.25 0.39 0.59 0.48 0.34 0.44 0.66
2000 0.34 0.24 0.38 0.59 0.42 0.29 0.41 0.64
2005 0.31 0.23 0.37 0.55 0.39 0.28 0.40 0.60
2010 0.29 0.21 0.36 0.53 0.35 0.26 0.39 0.56
2015 0.28 0.21 0.35 0.55 0.41 0.28 0.40 0.63
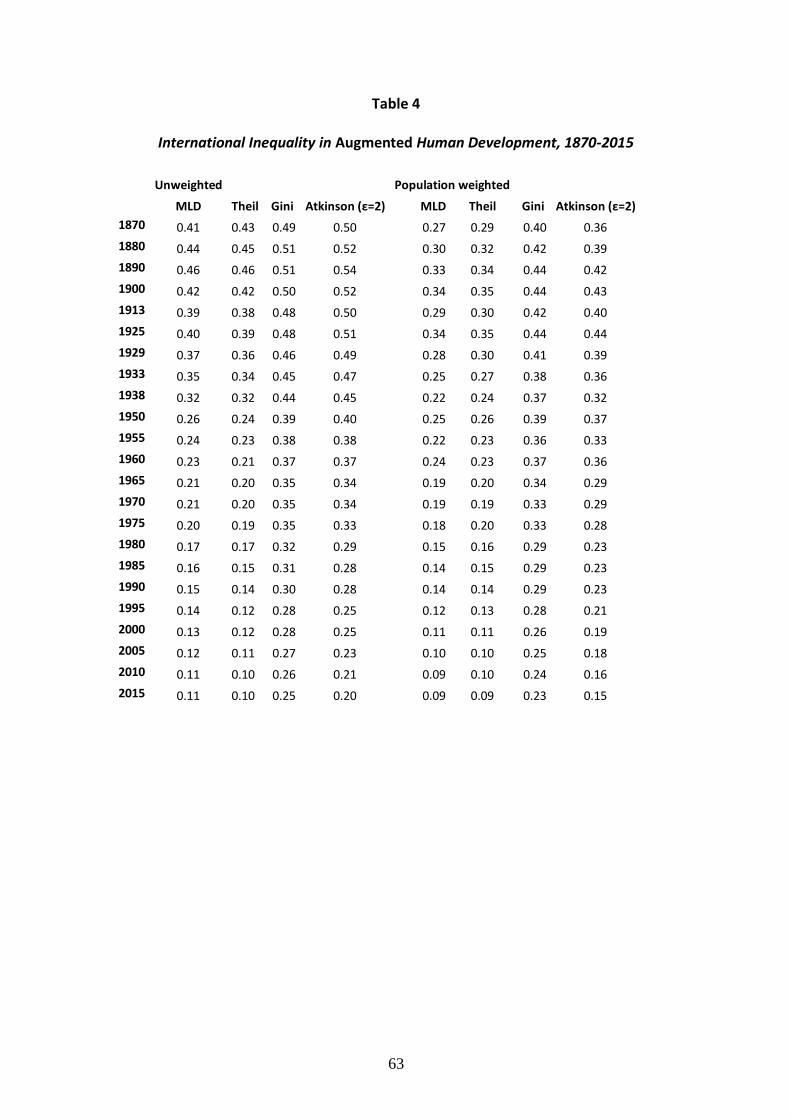
63
Table 4
International Inequality in Augmented Human Development, 1870-2015
Unweighted Population weighted
MLD Theil Gini Atkinson (ε=2) MLD Theil Gini Atkinson (ε=2)
1870 0.41 0.43 0.49 0.50 0.27 0.29 0.40 0.36
1880 0.44 0.45 0.51 0.52 0.30 0.32 0.42 0.39
1890 0.46 0.46 0.51 0.54 0.33 0.34 0.44 0.42
1900 0.42 0.42 0.50 0.52 0.34 0.35 0.44 0.43
1913 0.39 0.38 0.48 0.50 0.29 0.30 0.42 0.40
1925 0.40 0.39 0.48 0.51 0.34 0.35 0.44 0.44
1929 0.37 0.36 0.46 0.49 0.28 0.30 0.41 0.39
1933 0.35 0.34 0.45 0.47 0.25 0.27 0.38 0.36
1938 0.32 0.32 0.44 0.45 0.22 0.24 0.37 0.32
1950 0.26 0.24 0.39 0.40 0.25 0.26 0.39 0.37
1955 0.24 0.23 0.38 0.38 0.22 0.23 0.36 0.33
1960 0.23 0.21 0.37 0.37 0.24 0.23 0.37 0.36
1965 0.21 0.20 0.35 0.34 0.19 0.20 0.34 0.29
1970 0.21 0.20 0.35 0.34 0.19 0.19 0.33 0.29
1975 0.20 0.19 0.35 0.33 0.18 0.20 0.33 0.28
1980 0.17 0.17 0.32 0.29 0.15 0.16 0.29 0.23
1985 0.16 0.15 0.31 0.28 0.14 0.15 0.29 0.23
1990 0.15 0.14 0.30 0.28 0.14 0.14 0.29 0.23
1995 0.14 0.12 0.28 0.25 0.12 0.13 0.28 0.21
2000 0.13 0.12 0.28 0.25 0.11 0.11 0.26 0.19
2005 0.12 0.11 0.27 0.23 0.10 0.10 0.25 0.18
2010 0.11 0.10 0.26 0.21 0.09 0.10 0.24 0.16
2015 0.11 0.10 0.25 0.20 0.09 0.09 0.23 0.15

64
Table 5
Dimensions’ Contributions to Human Development Inequality (population-weighted): MLD and Theil
MLD
Life Expectancy Years of Schooling Adjusted Income Liberal Democracy Residual 1870 0.05 0.22 0.01 0.12 -0.13 1880 0.06 0.21 0.01 0.14 -0.12 1890 0.07 0.21 0.01 0.14 -0.11 1900 0.09 0.19 0.01 0.15 -0.10 1913 0.10 0.16 0.01 0.08 -0.06 1925 0.10 0.17 0.01 0.14 -0.09 1929 0.06 0.15 0.01 0.14 -0.08 1933 0.06 0.14 0.01 0.13 -0.09 1938 0.05 0.14 0.02 0.14 -0.11 1950 0.04 0.13 0.02 0.17 -0.11 1955 0.04 0.12 0.02 0.17 -0.13 1960 0.05 0.11 0.02 0.18 -0.12 1965 0.03 0.10 0.02 0.18 -0.14 1970 0.02 0.09 0.02 0.20 -0.15 1975 0.02 0.09 0.02 0.19 -0.13 1980 0.02 0.08 0.01 0.17 -0.13 1985 0.02 0.07 0.01 0.16 -0.12 1990 0.02 0.07 0.01 0.13 -0.09 1995 0.02 0.06 0.01 0.12 -0.08 2000 0.02 0.05 0.01 0.11 -0.08 2005 0.02 0.05 0.01 0.10 -0.07 2010 0.02 0.05 0.01 0.09 -0.07 2015 0.02 0.04 0.01 0.10 -0.08

65
Table 6
International Inequality in Real Per Capita GDP, 1870-2015
Unweighted Population weighted
MLD Theil Gini Atkinson (ε=2) MLD Theil Gini Atkinson (ε=2)
1870 0.22 0.23 0.37 0.32 0.18 0.21 0.33 0.26
1880 0.24 0.25 0.39 0.35 0.22 0.25 0.36 0.30
1890 0.26 0.27 0.40 0.38 0.25 0.28 0.39 0.34
1900 0.28 0.29 0.41 0.39 0.30 0.32 0.43 0.39
1913 0.30 0.31 0.42 0.42 0.36 0.36 0.46 0.46
1925 0.31 0.31 0.43 0.44 0.39 0.40 0.48 0.49
1929 0.34 0.34 0.45 0.47 0.41 0.42 0.49 0.51
1933 0.31 0.31 0.43 0.44 0.34 0.34 0.45 0.45
1938 0.34 0.33 0.45 0.48 0.42 0.40 0.49 0.52
1950 0.54 0.61 0.55 0.60 0.57 0.54 0.56 0.63
1955 0.53 0.60 0.55 0.60 0.55 0.53 0.55 0.61
1960 0.52 0.56 0.54 0.60 0.57 0.53 0.55 0.62
1965 0.51 0.50 0.53 0.60 0.58 0.54 0.55 0.63
1970 0.52 0.50 0.54 0.62 0.62 0.56 0.56 0.65
1975 0.51 0.46 0.52 0.63 0.63 0.56 0.57 0.66
1980 0.49 0.41 0.49 0.63 0.62 0.55 0.56 0.66
1985 0.48 0.39 0.49 0.63 0.60 0.56 0.56 0.64
1990 0.51 0.41 0.50 0.65 0.62 0.59 0.57 0.64
1995 0.57 0.46 0.52 0.69 0.58 0.57 0.56 0.63
2000 0.59 0.47 0.53 0.71 0.57 0.57 0.56 0.64
2005 0.58 0.45 0.52 0.71 0.50 0.50 0.52 0.61
2010 0.54 0.42 0.50 0.69 0.42 0.40 0.47 0.59
2015 0.52 0.40 0.50 0.69 0.39 0.36 0.45 0.58

66
Table 7
International Inequality in Schooling, 1870-2015: The Contribution of China and India, Sub Saharan Africa, and Russia (MLD)
(Kakwani Indices)
Excluding Excluding Excluding
Actual China and India Sub Saharan Africa Russia
1870 0.88 0.82 0.86 0.94
1880 0.85 0.83 0.82 0.91
1890 0.84 0.83 0.80 0.90
1900 0.77 0.82 0.72 0.82
1913 0.65 0.66 0.58 0.70
1925 0.69 0.64 0.62 0.75
1929 0.60 0.61 0.53 0.66
1933 0.57 0.57 0.50 0.62
1938 0.54 0.53 0.47 0.59
1950 0.52 0.54 0.45 0.56
1955 0.49 0.51 0.42 0.51
1960 0.45 0.48 0.39 0.47
1965 0.42 0.45 0.36 0.44
1970 0.38 0.42 0.33 0.39
1975 0.35 0.41 0.30 0.36
1980 0.31 0.36 0.27 0.33
1985 0.28 0.32 0.24 0.29
1990 0.27 0.31 0.24 0.27
1995 0.24 0.29 0.21 0.25
2000 0.21 0.26 0.18 0.21
2005 0.20 0.25 0.17 0.21
2010 0.20 0.24 0.17 0.20
2015 0.15 0.21 0.13 0.15
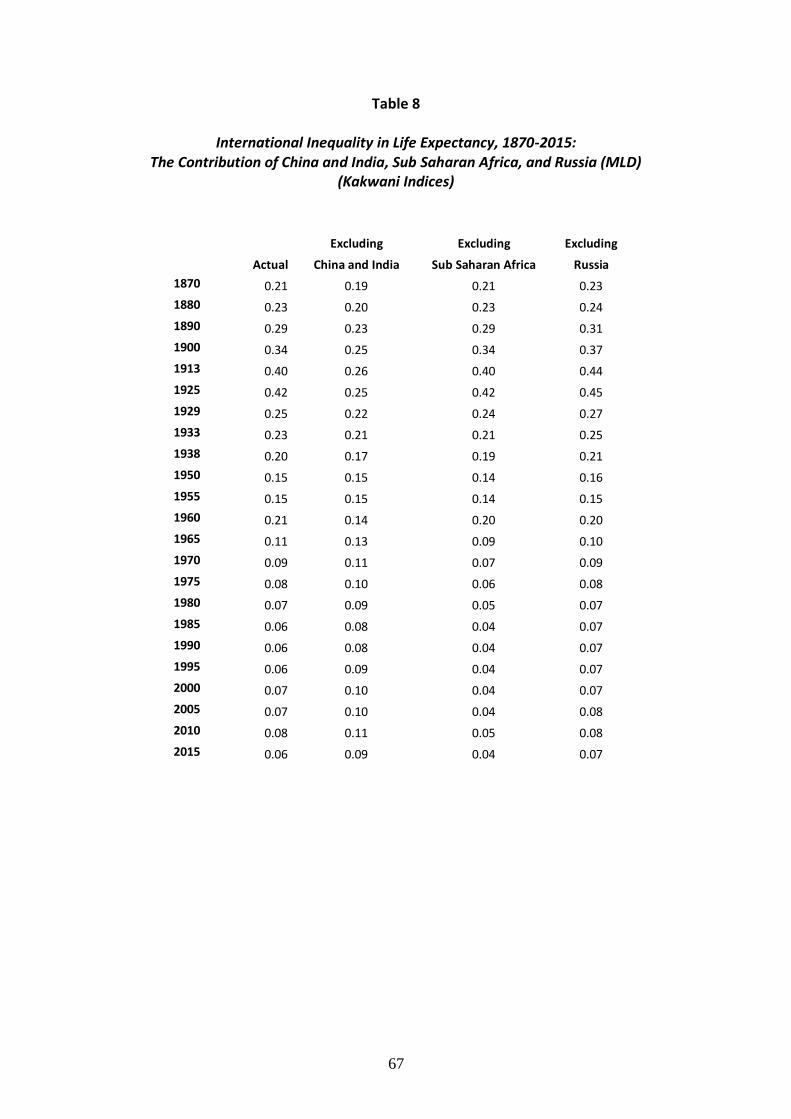
67
Table 8
International Inequality in Life Expectancy, 1870-2015: The Contribution of China and India, Sub Saharan Africa, and Russia (MLD)
(Kakwani Indices)
Excluding Excluding Excluding
Actual China and India Sub Saharan Africa Russia
1870 0.21 0.19 0.21 0.23
1880 0.23 0.20 0.23 0.24
1890 0.29 0.23 0.29 0.31
1900 0.34 0.25 0.34 0.37
1913 0.40 0.26 0.40 0.44
1925 0.42 0.25 0.42 0.45
1929 0.25 0.22 0.24 0.27
1933 0.23 0.21 0.21 0.25
1938 0.20 0.17 0.19 0.21
1950 0.15 0.15 0.14 0.16
1955 0.15 0.15 0.14 0.15
1960 0.21 0.14 0.20 0.20
1965 0.11 0.13 0.09 0.10
1970 0.09 0.11 0.07 0.09
1975 0.08 0.10 0.06 0.08
1980 0.07 0.09 0.05 0.07
1985 0.06 0.08 0.04 0.07
1990 0.06 0.08 0.04 0.07
1995 0.06 0.09 0.04 0.07
2000 0.07 0.10 0.04 0.07
2005 0.07 0.10 0.04 0.08
2010 0.08 0.11 0.05 0.08
2015 0.06 0.09 0.04 0.07

68
Table 9
International Inequality in Civil and Political Liberties, 1870-2015: The Contribution of China and India, Sub Saharan Africa, and Russia (MLD)
Excluding Excluding Excluding
Actual China and India Sub Saharan Africa Russia
1870 0.47 0.38 0.45 0.51
1880 0.54 0.47 0.52 0.58
1890 0.58 0.52 0.55 0.60
1900 0.58 0.51 0.57 0.59
1913 0.33 0.39 0.32 0.34
1925 0.55 0.64 0.55 0.48
1929 0.56 0.66 0.56 0.49
1933 0.52 0.66 0.52 0.44
1938 0.54 0.74 0.55 0.46
1950 0.68 0.59 0.69 0.60
1955 0.68 0.56 0.69 0.61
1960 0.71 0.56 0.72 0.65
1965 0.72 0.58 0.74 0.65
1970 0.80 0.66 0.81 0.75
1975 0.77 0.67 0.78 0.72
1980 0.66 0.68 0.67 0.60
1985 0.63 0.65 0.63 0.58
1990 0.54 0.44 0.52 0.55
1995 0.48 0.38 0.47 0.49
2000 0.42 0.30 0.43 0.43
2005 0.39 0.27 0.40 0.39
2010 0.35 0.26 0.37 0.35
2015 0.41 0.26 0.45 0.41

69
Table 10
International Inequality in Human Development, 1870-2015: The Contribution of China and India, Sub Saharan Africa, and Russia (MLD)
Excluding Excluding Excluding
Actual China and India Sub Saharan Africa Russia
1870 0.27 0.27 0.26 0.29
1880 0.30 0.30 0.29 0.32
1890 0.33 0.32 0.31 0.35
1900 0.34 0.32 0.33 0.36
1913 0.29 0.28 0.28 0.32
1925 0.34 0.31 0.33 0.36
1929 0.28 0.30 0.27 0.30
1933 0.25 0.27 0.23 0.27
1938 0.22 0.25 0.21 0.24
1950 0.25 0.24 0.24 0.27
1955 0.22 0.22 0.21 0.24
1960 0.24 0.21 0.23 0.25
1965 0.19 0.20 0.18 0.20
1970 0.19 0.21 0.17 0.20
1975 0.18 0.21 0.17 0.19
1980 0.15 0.19 0.13 0.16
1985 0.14 0.18 0.12 0.15
1990 0.14 0.17 0.12 0.14
1995 0.12 0.16 0.11 0.13
2000 0.11 0.14 0.09 0.11
2005 0.10 0.13 0.09 0.10
2010 0.09 0.12 0.08 0.10
2015 0.09 0.10 0.08 0.09
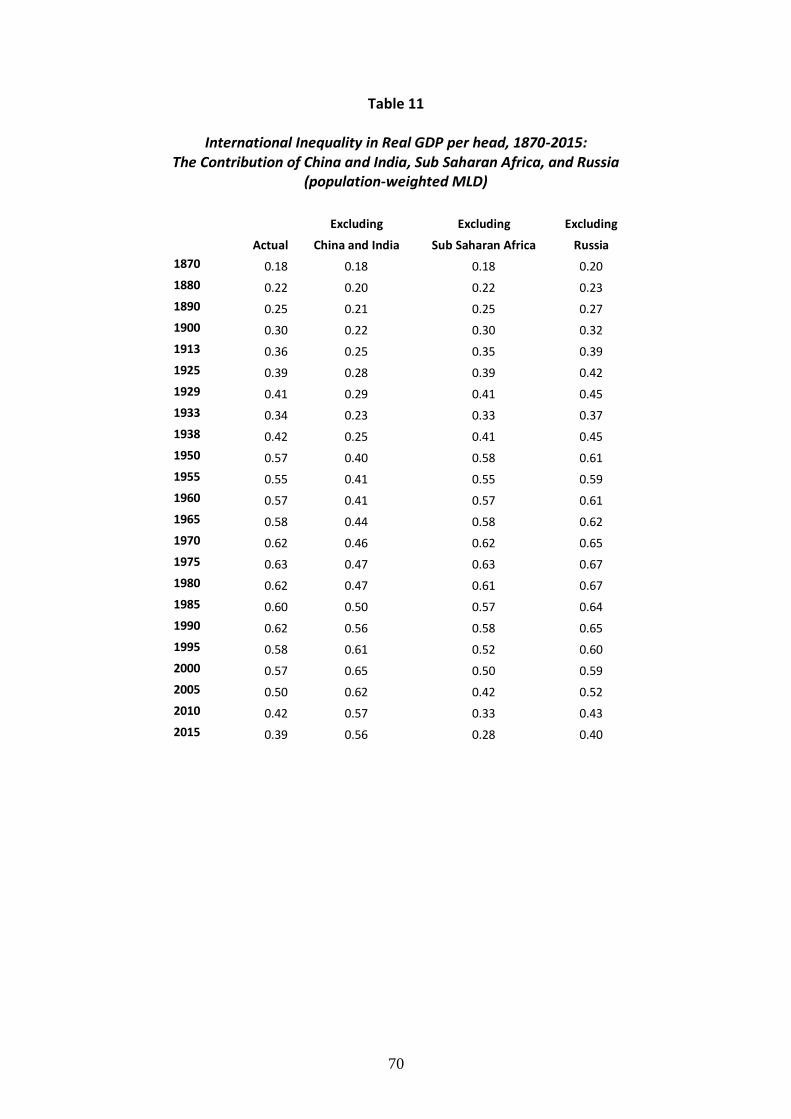
70
Table 11
International Inequality in Real GDP per head, 1870-2015: The Contribution of China and India, Sub Saharan Africa, and Russia
(population-weighted MLD)
Excluding Excluding Excluding
Actual China and India Sub Saharan Africa Russia
1870 0.18 0.18 0.18 0.20
1880 0.22 0.20 0.22 0.23
1890 0.25 0.21 0.25 0.27
1900 0.30 0.22 0.30 0.32
1913 0.36 0.25 0.35 0.39
1925 0.39 0.28 0.39 0.42
1929 0.41 0.29 0.41 0.45
1933 0.34 0.23 0.33 0.37
1938 0.42 0.25 0.41 0.45
1950 0.57 0.40 0.58 0.61
1955 0.55 0.41 0.55 0.59
1960 0.57 0.41 0.57 0.61
1965 0.58 0.44 0.58 0.62
1970 0.62 0.46 0.62 0.65
1975 0.63 0.47 0.63 0.67
1980 0.62 0.47 0.61 0.67
1985 0.60 0.50 0.57 0.64
1990 0.62 0.56 0.58 0.65
1995 0.58 0.61 0.52 0.60
2000 0.57 0.65 0.50 0.59
2005 0.50 0.62 0.42 0.52
2010 0.42 0.57 0.33 0.43
2015 0.39 0.56 0.28 0.40

71
Table 12
Decomposing International Inequality in Schooling (population-weighted MLD) (Kakwani Indices)
Within-group Between-group TOTAL OECD The Rest
1870 0.50 0.38 0.88 0.20 0.57 1880 0.43 0.42 0.85 0.15 0.50 1890 0.39 0.45 0.84 0.12 0.46 1900 0.33 0.44 0.77 0.09 0.39 1913 0.26 0.38 0.65 0.07 0.32 1925 0.29 0.40 0.69 0.07 0.35 1929 0.27 0.33 0.60 0.07 0.33 1933 0.28 0.29 0.57 0.07 0.33 1938 0.28 0.26 0.54 0.06 0.34 1950 0.29 0.23 0.52 0.06 0.35 1955 0.29 0.20 0.49 0.06 0.34 1960 0.28 0.17 0.45 0.06 0.32 1965 0.26 0.16 0.42 0.05 0.30 1970 0.24 0.14 0.38 0.05 0.27 1975 0.21 0.14 0.35 0.05 0.24 1980 0.20 0.11 0.31 0.05 0.23 1985 0.18 0.10 0.28 0.04 0.20 1990 0.16 0.11 0.27 0.04 0.17 1995 0.14 0.10 0.24 0.04 0.16 2000 0.12 0.09 0.21 0.03 0.14 2005 0.12 0.08 0.20 0.03 0.14 2010 0.12 0.08 0.20 0.03 0.13 2015 0.10 0.06 0.15 0.03 0.10

72
Table 13 Decomposing International Inequality in Life Expectancy (population-weighted MLD)
(Kakwani Indices)
Within-group Between-group TOTAL OECD The Rest
1870 0.07 0.14 0.21 0.04 0.08 1880 0.07 0.15 0.23 0.04 0.08 1890 0.09 0.20 0.29 0.02 0.11 1900 0.12 0.22 0.34 0.02 0.15 1913 0.15 0.25 0.40 0.01 0.18 1925 0.20 0.22 0.42 0.02 0.25 1929 0.10 0.14 0.25 0.01 0.13 1933 0.09 0.14 0.23 0.01 0.11 1938 0.07 0.12 0.20 0.02 0.09 1950 0.07 0.08 0.15 0.00 0.09 1955 0.09 0.06 0.15 0.00 0.11
1960 0.14 0.07 0.21 0.00 0.17 1965 0.07 0.04 0.11 0.00 0.08 1970 0.06 0.02 0.09 0.00 0.07 1975 0.06 0.02 0.08 0.00 0.07 1980 0.05 0.02 0.07 0.00 0.05 1985 0.04 0.02 0.06 0.00 0.05 1990 0.04 0.02 0.06 0.00 0.05 1995 0.05 0.02 0.06 0.00 0.05 2000 0.05 0.02 0.07 0.00 0.06 2005 0.06 0.02 0.07 0.00 0.06 2010 0.06 0.02 0.08 0.01 0.06 2015 0.05 0.02 0.06 0.01 0.05

73
Table 14
Decomposing International Inequality in Civil and Political Liberties
(population-weighted MLD)
Within-group Between-group TOTAL OECD The Rest
1870 0.25 0.22 0.47 0.06 0.29 1880 0.24 0.31 0.54 0.06 0.28 1890 0.27 0.31 0.58 0.06 0.33 1900 0.28 0.31 0.58 0.06 0.33 1913 0.11 0.22 0.33 0.05 0.13 1925 0.29 0.25 0.55 0.21 0.32 1929 0.28 0.28 0.56 0.25 0.29 1933 0.28 0.24 0.52 0.32 0.27 1938 0.35 0.19 0.54 0.60 0.29 1950 0.45 0.23 0.68 0.11 0.53 1955 0.57 0.12 0.68 0.11 0.67
1960 0.58 0.12 0.71 0.11 0.69 1965 0.60 0.12 0.72 0.10 0.70 1970 0.65 0.14 0.80 0.12 0.76 1975 0.55 0.22 0.77 0.09 0.63 1980 0.50 0.16 0.66 0.04 0.57 1985 0.49 0.15 0.63 0.03 0.55 1990 0.45 0.09 0.54 0.00 0.51 1995 0.41 0.07 0.48 0.00 0.47 2000 0.37 0.05 0.42 0.02 0.42 2005 0.34 0.05 0.39 0.02 0.38 2010 0.30 0.05 0.35 0.02 0.34 2015 0.36 0.05 0.41 0.02 0.40

74
Table 15
Decomposing International Inequality in Augmented Human Development (population-weighted MLD)
Within-group Between-group TOTAL OECD The Rest
1870 0.08 0.19 0.27 0.05 0.08 1880 0.07 0.22 0.30 0.04 0.08 1890 0.08 0.24 0.33 0.03 0.10 1900 0.09 0.25 0.34 0.03 0.11 1913 0.09 0.21 0.29 0.02 0.10 1925 0.12 0.22 0.34 0.05 0.14 1929 0.10 0.19 0.28 0.05 0.11 1933 0.09 0.16 0.25 0.05 0.10 1938 0.09 0.14 0.22 0.08 0.09 1950 0.09 0.16 0.25 0.03 0.11 1955 0.09 0.13 0.22 0.03 0.11 1960 0.11 0.12 0.24 0.02 0.13 1965 0.08 0.11 0.19 0.02 0.10 1970 0.08 0.10 0.19 0.02 0.09 1975 0.08 0.10 0.18 0.02 0.09 1980 0.06 0.09 0.15 0.01 0.07 1985 0.06 0.08 0.14 0.01 0.07 1990 0.07 0.06 0.14 0.00 0.08 1995 0.07 0.05 0.12 0.00 0.08 2000 0.06 0.05 0.11 0.00 0.07 2005 0.06 0.04 0.10 0.00 0.07 2010 0.05 0.04 0.09 0.00 0.06 2015 0.05 0.04 0.09 0.00 0.06

75
Table 16
Decomposing International Inequality in Real Per Capita GDP, 1870-2015 (population-weighted MLD)
Within-group Between-group TOTAL OECD The Rest
1870 0.03 0.15 0.18 0.05 0.03 1880 0.04 0.18 0.22 0.05 0.04 1890 0.06 0.19 0.25 0.05 0.06 1900 0.08 0.22 0.30 0.05 0.09 1913 0.11 0.25 0.36 0.05 0.13 1925 0.12 0.27 0.39 0.06 0.13 1929 0.14 0.28 0.41 0.05 0.16 1933 0.12 0.22 0.34 0.03 0.14 1938 0.18 0.24 0.42 0.06 0.21 1950 0.26 0.31 0.57 0.11 0.30 1955 0.24 0.31 0.55 0.08 0.28 1960 0.27 0.29 0.57 0.06 0.32 1965 0.29 0.30 0.58 0.05 0.34 1970 0.34 0.28 0.62 0.03 0.40 1975 0.37 0.26 0.63 0.02 0.43 1980 0.38 0.25 0.62 0.02 0.43 1985 0.35 0.25 0.60 0.03 0.39 1990 0.34 0.28 0.62 0.02 0.39 1995 0.30 0.27 0.58 0.02 0.34 2000 0.29 0.28 0.57 0.02 0.32 2005 0.26 0.24 0.50 0.03 0.29 2010 0.24 0.18 0.42 0.02 0.27 2015 0.24 0.15 0.39 0.03 0.26

European Historical Economics Society
EHES Working Paper Series Recent EHES Working Papers 2021
EHES 209 Paving the way to modern growth. Evidence from Bourbon roads in Spain Miquel-Àngel Garcia-López, Alfonso Herranz-Loncan, Filippo Tassinari, Elisabet Viladecans-Marsal EHES 208 Why Covid19 will not be gone soon: Lessons from the institutional economics of
smallpox vaccination in 19th Century Germany Katharina Muhlhoff EHES 207 Leaving Their Mark: Using Danish Student Grade Lists to Construct a More
Detailed Measure of Historical Human Capital Nicholas Ford, Kristin Ranestad, Paul Sharp EHES 206 Violence in the Viking World: New Bioarchaeological Evidence Joerg Baten, Giacomo Benati, Anna Kjellström EHES 205 Productivity, Mortality, and Technology in European and US Coal Mining, 1800-
1913 Javier Silvestre 2020
EHES 204 Globalization and Empire: Market integration and international trade between Canada, the United States and Britain, 1750-1870
Maja Uhre Pedersen, Vincent Geloso, Paul Sharp EHES 203 Opening the Black Box of the Danish Dairy Cooperatives: A Productivity
Analysis Sofia Henriques, Eoin McLaughlin, Paul Sharp, Xanthi Tsoukli, Christian Vedel EHES 202 On the Origins of the Demographic Transition. Rethinking the European Marriage
Pattern Faustine Perrin EHES 201 Did taller people live longer? Influence of height on life span in rural Spain, 1835-
2019, Francisco J. Marco-Gracia, Javier Puche All papers may be downloaded free of charge from: http://www.ehes.org/ The European Historical Economics Society is concerned with advancing education in European economic history through study of European economies and economic history. The society is registered with the Charity Commissioners of England and Wales number: 1052680