egypra report mini-split testing and results
TRANSCRIPT
i
Project supported by the Multilateral Fund of the Montreal Protocol
UNITED NATIONS ENVIRONMENT
UNITED NATIONS INDUSTRIAL DEVELOPMENT ORGANIZATION
EGYPRA EGYPRA EGYPRA EGYPRA –––– Promotion of LowPromotion of LowPromotion of LowPromotion of Low----GWP Refrigerants GWP Refrigerants GWP Refrigerants GWP Refrigerants
for the Air Conditioning Industry in Egyptfor the Air Conditioning Industry in Egyptfor the Air Conditioning Industry in Egyptfor the Air Conditioning Industry in Egypt 2019
ReportReportReportReport

ii
Disclaimer
This report may be reproduced in whole or in part and in any form for educational or non-profit
purposes without special permission from United Nations Industrial Development Organization
(UNIDO) and United Nations Environment (UNEP), provided acknowledgement of the source is
made. UNIDO and UNEP would appreciate receiving a copy of any publication that uses this
publication as a source. No use of this publication may be made for resale or for any other
commercial purpose whatsoever without prior permission in writing from UNIDO and UNEP.
While the information contained herein is believed to be accurate, it is of necessity presented in a
summary and general fashion. The decision to implement one of the options presented in this
document requires careful consideration of a wide range of situation-specific parameters, many of
which may not be addressed by this document. Responsibility for this decision and all its resulting
impacts rests exclusively with the individual or entity choosing to implement the option. UNIDO,
UNEP, their consultants and the reviewers and their employees do not make any warranty or
representation, either expressed or implied, with respect to the accuracy, completeness or utility
of this document; nor do they assume any liability for events resulting from the use of, or reliance
upon, any information, material or procedure described herein, including but not limited to any
claims regarding health, safety, environmental effects, efficacy, performance, or cost made by the
source of information.

iii
Acknowledgement
We would like to acknowledge the assistance given by the government and the National Ozone Unit
Officers of Egypt for their support in the implementation of the project phases and their assistance in
facilitating communication with the different stakeholders.
We also acknowledge the independent International Technical Review Team that assist the project team in
reviewing the process, results and the report of the project.
Prof. Roberto Peixoto (Brazil)
Prof. Walid Chakroun (Kuwait)
Dr. Omar Abdel Aziz (USA/UAE)
Acknowledgement also goes to the “Technology Providers” (Refrigerant and Compressor manufacturers)
for providing components free of charge.
Refrigerant Providers: Arkema, Chemours, Daikin, and Honeywell.
Compressor providers: Emerson, Highly, and GMCC.
Also the OEM manufacturers who built the prototypes and tested them at their own facilities. The OEMs
are listed under item 1.6
Delta Construction Manufacturing (DCM)
Elaraby
Egyptian German Air Treatment Company (EGAT)
Fresh
Miraco
Power
Unionaire
Volta

iv
Project Team
The National Ozone Unit – Ministry of Environment, Egypt: EGYPRA is funded by the HCFC Phase-
out Management Plan (HPMP) of Egypt. The ministry team provided guidance and direction and
participated at project meetings and discussions.
The Project Management: UN Environment and UNIDO provided overall management and
coordination of the project, established the link with the technology providers, and oversaw the
development of the report of the project. The Project was managed by Dr. Lamia Benabbas,
Programme Officer – UNIDO and Mr. Ayman Eltalouny, International Partnership Coordinator,
OzoneAction Programme – UN Environment
The Egyptian Organization for Standards: provided guidance on the Egyptian standards for testing
as well as the minimum energy performance standards (MEPS).
The Technical Consultant, Dr. Alaa Olama advised OEMs during prototype design and construction.
Devised testing methodology and testing TOR, consulted with OEMs to provide technical solutions
for problems as they arose. The Technical Consultant witnessed-testing of all prototypes and
baseline units, compiled testing data, and provided analysis of data.
The Coordination Consultant, Mr. Bassam Elassaad provided logistical support and coordination for
the project and helped with writing of the final report.

v
Contents List of Figures .................................................................................................................................................... vi
List of Tables .................................................................................................................................................... vii
Acronyms ........................................................................................................................................................ viii
Executive Summary ........................................................................................................................................... x
1. Introduction .............................................................................................................................................. 1
1.1. Egypt HPMP ....................................................................................................................................... 1
1.2. Project Objectives ............................................................................................................................. 1
1.3. Selection of Alternative Refrigerants ............................................................................................... 2
1.4. Selection of Capacity Categories ...................................................................................................... 3
1.5. Stakeholders: .................................................................................................................................... 4
1.6. Methodology ..................................................................................................................................... 5
1.7. Testing Parameters and Facilities ..................................................................................................... 6
2. Results ....................................................................................................................................................... 9
2.1 Presentation and Analysis of Results ................................................................................................... 10
2.1.1. Analysis of Capacity and EER Performance for HCFC-22 Alternatives .................................. 10
2.1.2. Analysis of Capacity and EER Performance for R-410A Alternatives .................................... 14
3. Analytical comparison & way forward ................................................................................................... 17
3.1. Capacity and EER behaviour of HCFC-22 Alternatives for each category across all refrigerants
and testing temperatures ........................................................................................................................... 18
3.2. Capacity and EER behaviour of HCFC-22 Alternatives for each refrigerant across all categories
and testing temperatures ........................................................................................................................... 19
3.3. Capacity and EER behaviour of HCFC-22 Alternatives for each testing temperature across all
categories and refrigerants ........................................................................................................................ 19
3.4. Capacity and EER behaviour of R-410A Alternatives for each category across all refrigerants and
testing temperatures .................................................................................................................................. 20
3.5. Capacity and EER behaviour of R-410A Alternatives for each refrigerant across all categories
and testing temperatures ........................................................................................................................... 20
3.6. Capacity and EER behaviour of R-410A Alternatives for each temperature across all categories
and refrigerants .......................................................................................................................................... 21
4. Energy Efficiency and Progressive Changes in MEPS for Egypt ............................................................ 22
5. Conclusion ............................................................................................................................................... 26
5.1. Technical Conclusion ....................................................................................................................... 26
5.2. Capacity Building Requirements .................................................................................................... 26
Bibliography .................................................................................................................................................... 28
Annex 1: Test Results ...................................................................................................................................... 29
Annex 2: Sample Questionnaire for Local Manufacturers ............................................................................ 42
Annex 3: Brief description of Manufacturers’ testing labs ........................................................................... 44

vi
Annex 4: Other Research Programs ............................................................................................................... 47
List of FiguresList of FiguresList of FiguresList of Figures
Figure 1 Capacity vs. EER ratio for HCFC-22 alternatives in 12,000 Btuh split units ....................................... 11
Figure 2 Capacity vs EER Ratio for HCFC-22 alternatives in 18,000 Btuh split units ....................................... 12
Figure 3 Capacity vs. EER ratio for HCFC-22 alternatives in 24,000 Btuh split units ....................................... 13
Figure 4 Capacity vs EER ratio for R-410a alternatives in 12,000 Btuh split units .......................................... 14
Figure 5 Capacity vs EER ratio for R-410A alternatives in 18,000 Btuh split units ( ........................................ 15
Figure 6 Capacity vs EER ratio for R-410A alternatives in 24,000 Btuh split units .......................................... 16
Figure 7 Example of pie chart for HCFC-22 alternatives in the 12,000 Btuh category .................................... 18
Figure 8 capacity and EER Performance of HCFC-22 alternatives for each category across all refrigerants and
all testing temperatures .................................................................................................................................. 18
Figure 9 capacity and EER performance for HCFC-22 alternatives for each refrigerant across all categories
and all testing temperatures ........................................................................................................................... 19
Figure 10 Capacity and EER performance of HCFC-22 alternatives for each testing temperature across all
categories and all refrigerants ......................................................................................................................... 19
Figure 11 capacity and EER performance of R-410A alternatives for each category across all refrigerants and
all testing temperatures .................................................................................................................................. 20
Figure 12 Capacity and EER performance of R-410A alternatives for each refrigerant across all categories
and all testing temperatures ........................................................................................................................... 20
Figure 13 Capacity and EER performance of R-410A alternatives for each testing temperature across all
categories and refrigerants ............................................................................................................................. 21
Figure 14: EER curves for the highest in each class plotted vs. the standard regulation year ........................ 24
Figure 15 A1 - Equivalent capacity charts for HCFC-22 alternatives in 12,000 Btuh category plotted vs HCFC-
22 results ......................................................................................................................................................... 30
Figure 16 A1 - Equivalent EER chart for HCFC-22 alternatives in 12,000 Btuh category plotted vs HCFC-22
results .............................................................................................................................................................. 31
Figure 17 A1 - Equivalent capacity charts for HCFC-22 alternatives in 18,000 Btuh category plotted vs HCFC-
22 results ......................................................................................................................................................... 32
Figure 187 A1 - Equivalent EER charts for HCFC-22 alternatives in 18,000 Btuh category plotted vs HCFC-22
results .............................................................................................................................................................. 33
Figure 19 A1 - Equivalent capacity charts for HCFC-22 alternatives in 24,000 Btuh category plotted vs HCFC-
22 results ......................................................................................................................................................... 34
Figure 20 A1 - Equivalent EER chart for HCFC-22 alternatives in 24,000 Btuh category plotted vs HCFC-22
results .............................................................................................................................................................. 35
Figure 21 A1 - Equivalent capacity chart for R410A alternatives in 12,000 Btuh category plotted vs R-410A
results .............................................................................................................................................................. 36
Figure 22 A1 - Equivalent EER chart for R-410A alternatives in 12,000 Btuh category plotted vs R-410A
results .............................................................................................................................................................. 37
Figure 23 A1- Equivalent capacity charts for R-410A alternatives in 18,000 Btuh category plotted vs R-410A
results .............................................................................................................................................................. 38
Figure 24 A1 - Equivalent EER chart for R-410A alternatives in 18,000 Btuh category plotted vs R-410A
results .............................................................................................................................................................. 39
Figure 25 A1 - Equivalent capacity charts for R-410A alternatives in 24,000 Btuh category plotted vs R-410A
results .............................................................................................................................................................. 40
Figure 26 A1 - Equivalent EER chart for R-410A alternatives in 24,000 category plotted vs R-410A results .. 41

vii
List of TablesList of TablesList of TablesList of Tables
Table 1 List of HCFC-22 alternative refrigerants ............................................................................................... 2
Table 2 List of R-410A alternative refrigerants .................................................................................................. 3
Table 3 Matrix of prototypes showing refrigerants selected for each equipment category ............................ 3
Table 4 Prototypes and type of refrigerant built by the different OEMs .......................................................... 5
Table 5 Testing conditions for outdoor and indoor dry and wet bulb temperatures ....................................... 6
Table 6: Conditions and relevant results for the rooftop unit simulated using the ORNL Flexible HPDM
simulation tool ................................................................................................................................................... 9
Table 7 Comparison of HCFC-22 alternatives for 12,000 Btuh split units ....................................................... 11
Table 8 Comparison of HCFC-22 alternatives for 18,000 Btuh split units ....................................................... 12
Table 9 Comparison of HCFC-22 alternatives for 24,000 Btuh split units ....................................................... 13
Table 10 Comparison of R-410A alternatives for 12,000 Btuh split units ....................................................... 14
Table 11 Comparison of R-410A alternatives for 18,000 Btuh split units ....................................................... 15
Table 12 Comparison of R-410A alternatives for 24,000 Btuh split units ....................................................... 16
Table 13 Example of calculation of the comparative pie charts ..................................................................... 17
Table 14: Egypt Energy Ratings per 2014 Standard ........................................................................................ 22
Table 15: Egypt Energy Ratings per 2017 Standard ........................................................................................ 22
Table 16: Egypt Energy Ratings per 2019 Standards ....................................................................................... 23
Table 17: Egypt Energy ratings per 2021 Standard ......................................................................................... 23
Table 18: EER Values at T1 according to the Egyptian Standard ES: 3795/2016 ............................................ 24
Table 19 A1: Capacity and EER Results for HCFC-22 alternatives in 12,000 Btuh category ............................ 30
Table 20 A1- Capacity and EER results for HCFC-22 alternatives in 18,000 Btuh category............................. 32
Table 21 A1 - Capacity and EER results for HCFC-22 alternatives in 24,000 Btuh category ............................ 34
Table 22 A1 - Capacity & EER results for R-410A alternatives in 12,000 Btuh category ................................. 36
Table 23 A1 - Capacity & EER results for R-410A alternatives in 18,000 Btuh category ................................. 38
Table 24 A1 - Capacity & EER results for R-410A alternatives in 24,000 Btuh category ................................. 40
Table 25 A3: Typical parameters shown on a testing lab monitoring screen ................................................. 46
Table 26 A4 - Results for PRAHA-I program .................................................................................................... 48
Table 27 A4 - Results for the AREP program ................................................................................................... 49
Table 28 A4 - Results for the ORNL program ................................................................................................... 50

viii
AcronymsAcronymsAcronymsAcronyms
AHRI Air Conditioning, Heating, and Refrigeration Institute
ANSI American National Standards Institute
AREP Alternative Refrigerant Evaluation Program
ASHRAE American Society of Heating, Refrigerating, and Air Conditioning Engineers
Btuh Also denoted as BTU/h or B.t.u/hr = British Thermal Unit per Hour
BV Burning Velocity
CAP Capacity
CC Cooling Capacity
CFC Chloro Fluoro Carbon
COP Coefficient of Performance
DB Dry Bulb
DC District Cooling
DX Direct Expansion
EE Energy Efficiency
EER Energy Efficiency Ratio
EGYPRA Egyptian Program for Promoting Low-GWP Refrigerant Alternatives
EN European Norms (Standards)
EPA Environmental Protection Agency (US)
GWP Global Warming Potential
HAT High Ambient Temperature
HC Hydro Carbons
HCFC Hydro Chloro Fluoro Carbon
HFC Hydro Fluoro Carbon
HFO Hydro Fluoro Olefins
HPMP HCFC Phase-out Management Plan
HVACR Heating, Ventilation, Air Conditioning and Refrigeration
HX Heat Exchanger
IU Indoor Unit
IEC International Electrotechnical Commission
IPR Intellectual Property Rights
ISO International Standards Organization
Kg Kilograms
kW Kilowatts
LCCP Life Cycle Climate Performance
LFL lower Flammability Limit
MEPS Minimum Energy Performance Standards
MOP Meeting of Parties
MP Montreal Protocol
NOU National Ozone Unit
ODP Ozone Depleting Potential
ODS Ozone Depleting Substances
OEM Original Equipment Manufacturer
PRAHA Promoting Low-GWP Refrigerants for the Air Conditioning in HAT Countries
PSI Pounds per Square Inch
RAC Refrigeration and Air Conditioning
ROWA UNEP Regional Office for West Africa
RTOC Refrigeration, Air Conditioning, and Heat pump & Technical Options Committee

ix
SCFM Standard Cubic Foot per Minute
SHR Sensible Heat ratio
SNAP Significant New Alternative Policy
Tdb Dry Bulb Temperature
Twb Wet Bulb Temperature
TEAP Technical & Economic Assessment Panel
TEWI Total Equivalent Warming Impact
TF Task Force
TWB Wet Bulb Temperature
UNEP United Nations Environment
UNIDO United Nations Industrial Development Organization
USD US Dollars
VC Vienna Convention
VRF Variable Refrigerant Flow
WB Wet Bulb
WG Working Group

x
Executive SummaryExecutive SummaryExecutive SummaryExecutive Summary
HCFCs are used extensively in the refrigeration and air conditioning industry, in particular in the air-
conditioning industry. Parties to the Montreal Protocol, in their 21st meeting, adopted a decision concerning
HCFCs and environmentally sound alternatives. The decision calls for further assessment and support work
to enable parties to find the best ways of moving forward particularly for those with forthcoming compliance
targets related to consumption of HCFC in the air-conditioning sector.
The aim of this program was to individually test custom-built AC split unit prototypes and central unit
prototypes, to operate with alternative refrigerants and compare their performance against baseline units.
Those baseline units are either HCFC-22 or R-410A. The list of refrigerants used and the split unit categories
tested is as per the table below. The project involved building and testing 19 custom built split unit prototypes
with dedicated compressors provided by Emerson, GMCC, and Hitachi Highly, and 16 base units by five OEMs.
The refrigerants were provided by Arkema, Chemours, Daikin, and Honeywell. All the prototypes and the
base units were tested at locally available accredited labs at the time the tests were conducted and witnessed
by the project’s Technical Consultant who also advised the OEMs during the manufacturing stage. Tests were
repeated for optimization by tweaking some of the components. A total of 140 witnessed tests were
performed. The central units were built but could not be tested due to lack of locally accredited available
labs.
Split system (mini-split) Central 120,000 Btuh
Replacement
for
12,000
Btuh
18,000
Btuh
24,000
Btuh Std. coil
micro
channel
HC-290 HCFC-22
HFC-32 R-410A
R-457C (Arkema ARM-20a) HCFC-22
R-459A (Arkema ARM -71a) R-410A
R-454C (Chemours DR-3) HCFC-22
R-454B (Chemours DR-5A) R-410A
R-444B (Honeywell L-20) HCFC-22
R-447A (Honeywell L-41) R-410A
HCFC-22 baseline
R-410A baseline
The units were tested at four ambient temperatures: T1 (35 °C) and T3 (46 °C) with indoor dry bulb/wet
bulb temperatures of 27/19 °C and 29/19 °C respectively, plus two other ambient temperatures of 50 °C
termed as T High and 55 °C termed as T Extreme at ISO 5151 specified indoor dry bulb/wet bulb temperature of
32/23 °C (maximum testing condition in ISO 5151). These indoor temperatures are different from the ones
used by other testing programs such as AREP and ORNL. The test results gave higher capacities at THigh than
at T3.
The casual reading of the results may establish confusion, even among specialists, in relation to the
increase in capacity and EER at T High compared to T3. This result is not witnessed in other similar research
projects; however, by understanding the impact of changing the dry bulb and wet bulb indoor testing
conditions i.e. Thigh (outdoor 50/24 ⁰C, indoor 32/24 ⁰C) compared to T3 (outdoor 46/24 ⁰C, indoor
29/19 ⁰C), the results can be explained. These results were randomly double checked through a simulation
exercise. The additional exercise to review the results delayed publishing results.
The test results are presented in comparison to the baseline units and color coded to denote the
performance over or below the performance of the comparative baseline units. Scattered charts are
xi
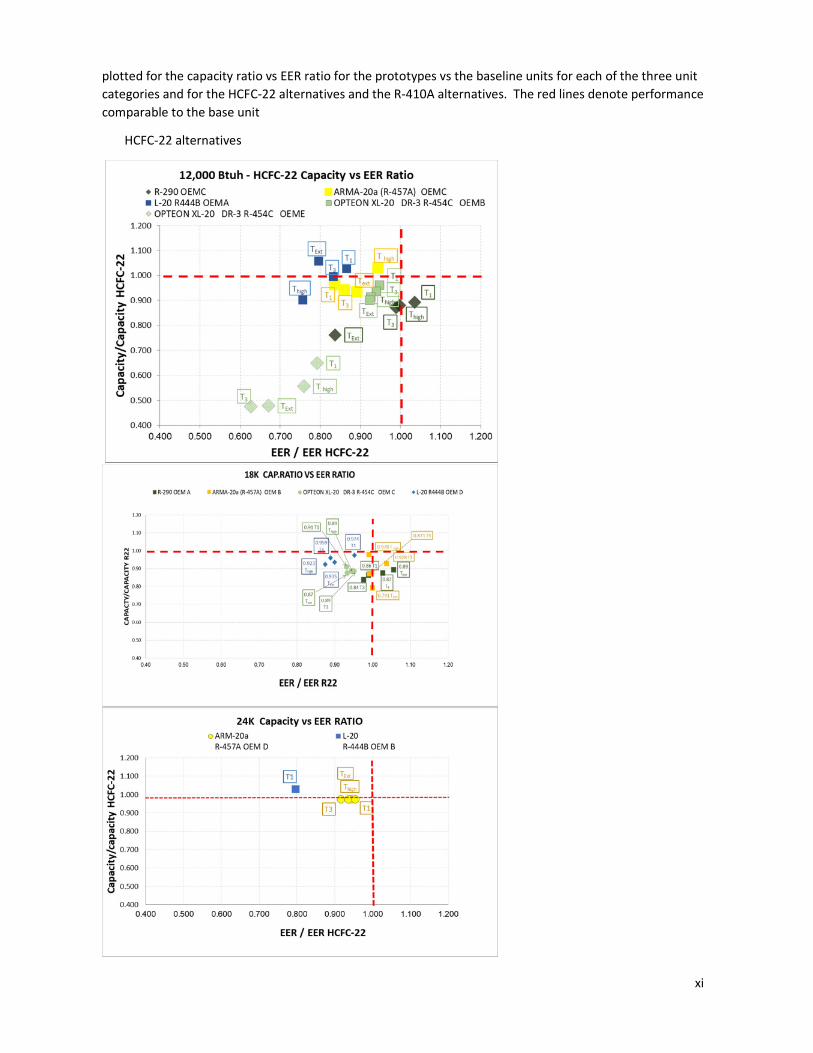
plotted for the capacity ratio vs EER ratio for the prototypes vs the baseline units for each of the three unit
categories and for the HCFC-22 alternatives and the R-410A alternatives. The red lines denote performance
comparable to the base unit
HCFC-22 alternatives

xii
R-410A alternatives
Test results for HCFC-22 alternatives refrigerants demonstrate that:
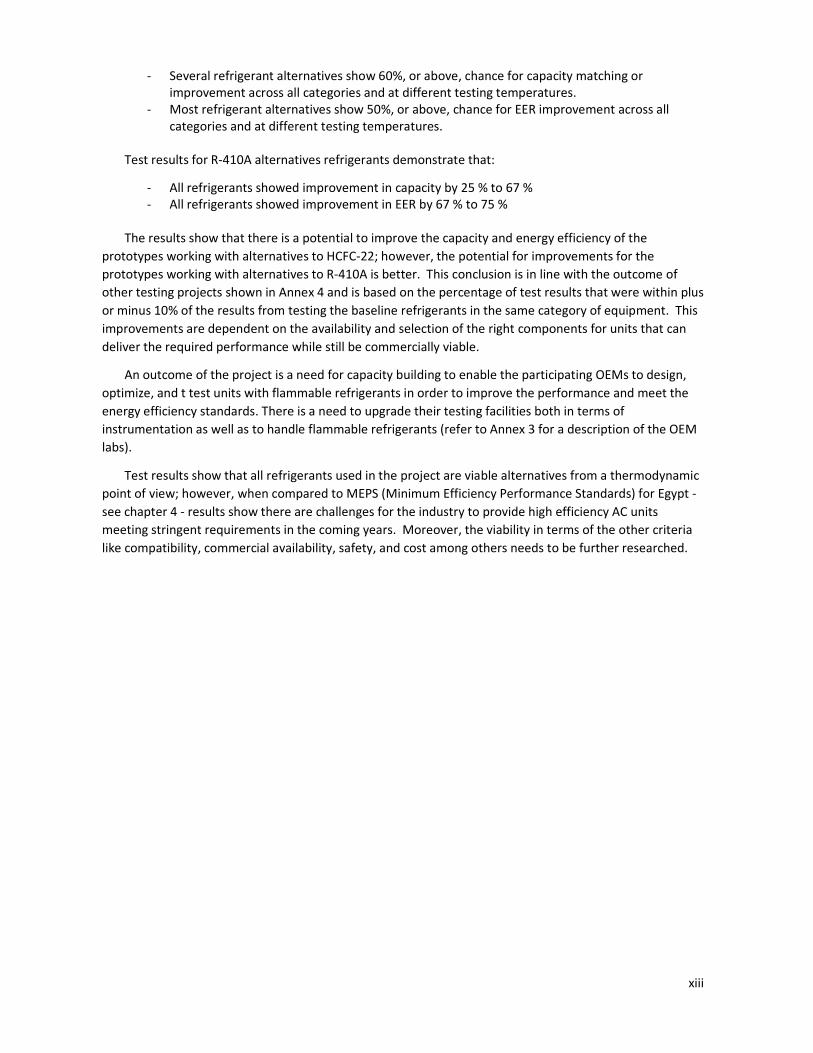
xiii
- Several refrigerant alternatives show 60%, or above, chance for capacity matching or
improvement across all categories and at different testing temperatures.
- Most refrigerant alternatives show 50%, or above, chance for EER improvement across all
categories and at different testing temperatures.
Test results for R-410A alternatives refrigerants demonstrate that:
- All refrigerants showed improvement in capacity by 25 % to 67 %
- All refrigerants showed improvement in EER by 67 % to 75 %
The results show that there is a potential to improve the capacity and energy efficiency of the
prototypes working with alternatives to HCFC-22; however, the potential for improvements for the
prototypes working with alternatives to R-410A is better. This conclusion is in line with the outcome of
other testing projects shown in Annex 4 and is based on the percentage of test results that were within plus
or minus 10% of the results from testing the baseline refrigerants in the same category of equipment. This
improvements are dependent on the availability and selection of the right components for units that can
deliver the required performance while still be commercially viable.
An outcome of the project is a need for capacity building to enable the participating OEMs to design,
optimize, and t test units with flammable refrigerants in order to improve the performance and meet the
energy efficiency standards. There is a need to upgrade their testing facilities both in terms of
instrumentation as well as to handle flammable refrigerants (refer to Annex 3 for a description of the OEM
labs).
Test results show that all refrigerants used in the project are viable alternatives from a thermodynamic
point of view; however, when compared to MEPS (Minimum Efficiency Performance Standards) for Egypt -
see chapter 4 - results show there are challenges for the industry to provide high efficiency AC units
meeting stringent requirements in the coming years. Moreover, the viability in terms of the other criteria
like compatibility, commercial availability, safety, and cost among others needs to be further researched.
1
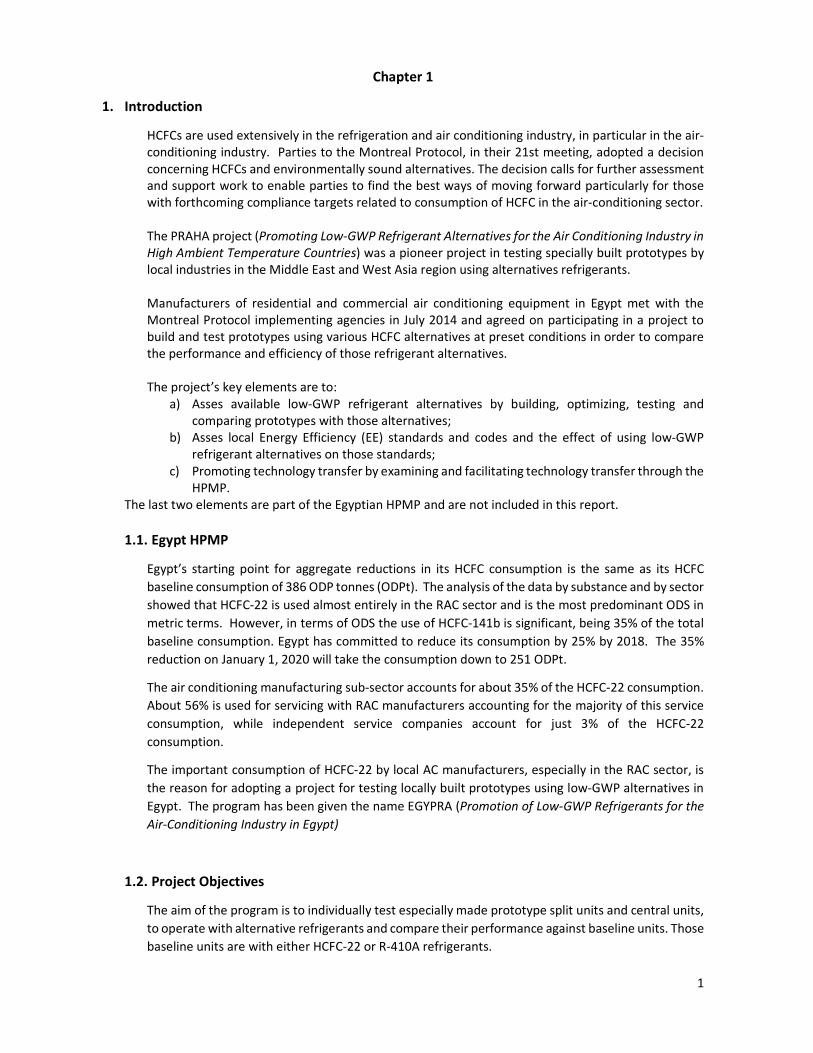
Chapter 1
1. Introduction
HCFCs are used extensively in the refrigeration and air conditioning industry, in particular in the air-
conditioning industry. Parties to the Montreal Protocol, in their 21st meeting, adopted a decision
concerning HCFCs and environmentally sound alternatives. The decision calls for further assessment
and support work to enable parties to find the best ways of moving forward particularly for those
with forthcoming compliance targets related to consumption of HCFC in the air-conditioning sector.
The PRAHA project (Promoting Low-GWP Refrigerant Alternatives for the Air Conditioning Industry in
High Ambient Temperature Countries) was a pioneer project in testing specially built prototypes by
local industries in the Middle East and West Asia region using alternatives refrigerants.
Manufacturers of residential and commercial air conditioning equipment in Egypt met with the
Montreal Protocol implementing agencies in July 2014 and agreed on participating in a project to
build and test prototypes using various HCFC alternatives at preset conditions in order to compare
the performance and efficiency of those refrigerant alternatives.
The project’s key elements are to:
a) Asses available low-GWP refrigerant alternatives by building, optimizing, testing and
comparing prototypes with those alternatives;
b) Asses local Energy Efficiency (EE) standards and codes and the effect of using low-GWP
refrigerant alternatives on those standards;
c) Promoting technology transfer by examining and facilitating technology transfer through the
HPMP.
The last two elements are part of the Egyptian HPMP and are not included in this report.
1.1. Egypt HPMP
Egypt’s starting point for aggregate reductions in its HCFC consumption is the same as its HCFC
baseline consumption of 386 ODP tonnes (ODPt). The analysis of the data by substance and by sector
showed that HCFC-22 is used almost entirely in the RAC sector and is the most predominant ODS in
metric terms. However, in terms of ODS the use of HCFC-141b is significant, being 35% of the total
baseline consumption. Egypt has committed to reduce its consumption by 25% by 2018. The 35%
reduction on January 1, 2020 will take the consumption down to 251 ODPt.
The air conditioning manufacturing sub-sector accounts for about 35% of the HCFC-22 consumption.
About 56% is used for servicing with RAC manufacturers accounting for the majority of this service
consumption, while independent service companies account for just 3% of the HCFC-22
consumption.
The important consumption of HCFC-22 by local AC manufacturers, especially in the RAC sector, is
the reason for adopting a project for testing locally built prototypes using low-GWP alternatives in
Egypt. The program has been given the name EGYPRA (Promotion of Low-GWP Refrigerants for the
Air-Conditioning Industry in Egypt)
1.2. Project Objectives
The aim of the program is to individually test especially made prototype split units and central units,
to operate with alternative refrigerants and compare their performance against baseline units. Those
baseline units are with either HCFC-22 or R-410A refrigerants.

2
The project objectives were decided upon in agreement with the local stakeholders and can be
summarized as follows:
• Orient the Egyptian air conditioning manufacturers to the new medium and low-GWP
refrigerants including those with low and high flammability;
• Support technical and policy decisions regarding long-term HCFC alternatives for the air-
conditioning industry as part of the of Egypt’s HPMP;
• Streamline the HCFC phase-out program with the Energy Efficiency work in Egypt;
• Promote the introduction of relevant standards/codes that ease the adoption of alternatives
needing special safety or handling considerations;
• Exchange the experience with other relevant initiatives and programs which aim at
addressing long term alternatives;
• Assess the capacity building and training needs for deploying low-GWP alternatives for
different groups dealing or handling refrigerants in Egypt.
The outcomes from the above objectives are not presented in this report which only presents the
results of the tests that were carried out for the various prototypes
1.3. Selection of Alternative Refrigerants
The selection of the alternative refrigerants was based on the following aspects which are derived
from decision XXIII/9 of the Meeting of Parties (MOP):
I. Commercially available;
II. Technically proven;
III. Environmentally sound;
IV. Economically viable and cost effective;
V. Safety consideration;
VI. Easy to service and maintain.
EGYPRA took into consideration the refrigerants that were tested by PRAHA and added new
alternatives that were still at an early stage of development when PRAHA was launched in 2012 even
though they were still not commercially available at the time the prototype building and testing was
done. The refrigerants were selected to replace either HCFC-22 or R-410A as shown in the two tables
below, in line with the other testing projects on alternative refrigerants. It is worth noting that
EGYPRA is a larger testing program than PRAHA, since it tested 19 specially made split unit prototypes
and 16 baseline units, a total 35 units. It also witness-tested all units at the manufacturers’ labs. In
all 140 tests were made including baseline refrigerants and eight low GWP refrigerants.
Table 1 List of HCFC-22 alternative refrigerants
Refrigerant ASHRAE classification GWP (100 years) – RTOC
HC-290 A3 5
R-444B Honeywell L-20A A2L 310
R-454C Chemours Opteon XL-20 A2L 295
R-457A Arkema ARM-20a A2L 251

3
Table 2 List of R-410A alternative refrigerants
Refrigerant ASHRAE classification GWP (100 years) – RTOC
HFC-32 A2L 704
R-447A Honeywell L-41-2 A2L 600
R-454B Chemours Opteon XL-41 A2L 510
R-459A Arkema ARM-71a A2L 466
While not all the selected refrigerants are not commercially available or cost effective at present,
they have all received “R” numbers as per ASHRAE standard 34.
1.4. Selection of Capacity Categories
The selection of prototypes to build took into consideration that the majority of the units produced
in Egypt are of the mini-split type with capacities of 12,000 Btuh, 18,000 Btuh, and 24,000 Btuh (
(equivalent to 1, 1.5, and 2 refrigeration tons). Some of the units are still manufactured with HCFC-
22 and some with HFC refrigerants which prompted building prototypes for alternatives to HCFC-22
as well as R-410A. .
Manufacturers also build what is termed as Central or Packaged units. Several manufacturers
produce these units in the 10 Tons (120,000 Btuh or 35 kW) capacity but also in larger capacities of
20 and 25 tons. A 10 Ton Central unit was added to the categories to be tested. Only HCFC-22
alternatives were used for this category. The Central category does not include a prototype with HC-
290 because of the relatively high amount of charge needed. The stakeholders preferred to wait for
the result of further risk assessment work being done in the region.
One of the technology stakeholders (Danfoss) suggested building at least one prototype with
condenser micro-channel heat exchangers (HX). Micro-channel HX technology is proven for
conventional refrigerants and uses less refrigerant charge. One of the OEMs took up the challenge
to build an extra Central unit with micro-channel HX.
Table 3 below shows the matrix of the prototypes that were agreed upon. Green highlighted areas
are for units built, while red denotes the unused portion of the central units as mentioned above.
Table 3 Matrix of prototypes showing refrigerants selected for each equipment category
Split system (mini-split) Central 120,000 Btuh
Replacement
for
12,000
Btuh
18,000
Btuh
24,000
Btuh Std. coil
micro
channel
HC-290 HCFC-22
HFC-32 R-410A
R-457C (Arkema ARM-20a) HCFC-22
R-459A (Arkema ARM -71a) R-410A
R-454C (Chemours DR-3) HCFC-22
R-454B (Chemours DR-5A) R-410A
R-444B (Honeywell L-20) HCFC-22
R-447A (Honeywell L-41) R-410A
HCFC-22 base
R-410A

4
OEMs were asked to supply from their standard manufacturing line units with baseline refrigerants
equivalent in capacity to each prototypes in order to compare units built by the same OEM.
The test results of the central units are not covered in this report.
1.5. Stakeholders:
The project stakeholders:
The Ministry of Environmental Affairs. The following entities at the ministry provided overall
supervision and monitoring of the project:
• The Egyptian Environmental Affairs Agency (EEAA): The Chief Executive Director of EEAA
has direct responsibility for the supervision of the activities of the National Ozone Unit.
• The National Ozone Unit (NOU): The NOU as an integral part of the Ministry for
Environmental Affairs may draw on the legal and technical expertise and resources of the
Ministry to undertake its responsibilities. It cooperates with other relevant divisions and field
offices of the Ministry and EEAA for carrying out its activities.
The Manufacturers (OEMs): Local manufacturers cooperated with Technology Providers to build and
test agreed upon prototypes. Eight OEMs participated in the project, listed in alphabetical order:
• DCM: (Delta Construction Manufacturing): a manufacturer of central air conditioning
equipment;
• EGAT (Egyptian German Air Treatment Company): a manufacturer of ducted split and
central air conditioners along with airside equipment for commercial and industrial air
conditioning;
• Elaraby Company for Air Conditioning: a manufacturer of air conditioners and home
appliances, Elaraby partners with Sharp on technology for air conditioning equipment;
• FRESH Electric for Home Appliances: a manufacturer of air conditioners and home
appliances;
• Miraco Carrier: a manufacturer of residential and commercial air conditioning equipment.
Miraco also partners with Midea;
• Power Egypt: a manufacturer of small and central commercial & residential air conditioning
equipment;
• Unionaire: a manufacturer of air conditioners and home appliances;
• Volta Egypt: a manufacturer of central air conditioning equipment.
Note on Confidentiality: To ensure the confidentiality of results, OEMs were given random
designations from A to H and the results were reported under this designation.
The Technology Providers: Provide sample raw materials (refrigerants, compressors, and micro-
channel coils) in addition to technical support when needed;
• Chemours (ex-DuPont): Provided refrigerants R-454C and R-454B;
• Daikin: Provided refrigerant HFC-32;
• Danfoss: provided micro-channel HX condenser coils for one central unit;
• Emerson: provided compressors for some split systems and all central units;
• GMCC: Provided compressors for some of the split systems;
• Hitachi Highly: provided compressors for some of the split systems;
• Honeywell: provided refrigerants R-444B and R-447A.

5
1.6. Methodology
The local manufacturers volunteered to build a certain number of prototypes each and provided
standard units from their production line running on the baseline refrigerants against which the
particular prototypes were compared. Baseline units are with either HCFC-22 or R-410A refrigerants.
The assignment of categories and refrigerants to each of the OEMs was based on a questionnaire in
which they listed their preferences and their capabilities to take on the work. The questionnaire can be
found in Annex 2. Coordination meetings were held with the OEMs in which some of the technology
providers were also present. These meetings and the subsequent contacts with the OEMs facilitated the
logistics of shipping both the compressors and the refrigerants to the different OEMs
The prototypes were built with the following constraints:
• Using dedicated compressors provided by the project for each type of alternative refrigerant;
• Using the same unit overall dimensions as the base unit, i.e. the heat exchangers could not be
oversized in order to compare with the baseline unit. The overall dimensions of the unit were
hence kept the same;
• Prototypes needed to meet the MEPS as set out by the Egyptian Organization for Standards EOS
3795:2013 equivalent to ISO 5151 at T1 conditions as a minimum.
• OEMs provided throttling devices (capillary, flow controls…) according to guidance from
refrigerant manufacturers for optimization.
EOS 3795:2013 stipulates for split units less than 65,000 Btuh capacity an EER of 9.5 equivalent to a COP
of 2.78 W/W at T1 conditions.
The OEMs optimized the prototypes by changing the refrigerant charge and the expansion devices. No
special coil designs were made for this project except for the micro-channel HX coils used on the central
unit. The constraint of keeping the same coils has an effect on the optimization of the prototype;
however, since the purpose of the tests is to compare to a baseline unit using HCFC-22 or R-410A
refrigerants, this constraint was accepted by the stakeholders.
The Table below shows the number and type of prototype built by each of the OEMs
Table 4 Prototypes and type of refrigerant built by the different OEMs
Category 12 000 Btuh 18 000 Btuh 24 000 Btuh
OEM HCFC-22
Alternatives
R-410 A
Alternatives
HCFC-22
Alternatives
R-410 A
Alternatives
HCFC-22
Alternatives
R-410 A
Alternatives
A R-444B R-447A R-290 HFC-32 and
R-454B
- -
B R-454C HFC-32 R-457A - R-444B -
C R-290 and
R-457C
- R-457A R-459A - HFC-32 and
R-454B
D - - R-444B - R-457C -
E R-454C R-454B - - - -

6
1.7. Testing Parameters and Facilities
EGYPRA testing protocol followed the following testing conditions:
Table 5 Testing conditions for outdoor and indoor dry and wet bulb temperatures
T1 T3 THigh TExtreme
Outdoor ᵒC db/wb 35/24 46/24 50/24 55/24
Indoor ᵒC db/wb 27/19 29/19 32/23 32/23
The indoor conditions at THigh and TExtreme are not the same as those at T3 conditions, they were chosen in
agreement with the OEMs and are in conformity with ISO 5151 which is followed in Egypt. These indoor
conditions are also not the same as in the other testing projects shown in Annex 4. Since the objective
of EGYPRA is to compare the performance of AC units with medium and low-GWP alternative refrigerants
against units with baseline refrigerants, this comparison remains true as long as the conditions of testing
are consistent.
EGYPRA testing facilities: The project managers wanted to use one independent testing lab for testing
all units in order to provide a continuity and similitude of testing. The government’s accredited lab was
contacted for that purpose; however, the lab did not have the capability of testing flammable
refrigerants. Efforts at upgrading the lab capabilities could not be finished in time for the project timeline
and the project adapted the strategy of witness testing at the manufacturers’ testing facilities. The
Technical Consultant witnessed all the tests and verified the results. A brief description of the OEM
testing facilities can be found in Annex 3.
Testing Methodology:
Testing of the units followed the Egyptian standard EOS 4814, non-ducted AC & HP testing and rating
performance. The standard is derived from ISO-5151 and is followed by all manufacturers. The
standard stipulates that,
“4.1.1.2.5 Machines manufactured for use in more than one of the climatic conditions as T3, T2 and T1
shall be rated and recorded at each of the conditions for which the unit was designed.”
The Egyptian standards do not stipulate testing at temperatures higher than T3. The THigh and TExtreme
conditions were derived from ISO 5151 with the agreement of the OEMs.
The tests were witnessed by the Technical Consultant. Re-testing the units was permitted when the
results were inconsistent or did not meet the minimum EER stipulated in EOS 3795. The Technical
Consultant advised the OEMs on possible remedies and helped them in the determination of the charge
and the expansion device setting to achieve better results.
Testing procedure
Table below describes the testing procedure applied by all OEMs
7
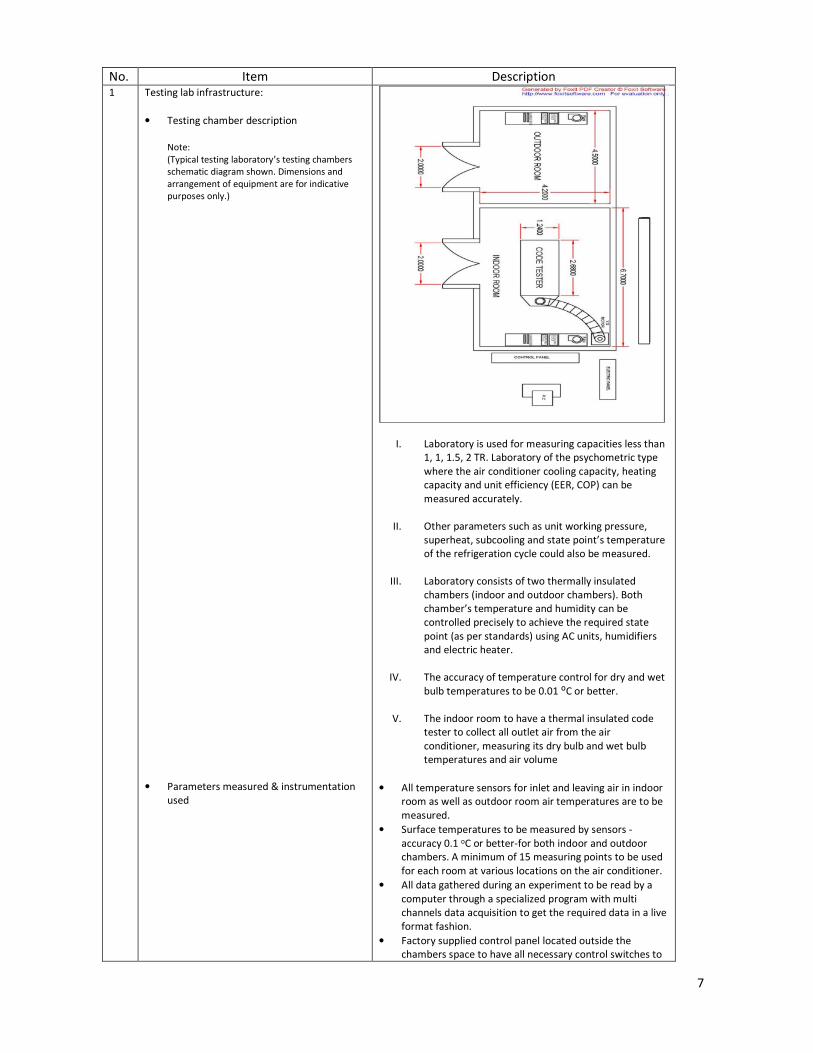
No. Item Description 1 Testing lab infrastructure:
• Testing chamber description
Note:
(Typical testing laboratory’s testing chambers
schematic diagram shown. Dimensions and
arrangement of equipment are for indicative
purposes only.)
• Parameters measured & instrumentation
used
Descriptions
I. Laboratory is used for measuring capacities less than
1, 1, 1.5, 2 TR. Laboratory of the psychometric type
where the air conditioner cooling capacity, heating
capacity and unit efficiency (EER, COP) can be
measured accurately.
II. Other parameters such as unit working pressure,
superheat, subcooling and state point’s temperature
of the refrigeration cycle could also be measured.
III. Laboratory consists of two thermally insulated
chambers (indoor and outdoor chambers). Both
chamber’s temperature and humidity can be
controlled precisely to achieve the required state
point (as per standards) using AC units, humidifiers
and electric heater.
IV. The accuracy of temperature control for dry and wet
bulb temperatures to be 0.01 ᴼC or better.
V. The indoor room to have a thermal insulated code
tester to collect all outlet air from the air
conditioner, measuring its dry bulb and wet bulb
temperatures and air volume
• All temperature sensors for inlet and leaving air in indoor
room as well as outdoor room air temperatures are to be
measured.
• Surface temperatures to be measured by sensors -
accuracy 0.1 oC or better-for both indoor and outdoor
chambers. A minimum of 15 measuring points to be used
for each room at various locations on the air conditioner.
• All data gathered during an experiment to be read by a
computer through a specialized program with multi
channels data acquisition to get the required data in a live
format fashion.
• Factory supplied control panel located outside the
chambers space to have all necessary control switches to
8
operate the laboratory and set the required conditions
with power meters for single phase and 3 phase and all
electrical data for tested units. Data to be measured and
transferred to computer system.
2 Standards to be used:
All tests for cooling and heating performance to be performed
according to the following standards:
• EOS 4814 non-ducted AC & HP testing and rating
performance
• ASHRAE testing standards
• ISO 5151 for non-ducted air conditioners
• ISO 13253 for ducted type split
• EOS 3795-1/2016
• EOS 3795-2/2017
3 Description of the testing procedures:
• Description of testing method
• Method of selection of capillary tube and
choosing refrigerant charge
• Achieving steady state for outdoor and
indoor conditions (description, time
needed…)
• Psychometric testing method is used as per ISO 5151-
2017 annex C, G.
Air flow rates are to be measured through nozzles for
both entering and leaving dry and wet bulb temperatures.
• Optimum selection of capillary size, length, number and
refrigerant charge to achieve good matching and
improved performance for the unit according to the
following:
i) Select from preliminary capillary chart size,
number and length of the required capillary to
match the specified load.
ii) Accumulated experience plays an important role in
determining the preliminary refrigerant charge.
iii) Testing the unit based on pervious selections give
an indication for system optimization including
increasing or decreasing the charge and/or the
size of the capillary.
iv) System pressure, superheat, subcooling, power
consumption, cooling capacity and refrigerant
temperature at various points of the cycle give a
strong indication on how the matching is
proceeding.
• 2 hours’ time are needed as a minimum to achieve the
steady state condition for testing cooling capacity of the
unit
as well as EER or COP.
4 Calculating EER and capacity:
• How the EER is calculated measurements
used and formula
• How the capacity was calculated
measurements used and formula
EER= cooling capacity/ total power consumed by the system in
Btuh/W or equivalent.
As per ISO 5151 see equations in annex C
5 The air psychometric process:
• The cycle on psychometric chart
• Explanation of state points at T1, T3, Th and
Text
• Test result to provide all required information to draw the
cycle on Psychometric chart:
o EDB,LDB,EWB,LDB (E=Enthalpy)
• Test result to provide all required data to draw and
change, when needed, the cycle on the PH diagram:
o High pressure.
o Compressor discharge temp.
o Subcooling amount in condenser.
o Low pressure.
o Compressor suction temperature.
o Superheat amount in evaporator
for all required tests T1, T3, Th and Text .

9
Chapter 2
2. Results
The results of the various tests were combined under two major headings: results of alternatives to HCFC-
22 and results of alternatives to R-410A. The presentation or comparison of results across the two major
headings does not lead to tangible conclusions while the separation of the discussion under the two
baseline refrigerants leads to a better understanding of the information.
The casual reading of the results may establish confusion, even among specialists, in relation to the
increase in capacity at T High compared to T3. This result is not witnessed in other similar research projects;
however, by understanding the impact of changing the dry bulb and wet bulb indoor testing conditions i.e.
Thigh (outdoor 50/24 ⁰C, indoor 32/24 ⁰C) compared to T3 (outdoor 46/24 ⁰C, indoor 29/19 ⁰C), the results
can be justified using the modeling approach explained below. The additional exercise to review and
validate all results is the reason for the unplanned delay in concluding the project report.
Modeling Using ORNL Heat Pump Design Model
Since the measurements provided by the labs were somehow limited, it was difficult to explain the
hypothesis for the increase in performance under T High conditions. As such, a full-scale modeling using the
ORNL Flexible Heat Pump Model was performed on a sample packaged air conditioning system and the
indoor and outdoor conditions were changed according to the EGYPRA conditions: T1, T3, THot, and THigh.
Table 5 above provides a summary of the indoor and ambient conditions for the four simulations along
with the capacity ratio (capacity/capacity at T1), compressor mass flow rate, compressor power, sensible
heat ratio (SHR), and evaporator overall area integral heat transfer for the vapor (UA_vap) and the 2 phase
(UA_2-ph) portions respectively.
The THot condition was selected to simulate the same ambient conditions as that tested by the OEMs but
with the same indoor conditions as T1 and T3. The results for this simulation follows the simple intuition
that as the ambient temperature increases, the performance degrades at a rough order of magnitude of 1%
point per 1°C of outdoor temperature increase. However, when examining the performance of the THigh
condition; we notice a sudden increase in capacity – coupled with an increase in refrigerant mass flow rate,
and reduction in SHR. The simulation results show that for T1, T3 and THot conditions, the suction saturation
temperature change was less than 1°C, while when the indoor conditions were changed to the THigh
condition, the suction saturation temperature changed by more than 4°C. This has an impact on the
compression ratio, compressor suction density, and compressor performance (volumetric and isentropic
efficiencies). Furthermore, the higher humidity associated with the THigh condition induces the evaporator
coil to become wetter and as such results in higher airside performance and higher SHR.
Table 6: Conditions and relevant results for the rooftop unit simulated using the ORNL Flexible HPDM simulation tool
Co
nd
itio
n
ED
B
EW
B
Am
bie
nt
Ca
pa
city
/Ca
pa
city
at
T1
Co
mp
ress
or
ma
ss f
low
ra
te
Co
mp
ress
or
Po
we
r
SH
R
Ev
ap
ora
tor
va
po
r U
A
Ev
ap
ora
tor
2-
ph
UA
°C °C °C % g/s W % W/K W/K
T1 29 19 35 100% 379.8 14,074.9 88% 5.6 265.7
T3 29 19 46 89% 383.7 16,952.9 93% 6.7 265.1
THot 29 19 50 86% 384.6 18,077.2 95% 6.7 265.2
THigh 32 23 50 94% 433.9 18,693.8 78% 9.4 261.3

10
Hypothesis summary
When the indoor dry bulb and wet bulb temperatures are increased from the T3 conditions to the THigh
conditions; the sensible heat ratio of the AC system is reduced, and a large portion of the evaporator is
wetted by the condensate. This results in heat transfer enhancement due to reduced free flow area and
increased surface velocity and the concurrence of heat and mass transfer at the tubes and fin surfaces.
From further analysis provided by the detailed study from OEM C; the evaporator log mean temperature
difference is also increased due to the increased air inlet temperature. Hence on the air side, both the
increase in overall heat transfer coefficient along with the increased evaporator LMTD and increased latent
capacity contribute directly to the increased heat capacity between T3 and T3 with elevated indoor
conditions (subsequently also the increased capacity at the THigh conditions).
At the refrigerant side, when the indoor conditions are changed from the T3 to the THigh conditions – the
compressor pressure ratio is reduced while the compressor inlet density is increased. The refrigerant flow
rate also increases which further justifies the increased cooling capacity from the refrigerant side analysis.
2.1 Presentation and Analysis of Results
The analysis of the results is presented in table form. The complete results and comparative bar charts are
found in Annex 1.
The Results for capacity in Btuh and energy efficiency in EER (energy efficiency ratio in MBH output/ kW
input) are given for the four testing temperatures. The tables show the test results and the percentage
increase or decrease in capacity and EER compared to the baseline unit. As a reminder, each OEM was
asked to test a baseline unit from their own standard production for each prototype built in order to
compare with the results.
The analysis uses shades of color to denote the comparison level to the baseline unit as follows:
No shading Performance is same as base unit – for capacity and EER
Green Increase in EER or cooling capacity over baseline unit
Yellow Decrease in EER or cooling capacity by - 0.01 % to - 5 %
Orange Decrease in EER or cooling capacity from -5 % to - 10 %
Red Decrease in EER or cooling capacity over -10 %
The results are then plotted on a scattered chart for the ratio of capacity of the prototype to that of the
baseline unit vs. the EER ratio at the four testing temperatures. The baseline unit performance is denoted
by the two red dotted lines at a ratio of one for both capacity and EER.
The analysis is presented for the alternatives of HCFC-22 and R-410A separately. Some results for
inconclusive tests mentioned in the Annex were not used in the analysis.
2.1.1. Analysis of Capacity and EER Performance for HCFC-22 Alternatives
The tables in this section are for alternatives to HCFC-22 for the three categories of mini-split units: 12,000
Btuh, 18,000 Btuh, and 24,000 Btuh.

11
Results for the 12,000 Btuh category
Table 7 Comparison of HCFC-22 alternatives for 12,000 Btuh split units
The table shows that for HC-290, the capacity of the prototype at all four temperatures is less than that of
HCFC-22 baseline, while the EER is higher at T1 and within 1% at T3 and THigh. The results for R-457A and R-
454C show results for capacity up to 10% less than the baseline with R-457A showing a better capacity at
Thigh which is not the case for R-454C. For R-444B, capacity is better than the baseline at both T1 and
TExtreme but 10% worse at THigh which cannot be explained. EER for R-444B is more than 10% worse than the
baseline. Plotted on a scattered chart as follows
Figure 1 Capacity vs. EER ratio for HCFC-22 alternatives in 12,000 Btuh split units
T1
T3
Thigh
TExt
T1T3
T high
Text
T1T3
Thigh
TExt
T1
T3Thigh
TExt
T1
T3
T high
TExt
0.400
0.500
0.600
0.700
0.800
0.900
1.000
1.100
1.200
0.400 0.500 0.600 0.700 0.800 0.900 1.000 1.100 1.200
Ca
pa
city
/Ca
pa
city
HC
FC
-22
EER / EER HCFC-22
12,000 Btuh - HCFC-22 Capacity vs EER RatioR-290 OEMC ARMA-20a (R-457A) OEMCL-20 R444B OEMA OPTEON XL-20 DR-3 R-454C OEMBOPTEON XL-20 DR-3 R-454C OEME
HFCF-22
12,000 Btuh T1 T3 T High T Extreme T1 T3 T High T Extreme
Capacity in Btuh EER
Base Units
R-22(OEM C)
R-22(OEM B)
R-22(OEM A)
11,452
11,410
11,479
9,960
9,988
9,699
10,560
10,900
11,353
10,181
10,035
8,407
10.0
8.41
9.74
7.25
6.38
6.88
6.98
6.33
7.31
6.23
5.47
5.61
Prototypes
HC-290
(OEMC)
10,219
(-10.77%)
8,677
(-12.88%)
9,289
(-12.04%)
7,747
(-23.91%)
10.36
(+3.53%)
7.17
(-1.1%)
6.96
(-0.23%)
5.22
(-16.2%)
R-457A
(OEM C)
11,023
(-3.75%)
9,376
(-5.86%)
10,892
(+3.14%)
9,517
(-6.52%)
8.36
(-16.44%)
6.24
(-13.93%)
6.58
(-5.63%)
5.56
(-10.83%)
R-454 C
(OEM B)
10,968
(-3.87%)
9,349
(-6.40%)
9,946
(-8.75%)
9,042
(-9.90%)
7.97
(-5.23%)
6.00
(-5.96%)
5.86
(-7.42%)
5.05
(-7.68%)
R-444 B
(OEM A)
11,790
(+2.71%)
9,661
(-0.39%)
10,241
(-9.79%)
8,881
(+5.64%)
8.43
(-13.45%)
5.73
(-16.72%)
5.53
(-24.35%)
4.47
(-20.32%)

12
Results for 18,000 Btuh Splits
Table 8 Comparison of HCFC-22 alternatives for 18,000 Btuh split units
18,000 Btuh T1 T3 T High T Extreme T1 T3 T High T Extreme
Refrigerant Capacity EER
Baseline Units
HCFC-22
OEM A
OEM B
OEM C
OEM D
18,659
16,433
18,160
17,548
16,799
14,545
16,182
16,422
17,543
13,718
17,632
14,624
15,046
15,350
16,292
13,948
9.41
8.93
10.00
10.50
7.20
6.65
7.37
8.75
6.98
6.37
7.37
7.22
5.55
5.33
6.45
6.00
Prototypes
R-290
(OEM A)
16,111
(-13.66%)
14,067
(-16.26%)
15,343
(-12.54%)
13,442
(-10.66%)
9.31
(-1.06%)
7.090
(-2.34%)
7.170
(+2.72%)
5.860
(+5.59%)
R-444 B
(OEM D)
17,098
(-2.56%)
15,746
(-4.12%)
13,498
(-7.70%)
13,047
(-6.46%)
10.00
(-4.76%)
7.78
(-11.01%)
6.32
(-12.47%)
5.40
(-10.00%)
R-454 C
(OEM C)
16,510
(-9.09%)
14,327
(-11.46%)
15,619
(-11.42%)
14,250
(-12.53%)
9.31
(-6.88%)
6.97
(-5.43%)
7.01
(-4.88%)
6.02
(-6.67%)
R-457 A
(OEM B)
15,257
(-7.16%)
12,672
(-12.88%)
13,418
(-2.19%)
12,149
(-20.85%)
9.26
(+3.70%)
6.59
(-0.90%)
6.31
(-0.94%)
5.33
(0.00%)
The results for HC-290 for capacity are consistent with the results of the 12,000 Btuh category, while the
EER shows better results than the baseline at T High and T Extreme. The results for R-457C capacity compared to
the 12,000 Btuh category show a further degradation compared to the baseline for the 18,000 Btuh
category, while the EER results at the four temperatures are better than the 12,00 Btuh category. The
same can be said about R-454C, while R-444B has comparable results with the 12,000 Btuh category with a
variation with temperature. The results of this category show higher values for both capacity and EER for T
High results compared to T3 in line with the discussion at the beginning of this chapter.
Figure 2 Capacity vs EER Ratio for HCFC-22 alternatives in 18,000 Btuh split units

13
Results for 24,000 splits
Table 9 Comparison of HCFC-22 alternatives for 24,000 Btuh split units
24,000 Btuh T1 T3 T High T Extreme T1 T3 T High T Extreme
Refrigerant Capacity EER
Baseline
HCFC-22
OEM B
OEM D
22,782
22,318
N/A
21,202
N/A
20,144
N/A
19,148
9.27
9.30
N/A
7.32
N/A
6.10
N/A
5.73
Prototypes
R-444 B
(OEM B)
23,436
(+2.87%)
N/A
N/A
N/A
7.38
(-20.39%)
N/A
N/A
N/A
R-457 A
(OEM D)
21,758
(-2.51%)
20,670
(-2.51%)
19,636
(-2.52%)
18,657
(-2.56%)
8.78
(-5.59%)
6.85
(-6.42%)
5.82
(-4.59%)
5.25
(-8.38%)
Unfortunately, the data for R-444B at temperatures other than T1 were not available. Data for R-457A as a
percentage of the baseline by the same OEM show a better trend than for the other two categories;
however, in absolute terms the EER of the baseline of the 24,000 Btuh category is lower than the other two
categories which explains the higher percentage.
Figure 3 Capacity vs. EER ratio for HCFC-22 alternatives in 24,000 Btuh split units
Note that the results for the capacity for R-457A at the four temperatures are similar and hence the yellow
circle label points seem almost concentric.
T3 T1
Thigh
TExtT1
0.400
0.500
0.600
0.700
0.800
0.900
1.000
1.100
1.200
0.400 0.500 0.600 0.700 0.800 0.900 1.000 1.100 1.200
Ca
pa
city
/ca
pa
city
HC
FC
-22
EER / EER HCFC-22
24K Capacity vs EER RATIO
ARM-20a
R-457A OEM D
L-20
R-444B OEM B

14
2.1.2. Analysis of Capacity and EER Performance for R-410A Alternatives
Results for 12,000 Btuh splits
Table 10 Comparison of R-410A alternatives for 12,000 Btuh split units
12,000 T1 T3 T High T Extreme T1 T3 T High T Extreme
Refrigerant Capacity EER
Baseline
R-410A
OEM A
OEM B
OEM E
10,307
12,068
11,905
N\A
10,343
9,369
8,313
11,089
10,848
N\A
9,968
9,299
8.77
10.17
10.88
N\A
7.31
7.29
5.43
7.15
7.42
N\A
5.93
5.89
Prototype
HFC-32
(OEM B)
11355
(-5.91%)
9,249
(-10.58%)
9,822
(-11.435)
8,499
(-14.74%)
11.51
(+13.18%)
7.53
(+3.01%)
7.26
(+1.54%)
5.69
(-4.05%)
R-454B
(OEM E)
11,987
(+0.69%)
11130
(+18.8%)
12,257
(+12.99%)
11,094
(+19.30%)
9.92
(-8.82%)
7.95
(+9.05%)
7.66
(+3.27%)
6.7
(+14.90%)
R-447A
(OEM A)
9963
(-3.34%)
N\A
N\A
8539
(+2.72%)
N\A
N\A
8.38
(-4.45%)
N\A
N\A
5.55
(+2.21%)
N\A
N\A
The results for R-454B compared to the baseline is better except for the EER at T1. Results for HFC-
32 compared to the baseline show a higher performance for EER but lower for capacity.
Figure 4 Capacity vs EER ratio for R-410a alternatives in 12,000 Btuh split units
T1T3
Thigh
TExt
T1
T3
Thigh
Text
T1
Thigh
0.600
0.700
0.800
0.900
1.000
1.100
1.200
0.400 0.500 0.600 0.700 0.800 0.900 1.000 1.100 1.200
CA
P /
CA
P R
41
0A
EER / EER R410A
12K Capacity ratio Vs EER ratioR-32 OEMB Opteon XL-41 DR-5
R-454B
L-41 R447A

15
Results for 18,000 Btuh
Table 11 Comparison of R-410A alternatives for 18,000 Btuh split units
18,000 T1 T3 T High T Extreme T1 T3 T High T Extreme
Refrigerant Capacity EER
Baseline
R- 410 A
OEM A
OEM C
16,938
17,800
14,337
14,924
14,123
16,075
12,441
13,746
9.8
9.15
6.8
6.50
6.3
6.49
5.1
5.12
Prototype
R-459A
(OEM C)
17,115
(-3.85%)
14,430
(-3.31%)
15,392
(-4.25%)
14,023
(+2.02%)
9.28
(+1.42%)
6.54
(+0.72%)
6.27
(-3.39%)
5.32
(+3.99%)
HFC-32
(OEM A)
17616
(+4.00%)
15,255
(+6.40%)
15,761
(+11.60%)
13,809
(+11.00%)
10.03
(+2.35%)
7.10
(+4.41%)
6.65
(+5.56%)
5.29
(+3.73%)
R-454B
(OEM A)
15,167
(-10.46%)
13,229
(-7.73%)
13,782
(-2.41%)
11,800
(-5.15%)
9.5
(-3.06%)
6.90
(+1.47%)
6.50
(+3.17%)
5.20
(+1.96%)
The results for R-454B show a similar trend of higher values against the baseline to the 12,000 Btuh
category for EER but lower for capacity. Results for HFC-32 are higher than the baseline for both
capacity and EER, which is different from the 12,000 Btuh category.
Figure 5 Capacity vs EER ratio for R-410A alternatives in 18,000 Btuh split units
The plot shows that most of the results are on the positive side when compared to the baseline units for
EER with some results for capacity showing lower values.
T1
T3
T high
TExt
T1T3
Thigh
TExt
T1T3
Thigh
Text
0.6
0.7
0.8
0.9
1
1.1
1.2
0.4 0.5 0.6 0.7 0.8 0.9 1 1.1 1.2
CA
P /
CA
P R
41
0A
EER / EER R410A
18K Capacity ratio Vs EER ratio
ARM-71a
R-459A OEM C
R-32 OEM A Opteon XL-41 DR-5
R-454B OEM A

16
Results for 24,000 Btuh
Table 12 Comparison of R-410A alternatives for 24,000 Btuh split units
24,000 T1 T3 T High T Extreme T1 T3 T High T Extreme
Refrigerant Capacity EER
Baseline
R- 410 A
OEM C
23022
19531
20534
18379
10.57
7.518 7.376
6.161
Prototype
HFC-32
(OEM C)
23310
(+1.25%)
19522
(-0.05%)
21876
(+6.54%)
19035
(+3.57%)
10.62
(-0.47%)
7.228
(-3.86%)
7.459
(+1.13%)
5.988
(-2.81%)
R-454B
(OEM C)
23766
(+3.23%)
20241
(+3.64%)
22268
(+8.44%)
20160
(+9.69%)
10.653
(+0.79%)
7.516
(-0.03%)
7.515
(+1.88%)
6.224
(+1.02%)
Results are mostly positive for the two refrigerants tested at this category.
Figure 6 Capacity vs EER ratio for R-410A alternatives in 24,000 Btuh split units
T1T3
Thigh
TExt
T1
T3
Thigh
Text
0.600
0.700
0.800
0.900
1.000
1.100
1.200
0.400 0.500 0.600 0.700 0.800 0.900 1.000 1.100 1.200
CA
P /
CA
P R
41
0A
EER / EER R410A
24K Capacity ratio Vs EER ratioR-32 OEM C Opteon XL-41 DR-5
R-454B OEM C

17
Chapter 3
3. Analytical comparison & way forward
The purpose of the comparative analysis in this section is to determine the potential for improvement
for the different alternative refrigerants at the different testing temperatures and for the three
categories. Since we have three variables: refrigerants, testing temperatures, and category of
equipment, the analysis fixed one of the variables and then calculated the percentage of incidence of
cases where either the capacity or the EER are compared to the base unit falls in the five color
categories defined earlier and repeated here for ease of reference.
No shading Performance is same as base unit
Green Increase in performance or cooling capacity over base unit
Yellow Decrease in performance or cooling capacity by - 0.01 % to - 5 %
Orange Decrease in performance or cooling capacity from -5 % to - 10 %
Red Decrease in performance or cooling capacity over -10 %
As an example, consider the 12,000 Btuh category for all refrigerants and at all testing temperatures for
the capacity comparison. We come up with the following table:
Table 13 Example of calculation of the comparative pie charts
12,000 Btuh category Capacity Refrigerant T1 T3 THigh TExtreme
R-290 10219 8677 9289 7747 (OEM C) (-10.77%) (-12.88%) (-12.04%) (-23.91%) R-457 A 11023 9376 10892 9517 (OEM C) (-3.75%) (-5.86%) (+3.14%) (-6.52%)
R-454 C 10968 9349 9946 9042
(OEM B) (-3.87%) (-6.40%) (-8.75%) (-9.90%) R-444 B 11790 9661 10241 8881 (OEM A) (+2.71%) (-0.39%) (-9.79%) (+5.64%) Calculation of incidence percentage
Green Yellow Orange Red No shading
Incidence: number of
entries per color 3 3 6 4 0
Percentage of the 16
entries 18.75% 18.75% 37.5% 25% 0%
And the respective pie chart will look as in Figure 7 with the percentage of each incidence marked on
the respective color. The pie chart is telling us that when we consider all the HCFC-22 refrigerant
alternatives at all testing temperatures for the 12,000 category, there is
• 18.75% certainty that the result is better than the base,
• 18.75% that the result is up to 5% less compared to the base,
• 37.5% that the result between 5 and 10% less, and
• 25% that the results is over 10% less than the base.
Similar comparative analysis will be made for the different cases for HCFC-22 alternatives and R-410A
alternatives. The analysis clarifies the way forward and recommendations can be made for all the
cases.

18
Figure 7 Example of pie chart for HCFC-22 alternatives in the 12,000 Btuh category
3.1. Capacity and EER behaviour of HCFC-22 Alternatives for each category across all
refrigerants and testing temperatures
Figure 8 capacity and EER Performance of HCFC-22 alternatives for each category across all refrigerants and all testing
temperatures
This analysis shows the following key observations:
For 12,000 Capacity:
- There is, certainly, potential to improve the capacity across 75% of refrigerants and at different
testing temperatures
- On the EER side, the potential improvement drops down to 50%
For 18,000 Capacity:
- There is less potentiality to improve capacity across all refrigerants and at different testing
temperatures compared to the 12,000 category.
- However, opportunities to improve EER is much higher reaching over 85% across all refrigerants
and at different testing temperatures
The 24,000 prototypes results were disregarded, since only one OEM tested one refrigerant across all test
temperatures conditions. The other OEM tested another refrigerant at only one testing temperature
condition. Therefore, a comparison of the results would be misleading.
18.75
18.7537.5
25
Allternatives to HCFC-22
Capacity % performance change for all
Refrigerants and Temperatures 12,000 BTUh
category
18.75
18.7537.5
25
Alt-R22_Capacity_% performance
change_12000 for all Ref's & T's
18.75
2556.25
Alt-R22_Capacity_% performance
change_18000 for all Ref's & T's
6.2512.5
31.25
50
Alt-R22_EER_% performance change_12000 for
all Ref's & T's
18.75
37.5
25
12.5 6.25
Alt-R22_EER_% performance
change_18000 for all Ref's & T's
19
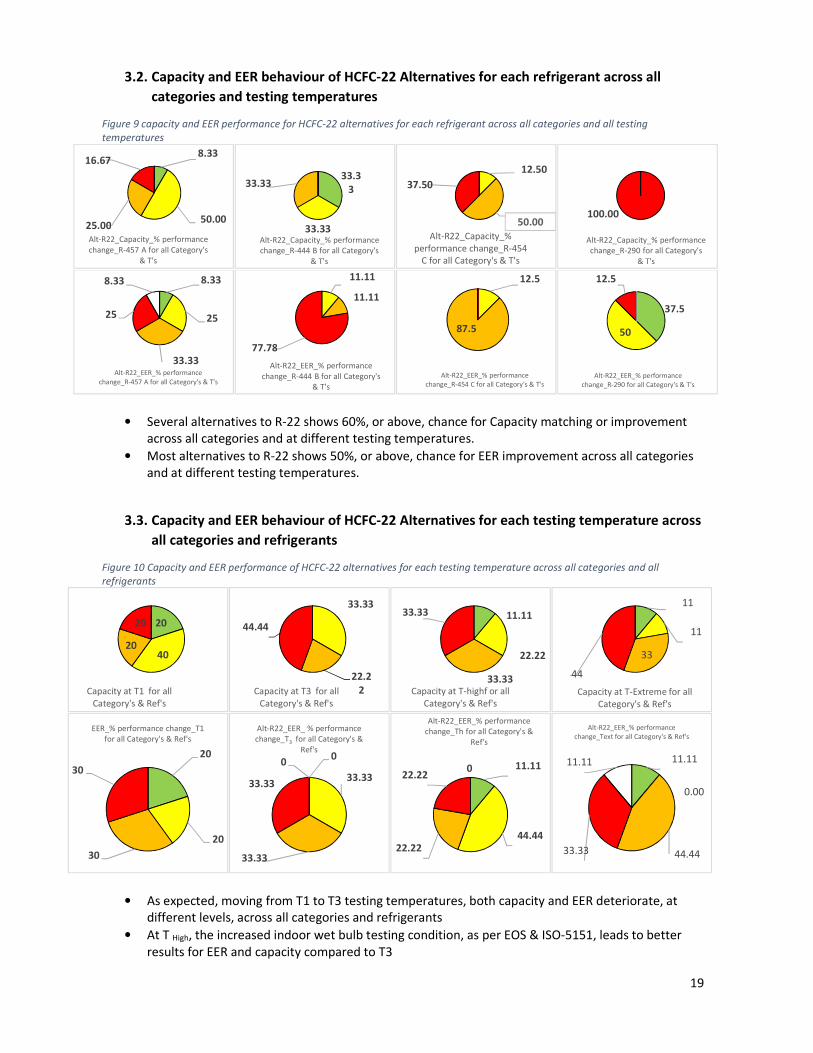
3.2. Capacity and EER behaviour of HCFC-22 Alternatives for each refrigerant across all
categories and testing temperatures
Figure 9 capacity and EER performance for HCFC-22 alternatives for each refrigerant across all categories and all testing
temperatures
• Several alternatives to R-22 shows 60%, or above, chance for Capacity matching or improvement
across all categories and at different testing temperatures.
• Most alternatives to R-22 shows 50%, or above, chance for EER improvement across all categories
and at different testing temperatures.
3.3. Capacity and EER behaviour of HCFC-22 Alternatives for each testing temperature across
all categories and refrigerants
Figure 10 Capacity and EER performance of HCFC-22 alternatives for each testing temperature across all categories and all
refrigerants
• As expected, moving from T1 to T3 testing temperatures, both capacity and EER deteriorate, at
different levels, across all categories and refrigerants
• At T High, the increased indoor wet bulb testing condition, as per EOS & ISO-5151, leads to better
results for EER and capacity compared to T3
8.33
50.0025.00
16.67
Alt-R22_Capacity_% performance
change_R-457 A for all Category's
& T's
33.3
3
33.33
33.33
Alt-R22_Capacity_% performance
change_R-444 B for all Category's
& T's
12.50
50.00
37.50
Alt-R22_Capacity_%
performance change_R-454
C for all Category's & T's
100.00
Alt-R22_Capacity_% performance
change_R-290 for all Category's
& T's
8.33
25
33.33
25
8.33
Alt-R22_EER_% performance
change_R-457 A for all Category's & T's
11.11
11.11
77.78
Alt-R22_EER_% performance
change_R-444 B for all Category's
& T's
12.5
87.5
Alt-R22_EER_% performance
change_R-454 C for all Category's & T's
37.5
50
12.5
Alt-R22_EER_% performance
change_R-290 for all Category's & T's
20
4020
20
Capacity at T1 for all
Category's & Ref's
33.33
22.2
2
44.44
Capacity at T3 for all
Category's & Ref's
11.11
22.22
33.33
33.33
Capacity at T-highf or all
Category's & Ref's
11
11
33
44
Capacity at T-Extreme for all
Category's & Ref's
20
20
30
30
EER_% performance change_T1
for all Category's & Ref's
0
33.33
33.33
33.33
0
Alt-R22_EER_ % performance
change_T3 for all Category's &
Ref's
11.11
44.4422.22
22.220
Alt-R22_EER_% performance
change_Th for all Category's &
Ref's
11.11
0.00
44.4433.33
11.11
Alt-R22_EER_% performance
change_Text for all Category's & Ref's

20
• Since T Extreme testing condition is similar to T High, with regard to indoor wet bulb testing condition,
both EER and capacity re-deteriorate.
• In general, there are candidates with potential improvement, more than 50%, across all categories
at all high temperature testing conditions i.e. T3, T high & T extreme.
3.4. Capacity and EER behaviour of R-410A Alternatives for each category across all
refrigerants and testing temperatures
Figure 11 capacity and EER performance of R-410A alternatives for each category across all refrigerants and all testing
temperatures
• Increase in capacity as category size increases, across all refrigerants and all testing temperate
conditions.
• Capacity increases are from 50 % to 87.5 %.
• However, EER decreased as category size increases.
• EER improvement decreases from 70 % to 50 %.
• 18,000 showed capacity readings for all ranges similar to EER readings.
• 18,000 in the range (-0.1 % to - 5 %) readings for both capacity and EER were the same, 33.33 %
instead of 10 % and 20 % in 12,000 size.
• The possibility of improving by optimization capacity and EER compared to R-410A are high
3.5. Capacity and EER behaviour of R-410A Alternatives for each refrigerant across all
categories and testing temperatures
Figure 12 Capacity and EER performance of R-410A alternatives for each refrigerant across all categories and all testing
temperatures
50
1010
30
Alt-R410 A_Capacity_% performance
change_12000 for all Ref's & T's
41.67
33.33
16.67
8.33
Alt-R410 A_Capacity_% performance
change_18000 for all Ref's & T's
87.5
12.5
Alt-R410 A_Capacity_% performance
change_24000 for all Ref's & T's
70
20
10
Alt-R410 A_EER_% performance change_12000
for all Ref's & T's
41.67
33.33
16.67
8.33
Alt-R410 A_Capacity_% performance
change_18000 for all Ref's & T's
5050
Alt-R410 A_EER_% performance
change_24000 for all Ref's & T's
5050
Alt-R410 A_Capacity_%
performance change_R-447 A for
all Category's & T's
25
75
Alt-R410 A_Capacity_%
performance change_R-459 A for
all Category's & T's
66.678.33
16.67
8.33
Alt-R410 A_Capacity_%
performance change_R-454 B for
all Category's & T's
58.33
8.33
8.33
25.00
Alt-R410 A_Capacity_%
performance change_R-32 for all
Category's & T's
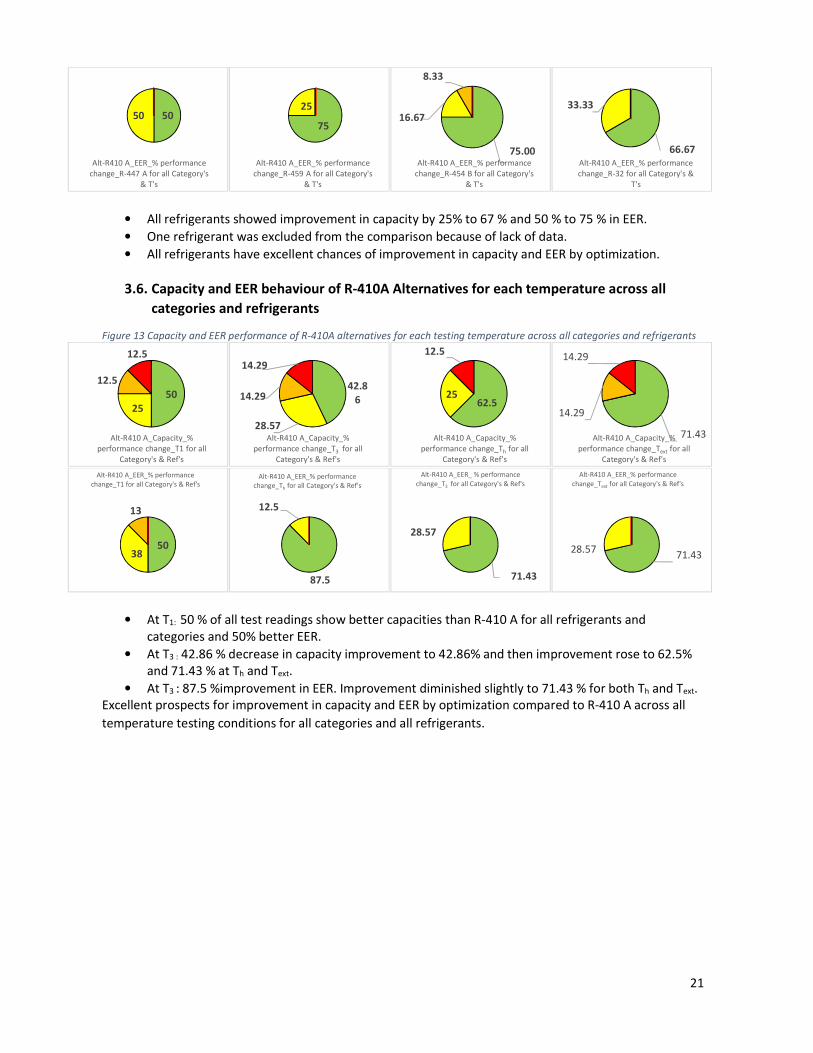
21
• All refrigerants showed improvement in capacity by 25% to 67 % and 50 % to 75 % in EER.
• One refrigerant was excluded from the comparison because of lack of data.
• All refrigerants have excellent chances of improvement in capacity and EER by optimization.
3.6. Capacity and EER behaviour of R-410A Alternatives for each temperature across all
categories and refrigerants
Figure 13 Capacity and EER performance of R-410A alternatives for each testing temperature across all categories and refrigerants
• At T1: 50 % of all test readings show better capacities than R-410 A for all refrigerants and
categories and 50% better EER.
• At T3 : 42.86 % decrease in capacity improvement to 42.86% and then improvement rose to 62.5%
and 71.43 % at Th and Text.
• At T3 : 87.5 %improvement in EER. Improvement diminished slightly to 71.43 % for both Th and Text.
Excellent prospects for improvement in capacity and EER by optimization compared to R-410 A across all
temperature testing conditions for all categories and all refrigerants.
5050
Alt-R410 A_EER_% performance
change_R-447 A for all Category's
& T's
75
25
Alt-R410 A_EER_% performance
change_R-459 A for all Category's
& T's
75.00
16.67
8.33
Alt-R410 A_EER_% performance
change_R-454 B for all Category's
& T's
66.67
33.33
Alt-R410 A_EER_% performance
change_R-32 for all Category's &
T's
50
25
12.5
12.5
Alt-R410 A_Capacity_%
performance change_T1 for all
Category's & Ref's
42.8
6
28.57
14.29
14.29
Alt-R410 A_Capacity_%
performance change_T3 for all
Category's & Ref's
62.525
12.5
Alt-R410 A_Capacity_%
performance change_Th for all
Category's & Ref's
71.43
14.29
14.29
Alt-R410 A_Capacity_%
performance change_Text for all
Category's & Ref's
5038
13
Alt-R410 A_EER_% performance
change_T1 for all Category's & Ref's
87.5
12.5
Alt-R410 A_EER_% performance
change_Th for all Category's & Ref's
71.43
28.57
Alt-R410 A_EER_ % performance
change_T3 for all Category's & Ref's
71.4328.57
Alt-R410 A_EER_% performance
change_Text for all Category's & Ref's

22
Chapter 4
4. Energy Efficiency and Progressive Changes in MEPS for Egypt
Egypt’s MEPS (Minimum Energy Performance Standards) energy efficiency label requirement for mini
split air conditioning units and window type, ES: 3795-/2013 and ES: 3795-/2016 Part 1-for constant
speed compressors- define EER (BTU/W.hr) at T1 condition (ISO 5151) across several efficiency classes,
A 5+ to E as listed in the tables below according to regulation years, 2014 to 2021.
MEPS progression across the years:
The standards, starting June 2014, lists EER values for energy efficiencies that define a certain class,
termed calibration level, starting from E to A++, see table below.
Table 14: Egypt Energy Ratings per 2014 Standard
Calibration Energy Efficiency ratio of a room air conditioner (Split AC)
Watt/ Watt B.T.U/ Watt/h
A++ Higher or equal to 4,1 Higher or equal to 14
A+ Higher than or equal to 3, 81 and less
than 4,1
Higher or equal to 13 and less than 14
A Higher than or equal to 3, 51 and less
than 3, 81
Higher or equal to 12 and less than 13
B Higher than or equal to 3, 22 and less
than 3, 51
Higher or equal to 11 and less than 12
C Higher than or equal to 3, 08 and less
than 3, 22
Higher or equal to 10, 5 and less than
11
D Higher than or equal to 2, 93 and less
than 3, 08
Higher or equal to 10 and less than 10,
5
E Higher than or equal to 2, 78 and less
than 2, 93
Higher or equal to 9, 5 and less than 10
Those EER classes’ changes to become progressively stricter, as of June 2017, see table shown below,
new class created A+++ and class E removed:
Table 15: Egypt Energy Ratings per 2017 Standard
Calibration Energy Efficiency ratio of a room air conditioner (Split AC)
Watt/ Watt B.T.U/ Watt/h
A+++ Higher or equal to 4,4 Higher or equal to 15
A++ Higher than or equal to 4,1 and less than
4,4
Higher or equal to 14 and less than 15
A+ Higher than or equal to 3, 81 and less
than 4,1
Higher or equal to 13 and less than 14
A Higher than or equal to 3, 51 and less
than 3, 81
Higher or equal to 12 and less than 13
B Higher than or equal to 3, 22 and less
than 3, 51
Higher or equal to 11 and less than 12
C Higher than or equal to 3, 08 and less
than 3, 22
Higher or equal to 10, 5 and less than
11
D Higher than or equal to 2, 93 and less
than 3, 08
Higher or equal to 10 and less than
10, 5
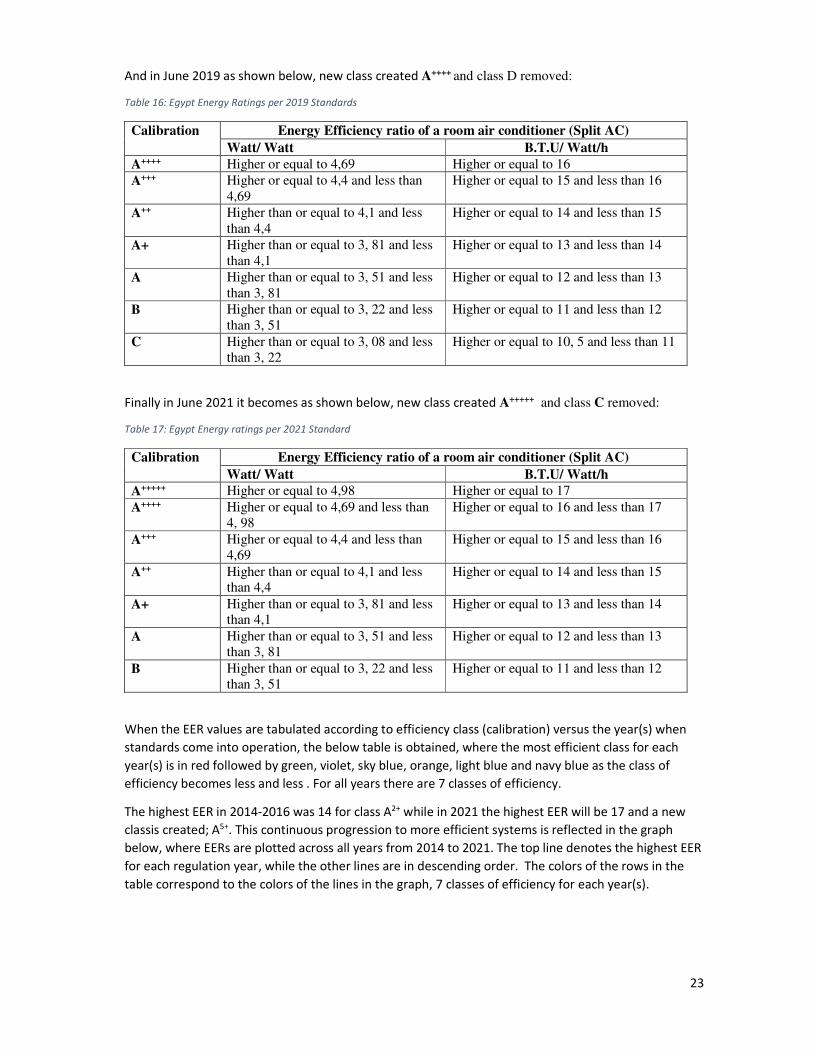
23
And in June 2019 as shown below, new class created A++++ and class D removed:
Table 16: Egypt Energy Ratings per 2019 Standards
Calibration Energy Efficiency ratio of a room air conditioner (Split AC)
Watt/ Watt B.T.U/ Watt/h
A++++ Higher or equal to 4,69 Higher or equal to 16
A+++ Higher or equal to 4,4 and less than
4,69
Higher or equal to 15 and less than 16
A++ Higher than or equal to 4,1 and less
than 4,4
Higher or equal to 14 and less than 15
A+ Higher than or equal to 3, 81 and less
than 4,1
Higher or equal to 13 and less than 14
A Higher than or equal to 3, 51 and less
than 3, 81
Higher or equal to 12 and less than 13
B Higher than or equal to 3, 22 and less
than 3, 51
Higher or equal to 11 and less than 12
C Higher than or equal to 3, 08 and less
than 3, 22
Higher or equal to 10, 5 and less than 11
Finally in June 2021 it becomes as shown below, new class created A+++++ and class C removed:
Table 17: Egypt Energy ratings per 2021 Standard
Calibration Energy Efficiency ratio of a room air conditioner (Split AC)
Watt/ Watt B.T.U/ Watt/h
A+++++ Higher or equal to 4,98 Higher or equal to 17
A++++ Higher or equal to 4,69 and less than
4, 98
Higher or equal to 16 and less than 17
A+++ Higher or equal to 4,4 and less than
4,69
Higher or equal to 15 and less than 16
A++ Higher than or equal to 4,1 and less
than 4,4
Higher or equal to 14 and less than 15
A+ Higher than or equal to 3, 81 and less
than 4,1
Higher or equal to 13 and less than 14
A Higher than or equal to 3, 51 and less
than 3, 81
Higher or equal to 12 and less than 13
B Higher than or equal to 3, 22 and less
than 3, 51
Higher or equal to 11 and less than 12
When the EER values are tabulated according to efficiency class (calibration) versus the year(s) when
standards come into operation, the below table is obtained, where the most efficient class for each
year(s) is in red followed by green, violet, sky blue, orange, light blue and navy blue as the class of
efficiency becomes less and less . For all years there are 7 classes of efficiency.
The highest EER in 2014-2016 was 14 for class A2+ while in 2021 the highest EER will be 17 and a new
classis created; A5+. This continuous progression to more efficient systems is reflected in the graph
below, where EERs are plotted across all years from 2014 to 2021. The top line denotes the highest EER
for each regulation year, while the other lines are in descending order. The colors of the rows in the
table correspond to the colors of the lines in the graph, 7 classes of efficiency for each year(s).
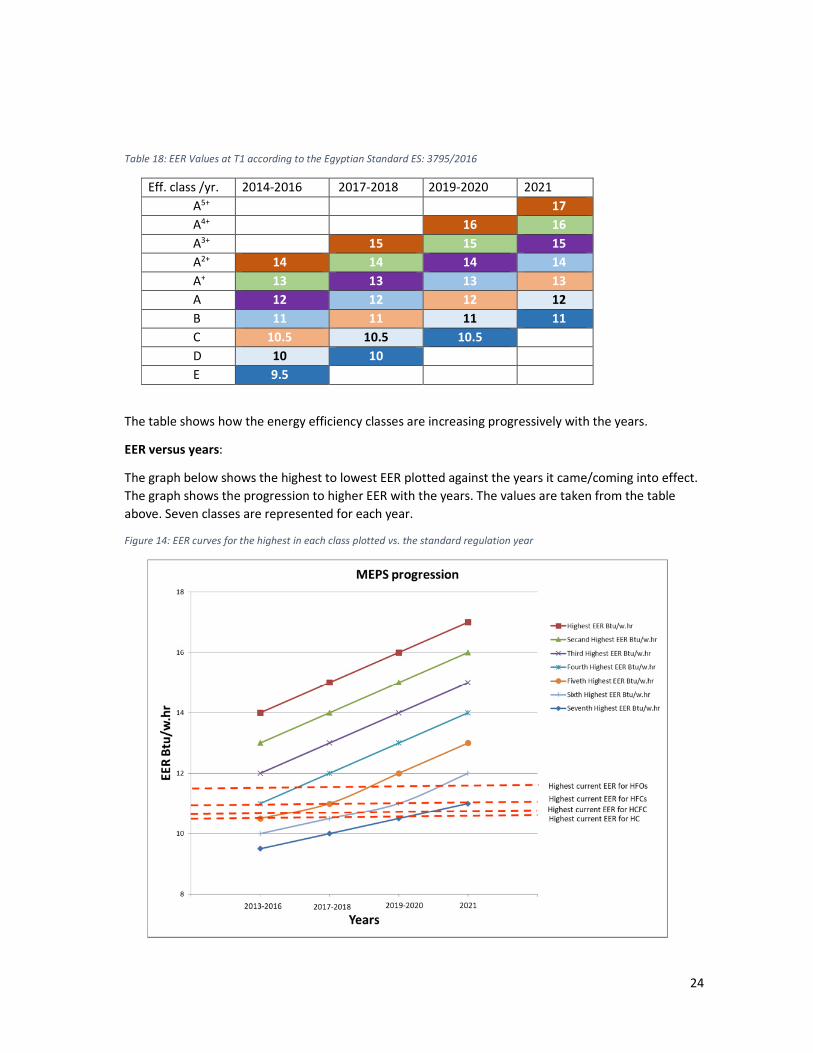
24
Table 18: EER Values at T1 according to the Egyptian Standard ES: 3795/2016
Eff. class /yr. 2014-2016 2017-2018 2019-2020 2021
A5+
17
A4+
16 16
A3+
15 15 15
A2+ 14 14 14 14
A+ 13 13 13 13
A 12 12 12 12
B 11 11 11 11
C 10.5 10.5 10.5
D 10 10
E 9.5
The table shows how the energy efficiency classes are increasing progressively with the years.
EER versus years:
The graph below shows the highest to lowest EER plotted against the years it came/coming into effect.
The graph shows the progression to higher EER with the years. The values are taken from the table
above. Seven classes are represented for each year.
Figure 14: EER curves for the highest in each class plotted vs. the standard regulation year
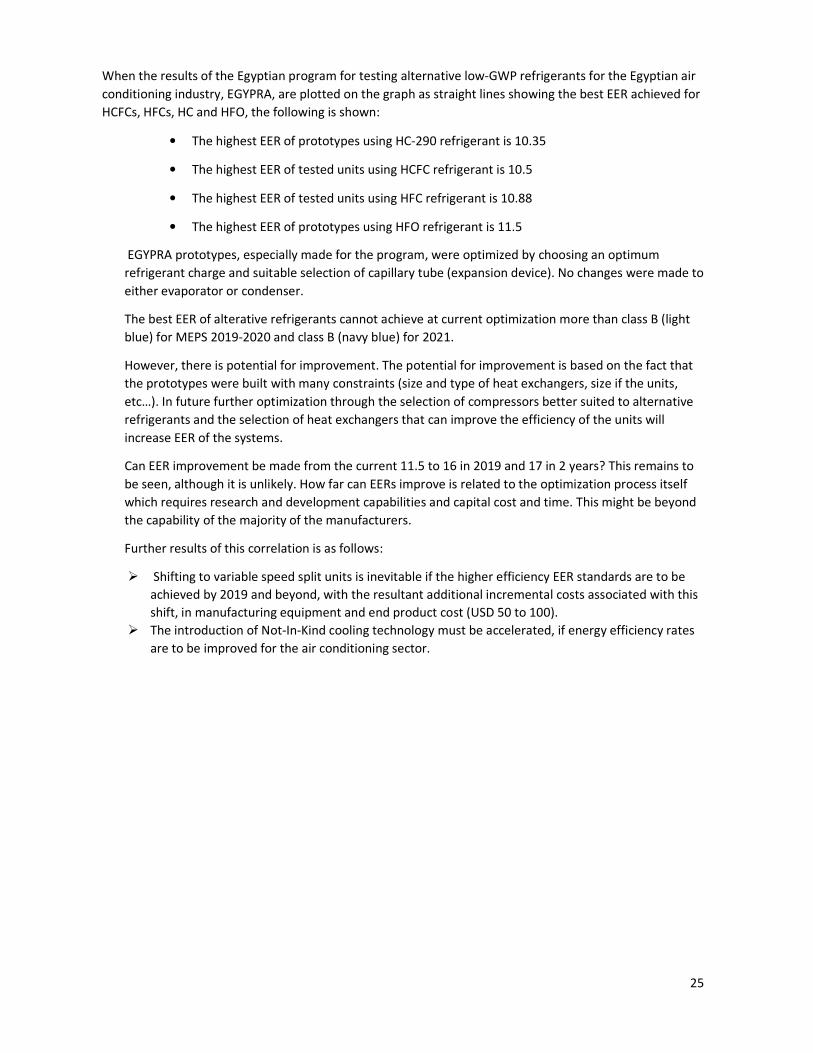
25
When the results of the Egyptian program for testing alternative low-GWP refrigerants for the Egyptian air
conditioning industry, EGYPRA, are plotted on the graph as straight lines showing the best EER achieved for
HCFCs, HFCs, HC and HFO, the following is shown:
• The highest EER of prototypes using HC-290 refrigerant is 10.35
• The highest EER of tested units using HCFC refrigerant is 10.5
• The highest EER of tested units using HFC refrigerant is 10.88
• The highest EER of prototypes using HFO refrigerant is 11.5
EGYPRA prototypes, especially made for the program, were optimized by choosing an optimum
refrigerant charge and suitable selection of capillary tube (expansion device). No changes were made to
either evaporator or condenser.
The best EER of alterative refrigerants cannot achieve at current optimization more than class B (light
blue) for MEPS 2019-2020 and class B (navy blue) for 2021.
However, there is potential for improvement. The potential for improvement is based on the fact that
the prototypes were built with many constraints (size and type of heat exchangers, size if the units,
etc…). In future further optimization through the selection of compressors better suited to alternative
refrigerants and the selection of heat exchangers that can improve the efficiency of the units will
increase EER of the systems.
Can EER improvement be made from the current 11.5 to 16 in 2019 and 17 in 2 years? This remains to
be seen, although it is unlikely. How far can EERs improve is related to the optimization process itself
which requires research and development capabilities and capital cost and time. This might be beyond
the capability of the majority of the manufacturers.
Further results of this correlation is as follows:
Shifting to variable speed split units is inevitable if the higher efficiency EER standards are to be
achieved by 2019 and beyond, with the resultant additional incremental costs associated with this
shift, in manufacturing equipment and end product cost (USD 50 to 100).
The introduction of Not-In-Kind cooling technology must be accelerated, if energy efficiency rates
are to be improved for the air conditioning sector.

26
Chapter 5
5. Conclusion
EGYPRA is funded from Egypt’s HCFC Phase-out Management Plan (HPMP) as an enabling activity for
the benefit of the Egyptian air conditioning industry to help local manufacturers experiment working
with new alternative lower-GWP refrigerants.
EGYPRA tested refrigerants with medium pressure characteristics similar to HCFC-22 and others with
high pressure similar to R-410A in split system units. Testing of central units with higher capacity was
not finalized in time for this report due to lack of testing facilities for flammable refrigerants at those
capacities. Results will be reported in the future once testing and evaluation is done.
This conclusion is in two parts: technical and institutional regarding capacity building requirements.
5.1. Technical Conclusion
EGYPRA results lead to the following conclusions:
• As expected, and for all refrigerants, moving from T1 to T3 testing temperatures, both capacity
and EER deteriorate, at different levels, across all categories and refrigerants;
• At T High, the increased indoor wet bulb testing condition, as per EOS & ISO-5151, leads to
better results for EER and capacity compared to T3;
• Since T Extreme testing condition is similar to T High, with regard to indoor wet bulb testing
condition, both EER and capacity re-deteriorate;
• In general, there are candidates with potential for improvement; however, since high pressure
refrigerants show better results vs. R-410A, the potential for improvement is higher.
Almost all of the OEMs who have participated in EGYPRA have already introduced R-410A units into
the market. One uncorroborated study shows that more than 10% of the units sold in 2017 were
with R-410A. This might make it easier for OEMs to leap-frog solutions for HCFC-22 and pass directly
to high pressure alternatives to R-410A as the possibility for performance and EER improvement is
higher for those alternatives.
Results also show that the potential for improvement applies also at higher ambient temperatures,
an important factor for some of the regions in the south of Egypt that experience higher ambient
temperatures than 35 °C. This is also important for the export market as some manufacturers export
to neighboring HAT countries in the region.
5.2. Capacity Building Requirements
The conclusion from chapter 4 is clear: at the current optimization level, none of the prototypes
tested will be able to meet more than class B of the 2021 MEPS values; however, the fact is that
prototypes were built with many constraints
• The prototypes could be further optimized through the selection of compressors better suited
to the tested refrigerants and the selection of heat exchangers that can improve the efficiency
of the units;
• Variable speed technology would improve the Seasonal EER of the units where applicable;
• The optimization process requires research and development capabilities that might go beyond
those available at some of the manufacturers;

27
• A further conclusion concerns the testing facilities of the EGYPRA OEMs. Witness testing has
enabled the Technical Consultant to carefully assess the capabilities of each lab, especially for
testing flammable refrigerants. For confidentiality purposes, the general description of the lab
facilities given in Annex 2 does not aim to critique the individual labs or divulge where the
individual labs need to be upgraded; however, the fact remains that some of the labs could
benefit from an upgrade program;
• The lack of an accredited independent lab to test larger than 65,000 Btuh units using flammable
refrigerants was the reason for the delay in testing central units which are part of the EGYPRA
project. These units were built by the respective manufacturers; however, the arrangement for
testing them independently and with good certainty could not be made on time for this report.
• Test results show that all refrigerants used in the project are viable alternatives from a
thermodynamic point of view. The viability in terms of the other criteria like commercial
availability, cost, and safety – among others - needs to be further researched.

28
BibliographyBibliographyBibliographyBibliography
Abdelaziz 2015 Abdelaziz O, Shrestha S, Munk J, Linkous R, Goetzler W, Guernsey M and Kassuga T, 2015.
“Alternative Refrigerant Evaluation for High-Ambient-Temperature Environments: R-22 and
R-410A Alternatives for Mini-Split Air Conditioners”, ORNL/TM-2015/536. Available at:
https://www.energy.gov/sites/prod/files/2015/10/f27/bto_pub59157_101515.pdf .
AREP 2014 AHRI Alternative Refrigerant Evaluation Program http://www.ahrinet.org/arep
EOS 3795:2013 Egyptian Organization for Standardization and Quality - Energy Efficiency Requirements for
Window and Split Units (Arabic version) – Dec 2013
EOS 4814 Egyptian Organization for Standardization and Quality – Testing and Performance Rating
for Ductless Air conditioning Units (Arabic Version)
ISO 5151:2017 International Organization for Standardization - Non-ducted air conditioners and heat
pumps - Testing and rating for performance (2017-en)
PRAHA 2016 PRAHA Project Report: https://www.unenvironment.org/resources/report/promoting-low-
gwp-refrigerants-air-conditioning-sectors-high-ambient-temperature
RTOC 2014 Refrigeration and Air conditioning technical Options Committee Assessment report (2014)

29
Annex 1Annex 1Annex 1Annex 1: Test Results: Test Results: Test Results: Test Results
The annex includes tables and charts from the test results. All OEMs results were compiled by category, for
HCFC-22 equivalent refrigerants and for R-410A equivalent refrigerants.
The tables show the results for capacity in Btuh and EER at the four testing temperatures. The tables are
per category of 12,000 Btuh split units, 18,000 split units and 24,000 Btuh split units. They include all
alternatives refrigerant tested by each OEM.
The equivalent bar charts reflect the results in the tables: one bar chart for capacity and one bar chart for
EER.
The sequence in which they are presented is:
• Table and bar chart equivalents for HCFC-22 alternatives in the 12,000 Btuh category;
• Table and bar chart equivalents for HCFC-22 alternatives in the 18,000 Btuh category;
• Table and bar chart equivalents for HCFC-22 alternatives in the 24,000 Btuh category;
• Table and bar chart equivalents for R-410A alternatives in the 12,000 Btuh category;
• Table and bar chart equivalents for R-410A alternatives in the 18,000 Btuh category;
• Table and bar chart equivalents for R-410A alternatives in the 24,000 Btuh category.

30
Table 19 A1: Capacity and EER Results for HCFC-22 alternatives in 12,000 Btuh category
HCFC-22 eq.
12,000 Btuh OEM A OEM B OEM C OEM E
Ambient T 1 T 3 T high T Ext T 1 T 3 T high T Ext T 1 T 3 T high T Ext T 1 T 3 T high T Ext
R-22 CAP 11479 9699 11353 8407 11410 9988 10900 10035 11452 9960 10560 10181 10753 10415 10352 9381
EER 9.74 6.88 7.31 5.61 8.410 6.380 6.330 5.470 10.002 7.249 6.975 6.231 10.290 8.300 7.380 6.230
R-290 CAP 10219 8677 9289 7747
EER 10.355 7.171 6.959 5.217
ARM-
20a
R-457A
CAP 11023 9376 10892 9517
EER 8.358 6.239 6.582 5.556
Opteon
XL-20
R-454C
CAP 10968 9349 9946 9042 6980.6 4958.27 5762.15 4489.25
EER 7.970 6.000 5.860 5.050 8.150 5.200 5.600 4.180
L-20
R-444B
CAP 11790 9661 10241 8881
EER 8.43 5.73 5.53 4.47
Figure 15 A1 - Equivalent capacity charts for HCFC-22 alternatives in 12,000 Btuh category plotted vs HCFC-22 results
0
2000
4000
6000
8000
10000
12000
14000
T 1 T 3 T high T Ext T 1 T 3 T high T Ext T 1 T 3 T high T Ext T 1 T 3 T high T Ext
OEM A OEM B OEM C OEM E
12K R-22 EQUIVELANT CAPACITY CHART
R-22 CAP R-290 CAP ARM-20a
R-457A CAP
Opteon XL-20 DR-3 R-454C CAP L-20
R-444B CAP

31
Figure 16 A1 - Equivalent EER chart for HCFC-22 alternatives in 12,000 Btuh category plotted vs HCFC-22 results
0
2
4
6
8
10
12
T 1 T 3 T high T Ext T 1 T 3 T high T Ext T 1 T 3 T high T Ext T 1 T 3 T high T Ext
OEM A OEM B OEM C OEM E
12K R22 EQUIVELANT EER CHARTR-22 EER R-290 EER ARM-20a
R-457A EER
Opteon XL-20 DR-3 R-454C EER L-20
R-444B EER

32
Table 20 A1- Capacity and EER results for HCFC-22 alternatives in 18,000 Btuh category
HCF-22 eq.
18,000 Btuh OEM A OEM B OEM C OEM D
Ambient T 1 T 3 T high T Ext T 1 T 3 T high T Ext T 1 T 3 T high T Ext T 1 T 3 T high T Ext
R-22 CAP 18659 16799 17543 15046 16433 14545 13718 15350 18160 16182 17632 16292 17548 16422 14624 13948
EER 9.410 7.260 6.980 5.550 8.930 6.650 6.370 5.330 10 7.372 7.371 6.445 10.500 8.750 7.220 6.00
R-290 CAP 16111 14067 15343 13442
EER 9.310 7.090 7.170 5.860
R-457A CAP 15257 12672 13418 12149
EER 9.260 6.590 6.310 5.330
R-454C CAP 16510 14327 15619 14250
EER 9.312 6.972 7.011 6.015
R-444B CAP 17098 15746 13498 13047
EER 10.000 7.780 6.320 5.400
Figure 17 A1 - Equivalent capacity charts for HCFC-22 alternatives in 18,000 Btuh category plotted vs HCFC-22 results
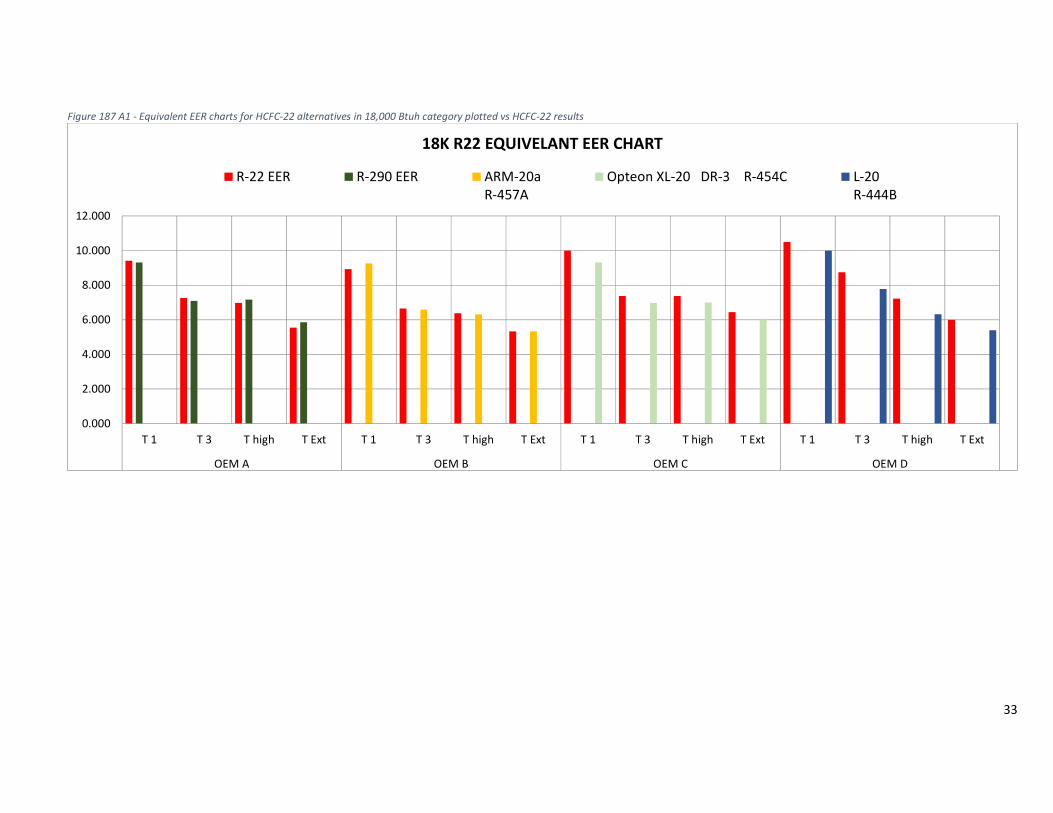
33
Figure 187 A1 - Equivalent EER charts for HCFC-22 alternatives in 18,000 Btuh category plotted vs HCFC-22 results
0.000
2.000
4.000
6.000
8.000
10.000
12.000
T 1 T 3 T high T Ext T 1 T 3 T high T Ext T 1 T 3 T high T Ext T 1 T 3 T high T Ext
OEM A OEM B OEM C OEM D
18K R22 EQUIVELANT EER CHART
R-22 EER R-290 EER ARM-20a
R-457A
Opteon XL-20 DR-3 R-454C L-20
R-444B

34
Table 21 A1 - Capacity and EER results for HCFC-22 alternatives in 24,000 Btuh category
HCFC-22 eq. 24,000 Btuh OEM B OEM D
Ambient T 1 T 3 T high T Ext T 1 T 3 T high T Ext
R-22 CAP 22782 22318 21202 20144 19148
EER 9.270 9.300 7.320 6.100 5.73
R-290 CAP
EER
ARM-20a
R-457A
CAP 21758 20670 19636 18657
EER 8.78 6.85 5.82 5.25
Opteon XL-20 DR-
3 R-454C
CAP
EER
L-20
R-444B
CAP 23436
EER 7.38
Figure 19 A1 - Equivalent capacity charts for HCFC-22 alternatives in 24,000 Btuh category plotted vs HCFC-22 results
0
5000
10000
15000
20000
25000
T 1 T 3 T high T Ext T 1 T 3 T high T Ext
OEM B OEM D
24K R22 EQUIVELANT CAPACITY CHARTR-22 ARM-20a
R-457A CAP
L-20
R-444B CAP

35
Figure 20 A1 - Equivalent EER chart for HCFC-22 alternatives in 24,000 Btuh category plotted vs HCFC-22 results
0.000
1.000
2.000
3.000
4.000
5.000
6.000
7.000
8.000
9.000
10.000
T 1 T 3 T high T Ext T 1 T 3 T high T Ext
OEM B OEM D
24K R22 EQUIVELANT EER CHARTR-22 EER ARM-20a
R-457A EER
L-20
R-444B EER

36
Table 22 A1 - Capacity & EER results for R-410A alternatives in 12,000 Btuh category
R-410 A eq. OEM A OEM B OEM E
12,000 Btuh
Ambient T 1 T 3 T high T Ext T 1 T 3 T high T Ext T 1 T 3 T high T Ext
R-410A CAP 10307 - 8313 - 12068 10343 11089 9968 11905 9369 10848 9299
EER 8.77 - 5.43 - 10.17 7.31 7.15 5.93 10.88 7.29 7.42 5.89
ARM-71a
R-459A
CAP
EER
R-32 CAP 11355 9249 9822 8499
EER 11.51 7.53 7.26 5.69
Opteon XL-41
DR-5
R-454B
CAP 11987 11130 12257 11094
EER 9.92 7.95 7.66252 6.7676
L-41
R447A
CAP 9963 - 8539 -
EER 8.38 - 5.55 -
Figure 21 A1 - Equivalent capacity chart for R410A alternatives in 12,000 Btuh category plotted vs R-410A results
0
2000
4000
6000
8000
10000
12000
14000
T 1 T 3 T high T Ext T 1 T 3 T high T Ext T 1 T 3 T high T Ext
OEM A OEM B OEM E
12K R410 A EQUIVELANT CAPACITY CHART R-410A CAP R-32 CAP Opteon XL-41 DR-5
R-454B CAP
L-41
R447A CAP

37
Figure 22 A1 - Equivalent EER chart for R-410A alternatives in 12,000 Btuh category plotted vs R-410A results
0
2
4
6
8
10
12
14
T 1 T 3 T high T Ext T 1 T 3 T high T Ext T 1 T 3 T high T Ext
OEM A OEM B OEM E
12K R410 A EQUIVELANT EER CHART R-410A R-32 Opteon XL-41 DR-5
R-454B
L-41
R447A

38
Table 23 A1 - Capacity & EER results for R-410A alternatives in 18,000 Btuh category
R-410 A eq. 18,000 Btuh OEM A OEM C
Ambient T 1 T 3 T high T Ext T 1 T 3 T high T Ext
R-410A CAP 16938 14337 14123 12441 17800 14924 16075 13746
EER 9.8 6.8 6.3 5.1 9.152 6.497 6.485 5.116
ARM-71a
R-459A
CAP 17115 14430 15392 14023
EER 9.282 6.544 6.265 5.32
R-32 CAP 17616 15255 15761 13809
EER 10.03 7.1 6.65 5.29
Opteon XL-41 DR-5
R-454B
CAP 15167 13229 13782 11800
EER 9.5 6.9 6.5 5.2
L-41 R447A CAP
EER
Figure 23 A1- Equivalent capacity charts for R-410A alternatives in 18,000 Btuh category plotted vs R-410A results
0
2000
4000
6000
8000
10000
12000
14000
16000
18000
20000
T 1 T 3 T high T Ext T 1 T 3 T high T Ext
OEM A OEM C
18K R410a EQUIVELANT CAPACITY CHART R-410A ARM-71a
R-459A
R-32 Opteon XL-41 DR-5
R-454B

39
Figure 24 A1 - Equivalent EER chart for R-410A alternatives in 18,000 Btuh category plotted vs R-410A results
0
2
4
6
8
10
12
T 1 T 3 T high T Ext T 1 T 3 T high T Ext
OEM A OEM C
18K R410a EQUIVELANT EER CHART
R-410A ARM-71a… R-32 Opteon XL-41 DR-5…

40
Table 24 A1 - Capacity & EER results for R-410A alternatives in 24,000 Btuh category
R-410 A eq. 24,000 Btuh OEM C
Ambient T 1 T 3 T high T Ext
R-410A CAP 23022 19531 20534 18379
EER 10.57 7.518 7.376 6.161
ARM-71a
R-459A
CAP
EER
R-32 CAP 23310 19522 21876 19035
EER 10.62 7.228 7.459 5.988
Opteon XL-41 DR-5
R-454B
CAP 23766 20241 22268 20160
EER 10.653 7.516 7.515 6.224
L-41 R447A CAP
EER
Figure 25 A1 - Equivalent capacity charts for R-410A alternatives in 24,000 Btuh category plotted vs R-410A results
0
5000
10000
15000
20000
25000
T 1 T 3 T high T Ext
OEM C
24K R410a EQUIVELANT CAPACITY CHART
R-410A CAP R-32 CAP Opteon XL-41 DR-5
R-454B CAP
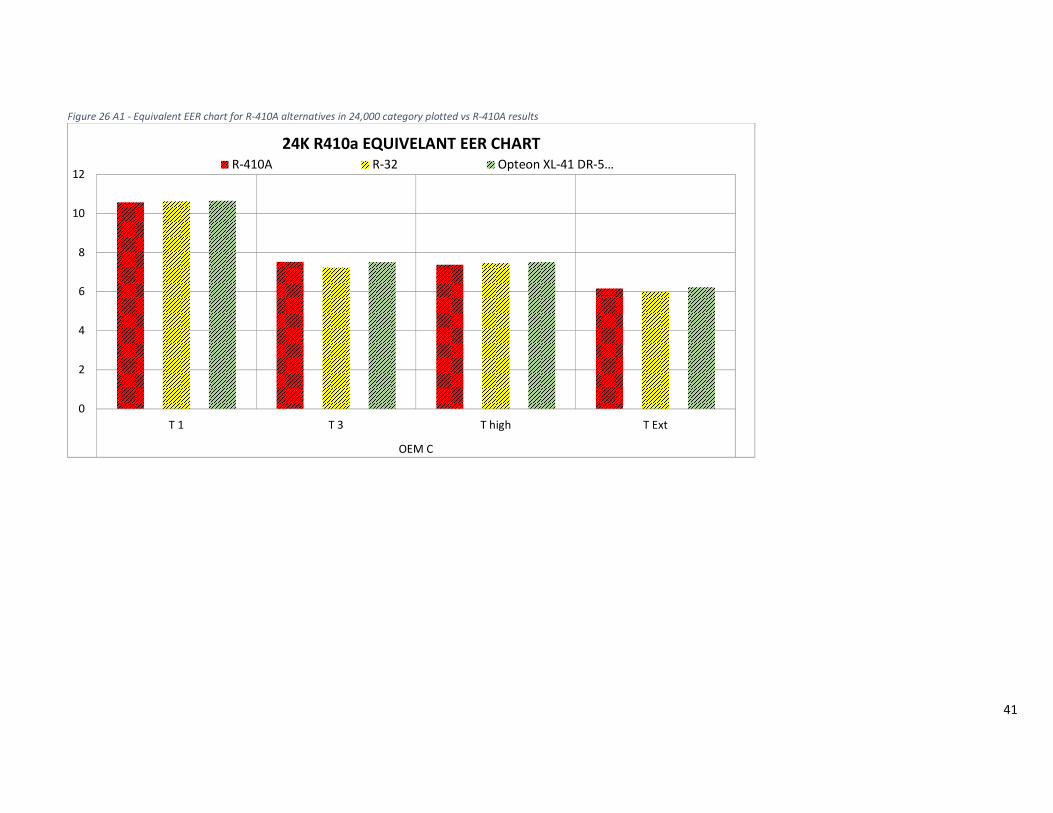
41
Figure 26 A1 - Equivalent EER chart for R-410A alternatives in 24,000 category plotted vs R-410A results
0
2
4
6
8
10
12
T 1 T 3 T high T Ext
OEM C
24K R410a EQUIVELANT EER CHART R-410A R-32 Opteon XL-41 DR-5…

42
Annex 2Annex 2Annex 2Annex 2: Sample Questionnaire for Local Manufacturers: Sample Questionnaire for Local Manufacturers: Sample Questionnaire for Local Manufacturers: Sample Questionnaire for Local Manufacturers
Goal:
The Initiative objective is to test prototype air-conditioning units using low-GWP alternative technologies and
share recommendations with manufacturers and decision makers in Egypt
Questionnaire:
This questionnaire is aimed at selected air-conditioning manufacturers in Egypt. The purpose of the
questionnaire is to ask the preferences of the selected manufacturers in as far as technology selection and
partnership with other stakeholders as well as getting a confirmation on their willingness to participate. All
information complied of this questionnaire will be treated as confidential.
A. General Conditions Participant response
My company is willing to participate in the project. If you answer YES, please proceed to rest to questionnaire.
YES NO
B. Technology Selection Participant response
1. Do you have a preference for the alternative refrigerant? YES NO
2. Alternative refrigerant choice (you can provide more than one selection by deleting what is not applicable)
HFO Honeywell HFO DuPont R-32 Hydrocarbon
3. Do you have a preference for the compressor manufacturer? YES NO
4. Provide name of compressor manufacturer(s)
C. Application Selection Participant response
5. Do you have a preference for the type and capacity of equipment for which you will build the prototype?
YES NO
6. My selection of equipment: (you can provide more than one selection)
Decorative split Ducted split Rooftop package Self-contained
7. My selection of cooling capacity 1 – 5 tons 6 – 10 tons No preference
D. Building Prototypes Participant response
8. My company can design and/or build prototypes YES NO
9. How many prototypes are you willing to build? One More (pls specify
number)
E. Testing Prototypes Participant response
10. Which type of testing do you prefer? Independent 3rd party Testing
Witness Testing at own premises
11. If you answered 3rd Party Testing, are you willing to pay the cost for the test?
YES NO

43
12. If you answered Witness Testing, is your lab certified and by whom?
YES NO Certified by:
F. Logistics Participant response
13. My company will allow independent consultants appointed by UNEP/UNIDO to oversee the development of the prototypes.
YES NO
14. If NO, pls describe what limitations you want to impose.
15. My company will allow independent consultants appointed by UNEP/UNIDO to oversee the testing of the prototypes.
YES NO
16. If NO, pls describe what limitations you want to impose.
G. Information about the Company Participant response
17. Company Name
18. Brand names used in market
19. Company headquarters location
20. Manufacturing location where prototype will be built
21. Ownership percentage pertaining to the nationality where prototype is manufactured (This information is needed to determine whether the limitations for project participation set by the Ozone Secretariat of the Montreal Protocol are applicable)
22. Name and title and Contact details of designated contact person for this project

44
Annex 3Annex 3Annex 3Annex 3: Brief description of Manufacturers’ testing labs: Brief description of Manufacturers’ testing labs: Brief description of Manufacturers’ testing labs: Brief description of Manufacturers’ testing labs
The test labs of the different OEMs had varying capabilities. The best equipped labs have the following
characteristics:
• Psychrometric type laboratory in which the air enthalpy test method is used to determine the
cooling and heating capacities from measurements of entering and leaving wet-and dry-bulb
temperatures and the associated airflow rate;
• Air sampling devices in each room (indoor room, code tester and outdoor room) are used to
measure an average temperature. The airflow induced using blower through the tree (photo on
left) and insulated duct passing over the temperature instruments (photo on the right) at
velocity of 4-5 m/s.
• Air flow measuring apparatus (code tester) is attached to air discharge of UUT by insulated
duct. The first section (receiving chamber) delivers air from UUT and contains the static
pressure measuring instrument. The air is then mixed by a mixer in next section to measure its
temperature by the air sampling device installed inside the code tester.
• Nozzles section, consisting of a receiving chamber and a discharge chamber separated by a
partition in which four nozzles are located (see photo below). Air passes through the nozzles
and is then exhausted to the test room. The pressure drop across the nozzles is measured using
differential pressure transmitter. Air flow rate is calculated according to ISO 5151:2017.

45
• Voltage stabilizer(photo on left) is used to adjust the applied voltage for UUT, and the Power
meter device is used to measure electrical parameters for it like applied voltage, power
consumption, current consumption and power factor.
• Most labs are capable of testing up to 5 TR capacity (17.5 kW of cooling) measuring unit
working pressure, super-heat, sub-cooling, and various temperature points on the refrigeration
cycle;
• Lab consists of two well thermally insulated rooms: indoor room and outdoor room. In both
rooms, temperature and humidity can be controlled preciously to achieve the required
environment, as per different standards, thru refrigeration units, humidifiers and electric
heaters;
• The accuracy of temperature control for dry and wet bulb temperature is 0.01 °C;
• In the indoor room there is a thermal insulated code tester where outlet air dry bulb, wet bulb
and volume are measured;
• Wires sensors with accuracy of 0.1 °C are used for measuring surface temperatures at various
points;
• Information gathered during the test are monitored on a computer screen;
The table below shows the parameters that are shown on the monitor

46
Table 25 A3: Typical parameters shown on a testing lab monitoring screen
Test Screen Display
Inlet DB
Inlet WB
Inlet Enthalpy
Outlet DB
Outlet WB
Outlet Enthalpy
Enthalpy Differential
Specific Density
Air velocity
Air volume
Standard air volume
Atmospheric pressure
Differential pressure
Heat Loss
Total capacity
Capacity ratio
EER
EER ratio
COMPRESSOR
FM surface temperature
high pressure
low pressure
Super-heat
Sub-cooling
ADDITIVE TEMP.
Accumulator outlet temp
Outlet air temperature
Evaporator coil sensor temp
Compressor inlet
O/D Motor surface
OUTDOOR UNIT
Inlet DB
Inlet WB
POWER
Voltage
Current
Wattage
Power Factor
Frequency

47
Annex Annex Annex Annex 4444: Other Research Programs: Other Research Programs: Other Research Programs: Other Research Programs
Research at High Ambient Temperature
The dedicated research on the performance of refrigerants at High Ambient Temperatures (HAT)
was driven by the need to find low-GWP alternative refrigerants that have a better degradation
of capacity and efficiency than the commercial HFCs that are replacing HCFCs in the HAT
countries. The need to meet higher Minimum Efficiency Performance Standards (MEPS) while
phasing out the current production of HCFC-based units was a challenge facing both the local
industry in the HAT countries and the global exporters to those markets.
Three research programs were announced and completed in the time period between 2013 and
2016. While the three programs had a common goal in testing the refrigerant alternatives at
temperatures higher than the standard T1 testing conditions, they were distinct in their
protocols, approach, and the entity who was behind the project.
The PRAHA program mentioned in Chapter 1 is a Multilateral Fund financed project to test
custom-built prototypes in four equipment categories that built by manufacturers located in
HAT countries and testing them all at one independent lab. The results were compared to base
units running with HCFC-22 and R-410A refrigerants.
The AREP (Alternative Refrigerant Evaluation Program) is an industry association program by the
Air Conditioning, Heating, and Refrigeration Institute (AHRI) to test various categories of
equipment, by various manufacturers, at their own labs by either dropping in the refrigerant or
“soft” optimizing the unit.
The Oak Ridge National Laboratory (ORNL) program by the United States Department of Energy
(DoE) tested two similar capacity standard units running with HCFC-22 and R-410A and soft
optimizing them for the various alternative refrigerants. All tests were carried on at ORNL labs.
A comparison of the three program design criteria and testing protocols is found in table xx
below. In the next sections of this chapter is a resume of the test results for the three programs
and a comparison of these results.

48
PRAHA program
Six local Original Equipment Manufacturers (OEMs) built 14 prototypes running with five
refrigerant alternatives and shipped 9 other “base units’ operating with HCFC or HFC for direct
comparison purposes. Testing was done at 35, 46, and 50 °C ambient temperatures with an
“endurance” test at 55 °C ambient to ensure no tripping for two hours when units are run at
that temperature. The indoor conditions will be kept the same for all tests; dry bulb
temperature of 27 ⁰C and a relative humidity of 50 % as per AHRI test procedures for T1
conditions (35 ⁰C), and 29 ⁰C and 50% for T3 (46 ⁰C and 50 ⁰C) conditions. A memorandum of
understanding (MOU) was signed with AHRI (Air-Conditioning, Heating and Refrigerating
Institute) for exchanging experience on the testing methodology benefiting of AHRI relevant
research project known as AREP.
The project compares the following refrigerants: R-290, HFC-32, R-444B (herein referred to as
L-20), R-447A (L-41), and DR-3 to HCFC-22 or R-410A. Prototypes operating with R-290, R-444B,
and DR-3 are compared with HCFC-22 as they portray similar characteristics to HCFC-22, while
HFC-32, and R-447A are compared with R-410A.
All the prototypes in every category were built to have the same cooling capacity and fit in the
same box dimensions as their respective base units, and they were all required to meet the
minimum energy efficiency (EER) of 7 at 46 °C. Tests were performed at an independent
reputable lab for result consistency; Intertek was selected through competitive bidding.
Verification for repeatability was performed to ensure that results are within the acceptable
accuracy levels.
Table 26 A4 - Results for PRAHA-I program

49
AREP Program
The Alternative Refrigerant Evaluation Program (AREP) by the Air Conditioning, Heating, and
Refrigeration Institute (AHRI) tested several refrigerants either as a drop-or in soft optimized
units built and tested at various manufacturers who are members of AHRI (AREP 2014). Testing
was done in two phases for several applications including refrigeration and at various
temperatures.
Table 27 A4 - Results for the AREP program
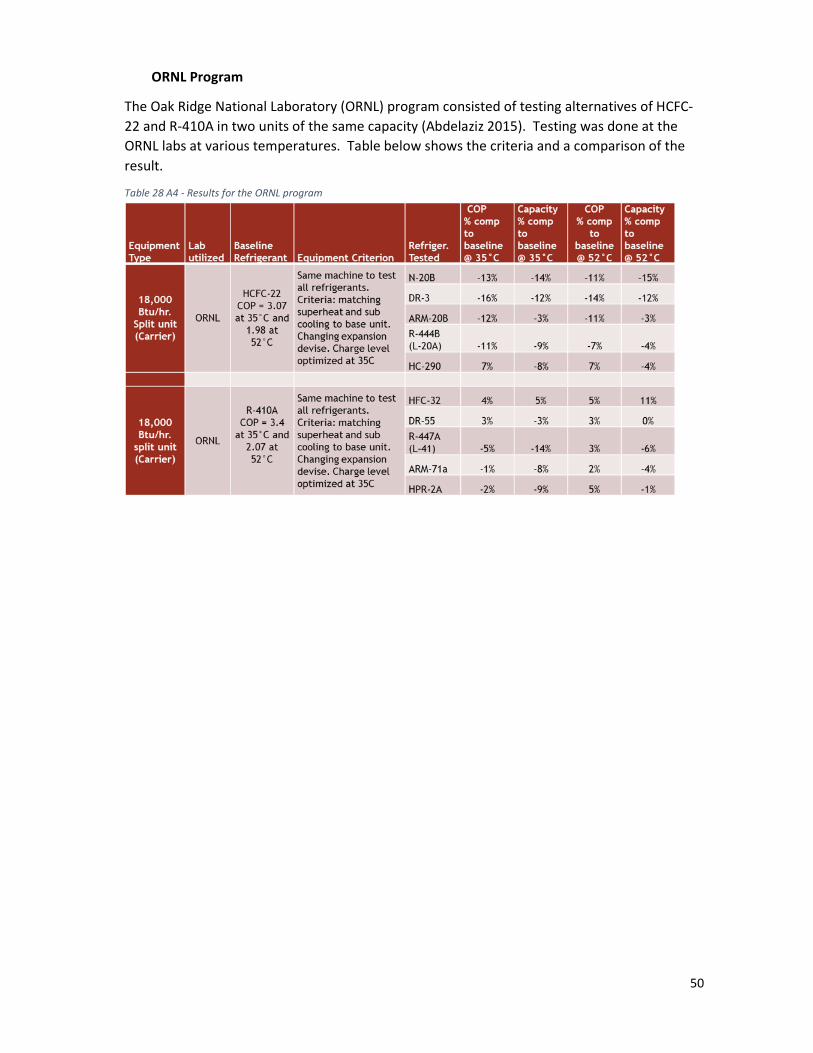
50
ORNL Program
The Oak Ridge National Laboratory (ORNL) program consisted of testing alternatives of HCFC-
22 and R-410A in two units of the same capacity (Abdelaziz 2015). Testing was done at the
ORNL labs at various temperatures. Table below shows the criteria and a comparison of the
result.
Table 28 A4 - Results for the ORNL program