egr cooler thermal assessment by implicitly coupled … · star global conference – march 2014...
TRANSCRIPT

STAR Global Conference – March 2014
EGR Cooler Thermal Assessment by
Implicitly Coupled Multi-Physics
Modelling Serdar Güryuva
Analysis Engineer
Ford OTOSAN – Powertrain 3D CFD & Combustion

STAR Global Conference – March 2014
Page 2 of 22
Originator: sguryuva
Date: March 2014
Outline
• About Us
• Introduction – EGR Systems
• Motivation for EGR Cooler Modelling
• EGR Cooler Modelling Literature
• Modelling Details & Methodology
• Results and Verification
• Further Opportunities
• Q&A

STAR Global Conference – March 2014
Page 3 of 22
Originator: sguryuva
Date: March 2014
About Us
• Ford Otosan is the leading automotive company at Turkey and is a joint venture of Ford and Otosan.
• Powertrain 3D CFD & Combustion is a sub-branch of Powertrain Product Development CAD-CAE Team consisting of more than 100 engineers.
• Experienced in analysis of
– Exhaust After Treatment Systems (Exhaust Gas Flow, Fuel Vaporizer & SCR )
– 3D Combustion Simulations
– 3D CFD Implicit Coupled Head & Block Analysis
– Exhaust Manifold Explicit Coupled Analysis
– Air Intake System (1D-3D Coupled) Flow
– Water Pump Performance & Optimization
– Oil Pan Sloshing
– Fuel Tank Sloshing
– Java Scripting and GUI Development for Automation
– Head Quenching
– GeRotor Oil Pump Performance
STAR Global Conference – March 2014
Page 4 of 22
Originator: sguryuva
Date: March 2014
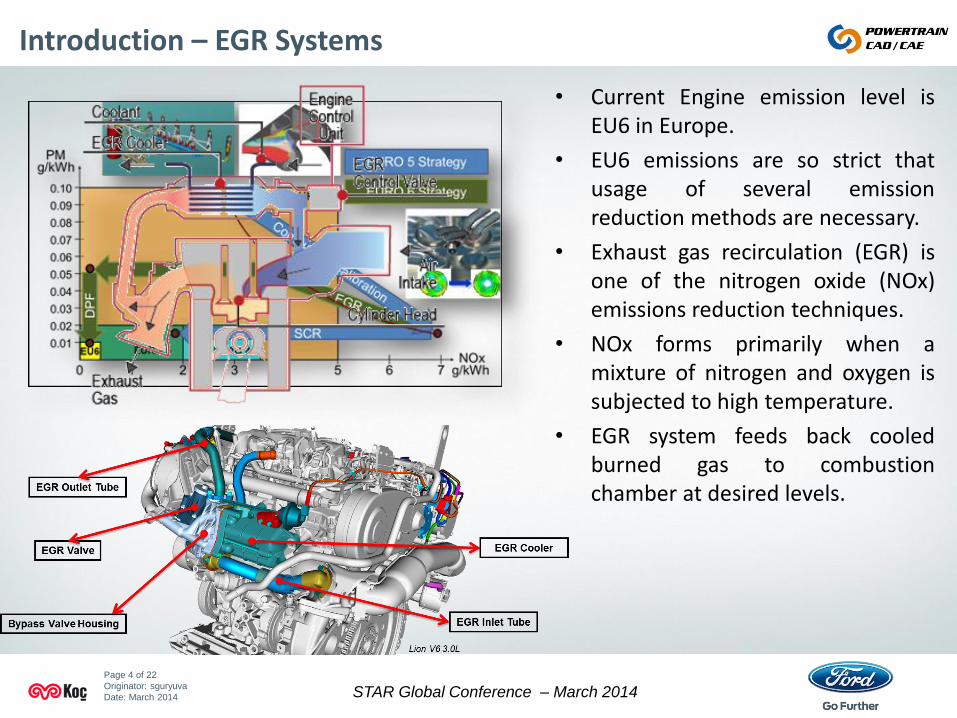
Introduction – EGR Systems
• Current Engine emission level is EU6 in Europe.
• EU6 emissions are so strict that usage of several emission reduction methods are necessary.
• Exhaust gas recirculation (EGR) is one of the nitrogen oxide (NOx) emissions reduction techniques.
• NOx forms primarily when a mixture of nitrogen and oxygen is subjected to high temperature.
• EGR system feeds back cooled burned gas to combustion chamber at desired levels.

STAR Global Conference – March 2014
Page 5 of 22
Originator: sguryuva
Date: March 2014
Introduction – EGR Cooler
• Most of the EGR coolers are shell and tube type heat exchangers (STHEs)
– Gas flows inside tube side
– Coolant flows at shell side.
• The principal components of STHEs are shells, tubes, nozzles and baffles (if exists).
• Inside the tubes the heat transfer coefficient and pressure drop are functions of both Re and Pr numbers in form of
𝑁𝑢 = ℎ𝐷
𝑘= 𝑎1 ∙ 𝑅𝑒𝑛1 ∙ 𝑃𝑟𝑚1
𝐸𝑢 = ∆𝑃
𝜌𝑢𝑚𝑎𝑥2 = 𝑎2 ∙ 𝑅𝑒𝑛2 ∙ 𝑃𝑟𝑚2
STAR Global Conference – March 2014
Page 6 of 22
Originator: sguryuva
Date: March 2014
Motivation for EGR Cooler Modelling
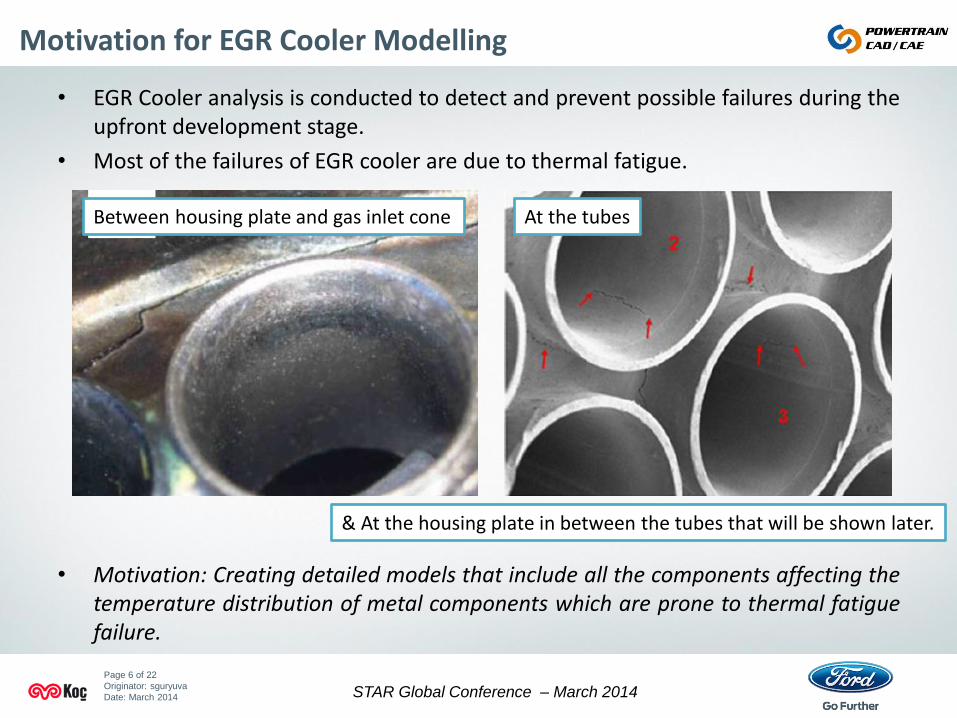
• EGR Cooler analysis is conducted to detect and prevent possible failures during the upfront development stage.
• Most of the failures of EGR cooler are due to thermal fatigue.
• Motivation: Creating detailed models that include all the components affecting the temperature distribution of metal components which are prone to thermal fatigue failure.
At the tubes Between housing plate and gas inlet cone
& At the housing plate in between the tubes that will be shown later.

STAR Global Conference – March 2014
Page 7 of 22
Originator: sguryuva
Date: March 2014
Introduction – EGR Cooler Modelling Literature
• For heat transfer enhancement (HTE), features like fins, corrugations and winglets are used inside and outside of the gas carrying tubes.
• Detailed 3D CFD modelling of STHX is not possible due to high computational cost.
• For HTC, if any HTE features exists, the only way to incorporate their effect is using additional modification functions for calculation of HTC and using modified HTC values at the tube side as reported in the literature [1].
• The pressure drop is modelled by usage of porous medium approach where necessary[2].
1 Transient CFD Simulation of Exhaust Gas Recirculation Coolers for Further Structural Analyses , SAE 2009-01-1228, Behr GmbH & Co. KG
2 Shell side CFD analysis of a small shell-and-tube heat exchanger, Ender Ozden, Ilker Tari, 2009 Energy Conversion and Management
STAR Global Conference – March 2014
Page 8 of 22
Originator: sguryuva
Date: March 2014
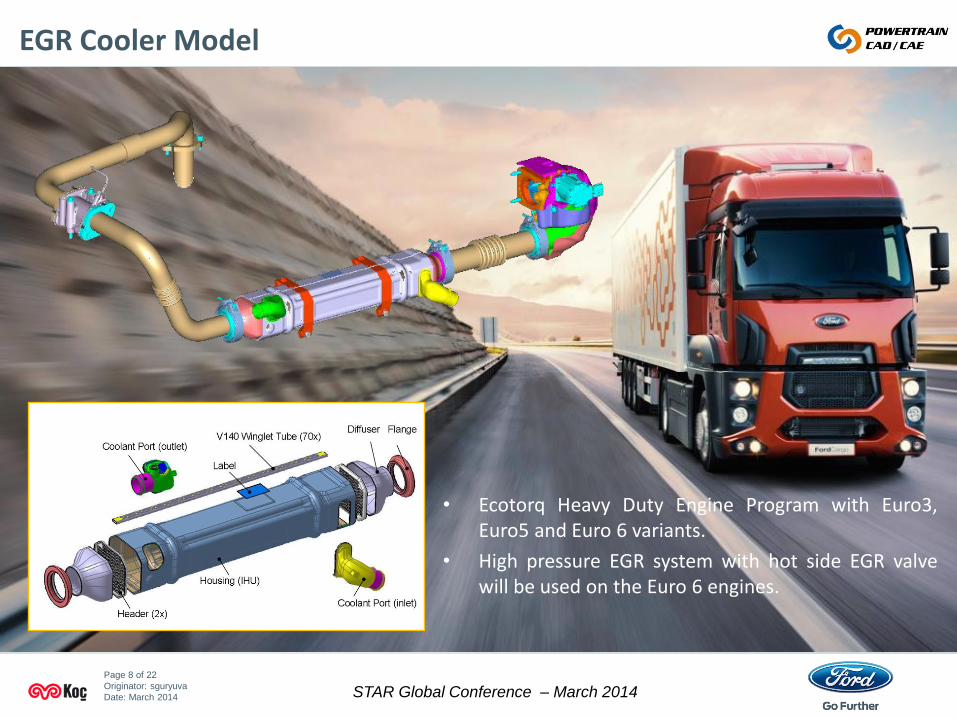
EGR Cooler Model
• Ecotorq Heavy Duty Engine Program with Euro3, Euro5 and Euro 6 variants.
• High pressure EGR system with hot side EGR valve will be used on the Euro 6 engines.

STAR Global Conference – March 2014
Page 9 of 22
Originator: sguryuva
Date: March 2014
EGR Cooler Modelling
• EGR Cooler analysis is conducted to retrieve
– Gas flow uniformity values at certain sections of EGR cooler
– Absolute total pressure difference between inlet and outlet of fluid domains
– Any stagnant and thermally critical regions
– Level of boiling
– Temperature distribution at metal plates
Cooler Mid-Section

STAR Global Conference – March 2014
Page 10 of 22
Originator: sguryuva
Date: March 2014
EGR Cooler Analysis Properties
• Transient multi-physics implicit coupled analysis of Co-Flow Type H.E that includes: – Multiphase VOF for coolant as %50 Glycol Water
– Single phase exhaut gas as air
– Steel solid header plates
– Steel tubes modelled using shell 3D modeller of STAR-CCM +
• T. & P. Dependent properties
• Absolute static pressure dependent boiling temperature
• 2nd order k-ε turbulence model with all y+ wall treatment
• Segregated flow, temperature and turbulence solver
• Non-conformal trim mesh and extruded cells at tubes
• 22.3M cells
• 2500 iteration steps (10s) @ 48CPU: ~10hrs.

STAR Global Conference – March 2014
Page 11 of 22
Originator: sguryuva
Date: March 2014
Coupled Gas and Coolant Flow Analysis Methodology
• For modelling of thin (~0.5mm) volume of tubes Shell 3D Model of STAR-CCM+ which is a 3D conduction solver, has been used.
• Based on the assumption that the temperature variation normal to the shell surface is piecewise-linear.
• Mid section surface of the tubes is taken as reference surface.
• Housing plates are interfaced with both gas and coolant regions.
Shell-3D & Solid Components
SHELL with 0.5mm Thickness
Metal 4 Layers

STAR Global Conference – March 2014
Page 12 of 22
Originator: sguryuva
Date: March 2014
Coupled Gas and Coolant Flow Analysis Methodology
• Mesh independency study conducted to determine best PL settings and mesh sizes suitable for geometry and model settings used.
Meshing Strategy
STAR Global Conference – March 2014
Page 13 of 22
Originator: sguryuva
Date: March 2014
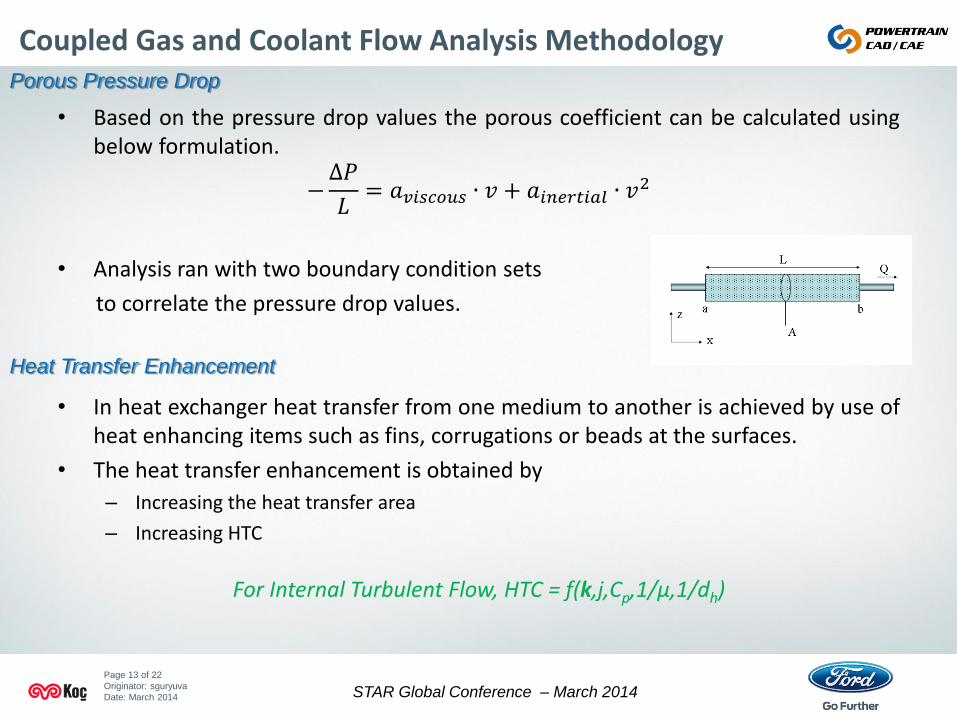
Coupled Gas and Coolant Flow Analysis Methodology Porous Pressure Drop
Heat Transfer Enhancement
• Based on the pressure drop values the porous coefficient can be calculated using below formulation.
−∆𝑃
𝐿= 𝑎𝑣𝑖𝑠𝑐𝑜𝑢𝑠 ∙ 𝑣 + 𝑎𝑖𝑛𝑒𝑟𝑡𝑖𝑎𝑙 ∙ 𝑣2
• Analysis ran with two boundary condition sets
to correlate the pressure drop values.
• In heat exchanger heat transfer from one medium to another is achieved by use of heat enhancing items such as fins, corrugations or beads at the surfaces.
• The heat transfer enhancement is obtained by
– Increasing the heat transfer area
– Increasing HTC
For Internal Turbulent Flow, HTC = f(k,j,Cp,1/μ,1/dh)

STAR Global Conference – March 2014
Page 14 of 22
Originator: sguryuva
Date: March 2014
Analysis Verification with Experimental Data
• Experimental data is received from manufacturer as a result of standard performance test of EGR coolers.
• 3 test conditions have been used for porous coefficients determination and heat transfer enhancement.
• Additional of components such as gas inlet pipe and different throttle positions affects the results significantly.
Test Case
Actual Case

STAR Global Conference – March 2014
Page 15 of 22
Originator: sguryuva
Date: March 2014
Analysis Verification with Experimental Data
Error Bars are 2.5%
Coolant Pressure Drop
Gas Pressure Drop
Coolant Outlet Temperature
Gas Outlet Temperature

STAR Global Conference – March 2014
Page 16 of 22
Originator: sguryuva
Date: March 2014
Analysis Results Comparison – 1900RPM
Experimental Setup Engine Setup
Velocity
Contour
Uniformity: 0.972 Uniformity: 0.965
Mass Flux
Contour
Uniformity: 0.977 Uniformity: 0.967
STAR Global Conference – March 2014
Page 17 of 22
Originator: sguryuva
Date: March 2014
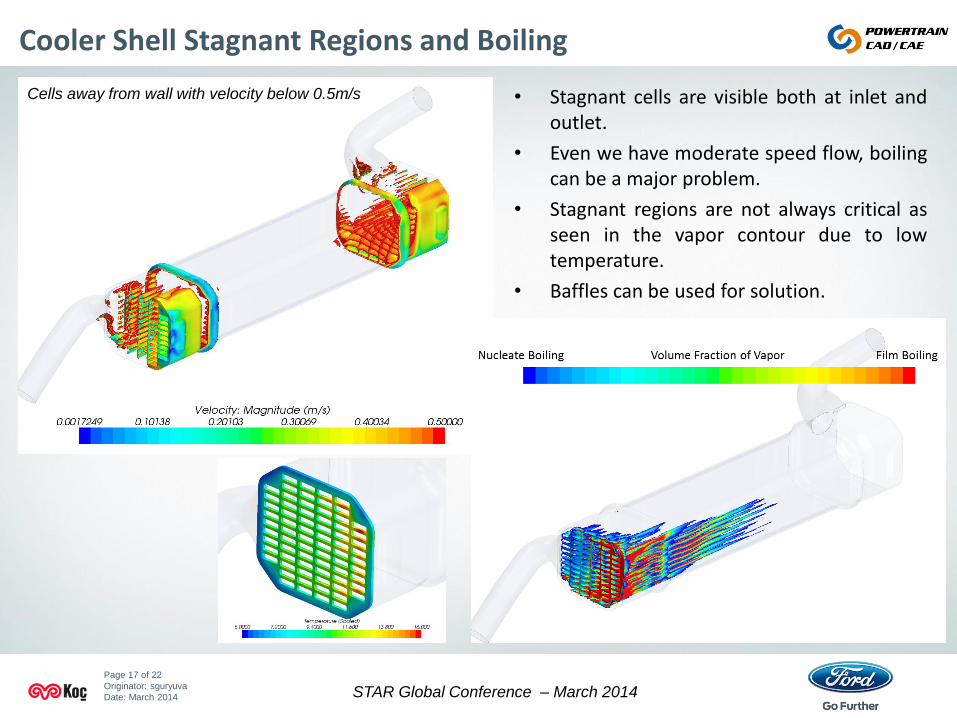
Cooler Shell Stagnant Regions and Boiling
Cells away from wall with velocity below 0.5m/s • Stagnant cells are visible both at inlet and outlet.
• Even we have moderate speed flow, boiling can be a major problem.
• Stagnant regions are not always critical as seen in the vapor contour due to low temperature.
• Baffles can be used for solution.
STAR Global Conference – March 2014
Page 18 of 22
Originator: sguryuva
Date: March 2014
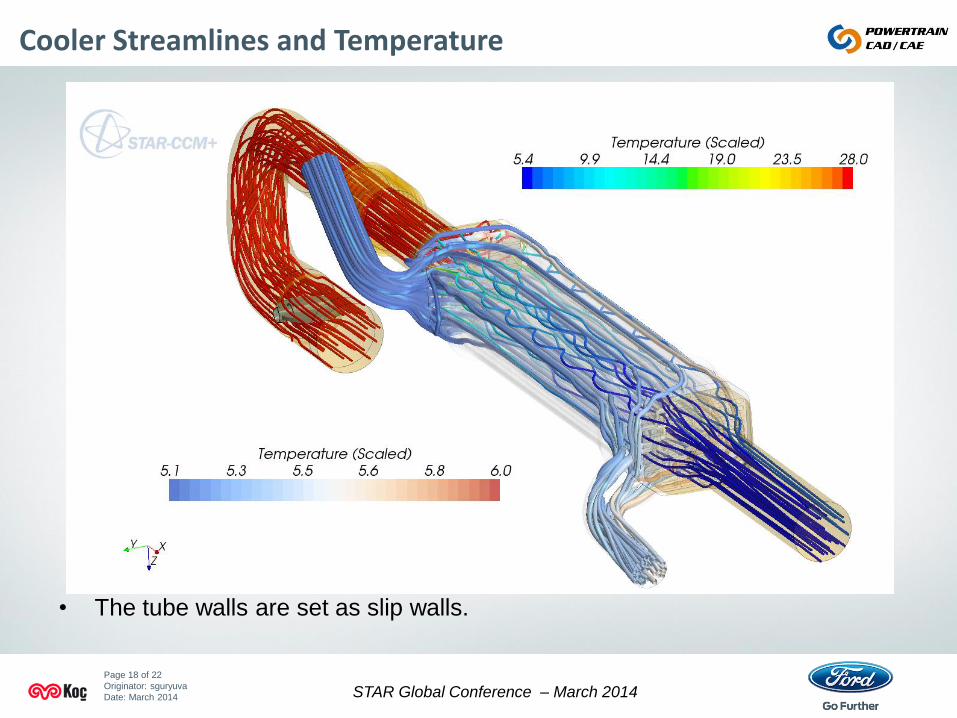
Cooler Streamlines and Temperature
• The tube walls are set as slip walls.

STAR Global Conference – March 2014
Page 19 of 22
Originator: sguryuva
Date: March 2014
Shell Tubes Temperature
Coolant Side
GasSide

STAR Global Conference – March 2014
Page 20 of 22
Originator: sguryuva
Date: March 2014
Header Plate Temperature
• Hot side header plates are the most critical that are subjected to very high thermal stress and thermal fatigue.
• About 60°C difference in 2mm: 30 °C/mm temperature gradient.
Gas
Side View
Coolant
Side View
STAR Global Conference – March 2014
Page 21 of 22
Originator: sguryuva
Date: March 2014
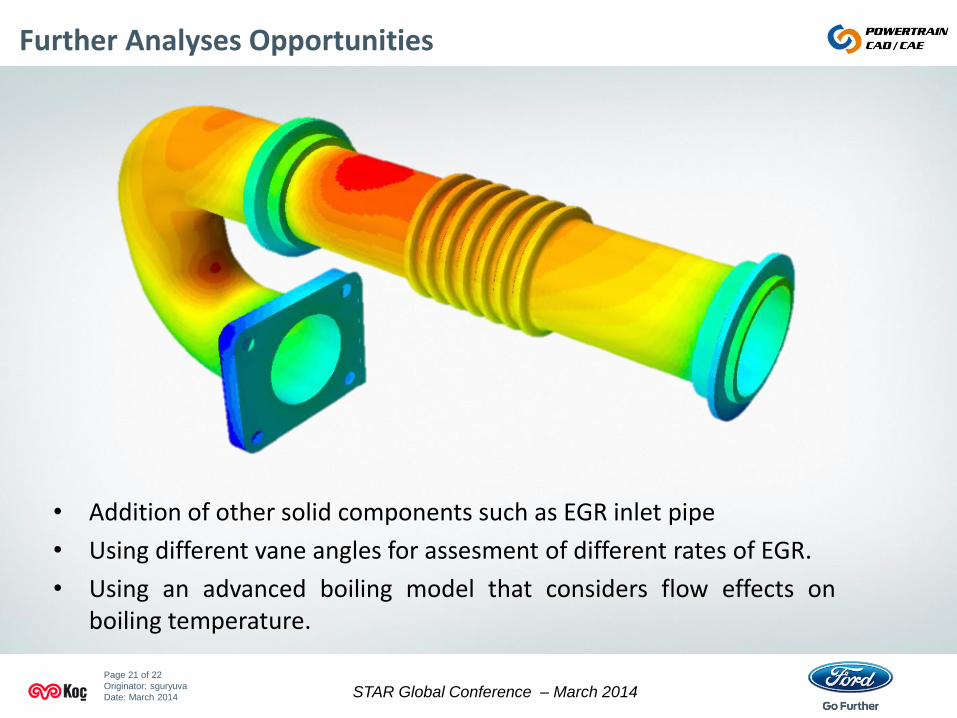
Further Analyses Opportunities
• Addition of other solid components such as EGR inlet pipe
• Using different vane angles for assesment of different rates of EGR.
• Using an advanced boiling model that considers flow effects on boiling temperature.

STAR Global Conference – March 2014
Page 22 of 22
Originator: sguryuva
Date: March 2014
Q&A