egprs-edge capacity with imd - grip it strips · pdf fileepgrs/edge and gprs capacity impact...
TRANSCRIPT
Finesse Wireless IncProperty of Finesse Wireless Inc. 10/6/2003
1 of 16© Finesse Wireless Inc 10/6/2003
EPGRS/EDGE and GPRS Capacity ImpactFrom Intermodulation Products and
Capacity Recovery with Intermodulation Products CancellationWhite Paper
Francis J. Smith CTO
Abstract: When cellular telephony voice and data channels are impacted by intermodulationproducts that fall inband of the Signal of Interest, the carrier to interference ratio is degraded and thecapacity of the channel can suffer significant degradation. While voice can suffer significant reductions inthe signal to noise ratio and still provide some measure of usability, the data networks are often severelydegraded. Packets are either correct or rejected, resulting in re-transmission. When re-transmission isrequired, bandwidth is consumed. If the re-transmission rate is too high for GPRS and EDGE, the data rateis reduced to a level where the re-transmission rate is acceptable. There are nine modulation and codingschemes for EGPRS/EDGE. As the packet error rate increases, greater error protection is required and thedata rate is reduced. This reduces the traffic capacity to the user. In this paper, one user is examined in thepresence of intermodulation products from other service provider basestations and the impact is modeledbased on throughput capacity versus the signal to interference based on data from Nokia [1][2] The impactof the intermodulation products is modeled and the benefit of the Finesse Wireless Inc. interferencemitigation technology is presented. The benefit of the suppression of intermodulation products ispresented, but the method of cancellation is proprietary and requires an NDA for disclosure. The FinesseWireless technology can recover a high percentage of the system capacity lost to intermodulation products.
1. Introduction:
Voice and data networks have significantly different levels of tolerance to bit error rate. Voice services canbe significantly degraded in bit error rate while still maintaining a useful radio link. However with data,this is not the case. Packet data channels can recover lost data via retransmission, but this costs linkcapacity. As the SNR (or the CIR) degrades, the capacity of data networks degrades rapidly. If, in the caseof EGPRS/EDGE and GPRS, the handset experiences intermodulation products (IMP) inband, the SNRwill be directly impacted. While the specifications for GSM and like systems only require designs toaccommodate IMP’s from two tones at -49dBm, much higher interference can be encountered. GSM andGPRS/EDGE are required to handle blocking tones as high as -26 dBm. The IMPs will have the samepower level independent of the location within the receiver band if the frequency spacing produces aninband IMP. Signals from other service provider basestations are often measured at -30 to -35 dBm andwhile not at common, -20 to -25 dBm are seen.
Finesse Wireless Inc. has developed and has patents pending for technology which facilitates cancellationof multiple IMPs in real time for any wireless applications, in the handset, mobile terminals or basestations. This paper is focused on the handset applications. The technology adapts in real time to cancel outcontinuous IMP interference and frequency hopped interference. The Signal of Interest (SOI) can be eitherfrequency hopped or non-frequency hopped. In both cases, the architecture is identical. The technology ismodulation and standards independent and requires no changes to baseband processors or standards. TheFinesse Wireless IMP interference suppression technology works for narrow band and wideband IMPinterfering signals and automatically compensates for fading and other real time changes in the IMPs asinterfering signals change in time. This includes changes due to Doppler shift, path loss, group delay andmultipath. The analysis in this paper looks at the impact on the capacity of a handset with high power IMPsand the recovery of capacity as a function of the cancellation of IMPs. This technology is directlyapplicable to direct conversion and super heterodyne implementations.
Cellular handsets or mobile stations (MS) must provide for reception of traffic channels anywhere in theallocated mobile telephony spectrum. In North America, the Cellular Band is 28 MHz and the PCS is 60MHz. The MS does not have a priori knowledge of the channel to which it will be assigned prior toentering a cell and thus must receive the entire band at the front end prior to channel selection. In a superheterodyne, channel selection is done at an intermediate frequency (IF), and in a direct conversion receiver

Finesse Wireless IncProperty of Finesse Wireless Inc. 10/6/2003
2 of 16© Finesse Wireless Inc 10/6/2003
it is done at zero IF, or baseband. When high power signals from other service provider base stations (BS)are present, these signals will mix in the nonlinear analog elements of the MS and produce IMPs prior tofinal channel selection. The location of the source signals that generate the IMPs, does not impact thepower in the IMP as long as the frequency spacing results in an inband IMP, as shown in figure 1, whenX=Y.
As shown in Fig 1., CDMA2000 requires that performance be met in the presence of tones at -21dBm, butdoes however relax the sensitivity requirement of the MS from -119dBm to -94dBm. This, however,requires the BS to increase the power transmitted for the given user. The WCDMA specification requiresthe MS be designed for a two tone test at -49dBm rather than the -21dBm specified for CDMA2000. Fordesigns with reasonable linearity, when a WCDMA MS is subjected to the high level of interference (asspecified for CDMA2000) the impact to the MS sensitivity is severe. Base station (BS) transmitterstransmit on the order of +46dBm and sometimes as high as +50 to +60 dBm. CDMA200 and WCDMA areaddressed in the companion paper to this paper from Finesse Wireless Inc. “Impact of the Interference fromIntermodulation Products on the Load Factor and Capacity of Cellular CDMA2000 and WCDMA Systems& Mitigation with Interference Suppression”.
1850MHz
1990MHz
TransmitReceive
Guardband20 MHz
Transmit Band Receive Band1910MHz
1930MHz
PCS Band Band Class 1
10 MHzSignal of Interest-94 dBm
900 KHz 800 KHz
1700 KHz
-21 dBm -21 dBm
2 x 900 -1700 = 100KHz
CDMA IS-95, IS-98 CDMA2000 1X, 2X and 3X 1.25
MHz
TDMA orAMPS
GSMGPRSEDGE
Note: First jammer is900KHz offset for BandClass o and offset 1270
for Band class 1
AMPS, TDMA and CDMAexist in Band Class 0
TDMA, GSM and CDMAexist in Band Class 1
10 MHz
2 - 2.5 G
-21 dBm -21 dBm
TDMA orAMPS
GSMGPRSEDGE
Signal of Interest
3 G WCDMA
HomeBasestation
Other ServiceProvider
Basestation
Other ServiceProvider
Basestation
3rd OrderMixing Produces
Inband Interference
3rd Order Intermodulation Product Interference Signal Generation
3rd order IMPInterference can be
Narrowband orWideband
WCDMA 3G is threetimes as vulnerable
to multiple IMPsbecause it is 3
times the width ofCDMA 2000
X YIF X = Y
Intermod isinband
Fig. 1: The Power in the IMPs does not depend on the Proximity of the Source Signals, but only on theFrequency Spacing and Power in the Source Signals. IMPs can be Wideband or Narrowband Signals.
As shown in Fig.2, GSM and WCDMA must meet performance requirements in the presence of blockingsignals that are nearly as high as the CDMA2000 two tone test. It is interesting to note that, if a GSM MShas a system IIP3 of +0dBm (cascaded IIP3 from the antenna thru baseband filters) (-10 is more commonfor GSM) and it is subjected to tones at -21dBm, the IMP will be -63 dBm or more than 40 dB above theGSM sensitivity requirement. 3G WCDMA will be more vulnerable because the bandwidth is 3 times thatof CDMA2000, and it may be subjected to multiple IMPs. This paper will concentrate on GPRS andEGPRS/EDGE.

Finesse Wireless IncProperty of Finesse Wireless Inc. 10/6/2003
3 of 16© Finesse Wireless Inc 10/6/2003
The suppression of the IMPs has three benefits: 1. the handset receiver sensitivity is improved dB for dBdown to the noise floor of the receiver and, 2. the capacity of the cell/sector is preserved and, 3. the cell-to-cell interference is kept at a minimum. It can be shown that cellular systems are most effective when alltransmitters operate at the lowest possible level required to close the links and deliver the Quality ofService (QoS) specified.
Simulations of the Finesse Wireless Inc. technology show around 20 dB of IMP suppression and theanalysis herein shows the result of 10 and 20 dB suppression of the interfering IMPs. The suppression ofthe 2nd and 3rd order IMPs provides for either greater receiver sensitivity or relaxation of the IIP2 and IIP3or some combination of the two. For this reason, the resultant IMP suppression will be between 10 and 20dB. This technology is independent of modulation or signal bandwidth and can be used for all standards toinclude CDMA2000, 1x-EV-DO and other data standards, 3G WCDMA, GSM, GPRS, EDGE, AMPS andTDMA IS-136, either as the SOI or the source signals that generate the interfering IMPs.
The source of IMPs in telephony is described above. The analysis below will look at the impact of IMPson the Carrier to Interference Ratio (CIR) for EGPRS/EDGE (MCS 1-9) and GPRS (CS 1-4). Section 2describes the method of analysis and section 3 presents the MATLAB simulation results. These simulationswere done for CDMA2000, but are equally applicable to any standard and modulation. The simulationspredict approximately 20 dB of IMP interference cancellation. Section 4 presents the results of the analysispresented in section 2 for GRPS and EGPRS/EDGE for three cases, IMP cancellation of 0, 10 and 20 dB.
fo + 6
00 k
Hz
fo -
600
kHz
-99dBm... ... ... ...
fo +1
.4 M
Hzf o
+1.
6 M
H z
fo +2
.8 M
Hzfo
+3. 0
MHz
1920
MHz
1980
MHz
- 43 dBm- 33 dBm
-26 dBm-12 dBm
0 dBm 0 dBm
.........- 43 dBm- 33 dBm
-26 dBm-12 dBm
0 dBm0 dBm
fo -1
. 4 M
Hz
f o -1
. 6 M
Hz
fo -2
.8 M
H z
f o -3
. 0 M
Hz
1910
MH
z
1830
MHz
Inband
f0
Out-of-Band
(iii) (iv)
Out-of-Band
(i) (ii)
fo +
600
kHz
fo -
600 k
Hz
-99dBm
... ... ... ... ...
fo +
1.4 M
Hzfo
+1.
6 MHz
fo +
2.8 M
Hzfo
+3.0
MHz
2010
MHz
2070
MHz
- 43dBm
- 33dBm
-26dBm
-12dBm
0 dBm 0 dBm
...............
- 43dBm
- 33dBm
-26dBm
-12dBm
0 dBm0 dBm
fo -1
.4 M
Hz
fo -1
.6 M
Hz
fo -2
.8 M
Hz
fo -3
.0 M
Hz
1910
MH z
1830
MHz
Inband
f0
Out-of-Band
(iii) (iv)
Out-of-Band
(i) (ii)
Blocking Profile for North AmericaPCS 1900
Blocking Profile for Europe DSC 1800
40 MHz
......20 MHz
Fig. 2: The GSM/GPRS/EDGE and WCDMA Requirements for Blocking Tones are as high as the two tone testsfor CDMA2000. The GSM and WCDMA will Experience the Same Level of Interference as CDMA2000
2. Method of Analysis
Two handset implementations are examined, one for GPRS and one for EGPRS to include EDGE. In bothcases, ideal frequency hopping is assumed. Figure 3 is plotted from graphs in the textbook GSM, GPRSand EDGE Performance, Evolution Towards 3G/UMTS page 237 Figure 7.4. [1]. EGPRS has 9 modulationand coding schemes MCS-1 Thru MCS- 9. MSC-5 thru MSC-9 use 8 PSK. GPRS has 4 coding schemes

Finesse Wireless IncProperty of Finesse Wireless Inc. 10/6/2003
4 of 16© Finesse Wireless Inc 10/6/2003
CS 1 thru CS4. In figure 3, the modeling was done assuming a TU3 environment that is a typical urbanenvironment with the handset moving at 3 km per hour.
In the following analysis, a base station transmitter power of 45 dBm is used and the signal strength, as afunction of the distance from the user base station transmitter, is computed. The path loss was computedusing an equation from Reference [1] on page 239 for a TU3 environment. The Finesse Wirelesstechnology dynamically cancels 2nd order IMP products that manifest themselves as a “time varying” DCoffset. The Doppler effect will manifest itself as a “time varying” DC offset and the Finesse technologywill take this out thus making a TU50 environment look more like a TU3 or lower environment. (TU3assumes 3km per hour movement).
Eq. 1 L = 40*(1- (4 x 10⁻³ * h))*log10(R) +18*log10(h) +21*log10(f) + 80 dB
Where:L = loss in dBR = distance in kmh = base station antenna height above the roof in metersf = frequency is MHz = 850 MHz for this analysis
For the handset receiver, the following parameters were used:Thermal Noise = -174dBm/HzNoise bandwidth = 180 kHzNoise Figure = 5 dBSystem IIP3 = -10 dBm
From the data above, the Noise power and the signal power are computed.
This results in a system noise floor of -116dBm. When IMPs are well below the -116dBm (on the order of6 to 10 dB), they do not have an appreciable impact on the handset data capacity.
The IMP power is then computed with the following:
3rd Order IMP = 3*(tone power) – 2*IIP3
BaseStation Carrier High of Distance Free Space MSTrans Pwr Frequency BS from BT Loss RSSI
dBm MHz meters km dB dBm45 8.50E+02 15 0.1 7.06E+01 -25.5945 8.50E+02 15 0.2 7.66E+01 -31.6145 8.50E+02 15 0.3 8.01E+01 -35.1345 8.50E+02 15 0.4 8.26E+01 -37.6345 8.50E+02 15 0.5 8.46E+01 -39.5745 8.50E+02 15 0.6 8.62E+01 -41.1545 8.50E+02 15 0.7 8.75E+01 -42.4945 8.50E+02 15 0.8 8.87E+01 -43.6545 8.50E+02 15 0.9 8.97E+01 -44.6745 8.50E+02 15 1 9.06E+01 -45.5945 8.50E+02 15 1 9.06E+01 -45.5945 8.50E+02 15 1.2 9.22E+01 -47.1745 8.50E+02 15 1.3 9.29E+01 -47.8745 8.50E+02 15 1.4 9.35E+01 -48.5145 8.50E+02 15 1.5 9.41E+01 -49.11
Table 1: Power of Source Signals as a function of Distance from Offending Base station
The power available from interfering base station was computed as a function of the distance from thosebase stations. These are the source of the signals that produce the IMPs. Table 1 provides the values of the

Finesse Wireless IncProperty of Finesse Wireless Inc. 10/6/2003
5 of 16© Finesse Wireless Inc 10/6/2003
receive signal strength (RSS) of the source tones on the handset as a function of distance, from the “otherprovider” base station, using equation 2 taken from page 152 reference [1]. This equation is used instead ofequation 1 because the interfering signals are likely to be much closer and multipath does not affect theinterference to the same degree as the signal of interest (SOI) and we are just looking at RSS. Thisequation assumes a line of sight condition. If the signal of the “other provider” is high enough to be ofconcern, it will probably be a line of sight condition with the MS being close to the offending base station.
Eq 2 L= 32 + 20*log10(f) + 20*log10(d)Where:
L = path loss in dBf = frequency in MHzd = distance in km
Figure 3: EGPRS and GPRS Capacity as a Function of CIR [1], [2]
While the standards do not require receivers for EPGRS and GPRS to meet performance requirements withtwo tone tests above -49 dBm, other cellular telephony standards require up to -21 dBm two tone tests. Tomeet the -49 dBm test with no degradation, a receiver would have a system IIP3 of -10dBm to -12 dBm.For this analysis, a system IIP3 of -10dBm was used.
The power in the 3rd order IMP is added to the noise power to compute the total interference power. As afunction of the distance from the user base station transmitter, the Carrier to Interference Ratio (CIR) iscomputed as the ratio of the signal strength to the interference power. With the CIR, Figure 3 was used todetermine the data throughput capacity for EGPRS/EDGE and GPRS. Table 2 was generated from figure3.
3. IMP Interference Mitigation Technology, System Simulations
A MATLAB system simulation was built for a CDMA2000 receiver with performance specifications thatjust meet the high power two tone test. Fig. 4 shows the SOI and the IMP generated by the system thatmeets the sensitivity requirement of -94dBm. Fig. 5 shows the improvement when the IMP is cancelled by

Finesse Wireless IncProperty of Finesse Wireless Inc. 10/6/2003
6 of 16© Finesse Wireless Inc 10/6/2003
the Finesse Wireless technology. In the simulations, the SOI is shown as a tone so that the relativestrength can be seen. In reality, it is below the noise floor and spread by 21 dB.
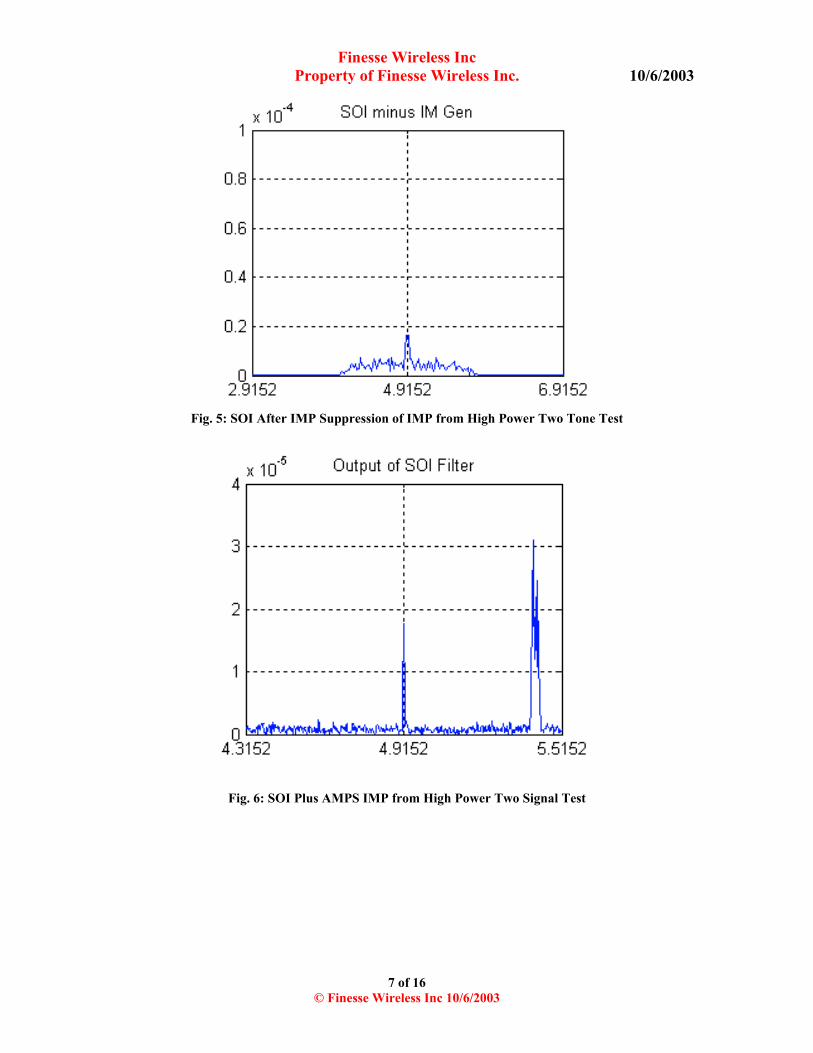
In the real world the source signals that generate the IMPs, are not tones but are modulated signals. Anadditional simulation was run with simulated FM AMPS signal with a 30 kHz bandwidth. Fig.6 shows theSOI plus the IMP prior to IMP suppression. Fig. 5 shows the SOI after IMP suppression. As shown in Fig.7, there is a small residual of the modulated IMP. This can be eliminated when the differential group delayis taken into account. Even at the present level, when the IMP is spread by the CDMA2000 spreading gainof 21dB, it will have no impact on the signal to interference ratio.
The simulations are predicting 18 to 20 dB of suppression for the modulated and tone IMPs respectively.10dB suppression of the IMPs is conservative and 15 to 20dB is reasonable. As will be shown below,significant sensitivity and system capacity improvements can be achieved with IMP suppression in thehandset or MS.
Fig. 4: SOI Plus IMP from High Power Two Tone Test
Finesse Wireless IncProperty of Finesse Wireless Inc. 10/6/2003
7 of 16© Finesse Wireless Inc 10/6/2003
Fig. 5: SOI After IMP Suppression of IMP from High Power Two Tone Test
Fig. 6: SOI Plus AMPS IMP from High Power Two Signal Test

Finesse Wireless IncProperty of Finesse Wireless Inc. 10/6/2003
8 of 16© Finesse Wireless Inc 10/6/2003
Fig. 7: SOI After IMP Suppression of IMP from High Power Two Signal Test
3. Analysis and Computations
Table 2 lists the values of the data throughput taken off of the graph in Figure 3. Table 3 shows the resultsof the computations of the SOI strength and the noise power as a function of the distance from the basestation. Table 4 shows the CIR as a function of the power in the tones from offending base stations and thedistance from the user base station.
Tables 5 and 6 were generated by taking the CIR from Table 4 and the data from Table 2. The results arethe tables for the capacity of EGPRS/EDGE and GPRS handsets in the presence of IMPs. The results showthe impact of IMPs on the data carrying capacity with no IMP cancellation. Tables 7 thru 9 give the resultsof the computation for a 10 dB cancellation of IMPs and Tables 10 thru 12 provide the same for 20 dB ofIMP cancellation
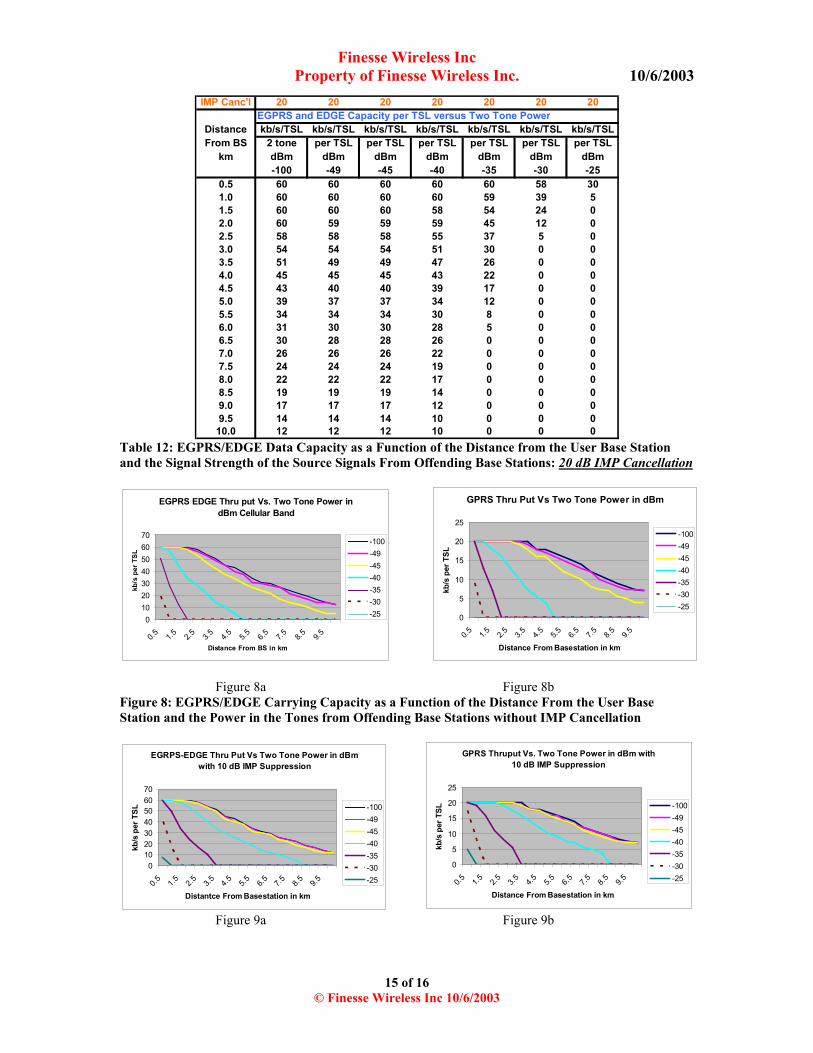
Figures 8a and 8b show a graphical representation of the EGPRS/EDGE and GPRS Capacity in kb/s perTime Slot (TSL) with no IMP Cancellation as a function of the power in the two tone test signals. Thereare 8 time slots per GPRS channel. Figures 9a and 9b show the EGPRS/EDGE and GPRS Capacity with10 dB of IMP Cancellation and Figures 10a and b show the EGPRS/EDGE and GPRS capacity with 20 dBof IMP cancellation.

Finesse Wireless IncProperty of Finesse Wireless Inc. 10/6/2003
9 of 16© Finesse Wireless Inc 10/6/2003
BaseStation Carrier High of Distance Free Space MS Back Grnd Noise Noise NoiseTrans Pwr Frequency BS from BT Loss RSSI Noise Bandwidth Factor Power
dBm MHz meters km dB dBm dBm/Hz Hz dB dBm45 8.50E+02 15 0.5 1.09E+02 -64.03 -1.74E+02 1.80E+05 5.00E+00 -1.16E+0245 8.50E+02 15 1 1.20E+02 -75.35 -1.74E+02 1.80E+05 5.00E+00 -1.16E+0245 8.50E+02 15 1.5 1.27E+02 -81.97 -1.74E+02 1.80E+05 5.00E+00 -1.16E+0245 8.50E+02 15 2 1.32E+02 -86.67 -1.74E+02 1.80E+05 5.00E+00 -1.16E+0245 8.50E+02 15 2.5 1.35E+02 -90.31 -1.74E+02 1.80E+05 5.00E+00 -1.16E+0245 8.50E+02 15 3 1.38E+02 -93.29 -1.74E+02 1.80E+05 5.00E+00 -1.16E+0245 8.50E+02 15 3.5 1.41E+02 -95.81 -1.74E+02 1.80E+05 5.00E+00 -1.16E+0245 8.50E+02 15 4 1.43E+02 -97.99 -1.74E+02 1.80E+05 5.00E+00 -1.16E+0245 8.50E+02 15 4.5 1.45E+02 -99.91 -1.74E+02 1.80E+05 5.00E+00 -1.16E+0245 8.50E+02 15 5 1.47E+02 -101.63 -1.74E+02 1.80E+05 5.00E+00 -1.16E+0245 8.50E+02 15 5.5 1.48E+02 -103.19 -1.74E+02 1.80E+05 5.00E+00 -1.16E+0245 8.50E+02 15 6 1.50E+02 -104.61 -1.74E+02 1.80E+05 5.00E+00 -1.16E+0245 8.50E+02 15 6.5 1.51E+02 -105.91 -1.74E+02 1.80E+05 5.00E+00 -1.16E+0245 8.50E+02 15 7 1.52E+02 -107.12 -1.74E+02 1.80E+05 5.00E+00 -1.16E+0245 8.50E+02 15 7.5 1.53E+02 -108.25 -1.74E+02 1.80E+05 5.00E+00 -1.16E+0245 8.50E+02 15 8 1.54E+02 -109.30 -1.74E+02 1.80E+05 5.00E+00 -1.16E+0245 8.50E+02 15 8.5 1.55E+02 -110.29 -1.74E+02 1.80E+05 5.00E+00 -1.16E+0245 8.50E+02 15 9 1.56E+02 -111.23 -1.74E+02 1.80E+05 5.00E+00 -1.16E+0245 8.50E+02 15 9.5 1.57E+02 -112.11 -1.74E+02 1.80E+05 5.00E+00 -1.16E+0245 8.50E+02 15 10 1.58E+02 -112.95 -1.74E+02 1.80E+05 5.00E+00 -1.16E+02
Table 2 Data Capacity versus CIR taken from Figure 3

Finesse Wireless IncProperty of Finesse Wireless Inc. 10/6/2003
10 of 16© Finesse Wireless Inc 10/6/2003
Freq Hop EGPRS EGPRS Freq Hop GPRS GPRSCIR kb/s/TSL x 8 CIR kb/s/TSL x 8
0 5 40 0 4 321 7.5 60 1 5 382 10.0 80 2 5.5 443 12.0 96 3 7 524 14.0 112 4 7.5 605 16.5 132 5 8 666 19.0 152 6 9 727 21.5 172 7 10 808 24.0 192 8 11 889 26.0 208 9 12 96
10 28.0 224 10 13 10411 29.5 236 11 14 11212 31.0 248 12 15 12013 34.0 272 13 16 12414 37.0 296 14 16 12815 38.5 308 15 17 13216 40.0 320 16 17 13617 42.5 340 17 18 14018 45.0 360 18 18 14419 47.0 376 19 19 14820 49.0 392 20 19 15221 51.0 408 21 20 15622 53.0 424 22 20 16023 54.0 432 23 20 16024 55.0 440 24 20 16025 56.5 452 25 20 16026 58.0 464 26 20 16027 58.5 468 27 20 16028 59.0 472 28 20 16029 59.5 476 29 20 16030 60.0 480 30 20 160
Table 3 Computation of Signal Strength and Noise Floor as a Function of Distance from the BaseStation

Finesse Wireless IncProperty of Finesse Wireless Inc. 10/6/2003
11 of 16© Finesse Wireless Inc 10/6/2003
IMP Canc'l 0 0 0 0 0 0 0 IMP Canc'l3rd IMP -127.00 -115.00 -100.00 -85.00 -70.00 -55.00 -43.00
none -49.00 -45.00 -40.00 -35.00 -30.00 -25.00 -21.00 Distance2-Tone 2-tone 2-tone 2-tone 2-tone 2-tone 2-tone 2-tone From BSdBm dBm dBm dBm dBm dBm dBm dBm kmCIR CIR CIR CIR CIR CIR CIR CIR 052 52 48 36 21 6 -9 -21 0.541 40 37 25 10 -5 -20 -32 1.034 34 30 18 3 -12 -27 -39 1.530 29 26 13 -2 -17 -32 -44 2.026 25 22 10 -5 -20 -35 -47 2.523 22 19 7 -8 -23 -38 -50 3.021 20 17 4 -11 -26 -41 -53 3.518 18 14 2 -13 -28 -43 -55 4.017 16 13 0 -15 -30 -45 -57 4.515 14 11 -2 -17 -32 -47 -59 5.013 12 9 -3 -18 -33 -48 -60 5.512 11 8 -5 -20 -35 -50 -62 6.011 10 7 -6 -21 -36 -51 -63 6.59 9 5 -7 -22 -37 -52 -64 7.08 7 4 -8 -23 -38 -53 -65 7.57 6 3 -9 -24 -39 -54 -66 8.06 5 2 -10 -25 -40 -55 -67 8.55 4 1 -11 -26 -41 -56 -68 9.04 4 0 -12 -27 -42 -57 -69 9.53 3 0 -13 -28 -43 -58 -70 10.0
Table 4: Carrier to Interference Ratio as a function of the Distance from the Base Station and theStrength in the 2-Tones producing the IMPs. No IMP Interference Cancellation.
IMP Canc'l 0 0 0 0 0 0 0GPRS Capacity per TSL versus Two Tone Power
Distance kb/s/TSL kb/s/TSL kb/s/TSL kb/s/TSL kb/s/TSL kb/s/TSL kb/s/TSLFrom BS 2 tone per TSL per TSL per TSL per TSL per TSL per TSL
km dBm dBm dBm dBm dBm dBm dBm-100 -49 -45 -40 -35 -30 -25
0.5 20 20 20 20 20 9 01.0 20 20 20 20 13 0 01.5 20 20 20 18 7 0 02.0 20 20 20 16 0 0 02.5 20 20 20 13 0 0 03.0 20 20 19 10 0 0 03.5 20 19 18 8 0 0 04.0 18 18 16 6 0 0 04.5 18 17 16 4 0 0 05.0 17 16 14 0 0 0 05.5 16 15 12 0 0 0 06.0 15 14 11 0 0 0 06.5 14 13 10 0 0 0 07.0 12 12 8 0 0 0 07.5 11 10 8 0 0 0 08.0 10 9 7 0 0 0 08.5 9 8 6 0 0 0 09.0 8 8 5 0 0 0 09.5 8 8 4 0 0 0 010.0 7 7 4 0 0 0 0
Table 5: GPRS Data Capacity as a Function of the Distance from the User Base Station and theSignal Strength of the Source Signals From Offending Base Stations. No IMP InterferenceCancellation
Finesse Wireless IncProperty of Finesse Wireless Inc. 10/6/2003
12 of 16© Finesse Wireless Inc 10/6/2003
IMP Canc'l 0 0 0 0 0 0 0EGPRS and EDGE Capacity per TSL versus Two Tone Power
Distance kb/s/TSL kb/s/TSL kb/s/TSL kb/s/TSL kb/s/TSL kb/s/TSL kb/s/TSLFrom BS 2 tone per TSL per TSL per TSL per TSL per TSL per TSL
km dBm dBm dBm dBm dBm dBm dBm-100 -49 -45 -40 -35 -30 -25
0.5 60 60 60 60 51 19 01.0 60 60 60 57 28 0 01.5 60 60 60 45 12 0 02.0 60 59 58 34 0 0 02.5 58 57 53 28 0 0 03.0 54 53 47 22 0 0 03.5 51 49 43 14 0 0 04.0 45 45 37 10 0 0 04.5 43 40 34 5 0 0 05.0 39 37 30 0 0 0 05.5 34 31 26 0 0 0 06.0 31 30 24 0 0 0 06.5 30 28 22 0 0 0 07.0 26 26 17 0 0 0 07.5 24 22 14 0 0 0 08.0 22 19 12 0 0 0 08.5 19 17 10 0 0 0 09.0 17 14 8 0 0 0 09.5 14 14 5 0 0 0 0
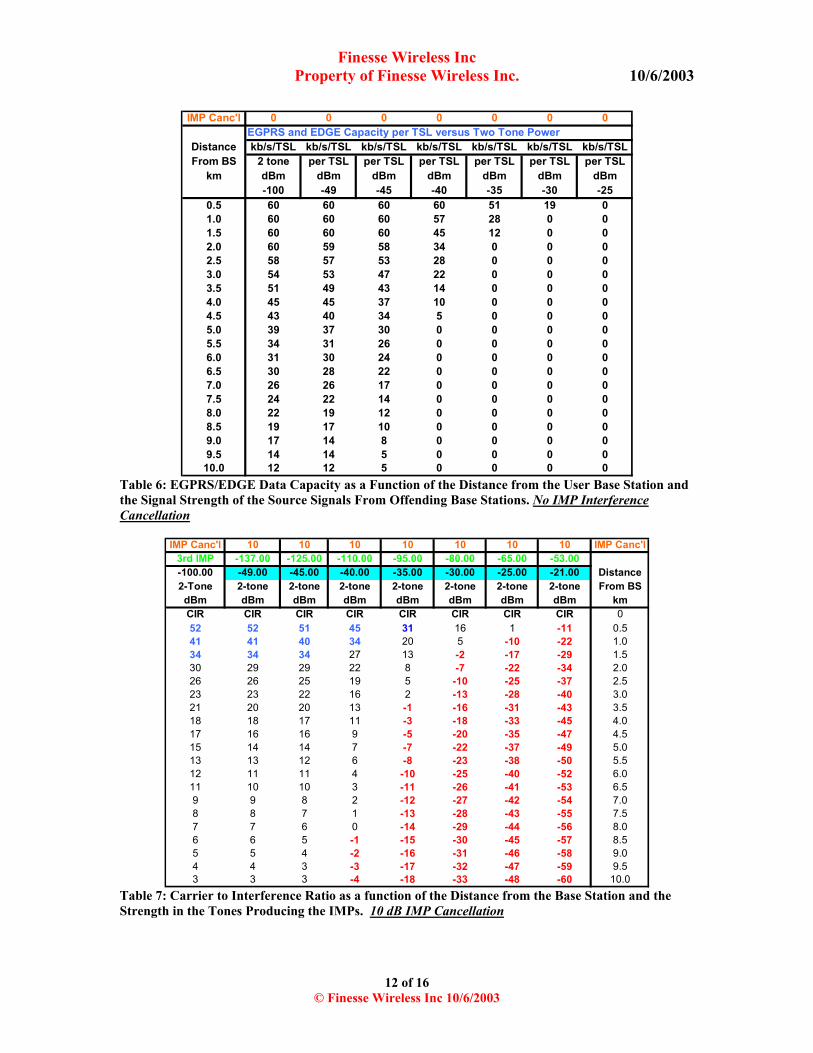
10.0 12 12 5 0 0 0 0Table 6: EGPRS/EDGE Data Capacity as a Function of the Distance from the User Base Station andthe Signal Strength of the Source Signals From Offending Base Stations. No IMP InterferenceCancellation
IMP Canc'l 10 10 10 10 10 10 10 IMP Canc'l3rd IMP -137.00 -125.00 -110.00 -95.00 -80.00 -65.00 -53.00-100.00 -49.00 -45.00 -40.00 -35.00 -30.00 -25.00 -21.00 Distance2-Tone 2-tone 2-tone 2-tone 2-tone 2-tone 2-tone 2-tone From BSdBm dBm dBm dBm dBm dBm dBm dBm kmCIR CIR CIR CIR CIR CIR CIR CIR 052 52 51 45 31 16 1 -11 0.541 41 40 34 20 5 -10 -22 1.034 34 34 27 13 -2 -17 -29 1.530 29 29 22 8 -7 -22 -34 2.026 26 25 19 5 -10 -25 -37 2.523 23 22 16 2 -13 -28 -40 3.021 20 20 13 -1 -16 -31 -43 3.518 18 17 11 -3 -18 -33 -45 4.017 16 16 9 -5 -20 -35 -47 4.515 14 14 7 -7 -22 -37 -49 5.013 13 12 6 -8 -23 -38 -50 5.512 11 11 4 -10 -25 -40 -52 6.011 10 10 3 -11 -26 -41 -53 6.59 9 8 2 -12 -27 -42 -54 7.08 8 7 1 -13 -28 -43 -55 7.57 7 6 0 -14 -29 -44 -56 8.06 6 5 -1 -15 -30 -45 -57 8.55 5 4 -2 -16 -31 -46 -58 9.04 4 3 -3 -17 -32 -47 -59 9.53 3 3 -4 -18 -33 -48 -60 10.0
Table 7: Carrier to Interference Ratio as a function of the Distance from the Base Station and theStrength in the Tones Producing the IMPs. 10 dB IMP Cancellation

Finesse Wireless IncProperty of Finesse Wireless Inc. 10/6/2003
13 of 16© Finesse Wireless Inc 10/6/2003
IMP Canc'l 10 10 10 10 10 10 10GPRS Capacity per TSL versus Two Tone Power
Distance kb/s/TSL kb/s/TSL kb/s/TSL kb/s/TSL kb/s/TSL kb/s/TSL kb/s/TSLFrom BS 2 tone per TSL per TSL per TSL per TSL per TSL per TSL
km dBm dBm dBm dBm dBm dBm dBm-100 -49 -45 -40 -35 -30 -25
0.5 20 20 20 20 20 18 51.0 20 20 20 20 19 8 01.5 20 20 20 20 16 0 02.0 20 20 20 20 11 0 02.5 20 20 20 19 8 0 03.0 20 20 20 18 6 0 03.5 20 19 19 16 0 0 04.0 18 18 18 14 0 0 04.5 18 18 18 12 0 0 05.0 17 16 16 10 0 0 05.5 16 16 15 9 0 0 06.0 15 14 14 8 0 0 06.5 14 13 13 7 0 0 07.0 12 12 11 6 0 0 07.5 11 11 10 5 0 0 08.0 10 10 9 4 0 0 08.5 9 9 8 0 0 0 09.0 8 8 8 0 0 0 09.5 8 8 7 0 0 0 0
10.0 7 7 7 0 0 0 0Table 8: GPRS Data Capacity as a Function of the Distance from the User Base Station and theSignal Strength of the Source Signals From Offending Base Stations: 10 dB IMP Cancellation
IMP Canc'l 10 10 10 10 10 10 10EGPRS and EDGE Capacity per TSL versus Two Tone Power
Distance kb/s/TSL kb/s/TSL kb/s/TSL kb/s/TSL kb/s/TSL kb/s/TSL kb/s/TSLFrom BS 2 tone per TSL per TSL per TSL per TSL per TSL per TSL
km dBm dBm dBm dBm dBm dBm dBm-100 -49 -45 -40 -35 -30 -25
0.5 60 60 60 60 60 40 81.0 60 60 60 60 49 17 01.5 60 60 60 58 34 0 02.0 60 59 59 53 24 0 02.5 58 58 57 47 17 0 03.0 54 54 53 40 10 0 03.5 51 49 49 34 0 0 04.0 45 45 43 30 0 0 04.5 43 40 40 26 0 0 05.0 39 37 37 22 0 0 05.5 34 34 31 19 0 0 06.0 31 30 30 14 0 0 06.5 30 28 28 12 0 0 07.0 26 26 24 10 0 0 07.5 24 24 22 8 0 0 08.0 22 22 19 5 0 0 08.5 19 19 17 0 0 0 09.0 17 17 14 0 0 0 09.5 14 14 12 0 0 0 0
10.0 12 12 12 0 0 0 0Table 9: EGPRS/EDGE Data Capacity as a Function of the Distance from the User Base Station andthe Signal Strength of the Source Signals From Offending Base Stations with 10 dB IMP Cancellation

Finesse Wireless IncProperty of Finesse Wireless Inc. 10/6/2003
14 of 16© Finesse Wireless Inc 10/6/2003
IMP Canc'l 20 20 20 20 20 20 20 IMP Canc'l3rd IMP -147.00 -135.00 -120.00 -105.00 -90.00 -75.00 -63.00-100.00 -49.00 -45.00 -40.00 -35.00 -30.00 -25.00 -21.00 Distance2-Tone 2-tone 2-tone 2-tone 2-tone 2-tone 2-tone 2-tone From BSdBm dBm dBm dBm dBm dBm dBm dBm kmCIR CIR CIR CIR CIR CIR CIR CIR 052 52 52 51 41 26 11 -1 0.541 41 41 39 29 15 0 -12 1.034 34 34 33 23 8 -7 -19 1.530 29 29 28 18 3 -12 -24 2.026 26 26 24 14 0 -15 -27 2.523 23 23 21 11 -3 -18 -30 3.021 20 20 19 9 -6 -21 -33 3.518 18 18 17 7 -8 -23 -35 4.017 16 16 15 5 -10 -25 -37 4.515 14 14 13 3 -12 -27 -39 5.013 13 13 11 1 -13 -28 -40 5.512 11 11 10 0 -15 -30 -42 6.011 10 10 9 -1 -16 -31 -43 6.59 9 9 7 -2 -17 -32 -44 7.08 8 8 6 -4 -18 -33 -45 7.57 7 7 5 -5 -19 -34 -46 8.06 6 6 4 -6 -20 -35 -47 8.55 5 5 3 -7 -21 -36 -48 9.04 4 4 2 -7 -22 -37 -49 9.53 3 3 2 -8 -23 -38 -50 10.0
Table 10: Carrier to Interference Ratio as a function of the Distance from the Base Station and theStrength in the Tones Producing the IMPs. 20 dB IMP Cancellation
IMP Canc'l 20 20 20 20 20 20 20GPRS Capacity per TSL versus Two Tone Power
Distance kb/s/TSL kb/s/TSL kb/s/TSL kb/s/TSL kb/s/TSL kb/s/TSL kb/s/TSLFrom BS 2 tone per TSL per TSL per TSL per TSL per TSL per TSL
km dBm dBm dBm dBm dBm dBm dBm-100 -49 -45 -40 -35 -30 -25
0.5 20 20 20 20 20 20 201.0 20 20 20 20 20 20 171.5 20 20 20 20 20 20 112.0 20 20 20 20 18 18 72.5 20 20 20 20 16 16 43.0 20 20 20 20 14 14 03.5 20 19 19 19 12 12 04.0 18 18 18 18 10 10 04.5 18 18 18 17 8 8 05.0 17 16 16 16 7 7 05.5 16 16 16 14 5 5 06.0 15 14 14 13 4 4 06.5 14 13 13 12 0 0 07.0 12 12 12 10 0 0 07.5 11 11 11 9 0 0 08.0 10 10 10 8 0 0 08.5 9 9 9 8 0 0 09.0 8 8 8 7 0 0 09.5 8 8 8 6 0 0 0
10.0 7 7 7 6 0 0 0Table 11: GPRS Data Capacity as a Function of the Distance from the User Base Station and theSignal Strength of the Source Signals From Offending Base Stations. 20 dB IMP Cancellation
Finesse Wireless IncProperty of Finesse Wireless Inc. 10/6/2003
15 of 16© Finesse Wireless Inc 10/6/2003
IMP Canc'l 20 20 20 20 20 20 20EGPRS and EDGE Capacity per TSL versus Two Tone Power
Distance kb/s/TSL kb/s/TSL kb/s/TSL kb/s/TSL kb/s/TSL kb/s/TSL kb/s/TSLFrom BS 2 tone per TSL per TSL per TSL per TSL per TSL per TSL
km dBm dBm dBm dBm dBm dBm dBm-100 -49 -45 -40 -35 -30 -25
0.5 60 60 60 60 60 58 301.0 60 60 60 60 59 39 51.5 60 60 60 58 54 24 02.0 60 59 59 59 45 12 02.5 58 58 58 55 37 5 03.0 54 54 54 51 30 0 03.5 51 49 49 47 26 0 04.0 45 45 45 43 22 0 04.5 43 40 40 39 17 0 05.0 39 37 37 34 12 0 05.5 34 34 34 30 8 0 06.0 31 30 30 28 5 0 06.5 30 28 28 26 0 0 07.0 26 26 26 22 0 0 07.5 24 24 24 19 0 0 08.0 22 22 22 17 0 0 08.5 19 19 19 14 0 0 09.0 17 17 17 12 0 0 09.5 14 14 14 10 0 0 0
10.0 12 12 12 10 0 0 0Table 12: EGPRS/EDGE Data Capacity as a Function of the Distance from the User Base Stationand the Signal Strength of the Source Signals From Offending Base Stations: 20 dB IMP Cancellation
Figure 8a Figure 8bFigure 8: EGPRS/EDGE Carrying Capacity as a Function of the Distance From the User BaseStation and the Power in the Tones from Offending Base Stations without IMP Cancellation
Figure 9a Figure 9b
EGPRS EDGE Thru put Vs. Two Tone Power in dBm Cellular Band
010203040506070
0.5 1.5 2.5 3.5 4.5 5.5 6.5 7.5 8.5 9.5
Distance From BS in km
kb/s
per
TSL
-100-49-45-40-35-30-25
GPRS Thru Put Vs Two Tone Power in dBm
0
5
10
15
20
25
0.5 1.5 2.5 3.5 4.5 5.5 6.5 7.5 8.5 9.5
Distance From Basestation in km
kb/s
per
TSL
-100-49-45-40-35-30-25
EGRPS-EDGE Thru Put Vs Two Tone Power in dBm with 10 dB IMP Suppression
010203040506070
0.5 1.5 2.5 3.5 4.5 5.5 6.5 7.5 8.5 9.5
Distantce From Basestation in km
kb/s
per
TSL -100
-49-45-40-35-30-25
GPRS Thruput Vs. Two Tone Power in dBm with 10 dB IMP Suppression
0
5
10
15
20
25
0.5 1.5 2.5 3.5 4.5 5.5 6.5 7.5 8.5 9.5
Distance From Basestation in km
kb/s
per
TSL -100
-49-45-40-35-30-25

Finesse Wireless IncProperty of Finesse Wireless Inc. 10/6/2003
16 of 16© Finesse Wireless Inc 10/6/2003
Figure 9: EGPRS/EDGE Carrying Capacity as a Function of the Distance From the User BaseStation and the Power in the Tones from Offending Base Stations with 10 dB IMP Cancellation
Figure 10a Figure 10bFigure 10: EGPRS/EDGE Carrying Capacity as a Function of the Distance From the User BaseStation and the Power in the Tones from Offending Base Stations with 20 dB IMP Cancellation
4. Conclusions:
The capacity of EGPRS/EDGE and GPRS handsets can be seriously degraded by high power IMPs fromother service provider base stations. When IMP cancellation is employed, the data rate throughput can goup by a factor of two to five times depending on the level of interference and the distance from the userbase station.
As an example, the EGPRS capacity in figure 8a for a two tone test at -40dBm at 3km range from the userbase station without IMP cancellation is about 25 kb/s per TSL. With 10 dB cancellation, the capacity isabout 40 kb/s and with 20 dB cancellation, the capacity is over 50 kb/s. In this fairly benign case, thecapacity of the EGPRS/EDGE handset is doubled.
If the two tones power is at -35dBm, at a range of 2.0 km, the capacity is around 5 kb/s and with 10 dBcancellation, it grows to almost 30 kb/s and with 20 dB cancellation, it grows to around 50 kb/s per TSL.
The IMP cancellation can improve the carrying capacity by a factor of 2 to 10 depending on the level ofdegradation due to IMP interference.
For further information, contact:Francis J. Smith Bert Tao,CTO Finesse Wireless Inc. CEO Finesse Wireless Inc.925-292-9042 (408) 316-0165925-292-9041 fax [email protected]@finessewireless.com
References:
[1.] GSM, GPRS and EDGE Performance, Evolution Towards 3G/UMTS, Timo Halonen, JavierRomero, Juan Melero, John Wiley and Sons, LTD, 2002.
[2] Rysavy, Data Capabilities for GSM Evolution to UMTS, November 19, 2002; Peter Rysavy,http://www.rysavy.com ; 1-514-386-7475
EGRPS-EDGE Thru Put Vs Two Tone Power in dBm with 20 dB IMP Suppression
010203040506070
0.5 1.5 2.5 3.5 4.5 5.5 6.5 7.5 8.5 9.5
Distantce From Basestation in km
kb/s
per
TSL none
-49-45-40-35-30-25
GPRS Thruput Vs. Two Tone Power in dBm with 20 dB IMP Suppression
0
5
10
15
20
25
0.5 1.5 2.5 3.5 4.5 5.5 6.5 7.5 8.5 9.5
Distance From Basestation in km
kb/s
per
TSL -100
-49-45-40-35-30-25