efsa performance report · efsa performance report ... emas eco-management audit scheme...
TRANSCRIPT

mb171011-i1EFSA Performance Report
GLOBAL PERFORMANCE SERVICES
EFSA Performance Report
Second Reporting period 2017
May – August 2017


Table of contents
Introduction........................................................................................................ 7
Performance at a glance ....................................................................................... 9
Section I. Annual and Multiannual work programme - Performance per StrategicObjective.......................................................................................................... 11
Prioritise public and stakeholder engagement in the process of scientific1.assessment.................................................................................................... 11
Widen EFSA’s evidence base and optimise access to its data ........................ 192.
Build the EU’s scientific assessment capacity and knowledge community ....... 223.
Prepare for future risk assessment challenges ............................................ 264.
Create an environment and culture that reflects EFSA’s values ..................... 295.
Section II. Management of resources ................................................................... 36
Budget and financial management ............................................................ 361.
FTEs and budget indicators per strategic objective ...................................... 382.
Section III. Assurance ........................................................................................ 40
Annex I. Resource allocation per strategic objective............................................... 42
Annex II. Financial resources .............................................................................. 44
ANNEX III. Status of projects .............................................................................. 56
Legend
Status Symbol Thresholds
Over-Achieved Actual/Target more than 105%
Achieved Actual/Target between 95% and 105%
Partially Achieved Actual/Target between 75% and 95%
Not Achieved Actual/Target less than 75%
N/A Data not available for this period

List of acronyms
AFSCO Advisory Forum and Scientific Cooperation Unit
AHAW Panel EFSA Panel on Animal Health and Welfare
ALPHA EFSA Animal and Plant Health Unit
AMU EFSA Assessment and Methodological Support Unit
AMR Antimicrobial resistance
ANS Panel EFSA Panel on Food Additives and Nutrient Sources Added to Food
APDESK EFSA Applications Desk Unit
BAU Business as usual
BIOCONTAM EFSA Biological Hazards and Contaminants Unit
BIOHAZ Panel EFSA Panel on Biological Hazards
BUS Business Services Department
CBC EFSA Corporate Business Control Team
CEF Panel EFSA Panel on Food Contact Materials, Enzymes, Flavourings and Processing Aids
CEN Communications Experts Network
COMMS EFSA Communications and External Relations Department
CONTAM Panel EFSA Panel on Contaminants in the Food Chain
CORSER EFSA Corporate Services Unit
CRM Customer Relation Management Project
DATA EFSA Evidence Management Unit
DEV Development projects
DG SANTE Directorate General for Health and Food Safety
DOI Declaration of Interest
doi digital object identifier
DTS Digital Transformation Services
EC European Commission
ECDC European Centre for Disease Prevention and Control
ECHA European Chemicals Agency
EEA European Environment Agency
EFSA European Food Safety Authority
EKE Expert Knowledge Elicitation
EMA European Medicines Agency
EMAS Eco-Management Audit Scheme certification
ENP European Neighbourhood Policy
EU European Union
EUAN EU Agencies Network
FEED EFSA Feed Unit
FEEDAP Panel EFSA Panel on Additives and Products or Substances Used in Animal Feed
FIN EFSA Finance Unit

FIP EFSA Food Ingredients and Packaging Unit
FTE Full-Time staff Equivalent
GMO Genetically Modified Organism / EFSA GMO Unit
GMO Panel EFSA Panel on Genetically Modified Organisms
GPS Global Performance Services Unit
HUCAP EFSA Human Capital Unit
IAS Internal Audit Service of the European Commission
IPCHeM Information Platform for Chemical Monitoring
IPPC International Plant Protection Convention
JRC Joint Research Centre
JRC-IPSC JRC Institute for the Protection and Security of the Citizen
LA EFSA Legal and Regulatory Affairs Unit
MB EFSA Management Board
MD programme Managers’ development programme
MP Methodologies Programme
MRL Maximum Residue Level
MS Member States
NDA Panel EFSA Panel on Dietetic Products, Nutrition and Allergies
NUTRI EFSA Nutrition Unit
OECD Organisation for Economic Co-operation and Development
OHSAS Occupational Health and Safety Assessment Series
Open ScAIE Open Scientific Advanced Information and Evidence Hub
PII Process improvement initiatives
PLH Panel EFSA Panel on Plant Health
PPR Panel EFSA Panel on Plant Protection Products and Their Residues
PRAS EFSA Pesticides Unit
PROMETHEUS Promoting Methods for Evidence Use in Scientific Assessments project
RA risk assessment
RASA EFSA Risk Assessment and Scientific Assistance Department
RAW Risk Assessment Workflow
REGPRO Regulated products area
REPRO EFSA Scientific Evaluation of Regulated Products Department
RISKCOM EFSA Risk Communication Unit
ROA Rapid Outbreak Assessment
SC EFSA Scientific Committee
SCER EFSA Scientific Committee and Emerging Risks Unit
SDWH Scientific Data Warehouse project
SEA Stakeholder Engagement Approach
SSD2 Standard Sample Description project
TDI Tolerable Daily Intake
TERA Transparency and Engagement in Risk Assessment project

IntroductionThis document is the second Performance Report of EFSA and is designed to include informationin all aspects of the EFSA performance measured during the respective period of reportingagainst the annual and multiannual work programme as presented in the Single ProgrammingDocument adopted on 14 December 2016. Following the comments received during the 73rd
session of the MB, an effort is made to reduce the size of the report and provide clarity on thestructure. Focus has been put to the contribution of the activities and outputs of this reportingperiod to the expected results of the implementation of EFSA Strategy 2020.
EFSA’s Performance Indicators are set in the Single Programming Document 2017-2019 in orderto monitor the annual and the multiannual work of EFSA towards the achievement of itsstrategic objectives, following a “results-oriented approach”. Three levels of indicators aredefined:
• Intermediate impact (result) indicators measure EFSA’s performance to achieve its strategicobjectives in the long term from all related activities in a strategic area.
• Outcome (result) indicators measure the result of several activities towards achievingpartially a strategic objective in the midterm. Being measured less frequently, they areincluded in the report only if defined and if the frequency of measurement is relevant to thequarter.
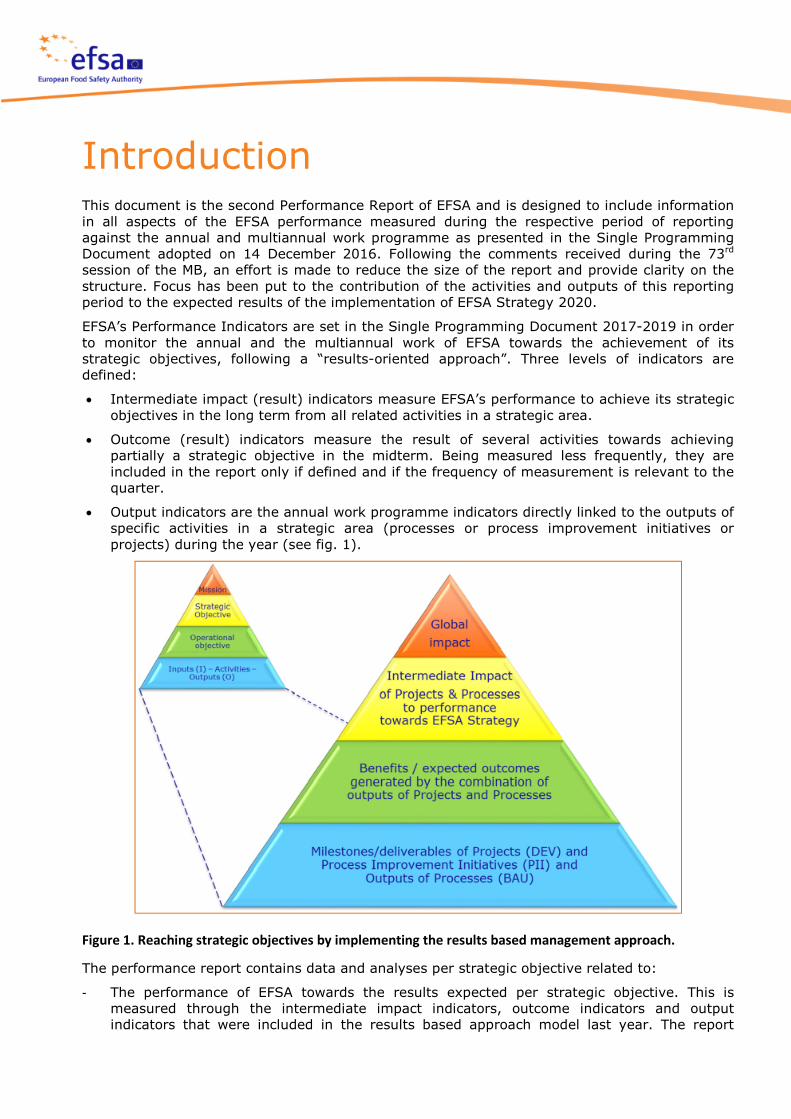
• Output indicators are the annual work programme indicators directly linked to the outputs ofspecific activities in a strategic area (processes or process improvement initiatives orprojects) during the year (see fig. 1).
Figure 1. Reaching strategic objectives by implementing the results based management approach.
The performance report contains data and analyses per strategic objective related to:
- The performance of EFSA towards the results expected per strategic objective. This ismeasured through the intermediate impact indicators, outcome indicators and outputindicators that were included in the results based approach model last year. The report

contains information on those indicators that are currently defined. As mentioned in the SPD2017-2019, there is a number of indicators for which the target and/or the baseline areunder definition in 2017;
- The progress of the work programme execution at outputs level and any variance observedrepresenting a deviation to the initial plan;
- The current status of the projects based on relevant data such as time, costs, quality andrisks parameters including how they do contribute to the achievement of the expectedresults;
- The forecast for the execution of the various aspects of the work programme by the end ofthe year;
- The comparison, whenever possible, with the performance of the same period in theprevious year in order to provide elements for reflection on trends and inform discussion onfuture activities.
The structure given to the report follows the one of the Annual Activity Report. It is split in threesections: Work programme achievements (I), Management of resources (II) and Assurance(III). However, Section III (Assurance) will be reported only in October and in the AnnualActivity Report in March. The recipients are the EFSA Governance bodies, namely theManagement team and the Management Board.
The release is done three times per year, following the respective reporting periods in alignmentwith the MB meetings:
- Performance Report P1, analysing data as of end of April
- Performance Report P2: analysing data as of end of August
- Performance Report P3: analysing data as of end of October
The last two months of the year will be included in the Annual Activity Report presented in Marchof the subsequent year.
The present report contains the achievements of the 2nd reporting period (P2), from the 1st ofMay to the 31st of August 2017. The actual values of the performance indicators are cumulativenumbers (January-August) compared to the annual targets set in the annual and multiannualwork programme of EFSA.

Performance at a glanceThe overall performance for this reporting period is satisfactory with only one out of59 indicators demonstrating ‘relevant deviations’ from their targets (the output indicator in SO1‘Number of questions in backlog in PRAS (art. 12 only) delivered’). Figure 2 presents theoverview of the EFSA performance per strategic objective for this reporting period. The picturewill be completed later in the year, when the remaining part of the performance indicators willbe defined and measured.
Figure 2. EFSA performance per strategic objective in P2 (January – August 2017)
Looking deeper in SO1 the picture is overall positive with the production of scientific outputsexceeding expectations, for both general risk assessment and regulated products. However, inregulated products the art.12 backlog reduction in PRAS did not reach the target for thisreporting period but it is expected to remediate by the end of the year. In the same area ofregulated products the timeliness is slightly below the target for ‘the scientific and technicalquestions adopted within the deadline’ (excluding backlog). On the other hand, in the area ofstakeholders’ engagement and communication a moderate deviation from the target is observedfor the indicator ‘Proportion of scientific outputs delivered within 28 working days ofadoption (%)’, however progress is made since the previous reporting period. Nevertheless, theoverall medium term result in enhanced outreach and communication exceeds expectations even

if the long term result on ‘impact of media coverage’ is slightly below target (but not below thebaseline 2016) due to the end of August- negative coverage related to glyphosate. The majorityof projects contributing to the results of this strategic area are on track. Some deviations in theimplementation of the IT solutions and their integration are observed in Matrix project, wherethe pilots foreseen have been postponed to autumn 2017.
Under SO2 and the evidence management area, the production of scientific outputs exceededexpectations. Towards wider data coverage, the ‘Molecular typing’ project has some risks ofdelay due to technical issues however it is foreseen that the project can be completed inSeptember. In the context of increased standardisation and interoperability of data, EU MENUrisks delays on the approval of reports due to quality issues, while the pilot SSD2 and IPCHEMprojects have successfully delivered and closed. Finally the pilot project ’data collection services’implementing service management in the DATA unit in response to an IAS auditrecommendation is pending prioritisation on budgetary grounds.
In SO3, towards building the EU’s scientific assessment capacity and knowledge community, theinternational cooperation activities and the resulted agreements are exceeding expectations. Theactivities with European and international partners towards building and sharing capacity withinthe risk assessment community exceed expectations.
In the preparedness and methodological development area (SO4), the production of scientificoutputs is exceeding expectations as well. Aiming at fostered use of new approaches andenhanced ability to anticipate and respond to risks, the relevant projects are on track. Moderatedeviation from the target observed in the guidance development on Hazard assessment ofEndocrine Disruptors for which an extension of deadline is requested.
In SO5 activities towards creating environment and culture reflecting EFSA’s values, at the levelof the annual programme execution the financial performance is slightly below target but higherthan last year execution. Compliance to the independence rules of EFSA is on track with theproportion of experts with approved annual DOI (aDOI) before first meeting invitation on target,while there is a deviation on the proportion of experts with approved specific DOI (sDOI) beforeparticipation in an EFSA meeting. A world-class IT to enable the achievement of EFSA's strategicobjectives is ascertained according to metrics on service delivery 89% above target & end usersatisfaction of 92% which increased in P2 and exceeded target of 90%. Additionally, thetransformation performance index has reached the target, improving from the previousreporting period.
Overall, the indicator for sound operational performance is on target. However, the singleindicator showing relevant deviation in SO1, brings the intermediate impact indicator ’Proportionof KPIs of the programming documents reaching target – output indicators’ in strategic objective5 at 88.2%, below the target, while the same indicator calculating the overall performance ofthe outcome indicators reached 96.3% and exceeds the target of 90%. No further deviations areobserved in the long and medium term results indicators.

Section I. Annual and
Multiannual work programme -
Performance per Strategic
Objective
Prioritise public and stakeholder engagement in the process of1.scientific assessment
In the area of provision and communication of scientific advice for general riskassessment priorities and regulated products, the main achievements from theimplementation of the EFSA work programme during the second reporting period of 2017were:
General risk assessment
• Animal welfare
Vector-borne diseases - story maps: EFSA has launched 36 interactive story mapsthat provide user-friendly information on vector-borne diseases – from theirgeographical spread, to the risk of introduction in the EU to prevention and controlmeasures. The story maps have been developed as part of a scientific opinion that willsupport risk managers to prioritise control measures. The tool that experts developed tocarry out their risk assessments (Mintrisk) and the data and information used by theexperts to reach their conclusions are publicly available. The interactive tool encouragespublic and stakeholder engagement by providing visually stimulating and user-friendlyway of reviewing information about various animal diseases. It reflects an effort tooptimize access to data and provides a baseline in assessment of a future evaluation ofan animal disease threat.
Welfare insights on slaughter of pregnant animals: EFSA experts have examinedissues surrounding the slaughter of pregnant farmed animals in Europe. EFSA’s Panel onAnimal Health and Welfare first assessed whether and when livestock foetuses ofdifferent animal species experience pain. The experts estimated the probability thatfoetuses experience pain during the final third of gestation. They concluded that themost probable scenario is that they don’t due to the presence of a series of inhibitorymechanisms in the body of the foetus. There is limited information on this topic andEFSA’s scientific opinion, which is based on expert judgement, offers insights that can beused by risk managers across the EU.
• Antimicrobial resistance
EU report: more evidence on link between antibiotic use and antibioticresistance: The EFSA, EMA and the ECDC finalized the Joint Interagency AntimicrobialConsumption and Resistance Analysis (JIACRA) report that presents new data onantibiotic consumption and antibiotic resistance and reflects improved surveillance acrossEurope. The report highlights that there are still important differences across the EU inthe use of antibiotics in animals and humans. Reducing their unnecessary use will havean impact on the occurrence of resistance. Experts of the three agencies recommendfurther research to better understand how the use of antibiotics and resistance affectone another.

EFSA Performance Report – P2, as of 31/8/2017
12
• Biological hazards
Scientists investigate origin of isolated BSE cases: the European Commission askedEFSA to investigate the origin of isolated cases of bovine spongiform encephalopathy(BSE) that are still being reported in the EU, although none of the 60 cases reportedsince 2001 entered the food chain, and to determine if these cases were caused bycontaminated feed or whether they occurred without an apparent cause. EFSA expertsconcluded that contaminated feed is the most likely source of infection. EFSA expertsmade a series of recommendations to maintain and strengthen the EU monitoring andreporting system, and to evaluate new scientific data that become available.
• Plant health
Pest risk assessment and risk reduction options for Atropellis spp, Diaporthevaccini, Eotetranychus lewisi and Radopholus similis: To support the new EU PlantHealth regime several pest risk assessments were adopted applying a quantitative pestrisk assessment methodology. These opinions are considered to be pilots for testing thenew methodology using models following the pathways, modelling the changes ofinfestation allowing quantification including uncertainty and evaluation of risk reductionoptions. These opinions further build the EUs scientific knowledge base on these pestsand their control. They use newly developed methodology and furthermore assist thepreparation for future risk assessment challenges.
Plant Pest categorisation opinions: Within the frame of supporting the new EU planthealth law and its secondary legislation for the listing of EU regulated pests, EFSA haspublished 8 pest categorisations out of 133 plant pest categorisations in total that will bedelivered in 3 batches throughout 2017-2020. In particular, EFSA is to determinewhether a specific pest falls in the criteria of a quarantine pest or those of aregulated/non-quarantine pest for the area of the EU. The scientific opinions provideinformation on the distribution of the pest and its host(s), the identity and biology of thepest, its entry pathways, establishment, spread and impact in the EU territory, as well asthe control measures. This work widens EFSA’s evidence base on these pests and as it isthe Step 1 of pest risks assessments it contributes significantly to the building of the EUscientific assessment capacity, and improves the preparatory phase for future riskassessments.
Scientific opinion on the risk of Citrus junos fruits for the introduction of citruscanker: EFSA analysed two scientific papers provided by Japanese authorities, as wellas 16 additional papers identified through a systematic literature review as she wasasked to indicate whether C. junos fruit could represent a pathway for the introduction ofcitrus bacterial canker into the European Union. The PLH Panel considers that itsconclusions from the 2014 opinion still apply. The targeted reply of EFSA about possiblepest introduction into EU via citrus fruit, widens the evidence base on this disease andimproved the preparation for future risk assessment challenges.
• Nutrition
Dietary reference values: EFSA publishes advice on vitamin K: EFSA has setdietary reference values for vitamin K as part of its review of scientific advice on nutrientintakes. The Panel on Dietetic Products, Nutrition and Allergies (NDA) decided tomaintain the dietary reference values established by the Scientific Committee for Food in1993. In order to ensure public engagement, a public consultation was carried out and atechnical report on the comments received was published.
Dietary reference values for riboflavin (vitamin B2) as part of its review ofscientific advice on nutrient intakes: Based on new scientific findings, the Panel onDietetic Products, Nutrition and Allergies (NDA) decided to update the dietary referencevalues for riboflavin established by the Scientific Committee for Food in 1993. EFSAconsidered comments and input on the draft scientific opinion it received during a five-week public consultation. A technical report on the comments received was published.

EFSA Performance Report – P2, as of 31/8/2017
13
Regulated products evaluation
• Support to applicants
The MATRIX project is piloting the electronic submission of applications workflow forPRAS, GMO and FEED and continues with the definition of dossier structure and thecreation of the ‘dossier builder’. Some deviations in the implementation of the ITsolutions and their integration are observed. For this reason, the internal pilot andthe pilot with MSs, EC and applicants has been postponed respectively untilSeptember and October 2017.
In the context of promoting dialogue with applicants and supporting them in theapplications procedure, the APDESK Unit finalised the ‘Update of the EFSA’sCatalogue of support initiatives during the life-cycle of applications for regulatedproducts’ and provided support to the ‘Webinar: scientific aspects to consider whenpreparing a novel food application’. Finally the 4th Roundtable with industryassociations was organised. The individual satisfaction applicant’s survey that waslaunched on 1 June 2017, is on-going with low number of replies received duringsummer.
• Food additives
EFSA reviews safety of glutamates added to food: EFSA has established a safeintake level for glutamic acid and glutamates used as food additives after re-evaluating their safety. The Authority also concluded that estimated dietary exposureto glutamic acid and glutamates may exceed not only the safe level but also dosesassociated with adverse effects in humans for some population groups. On this basis,EFSA’s experts recommend reviewing the maximum permitted levels for these foodadditives. EFSA re-assessed the safety of glutamates used as food additives andderived a group acceptable daily intake (ADI) based on the highest dose at whichscientists observed no adverse effects on test animals in toxicity studies.
EFSA confirms safe levels for nitrites and nitrates added to food: In theframework of food additives re-evaluation foreseen in the legislation, EFSA re-evaluated the existing levels for sodium and potassium salts of nitrite and nitrate(E 249-252) that are authorised in the EU to be intentionally added to meat andother foods. EFSA concluded that these levels are sufficiently protective forconsumers. Consumer exposure to nitrites and nitrates as food additives is withinsafe levels for all population groups, except for a slight exceedance in children whosediet is high in foods containing these additives. However, if all dietary sources ofnitrites and nitrates are considered, the safe levels (ADIs) may be exceeded for allage groups.
• Pesticides
Scientific support for preparing an EU position in the 49th Session of theCodex Committee on Pesticide Residues (CCPR): In 2016 JMPR evaluated12 active substances regarding the setting of toxicological reference values to beused in consumer risk assessment. EFSA was requested by the European Commissionto prepare comments on the Codex MRL proposals and the proposed toxicologicalreference values. In addition, EFSA provided the views on follow-up assessments ofJMPR on pesticides where specific concerns were raised in the previous CCPRmeetings. The Scientific Report of EFSA, published in July, was the basis for derivingthe EU position for the CCPR meeting.
Follow-up on glyphosate evaluation: Two EFSA statements on request from theEuropean Commission were published in June and August on the EU assessment ofglyphosate, in response to allegations made in the so-called “Monsanto papers”.
Conclusion on potential endocrine disruptor properties of glyphosate: Afocussed EFSA Conclusion on potential endocrine disrupting properties of glyphosatewas adopted in August. The conclusions of EFSA, following the peer review of theinitial risk assessment carried out by the competent authority of the rapporteur

EFSA Performance Report – P2, as of 31/8/2017
14
Member State, Germany, are reported, following the submission and evaluation ofpertinent data made available by the applicants. The current conclusion presents afollow-up assessment to the existing EFSA Conclusion on the peer review for therenewal of the approval of glyphosate (EFSA Journal 2015;13(11):4302) focussed onthe outstanding issues identified in relation to the potential endocrine activity ofglyphosate.
Stakeholders’ engagement and communication
• Stakeholders’ engagement
Aiming at enforcing the customer oriented approach of EFSA activities, increasingtransparency throughout the risk assessment process and fostering engagement of thestakeholders throughout the development of scientific outputs, the project on ‘customeroriented approach’, the project on ‘reputation management’ and the ‘StakeholderEngagement Approach’ (SEA) are on track. The TERA project is on track, delivering threemore of the planned measures to further increase transparency: (i) Enhancing use ofconsultation in different steps of risk assessment process (including pilot on draftmandates), (ii) Consultation meetings with MSs authorities introduced, (iii) Enhancedtransparency on re-opening of opinions process.
A number of opportunities for engagement with EFSA’s stakeholders have taken place inParma. Examples are: the 1st Stakeholder Forum at the end of May, with theparticipation of EFSA’s MB chair and over 50 registered stakeholders, aiming to fosterpublic and stakeholder involvement in the process of risk assessment. TheCommunicators Lab has been launched as way of eliciting feedback from EFSA’sregistered stakeholders; the setting up of Stakeholder Mandates Working Group as anew targeted engagement modality and the setting up of the Bee PartnershipStakeholder Discussion Group, as a follow-up on the Bee Health Symposium in Brussels.
• Media and social media
201 media requests were received, 1/3 less compared to the previous quarter, due tothe summer break. Over 5,000 articles mentioned EFSA in this period with most populartopics the glyphosate, independence (Conflicts of Interest/Transparency) and pesticides(Neonics). The fipronil tainted eggs incident generated a number or requests over thetime period mid-July/mid-August. Among the 23 interviews occurred in the reportingperiod, high-profile interviews with EFSA’s ED for the national Swedish Dagens Nyheterand Iceland’s national broadcasting service RÚV are highlighted. Several interviews tookplace with the EFSA scientists in Brussels during the bee event on June 26th. Campaignsand coverage on multiple platforms (Twitter, LinkedIn, Instagram) of the beesconference, bees photo competition, 2018 Panels renewal, Europe Day/EU@60, meatsafety in the EU and AMR were developed.
Towards strengthening the effectiveness of communication, the project ‘social media2020’, defined the strategy, amplification tools and its deliverables on architecture. Inthis context a workshop for pre-accession countries was held in FYROM.
• Content production and dissemination
The EFSA Journal launched the ‘EFSA Journal Publishing Efficiency Initiative’ to addressthe issue of timeliness in publication observed in the previous reporting period and todemonstrate the efficiency gains of the new publication process. The RiskCommunications Guidelines were also published. In the context of ‘Communicatinguncertainty’ the recruitment of a social scientists, and the first experts meeting onGuidance for Communication of Uncertainty were successful. Furthermore, support wasprovided to the 2018 Panel Renewal call via different channels, including a video, directmailings and social media campaigning, while the multimedia team published two newUnderstanding Science videos, one on novel foods and one on alternatives to animaltesting (http://www.efsa.europa.eu/en/topics/videos). Finally, the Annual Report onInternational Scientific Cooperation was published.

EFSA Performance Report – P2, as of 31/8/2017
15
Within the same area, aiming at ensuring clarity in the communication of findings, EFSAorganised an internal workshop on collaboration@EFSA in the context of the EFSA 2020Strategy. As a result, two new projects were launched in July 2017: ‘New World ofWorld’ under SO5 and ‘Digital Collaboration’ under SO1. The two projects are strictlycorrelated and will be coordinated under the supervision of a single Sponsor within theInformation Management Programme. Four pilot areas of collaboration & cooperation bymean of modern technology are envisioned for 2018: Use of Digital Collaboration toolsand processes with Experts (e.g. for WGs), use of Digital Collaboration tools andprocesses with MSs (e.g. for Networks), creation and management of “Communities ofKnowledge” and “Knowledge & Innovation Communities” (KICs), and modernise InternalCommunication & Engagement.
State of play
Indicators available to monitor performance in this area are presented in table 1-5 belowand a summary status report for the key projects under strategic objective 1 ispresented in Annex III. Overall the progress exceeds expectations with some deviationsdescribed below.
The production of scientific outputs and technical reports overall exceeded the target inthe area of general risk assessment (96 scientific outputs and 7 technical reports againsta target of a total of 71 for this quarter, achieving 90% of the annual target). Theincreased number of scientific outputs is due to the completion of activities related toanimal health categorisation and the early completion of priority 1 plant pests opinions.A technical report in the area of Nutrition has also been finalised before the deadline.
The annual target was exceeded also on the questions closed in other EFSA publications(external reports, event reports), due to additional 8 external scientific reports approved(ALPHA) and initially not planned in the work programme 2017, and 3 external scientificreports approved in the nutrition area.
Timeliness is on track with one Scientific Report of EFSA (part of P1 report) not meetingthe deadline (result within the margin of 5%). The delay is due to data discrepanciesidentified when the report was concluded. It has therefore been agreed with DG SANTEto circulate the report and the original raw data to the MS for a final check and to publishthe report only after the original raw data cross-checks and analysis. No new outputs inSO1 general RA were adopted late in this reporting period.
Table 1: Activity and outputs indicators for SO1 – General risk assessment
ACTIVITY – OUTPUT INDICATORS
General risk assessment
IndicatorTarget2017
TargetP2 2017
ExecutedP2 2017
StatusP2
% Target2017
Number of questions delivered forscientific outputs and technical reports
1141 71 103 90%
Number of questions delivered for‘other publications’2 (external reports,event reports)
7(externalreports)
1 20 286%
Proportion of scientific/technicalquestions adopted within deadline
100% 100% 99% 99%
1 Significant increase as of 2017 is due to new requests to be received for plant pest categorisation
(approximately 150 questions in 2017-2019), which have a lower complexity compared to regular questions.2 According to definitions of EFSA outputs http://www.efsa.europa.eu/en/efsajournal/scdocdefinitions.

EFSA Performance Report – P2, as of 31/8/2017
16
The production of scientific outputs and technical reports exceeded the target. In thearea of the evaluation of regulated products 251 scientific outputs and 42 technicalreports were published reaching 72% of the annual target. The reasons behind thisresult are a higher number of questions closed in the feed additives area. The unitfocused on applications during the first two plenaries in order to dedicate the meetingtime to the guidance updates from September onwards. Moreover, in the areas of healthclaims and nutrition some opinions were adopted early compared to the initial plan andadditional ones finalised earlier due to a lower complexity. The above balances themissed quarterly target for pesticides reasoned opinions where only 36 out of 60 initiallyplanned are finalised.
Art.12 backlog reduction in PRAS is not on target as 13 questions were closed out of 22,representing 59% of the January-August period target. A statement covering18 questions will be prepared in autumn and the expected result is that the annualtarget at the end of the year will be met via the adoption of a second statement later inthe year; the finalisation of discussions with DG SANTE on the content of the secondstatement presents a small risk of possible delay. A constant monitoring will beperformed during 2017 to report on the performance of the PRAS backlog reduction,especially the MRLs (Art.12). Moreover, EFSA is developing new ways of working in orderto ensure that the MRL backlog is over by 2022 as planned, providing that the additionalresources allocated to the MRL backlog plan can be maintained until then.
Timeliness is slightly below the 90% target: 86% of the scientific and technical questionsadopted within the deadline for regulated products excluding the backlog. Delays arereported in the feed additives and GMO areas due to the complexity of the opinions andhigh volume of questions compared to the available workforce. In the area of pesticides,the Programming Document 2018-2020 included three new groups of activities for whichadditional resources (total 10 FTEs) were needed: new data requirements under AIR III,endocrine disruption and co-formulants. In 2017, the Pesticides unit has been challengedwith the implementation of the first two groups. As EFSA did not receive and was notable to allocate additional resources for these tasks, following a consultation with DGSANTE in February 2017 the Pesticides Unit conducted a prioritisation exercise. In thearea of pesticides residues, the Art 10 MRL received the fourth level of priority, andconsequently the need to allocate resources to areas with higher priority has affectedthis process and consequently delays are also expected in the Art.10 MRL areas. In view
of the above, the result on timeliness is expected to be below the target by the end of
the year.
The number of service catalogue activities with applicants (meetings, webinars, infosessions etc.) exceeded the target for this reporting period reaching the 78% of theannual target.
Table 2: Activity and output indicators for SO1 – Regulated products
ACTIVITY – OUTPUT INDICATORS
Regulated products evaluation
IndicatorTarget2017
TargetP2 2017
ExecutedP2 2017
StatusP2
% Target2017
Number of questions delivered forscientific outputs and technical reports
408 204 293 72%
Number of questions delivered for‘other publications’3 (external reports,event reports)
2(externalreports)
0 5 N/A4
3 According to definitions of EFSA outputs http://www.efsa.europa.eu/en/efsajournal/scdocdefinitions.4 Not initially planned

EFSA Performance Report – P2, as of 31/8/2017
17
ACTIVITY – OUTPUT INDICATORS
Number of questions in backlog in PRAS(art. 12 only) delivered
45 22 13 29%
Proportion of scientific/technicalquestions adopted within deadline
90% 90% 86% 86%5
Number of service catalogue activitieswith applicants (meetings, webinars,info sessions etc.)
+10%(55)
30 43 78%
The indicator ‘Proportion of scientific outputs delivered within 28 working days ofadoption (%)’ has been analysed to clarify the low score recorded in the first period of2017, which continues not reaching the target also in this reporting period althoughexceeding the 70% of outputs. This analysis highlighted that the non-achievement isrelated to the first phase of the publication process, just after the adoption of the output.The efficiency initiative now launched is expected to address these issues.
As mentioned in the previous performance report, the initial target for the number ofregistered stakeholders was based on a ‘best-guess’ estimation as this system isoperating for the first time. The target will be adjusted next year.
Thanks to effective and pro-active campaigning by the stakeholder team, expectationswere exceeded for the first list; quarterly reviews of new applications are ongoing andwill still increase in numbers. As this activity will be in pilot mode until the end of theyear, the definition of the indicator and target will be reviewed for the following years.
Table 3: Activity and outputs indicators for SO1 – Communication and engagement
ACTIVITY – OUTPUT INDICATORS
Communication and engagement
IndicatorTarget2017
TargetP2 2017
ExecutedP2 2017
StatusP2
% Target2017
Proportion of scientific outputsdelivered within 28 working days ofadoption (%)
85 85% 70.5% 76%
Total number of registeredstakeholders
85 85 102 120%
The targets for all indicators at the outcome level are already exceeded. It isacknowledged that they were underestimated and will be re-defined; one reason is thelaunch of promotion actions to increase followers which was not taken into considerationwhen defining the targets in the planning phase.
Table 4: Outcome indicators for SO1
KPI Indicator BaselineTarget2017
TargetP2 2017
ExecutedP2 2017
StatusP2
Outcome: Enhanced outreach of communication
Social mediaeffectiveness
Increasefollowers fromsocial mediaplatforms
+46%(40,742)
+3%(41,964)
41,353 48,200
5 Considering that the target is 90% for these type of outputs

EFSA Performance Report – P2, as of 31/8/2017
18
KPI Indicator BaselineTarget2017
TargetP2 2017
ExecutedP2 2017
StatusP2
Outcome: Enhanced outreach of communication
Socialinteractions
14 881+30%
(19,345)12,897 23,256
Traffic to EFSAweb contentfrom socialmedia
2.6%(63,464)
+2%(64,759)
43,173 54,723
Traffic to EFSA's web content(web metrics): number ofsessions
2,896,741+0.5%
(2,713,500)1,809,000 1,994,595
Number of subscribers toonline subscription products(newsletter and alerts)
33,934+1%
(36,360)36,180 35,738
The currently available indicator is the ‘impact of media coverage’ that is slightly belowtarget, but not below the baseline 2016. This is due to the end of August negativecoverage related to glyphosate.
Table 5: Intermediate impact indicators for SO1
KPI BaselineTarget2017
Target P22017
ExecutedP2 2017
Status P2
Intermediary impact: Increased satisfaction of stakeholders regarding EFSA’s scientific outputs(for EC/MS risk managers and stakeholders) and the scientific assessment process andcommunication tools and material
Impact of media coverage(EFSA’s coverage in themedia, including thefavourability of articles)
18 20 20 18

EFSA Performance Report – P2, as of 31/8/2017
19
Widen EFSA’s evidence base and optimise access to its data2.
In the area of data collection and evidence management, the main achievementstowards widening the EFSA’s evidence base and increasing access to its data, were:
In a constant effort to increase satisfaction of stakeholders regarding EFSA’s evidencemanagement services and to foster innovative re-use of data, the EFSA informationgovernance framework has been agreed and a pilot was started in July 2017. Theinformation governance framework has been aligned with the overall EFSA governanceframework established the second quarter of 2017. The Information Management Deskwith representatives of all information areas (Info Stewards) was kicked off in July 2017.The project is now reviewing the Scientific Data Management Framework with thesupport of ISA (Interoperability Solutions for Public Administration) programme of theEuropean Commission. The project aims to finalise the Information Governance pilot andagree on Information Management KPIs by end of 2017.
In this context, and specifically aiming at increasing accessibility to EFSA scientific datathe project ‘developing a system for assigning digital object identifiers (dois)’, is ontrack, while all the ‘Scientific Data Warehouse’ (DWH) project deliverables have beendelivered. In the same area, the Open ScAIE project delivered on time the businessprocess for uploading and managing evidence in place, including assignment of digitalobject identifiers to evidence.
Aiming at widening EFSA’s evidence base to support risk assessment, completion of the‘Molecular typing’ project is delayed due to technical issues. Additional resources havebeen requested and put in place by the IT contractor. The project completion is foreseenin September. Especially in the area of bee health and the effort made to widen EFSA’sevidence base in this area, EFSA outlined in a report of the MUST-B working group therequirements for the collection of field data needed to support its risk assessment modelfor bees. This activity contributes to the development of a holistic approach to the riskassessment of multiple stressors in honeybees that is currently being developed usingpublished data and expert knowledge. The new report sets out the type of data that isrequired and how and where it should be collected. The work presented severalchallenges, in particular the need for accurate, validated methods that will ensure thatthe data collected in the field is of sufficient quality to feed the model. The MUST-Bworking group has selected study sites in four Member States representing the differentclimatic and environmental conditions found across Europe and three honeybeesubspecies on which the data should be collected.
An opportunity to further discuss issues related to availability, collection and dataanalysis was the scientific colloquium ‘Collecting and Sharing Data on Bee Health:Towards a European Bee Partnership’, held in Brussels in June. Beekeepers, scientists,policy-makers and other relevant parties are to set up a European bee partnership thatcould transform the way bee health is assessed in Europe. The pledge was the mainoutcome of a major scientific meeting where more than 120 delegates from scientificorganisations, EU bodies, researchers, beekeeper, farmers’ groups, and NGOs attended.
In the group of projects contributing to the continuous effort of EFSA to increase datainteroperability and migrate towards structured data, innovation and new methods inrisk assessment, the project ‘Introduction of a framework for Information AccessManagement’ aiming at the improvement of data interoperability is on track. The ‘ITService Bus’ was put in production in June 2017 and the 4 business cases piloted in 2015were transitioned in process mode. The project is now focusing on implementing newIdentity Management workflows by Dec 2017. FOODEX2 project on data standardisationis on track while in EU MENU risks delays on the reports approval due to quality issues.Finally the SSD2 and IPCHEM projects are closed successfully. The SSD2 pilot project

EFSA Performance Report – P2, as of 31/8/2017
20
has been finalised and results presented to Member States at the first joint meeting ofthe pesticide monitoring and chemical occurrence networks in May 2017. Member Statesagreed to implement the new standard using a phased approach until 2020. The addedvalue is that at least six European data collections will use one common standard fordata transmission to EFSA. On the other hand, IPCHEM was transitioned in process modeto the DATA Unit who established follow up actions for the continuous provision of datato JRC and fine tuning of metadata.
Finally, aiming at improving quality of data, a pilot project has been started with fiveMSs to define and measure data quality indicators. In addition, the pilot projectimplementing service management in the DATA unit ’Data collection services’ inresponse to an IAS audit recommendation is pending prioritisation on budgetarygrounds.
Further activities to support the food consumption data collection, and the assessment ofdietary exposure were performed.
State of play
Indicators available to monitor performance in this area are presented in table6-7 below. A summary status report for the key projects under strategic objective 2 ispresented in Annex III. Overall the progress exceeds expectations:
The production of scientific outputs and technical reports exceeded the target for thisreporting period in the area of evidence management with 10 outputs produced.
The number of publication of other EFSA outputs approved during this reporting period ison target. The timeliness is on target as well.
Table 6: Activity and output indicators for SO2ACTIVITY – OUTPUT INDICATORS
IndicatorTarget2017
TargetP2 2017
ExecutedP2 2017
StatusP2
% Target2017
Number of questions delivered for scientificoutputs and technical reports
10 7 9 111%
Number of questions delivered for ‘otherpublications’ (external reports, event reports)
15 12 13 108%
Proportion of scientific/technical questionsadopted within deadline
100% 100% 100% 100%
Number of operational data collectionsprepared and opened within deadline (total &open)
13 12 12 92%
Number of new data collections underimplementation
2 0 0 N/A N/A
Number of new data collections under design 2 0 0 N/A N/A
Number of enhancements to operational datacollections6 20 14 14 70%
Regarding the data accessibility index aiming at improving access to data, the target forthis reporting period is reached for the data collections planned to be published with nodata aggregation from EFSA. On the data collections and dashboards where EFSA
6This output indicator was indicated as “to be defined” in the SPD 2017-2019.

EFSA Performance Report – P2, as of 31/8/2017
21
performs aggregation, delivery of dashboards (12) is aligned with the P2 target (12). Byend of 2017 DATA plans to publish dashboards pertaining to the FAIM template (foodadditive intake model), chemical contaminant levels and VMPR (veterinary medicinalproducts residues). The overall performance for this indicator is on track with a total of15 dashboards expected to be published by the end of the year.
Table 7: Outcome indicators for SO2
KPI Indicator BaselineTarget2017
TargetP2 2017
ExecutedP2 2017
StatusP2
Outcome 1: Improved access to data
Dataaccessibilityindex
Number of publiclyaccessible datacollections publishedwith no dataaggregation fromEFSA
17 58 4 4
Number of datacollectiondashboards/aggregates published
119 1510 12 12
7 Compendium of botanicals.8 As in 2016, in addition data collections on: chemical contaminants (EFSA-owned), chemical contaminants(countries agreeing on data sharing), chemical hazards, zoonoses (level 3 tables – prevalence, food-borneoutbreaks, animal diseases, animal populations).9 Chemical contaminants (occurrence), pesticide residues, zoonoses outbreaks, animal populations, animaldiseases, prevalence, antimicrobial resistance, food consumption, botanicals, food composition, EFSA-ownedraw data dashboards.10 As in 2016, in addition: chemical contaminant levels, contaminant raw data, Food Additives Intake Model(FAIM) template, veterinary medicinal products.

EFSA Performance Report – P2, as of 31/8/2017
22
Build the EU’s scientific assessment capacity and knowledge3.community
In the area of cooperation and expertise management and capacity building, theachievements from the implementation of the EFSA work programme covered, scientificcooperation in Member States, fostering cooperation with EU agencies and EUCommission activities at international level and scientific capacity building activities.
European Cooperation & Networking
EFSA’s Executive Director visited Poland on 26-28 June 2017. During this visit theharmonization of the integrative molecular surveillance of foodborne pathogens in lightof the technological shift towards Next Generation Sequencing (NGS) was discussed as apossible joint activity. The newly appointed CEO of the Food Standards Agency (FSA)visited EFSA on 14th July, discussing possible implications of BREXIT for bothorganisations. EFSA and Italy signed an agreement to work on a joint project on ‘Theburden of Mycotoxins on animal and human health and Biomonitoring data as a tool forassessing Aflatoxin B1 exposure of workers (BIODAF)’.
Work has started to review the current Focal Point Agreements for 2019. A breakoutsession with FPs will be held during the 32nd Focal Point meeting on 13.09.2017, withparticipation of the ED and the Head of the COMMS Department.
The EU ANSA network has finalised its paper on Agencies’ research that will also bediscussed at the next Heads of Agencies Network meeting.
A save-the-date announcement has gone out for a one-day event in February 2018organised to support the development of the EU Risk Assessment Agenda by i) providinga platform for networking, in particular to facilitate partnering and identification ofproject funding and ii) raising awareness of the importance of public funding for foodsafety to stimulate future public funding for food safety.
Supporting the European cooperation activities and aiming at increasing networkingefficiency at European level, the project on the ‘innovative approach for Art 36networking and management of the list’ is facing moderate challenges in terms of budgetand risks, waiting for the solution that will be developed in a pilot within the newCustomer Relationship Management (CRM) environment in EFSA.
Global Cooperation
EFSA met with the FAO and WHO Secretariats to the Joint FAO/WHO Expert Committeeson Food Additives (JECFA), Pesticide Residues (JMPR) and Microbiological RiskAssessment (JEMRA) in May and June to take stock of the cooperation between theagencies in the provision of scientific advice in the field of chemical and microbiologicalrisk assessment. The participants agreed to strengthen the cooperation where possibleto ensure an adequate implementation of new guidance documents by regulatory riskassessment agencies across the world and the added value of a new international liaisongroup for the harmonisation of methods for risk assessment of chemicals in food iscurrently being considered.
On 20-22 June, EFSA hosted the 2nd Meeting of WHO’s Chemical Risk AssessmentNetwork in Parma. Network participants from 63 institutions and 39 countries cametogether for 3 days of networking, scientific sessions and planning. Participants andspeakers shared experiences, research needs and ongoing efforts in chemical riskassessment. Keynotes were given on risk communication (EFSA) and on predictivetoxicology approaches for regulatory risk assessment (JRC).

EFSA Performance Report – P2, as of 31/8/2017
23
National data reports from Albania, Bosnia and Herzegovina, FYROM, Montenegro andSerbia on zoonoses, antimicrobial resistance and foodborne outbreaks have beenfinalised and sent to EFSA’s DataWarehouse (DWH). EFSA Capacity building events inrisk assessment and risk communication area were organised on Evidence base for riskassessment in Sarajevo, Bosnia and Herzegovina with 25 participants from the pre-accession countries on 21-22 June and Risk communication, with 25 participants fromthe pre-accession countries in Skopje held on 11-12 July.
A special edition of the European Neighbourhood (ENP) Food Safety Almanac has beenfinalised and under publication. This is a joint initiative between EFSA, the GermanFederal Institute for Risk Assessment (BfR) and the ENP countries institutions.
Scientific Capacity Building
Expertise Management Programme (EMP): Towards increasing efficiency atEuropean and international level by building and sharing of risk assessment capacity andknowledge community, the activities of the Expertise Management Programme are ontrack. Through EMP, EFSA is pursuing its efforts to develop a comprehensivecompetency-based approach to talent attraction, career management and talentretention for staff and experts and ultimately attract the best available expertise. DuringP2, an important milestone was accomplished꞉ the call for the Scientific Experts Panel and Scientific Committee was published as planned the 1st June using a new recruitmente-solution and the newly established comprehensive library of scientific competencescomplying with the European Commission methodology. Notably, the call was supportedby a dedicated campaign using multitenant channels and focusing on specificcompetences required to deliver EFSA Strategy 2020. However due to a rather lowparticipation rate recorded at the end of August, the SPD target of 1725 applicants wasnot achieved. All preparatory steps for the selection procedure including the evaluationguide have been finalised. To complement the library of scientific competences, acomprehensive catalogue of non-scientific competencies will be available by year end toenable strategic workforce planning for experts and staff. In preparation of next year’sactivities the Programme is developing the business case for an EFSA Academy with theobjective to evaluate the efficiency gains that will be brought by the design, structureand organisation of a centralized Academy as a hub aiming at knowledge acquisition andexchange in risk assessment, among EFSA staff & experts and with the European riskassessment & risk communication community.
EU- FORA Fellowship programme: Aiming at strengthening capacity building andsharing among EU and international partners, the projects ‘European Food RiskAssessment Fellowship (EU-FORA) Programme’ and ’EFSA pre-accession programme’ areon track. On 6-7 June 2017 the first EU-FORA summer workshop took place at EFSA withthe participation of the programme committee members, the Hosting Sites supervisorsand representatives of the training consortium, to discuss and fine-tune different aspectsof the programme and to provide guidance to the hosting sites so to be prepared forwelcoming the first cohort. Preparatory work during summer allows for the initiation of a3-week Induction Training in September 2017 involving the 15 fellows and 15 otherparticipants selected for induction training only.
In cooperation with the University of Parma and the University of Milan a summer schoolwith the title ‘In Silico Methods for Food Safety’ was organised in June. 110 participantsattended, mostly PhD students, but also experts and staff of competent authorities from20 countries such as from Georgia, Egypt and Palestine11.
On June 30, EFSA welcomed postgraduate students from the Tulane University of NewOrleans for an info-session on pesticides and their assessment process. On July 12, in
11This designation shall not be construed as recognition of a State of Palestine and is without prejudice to the
individual position of the Member States on this issue
EFSA Performance Report – P2, as of 31/8/2017
24
cooperation with the Catholic University of Milan the Authority welcomed internationalpostgraduate students for an info-session on the role and activities of EFSA.
Furthermore, EFSA hosted guest scientists from China, Hungary, Taiwan, Norway andIreland.
In the same context, aiming at strengthening risk assessment capacity by usinginnovative ways, the ‘crowdsourcing’ project is on track.
State of play
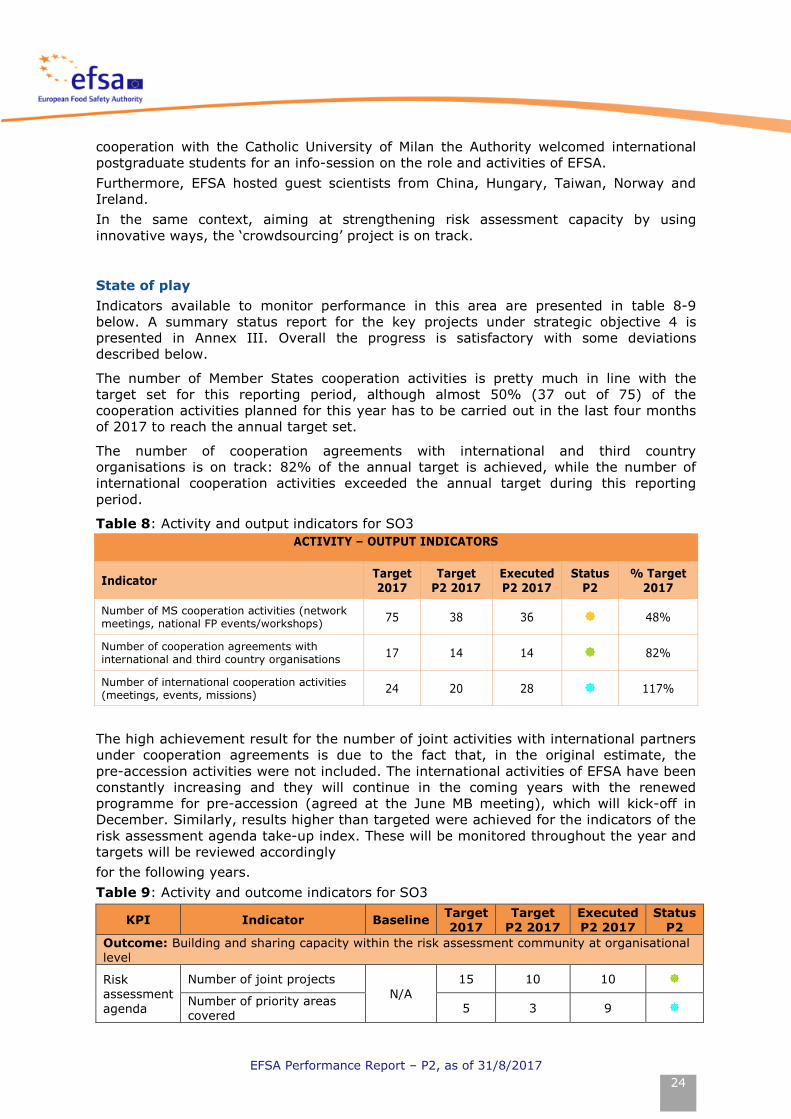
Indicators available to monitor performance in this area are presented in table 8-9below. A summary status report for the key projects under strategic objective 4 ispresented in Annex III. Overall the progress is satisfactory with some deviationsdescribed below.
The number of Member States cooperation activities is pretty much in line with thetarget set for this reporting period, although almost 50% (37 out of 75) of thecooperation activities planned for this year has to be carried out in the last four monthsof 2017 to reach the annual target set.
The number of cooperation agreements with international and third countryorganisations is on track: 82% of the annual target is achieved, while the number ofinternational cooperation activities exceeded the annual target during this reportingperiod.
Table 8: Activity and output indicators for SO3
ACTIVITY – OUTPUT INDICATORS
IndicatorTarget2017
TargetP2 2017
ExecutedP2 2017
StatusP2
% Target2017
Number of MS cooperation activities (networkmeetings, national FP events/workshops)
75 38 36 48%
Number of cooperation agreements withinternational and third country organisations
17 14 14 82%
Number of international cooperation activities(meetings, events, missions)
24 20 28 117%
The high achievement result for the number of joint activities with international partnersunder cooperation agreements is due to the fact that, in the original estimate, thepre-accession activities were not included. The international activities of EFSA have beenconstantly increasing and they will continue in the coming years with the renewedprogramme for pre-accession (agreed at the June MB meeting), which will kick-off inDecember. Similarly, results higher than targeted were achieved for the indicators of therisk assessment agenda take-up index. These will be monitored throughout the year andtargets will be reviewed accordingly
for the following years.
Table 9: Activity and outcome indicators for SO3
KPI Indicator BaselineTarget2017
TargetP2 2017
ExecutedP2 2017
StatusP2
Outcome: Building and sharing capacity within the risk assessment community at organisationallevel
Riskassessmentagenda
Number of joint projectsN/A
15 10 10
Number of priority areascovered
5 3 9

EFSA Performance Report – P2, as of 31/8/2017
25
KPI Indicator BaselineTarget2017
TargetP2 2017
ExecutedP2 2017
StatusP2
Outcome: Building and sharing capacity within the risk assessment community at organisationallevel
take-upindex
Number of partners(Member States) in jointprojects
8 4 16
Number of partners (otherthan Member States) injoint projects
12 6 7
Number of projects notfunded primarily by EFSA 12 0 N/A N/A N/A
Number of joint activities (staff exchange,joint projects/workshops) withinternational partners under cooperationagreements
5 8 18 23
12This sub indicator is included although no target is set for this year because it is part of the risk assessment agenda take up
index.

EFSA Performance Report – P2, as of 31/8/2017
26
Prepare for future risk assessment challenges4.
In the area of preparedness and methodological development, the main achievementsfrom the implementation of the EFSA work programme during the second reportingperiod of 2017 were as described below.
Preparedness and response
Aiming at fostering use of new approaches and enhancing the ability to anticipate andrespond to risks, EFSA embarked on self-task initiatives, in collaboration with keypartners and stakeholders. In this context the ‘Wildlife’ project, which targets thecreation of a web-based data repository on the geographic distribution and abundance ofselected wildlife populations and the pathogens the transmit to animals, is on track forthis reporting period, while the ‘Vectornet’ project on supporting the collection of data onvectors and pathogens in vectors related to both animal and human health carried out incollaboration with ECDC is finalised. Tracing methodology activities and the developmentof risk assessment tools for the safety of global food and feed supply chains (FPA withBfR) are on track while for the guidance development on Hazard assessment ofEndocrine Disruptors an extension of the deadline is requested.
Methodological advice
Hepatitis E: raw pork is main cause of infection in EU: Consumption of raw orundercooked pork meat and liver is the most common cause of hepatitis E infection inthe EU. The EFSA’s working group on hepatitis E underlined that hepatitis E is a growingconcern in the EU, even if it is not as widespread as other foodborne diseases. Expertsfrom EFSA’s Panel on Biological Hazards recommend that Member States increaseawareness of public health risks associated with raw and undercooked pork meat andadvise consumers to cook pork meat thoroughly. They also recommend the developmentof suitable methods for detecting hepatitis E in food.
Latest science further protects infants: EFSA’s Scientific Committee has developedguidance that provides an approach for carrying out risk assessment of substances infood (intentionally added or not) for infants below 16 weeks. EFSA scientists developedthe approach following a state-of-the-art assessment of infant development before andafter birth. Relevant feedback from a public consultation was taken into consideration bythe Scientific Committee in finalising the Guidance and is included in an accompanyingreport. Developing this guidance document will clarify the way EFSA performs its riskassessment, ensure a common understanding of the methodology used and in the endfacilitate the acceptance of EFSA Scientific Panels’ outputs.
Assessing allergenicity of GM plants supplementary guidance: EFSA has publishedsupplementary guidance on allergenicity to further strengthen risk assessment ofgenetically modified (GM) plants. The document considers new scientific and regulatorydevelopments, complementing recommendations in existing guidance and regulations.This guidance document was developed with the collaboration of a focus group thatcontributed to foster engagement with MS and stakeholders, in line with strategicobjective 1. Furthermore, this guidance will support EFSA in providing fit-for-purposeand timely advice to risk managers in the GMO areas.
Pesticides: new default values proposed for dermal absorption: EFSA haspublished new guidance on dermal absorption of plant protection products (PPPs). Theguidance proposes default values to be used in the absence of experimental data for therisk assessment of active substances used in PPPs. The document, which updates theguidance published by EFSA in 2012, was drafted in the light of newly available humanin vitro studies. EFSA also recommends that the OECD’s dermal absorption guidance and

EFSA Performance Report – P2, as of 31/8/2017
27
test guideline documents be revised. This would support a more harmonised approach tothe evaluation of dermal absorption of chemicals, better reflect the extensive experiencegained in the use of in vitro methods, and increase global acceptance of this method asan alternative to animal testing.
Pesticides: new default values proposed for dermal absorption: EFSA haspublished new guidance on dermal absorption of plant protection products (PPPs). Theguidance proposes default values to be used in the absence of experimental data for therisk assessment of active substances used in PPPs. The document, which updates theguidance published by EFSA in 2012, was drafted in the light of newly available humanin vitro studies. EFSA also recommends that the OECD’s dermal absorption guidance andtest guideline documents be revised. This would support a more harmonised approach tothe evaluation of dermal absorption of chemicals, better reflect the extensive experiencegained in the use of in vitro methods, and increase global acceptance of this method asan alternative to animal testing.
Guidance for predicting environmental concentrations of active substances insoil: The EFSA Guidance document for predicting environmental concentrations of activesubstances of plant protection products and transformation products of these activesubstances in soil was adopted in August. This document provides guidance for theexposure assessment of soil organisms to plant protection products (PPPs) and theirtransformation products in accordance with Regulation (EC) No. 1107/2009 of theEuropean Parliament and the Council and replaces the earlier version, published in 2015.To facilitate efficient use of the tiered approach in regulatory practice, user-friendlysoftware tools have been developed.
Methodology development
Two new guidance documents – on the weight-of-evidence approach andbiological relevance assessment: EFSA’s Scientific Committee has developed threekey methodological frameworks to improve the robustness, quality and transparency ofthe scientific assessments done by EFSA’s 10 sectoral scientific Panels: i) weight ofevidence; ii) biological relevance; and iii) uncertainty. The first two pillars of thisharmonised approach are published. Guidance on uncertainty has been trialled internallyat EFSA over the past year. Based on the experience, it will be fine-tuned and finalised inlate 2017/early 2018 to complete the series. EFSA will gradually integrate these into thedaily workings of all of its scientific Panels and other scientific groups. However, thethree approaches are interdependent and overlap. Therefore, EFSA will intensify thisprocess once the guidance on uncertainty is complete and following the renewal ofEFSA’s Scientific Committee and 10 scientific Panels in July 2018. Developing theseguidance documents will clarify the way EFSA performs its risk assessment, ensure acommon understanding of the methodology used in the EFSA Scientific Panels’ outputs.
Aiming at the harmonisation of risk assessment methodologies, Prometheus and Expertknowledge elicitation (EKE) projects are on track and the Pilot Projects within theframework of coordinated environmental risk assessment with MSs on 4 areas(pesticides soil, pesticides aquatic, plant health, multi-stressors) are planned to start infall.
Finally, aiming at strengthening EFSA’s capacity to deal with matters in the absence ofdata, while widening EFSA’s evidence base on chemical hazards in food and feed, EFSArecently launched its OpenFoodTox database of chemical hazards in food and feed, anew tool to potentially reduce the need for animal testing. The database is a rich sourceof toxicological information for risk assessment that can potentially support the reductionof animal testing. Scientists at the Institute for Pharmacological Research in Milanrecently completed an EFSA-funded project aimed at developing alternativecomputer-based (“in silico”) modelling tools based on data in OpenFoodTox. A reportexplains how these tools can help risk assessors to prioritise toxicological testing

EFSA Performance Report – P2, as of 31/8/2017
28
strategies and to carry out risk assessments for emerging contaminants when data areabsent.
Aiming at making EFSA an international reference in the area of development ofscientific assessment tools and methodologies, the ongoing projects, such as thedevelopment of risk assessment tools for the safety of global food and feed supplychains (Framework Partnership Agreement with BfR) are on track, with some delay thatis expected in Knowledge Junction in implementation of web services.
State of play
Indicators available to monitor performance in this area are presented in table 10 below.A summary status report for the key projects under strategic objective 4 is presented inAnnex III. Overall the progress exceeds expectations.
The production of scientific outputs and technical reports exceeded the reporting periodtarget, with 11 scientific outputs and 14 technical reports published, reaching the 63% ofthe annual target.
The annual target was exceeded also on the publication of other EFSA outputs(15 external report and 1 event report published, exceeding the target of 12 in total forthis reporting period) recording 89% of the annual target. Timeliness remains on target.
Table 10: Activity and output indicators for SO4
ACTIVITY – OUTPUT INDICATORS
IndicatorTarget2017
TargetP2 2017
ExecutedP2 2017
StatusP2
% Target2017
Number of questions delivered for scientificoutputs and technical reports
40 17 25 63%
Number of questions delivered for ‘otherpublications’ (external reports, event reports)
1813 12 16 89%
Proportion of scientific/technical questionsadopted within deadline
100% 100% 96% 96%
13(14 external/4 event reports)
EFSA Performance Report – P2, as of 31/8/2017
29
Create an environment and culture that reflects EFSA’s values5.
In the area of EFSA’s horizontal, governance, coordination, and support services, themain achievements from the implementation of the EFSA work programme during thefirst second reporting period of 2017 were the following.
BuS evolution
In the context of the evolution of Business Services Department several units wererestructured during the first reporting period (P1), the former Planning Technology &Transformation Unit (PTT) was split into “Digital Transformation Services” to drivedigitalisation of information, products and processes and into “Global PerformanceServices” to monitor the execution of EFSA 2020 Strategy and to reinforce businessintelligence, analytical capability, results-based management and budgeting while theprevious Legal & Regulatory Affairs Unit expanded its activities towards AssuranceServices). The undergoing evolution of Human Capital (HuCap) Services is expected tomake human resources at EFSA more efficient and effective developing new capabilities(competences and performance management, strategic workforce planning, talentdevelopment, organisational efficiency), leaning processes and delivering expert servicesto the core business via a partnering approach.
Aiming at establishing an operational framework that puts in practise EFSA’s values,ensures delivery of strategic objectives 1-4 and enforces sound operational performanceby optimizing available resources, the projects planned in the work plan 2017 are ontrack for this reporting period. Per services area the following developments happened:
“Strategy and Policy” services
Results-orientation ensuring sound operational performance and optimisingavailable resources are key priorities in 2017.• The new reporting framework aligned to the SPD, which was piloted with the first
2017 Performance Report and discussed at the 73rd Management Board meeting, isfostering internally a results-based approach enabling to track on a regular basis theprogress made against the five Strategic Objectives of EFSA 2020.
• A key milestone during P2 was the endorsement by the Heads of the EU AgenciesNetwork (EUAN) of that approach, acknowledged as providing a capability to allocatebudget and resources based on expected workload and results, moving away froman input-based approach. To enable further progress in the matter, EFSA is leadingthe development of a maturity model on results-based management and will bepiloting the new EC results-based budgeting approach next year, in the context ofthe preparations for the new Multiannual Financial Framework.
Talent attraction, management, and streamlining of recruitment processes isanother important dimension to sustain EFSA’s operating model:
• To enable strategic workforce planning for experts and staff, specific efforts weredeployed through the Expertise Management Programme (EMP), especially tocomplement the library of scientific competences delivered in P1, with acomprehensive catalogue of non-scientific technical competencies that will beavailable by year-end.
• As part of ensuring sound management of the establishment plan, 6 TAs posts (overthe 7 planned for 2017) have been suppressed. During the 73rd Management Boardmeeting EFSA clarified a potential shortfall in EFSA’s budget for salaries. Using aresult-based approach, it was agreed to partially cover the shortfall via a transfer offunds from its operations budget lines (Title III) to the staff expenditures lines

EFSA Performance Report – P2, as of 31/8/2017
30
(Title I). The shortfall in Title I forces EFSA to cap the Establishment Plan occupancyrate to a maximum of 98% allowing therefore to recruit only one quarter of theplanned positions for the remaining of 2017. The impact of the increasing share ofTitle I over the total budget has consequences on EFSA’s capacities to operate in thefuture. To address these challenges, EFSA is investing in enhanced budgetforecasting and analysis, and focusing on exploring additional scenarios for funding.
• The timeliness of recruitment procedures is nevertheless ensured so far with anoccupancy rate of 97.3% (vs. 95.5) at the end of August. To promote EFSA’sbranding and efficiency of recruitment procedures, vacancies are disseminated widelyenabling to register 37,640 subscribers for EFSA jobs and 25.778 followers onLinkedIn as of August 2017. A new Traineeship call has also been launched andconcluded for which the first intake is in the pipeline.
• In terms of Talent Development, EFSA has aligned its Learning & DevelopmentStrategy to EFSA 2020 objectives and continued investing in Learning with 110internal trainings organised at end of August vs 62 recorded last year. In itscontinuous effort to address staff development, engagement and retention, a “LeadExpert” path has been established as part of the efforts in developing acomprehensive set of career prospects for scientists. The main features of that rolewhich could be linked to the development of communities of knowledge will befurther elaborated in alignment with the Strategic Competencies Analysis (SCA)outcomes under the Expertise Management Programme.
In terms of policy development:
• As part of the review of the 2011 Independence Policy, a public consultation waslaunched in the first reporting period, which received more than 300 comments from209 interested parties (NGOs, industry, researchers, national competentAuthorities). On 21st June 2017, EFSA’s Management Board adopted a new Policy onIndependence. The new Policy strikes a new balance between ensuring theimpartiality of the professionals involved in EFSA’s work and the need to attractexperts. It does so inter alia by addressing the requests of the European Parliamentto include a comprehensive set of “cooling off” periods, by reinforcing thetransparency measures linked to independence related operations and by confirmingkey aspects of the system in place, such as a multi-layered scrutiny of declarationsof interest submitted by relevant individuals.
• For the reform of Independence policy, EFSA launched the third round on internalconsultation with the Project steering committee and Committee on Conflict ofInterest as well as with the concerned Units on the draft Decision on competinginterest management.
• In the context of the ‘Centralisation of declaration of interests screening’, theExecutive Director signed off the subsequent Working Instructions (WINs). The WINsprovide further operational details to perform the DoI screening and the biannualcompliance and veracity checks on a random sample of DoI screening processes,thereby attaining a new level of consistency in the joint and cooperative effortbetween the Science Departments and units and LA Unit required by theseprocesses. Within the centralised interest management project EFSA invested inguidance and dedicated trainings for staff and experts to ensure coherent applicationof the rules.
“Corporate Management Oversight” services
Improving organisational performance and compliance to ensure an efficient andeffective delivery of strategic objectives 1 to 4 is for EFSA a priority:• With the overall ambition of strengthening Governance and Accountability, the EFSA
Decision-Making Framework (DMF) has been finalised and adopted, while theoverarching Accountability Framework will be elaborated in a second phase (2018).The DMF includes a RAPID matrix which guides and clarifies the decision-making

EFSA Performance Report – P2, as of 31/8/2017
31
capabilities of the defined governance structures mapped against the EFSA ProcessArchitecture framework. A dedicated communication plan was developed and rolledout (phase I) to ensure awareness in EFSA and in alignment with the centralised MTMsecretariat function at the BuS Office. Within this context EFSA has initiated theexercise of reframing the Governance process in the production of its scientificoutputs and is also developing a paper on Quality of Science.
• The deliverables of the Correspondence Management project are postponed to thefourth quarter of 2017 and 2018 as the DMO activities are reallocated and there areinterdependencies with the document management process improvement initiatives.
• Further development of a world-class environment is strengthened as EFSA hostedthe European EMAS (Eco-Management Audit Scheme) award ceremony in partnershipwith ISPRA in May and the Health & Safety mandatory training for all staff is ongoing.
• Finally, EFSA supported other EC Agencies (Greening Networking Group) sharing bestpractices. Full appreciation was expressed by the Agencies and congratulations bythe EC representatives on the results achieved vs quality & timing. The OHSAScertification is on track with the final external audit already set for the fourth quarter2017 and the Health & Safety mandatory training for all staff ongoing.
• Enhanced corporate services are being deployed as planned following the completionof the staff missions’ centralisation end of June and the development of a new travelmodel for EFSA experts to be concluded by end of 2017. The project on missioncentralisation and travel logistics outsourcing is on track with the travel managementforeseen to be outsourcing awarded in the fourth quarter 2017 together with thefinalisation of the relevant operating procedures and working instructions for staff.
• The Businesses data warehouse (B.I.K.E. project) with a workshop organisedinternally in June to prepare for the chartering of the project towards developing thebusiness intelligence capability.
• Planned activities aiming at streamlining and improving the assurance functions arein progress. In particular, support is provided to the finalisation of the externalevaluation project, to prepare EFSA to complete successfully the coming externalevaluation. Further analysis is provided in section III Assurance of this report.
Institutional relations
• Several activities in the context of EFSA’s relation with the European Parliament, thecouncil, DG SANTE and the other EU Agencies were organised during this reportingperiod. To mention, the ED Annual hearing at ENVI Committee, ED meetings withMEP’s, and participation of the ED to the BUDG Committee in his capacity of EUANChair.
• EFSA’s Head of Legal Affairs participated in an in camera exchange of views withENVI Coordinators with the Court of Auditors on independence and conflicts ofinterest.
• Finally, in cooperation with the German Federal Institute for Risk Assessment (BfR),EFSA organised in the context of the European Forum Alpbach 2017 a break outsession called “Science-based policy-making in times of post-truth?”
EFSA is chairing in 2017 the Network of Agencies
In 2017, the network focuses more specifically on initiatives to share services amongagencies and promote the value added by the agencies to European citizens. Keyactivities and achievements in the reporting period were:
• Networks meetings successfully organised and held:- The plenary meetings of the Heads of Resources and of the Heads of EU Agencies
were held on 5-7 July at EFSA’s premises to discuss common strategic initiativesand reviewing the progress made on the actions laid out in the Network’s WorkProgramme. The meetings were also attended by representatives from theEuropean Commission, Parliament, Court of Auditors.
EFSA Performance Report – P2, as of 31/8/2017
32
- Heads of Agencies discussed current and future challenges faced by the Union(including the possible impact of Brexit) and how the EU Agency model could bereshaped to address these.
- In an intensive half-day workshop, participants from both the Heads of Agenciesand Heads of Resources also explored the possibility of sharing capabilities inhuman resource management to foster synergies and leverage on the potential of6000 staff members all across Europe.
• Highlights:- Expanded cooperation on procurement matters: a new sub-network was
established under the leadership of EFSA. The network of EU AgenciesProcurement Officers (NAPO) will allow for a coordinated approach amongstAgencies, incentivising joint procurements where feasible and giving room forexperience sharing and improvements. NAPO’s objective is to generateefficiencies and economies of scale. This potential has been already assessed with4 joint calls generating an estimated benefits of 6.2 M€ (4.7 M€ represents staffsavings for running the procurement procedures and managing the contracts and1.5 M€ savings due to economy of scale and increased bargaining power).
- Following European Parliament statement that “Union regulatory Agencies incharge of the risk assessment of regulated products, in particular the EuropeanFood Safety Authority, the European Chemicals Agency or the European MedicinesAgency do not have the financial and legal resources to fulfil their missionproperly”, a Working Group on ways of financing for the Agencies wasestablished. Under EFSA’s leadership, the above-mentioned Agencies aredeveloping a reflection on possible additional revenues.
- The Network, through a dedicated working group chaired by EFSA is alsocoordinating agencies’ input on the revision of the Framework FinancialRegulation (FFR). The delays observed in the Commission planning regarding therevision of the General Financial Regulation (GFR) will trigger delays in therevision of the FFR which is likely to be adopted end of 2018.
State of play
Indicators available to monitor performance in this area are presented in table 11-13below. A summary status report for the key projects under strategic objective 5 ispresented in Annex III.
Overall the progress exceeds expectations with some deviations described below: Whilethe compliance to independence policy indicator on aDOIs is on track, a deviation fromthe target is observed for the sDOIs (99.6%). This is due to two cases of experts fromFEED Panel that had their sDOIs approved during a working group and two experts in aWG of ALPHA Unit not having a sDOI requested and approved for one additional questionnumber before a teleconference.
Regarding the financial performance this is slightly below target but higher than lastyear’s execution. Further analysis is provided in section 2 of this report.
A world-class IT to enable the achievement of EFSA's strategic objectives is ascertainedaccording to metrics on service delivery 89% above target & end user satisfaction of92% which increased in P2 and exceeded target of 90%. Additionally, service owners’satisfaction 62% has increased in P2 above target. The transformation performanceindex has reached the target, improving from the previous reporting period.

EFSA Performance Report – P2, as of 31/8/2017
33
Table 11: Activity and output indicators for SO5
ACTIVITY – OUTPUT INDICATORS
IndicatorTarget2017
TargetP2 2017
ExecutedP2 2017
StatusP2
% Target2017
Proportion of experts withapproved annual DOI (aDOI)before first meeting invitation
100% 100% 100% 100%
Proportion of experts withapproved specific DOIs (sDOI)before participation in an EFSAmeeting
100% 100% 99.6% 99.6%
Proportion of original budgetcommitted/paid at year end –differentiated
100%56%
55%
51% (C)
51% (P)
51% (C14)
51% (P)
Proportion of original budgetcommitted/paid at year end –non-differentiated
100% /90%
79%61%
78% (C)
60% (P)
78% (C)
67% (P)
Proportion of original sciencegrants and procurement budgetcommitted/paid at year end
100%61%61%
55% (C)
56% (P)
55% (C)
56% (P)
Carry-forward of payments tofollowing year
10% NA NA NA NA
Service delivery index15 77% 77% 89% 115.6%
Transformation performanceindex (development projectexecution index)16
78% 78% 75% 96.2%
Measuring results in the area of people management the ‘Management and leadershipindex’ is on track with average Occupancy rate for the reporting period January – August2017 at 98%.
The compliance index is overall within the annual target while the respective financialimpact of the non-compliance is far below the limit.
Regarding the enabling work environment, and the use of innovative collaborationmethods supported by world class IT tools the proportion of tele-meetings over totalmeetings improved since the previous report, reaching the annual target of 20%.However, taking into account the overall plan until December 2017, the forecast is thatthis figure will drop to 17.8%, thus the number of tele-meetings must increase in thenext four months to reach the target. To be mentioned that the target on the proportionof tele-meetings has been raised with respect to the previous year from 15 to 20%.
14C: committed, P: Paid
15IT services are measured in this index (perfect services: % of services which consistently achieve or
overachieve their targeted SLAs).16
Based on selected projects.
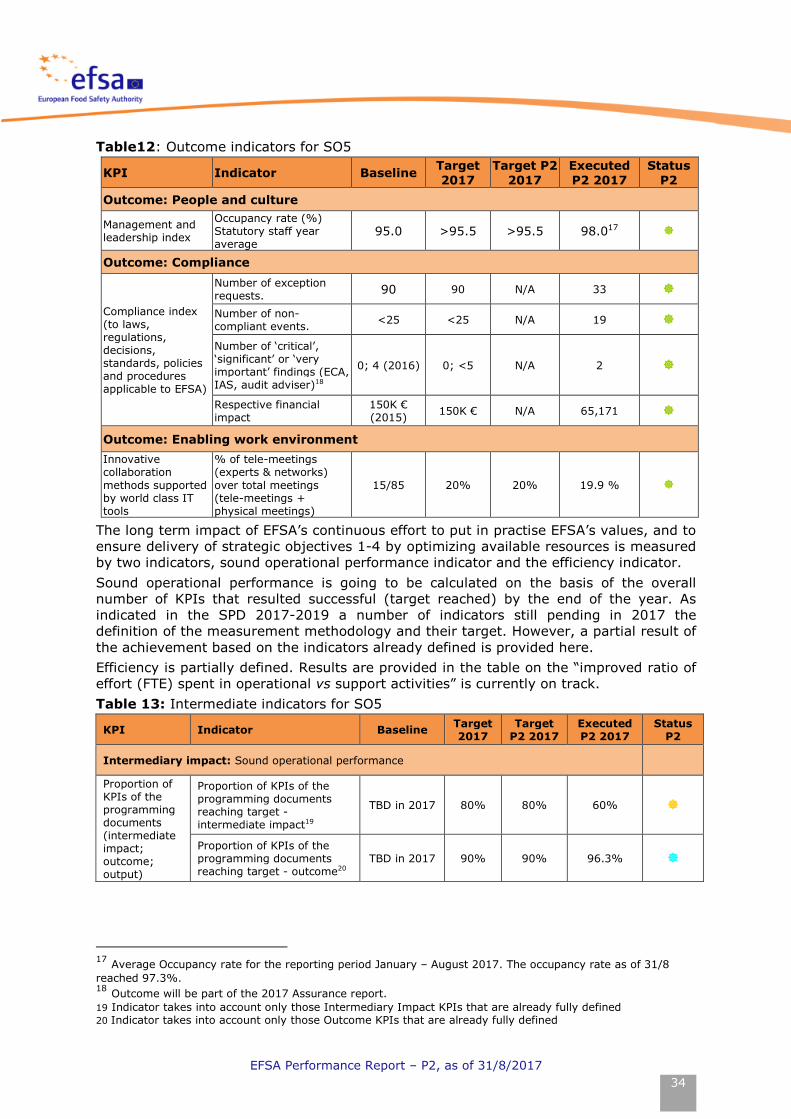
EFSA Performance Report – P2, as of 31/8/2017
34
Table12: Outcome indicators for SO5
KPI Indicator BaselineTarget2017
Target P22017
ExecutedP2 2017
StatusP2
Outcome: People and culture
Management andleadership index
Occupancy rate (%)Statutory staff yearaverage
95.0 >95.5 >95.5 98.017
Outcome: Compliance
Compliance index(to laws,regulations,decisions,standards, policiesand proceduresapplicable to EFSA)
Number of exceptionrequests.
90 90 N/A 33
Number of non-compliant events.
<25 <25 N/A 19
Number of ‘critical’,‘significant’ or ‘veryimportant’ findings (ECA,IAS, audit adviser)18
0; 4 (2016) 0; <5 N/A 2
Respective financialimpact
150K €(2015)
150K € N/A 65,171
Outcome: Enabling work environment
Innovativecollaborationmethods supportedby world class ITtools
% of tele-meetings(experts & networks)over total meetings(tele-meetings +physical meetings)
15/85 20% 20% 19.9 %
The long term impact of EFSA’s continuous effort to put in practise EFSA’s values, and toensure delivery of strategic objectives 1-4 by optimizing available resources is measuredby two indicators, sound operational performance indicator and the efficiency indicator.
Sound operational performance is going to be calculated on the basis of the overallnumber of KPIs that resulted successful (target reached) by the end of the year. Asindicated in the SPD 2017-2019 a number of indicators still pending in 2017 thedefinition of the measurement methodology and their target. However, a partial result ofthe achievement based on the indicators already defined is provided here.
Efficiency is partially defined. Results are provided in the table on the “improved ratio ofeffort (FTE) spent in operational vs support activities” is currently on track.
Table 13: Intermediate indicators for SO5
KPI Indicator BaselineTarget2017
TargetP2 2017
ExecutedP2 2017
StatusP2
Intermediary impact: Sound operational performance
Proportion ofKPIs of theprogrammingdocuments(intermediateimpact;outcome;output)
Proportion of KPIs of theprogramming documentsreaching target -intermediate impact19
TBD in 2017 80% 80% 60%
Proportion of KPIs of theprogramming documentsreaching target - outcome20
TBD in 2017 90% 90% 96.3%
17Average Occupancy rate for the reporting period January – August 2017. The occupancy rate as of 31/8
reached 97.3%.18
Outcome will be part of the 2017 Assurance report.
19 Indicator takes into account only those Intermediary Impact KPIs that are already fully defined20 Indicator takes into account only those Outcome KPIs that are already fully defined

EFSA Performance Report – P2, as of 31/8/2017
35
KPI Indicator BaselineTarget2017
TargetP2 2017
ExecutedP2 2017
StatusP2
Intermediary impact: Sound operational performance
reachingtarget
Proportion of KPIs of theprogramming documentsreaching target - output21
TBD in 2017 100% 100% 88.2%
Cleandischargeachieved
Accounts are closed22 Yes Yes Yes Yes
Discharge is granted23 Yes Yes Yes Yes
Observations are followedup within the prescribeddeadlines24
100% 100% N/A 100%
Intermediary impact: Efficiency
Improved ratio of effort (FTE) spent inoperational vs support activities
2016 actual:73.5:26.5
>75:25 >75:25 72:28
21 Indicator takes into account only those Output KPIs that are already fully defined22 Touch and go. On-track banking services23 Achievement relative to 2015 data24 Successful exercise - very positive outcome from the parliament

Section II. Management of
resources
Budget and financial management1.
Financial resources
As of August 31st the global commitment execution is at 75% (2% below themonthly plan and in line with the previous year). The global payment executionstands at 60% of the total budget (3% below the monthly plan and 5% above theprevious year). The main payment delays are in the area of scientific cooperation(EUR 0.57 million), in the area of operational support (EUR 0.60 million) and in thearea of communication (EUR 0.22 million). The forecast still stands to reach thetarget at year end for both commitments and payments.
Title I, commitment execution of EUR 32.29 million covers mainly staff salaries andallowances (EUR 28.31 million), European school (EUR 1.23 million), interim services(EUR 0.82 million), training (EUR 0.41 million) and visiting experts (EUR 0.40million).
Title II, out of EUR 8.60 million, EUR 3.94 million were committed for buildingrelated expenditures and EUR 3.15 million for IT.
Title III, out of EUR 19.56 million, EUR 6.99 million were committed for ScientificMeetings, EUR 6.75 million in horizontal operational support (out of which IT costsEUR 2.98 million) and EUR 5.18 million for the Scientific Cooperation Programme.
EUR 47.36 million payment execution is mainly linked to staff salaries andallowances (EUR 25.31 million) and European School (EUR 1.23 million) in Title I,building costs (EUR 2.40 million) and IT costs (EUR 2.20 million) in Title II andScientific Cooperation (EUR 6.03 million), meetings (EUR 5.04 million) and horizontaloperational support (EUR 3.16 million) in Title III.
TitleCommitmentsAugust 2017
CommitmentsAugust 2016
IncreasePayments
August2017
PaymentsAugust2016
Increase
Personnel 32,287,184 30,436,389 1.1% 28,155,053 26,402,114 1.3%
Infrastructure 7,270,122 7,686,241 7.0% 4,687,579 4,472,411 9.4%
Operations 19,559,206 21,002,193 -3.3% 14,474,584 14,154,057 -0.1%
Total: 59,116,512 59,124,823 0.2% 47,317,216 45,028,581 2.0%
Compared to the same period last year:
Title I - for both commitments and payments - the growth is caused mainly by theincrease in salaries and allowances expenditure, mainly due to an higher thanplanned occupancy rate, as well as higher commitments for internships, HRconsultancy, missions and shuttles cost.
Title II, commitment execution absolute value is lower than last year due to thelower initial appropriation under this title, while the execution rate within the Titlehas increased by 7.0% compared to last year. The payment execution rate withinthe Title shows a 9.4% relative increase compared to August 2016.
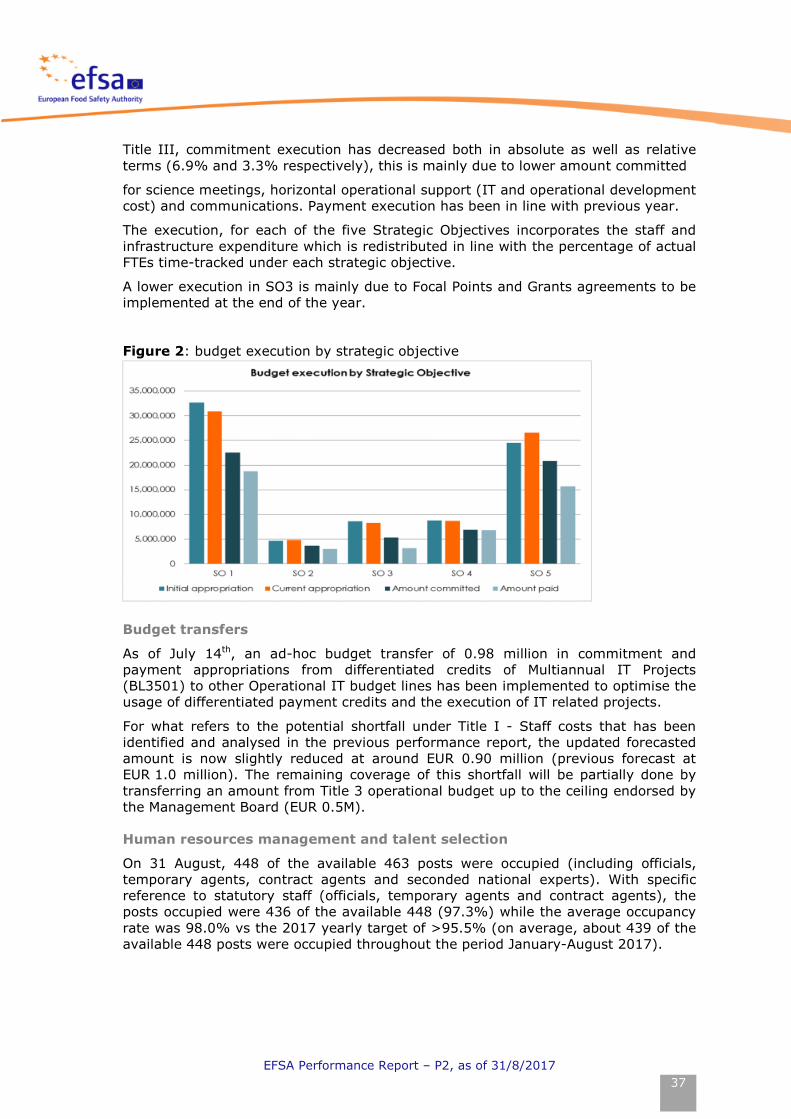
EFSA Performance Report – P2, as of 31/8/2017
37
Title III, commitment execution has decreased both in absolute as well as relativeterms (6.9% and 3.3% respectively), this is mainly due to lower amount committed
for science meetings, horizontal operational support (IT and operational developmentcost) and communications. Payment execution has been in line with previous year.
The execution, for each of the five Strategic Objectives incorporates the staff andinfrastructure expenditure which is redistributed in line with the percentage of actualFTEs time-tracked under each strategic objective.
A lower execution in SO3 is mainly due to Focal Points and Grants agreements to beimplemented at the end of the year.
Figure 2: budget execution by strategic objective
Budget transfers
As of July 14th, an ad-hoc budget transfer of 0.98 million in commitment andpayment appropriations from differentiated credits of Multiannual IT Projects(BL3501) to other Operational IT budget lines has been implemented to optimise theusage of differentiated payment credits and the execution of IT related projects.
For what refers to the potential shortfall under Title I - Staff costs that has beenidentified and analysed in the previous performance report, the updated forecastedamount is now slightly reduced at around EUR 0.90 million (previous forecast atEUR 1.0 million). The remaining coverage of this shortfall will be partially done bytransferring an amount from Title 3 operational budget up to the ceiling endorsed bythe Management Board (EUR 0.5M).
Human resources management and talent selection
On 31 August, 448 of the available 463 posts were occupied (including officials,temporary agents, contract agents and seconded national experts). With specificreference to statutory staff (officials, temporary agents and contract agents), theposts occupied were 436 of the available 448 (97.3%) while the average occupancyrate was 98.0% vs the 2017 yearly target of >95.5% (on average, about 439 of theavailable 448 posts were occupied throughout the period January-August 2017).

EFSA Performance Report – P2, as of 31/8/2017
38
Table 14: Human resource overview
HUMAN RESOURCES
2016 2017 2017
BUDGET
REQUEST
BUDGET
REQUEST
REPORTED
PERIOD (P2)
Temporary Agents and Officials Executives,Managers & Officers (AD)
230 227 211
Temporary Agents and Officials Assistantfunctions (AST)
100 96 105
Total 330 323 316
Contract agents officer functions (CA FGIV) 75 90 90
Contract agents assistant functions (CA FG I, II,III)
50 35 30
TOTAL 125 125 120
Seconded National Experts 15 15 12
TOTAL STAFF ALL CATEGORIES 470 463 448
FTEs and budget indicators per strategic objective2.
Table 15: Input indicators for SO1 (FTEs and Budget as full cost of all Titles)
INPUT INDICATORS
Total SO1
Resources invested per year Target 2017 Executed P2 2017
FTEs 198 133
Budget (K, €) 32.63 22.22
Scientific – general risk assessment
Input sub-indicatorFTEs 43 29
Budget (K, €) 8.70 6.35
Scientific – regulated products evaluation
Input sub-indicatorFTEs 122 80
Budget (K, €) 18.71 12.45
Communication & engagement
Input sub-indicatorFTEs 32 24
Budget (K, €) 5.22 3.41
Table 16: Input indicators for SO2 (FTEs and Budget as full cost of all Titles)
INPUT INDICATORS
Total SO2
Resources invested per year Target 2017 Executed P2 2017
FTEs 24 17
Budget (K, €) 4.64 3.67

EFSA Performance Report – P2, as of 31/8/2017
39
Table 17: Input indicators for SO3 (FTEs and Budget as full cost of all Titles)
INPUT INDICATORS
Total SO3
Resources invested per year Target 2017 Executed P2 2017
FTEs 37 20
Budget (K, €) 8.67 5.00
Table 18: Input indicators for SO4 (FTEs and Budget as full cost of all Titles)
INPUT INDICATORS
Total SO4
Resources invested per year Target 2017 Executed P2 2017
FTEs 35 25
Budget (K, €) 8.77 6.54
Table 19: Input indicators for SO5 (FTEs and Budget as full cost of all Titles)
INPUT INDICATOR
Total SO5
Resources invested per year Target 2017 Executed P2 2017
FTEs 162 125
Budget (K, €) 24.50 21.69

EFSA Performance Report – P2, as of 31/8/2017
40
Section III. AssuranceFollowing the EFSA Internal Control re-organisation several assurance processes arebeing updated. The reorganisation and integration of the assurance functions toensure effective implementation of management standards at EFSA is beingstreamlined and is further enhanced with the establishment of an Assurance Council.The Assurance Council governs the EFSA Assurance and Compliance environment,the Internal Control Standards & Norms, the Risk Management Organisation andvalidates the Assurance and Compliance Plan and Assurance Report for the approvalof the Management Board.
Risk Management
Risk Management is a continuous, proactive and systematic process of identifying,assessing, and managing risks to provide reasonable assurance as regards theachievement of objectives. Risk Management helps to improve decision-making,increase operational effectiveness and set up risk-based Internal Controlarrangements. The revised process design following the 2017 fine tuning exercisewill help to further align the Risk Management methodologies used in EFSA atprocess, project, programme and corporate level. The draft of the updated policydocument is planned for the end of September. Information on the outcome of the2017 Risk Management activities will be included in the EFSA 2017 AssuranceReport.
Internal control
The new Internal Control Framework is prioritized in P3 for future adoption by theManagement Board in order to ensure the auditability of EFSA. This prioritisation wasnecessary following the revision of the Commission Internal Control Standardsframework and therefore the delivery of a feasibility study on Integrated EFSAManagement Standards in P3 is postponed.
Quality management
EFSA’s quality management plan is on track to meet its 2017 objectives, aiming atimproving performance but also providing key elements to reinforce the assurance.Particular attention has been paid to the ISO 9001:2015 findings to ensure that allrecommendations are fully addressed before the October Surveillance Audit. Thisconcerns particularly: i) the documentation of processes and process interactions forthe further development of the continuous improvement process capability and theplanning and monitoring of EFSA’s efficiency targets, ii) the strengthening of EFSA’srisk management approach linking top-down to bottom-up risk identification viastandardised guidelines and criteria and via dissemination of risk based-thinking asan effective way to manage and monitor results and identify corrective andimprovement actions, and iii) the broadening of the concept of non-conformities tocover all areas of EFSA’s work. EFSA is also making progress in the definition of a‘records and document management policy’ (under the records managementproject), which will be followed by the definition of an SOP and a pilot proposal totest and implement records retention and archiving in 2018.

EFSA Performance Report – P2, as of 31/8/2017
41
Exception workflow
The overall purpose of the exception and non-compliance workflow is to monitor thecompliance of EFSA’s operations towards all applicable regulations, policies andprocedures. The “AS IS” analysis of the exception and non-compliance workflow hasbeen completed and the “TO BE” concept defined. The draft of the new guidancedocument replacing the existing ED Decision and related SOPs is planned for mid-September. The current tool will be used and instructions on its use in line with thenew guidance document will be updated. The template used for the follow-up actionshas been aligned to improve consistency with the follow-up activities of otherassurance processes. The reporting covering the 2017 exception and non-conformityworkflow will be included in the EFSA 2017 Assurance Report.
Evaluation activities
With regards to EFSA’s 3rd external evaluation, the contract with the externalconsultancy firm was signed early June 2017 as planned. The 1st deliverable i.e.Inception Report was adopted by the Management Board Steering Committee andthe Phase 1 on Data Collection will be carried out during the next reporting period.An EFSA’s Management Self-Evaluation has been produced and is ready to bediscussed with the Management Board.
Data protection
Accountability, compliance & a regulatory framework ensuring legality of theoperations are confirmed with the continuous legal and regulatory business supportservices, the Data Protection Officer function and its advisory role on data protection,the management of pre-litigations and PAD obligations (135 PAD requests registeredout of which 88 submitted during P2, 1 new/2 pending court cases), the centralisedinterest management function (752 ADOIs of experts processed), and theimplementation of EFSA’s anti-fraud strategy.
Audit outstanding observations
The follow up of outstanding audit recommendations is not part of any project orimprovement initiative. The last update on the outstanding audit recommendationshas been presented to the June Audit Committee. The next update on theoutstanding audit recommendations is planned for the December Management Boardmeeting and the last state of play will be included in the EFSA 2017 AssuranceReport.

EFSA Performance Report – P2, as of 31/8/2017
42
Annex I. Resource allocation
per strategic objective
1. Financial resources per strategic objective
Table 20: Budget allocations per strategic objective (% of the total EFSA budget)
EFSA’S STRATEGIC OBJECTIVE
EXECUTED
2016BUDGET 2017
EXECUTED
P2 2017
M€ % M€ % M€
SO1 Prioritise public and stakeholderengagement in the process of scientificassessment
32.20 41% 32.63 38% 22.22
SO2 Widen EFSA’s evidence base and optimiseaccess to its data
4.83 6% 4.64 6% 3.67
SO3 Build the EU’s risk assessment capacityand knowledge community
6.50 8% 8.67 8% 5.00
SO4 Prepare for future risk assessmentchallenges
11.60 15% 8.77 11% 6.54
SO5 Create an environment and culture thatreflects EFSA’s values
24.35 31% 24.50 37% 21.69
Of which operations 9.02 11% 9.74 15% 8.55
Of which support 15.33 19% 14.76 22% 13.14
Total EFSA 79.49 100% 79.20 100% 59.12

EFSA Performance Report – P2, as of 31/8/2017
43
2. Human resources per strategic objective
Table 21: FTE allocations per strategic objective
EFSA’S STRATEGIC OBJECTIVE
EXECUTED
2016PLAN 2017 P2 2017
FTE25
/ POSTS FTE26
/POSTS % POSTS %
SO1 Prioritise public and stakeholderengagement in the process of scientificassessment
200/202 198/201 43% 133 42%
SO2 Widen EFSA’s evidence base andoptimise access to its data
19/19 24/24 5% 17 5%
SO3 Build the EU’s risk assessment capacityand knowledge community
31/32 37/37 8% 20 6%
SO4 Prepare for future risk assessmentchallenges
35/36 35/36 8% 25 8%
SO5 Create an environment and culture thatreflects EFSA’s values
179/181 162/165 36% 125 39%
Of which operations 57/58 50/51 11% 35 11%
Of which support 122/123 112/114 25% 90 28%
Total EFSA 464/470 456/463 100% 320 100%
25Actual available FTEs
26Planned FTEs are based on a 98% occupancy rate assumption applied to the average number of posts
available during the year. Planned posts are the number of statutory staff and SNE posts assigned to EFSAat the end of each year

EFSA Performance Report – P2, as of 31/8/2017
44
Annex II. Financial resourcesTable 22: Expenditures
Expenditure/title
2017 2nd QUARTER
Current
commitment
appropriations
Payment
appropriations
Executed
Commitment
Executed
Payment
Title I - Staff expenditure 42.06 42.06 32.29 28.16
Title II - Infrastructureand operatingexpenditure
8.60 8.60 7.27 4.69
Title III - Operationalexpenditure
28.56 29.79 19.56 14.47
TOTAL EXPENDITURE 79.22 80.45 59.12 47.32
Expendituretype
Initialcommitmentappropriatio
ns
Currentcommitmentappropriatio
ns
Commitmentexecution
August 2017%
Curremtpayment
appropriations
Paymentexecution
August2017
%
Title 1 - Staffexpenditure
42,059,185 42,059,185 32,287,18477%
42,059,185 28,155,053 67%
Salaries &allowances
37,131,185 37,131,079 28,185,950 76% 37,131,079 25,193,509 68%
- Of whichestablishmentplan posts
29,304,185 29,304,079 22,323,550 76% 29,304,079 19,909,570 68%
- Of whichexternalpersonnel
7,827,000 7,827,000 5,862,400 75% 7,827,000 5,283,939 68%
Expenditurerelating to Staffrecruitment
480,000 480,000 344,971 72% 480,000 269,945 56%
Mission expenses 361,000 361,000 300,000 83% 361,000 135,768 38%
Socio-medicalinfrastructure
319,000 319,000 270,236 85% 319,000 124,804 39%
Training 584,000 584,000 406,331 70% 584,000 155,256 27%
External Services 1,869,000 1,869,106 1,518,608 81% 1,869,106 1,021,812 55%
Receptions,events andrepresentation
5,000 5,000 5,000100
%5,000 907 18%
Social welfare 1,310,000 1,310,000 1,256,088 96% 1,310,000 1,253,053 96%
Other Staffrelatedexpenditure
- - --
- --
Title 2 -Infrastructureand operatingexpenditure
8,578,000 8,599,545 7,270,12285%
8,599,545 4,687,579 55%
Rental ofbuildings andassociated costs*
4,914,500 4,880,045 3,937,975 81% 4,880,045 2,395,063 49%
Information,communication
2,814,000 2,912,762 2,802,370 96% 2,912,762 2,077,759 71%
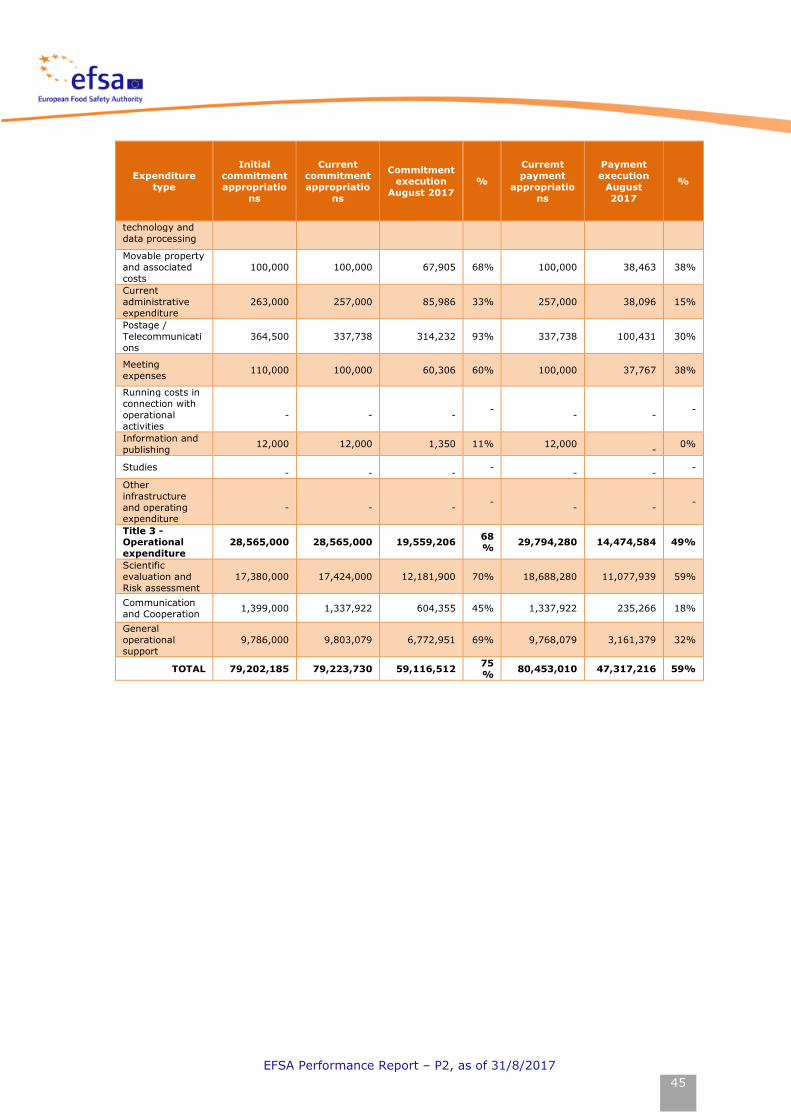
EFSA Performance Report – P2, as of 31/8/2017
45
Expendituretype
Initialcommitmentappropriatio
ns
Currentcommitmentappropriatio
ns
Commitmentexecution
August 2017%
Curremtpayment
appropriations
Paymentexecution
August2017
%
technology anddata processing
Movable propertyand associatedcosts
100,000 100,000 67,905 68% 100,000 38,463 38%
Currentadministrativeexpenditure
263,000 257,000 85,986 33% 257,000 38,096 15%
Postage /Telecommunications
364,500 337,738 314,232 93% 337,738 100,431 30%
Meetingexpenses
110,000 100,000 60,306 60% 100,000 37,767 38%
Running costs inconnection withoperationalactivities
- - --
- --
Information andpublishing
12,000 12,000 1,350 11% 12,000-
0%
Studies- - -
-- -
-
Otherinfrastructureand operatingexpenditure
- - --
- --
Title 3 -Operationalexpenditure
28,565,000 28,565,000 19,559,20668%
29,794,280 14,474,584 49%
Scientificevaluation andRisk assessment
17,380,000 17,424,000 12,181,900 70% 18,688,280 11,077,939 59%
Communicationand Cooperation
1,399,000 1,337,922 604,355 45% 1,337,922 235,266 18%
Generaloperationalsupport
9,786,000 9,803,079 6,772,951 69% 9,768,079 3,161,379 32%
TOTAL 79,202,185 79,223,730 59,116,51275%
80,453,010 47,317,216 59%

EFSA Performance Report – P2, as of 31/8/2017
46
Table 23: Budget Transfers January – August 2017
TitleBudget HeadingsTransfers from year start
Commitment andpaymentappropriation 2017
Initial Transfers Current
1 STAFF
11 STAFF IN ACTIVE EMPLOYMENT
110 Staff in active employment
1100 Basic salary 22,422,185.00 0.00 22,422,185.00
1101 Family allowance 2,907,000.00 0.00 2,907,000.00
1102 Transfer and expatriation allowance 2,397,000.00 0.00 2,397,000.00
1103 Secretarial allowance 13,000.00 0.00 13,000.00
tot. of 110 27,739,185.00 0.00 27,739,185.00
111 Other staff
1113 Stagiaires 818,000.00 0.00 818,000.00
1115 Contract staff 6,290,000.00 0.00 6,290,000.00
tot. of 111 7,108,000.00 0.00 7,108,000.00
113 Employer's social security contributions
1130 Insurance against sickness 786,000.00 0.00 786,000.00
1131 Insurance against accidents and occupational disease 116,000.00 -105.63 115,894.37
1132 Unemployment insurance for temporary staff 290,000.00 0.00 290,000.00
1133Establishment or maintenance of pension rights for temporarystaff
0.00 0.00 0.00
tot. of 113 1,192,000.00 -105.63 1,191,894.37
114 Miscellaneous allowances and grants
1140 Birth and death allowance 3,000.00 0.00 3,000.00
1141 Annual leave travelling expenses 280,000.00 0.00 280,000.00
1147 Call on duties 70,000.00 0.00 70,000.00
1149 Other allowances and repayments 20,000.00 0.00 20,000.00
tot. of 114 373,000.00 0.00 373,000.00
117 Supplementary services
1171 Translation and interpretation 120,000.00 0.00 120,000.00
1172Payment for administrative assistance from the Communityinstitutions
250,000.00 105.63 250,105.63
1175 Interim services 1,014,000.00 0.00 1,014,000.00
1176 Consultancy 240,000.00 0.00 240,000.00
1177 Other services 245,000.00 0.00 245,000.00
tot. of 117 1,869,000.00 105.63 1,869,105.63

EFSA Performance Report – P2, as of 31/8/2017
47
TitleBudget HeadingsTransfers from year start
Commitment andpaymentappropriation 2017
Initial Transfers Current
118Recruitment costs and expenses on entering and leaving theservice
1180 Miscellaneous expenditure on recruitment 100,000.00 0.00 100,000.00
1181 Travel expenses (including for members of the family) 10,000.00 0.00 10,000.00
1182 Installation, resettlement and transfer allowances 190,000.00 0.00 190,000.00
1183 Removal expenses 120,000.00 0.00 120,000.00
1184 Temporary daily subsistence allowance 60,000.00 0.00 60,000.00
tot. of 118 480,000.00 0.00 480,000.00
119 Salary weightings
1190 Salary weightings 0.00 0.00 0.00
tot. of 119 0.00 0.00 0.00
tot. of 11 38,761,185.00 0.00 38,761,185.00
13 MISSIONS AND DUTY TRAVEL
130 Mission and travel expenses
1300 Mission and travel expenses 261,000.00 0.00 261,000.00
1301 Shuttles for missions and duty 100,000.00 0.00 100,000.00
tot. of 130 361,000.00 0.00 361,000.00
tot. of 13 361,000.00 0.00 361,000.00
14 SOCIOMEDICAL INFRASTRUCTURE
140 Restaurants, meals and canteens
1400 Restaurants, meals and canteens 64,000.00 0.00 64,000.00
tot. of 140 64,000.00 0.00 64,000.00
141 Medical service
1410 Medical service 255,000.00 0.00 255,000.00
tot. of 141 255,000.00 0.00 255,000.00
142 Further training, language courses and retraining for staff
1420 Further training, language courses and retraining for staff 584,000.00 0.00 584,000.00
tot. of 142 584,000.00 0.00 584,000.00
tot. of 14 903,000.00 0.00 903,000.00
15 EXCHANGE OF OFFICIALS AND EXPERTS
152 Exchange of officials and experts

EFSA Performance Report – P2, as of 31/8/2017
48
TitleBudget HeadingsTransfers from year start
Commitment andpaymentappropriation 2017
Initial Transfers Current
1520 Visiting experts, National Experts on Detachement 719,000.00 0.00 719,000.00
1521Authority officials temporarily assigned to national civil services,to international organisations or to public or private institutions
0.00 0.00 0.00
tot. of 152 719,000.00 0.00 719,000.00
tot. of 15 719,000.00 0.00 719,000.00
16 SOCIAL WELFARE
160 Special assistance grants
1600 Special assistance grants 0.00 0.00 0.00
tot. of 160 0.00 0.00 0.00
161 Social contacts between staff
1610 Social contacts between staff 50,000.00 0.00 50,000.00
tot. of 161 50,000.00 0.00 50,000.00
162 Other interventions
1620 Other interventions 0.00 0.00 0.00
tot. of 162 0.00 0.00 0.00
163 Early childhood centres and other creches
1630 Early childhood centres, other creches and EU school contribution 1,250,000.00 0.00 1,250,000.00
tot. of 163 1,250,000.00 0.00 1,250,000.00
164 Complementary aid for the handicapped
1640 Complementary aid for the handicapped 10,000.00 0.00 10,000.00
tot. of 164 10,000.00 0.00 10,000.00
tot. of 16 1,310,000.00 0.00 1,310,000.00
17 RECEPTION AND ENTERTAINMENT EXPENSES
170 Reception and entertainment expenses
1700 Reception and entertainment expenses 5,000.00 0.00 5,000.00
tot. of 170 5,000.00 0.00 5,000.00
tot. of 17 5,000.00 0.00 5,000.00
tot. of 1 42,059,185.00 0.00 42,059,185.00
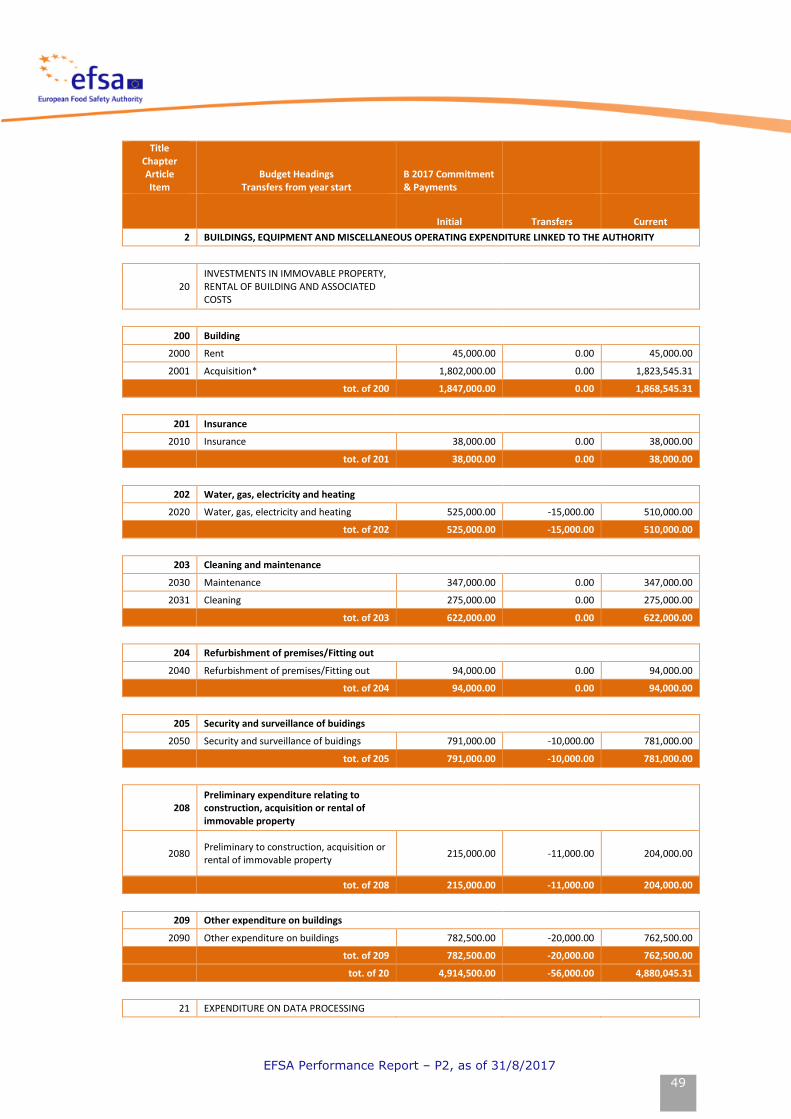
EFSA Performance Report – P2, as of 31/8/2017
49
TitleChapterArticleItem
Budget HeadingsTransfers from year start
B 2017 Commitment& Payments
Initial Transfers Current
2 BUILDINGS, EQUIPMENT AND MISCELLANEOUS OPERATING EXPENDITURE LINKED TO THE AUTHORITY
20INVESTMENTS IN IMMOVABLE PROPERTY,RENTAL OF BUILDING AND ASSOCIATEDCOSTS
200 Building
2000 Rent 45,000.00 0.00 45,000.00
2001 Acquisition* 1,802,000.00 0.00 1,823,545.31
tot. of 200 1,847,000.00 0.00 1,868,545.31
201 Insurance
2010 Insurance 38,000.00 0.00 38,000.00
tot. of 201 38,000.00 0.00 38,000.00
202 Water, gas, electricity and heating
2020 Water, gas, electricity and heating 525,000.00 -15,000.00 510,000.00
tot. of 202 525,000.00 -15,000.00 510,000.00
203 Cleaning and maintenance
2030 Maintenance 347,000.00 0.00 347,000.00
2031 Cleaning 275,000.00 0.00 275,000.00
tot. of 203 622,000.00 0.00 622,000.00
204 Refurbishment of premises/Fitting out
2040 Refurbishment of premises/Fitting out 94,000.00 0.00 94,000.00
tot. of 204 94,000.00 0.00 94,000.00
205 Security and surveillance of buidings
2050 Security and surveillance of buidings 791,000.00 -10,000.00 781,000.00
tot. of 205 791,000.00 -10,000.00 781,000.00
208Preliminary expenditure relating toconstruction, acquisition or rental ofimmovable property
2080Preliminary to construction, acquisition orrental of immovable property
215,000.00 -11,000.00 204,000.00
tot. of 208 215,000.00 -11,000.00 204,000.00
209 Other expenditure on buildings
2090 Other expenditure on buildings 782,500.00 -20,000.00 762,500.00
tot. of 209 782,500.00 -20,000.00 762,500.00
tot. of 20 4,914,500.00 -56,000.00 4,880,045.31
21 EXPENDITURE ON DATA PROCESSING

EFSA Performance Report – P2, as of 31/8/2017
50
TitleChapterArticleItem
Budget HeadingsTransfers from year start
B 2017 Commitment& Payments
Initial Transfers Current
210 Purchase and maintenance of IT for administration and non operational
2100 Purchase/ maintenance of IT equipment 404,000.00 -89,000.00 315,000.00
2101 Purchase / maintenance of software 649,000.00 138,000.00 787,000.00
2103 Software development 1,015,000.00 -32,448.00 982,552.00
2104 User Support 746,000.00 82,209.83 828,209.83
tot. of 210 2,814,000.00 98,761.83 2,912,761.83
tot. of 21 2,814,000.00 98,761.83 2,912,761.83
22 MOVABLE PROPERTY AND ASSOCIATED COSTS
220 Technical equipment and installations
2200 Technical equipment and installations 80,000.00 0.00 80,000.00
2201Hire or leasing of technical equipment andinstallations
0.00 0.00 0.00
2202Maintenance and repair of technicalequipment and installations
0.00 0.00 0.00
tot. of 220 80,000.00 0.00 80,000.00
221 Furniture
2210 Purchase of furniture 20,000.00 0.00 20,000.00
2211 Hire of furniture 0.00 0.00 0.00
2212 Maintenance and repair of furniture 0.00 0.00 0.00
tot. of 221 20,000.00 0.00 20,000.00
tot. of 22 100,000.00 0.00 100,000.00
23 CURRENT ADMINISTRATIVE EXPENDITURE
230 Stationery and office supplies
2300 Stationery and office supplies 66,000.00 -6,000.00 60,000.00
tot. of 230 66,000.00 -6,000.00 60,000.00
232 Financial charges
2320 Bank charges 1,000.00 0.00 1,000.00
2321 Other financial charges 0.00 0.00 0.00
tot. of 232 1,000.00 0.00 1,000.00
233 Legal expenses
2330 Legal expenses 185,000.00 0.00 185,000.00
tot. of 233 185,000.00 0.00 185,000.00
234 Damages
2340 Damages 0.00 0.00 0.00
tot. of 234 0.00 0.00 0.00

EFSA Performance Report – P2, as of 31/8/2017
51
TitleChapterArticleItem
Budget HeadingsTransfers from year start
B 2017 Commitment& Payments
Initial Transfers Current
235 Other operating expenditure
2350 Miscellaneous insurance 11,000.00 0.00 11,000.00
2353 Removals and associated handling 0.00 0.00 0.00
tot. of 235 11,000.00 0.00 11,000.00
239 Publications
2390 Publications 12,000.00 0.00 12,000.00
tot. of 239 12,000.00 0.00 12,000.00
tot. of 23 275,000.00 -6,000.00 269,000.00
24 POSTAL CHARGES AND TELECOMMUNICATIONS
240 Postal charges
2400 Postal charges 35,500.00 0.00 35,500.00
tot. of 240 35,500.00 0.00 35,500.00
241 Telecommunications
2410Telecommunications subscriptions andcharges
201,000.00 -18,761.83 182,238.17
2411 Purchase and installation of equipment 128,000.00 -8,000.00 120,000.00
tot. of 241 329,000.00 -26,761.83 302,238.17
tot. of 24 364,500.00 -26,761.83 337,738.17
25 GOVERNANCE EXPENDITURE
250 Governance expenditure
2500 Management Board meetings 110,000.00 -10,000.00 100,000.00
tot. of 250 110,000.00 -10,000.00 100,000.00
tot. of 25 110,000.00 -10,000.00 100,000.00
tot. of 2 8,578,000.00 0.00 8,599,545.31
*amended budget

TitleChapterArticleItem
Budget HeadingsTransfers from year start
B 2017 Commitment appropriation B 2017 Payment appropriation
Initial Transfers Current Initial Transfers Current
3 OPERATING EXPENDITURE LINKED TO THE AUTHORITY
30 SCIENTIFIC EVALUATION of REGULATED PRODUCTS
302 REPRO Experts meetings
3020 REPRO Experts meetings 4,118,000.00 0.00 4,118,000.00 4,118,000.00 0.00 4,118,000.00
tot. of 302 4,118,000.00 0.00 4,118,000.00 4,118,000.00 0.00 4,118,000.00
tot. of 30 4,118,000.00 0.00 4,118,000.00 4,118,000.00 0.00 4,118,000.00
31 RISK ASSESSMENT & SCIENTIFIC ASSISTANCE
312 RASA Experts meetings
3120 RASA Experts meetings 3,695,000.00 0.00 3,695,000.00 3,695,000.00 0.00 3,695,000.00
tot. of 312 3,695,000.00 0.00 3,695,000.00 3,695,000.00 0.00 3,695,000.00
313 Crisis support
3130 Crisis support 9,000.00 0.00 9,000.00 9,000.00 0.00 9,000.00
tot. of 313 9,000.00 0.00 9,000.00 9,000.00 0.00 9,000.00
tot. of 31 3,704,000.00 0.00 3,704,000.00 3,704,000.00 0.00 3,704,000.00
32 EFSA SCIENTIFIC COOPERATION
321 EFSA Grants & Procurement
3210 EFSA Grants & Procurement 9,490,000.00 0.00 9,490,000.00 10,754,280.00 0.00 10,754,280.00

EFSA Performance Report – P2, as of 31/8/2017
53
TitleChapterArticleItem
Budget HeadingsTransfers from year start
B 2017 Commitment appropriation B 2017 Payment appropriation
Initial Transfers Current Initial Transfers Current
tot. of 321 9,490,000.00 0.00 9,490,000.00 10,754,280.00 0.00 10,754,280.00
322 Scientific cooperation meetings
3220 Scientific cooperation meetings 68,000.00 44,000.00 112,000.00 68,000.00 44,000.00 112,000.00
tot. of 343 68,000.00 44,000.00 112,000.00 68,000.00 44,000.00 112,000.00
323 Pre-accession and ENP Programmes*
3230 Pre-accession programme 0.00 0.00 0.00 0.00 0.00 0.00
3231 ENP (European Neighbourhood programme) 0.00 0.00 0.00 0.00 0.00 0.00
tot. of 323 0.00 0.00 0.00 0.00 0.00 0.00
324 Collaboration with other organisations*
3240 Collaboration with FAO 0.00 0.00 0.00 0.00 0.00 0.00
tot. of 3324 0.00 0.00 0.00 0.00 0.00 0.00
tot. of 32 9,558,000.00 44,000.00 9,602,000.00 10,822,280.00 44,000.00 10,866,280.00
34 COMMUNICATIONS
341 Risk Communication
3410 Risk Communication 1,089,000.00 -61,078.50 1,027,921.50 1,089,000.00 -61,078.50 1,027,921.50
tot. of 341 1,089,000.00 -61,078.50 1,027,921.50 1,089,000.00 -61,078.50 1,027,921.50
342 External relations
3420 External relations 310,000.00 0.00 310,000.00 310,000.00 0.00 310,000.00

EFSA Performance Report – P2, as of 31/8/2017
54
TitleChapterArticleItem
Budget HeadingsTransfers from year start
B 2017 Commitment appropriation B 2017 Payment appropriation
Initial Transfers Current Initial Transfers Current
tot. of 342 310,000.00 0.00 310,000.00 310,000.00 0.00 310,000.00
tot. of 34 1,399,000.00 -61,078.50 1,337,921.50 1,399,000.00 -61,078.50 1,337,921.50
35 HORIZONTAL OPERATIONS
350 Operational IT Systems
3500 Operational IT Systems 3,975,000.00 994,787.50 4,969,787.50 3,975,000.00 994,787.50 4,969,787.50
3501 Multiannual IT Projects 1,202,000.00 -975,533.00 226,467.00 1,167,000.00 -975,533.00 191,467.00
tot. of 350 5,177,000.00 19,254.50 5,196,254.50 5,142,000.00 19,254.50 5,161,254.50
351 Operational support
3511Translation, Interpretation, Linguistic Proofreading andEditing
200,000.00 0.00 200,000.00 200,000.00 0.00 200,000.00
3512 Library 534,000.00 15,000.00 549,000.00 534,000.00 15,000.00 549,000.00
3513 Mission of staff related to operational duties 950,000.00 -35,000.00 915,000.00 950,000.00 -35,000.00 915,000.00
3514Shuttles for experts and staff related to operationalduties
1,025,000.00 0.00 1,025,000.00 1,025,000.00 0.00 1,025,000.00
tot. of 351 2,709,000.00 -20,000.00 2,689,000.00 2,709,000.00 -20,000.00 2,689,000.00
352 Conferences & Outreach
3520 Conferences and Outreach 1,100,000.00 -63,106.00 1,036,894.00 1,100,000.00 -63,106.00 1,036,894.00
tot. of 352 1,100,000.00 -63,106.00 1,036,894.00 1,100,000.00 -63,106.00 1,036,894.00
353 Operational development & Control
3530 Operational Development & Control 760,000.00 80,930.00 840,930.00 760,000.00 80,930.00 840,930.00
tot. of 353 760,000.00 80,930.00 840,930.00 760,000.00 80,930.00 840,930.00

EFSA Performance Report – P2, as of 31/8/2017
55
TitleChapterArticleItem
Budget HeadingsTransfers from year start
B 2017 Commitment appropriation B 2017 Payment appropriation
Initial Transfers Current Initial Transfers Current
354 Quality Management
3540 Quality Management 40,000.00 0.00 40,000.00 40,000.00 0.00 40,000.00
tot. of 354 40,000.00 0.00 40,000.00 40,000.00 0.00 40,000.00
tot. of 35 9,786,000.00 17,078.50 9,803,078.50 9,751,000.00 17,078.50 9,768,078.50
tot. of 3 28,565,000.00 0.00 28,565,000.00 29,794,280.00 0.00 29,794,280.00

ANNEX III. Status of projectsTable 24: Projects and Process improvement initiatives under SO1 – Status report
Intermediary Impact Expected result – Outcome ProjectOverallStatus
Increased satisfaction of stakeholdersregarding EFSA’s scientific outputs (for EC/MSrisk managers and stakeholders) and thescientific assessment process andcommunication tools and materials
increased engagement of stakeholders inscientific activities
Customer oriented approach for applications for RegulatedProducts
TERA
Stakeholder Engagement Approach (SEA)
Reputation Management (including Barometer)
full availability of documentation relevantto EFSA scientific outputs
Matrix
enhanced outreach of communication
COMMS digital collaboration N/A
Social Media 2020 strategy N/A
Table 25: Projects and Process improvement initiatives under SO2 – Status report
Intermediary impact Expected result - outcome ProjectOverallStatus
Increased satisfaction of stakeholdersregarding EFSA’s evidence managementservices and fostered innovative re-use of data
Information Management Programme
Information governance project
Improved access to data
Developing a system for assigning digital object identifiers (dois)project
Scientific Data Warehouse (DWH)
Open ScAIE project
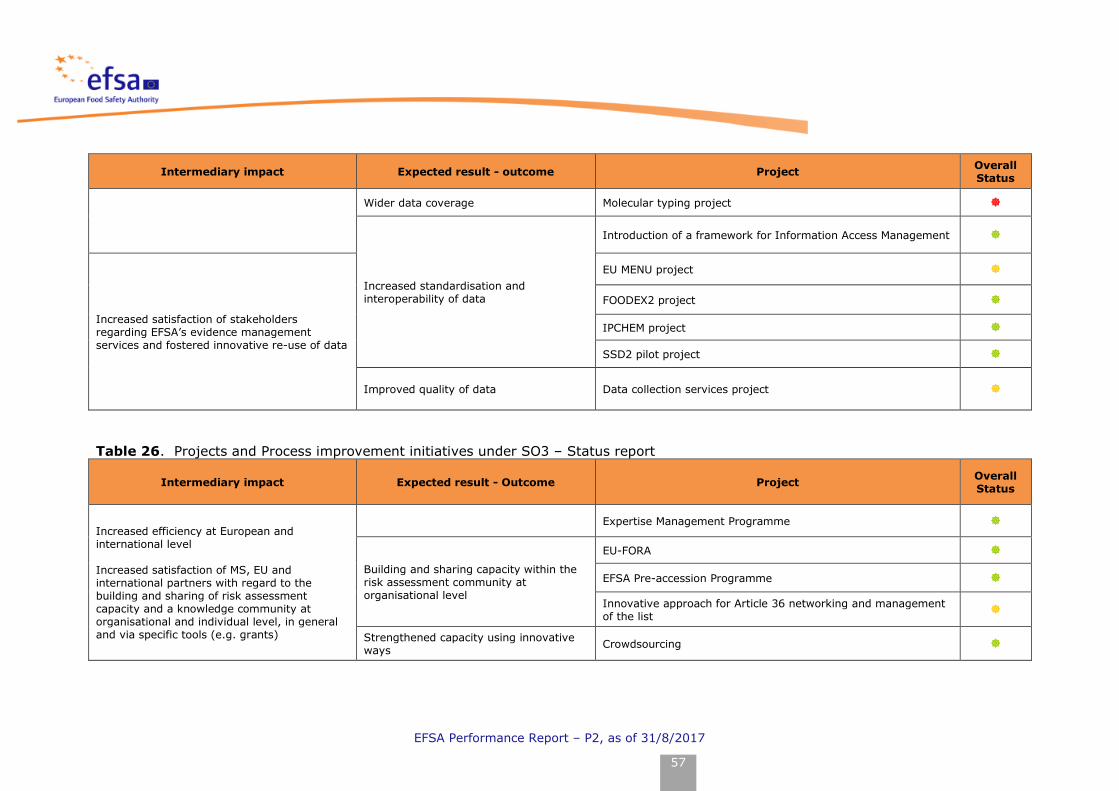
EFSA Performance Report – P2, as of 31/8/2017
57
Intermediary impact Expected result - outcome ProjectOverallStatus
Wider data coverage Molecular typing project
Increased standardisation andinteroperability of data
Introduction of a framework for Information Access Management
Increased satisfaction of stakeholdersregarding EFSA’s evidence managementservices and fostered innovative re-use of data
EU MENU project
FOODEX2 project
IPCHEM project
SSD2 pilot project
Improved quality of data Data collection services project
Table 26. Projects and Process improvement initiatives under SO3 – Status report
Intermediary impact Expected result - Outcome ProjectOverallStatus
Increased efficiency at European andinternational level
Increased satisfaction of MS, EU andinternational partners with regard to thebuilding and sharing of risk assessmentcapacity and a knowledge community atorganisational and individual level, in generaland via specific tools (e.g. grants)
Expertise Management Programme
Building and sharing capacity within therisk assessment community atorganisational level
EU-FORA
EFSA Pre-accession Programme
Innovative approach for Article 36 networking and managementof the list
Strengthened capacity using innovativeways
Crowdsourcing

EFSA Performance Report – P2, as of 31/8/2017
58
Table 27: Projects and Process improvement initiatives under SO4– Status report
Intermediary impact Expected result - outcome ProjectOverallStatus
Increased effectiveness of preparedness andresponse
Fostered use of new approaches andenhanced ability to anticipate andrespond to risks
Wildlife project
Vectornet project
Define new activity on urgent response for plant health issues N/A
Tracing methodology
Preparatory work for future advice / Integrating new approachesin chemical risk assessment
Cumulative Risk Assessment of Pesticides - part II
Data collection on historical control data
Coordinated framework for the development of environmentalrisk assessment across the various EFSA Units and Panels: PilotProjects with MSs on 4 areas (pesticides soil, pesticides aquatic,plant health, multi-stressors)
N/A
Bee health
Guidance on submissions for evaluation of nutrients or of otheringredients proposed for use in the manufacture of foods
Guidance documents for health claims
Use of protein hydrolysates in formulae
Aquatic RA Guidance: Opinion on TK/TD and simple food chaineffects modelling for RA
EFSA guidance on Dermal Absorption

EFSA Performance Report – P2, as of 31/8/2017
59
Intermediary impact Expected result - outcome ProjectOverallStatus
Increased effectiveness of preparedness andresponse
Fostered use of new approaches andenhanced ability to anticipate andrespond to risks
Epidemiological studies
Hazard assessment of Endocrine Disruptors
PECs in Soil
QSAR Dermal absorption
Repair action of the FOCUS surface water scenarios
Review of the published non-dietary exposure data to pesticidesfor residents and bystanders and for environmental RA.
N/A
Terrestrial RA Guidance. Non-target terrestrial plants andAmphibians and reptile Guidance
Testing strategies for evaluation of developmental neurotoxicity
Increased satisfaction of stakeholders withregard to EFSA's preparedness, methodologiesand response
Harmonisation of risk assessmentmethodologies
Set up of a plan for the further development and use of animal-based indications for animal welfare risk assessment
N/A
Expert knowledge elicitation (EKE)
Scientific Committee Guidance Document Review framework(Guidance review)
N/A
Harmonise EFSA environmental risk assessment (ERA) schemes N/A
Evidence use in risk assessment: Prometheus
Accessibility of EFSA methods and tools
Risk Assessment tools for the safety of global food and feedsupply chains (FPA with BfR)
R4EU
Knowledge junction (through Open ScAIE)

EFSA Performance Report – P2, as of 31/8/2017
60
Table 28: Projects and Process improvement initiatives under SO5 – Status report
Intermediate impact Expected result - Outcome ProjectOverallStatus
Sound operational performance
Efficiency
External evaluation
EU Agencies' Network (EUAN)
People and culture Talent Management
Compliance
Centralisation of competing interest management
Independence policy
Business continuity
OHSAS 18000 certification
Correspondence & records management
Enabling work environment
Organisational development: mission centralisation and travellogistics outsourcing
New World of Work N/A
Capabilities
Performance and results management approach
EMAS certification registration. ISO 14001 certification andcertification achievement
Businesses DWH (B.I.K.E. project)