eficienta energiei in transporturi
TRANSCRIPT

8/12/2019 Eficienta Energiei in Transporturi
http://slidepdf.com/reader/full/eficienta-energiei-in-transporturi 1/88
© OECD/IEA 2011
Energy efficiency policies
for transport
John Dulac and Francois Cuenot
International Energy AgencyParis, 9 April 2013
8/12/2019 Eficienta Energiei in Transporturi
http://slidepdf.com/reader/full/eficienta-energiei-in-transporturi 2/88
© OECD/IEA 2011
Content
1. Scene setting
2. Policies for energy efficient transport
3. Transport data collection
8/12/2019 Eficienta Energiei in Transporturi
http://slidepdf.com/reader/full/eficienta-energiei-in-transporturi 3/88
© OECD/IEA 2011
Transport scene-setting
• Why transport policies?
• Role of transport in energy consumption
• Understanding drivers of demand
8/12/2019 Eficienta Energiei in Transporturi
http://slidepdf.com/reader/full/eficienta-energiei-in-transporturi 4/88
© OECD/IEA 2011
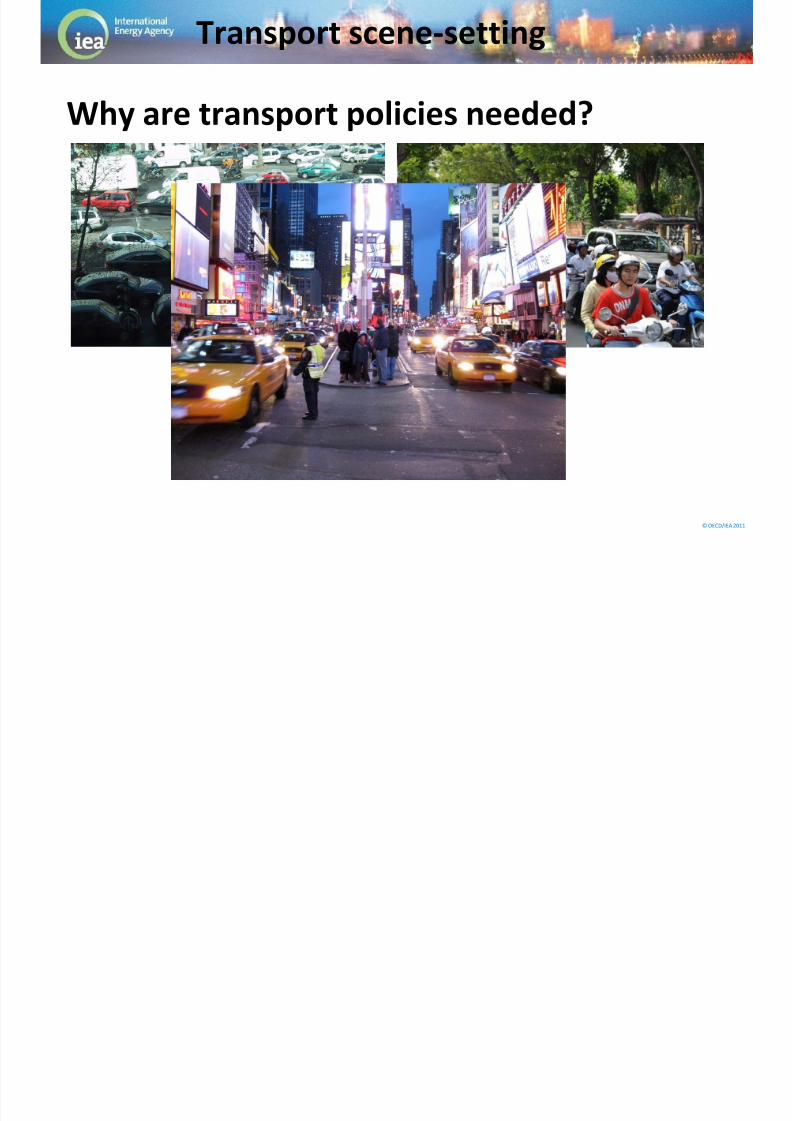
Why are transport policies needed?
• To reduce increasing energy demand
• To attenuate negative impacts
Damage to the environment
Health related issues (local pollutants / noise)
Injuries / fatalities
Economic loss (congestion / fuel / time / accidents)
•
To (try to) provide equal access to mobility Basic principle individuals should be able to move freely
Social equity
Access to employment and services
Transport scene-setting

8/12/2019 Eficienta Energiei in Transporturi
http://slidepdf.com/reader/full/eficienta-energiei-in-transporturi 5/88
© OECD/IEA 2011
The 450 Scenario illustrates what the
2⁰C goal will require
World energy-related CO2 emissions by scenario
Holding GHG concentration to 450 ppm would limit temperature increase to 2⁰C,
compared with 3.5⁰C in the New Policies Scenario & 6⁰C in the Current Policies Scenario
65%
33%
71%
28%
15 Gt
7 Gt
20
25
30
35
40
45
1990 2000 2010 2020 2030 2035
G t
Current Policies
Scenario
450 Scenario
New Policies
Scenario
Non-OECD
OECD
8/12/2019 Eficienta Energiei in Transporturi
http://slidepdf.com/reader/full/eficienta-energiei-in-transporturi 6/88
© OECD/IEA 2011
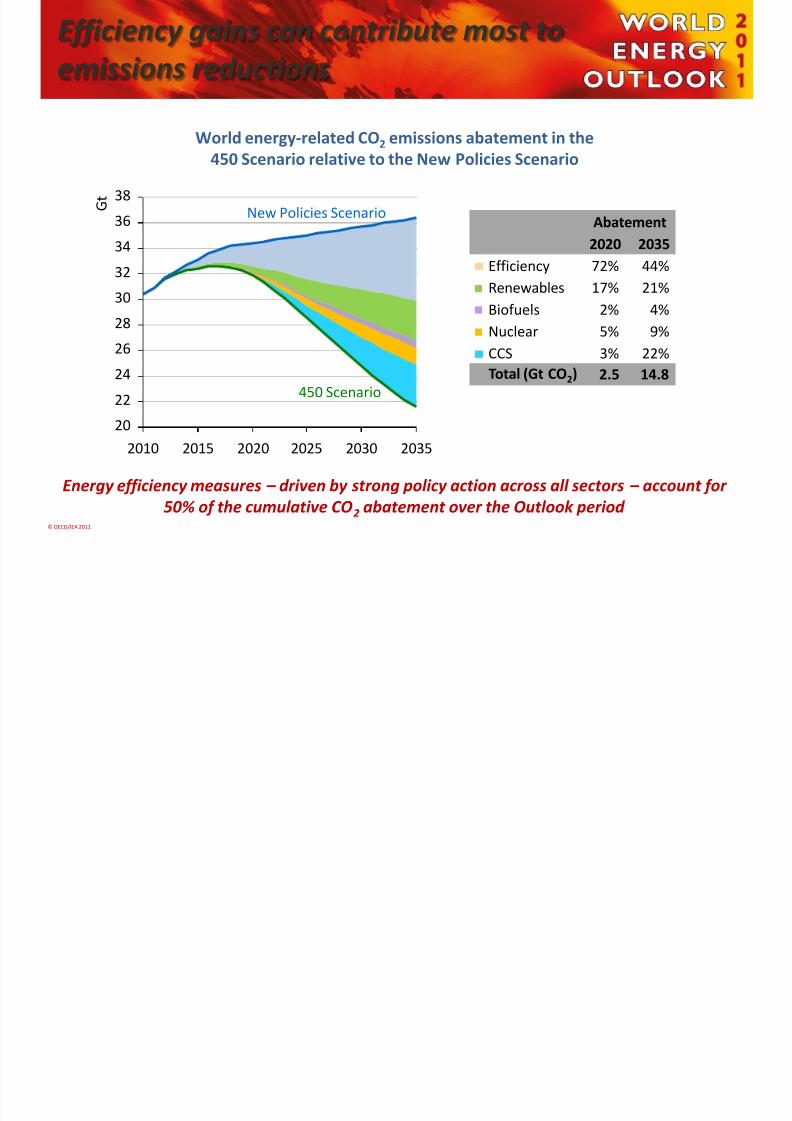
Efficiency gains can contribute most to
emissions reductions
World energy-related CO2 emissions abatement in the
450 Scenario relative to the New Policies Scenario
Energy efficiency measures – driven by strong policy action across all sectors – account for
50% of the cumulative CO2 abatement over the Outlook period
Abatement
2020 2035 Efficiency 72% 44%
Renewables 17% 21%
Biofuels 2% 4%
Nuclear 5% 9%
CCS 3% 22%
Total (Gt CO2) 2.5 14.8
20
22 24
26
28
30
32 34
36
38
2010 2015 2020 2025 2030 2035
G t
New Policies Scenario
450 Scenario
8/12/2019 Eficienta Energiei in Transporturi
http://slidepdf.com/reader/full/eficienta-energiei-in-transporturi 7/88© OECD/IEA 2011
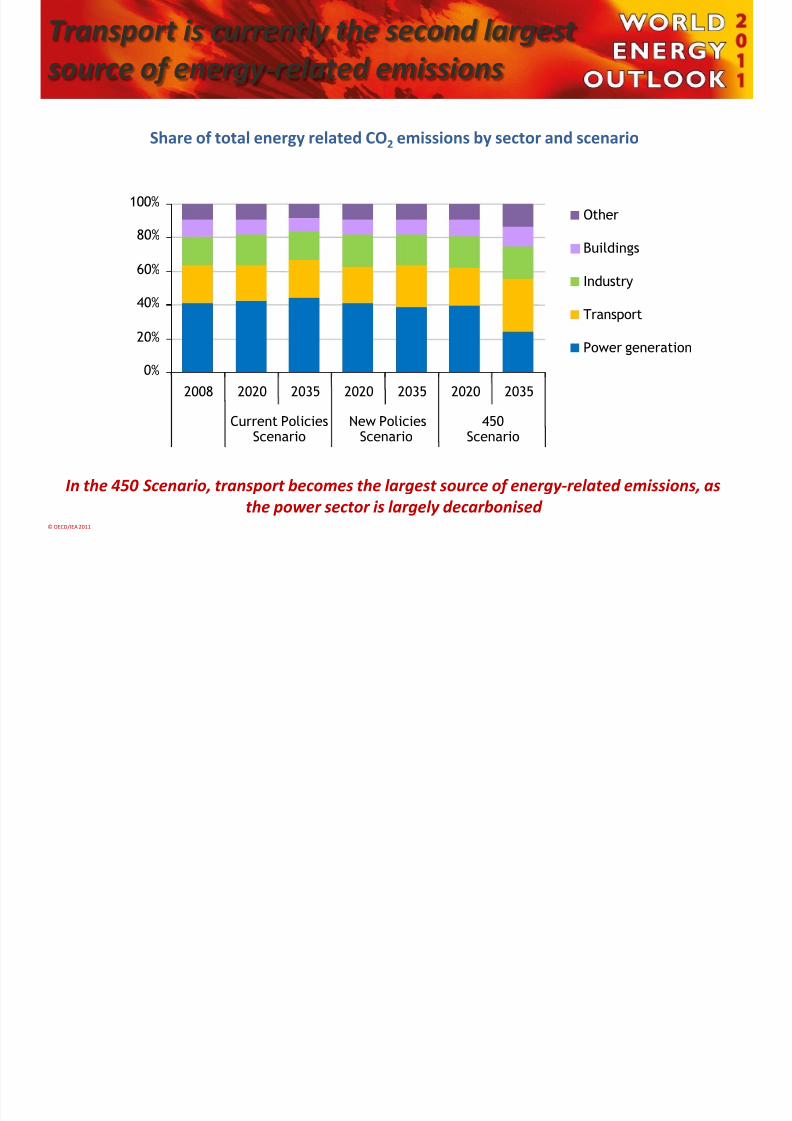
Transport is currently the second largest
source of energy-related emissions
In the 450 Scenario, transport becomes the largest source of energy-related emissions, as
the power sector is largely decarbonised
0%
20%
40%
60%
80%
100%
2008 2020 2035 2020 2035 2020 2035
Current Policies Scenario
New Policies Scenario
450 Scenario
Other
Buildings
Industry
Transport
Power generation
Share of total energy related CO2 emissions by sector and scenario

8/12/2019 Eficienta Energiei in Transporturi
http://slidepdf.com/reader/full/eficienta-energiei-in-transporturi 8/88
© OECD/IEA 2012
CO2 emissions below 2000 levels
• Combining Avoid/Shift/Improve helps reaching2DS objective
• Vehicle efficiency improvement key to success

8/12/2019 Eficienta Energiei in Transporturi
http://slidepdf.com/reader/full/eficienta-energiei-in-transporturi 9/88
© OECD/IEA 2012
L’addition s’il vous plait
•
Efficiency gains and alternative technologies bringhuge fuel savings
• Avoid/Shift reduces vehicle and infrastructure bill
• Combined Improve/Avoid/Shift greatest savings
8/12/2019 Eficienta Energiei in Transporturi
http://slidepdf.com/reader/full/eficienta-energiei-in-transporturi 10/88© OECD/IEA 2011
Why are transport policies needed?
Transport scene-setting
8/12/2019 Eficienta Energiei in Transporturi
http://slidepdf.com/reader/full/eficienta-energiei-in-transporturi 11/88© OECD/IEA 2011
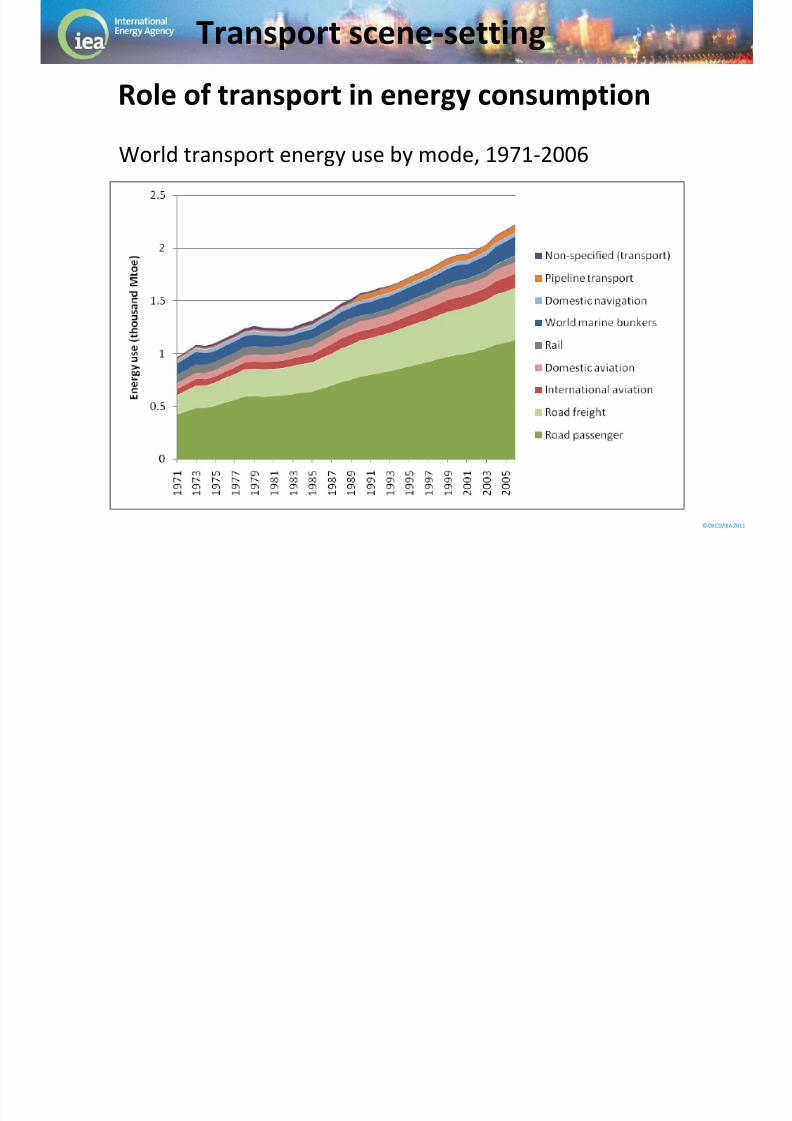
Role of transport in energy consumption
Transport scene-setting
World transport energy use by mode, 1971-2006
8/12/2019 Eficienta Energiei in Transporturi
http://slidepdf.com/reader/full/eficienta-energiei-in-transporturi 12/88© OECD/IEA 201112 12
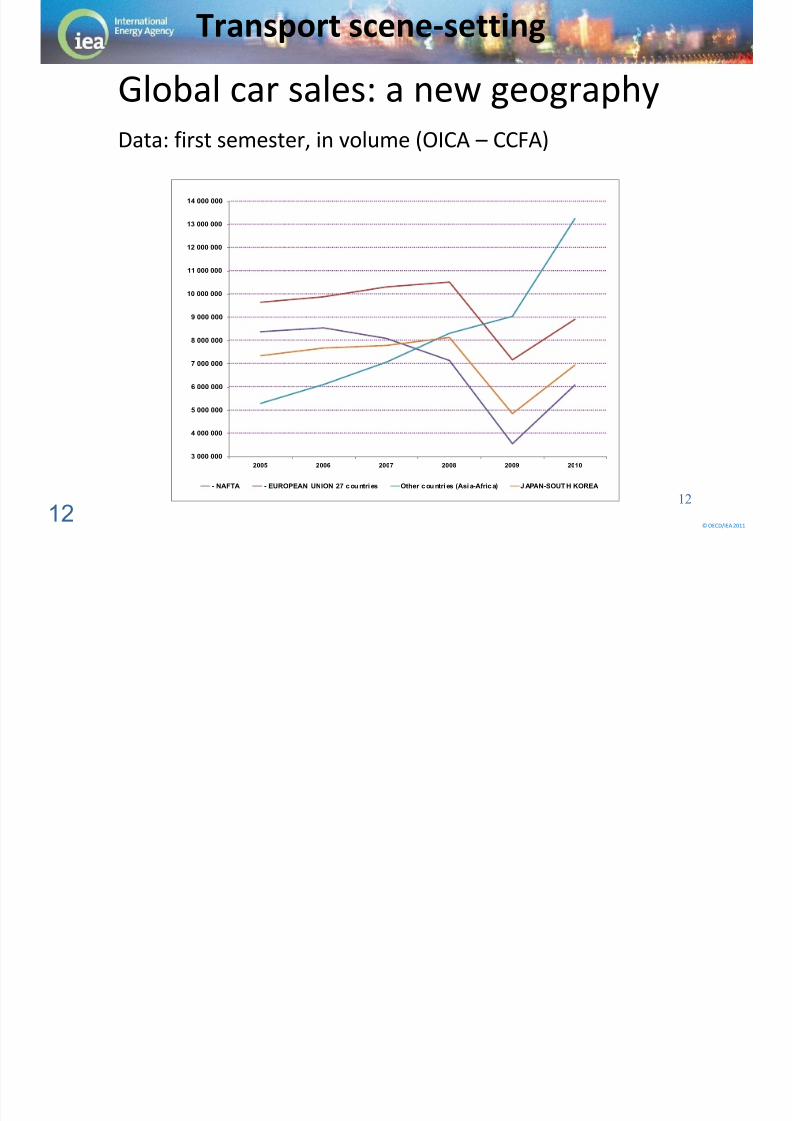
Global car sales: a new geography
Data: first semester, in volume (OICA – CCFA)
3 000 000
4 000 000
5 000 000
6 000 000
7 000 000
8 000 000
9 000 000
10 000 000
11 000 000
12 000 000
13 000 000
14 000 000
2005 2006 2007 2008 2009 2010
- NAFTA - EUROPEAN UNION 27 c ountries Other c ountries (Asia-Afric a) J APAN-SOUTH KOREA
Transport scene-setting

8/12/2019 Eficienta Energiei in Transporturi
http://slidepdf.com/reader/full/eficienta-energiei-in-transporturi 13/88© OECD/IEA 2011
Oil demand is driven higher
by soaring car ownership
Vehicles per 1 000 people in selected markets
The passenger vehicle fleet doubles to 1.7 billion in 2035; most cars are sold
outside the OECD by 2020, making non-OECD policies key to global oil demand
2010
2035
0
100
200
300
400
500
600
700
800
United States European
Union
China India Middle East
8/12/2019 Eficienta Energiei in Transporturi
http://slidepdf.com/reader/full/eficienta-energiei-in-transporturi 14/88© OECD/IEA 2011
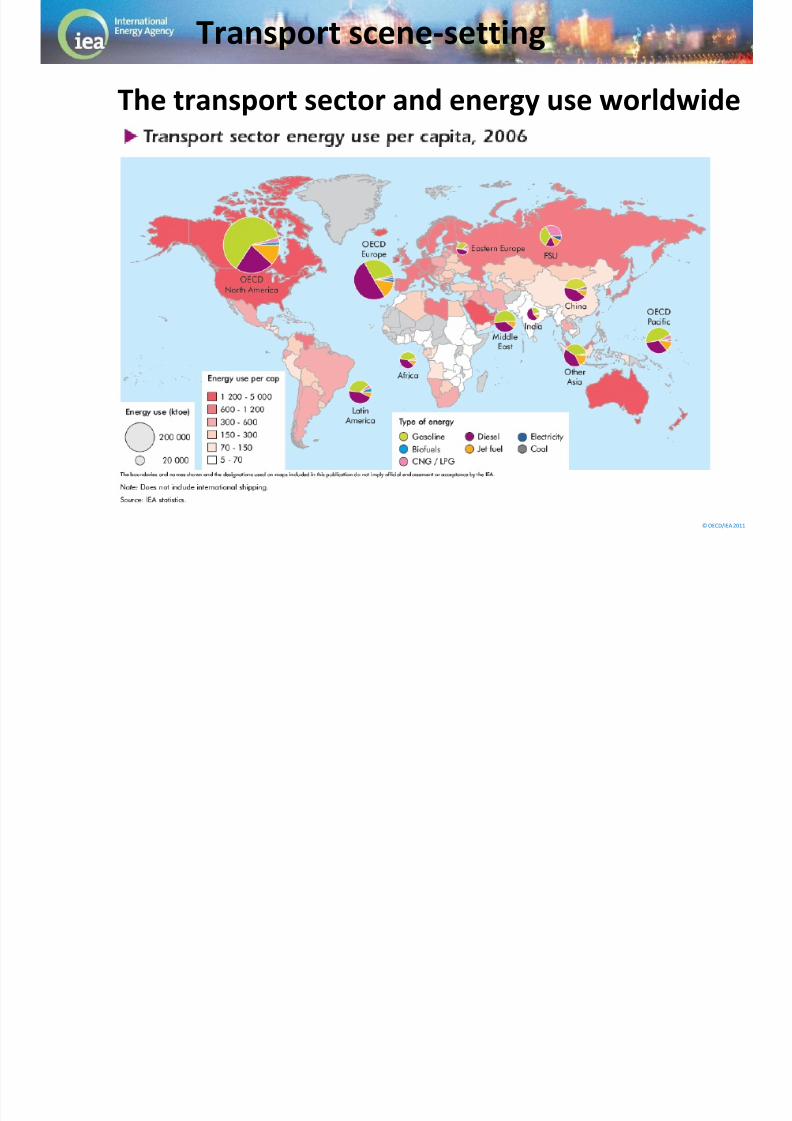
The transport sector and energy use worldwide
Transport scene-setting

8/12/2019 Eficienta Energiei in Transporturi
http://slidepdf.com/reader/full/eficienta-energiei-in-transporturi 15/88© OECD/IEA 2011
Flash survey
• What is the major transport issue presently facing
your country?
• How does it relate to transport energy use?
• Is transport a big consumer of energy (> 20%) in
your country?
Transport scene-setting
8/12/2019 Eficienta Energiei in Transporturi
http://slidepdf.com/reader/full/eficienta-energiei-in-transporturi 16/88© OECD/IEA 2011
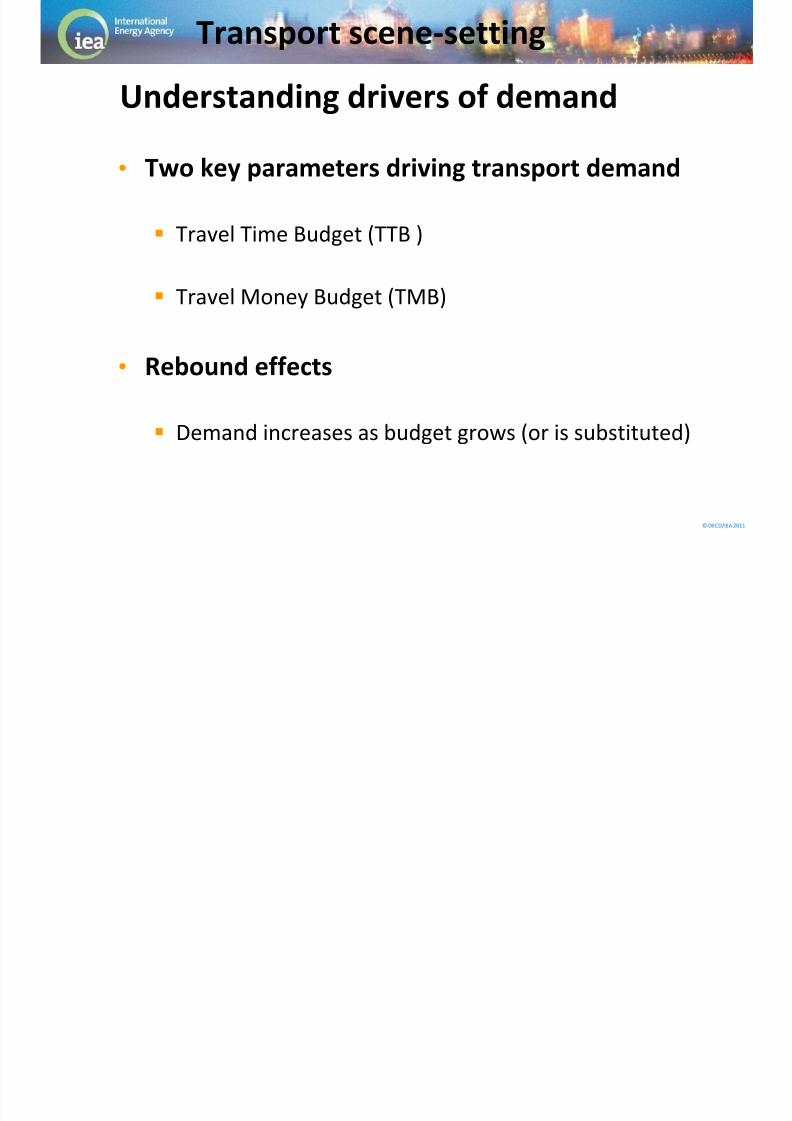
Understanding drivers of demand
• Two key parameters driving transport demand
Travel Time Budget (TTB )
Travel Money Budget (TMB)
•
Rebound effects
Demand increases as budget grows (or is substituted)
Transport scene-setting

8/12/2019 Eficienta Energiei in Transporturi
http://slidepdf.com/reader/full/eficienta-energiei-in-transporturi 17/88© OECD/IEA 2011
Policies for energy efficient transport

8/12/2019 Eficienta Energiei in Transporturi
http://slidepdf.com/reader/full/eficienta-energiei-in-transporturi 18/88© OECD/IEA 2011
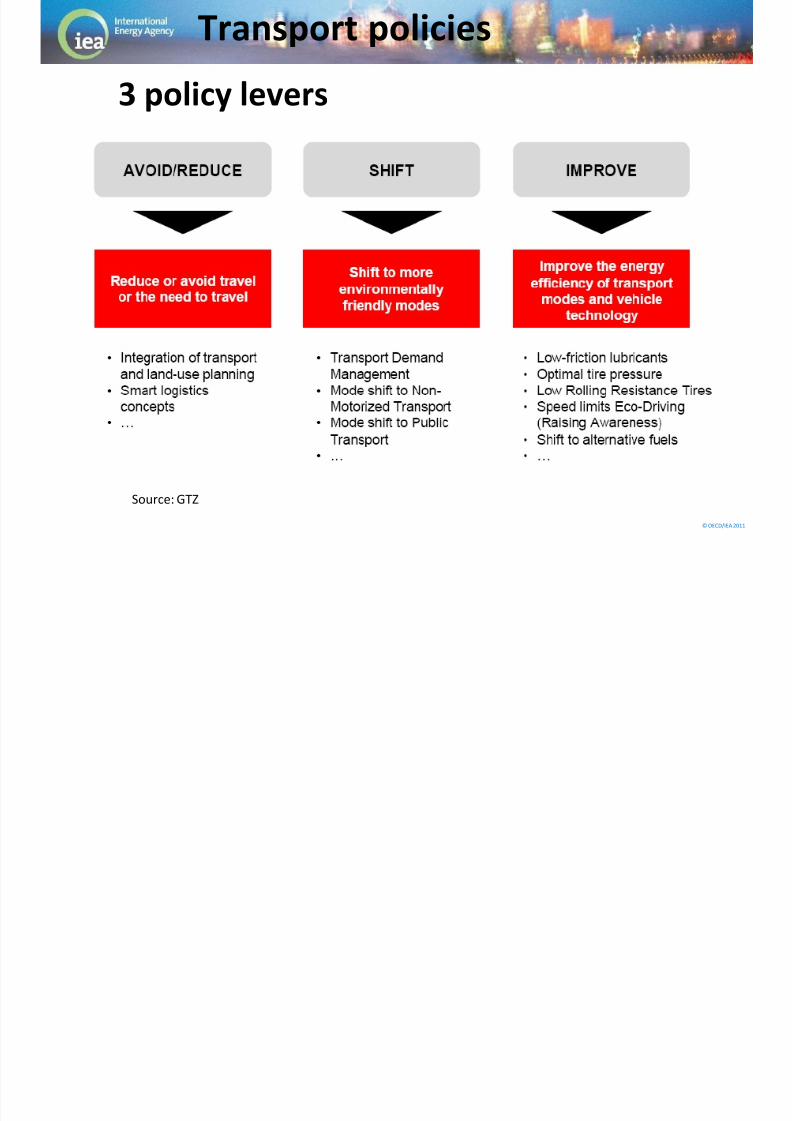
Transport policies
8/12/2019 Eficienta Energiei in Transporturi
http://slidepdf.com/reader/full/eficienta-energiei-in-transporturi 19/88
8/12/2019 Eficienta Energiei in Transporturi
http://slidepdf.com/reader/full/eficienta-energiei-in-transporturi 20/88© OECD/IEA 2011
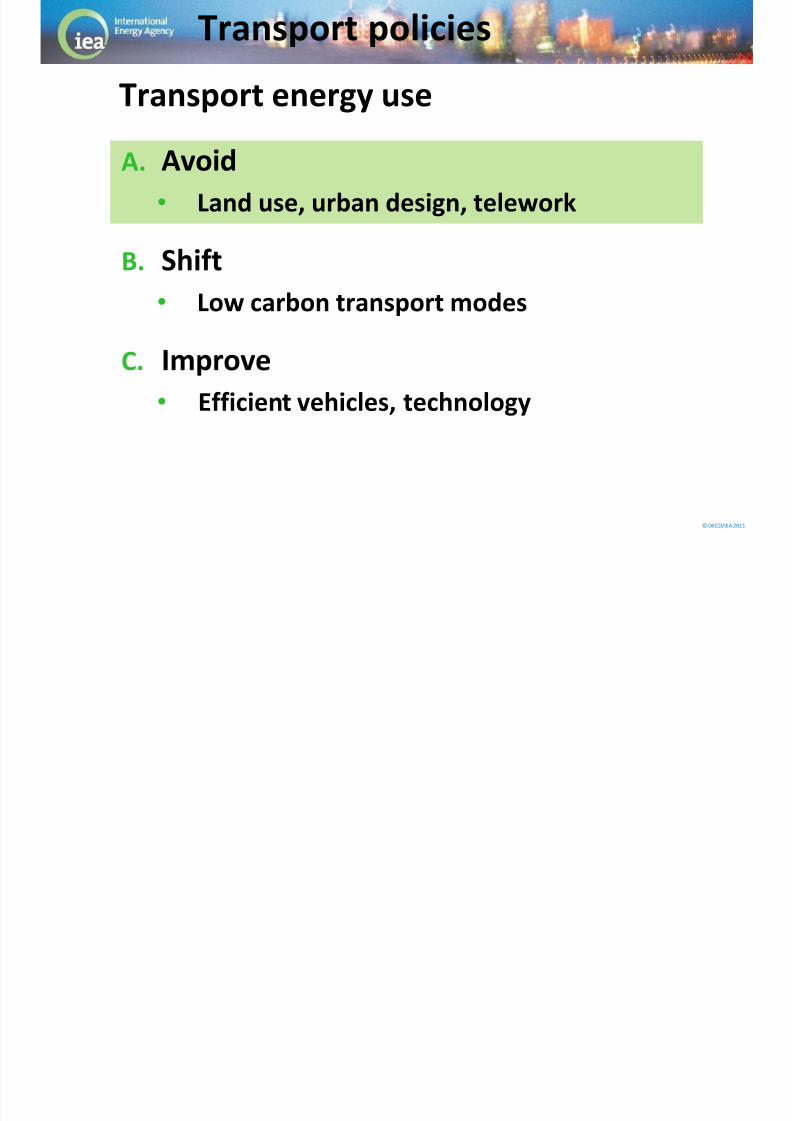
A. Avoid
• Land use, urban design, telework
B. Shift• Low carbon transport modes
C. Improve
• Efficient vehicles, technology
Transport energy use
Transport policies
8/12/2019 Eficienta Energiei in Transporturi
http://slidepdf.com/reader/full/eficienta-energiei-in-transporturi 21/88© OECD/IEA 2011
Avoid transport energy use
• The most energy efficient
trip is the one that is not
performed
Land use planning
Parking policy
Urban design
Transport policies
8/12/2019 Eficienta Energiei in Transporturi
http://slidepdf.com/reader/full/eficienta-energiei-in-transporturi 22/88
© OECD/IEA 2011
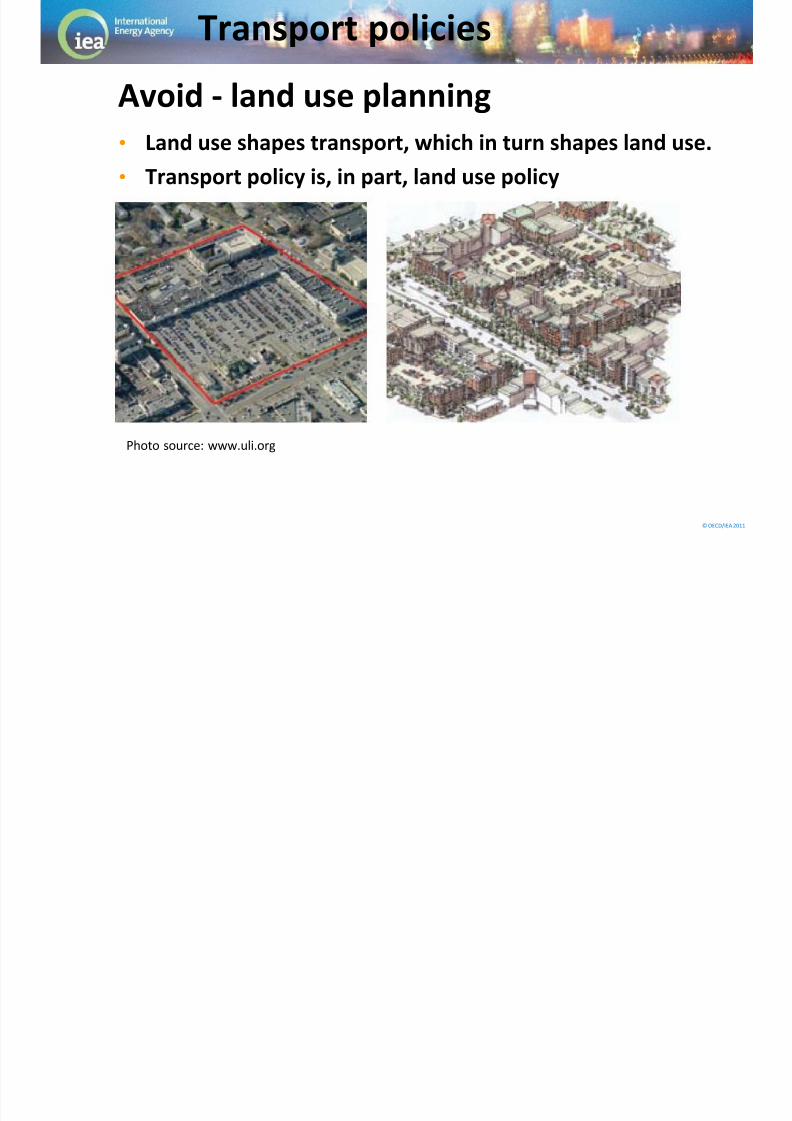
Avoid - land use planning
• Land use shapes transport, which in turn shapes land use.
• Transport policy is, in part, land use policy
Photo source: www.uli.org
Transport policies
8/12/2019 Eficienta Energiei in Transporturi
http://slidepdf.com/reader/full/eficienta-energiei-in-transporturi 23/88
© OECD/IEA 2011
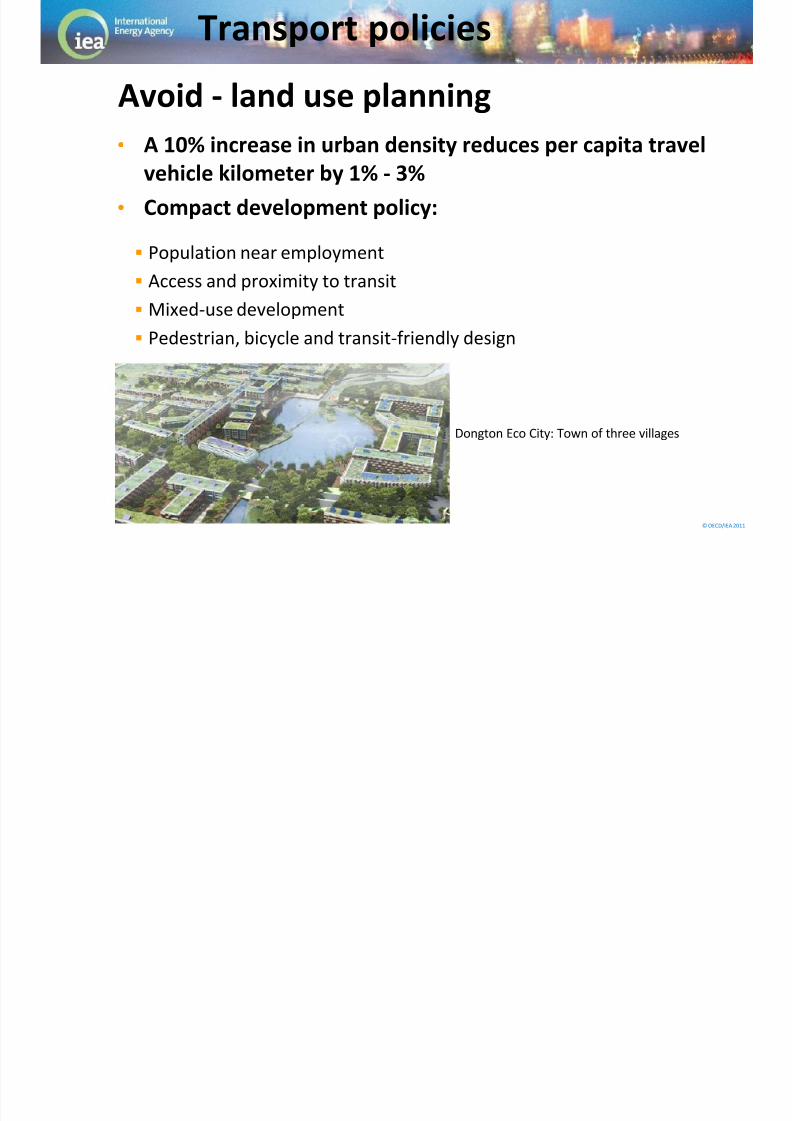
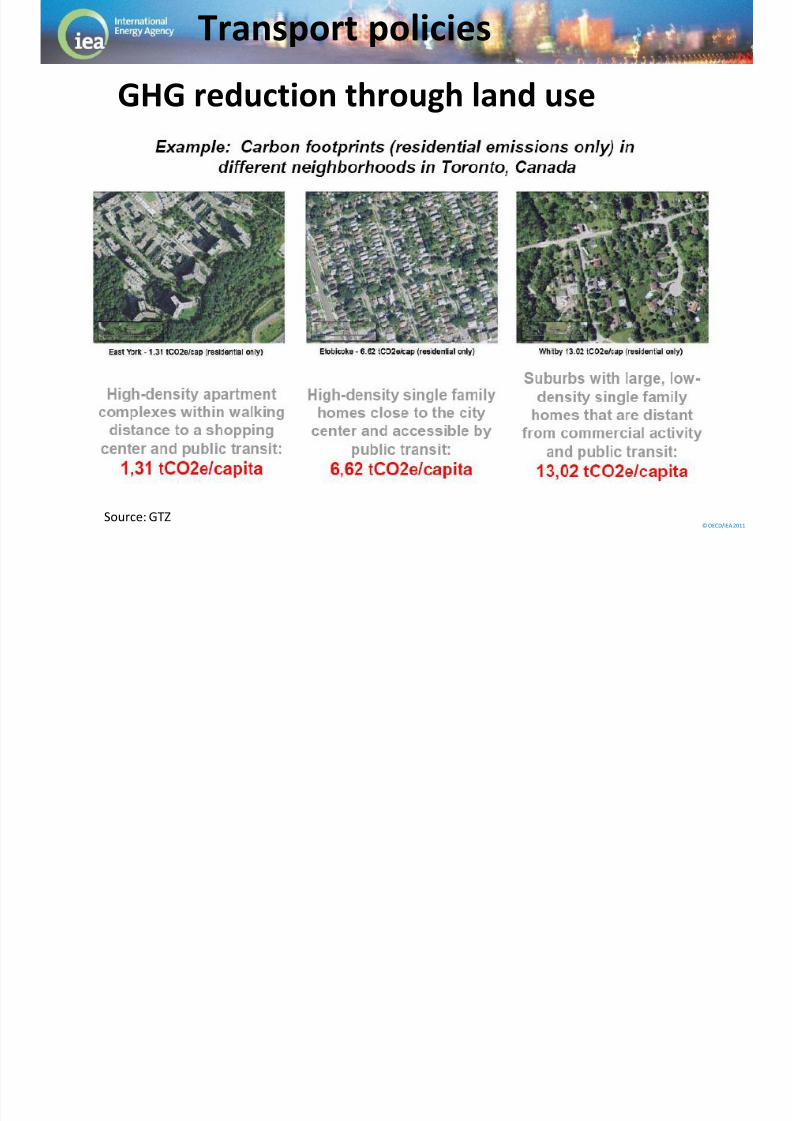
• A 10% increase in urban density reduces per capita travel
vehicle kilometer by 1% - 3%
• Compact development policy:
Population near employment Access and proximity to transit
Mixed-use development
Pedestrian, bicycle and transit-friendly design
Dongton Eco City: Town of three villages
Transport policies
Avoid - land use planning
l
8/12/2019 Eficienta Energiei in Transporturi
http://slidepdf.com/reader/full/eficienta-energiei-in-transporturi 24/88
© OECD/IEA 2011
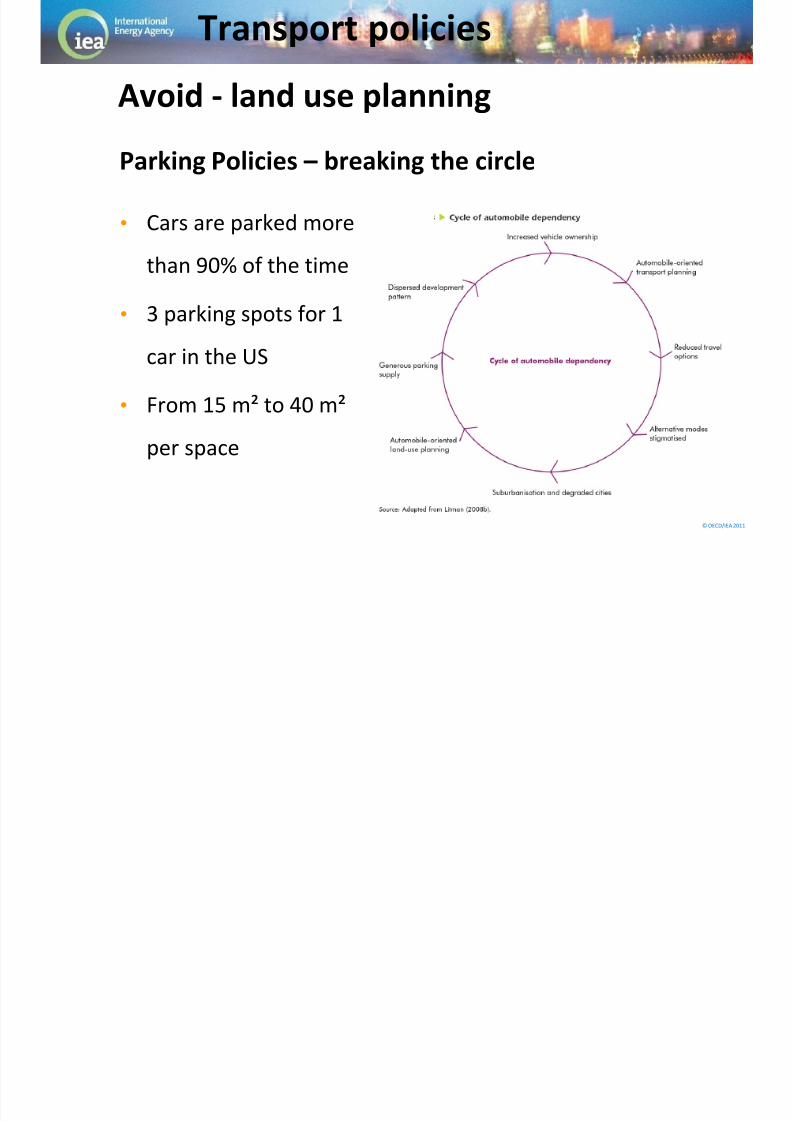
• Cars are parked more
than 90% of the time
• 3 parking spots for 1
car in the US
• From 15 m² to 40 m²
per space
Parking Policies – breaking the circle
Transport policies
Avoid - land use planning
li i
8/12/2019 Eficienta Energiei in Transporturi
http://slidepdf.com/reader/full/eficienta-energiei-in-transporturi 25/88
© OECD/IEA 2011
GHG reduction through land use
Source: GTZ
Transport policies
T li i

8/12/2019 Eficienta Energiei in Transporturi
http://slidepdf.com/reader/full/eficienta-energiei-in-transporturi 26/88
© OECD/IEA 2011
Urban Design Factors Affecting Traffic Activity
• Density (people and/or jobs) • Parking supply & management
• Land-use mix • Walking & cycling conditions
• Regional accessibility • Transit quality & accessibility
• Centeredness • Site design
• Connectivity • Mobility management
• Roadway design & management
Transport policies
Avoid - urban design
T li i
8/12/2019 Eficienta Energiei in Transporturi
http://slidepdf.com/reader/full/eficienta-energiei-in-transporturi 27/88
© OECD/IEA 2011
• One-day telework per week can reduce commuting related
vehicle travel by roughly 20%.
• Local regulations should not inhibit teleworking.
• Marginal cost of vehicle travel is high to justify telework.
• Enabling telecommunication infrastructure.
Transport policies
Avoid - telework (remote commuting)
T li i

8/12/2019 Eficienta Energiei in Transporturi
http://slidepdf.com/reader/full/eficienta-energiei-in-transporturi 28/88
© OECD/IEA 2011
• Building cities from scratch is not often possible
• Timeframe to alter urban design is usually very long
Bigger effects to be seen in the long term
• Dense environments with good transit use less energy
• Energy and GHG savings potential enormous as life
style are altered for generations
Transport policies
Avoid - review
T t li i

8/12/2019 Eficienta Energiei in Transporturi
http://slidepdf.com/reader/full/eficienta-energiei-in-transporturi 29/88
© OECD/IEA 2011
A. Avoid
• Land use, urban design, telework
B. Shift• Low carbon transport modes
C. Improve
• Efficient vehicles, technology
Transport energy use
Transport policies
T t li i
8/12/2019 Eficienta Energiei in Transporturi
http://slidepdf.com/reader/full/eficienta-energiei-in-transporturi 30/88
© OECD/IEA 2011
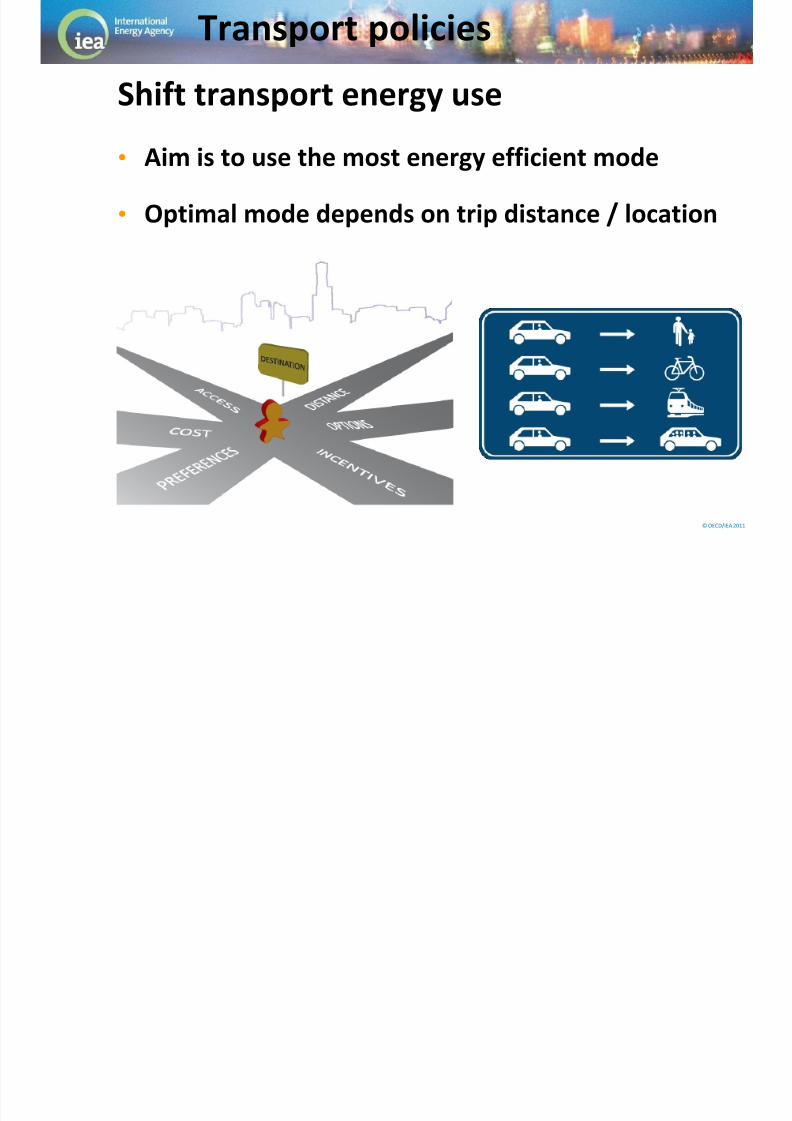
Shift transport energy use
• Aim is to use the most energy efficient mode
• Optimal mode depends on trip distance / location
Transport policies
T t li i
8/12/2019 Eficienta Energiei in Transporturi
http://slidepdf.com/reader/full/eficienta-energiei-in-transporturi 31/88
© OECD/IEA 2011
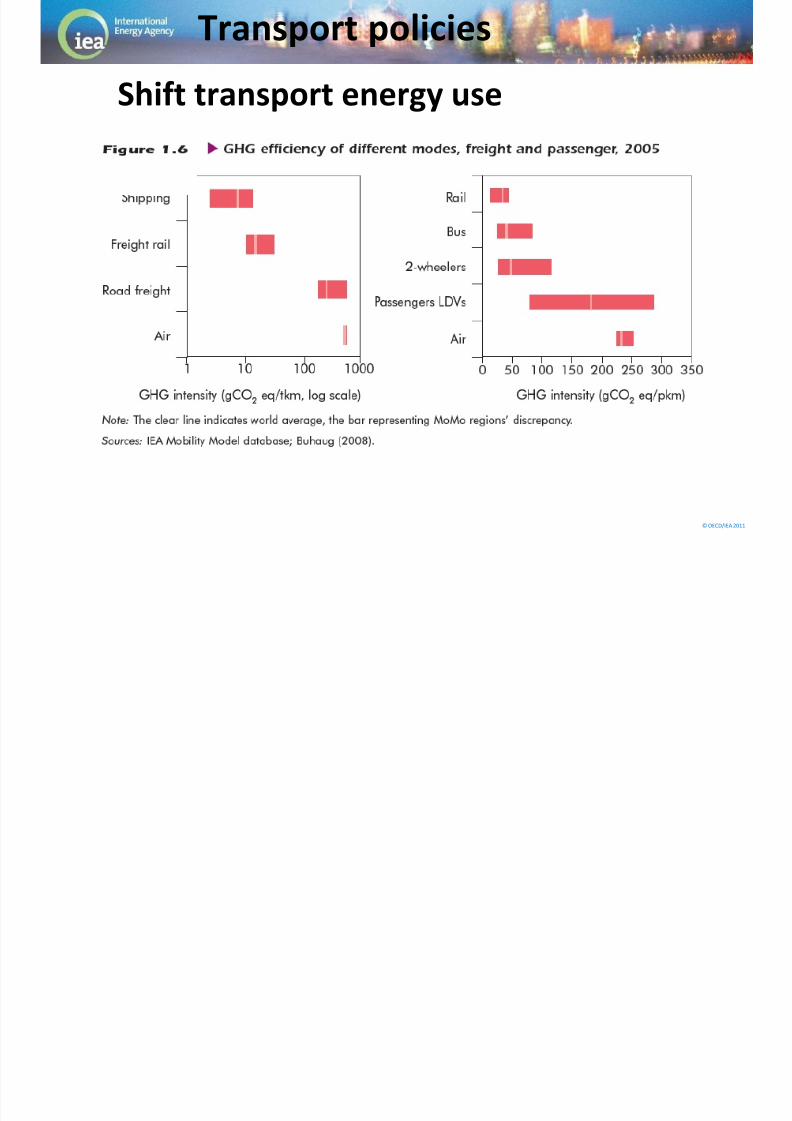
Transport policies
Shift transport energy use
T t li i

8/12/2019 Eficienta Energiei in Transporturi
http://slidepdf.com/reader/full/eficienta-energiei-in-transporturi 32/88
© OECD/IEA 2011
Transport policies
Shift - emissions reduction
T t li i
8/12/2019 Eficienta Energiei in Transporturi
http://slidepdf.com/reader/full/eficienta-energiei-in-transporturi 33/88
© OECD/IEA 2011
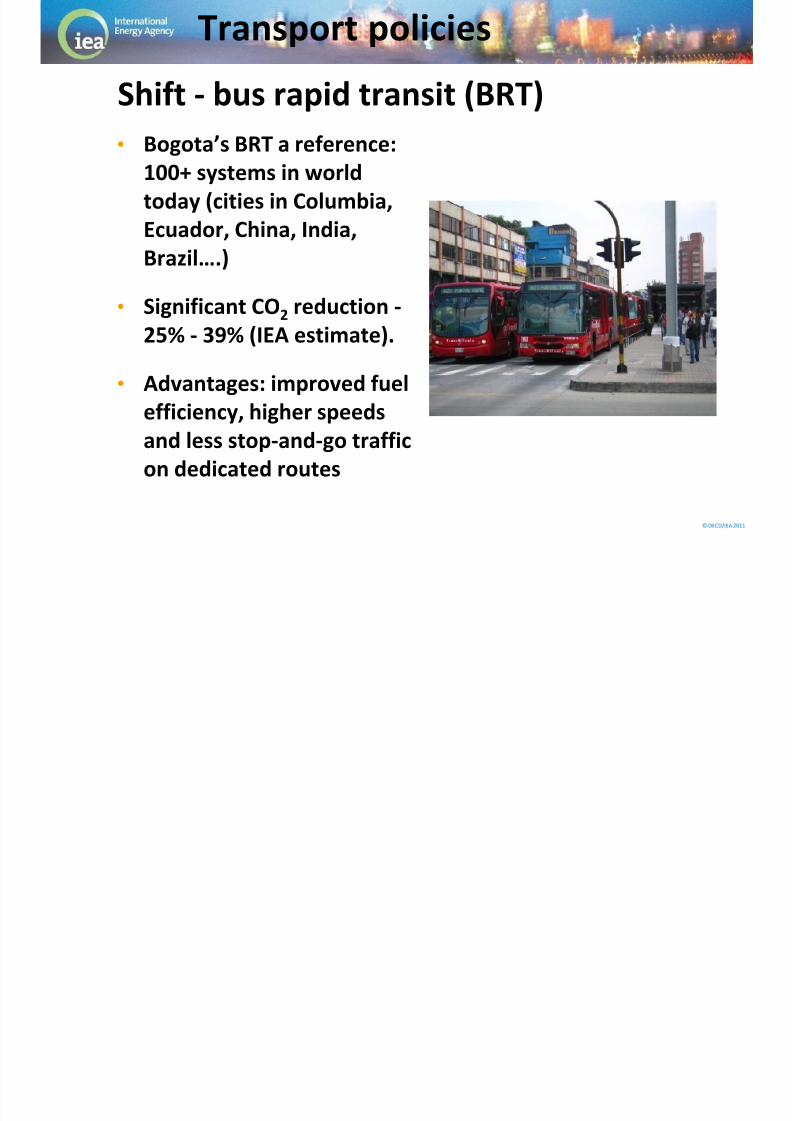
• Bogota’s BRT a reference:
100+ systems in world
today (cities in Columbia,
Ecuador, China, India,
Brazil….)
• Significant CO2 reduction -
25% - 39% (IEA estimate).
• Advantages: improved fuelefficiency, higher speeds
and less stop-and-go traffic
on dedicated routes
Transport policies
Shift - bus rapid transit (BRT)
T t li i

8/12/2019 Eficienta Energiei in Transporturi
http://slidepdf.com/reader/full/eficienta-energiei-in-transporturi 34/88
© OECD/IEA 2011
• HSR is ~15% more efficient
than previous generation
• New high speed rail are
built/planned in manycountries
• Worldwide ~ 37 000 km of
HSR tracks are under
construction or planned(IEA, 2009)
Transport policies
Shift - rail
8/12/2019 Eficienta Energiei in Transporturi
http://slidepdf.com/reader/full/eficienta-energiei-in-transporturi 35/88
Transport policies

8/12/2019 Eficienta Energiei in Transporturi
http://slidepdf.com/reader/full/eficienta-energiei-in-transporturi 36/88
© OECD/IEA 2011
Cycling:
• Infrastructure provisions: lanes,parking, traffic signals
• Funding / cycling mode relationship: Amsterdam: US$ 39/resident, Cycling 35%,
USA: US$ 1.5/resident, Cycling 1%.
• Bicycle “sharing” (rental) services
• Viable alternative for short trips
• Best promoted for densely populatedcity centers
Transport policies
Shift - non-motorised transport (NMT)
Transport policies

8/12/2019 Eficienta Energiei in Transporturi
http://slidepdf.com/reader/full/eficienta-energiei-in-transporturi 37/88
© OECD/IEA 2011
Walking:
• Pedestrian infrastructure, amenitiesand services are often neglected.
• Pedestrian friendly policies: Safe sidewalks
Well marked, respected crossings
Car-free zones
Traffic calming measures
• Walkability Index: modal conflict,security from crime, crossing safety,motorist behavior, benches andstreet lighting, etc.
Transport policies
Shift - NMT
Transport policies
8/12/2019 Eficienta Energiei in Transporturi
http://slidepdf.com/reader/full/eficienta-energiei-in-transporturi 38/88
© OECD/IEA 2011
• Targeted users not necessarily the ones reached
Shifts away from low-emission modes
• More traffic activity generated
Distances rising due to reliable / faster alternative modes
Transport policies
Shift - potential rebound effects
Transport policies

8/12/2019 Eficienta Energiei in Transporturi
http://slidepdf.com/reader/full/eficienta-energiei-in-transporturi 39/88
© OECD/IEA 2011
Discussion
• Does your country have any experience with mode
shifting?
• What barriers do you think exist to achieving
significant mode share?
•
What policies can you implement to achieve shiftsto energy efficient modes?
Transport policies
Transport policies
8/12/2019 Eficienta Energiei in Transporturi
http://slidepdf.com/reader/full/eficienta-energiei-in-transporturi 40/88
© OECD/IEA 2011
A. Avoid
• Land use, urban design, tele-work
B. Shift• Low carbon transport modes
C. Improve
• Efficient vehicles, technology
Transport Energy Use
Transport policies
Transport policies

8/12/2019 Eficienta Energiei in Transporturi
http://slidepdf.com/reader/full/eficienta-energiei-in-transporturi 41/88
© OECD/IEA 2011
Improve transport energy use
• Technology
efficiency policy
Standards
Alternative
technology
Components
• Behavioural policy
Promotion &awareness
Incentives for
cleaner vehicles
Photo source: Schipper et al. 2010
Transport policies
Transport policies
8/12/2019 Eficienta Energiei in Transporturi
http://slidepdf.com/reader/full/eficienta-energiei-in-transporturi 42/88
© OECD/IEA 2011
5.1 Fuel-efficient tyres
Labelling on tyre rolling resistance
Tyre pressure monitoring systems (TPMS)
5.2 Fuel efficiency standards for light-duty vehicles
5.3 Fuel efficiency standards for heavy-duty vehicles
5.4 Eco-driving
Driver training
In-car feedback instruments
Transport policies
Improve - IEA recommendations
Transport policies
8/12/2019 Eficienta Energiei in Transporturi
http://slidepdf.com/reader/full/eficienta-energiei-in-transporturi 43/88
© OECD/IEA 2011
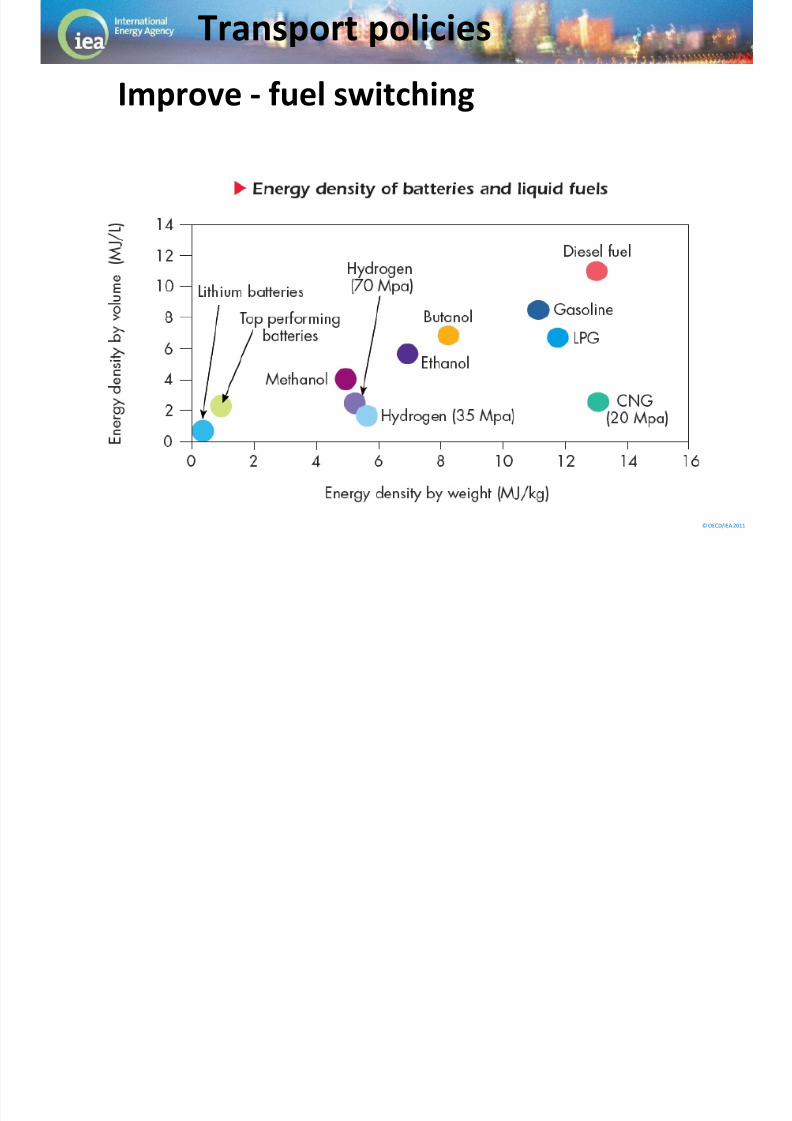
• Fuel switching
• Electric vehicles
• Pricing, subsidies and incentives
Transport policies
Improve - other policy measures
8/12/2019 Eficienta Energiei in Transporturi
http://slidepdf.com/reader/full/eficienta-energiei-in-transporturi 44/88
Transport policies
8/12/2019 Eficienta Energiei in Transporturi
http://slidepdf.com/reader/full/eficienta-energiei-in-transporturi 45/88
© OECD/IEA 2011
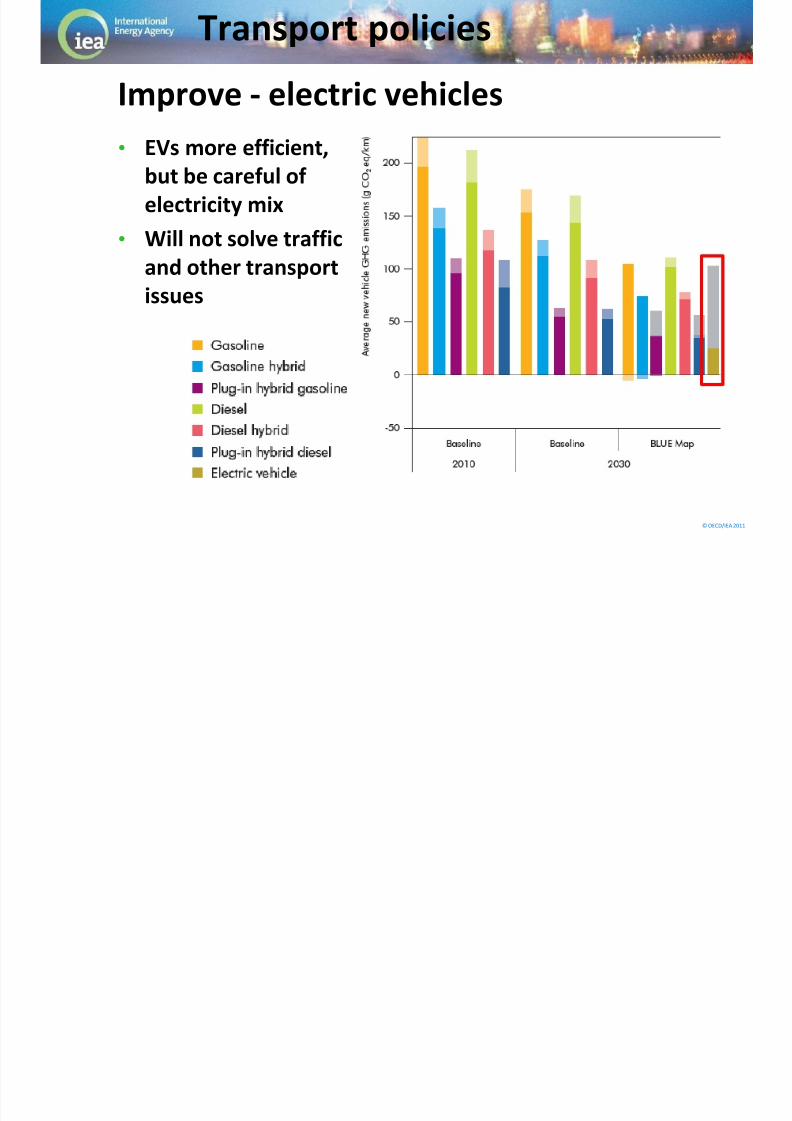
• EVs more efficient,
but be careful of
electricity mix
• Will not solve traffic
and other transport
issues
Transport policies
Improve - electric vehicles
Transport policies
8/12/2019 Eficienta Energiei in Transporturi
http://slidepdf.com/reader/full/eficienta-energiei-in-transporturi 46/88
© OECD/IEA 2011
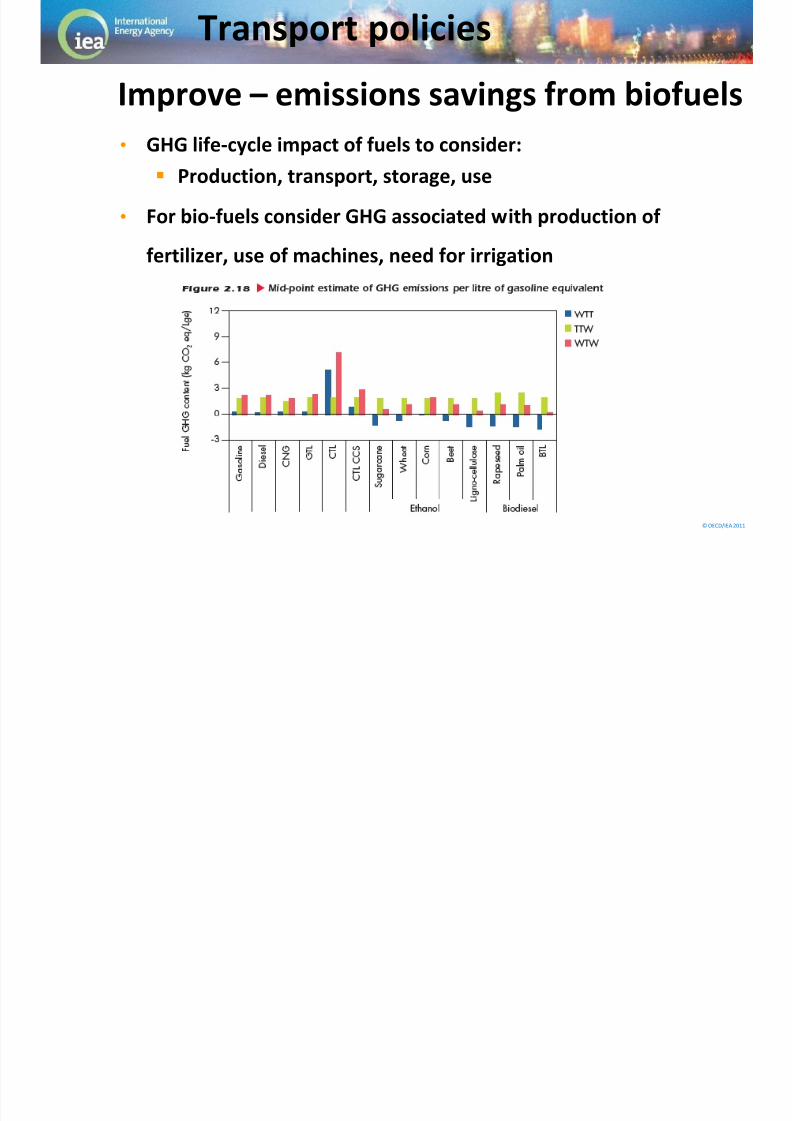
• GHG life-cycle impact of fuels to consider:
Production, transport, storage, use
• For bio-fuels consider GHG associated with production of
fertilizer, use of machines, need for irrigation
Transport policies
Improve – emissions savings from biofuels
Transport policies

8/12/2019 Eficienta Energiei in Transporturi
http://slidepdf.com/reader/full/eficienta-energiei-in-transporturi 47/88
© OECD/IEA 2011
• As cars become more efficient, mileage is rising
Cost of use should rise accordingly
• High up-front costs may lead to willingness to use
vehicles, no matter the cost of use
•
Technological answers have to be implementedwith accompanying measures to counter balance
negative effects
Transport policies
Improve - potential rebound effects
Transport policies
8/12/2019 Eficienta Energiei in Transporturi
http://slidepdf.com/reader/full/eficienta-energiei-in-transporturi 48/88
© OECD/IEA 2011
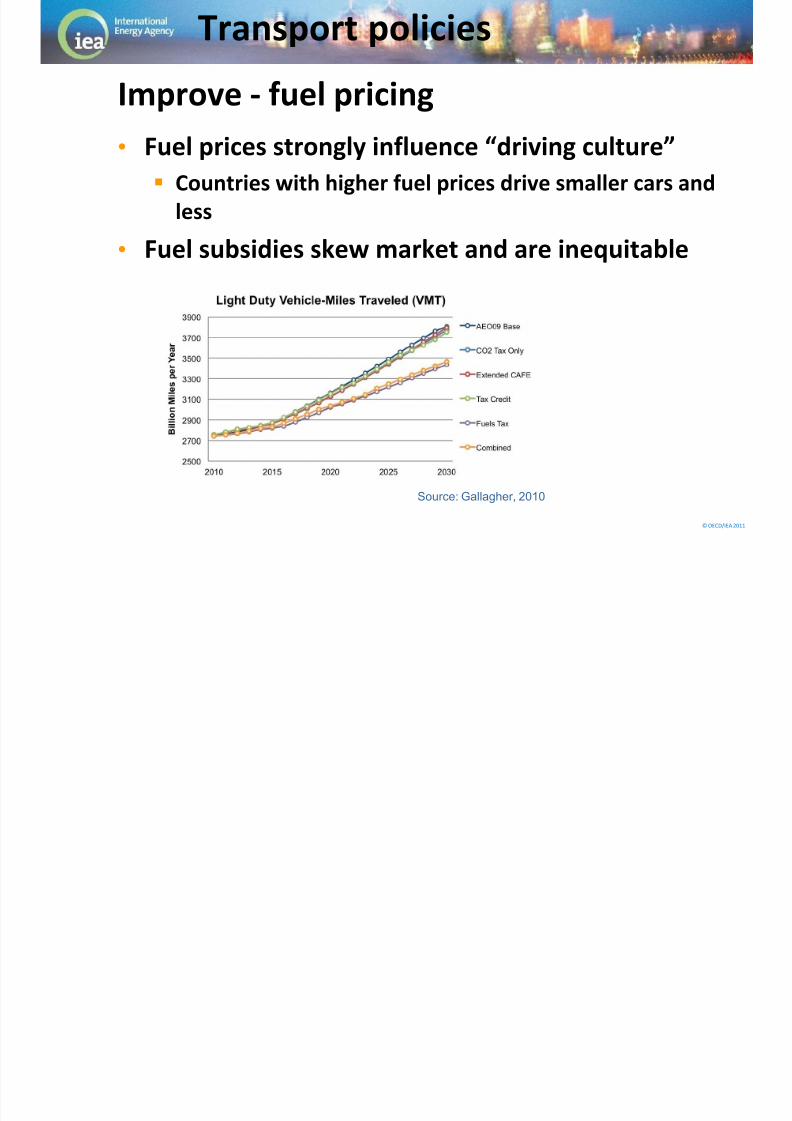
• Fuel prices strongly influence “driving culture”
Countries with higher fuel prices drive smaller cars and
less
•
Fuel subsidies skew market and are inequitable
Source: Gallagher, 2010
Transport policies
Improve - fuel pricing
Transport policies
8/12/2019 Eficienta Energiei in Transporturi
http://slidepdf.com/reader/full/eficienta-energiei-in-transporturi 49/88
© OECD/IEA 2011
• Stockholm congestion charge
Trial 1st Jan – 31st July 2006
Charge differed by time-of-day (€1.10, €1.60, €2.20) and
levied on inward and outward journeys
Many exemptions (ecovehicles, taxis, public transport)
Increase in public transport services (7%) 4 months
before start
Attitudes changed during trial
• London congestion charge Feb 2003-present
Congestion down 25% from pre-charge
Transport policies
Improve – road pricing
Transport policies
8/12/2019 Eficienta Energiei in Transporturi
http://slidepdf.com/reader/full/eficienta-energiei-in-transporturi 50/88
© OECD/IEA 2011
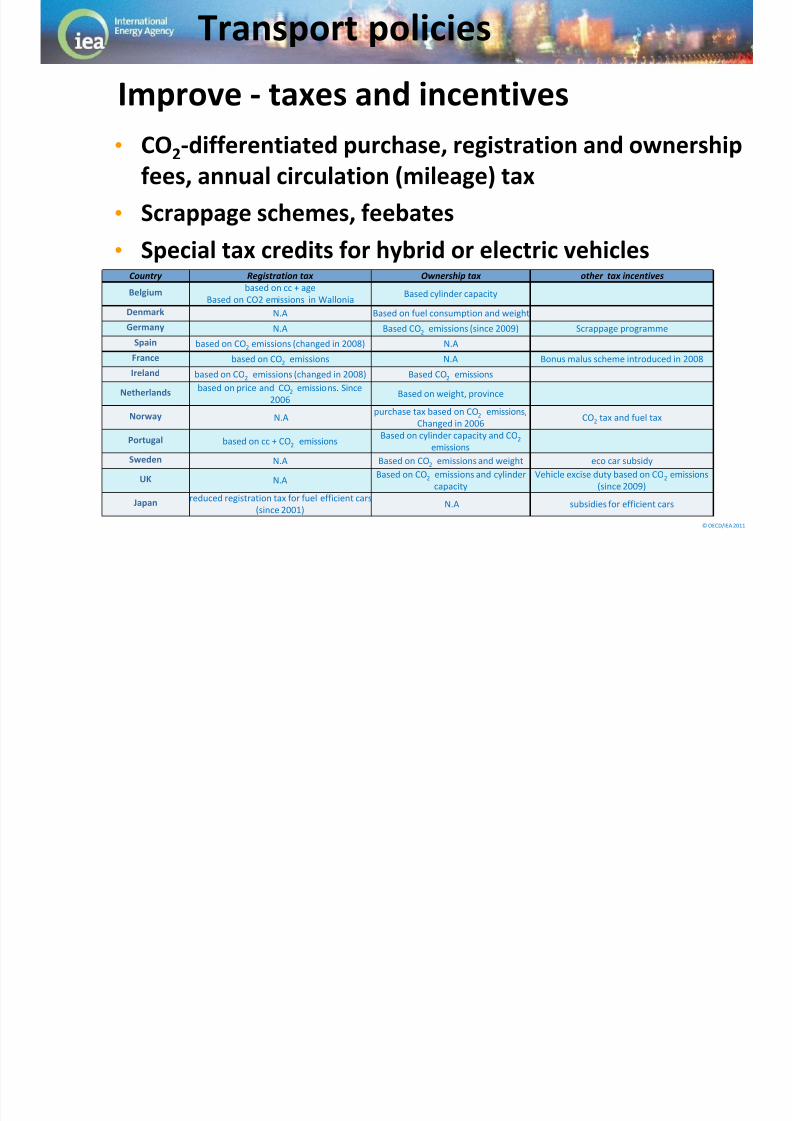
• CO2-differentiated purchase, registration and ownership
fees, annual circulation (mileage) tax
• Scrappage schemes, feebates
•
Special tax credits for hybrid or electric vehiclesCountry Registration tax Ownership tax other tax incentives
Belgiumbased on cc + age
Based on CO2 emissions in WalloniaBased cylinder capacity
Denmark N.A Based on fuel consumption and weight
Germany N.A Based CO2 emissions (since 2009) Scrappage programme
Spain based on CO2 emissions (changed in 2008) N.A
France based on CO2 emissions N.A Bonus malus scheme introduced in 2008
Ireland based on CO2 emissions (changed in 2008) Based CO2 emissions
Netherlandsbased on price and CO2 emissions. Since
2006Based on weight, province
Norway N.Apurchase tax based on CO2 emissions,
Changed in 2006CO2 tax and fuel tax
Portugal based on cc + CO2 emissionsBased on cylinder capacity and CO2
emissions
Sweden N.A Based on CO2 emissions and weight eco car subsidy
UK N.ABased on CO2 emissions and cylinder
capacity
Vehicle excise duty based on CO2 emissions
(since 2009)
Japan
reduced registration tax for fuel efficient cars
(since 2001) N.A subsidies for efficient cars
Transport policies
Improve - taxes and incentives
Transport policies
8/12/2019 Eficienta Energiei in Transporturi
http://slidepdf.com/reader/full/eficienta-energiei-in-transporturi 51/88
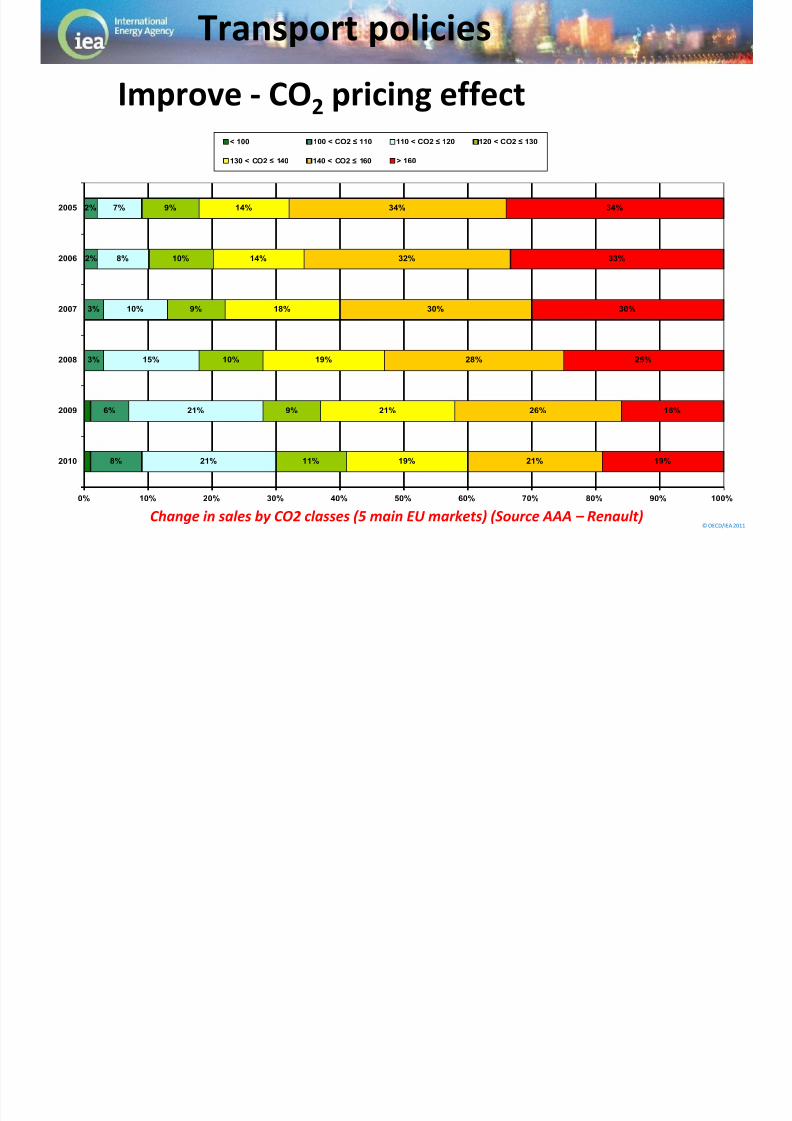
© OECD/IEA 2011Change in sales by CO2 classes (5 main EU markets) (Source AAA – Renault)
2%
3%
3%
6%
8%
7%
8%
10%
15%
21%
21%
9%
10%
9%
10%
9%
11%
14%
14%
18%
19%
21%
19%
34%
32%
30%
28%
26%
21%
34%
33%
30%
25%
16%
19%
2%
0% 10% 20% 30% 40% 50% 60% 70% 80% 90% 100%
2005
2006
2007
2008
2009
2010
< 100 100 < CO2 ≤ 110 110 < CO2 ≤ 120 120 < CO2 ≤ 130
130 < CO2 ≤ 140 140 < CO2 ≤ 160 > 160
Transport policies
Improve - CO2 pricing effect
Transport policies
8/12/2019 Eficienta Energiei in Transporturi
http://slidepdf.com/reader/full/eficienta-energiei-in-transporturi 52/88
© OECD/IEA 2011
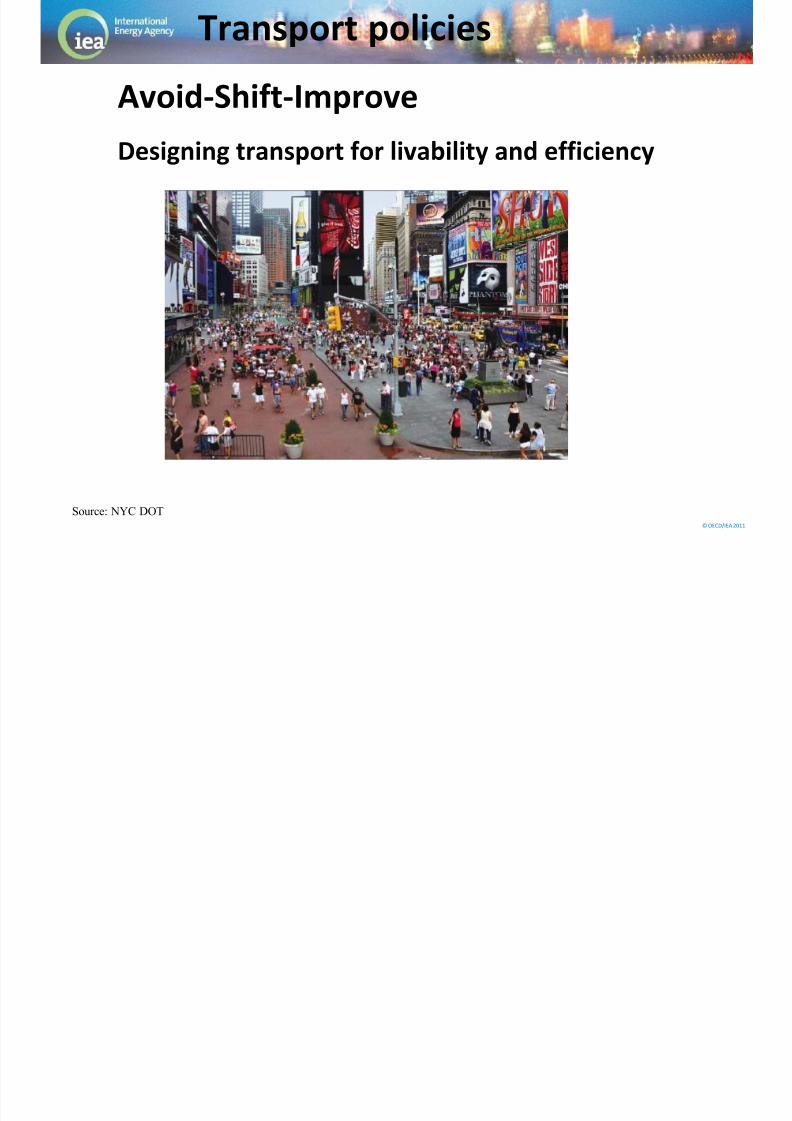
Avoid-Shift-Improve
Source: NYC DOT
Transport policies
Designing transport for livability and efficiency
Transport policies
8/12/2019 Eficienta Energiei in Transporturi
http://slidepdf.com/reader/full/eficienta-energiei-in-transporturi 53/88
© OECD/IEA 2011
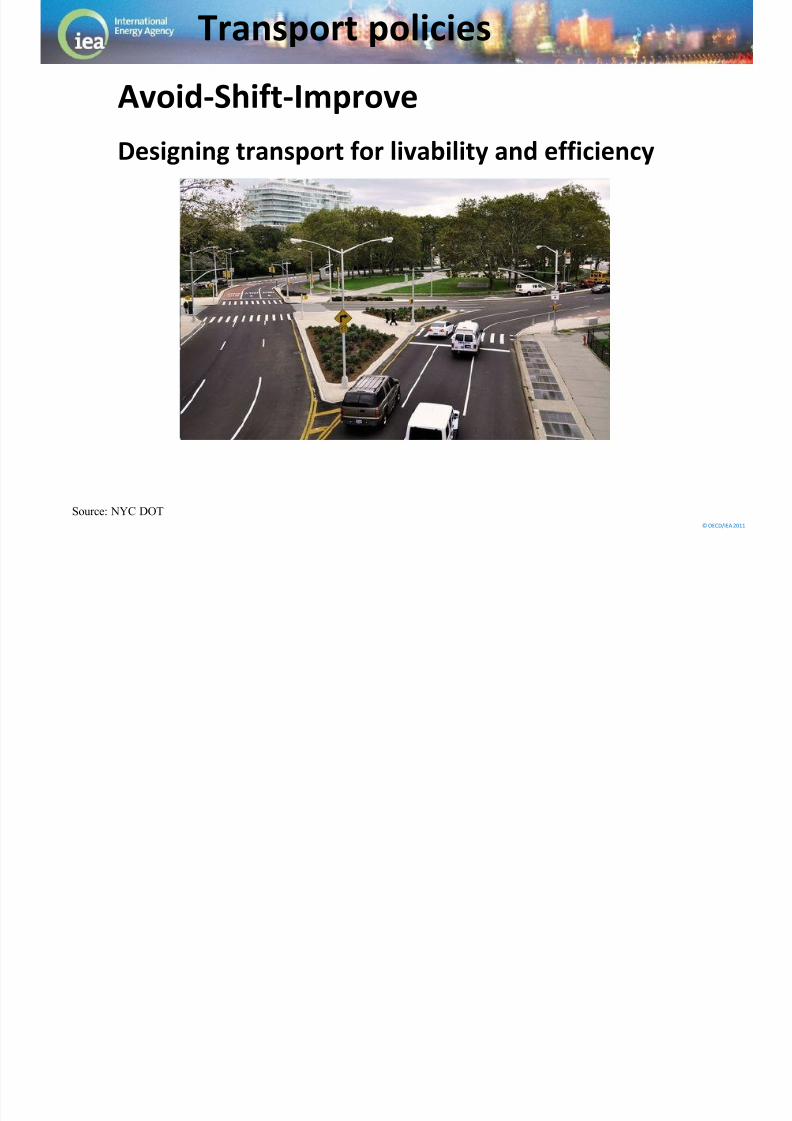
Avoid-Shift-Improve
Source: NYC DOT
Transport policies
Designing transport for livability and efficiency
Transport policies

8/12/2019 Eficienta Energiei in Transporturi
http://slidepdf.com/reader/full/eficienta-energiei-in-transporturi 54/88
© OECD/IEA 2011
Avoid-Shift-Improve: Q&A
Source: GTZ
Transport policies
Transport policies

8/12/2019 Eficienta Energiei in Transporturi
http://slidepdf.com/reader/full/eficienta-energiei-in-transporturi 55/88
© OECD/IEA 2011
More information:
Transport policies

8/12/2019 Eficienta Energiei in Transporturi
http://slidepdf.com/reader/full/eficienta-energiei-in-transporturi 56/88
© OECD/IEA 2012
PART 2: Transport data and Indicators
Francois Cuenot
Energy Technology Perpectives

8/12/2019 Eficienta Energiei in Transporturi
http://slidepdf.com/reader/full/eficienta-energiei-in-transporturi 57/88
© OECD/IEA 2011
To cover today
1. Data and indicators
2. How do we collect and analyse these?
3. Exercise and group discussion
4. Conclusions
8/12/2019 Eficienta Energiei in Transporturi
http://slidepdf.com/reader/full/eficienta-energiei-in-transporturi 58/88
© OECD/IEA 2011
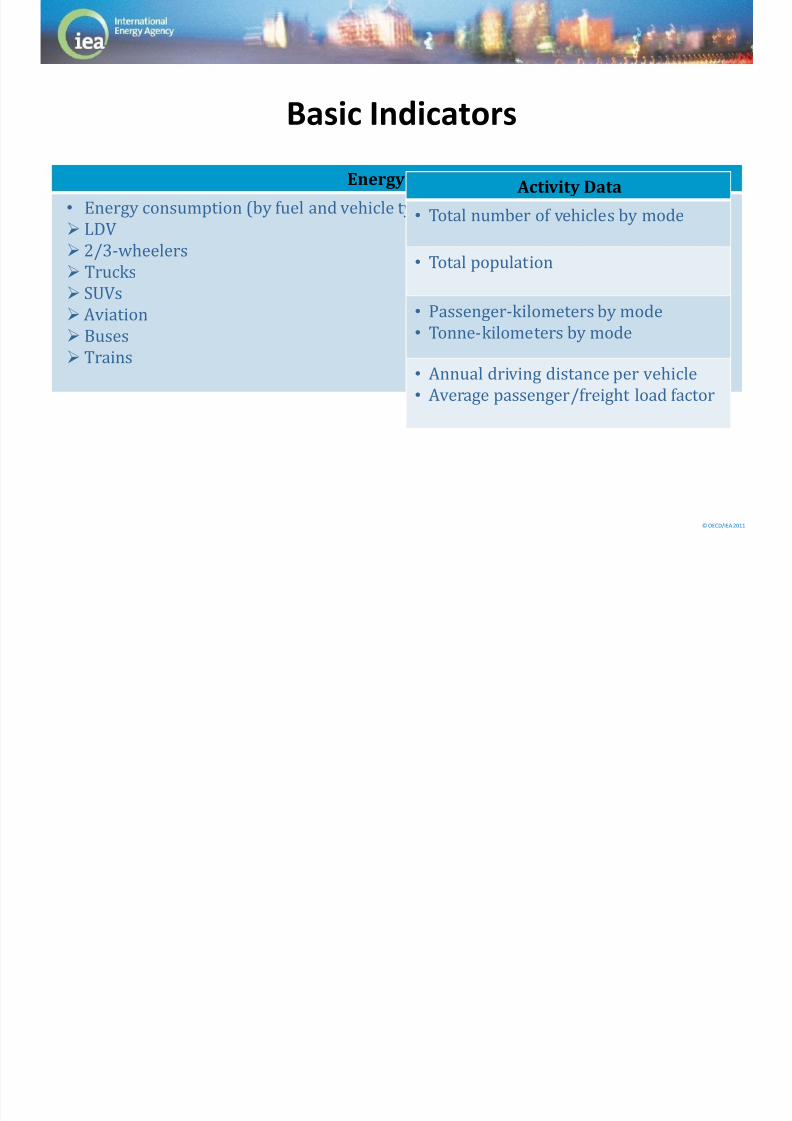
Basic Indicators
Energy Data
• Energy consumption (by fuel and vehicle type):
LDV
2/3-wheelers Trucks
SUVs
Aviation
Buses
Trains
Activity Data
• Total number of vehicles by mode
• Total population
• Passenger-kilometers by mode
• Tonne-kilometers by mode
• Annual driving distance per vehicle
• Average passenger/freight load factor

8/12/2019 Eficienta Energiei in Transporturi
http://slidepdf.com/reader/full/eficienta-energiei-in-transporturi 59/88
© OECD/IEA 2011
Supplementary Indicators
Energy Data
• Specific fuel consumption of new cars (test value)
• Fuel consumption by vehicle size (weight and power)
• Energy consumption relative to driving pattern
Activity Data
• Vehicle size, weight, power
• Travel activity (km) by mode and time
• Travel vs. trip shares
• Travel activity and cost
8/12/2019 Eficienta Energiei in Transporturi
http://slidepdf.com/reader/full/eficienta-energiei-in-transporturi 60/88
© OECD/IEA 2011
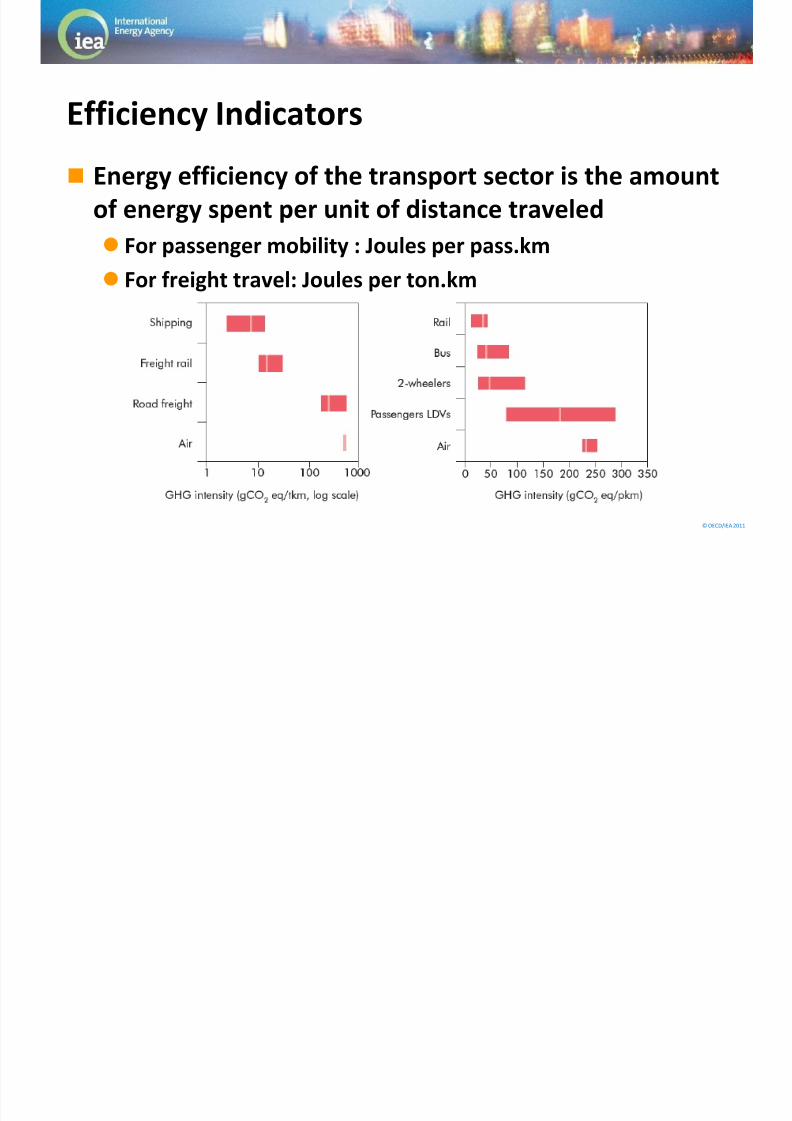
Efficiency Indicators
Energy efficiency of the transport sector is the amount
of energy spent per unit of distance traveled
For passenger mobility : Joules per pass.km
For freight travel: Joules per ton.km

8/12/2019 Eficienta Energiei in Transporturi
http://slidepdf.com/reader/full/eficienta-energiei-in-transporturi 61/88
© OECD/IEA 2011
Link between Energy use
and Traffic activity Vehicle’s fuel consumption allows to check that energy
use and Traffic activity match each other
Load factor links total passenger kilometres to vehiclekilometres (or freight tonne-kms to truck kms)
Energy Use

8/12/2019 Eficienta Energiei in Transporturi
http://slidepdf.com/reader/full/eficienta-energiei-in-transporturi 62/88
© OECD/IEA 2011
Fuel volumes(litres)
- Fuel importers
- Refineries- Fuel station survey
Vehicle Numbers
- Traffic counting
- Odometer reading
(km per vehicle)
Traffic Activity
(veh.km)
Fuel consumtpion
(l/100km)
Traffic Activity
(p.km and t.km)
Load Factor
Survey
Calculation

8/12/2019 Eficienta Energiei in Transporturi
http://slidepdf.com/reader/full/eficienta-energiei-in-transporturi 63/88
© OECD/IEA 2011
THE ASIF FRAMEWORK (by Lee Schipper)
How it all multiplies through to fuel use
= A Si Ii Fi,
Fuel Use and
Emissions from
Transport * * *
Load Factors – service
levels, security, speed
etc
From surveys, not
from new-vehicle
tests
Vehicle characteristics-incomes, new vehicle
taxation, fuel taxation,
culture
Technological energy
efficiency
Traff ic controls, enforcement of
speeding laws, CP and other
means to reduce congestion
I ncome, relative
transport costs,
speeds and service
levels, etcEnergy Use per
passenger km
For Carbon – relaive
fuel prices, carbon
taxes, low carbon fuel
standards
Income, urbanform, overall speed

8/12/2019 Eficienta Energiei in Transporturi
http://slidepdf.com/reader/full/eficienta-energiei-in-transporturi 64/88
© OECD/IEA 2011
To cover today
1. Data and indicators
2. How do we collect and analyse data?
3. Conclusions
8/12/2019 Eficienta Energiei in Transporturi
http://slidepdf.com/reader/full/eficienta-energiei-in-transporturi 65/88
© OECD/IEA 2011
How to Collect the Data?
Surveying
Modeling
Measuring/Metering Administrative Sources
There are four methods used to collect energy and activity data:
8/12/2019 Eficienta Energiei in Transporturi
http://slidepdf.com/reader/full/eficienta-energiei-in-transporturi 66/88
© OECD/IEA 2011
Data collection via surveys
Surveying Data collection via direct observation or questionnaires regarding travel
activities, energy use, etc.
Can be labour intensive, require large sample sizes, etc. Tends to provide estimates, not hard data
Can provide very rich data, useful to understand variations, correlations,
and other aspects of the sample
Examples:
National travel survey
Survey of fleets, trucking companies
Household surveys, focus groups
Observational (e.g. roadside) surveys
8/12/2019 Eficienta Energiei in Transporturi
http://slidepdf.com/reader/full/eficienta-energiei-in-transporturi 67/88
© OECD/IEA 2011
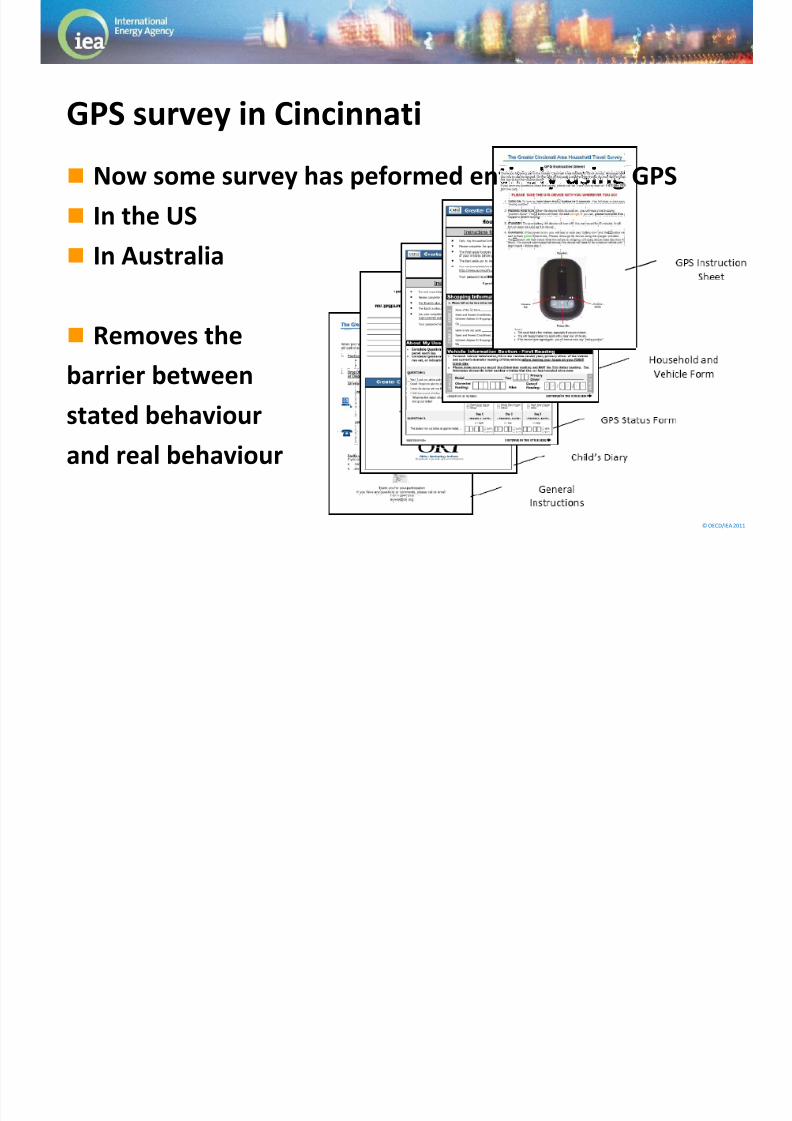
GPS survey in Cincinnati
Now some survey has peformed entirely using GPS
In the US
In Australia
Removes the
barrier betweenstated behaviour
and real behaviour

8/12/2019 Eficienta Energiei in Transporturi
http://slidepdf.com/reader/full/eficienta-energiei-in-transporturi 68/88
© OECD/IEA 2011
Survey Design- GPS Capabilities
Personal GPS units so that all travel, not just vehicle trips, are recorded. Can
be carried in a pocket or purse, or clipped on a belt or a wrist band.
Goal of recording three days of travel.
Every member of the household 13 years
and older carries a GPS unit for
three days.
The GPS devices will be deployed overa one year time period beginning in
July of 2009.
71

8/12/2019 Eficienta Energiei in Transporturi
http://slidepdf.com/reader/full/eficienta-energiei-in-transporturi 69/88
© OECD/IEA 2011
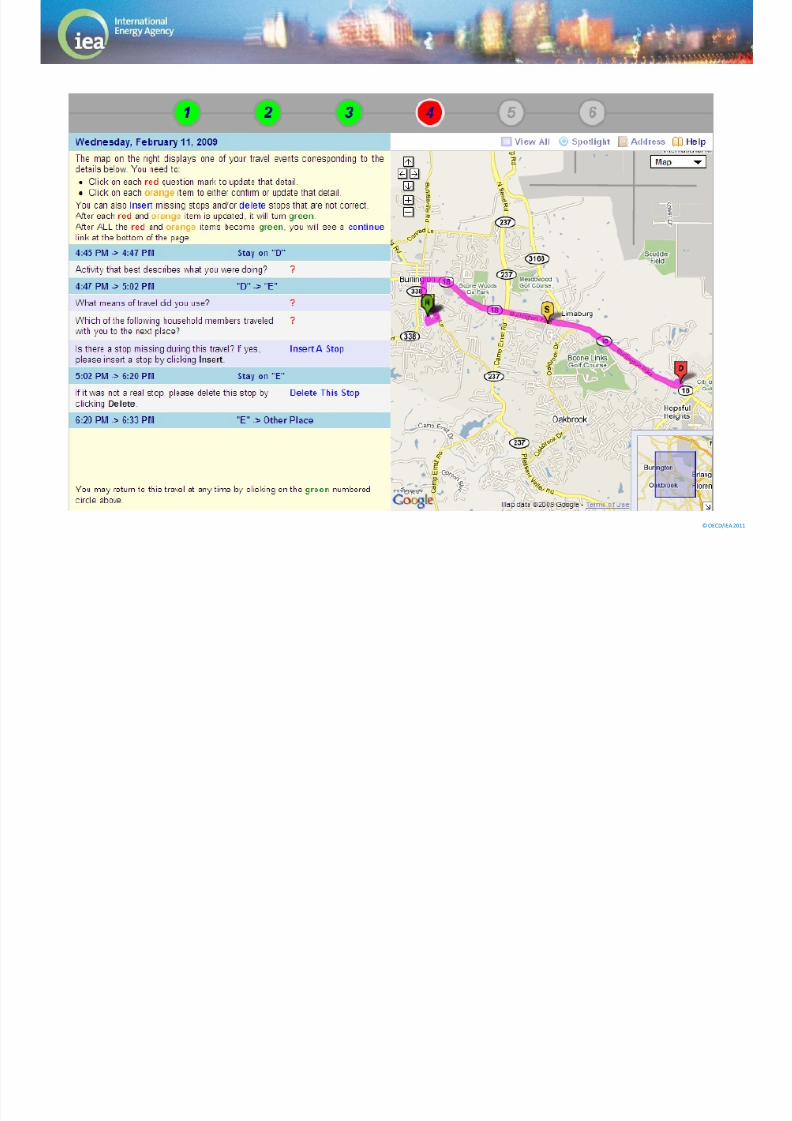
Prompted Recall Web Format
72
8/12/2019 Eficienta Energiei in Transporturi
http://slidepdf.com/reader/full/eficienta-energiei-in-transporturi 70/88
© OECD/IEA 2011
Prompted Recall Web Format
73
8/12/2019 Eficienta Energiei in Transporturi
http://slidepdf.com/reader/full/eficienta-energiei-in-transporturi 71/88
© OECD/IEA 2011
Data collection via modeling
Modelling
Not really collection – but estimation work
Can involve a number of techniques, and can sometimes be
very reliable
Interpolation
Elimination of degrees of freedom
Statistical analysis
Optimization (for normative purposes)
Neural networks
Virtually all projections generate “data” that are really
estimates via modelling
8/12/2019 Eficienta Energiei in Transporturi
http://slidepdf.com/reader/full/eficienta-energiei-in-transporturi 72/88
© OECD/IEA 2011
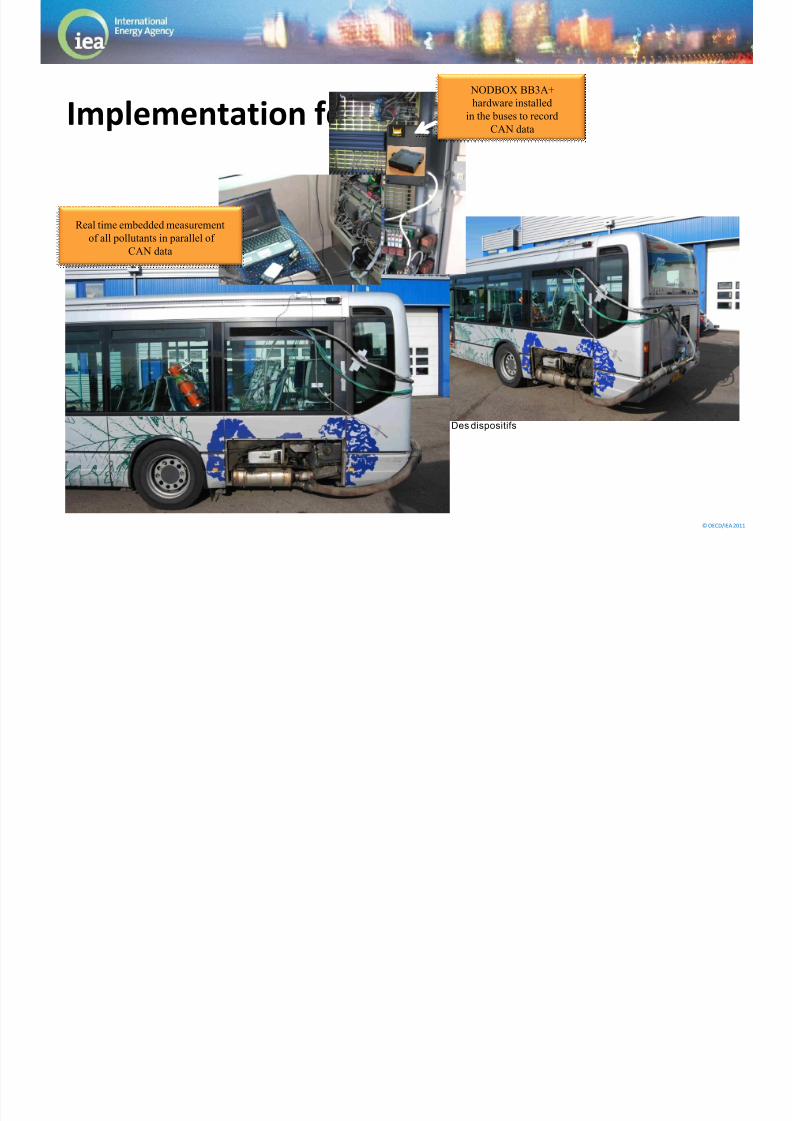
Implementation for learning phase
Des dispositifs
NODBOX BB3A+
hardware installed
in the buses to record
CAN data
Real time embedded measurement
of all pollutants in parallel of
CAN data
Neural network learning phase
8/12/2019 Eficienta Energiei in Transporturi
http://slidepdf.com/reader/full/eficienta-energiei-in-transporturi 73/88
© OECD/IEA 2011
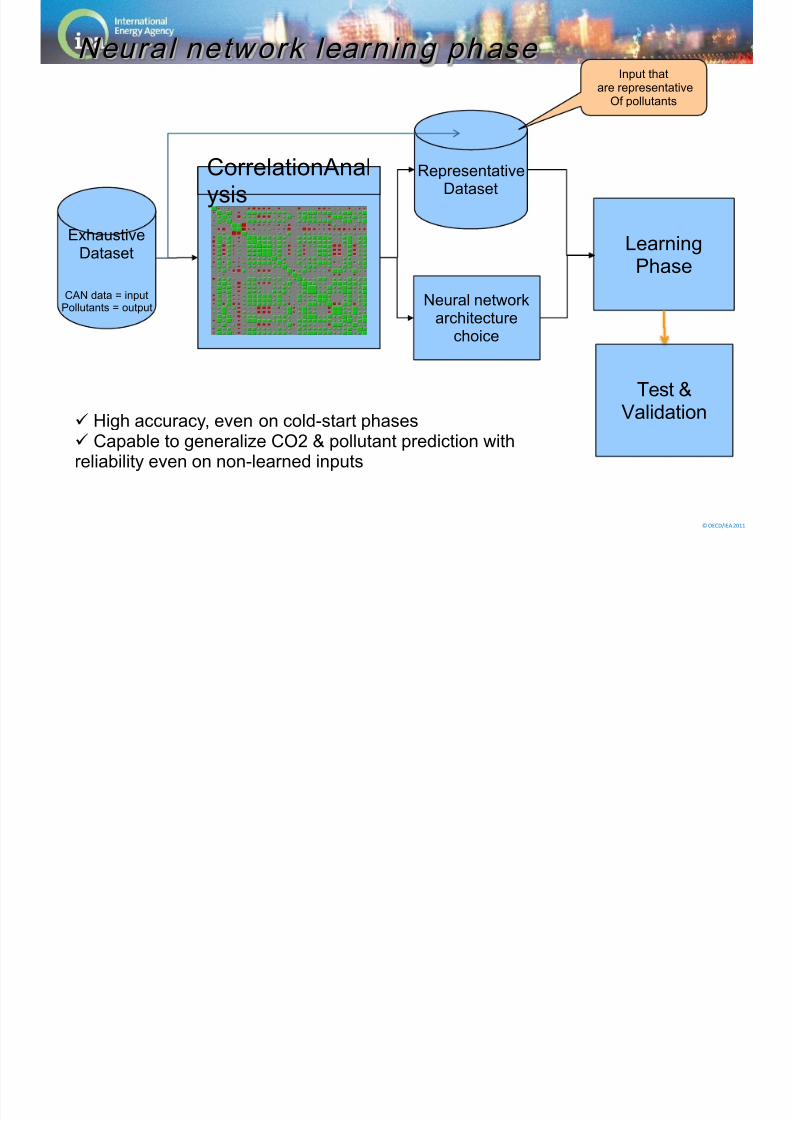
Neural network learning phase
Exhaustive
Dataset
CAN data = inputPollutants = output
CorrelationAnalysis
RepresentativeDataset
Input thatare representative
Of pollutants
Neural networkarchitecture
choice
Learning
Phase
Test &Validation
High accuracy, even on cold-start phases Capable to generalize CO2 & pollutant prediction withreliability even on non-learned inputs
8/12/2019 Eficienta Energiei in Transporturi
http://slidepdf.com/reader/full/eficienta-energiei-in-transporturi 74/88
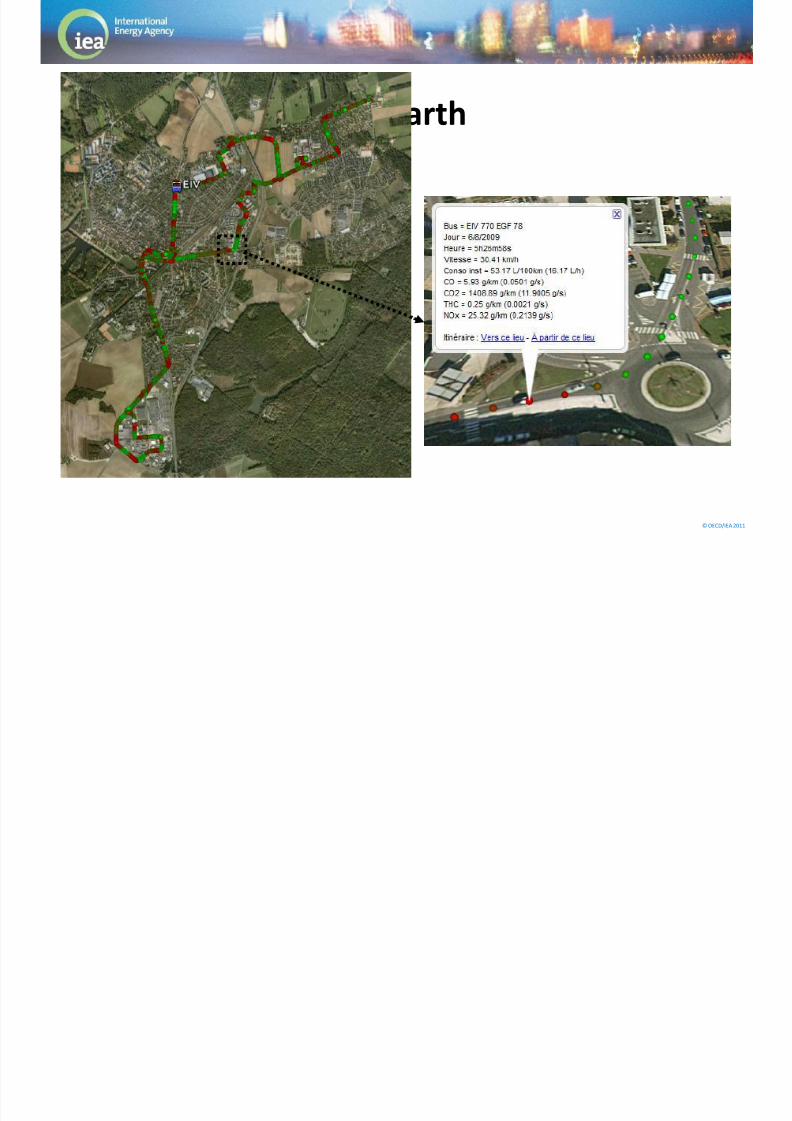
© OECD/IEA 2011
Restitution in Google Earth

8/12/2019 Eficienta Energiei in Transporturi
http://slidepdf.com/reader/full/eficienta-energiei-in-transporturi 75/88
© OECD/IEA 2011
Data collection via measuring / metering
Measuring / Metering Direct observation, usually of a physical phenomenon
Can use existing metering systems or involve creating new ones
Roadside car counters
Vehicle fuel economy testing
Car fuel economy computers (in use performance)
Tailpipe emissions detection systems
Speed detection systems
Atmospheric concentration metering
Typically reliable but often expensive
Sample size and data processing requirements will affect this
Can deliver only certain types of information

8/12/2019 Eficienta Energiei in Transporturi
http://slidepdf.com/reader/full/eficienta-energiei-in-transporturi 76/88
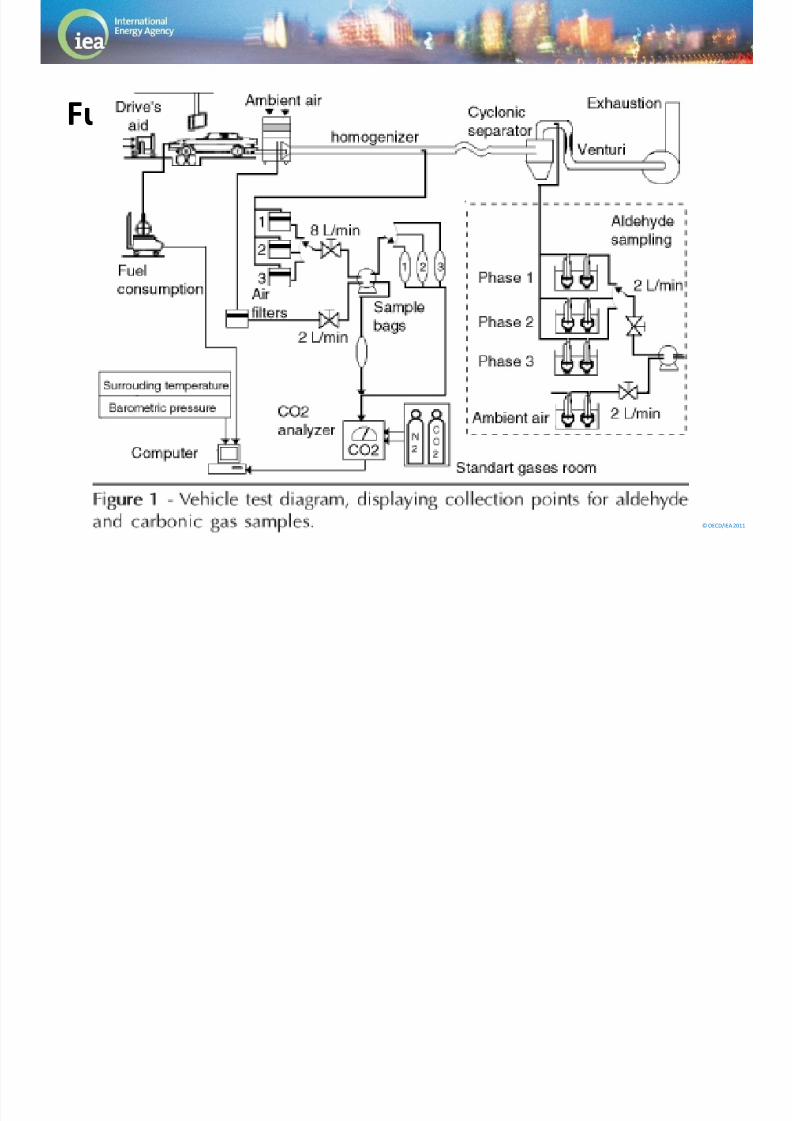
© OECD/IEA 2011
Fuel economy measurement
Vehicle are tested on similar test cylce within a given
country
8/12/2019 Eficienta Energiei in Transporturi
http://slidepdf.com/reader/full/eficienta-energiei-in-transporturi 77/88
© OECD/IEA 2011
Fuel economy measurement
Data collection via Administrative Sources
8/12/2019 Eficienta Energiei in Transporturi
http://slidepdf.com/reader/full/eficienta-energiei-in-transporturi 78/88
© OECD/IEA 2011
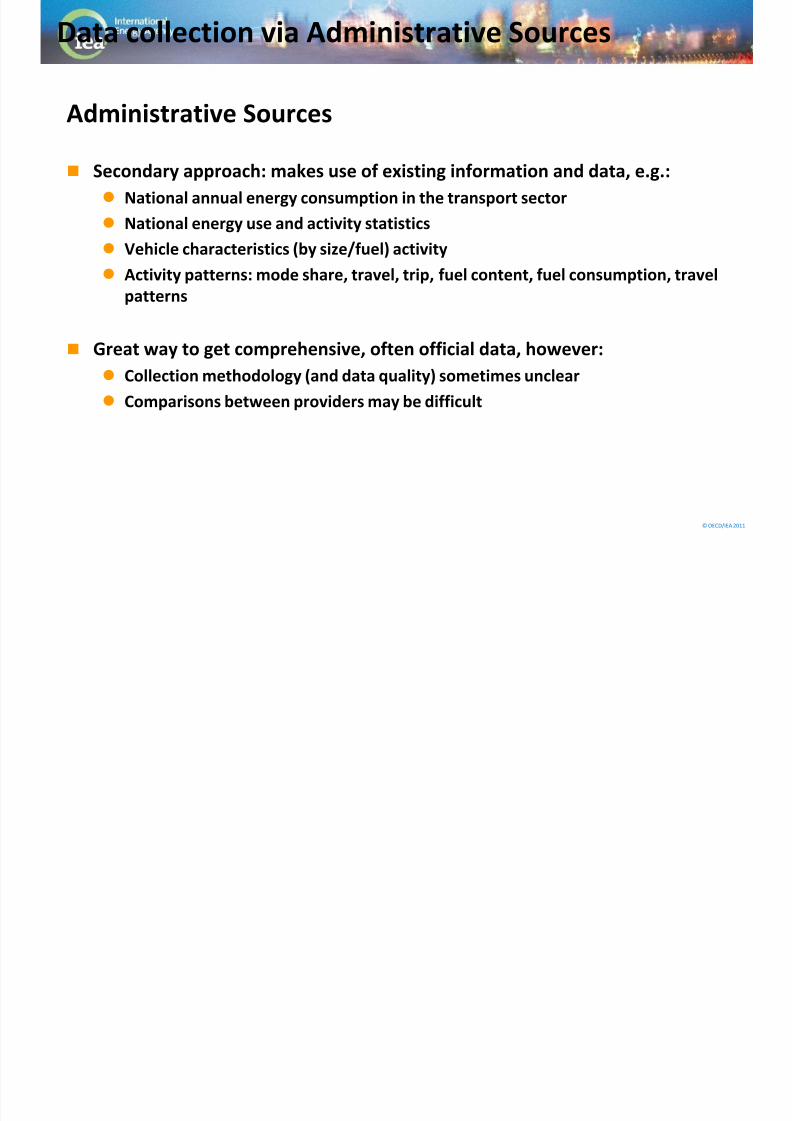
Administrative Sources
Secondary approach: makes use of existing information and data, e.g.:
National annual energy consumption in the transport sector
National energy use and activity statistics
Vehicle characteristics (by size/fuel) activity
Activity patterns: mode share, travel, trip, fuel content, fuel consumption, travel
patterns
Great way to get comprehensive, often official data, however:
Collection methodology (and data quality) sometimes unclear
Comparisons between providers may be difficult
Administrative sources

8/12/2019 Eficienta Energiei in Transporturi
http://slidepdf.com/reader/full/eficienta-energiei-in-transporturi 79/88
© OECD/IEA 2011
Sources typically used for the administrative data
Government statistical office
Manufacturers
National or international associations and organizations
Energy companies
Others
8/12/2019 Eficienta Energiei in Transporturi
http://slidepdf.com/reader/full/eficienta-energiei-in-transporturi 80/88
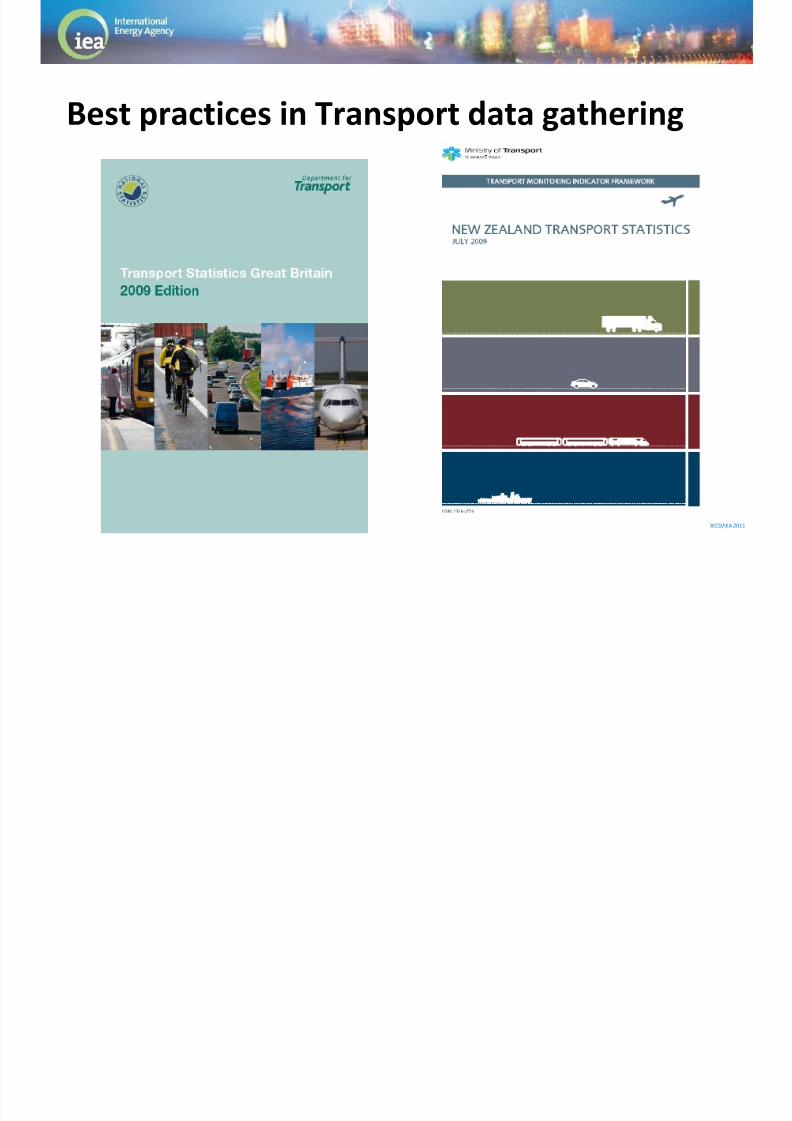
© OECD/IEA 2011
Best practices in Transport data gathering

8/12/2019 Eficienta Energiei in Transporturi
http://slidepdf.com/reader/full/eficienta-energiei-in-transporturi 81/88
© OECD/IEA 2011
Best Practices - Highlights
Yearly update
All data publically available
Comprehensive time series available Detailed information on modes, by fuel type
Scrappage functions
Used import info (NZ) Vehicle technical information
Regional details

8/12/2019 Eficienta Energiei in Transporturi
http://slidepdf.com/reader/full/eficienta-energiei-in-transporturi 82/88
© OECD/IEA 2011
Ideal Data requirement vs
Data availability: Russian ExampleData need to develop indicators IEA countries
coverage
Data
available
from Russia
Energy consumption by: - Energy source 25 No
- Transportation mode 21 No
o Cars, SUV and personal light trucks 22 No
o Motorcycles and three-wheelers 10 No
o Buses 22 No
o Passenger train 24 No
o Domestic passenger airplane 23 No
o Domestic passenger ships 5 No
Passenger-kilometres by: 20 ?
o Cars, SUV and personal light trucks 26 No
o
Motorcycles and three-wheelers 6 Noo Buses 23 YES

8/12/2019 Eficienta Energiei in Transporturi
http://slidepdf.com/reader/full/eficienta-energiei-in-transporturi 83/88
© OECD/IEA 2011
Ideal Data requirement vs
Data availability in RussiaData need to develop indicators IEA
countries
coverage
Data
available
from Russia
Vehicle Kilometres by: No
o Cars, SUV and personal light trucks 23 No
o Motorcycles and three-wheelers 11 No
o Buses 19 No
o Passenger train 2 No
o
Domestic passenger airplane 3 Noo Domestic passenger ships 1 No
Vehicle stocks by:
o Cars, SUV and personal light trucks 26 No
o Motorcycles and three-wheelers 24 Yes From MVD
o Buses 25 YES
8/12/2019 Eficienta Energiei in Transporturi
http://slidepdf.com/reader/full/eficienta-energiei-in-transporturi 84/88
© OECD/IEA 2011
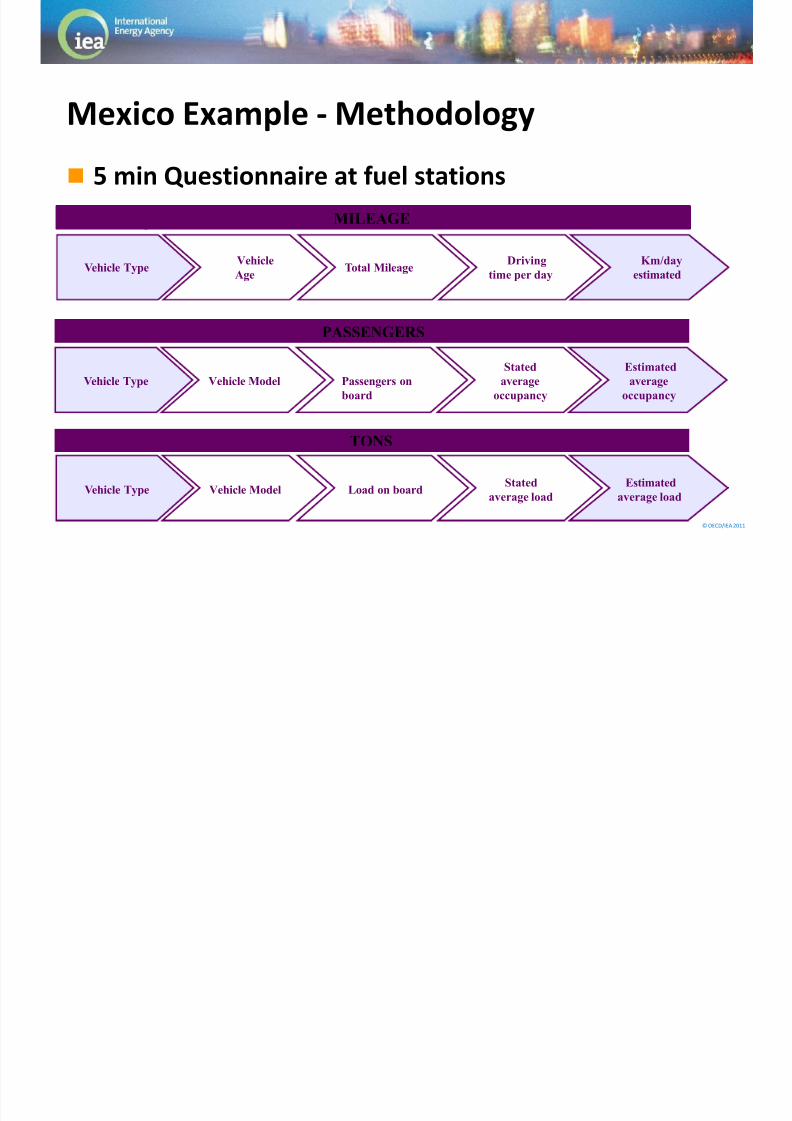
Mexico Example - Methodology
5 min Questionnaire at fuel stations
Sample size : 545 fuel stations 26265 vehicles
Vehicle Type Total MileageVehicleAge
Drivingtime per day
Km/dayestimated
MILEAGE
TONS
Vehicle Type Passengers on
board
Vehicle Model
Stated
average
occupancy
Estimated
average
occupancy
PASSENGERS
Vehicle Type Load on boardVehicle ModelStated
average load
Estimated
average load

8/12/2019 Eficienta Energiei in Transporturi
http://slidepdf.com/reader/full/eficienta-energiei-in-transporturi 85/88
8/12/2019 Eficienta Energiei in Transporturi
http://slidepdf.com/reader/full/eficienta-energiei-in-transporturi 86/88
© OECD/IEA 2011
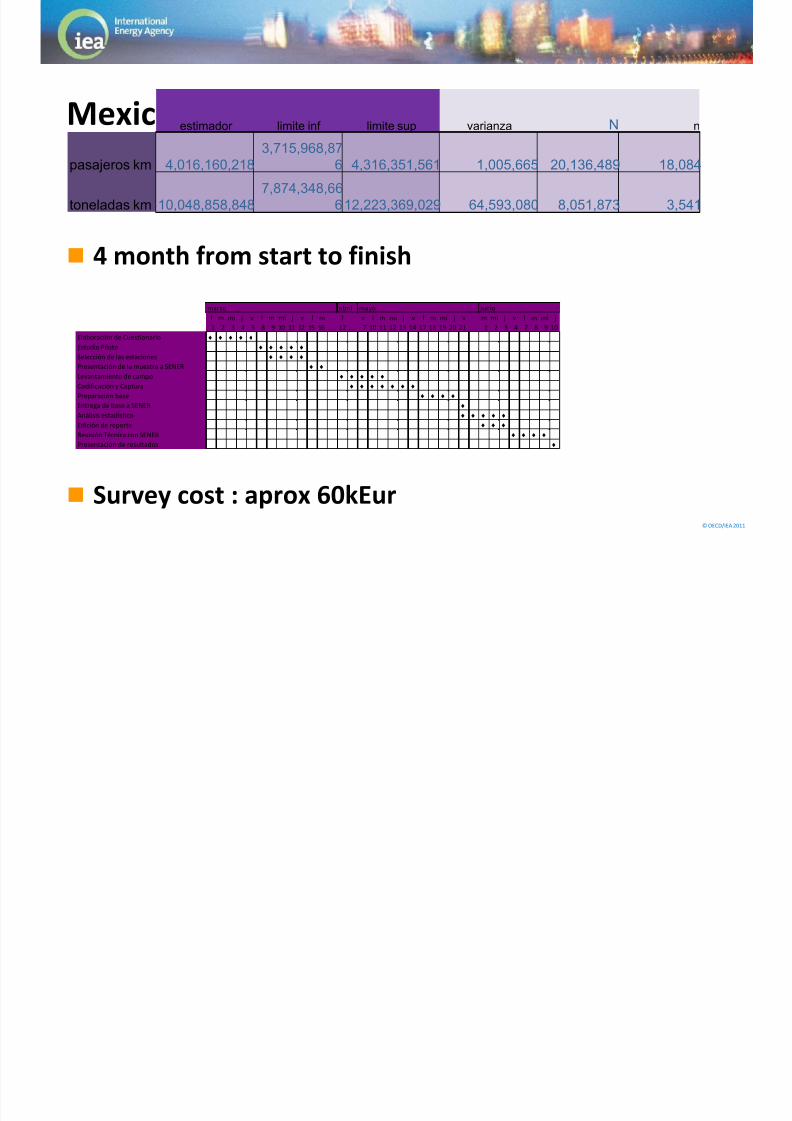
Mexico Example - Results
4 month from start to finish
Survey cost : aprox 60kEur
estimador limite inf limite sup varianza N n
pasajeros km 4,016,160,218
3,715,968,87
6 4,316,351,561 1,005,665 20,136,489 18,084
toneladas km 10,048,858,848
7,874,348,66
6 12,223,369,029 64,593,080 8,051,873 3,541
marzo abril mayo junio
l m mi j v l m mi j v l m l v l m mi j v l m mi j v m mi j v l m mi j
1 2 3 4 5 8 9 10 11 12 15 16 …. 12 …. 7 10 11 12 13 14 17 18 19 20 21 …. 1 2 3 4 7 8 9 10
Elaboración de Cuestionario
Estudio Piloto
Selección de las estaciones
Presentación de la muestra a SENER
Levantamiento de campo
Codificación y Captura
Preparación base
Entrega de base a SENER
Análisis estadístico
Edición de reporte
Revisión Técnica con SENER
Presentación de resultados
8/12/2019 Eficienta Energiei in Transporturi
http://slidepdf.com/reader/full/eficienta-energiei-in-transporturi 87/88
© OECD/IEA 2011
Improving Data collection
More accurate mileage data
Odometer reading during vehicle inspection?
Using diaries or follow-up to get:
Other modes trips information
Fuel consumption
distance by mode Travel patterns
GPS tracking
8/12/2019 Eficienta Energiei in Transporturi
http://slidepdf.com/reader/full/eficienta-energiei-in-transporturi 88/88
Conclusion
A wide set of data is necessary to have accurate
transport energy efficiency indicators
Cross checking is possible with vehicle fuel efficiency :
this is a key variable to get
First estimates are possible with little investment
No point in implementing Transport Policy without a
good set of indicators to assess the efficiency