efi analytics - diyautotune.com · efi analytics , inc tuning is a process you must be patient...
TRANSCRIPT

EFI AnalyticsData driven Tuning
MegaMeet 2014
Phil Tobin aka LT401VetteAndy Whittle aka whittlebeastBrian Holzbach aka Brian EFISept20, 2014
MegaSquirt

Overview
Getting started – Basic tuning tips
Review key configuration setting
General Tuning rules Explanation of the different areas of the tune Common settings that can skew Ve Table Values What to look at before you begin tuning Check timing table values & tune Spark Table Tuning Ve Table Analyzing Data Logs Table Smoothing Cranking, ASE and Warmup Enrichment
EFI Analytics , Inc
Getting started - Tuning Tips
EFI Analytics , Inc
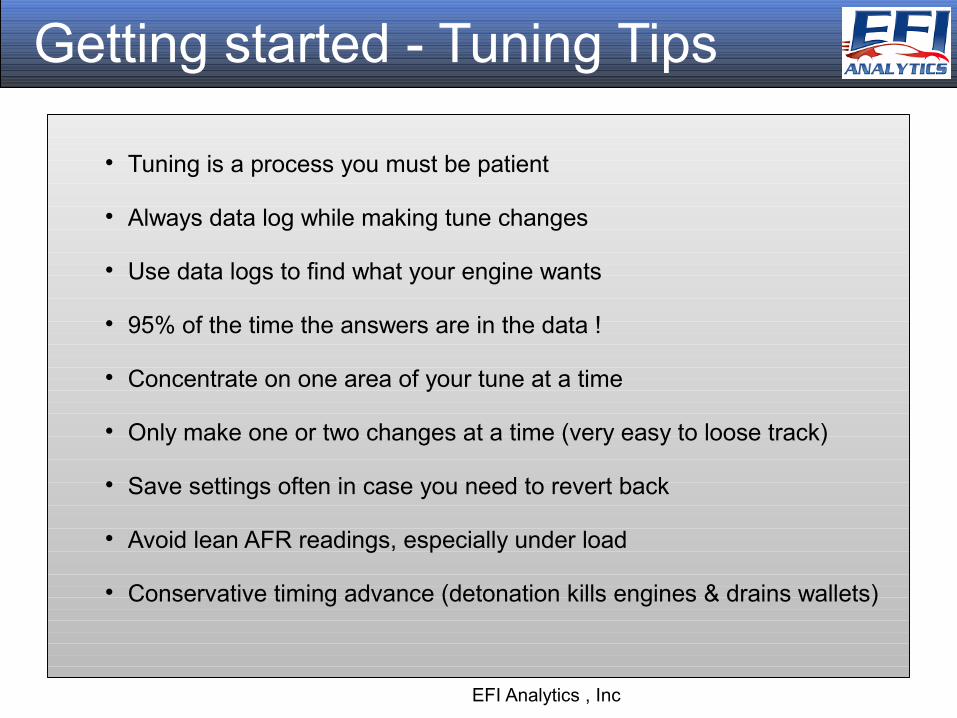
Tuning is a process you must be patient
Always data log while making tune changes
Use data logs to find what your engine wants
95% of the time the answers are in the data !
Concentrate on one area of your tune at a time
Only make one or two changes at a time (very easy to loose track)
Save settings often in case you need to revert back
Avoid lean AFR readings, especially under load
Conservative timing advance (detonation kills engines & drains wallets)

Before you begin tuning
EFI Analytics , Inc
Look over your settings
Research what you do not know
Verify Sensor calibrate
O2 Correction

Before you begin tuning
EFI Analytics , Inc
Settings that can dramatically alter your VE Table
Injector dead time
Incorporate AFR target
Multiply MAP
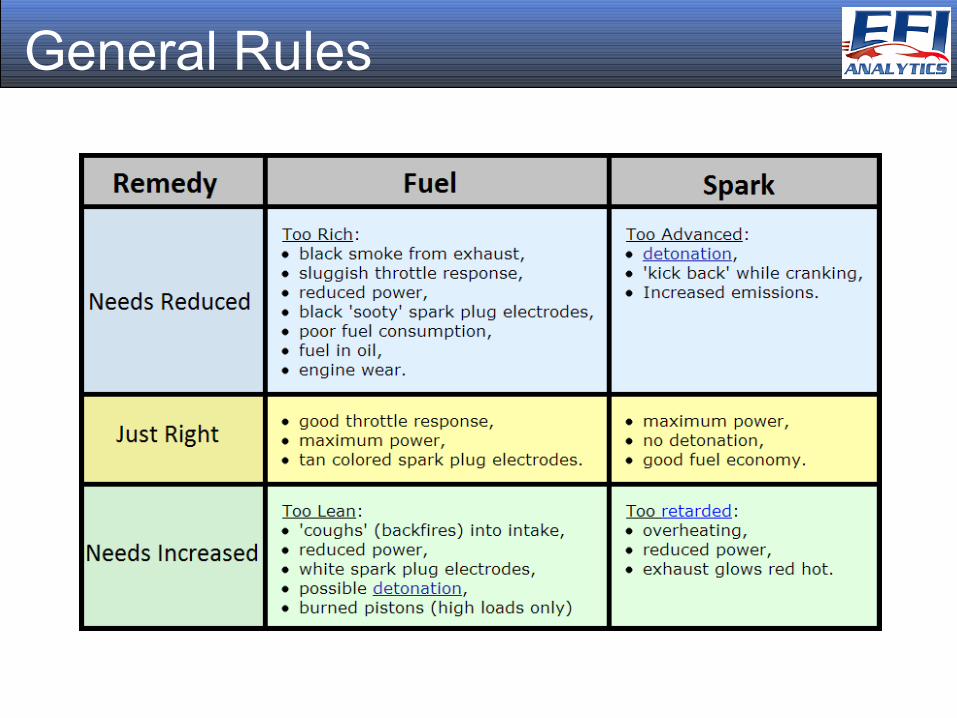
General Rules

Acceleration Increase fueling to achieve AFR target
Increased timing advance full timing around 3500
Best Throttle response
EFI Analytics , Inc
Accel enrichment options TPS MAP X-Tau EAE

AFR Table
EFI Analytics , Inc
I
Best values will vary some with engine Best targets will vary with Wideband accuracy AFR Table Generator will provide a good starting point Use dyno or ET’s to find best WOT AFR Use fuel economy and best running for Cruise AFR Use best idle for Idle AFR
Idle – generally stoich or slightly rich
Cruise – Stoich to slightly lean
WOT / Boost – rich of stoich.• NA – 12:1 – 13:1• Boost richen more as boost
increases

Idle, Cruise & WOT
Fairly rich (12.5:1 to 13.5:1 ) boosted applications will (11.5:1 to 12.1:1)
EFI Analytics , Inc
Stoichiometric to 15.5 AFR
High timing advance to full time
Typically Stoichiometric to 15.8:1 but can vary with application
Roughly 5° to 15° BTDC

Generating Base line advance table
Start with factory advance table if possible
(NA) reduce whole advance table by 2°- 3°
(Boosted) reduce by 2°- 3° / above 100kPa
reduce an additional 1°- 2°
Generating advance Table based on engine
parameters
older engines (1960s to 1990) with two valves -
max advance = 36
Newer two-valve engines – max advance = 30°
Three or four valve engines – max advance = 26°
Adjust for bore size
Under 3.5” (89mm) – subtract 3°
Between 3.5” & 4.0” (101.6mm) – no adjustment
Over 4.001” (+101.6mm) – add 3°
Adjust for the fuel
Regular – subtract 2°
Mid-grade – subtract 1°
Premium – no adjustment
Additional Modifiers
Aftermarket combination good squish +
optimized quench - subtract 2°
Idle to 3000RPM @ 100kPa increase
advance linearly to max advance
Every 10kPa over 100kPa reduce advance
- .5° to 1°
Max advance at full boost roughly half of
your total adv. at 100kPa
These are rules of thumb to help create a conservative spark advance table to get the engine runnable. The base line spark table you made from this information will need fine tuned to make optimal power.

Ve Table Tuning
EFI Analytics , Inc

Ve Table Tuning
EFI Analytics , Inc
I
MegaSquirt firmware uses 4 cell interpolation Good Ve Table Values guideline 30 – 130
Values typically increase as you climb through the table
If VE Values out of range adjust required fuel
recommendedVE = currentVE * (egoCorrection/100) * (actualAFR / targetAFR)
Typical Values: Idle 30 – 60
Cruise 50 – 80
WOT 80 -130
Boost 85 – 140
Decel 30 - 50

Ve Table Tuning
EFI Analytics , Inc
I
VE Analyze
Log based or Live in TS
Must be able to identify when something isn’t right
Manually adjusting areas Ve Analyze live did not reach
Some sections of the table will not get enough or any data to be corrected.
These areas of the table are not used while running the engine but you would likely want to manually correct

Cranking
EFI Analytics , Inc
Increase fueling for cold conditions
Low Ign advance (minimize kick back)
Cranking Pulse Width
Adjust for best start at temp
ASE – After Start Enrichment Additional fuel for a short
period after start Lean immediately after starting Data log of start up best to
identify after start lean Hot engines need less

Warm - Up
EFI Analytics , Inc
WUE - Warm Up Enrichment Increased Fuel based on given conditions
Increased timing advance
Warm up enrichment
ASE – After Start Enrichment Additional fuel for a short period
after start Lean immediately after starting Data log of start up best to identify
after start lean Hot engines need less

WUE with Scatter Plots
EFI Analytics , Inc
Correcting Warmup Enrichment with Scatter PlotsFull view for less iterations
CLT vs Gwarm with SmoothAFR for the Z Axis color• Regenerate the Warmup Curve as it was set in TunerStudio• Notice the Z Axis color that shows how far from target AFR it was at each
temperature.
SmoothAFRError? What is that?Custom Field explained on next slide

Solving WUE
EFI Analytics , Inc
Not only can you view what the warmup curve looked like, but you can generate the “Right” answer for it.
Note the Z Axis color illustrates the original Warm up
enrichment value.
The X & Y Axis show the desirable value.
This car was running needlessly rich.
How?? Where did the new curve come from?Desired Warm up for a single point would be:
Desired Warmup = [Gwarm] * ([Gego]/100) * ([AFR]/[targetAFR])Add Smoothing:
Desired Warmup = [Gwarm] * (SmoothBasic([Gego], 20)/100) * (SmoothBasic([AFR], 20)/[targetAFR])

Analyzing the data to know what changes need made to your tune.
EFI Analytics , Inc
Reducing condition changes Methods of looking at data Ways to spot issues

MegaLogViewer Scatter Plots
EFI Analytics , Inc
Abstract Art or valuable tuning tool?
Common Quote: Sure it looks pretty, but what the hell do I
do with it? What is it telling me?

MegaLogViewer Scatter Plots
EFI Analytics , Inc
Overview: Scatter Plot graph are commonly used for statistical and data analysis to identity correlations
MegaLogViewer Scatter Plots were designed for Tuning• Handles high data volumes• 3 Axis view • Custom Calculated Fields to combine and manipulate• Data Filtering!!!
Common Belief – For tuning high data rates are very important.FALSE – for most tuning slow data rates will work fine as long as each record is well correlated and you have sufficient time to collect data. More data is better with Scatter Plots, not necessarily faster data.
Normal log viewing work great for viewing specific details, but you can only see so much data at once. Using scatter plots you can view thousands of records or hours of data in 1 view to quickly get a big picture view.

MegaLogViewer Scatter Plots
EFI Analytics , Inc
When a scatter plot over a traditional graph?
- View many fields at once
- Step through record by record to see specifically what was happening at any point in time.
- Can see that at this specific point in time the RPM=5612, MAP=93 kPa, AFR is 12.55:1 and
Ego Cor is 100
- Difficult to realize the impact of conditions not happening at other points in time are having on the
viewed fields
- 3 Fields at a time
- Full picture view as if it is your Speed density VE Table. X Axis:RPM, Y Axis: MAP, Z Axis:AFR
- Notice the Yellow spots, they quickly reveal areas of the VE Table where it is running over 16:1. This is a
trend over a large amount of data, not a specific point.
- Can peel back the layers with filters to see what conditions may be effecting the view. AE, Warmup.
Quick View of Tune
EFI Analytics , Inc
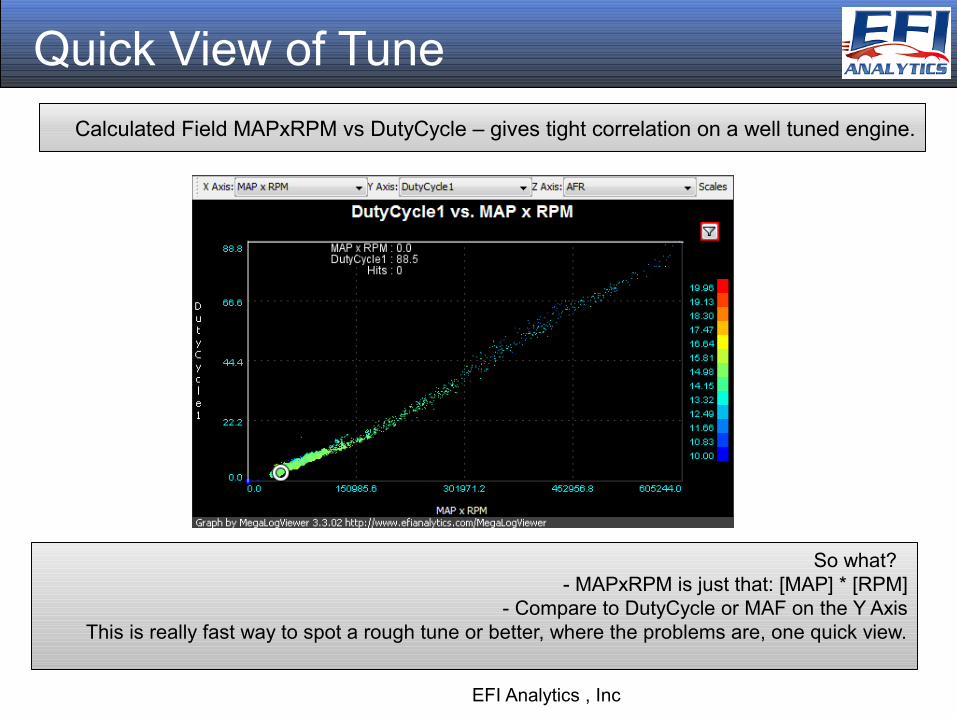
So what? - MAPxRPM is just that: [MAP] * [RPM]
- Compare to DutyCycle or MAF on the Y AxisThis is really fast way to spot a rough tune or better, where the problems are, one quick view.
Calculated Field MAPxRPM vs DutyCycle – gives tight correlation on a well tuned engine.

Quick View of Tune
EFI Analytics , Inc
Let’s look at this log in MegaLogViewer.- Bring up the Scatter Graph MAPxRPM vs DutyCycle1
- The Dead O2 Filter removes some records in the hump, but an insignificant number.- Click on the hump
- Switch to normal log viewing- Observe what is happening on many of those records.
The scatter plot showed there was a problem and where to looks. The normal log shows specifics.
Not showing a clear correlation.
Why?
What looks wrong?
What is causing this hump?

Scatter Plot Filters
EFI Analytics , Inc
Filtering:
Back to our CLT vs Gwarm with SmoothAFR for the Z Axis color
Filters can quickly remove anomalous data, or help to find the cause of that data.
Notice the blue dots up the left axis of top picture.Activate the dead O2 Filter to remove in picture 2.
Now you know you would want to filter that data from any formulas that it would skew the results.
Dead O2 Filter expression with Innovate 10:1-20:1:[Field.AFR] < 10.3
Numerous built in Filters where you can see the expressions used:
TP Transient: (abs([Field.TP] - [TP-4]) > 3 ) ASE Active: [Engine] | 4 == [Engine]
MAP Transients: (abs([Field.MAP] - [MAP-4]) > ([Field.MAP] * 0.15) )
These transient filters are built in and available for use after install.
EFI Analytics , Inc
Questions?

Hiring
Interested in working with the MegaSquirt team?EFI Analytics is hiring
- Tech Support- Java Developer
Please catch up with me here today if interested or email me
EFI Analytics , Inc